RIVERtalise
DHWANI
BISANI + PARAVEE POKAWATTHANANURAK
EMERGENT TECHNOLOGIES AND DESIGN

RIVER talise | 1
ARCHITECTURAL ASSOCIATION SCHOOL OF ARCHITECTURE
GRADUATE SCHOOL PROGRAMMES
COVERSHEET FOR SUBMISSION 2019-20
PROGRAMME: Emergent Technologies and Design
STUDENT NAME(S): Dhwani Bisani (MArch), Paravee Pokawatthananurak (MArch)
SUBMISSION TITLE RIVERtalise Adaptive River Rehabilitation in South East Asia
COURSE TITLE MArch Dissertation
COURSE TUTOR Elif Erdine
DECLARATION:
“I certify that this piece of work is entirely my/our own and that any quotation or paraphrase from the published or unpublished work of others is duly acknowledged.”
Signature of Student(s):
Date: Friday, January 29th, 2021
2 RIVER talise 3
Firstly, and most importantly, we would like to express our sincere gratitude to Elif Erdine and Michael Weinstock for their constant guidance, encouragement, and patience along the way. We would also like to thank George Jeronimidis, Milad Showkatbakhsh, Abhinav Choudhary, Alican Sungur, Eleni Polychronaki and Lorenzo Santelli for their invaluable feedback and sharing their computational expertise with us.
We would also like to thank and acknowledge the contribution of our M.Sc. teammate Weiting during the initial journey with us. This project would not have been the same without her. We would also like to extend the gratitude to our fellow Emtechers, for all the fun, inspiration and support we shared over the past year and a half.
Finally, we would like to thank our family and friends at home for their continuous love and support in all the ways they could.
4 RIVER talise 5
ABSTRACT
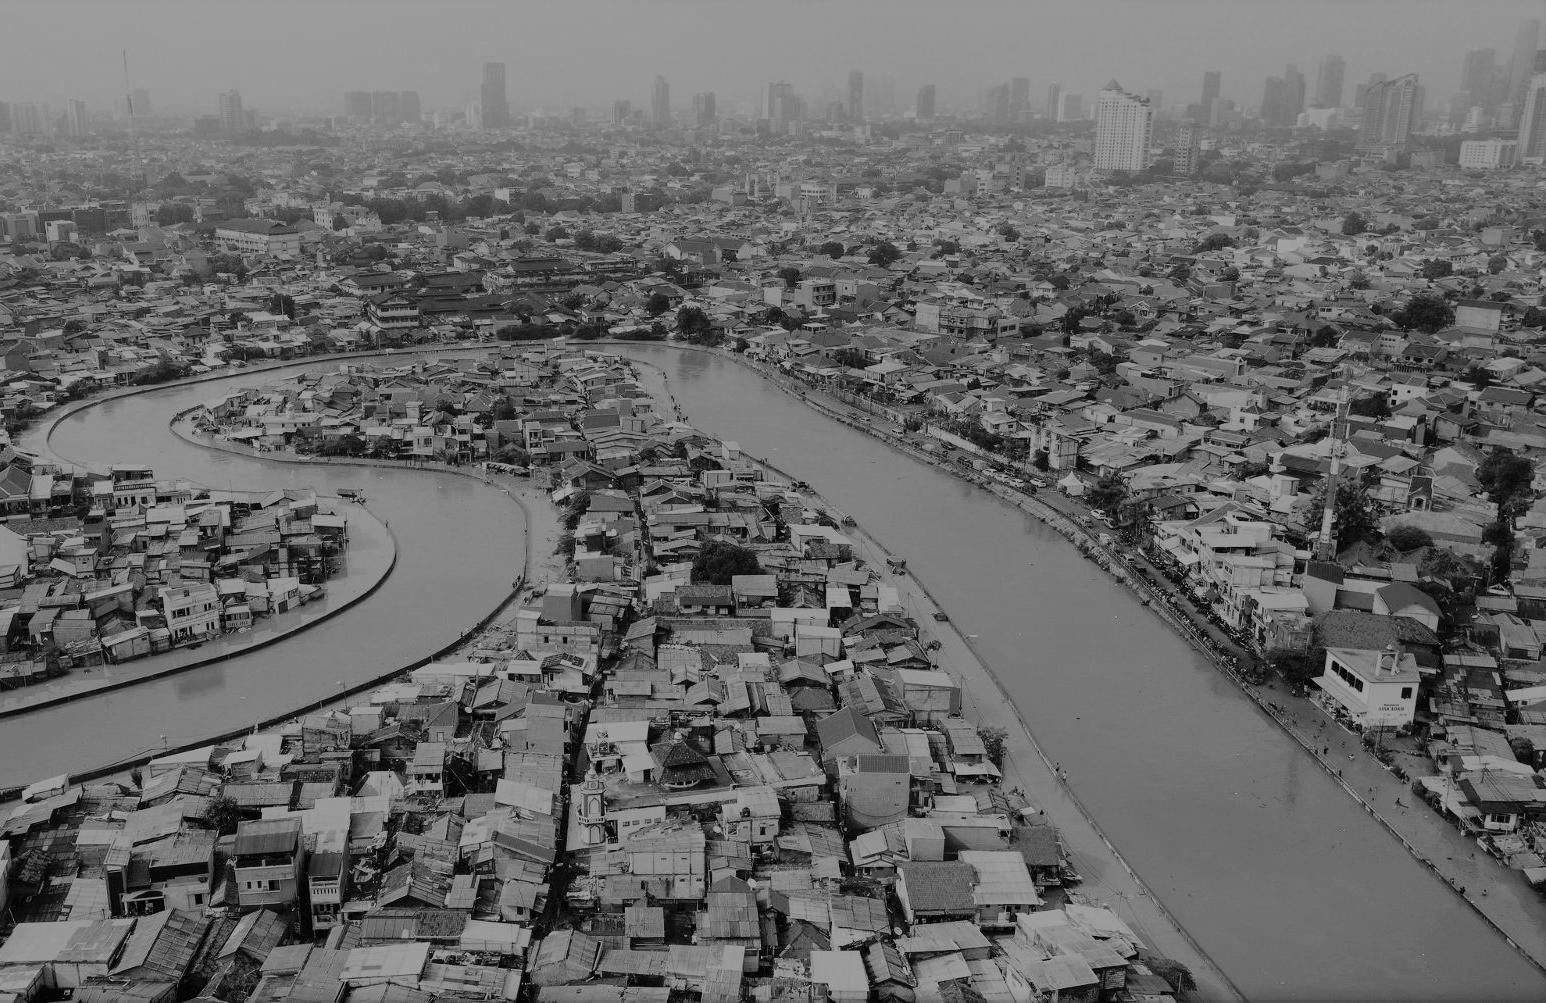
Indonesia’s capital city, Jakarta, has a long history of struggling with frequent flooding due to its geographical location. Rapid, unplanned urbanisation over the past few decades has resulted in large amounts of informal settlements in the city, which are often accused of aggravating flooding. However, the inhabitants are also often the most adversely affected by flooding.
RIVERtalise aims to explore a holistic approach in solving the problems associated with flooding and unplanned urbanisation, by integrating urban strategy and infrastructure for flood mitigation with the urban fabric.
At an urban scale, flood control strategies were distributed based on the river dynamics and nature of the floodplain. These infrastructures including the new absorptive landscapes were taken as the skeleton for urban zoning so that the local urban fabric could respond to different flood control strategies.
For the provision of housing, the project aimed to evolve vernacular typologies to suit the needs of modern households and future demographic growth. The architectural system pursues a framework that allows for spatial flexibility with emphasis on communal spaces, which is often lost in the existing government housing schemes. Bringing the urban scale and architectural scale solutions together, the resulting design aims to improve the neighbourhood’s resilience to flooding, at the same time taking into consideration the needs of its inhabitants.
RIVER talise 7 6
CONTENTS
1. INTRODUCTION
2. DOMAIN
2.1JAKARTA
2.2 RIVER FLOOD AND MITIGATION
2.3 OPEN BUILDING & KIT OF PARTS
2.4 VERNACULAR ARCHITECTURE
2.5 RESEARCH PROPOSAL
3. METHODS
4. RESEARCH DEVELOPMENT
4.1 URBAN SYSTEM
4.2 BUILDING AGGREGATION
4.3 HOUSING AGGREGATION
5. INTEGRATION
6. DESIGN PROPOSAL
6.1 CONSTRUCTION SEQUENCE
6.2 SITE SECTIONS
6.3 BUILDING BLOCK DESIGN
6.4 SIMULATIONS
7. CONCLUSION
7.1 FLOOD MITIGATION
7.2 FORMALLY INFORMAL
8. REFERENCES
9. APPENDIX
8 RIVER talise 9
INTRODUCTION
In recent years, a lot of cities in South East Asia are increasingly at risk to flooding. Indonesia’s capital city, Jakarta, is one of the most vulnerable amongst them. Loss attributable to flooding in Jakarta is disastrous due to the city’s economic significance and massive population. It is not uncommon for a major flood to shut down the entire city (Padawangi, 2015). On 1st January 2020, flash flood occurred throughout the city, costing the lives of 66 people and more than 60,000 were displaced. (CNN, 2020)
Urban flooding is a major recurring challenge facing cities around the world. Although a lot of mitigation measures have been implemented over the years, it is not possible to completely eliminate the risk of urban flooding as it is a natural disaster. The causes of urban flooding are complex and mostly involve both environmental and social factors.
In Jakarta, urban flooding is linked to the city’s geographical location, rapid urbanisation, its growing population, and housing shortages. Informal settlement resulted from unplanned urbanisation and housing shortages spreads in many parts of the city, especially along its riverbanks. Although these settlements contribute to aggravating the naturally occurring flood, its inhabitants also suffer the most from flooding.
To tackle the inevitably interlinked problem of urban floods, unplanned urbanisation and informal settlement, this research takes a holistic approach in developing integrated urban and architectural scale strategies. The research explored ways to incorporate active flood mitigation strategies in urban zoning while positively influencing the urban fabric. By abstracting the principles from vernacular practices, the research develops an architectural system in which an open building framework was explored to achieve the balance of rigorous planning and informality of community involvement through self-build.
10 RIVER talise 11 DOMAIN CONTEXT DOMAIN CONTEXT
DOMAIN
This chapter encompasses the experiments undertaken following initial domain research. The proposed strategies were divided into urban and architectural scale. At each scale various experiments were conducted to test these strategies and in the final section of this chapter they are fully integrated.
At urban scale environmental data were processed to aid the zoning and development of the infrastructure network. At architectural scale, an open building system was explored, combining features from vernacular longhouse as top down approach and spatial aggregation algorithm for a bottom up approach. CFD studies were carried out at different scales to further derive design principles related to buildings in the flood tolerated area. Final integration of the two scales experiments with ways for distributing the buildings in a way that is coherent to the overall urban flood strategy, while contextualising individual buildings to their unique location.
2.1 CONTEXT
2.2 RIVER FLOOD AND MITIGATION
2.3 OPEN BUILDING SYSTEM & KIT OF PARTS
2.4 VERNACULAR ARCHITECTURE
2.5 RESEARCH PROPOSAL
12 RIVER talise 13
2.1 CONTEXT
Jakarta is the capital, economic, cultural, and political centre of Indonesia with estimated population at over 10 million. Jakarta’s metropolitan area, Jabodetabek (Jakarta, Bogor, Depok, Tanggerang, Bekasi), has a population of more than 27 million people according to the 2010 census, making it the second-largest metropolitan area in the world.
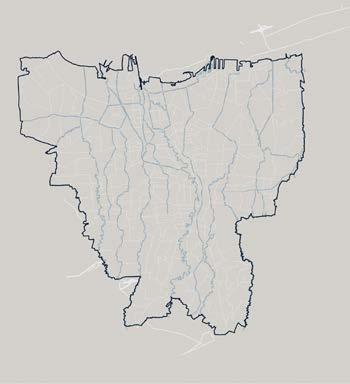
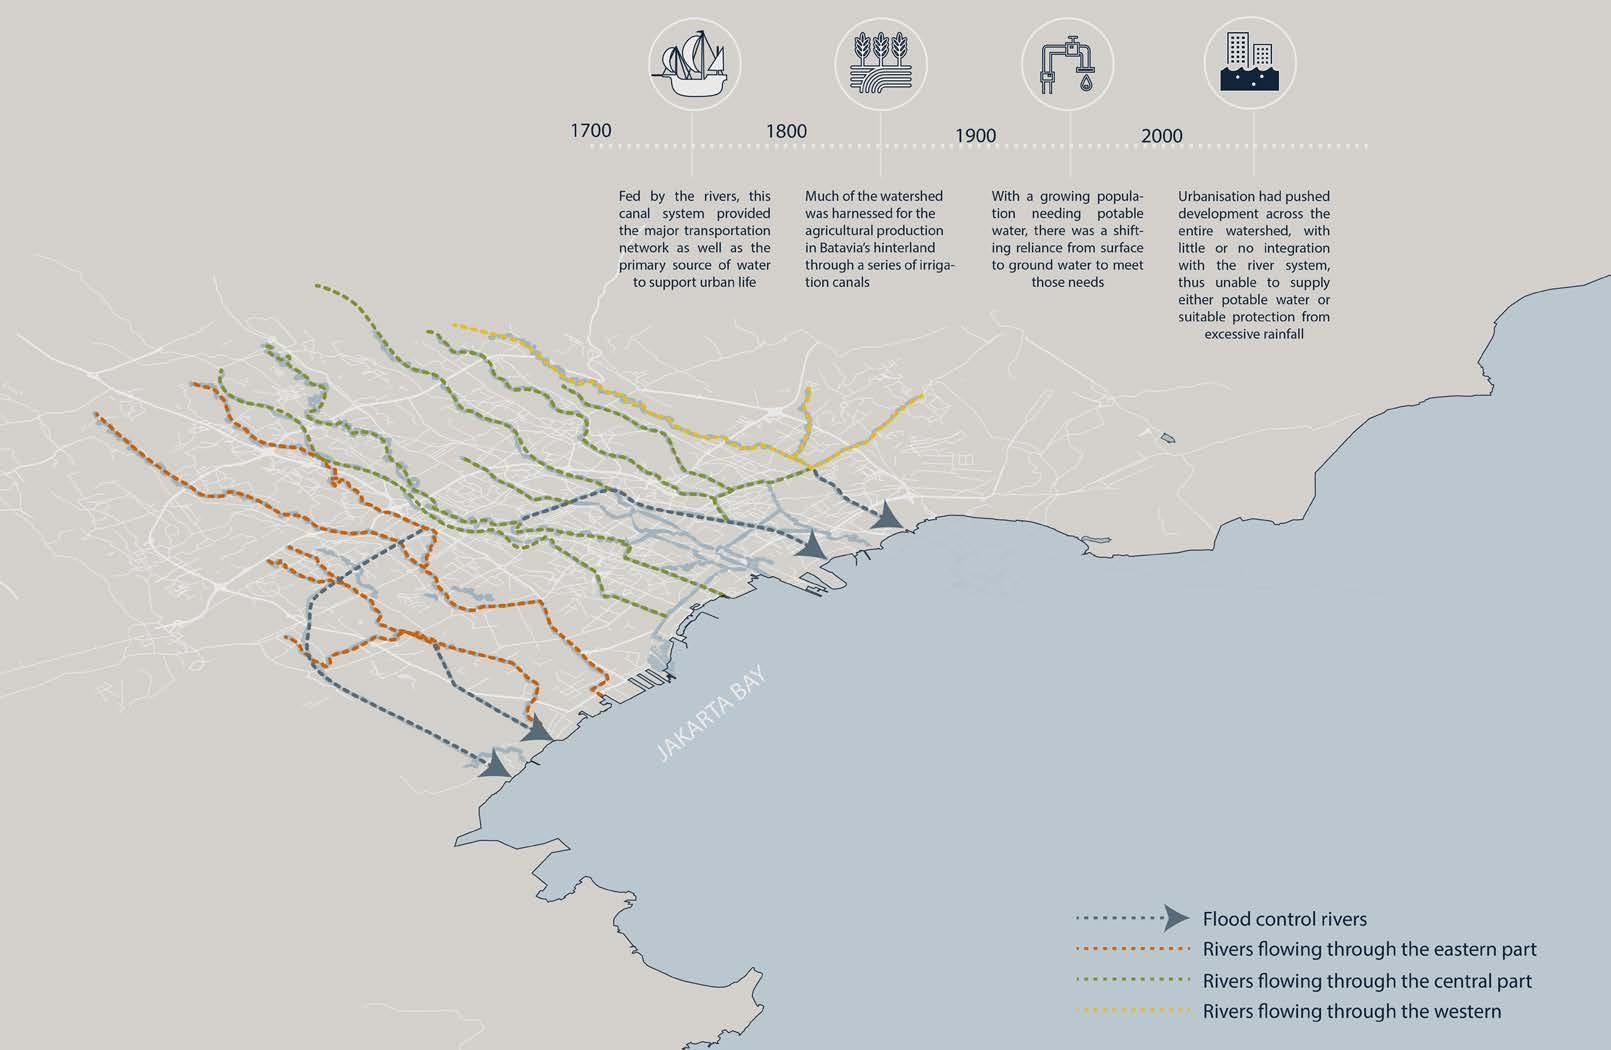
Located in a flood plain area, Jakarta has had a long history of flooding due to its geographical location on a low and flat alluvial plain of 13 rivers. Recurrent flood during monsoon seasons is a naturally occurring phenomenon. The floodplains, from being surrounded by rice paddy fields to an engineered system of canals have evolved with the city throughout history. The rivers also provided a major transportation network as well as the primary source of water at different times.
Rivers in Jakarta has functioned as urban drainage network in the past few decades. The rivers frequently faced contamination by waste disposal from riverside dwellings, industrial chemical discharge, and construction waste. These have resulted in a significant decrease in water quality and loss of biodiversity.
Post-colonial transformation of Jakarta which begins in 1980s overseen large-scale land development took place due to rapid economic growth followed by large influx of immigrants from outside the capital. The covering of land surfaces with impervious materials such as roads or cement dramatically increased surface runoff. This has changed the flooding in Jakarta from a relatively slow natural process with low frequency to a highflow, high frequency process. (Padawangi 2015).
The combination of both rapid population growth and pressurised flood plain area have caused Jakarta very prone to flooding. Therefore, there is a need for a more holistic strategy involving both housing and river rehabilitation for the recurrent floods in Jakarta. This dissertation wishes to explore the role of architecture and landscaping in driving a framework that address flood mitigation, ecological enhancement, and community empowerment. fig2.1.1(right):
14 RIVER talise 15 DOMAIN CONTEXT DOMAIN CONTEXT
Rivers of Jakarta
2.1.1 HOUSING AND INFORMAL SETTLEMENTS
The population of Jakarta in 2020 is now estimated at 10,770,487. This represents an annual change of 1.15 per cent. Based on recent data and population growth trends, the population of Jakarta is expected to increase to over 13 million by 2035. (United Nations 2018).
The rapid population growth in Jakarta over the 20th century caused housing backlog which resulted in the rise of informal settlements. Informal settlements along the riverbanks are often blamed to be worsening the flooding situation in Jakarta. At the same time, the lives and livelihood of the communities that occupy these settlements are the most vulnerable from flooding events. These communities are constantly adapting to the situation they are in by changing their houses, locations, and livelihoods. To gain resilience against flooding events, the residents have also organised among themselves ways to track and share water level information, announce early warning, as well as improving the environment through trash collection and other activities. (World Bank 2011, Padawangi, 2015)
Under pressure to provide sufficient housing for its citizens, the Indonesian government has rolled out may initiatives including Ruman Sederhana Sehat (Healthy Simple House), Rusunawa (Rental Flats) and Rusunami (Owned Flats). However, studies have shown these housing provisions could not meet their target in terms of providing enough housing. (Salim 2015)
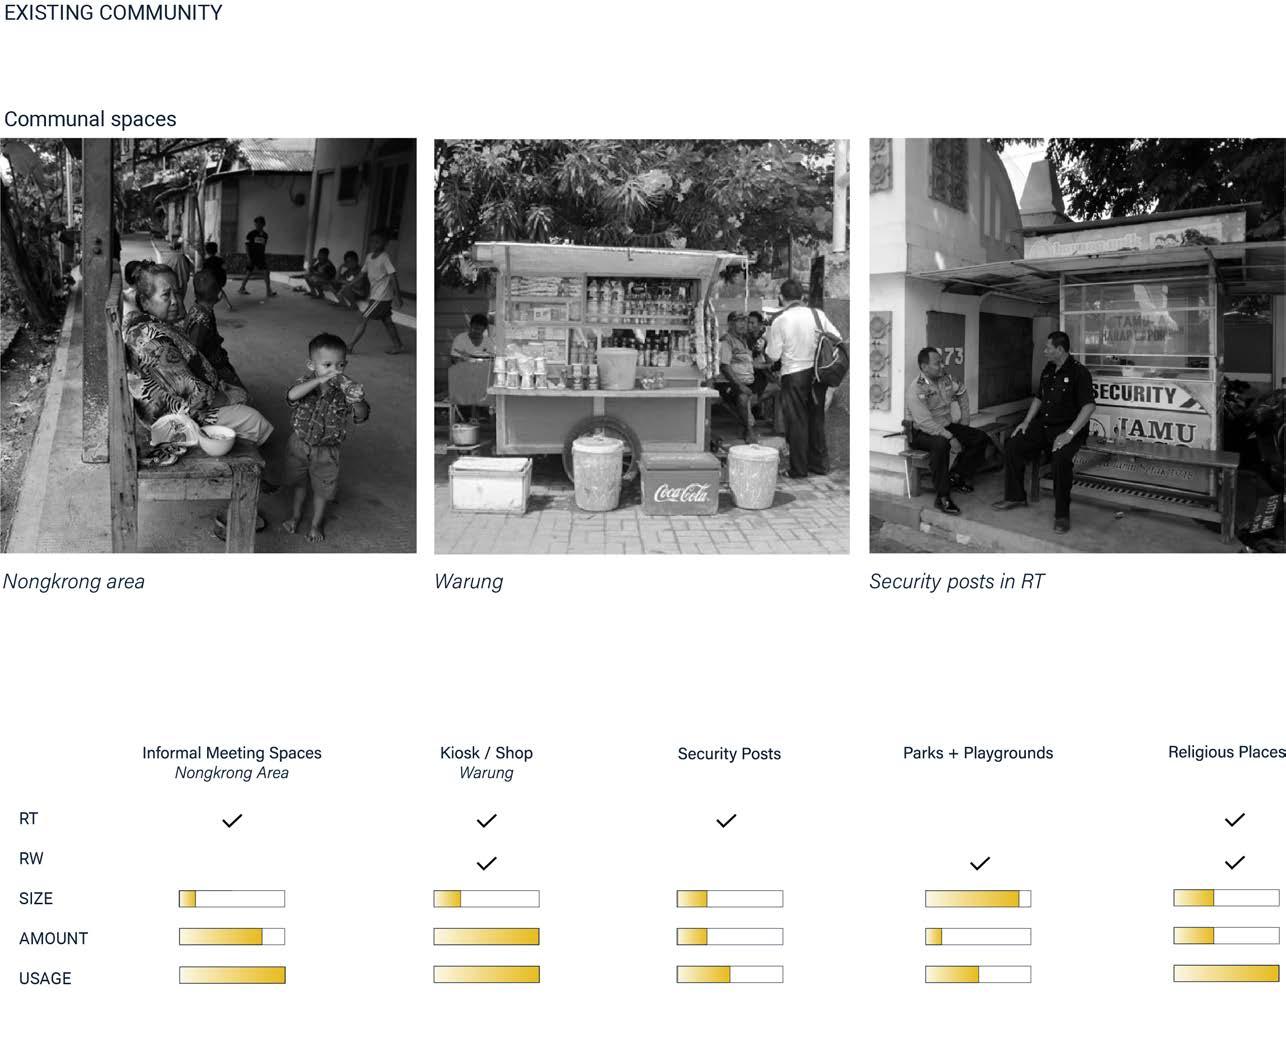
The government’s housing provision also failed to address the housing demand for different segments of the society. It was estimated that 93 percent of the housing demand are from the lower-middle income group (Widoyoko 2007), who benefit less from such mass housing schemes as their original houses and communities were often not only a place to live, but was also their premises of business. After the 1998 economic collapse in Southeast Asia, there was an increase of warung (kiosk) industry in the lower-income segments of the city (Padawangi 2015). Up to 38% of Jakarta’s economy is considered informal (World Bank 2011).
16 RIVER talise 17 DOMAIN CONTEXT DOMAIN CONTEXT
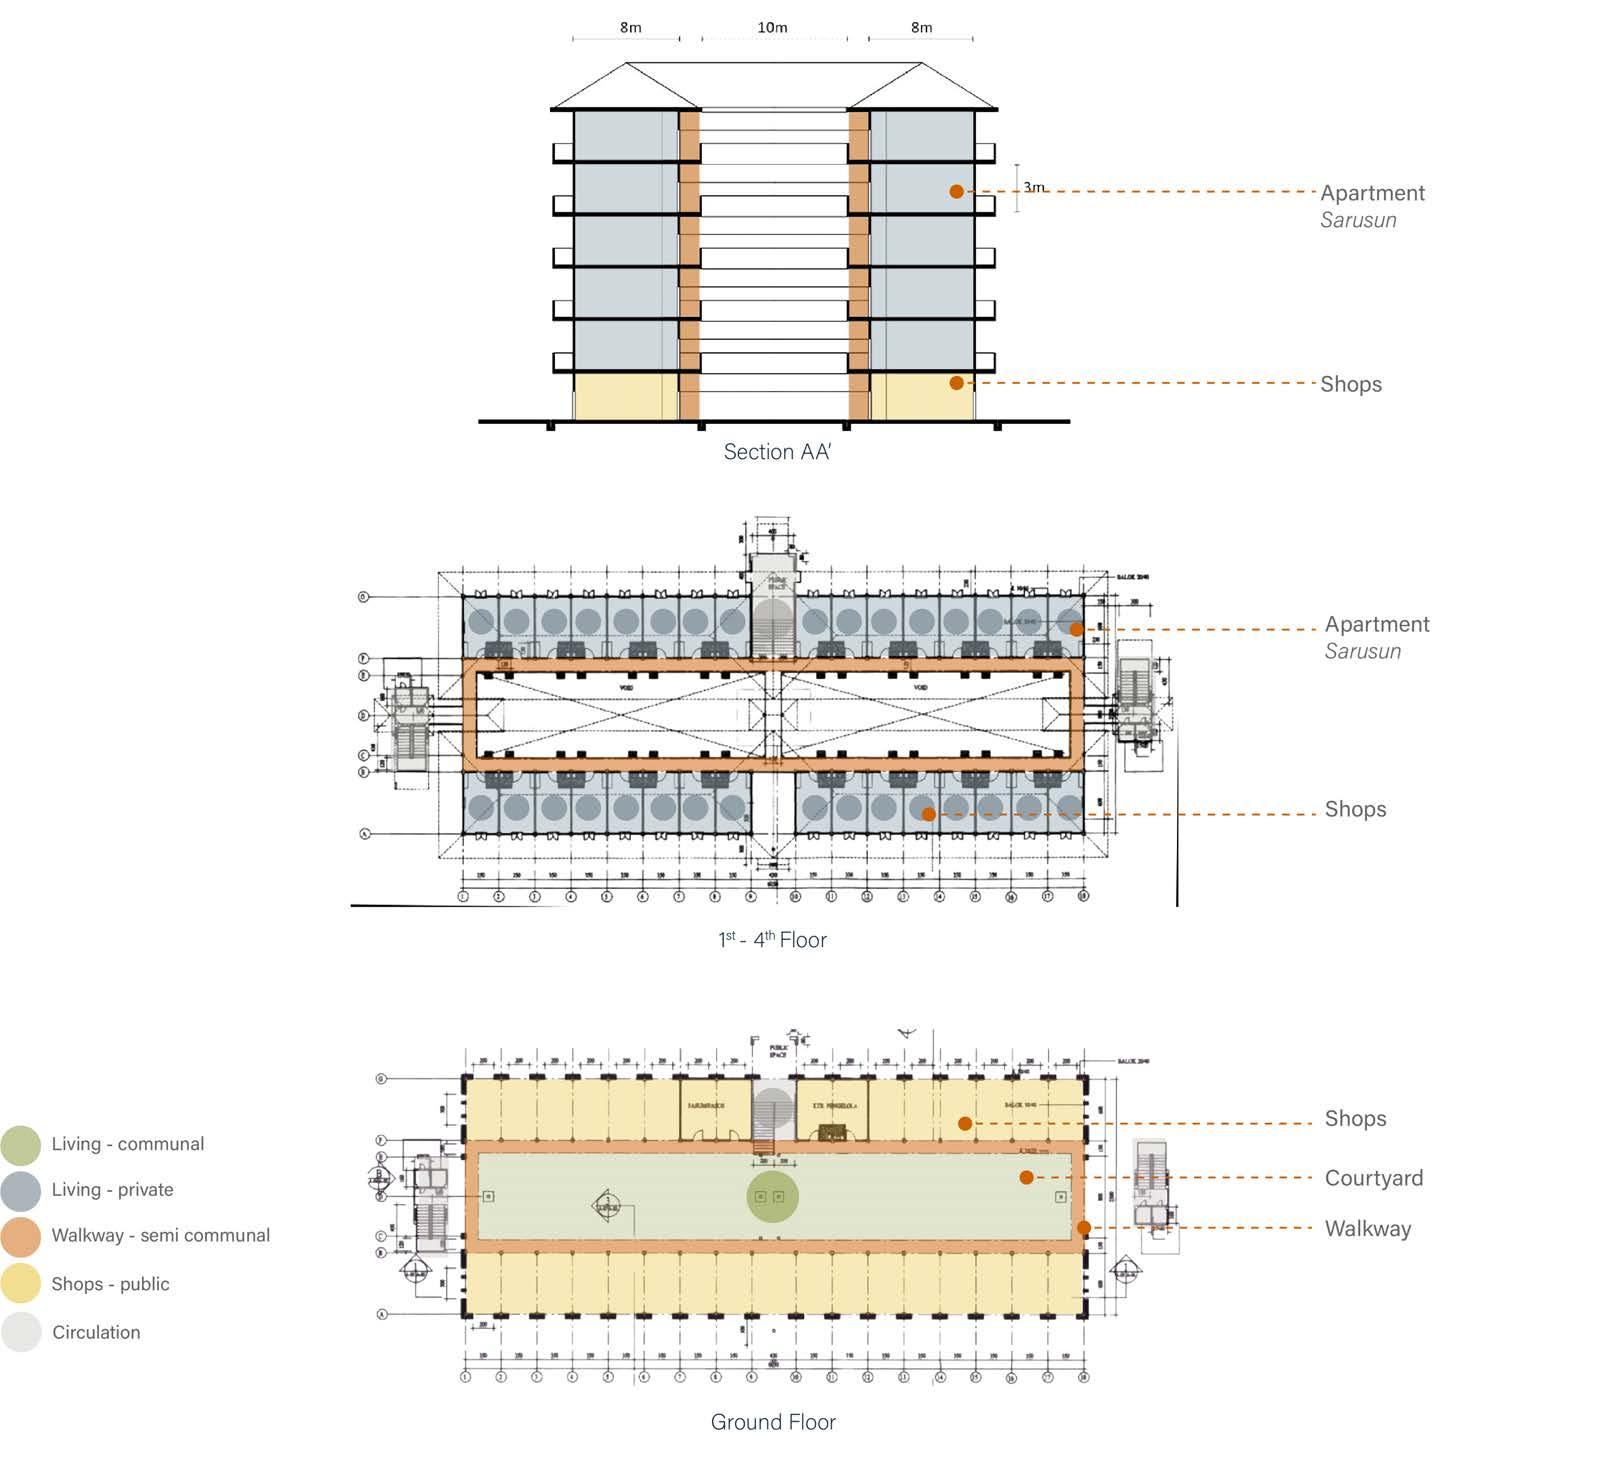
fig 2.1.1(right): Rusunawa floor plans and section
2.1.2
Relocating these residents into block apartments meant that they may become cut off from their livelihood. Moreover, government’s attempt to provide support for self-initiated housing struggle too as they were provided with minimum government engagement and framework provision.
(Widoyoko 2007)
Nevertheless, in these settlements community spirit and organisation are very often strong, and people help one another through community savings programs, flood early warning systems, and small-scale environmental clean-ups (World Bank 2011). There is a term describing this kind of practice of communal action where the entire community contributes resources and participates in a project or activity that benefits the community at large or specific numbers: Gotong-royong. Although the conditions of informal housings are vulnerable and government intervention to provide housing in the past appeared difficult, the key to tackle these challenges may lie within fully appreciating, harnessing, and formalising these informal social and communal networks that constitute large parts of the city.
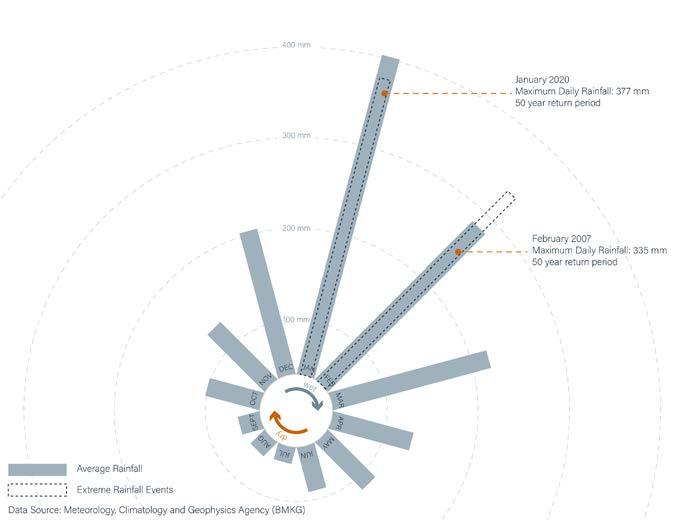
Jakarta has an equatorial tropical climate, with temperatures being consistent around the year with an annual low of 23⁰C to an annual high of 32⁰C. Jakarta gets significant amounts of precipitation, totalling almost 2,200mm annually. Jakarta’s wet season peaks with an average of 400mm of precipitation during January and a dry season average rainfall of 70mm during August. The city is hot and humid throughout the year.
The prevailing hourly average wind direction in Jakarta varies across the year. The wind is predominantly from the east for 7.4 months (April to November) with a peak percentage of 70% in July. The wind is mainly from the west for 4.6 months (November to April) with the highest percentage of 67% in January.
The average hourly wind speed in Jakarta has a slight seasonal difference over the year. The windiest part of the year lasts 3.2 months (December to March). For an estimated wind speed of more than 6.3 miles per hour.
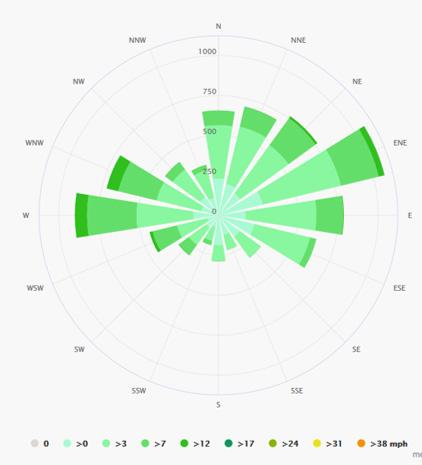
(MERRA-2 satellite-era reanalysis )
18 RIVER talise 19 DOMAIN CONTEXT DOMAIN CONTEXT
CLIMATIC CONDITION
fig 2.1.2(right-top): Annual rainfall and extreme rainfall chart (right-bottom): Wind rose
2.1.3 FLOOD MITIGATION IN
Flooding in Jakarta has proven difficult to deal with throughout the history of the city. A Tugu inscription from the early fifth century recorded hydraulic project by the order of King Purnawarman of Tarumanagara Kingdom that includes digging project to straighten and widen the river to avoid flooding in the wet season.
In the colonial era of Dutch East India Company, Simon Stevin was commissioned to design Batavia, the former name of Jakarta. Batavia resembled Amsterdam where the city is divided into two with the Ciliwung river channelled into a straight canal. Distribution of different functions within the city were separated by network of smaller canals. The Dutch East Indies government continued to build more canals in the city, including the West Flood Canal network until they left.
In recent years, the Indonesian government has implemented the construction of several infrastructure projects to battle the rising sea levels, sinking land and flooding. A ring dike known as Giant Sea Wall Jakarta is expected to be completed by 2025, to protect the city from the threat from the sea. (Jakarta Post 2011) Dams and tunnels were also proposed to ease flooding within the city. (Jakarta Post 2015) The tunnels form part of the network known as East Flood Canal, which began construction in 2002 but is still not completed and facing severe delays.
Ciliwung Normalisation Project, led by the Ministry of Public Works, includes strategies to dredge the river, stabilise the riverbanks and develop other flood mitigating infrastructure. The main infrastructure under this scheme is the installation of concrete embankments along 33.69km of the riverways. This project too face delays, with only about half of the planned works completed, leaving the areas around the uncompleted project still vulnerable when the catastrophic New Year’s Day flood hit on 1 January 2020. (Jakarta Globe 2020). Moreover, hydrodynamic modelling has also demonstrated that the fully normalisation of the Ciliwung river is not a fail proof solution for containing long term flood threats in Jakarta. (Lin et al 2016).
20 RIVER talise 21 DOMAIN CONTEXT DOMAIN CONTEXT
JAKARTA
fig 2.1.3(right): Existing flood defence
2.1.4 SELECTED SITE
Out of the 13 rivers, the flood prone Ciliwung river which divides Jakarta east and west has been the centre of flooding intervention measures due to its location, importance, and significance to the city.
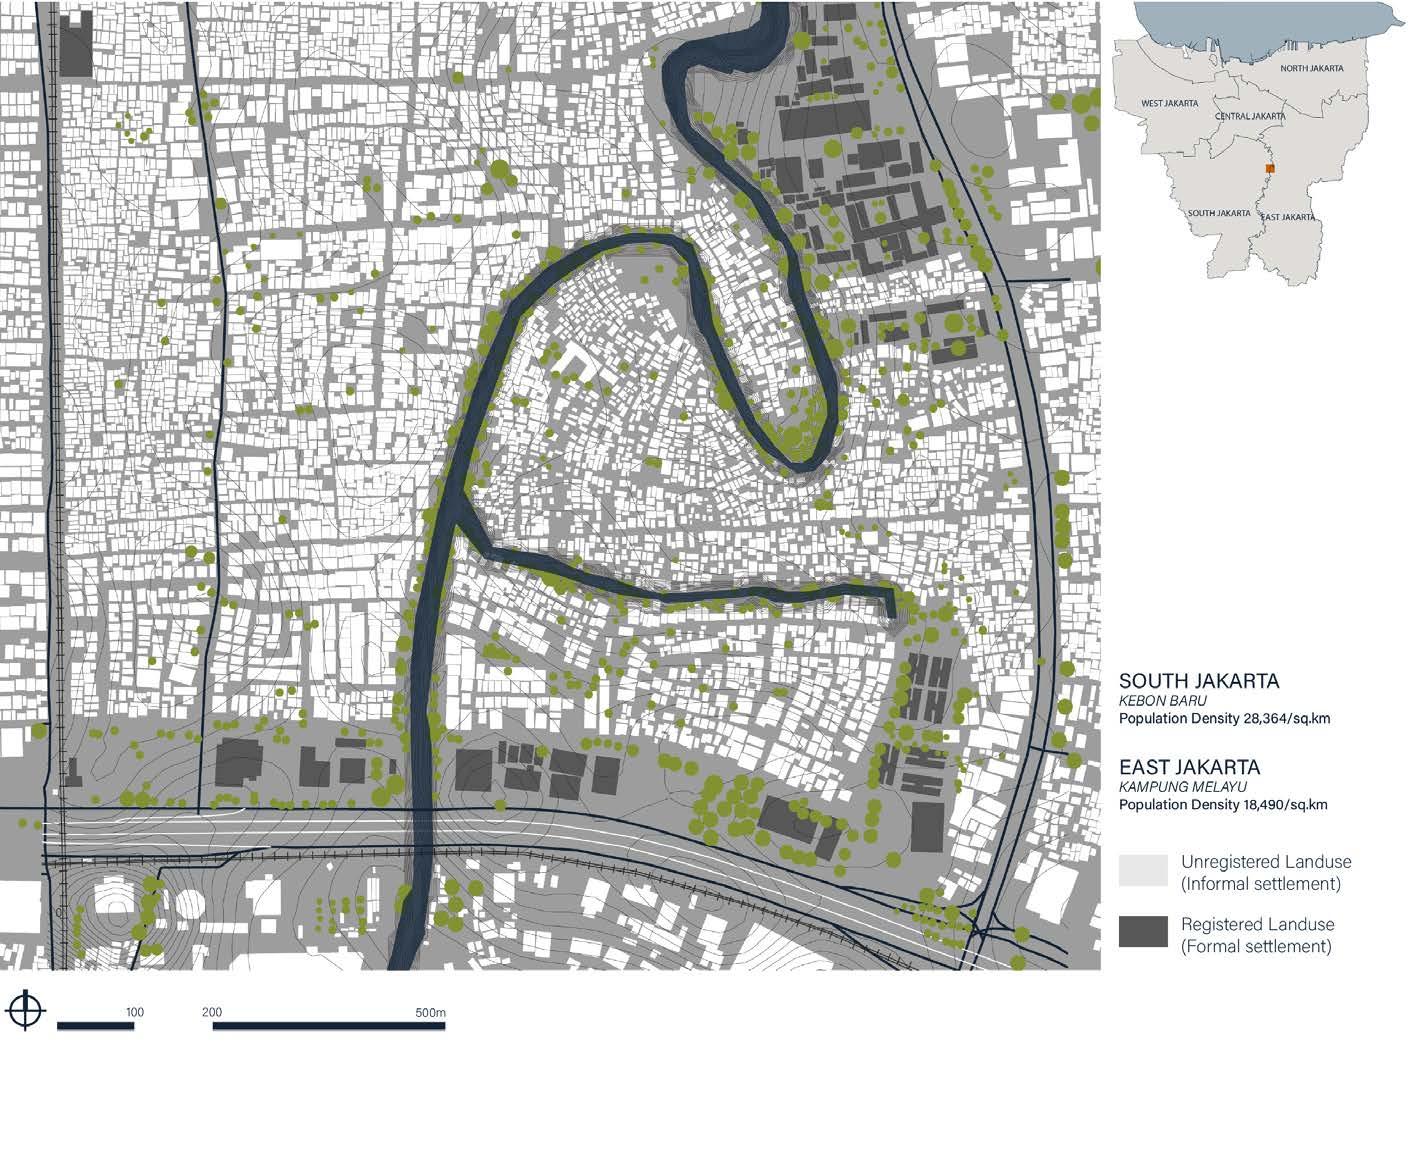
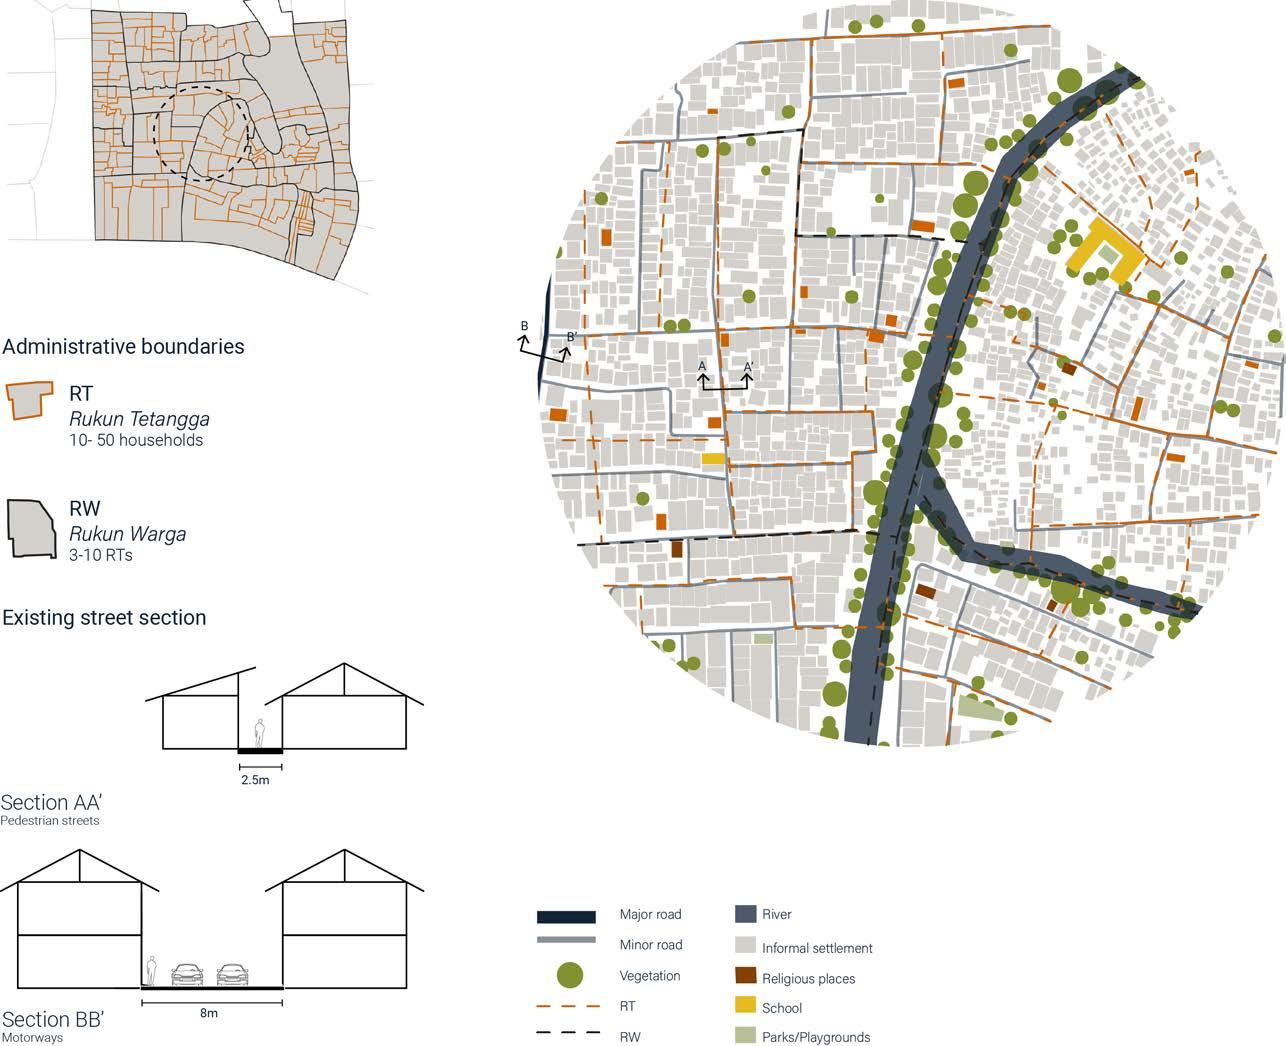
The chosen site is located between South and East Jakarta, along the Ciliwung River. The site contains parts of the flood-prone neighbourhoods of Kebon Baru and Kampung Melayu, which are also among the most populated areas, with a density of 28,364 and 18,490 people per km2, respectively. (Badan Pusat Statistik, Republik Indonesia 2010). According to the population growth in Jakarta, which represents a 1.15% annual change. These site population estimates in 2020 at 32,900 people and projections at over 41,500 people in 2035. (World Urbanization Prospects).
Around 80% of the 1.2 km2 site is considered as unregistered land use, i.e. informal settlement. The distribution of informal settlements is mainly along the riverbank and the railway. The densely built area contains mainly small, single household dwellings with narrow alleyways. The narrow access to these settlements not only make the flood situation more severe but also increase difficulty in evacuation and rescue. (Maarif et al. 2020)
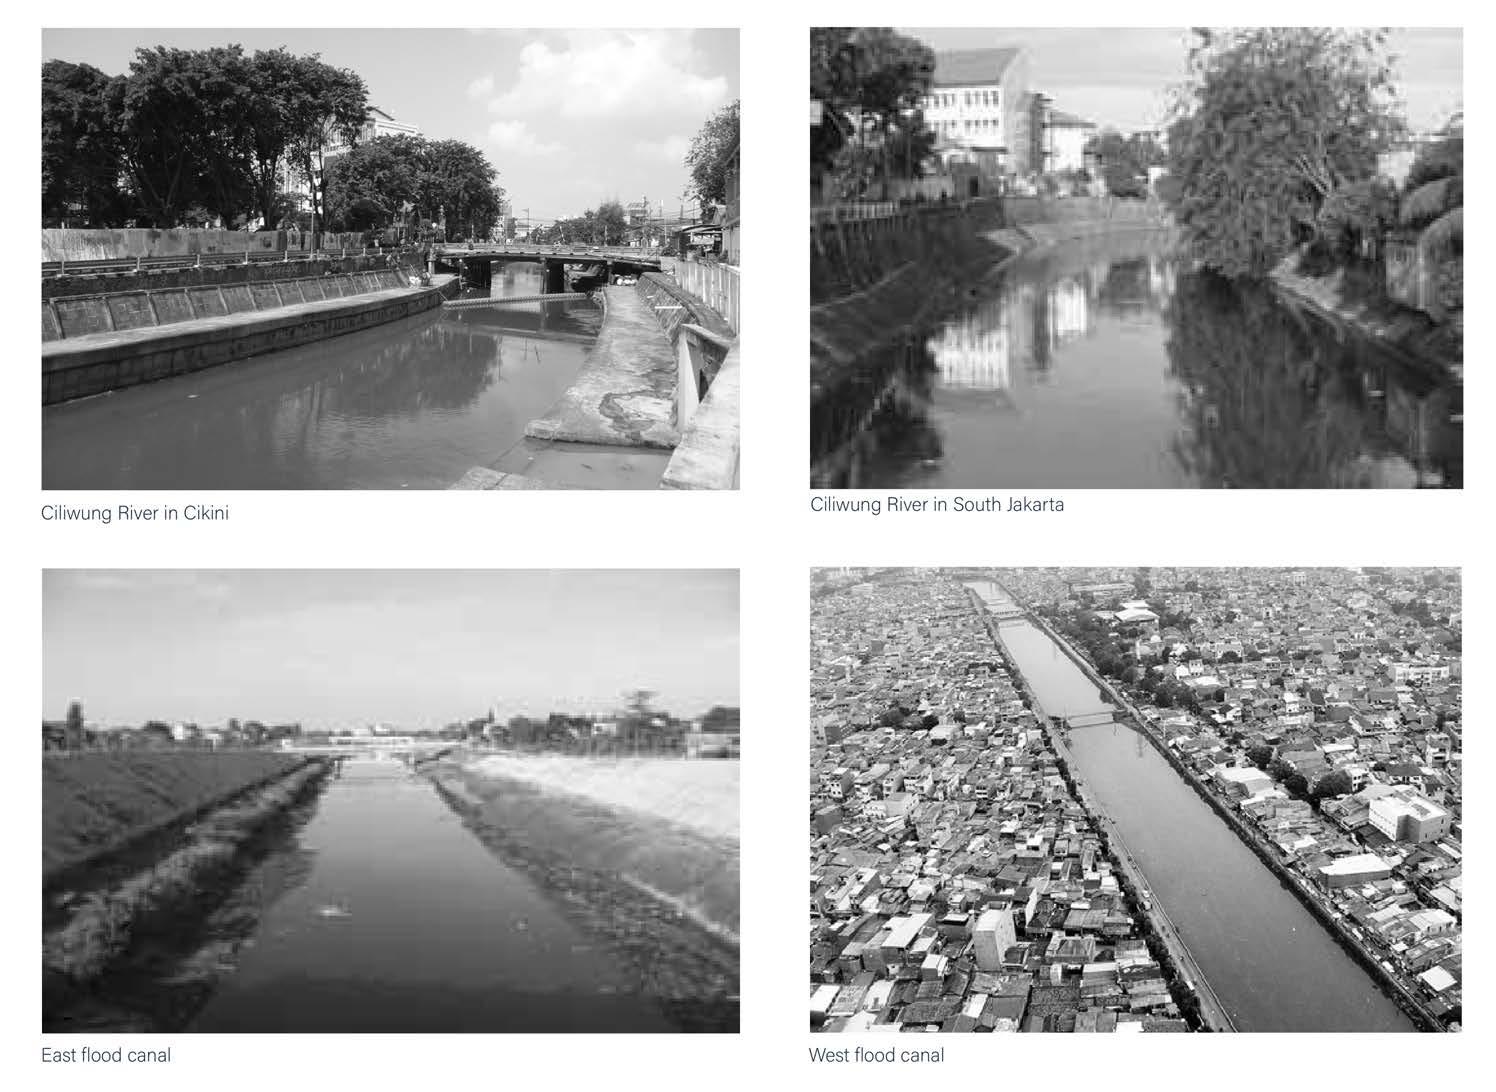
The Ciliwung River is one of the most significant water resources in Indonesia. The river is utilized for local transportation, agricultural irrigation and household use in many communities and informal settlement along riverbanks.
After the devastating flood in 2013, the government started cleaning up the Ciliwung River. The river profile has been widened with concrete retaining walls constructed, which also protects the river channel from erosion and allowing a smoother flow. The depth of the Ciliwung River was also increased to prevent future flooding. The development of retaining walls has caused the residents’ dwellings to be moved back a few meters on the banks of the Ciliwung River. (Maharani and Evawani 2019)
The existing flood mitigation strategy also shows a poor integration with the rest of the urban fabric. Fg.1. (Section A) shows the riverbank at the North part of the selected site protected by a steep reinforcement wall and embankment along two sides of the river which obstruct the view and fencing the interaction between community, road and the river.
fig 2.1.4(right): Selected site
22 RIVER talise 23 DOMAIN CONTEXT DOMAIN CONTEXT
24 RIVER talise 25 DOMAIN CONTEXT DOMAIN CONTEXT
2.2 RIVER FLOOD AND MITIGATION
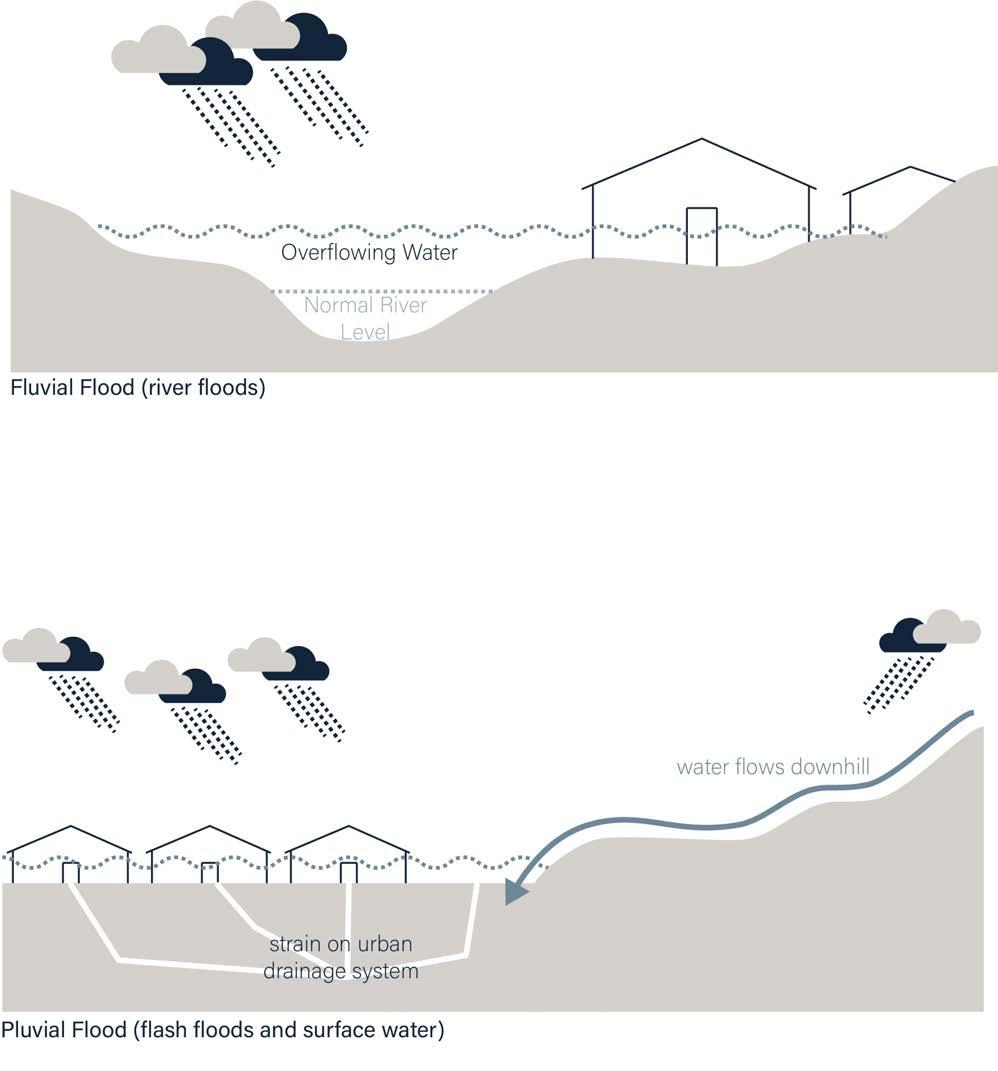
Urbanisation changes the natural conditions to the extent that the water no longer can run its natural course. Due to the large extent of paved surfaces in urban areas the water cannot infiltrate the ground and instead the major part rapidly runs off the surfaces (Butler & Davies 2010). In urban areas on flood plains, where urban rivers are spatially confined and artificially controlled, frequent flash flooding during stormwater event typically occurs due to excessive rainfall over an extended period of time which causes overwhelming of the urban drainage system (pluvial flooding) and nearby rivers to exceed its capacity (fluvial flooding).
In the past, urban flood plain spaces were protected from flooding by hard engineered infrastructures such as dams, canals, and embankments (Lin et al. 2016). Butler & Davies (2010) also indicated that the most common system to manage stormwater in urban areas is a sewer system that transport stormwater in pipes, separate to sanitary wastewater This led to strict limitations on the space within the direct sphere of influence of the water or even building over the water. Moreover, many aquatic plants and animals disappeared from the technically modified rivers which destroyed natural habitats (Prominski et. al., 2017).
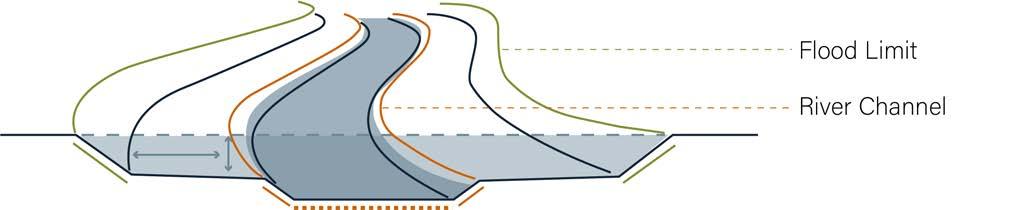
Hence, in recent years, there is an emergence of redefining river spaces design to cope with fluvial flooding. Integration and adaptation of spaces near rivers were materialising to comply with their process limits, namely the flood limit and the limit of the self dynamic river channel development (Prominski et al. 2017). The flood limit is essentially the lateral spread of water from a river, defined relatively to theoretical high water levels, while limits of self-dynamic river channel development is the limit of how rivers developed based on natural erosion and sedimentation processes.
Prominski et. al (2017) introduced a way to redefine river spaces by manipulating the flood limit, hence expanding the allowable flood areas in urban spaces instead of alienating the existing river. The flood retention areas then create space into which river can expand as the water level rises.
26 RIVER talise 27 DOMAIN RIVER FLOOD AND MITIGATION DOMAIN RIVER FLOOD AND MITIGATION
2.2.1 REDEFINING RIVER SPACES fig 2.2(right): Flooding types
Along with flood protection, flood plains in urban spaces have the potential to serve as recreational and social spaces, along with integrating systems of cycleways and footpaths along the flood plain. Buildings could also be built on stilts to allow water to rise during flood events.
Along the river, the limit of self dynamic river channel development could be restored with riparian forest buffers to restore the balance between public goals for food and ecosystem services as well as reducing water pollution and enhancing terrestrial wildlife (Bentrup et al. 2012). Socially, restoration of the riparian forest buffers also goes hand in hand with enhancing a city’s riverfront residual spaces. Maharani (2019) argued that by forming a desirable physical environment in these residual spaces through space appropriation activities, it raises the residents understanding and appreciation of these spaces and ultimately lead to the realisation of healthier urban spaces at riverbanks.
An example of such development is the Parque del Agua (Water Park) in Zaragoza which was built in 2008. As the site was frequently flooded, a network of channels and several large pools were excavated, while the most intensively modified parts of the park are protected from the flooding by the surrounding dike. A riverside ‘Nature Park’ and the riparian vegetation planted there are, however, allowed to flood on a frequent basis. Both portions of the park are devoted to theme of water, and in both form and conception, demonstrate a different way of using water and rivers which represents an exciting juxtaposition of process and control (Inaki et al. 2008).
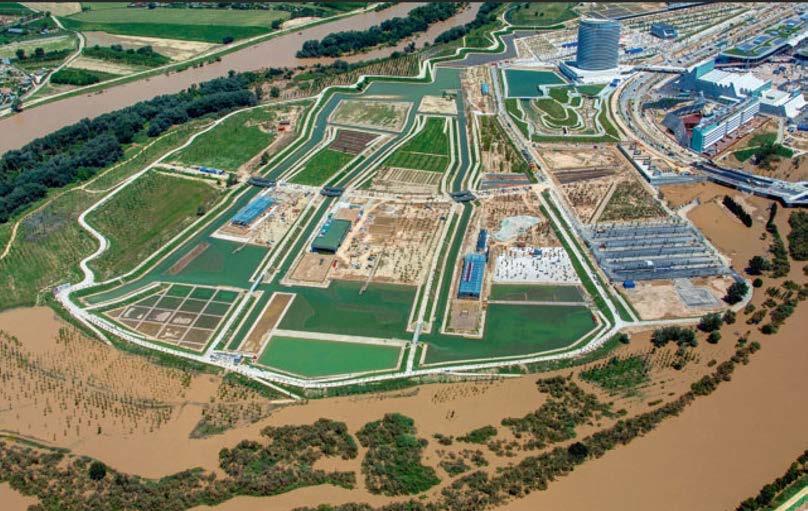
The inner side of the park is protected by the dike although water from the river can flow through it on a controlled basis. However, when flooding occurs, the system could be sealed off to prevent contaminated river water from entering the park. The natural-looking portion of the park located outside the dike is in constant contact with the river. As this riverside park is situated on the inside of a river loop, sedimentation process take place. There are also accessible spaces near the riparian zone for the public (Inaki et al. 2008).
Choice experiments have also found that there is a significant and substantial demand for both park space and forest conservation as additional ecological rehabilitation program component to the currently proposed engineered solutions to the rivers within Jakarta. (Vollmer et al 2013). This indicates that there are social, economic, and environmental demands to manage floods by rehabilitating the ecology of an urban river’s waterfront and living with the flood retention spaces instead of the traditional hard engineering techniques.
28 RIVER talise 29
DOMAIN RIVER FLOOD AND MITIGATION DOMAIN RIVER FLOOD AND MITIGATION
fig 2.2.1.1(left): River flood space
fig 2.2.1.2(right): Ebro, a waterpark expo in Zaragoza, Spain
2.2.2 PLUVIAL FLOODING AREA
In areas where pluvial flooding occurs, integration of urban spaces with urban drainage system has also emerged. The use of rain gardens, ponds and wetlands and their practical application through landscape architecture is an issue of transformation and orientation towards sustainable design (Vaculova and Stepankova 2017). Incorporation of these systems to an urban area has the potential to be exploited into a flexible space with multipurpose uses (Ivers 2018).
In general, rain gardens are vegetated depressions in the ground where stormwater accumulates and temporarily pond before evaporating, transpiring from the plants, and infiltrating the soil (Davis and Naumann 2017).
In this way the system reduces both runoff rate and volume if right soil and vegetation is selected (Davis 2008). Ponds and wetlands, on the other hand, are permanently wet areas which reduces peak flows of stormwater. However, they have limited impact on runoff volume reduction since the only reduction occur through evapotranspiration (Yang et al. 2016). However, Yang et al. (2016) argued that one advantage with a permanent water body is the positive addition for recreation and amenity in the city as well as increased biodiversity.
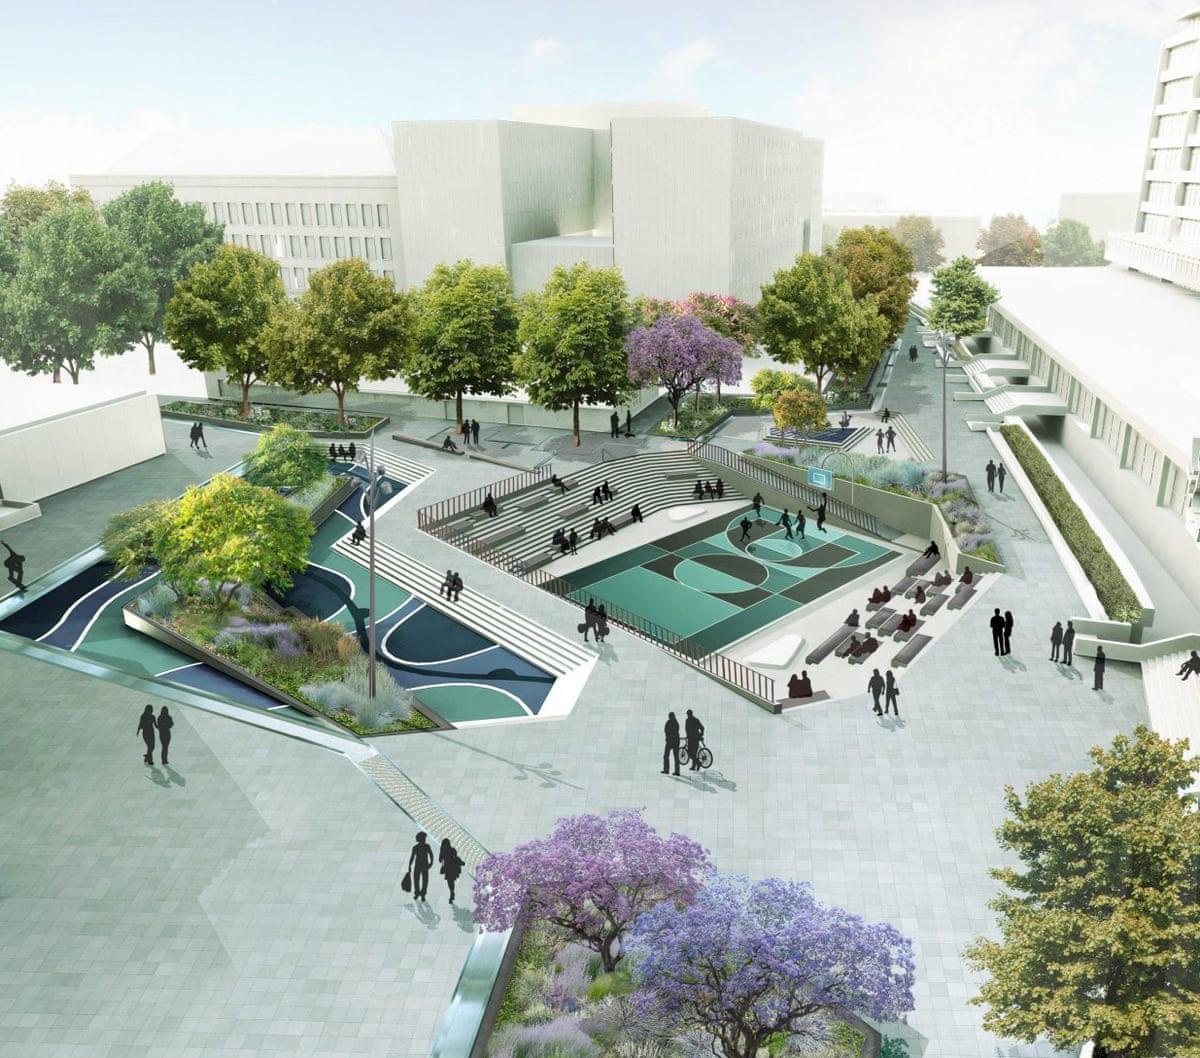
One example of a flexible space which is used for both flooding prevention and recreational space is Benthemplein Water Square in Rotterdam, Netherlands. Completed in 2013, the Water Square is a public space in Rotterdam, which doubles as an active square as well as a dramatic design for water attenuation (Ivers 2018). The ‘water square’ retains rainfall from both the adjacent paving areas and buildings and directing the stormwater discharge from the sewer system to square.
The square is made up of three sunken areas which serves as social spaces and open platform for performances, sports, and skateboard areas. Seating steps and lounger terrace face on to the space to provide space for relaxing and socialising. During rainfall, open drainage channels direct water into these sunken spaces, flooding the sport courts, platforms, and seating areas. Two shallow basins receive adjacent surface water drainage and the central feature, which is deeper than the other basins, is filled when the rain falls consistently for a longer duration. After the storm, the shallow basins discharge into an underground filtration system, which naturally seeps back into the water table. The central basin dissipates back into the open water system of the city after 36 hours to prevent water stagnation and water-borne bacteria from forming.
The water square has introduced an alternative method to incorporate an urban drainage system such as rain gardens and ponds in an urban area. By defining the attenuation pond as a flexible space, Benthemplein Water Square serves Rotterdam as an important social space, stormwater management system and also a communicator of environmental message of urban cooling and natural systems (Ivers, 2018).
30 RIVER talise 31
DOMAIN RIVER FLOOD AND MITIGATION DOMAIN RIVER FLOOD AND MITIGATION
fig 2.2.2 (left): Benthemplein Water Square in Rotterdam, Netherlands
Ciliwung River faces the problem for the occupants within the settlement by causing ecological damage in the riparian and aggravating Jakarta’s annual flooding. The flooding usually occurs because of the lowering of water in the catchment area due to the declining green open space which is a riparian zone (T U Z Noviandi et al., 2017). Additionally, the occupants in the settlement might have damaged land and vegetation formation (Kaswanto. 2015), resulting in the decreasing volume of water retention capability in the riparian. This could lead to the increase in surface runoff volumes that causes flood in downstream (Arifasihati Y, Kaswanto. 2016). Furthermore, river management concepts used in Indonesia are still oriented to conventional hydraulic that seeks to discharge water as quickly as possible toward the downstream leading to worsen the impact of the floods as the runoff cannot infiltrate the riparian effectively. Thus, the concept of River Restoration is introduced, aiming to rehabilitate the river and its riparian zone to its natural condition, including protection and ecological restoration in areas that had been disturbed by anthropogenic activities ( Helfield J, Engström J, Michel J, Nilsson C, Jansson R. 2012.) Therefore, the strategies for riparian zone restoration are needed.
One example of the redevelopment in riparian zone with terrace wetland is Liupanshui Minghu Wetland Park in Liupanshui City, along the Shuicheng River, China completed in 2012 which was designed by Treescape.
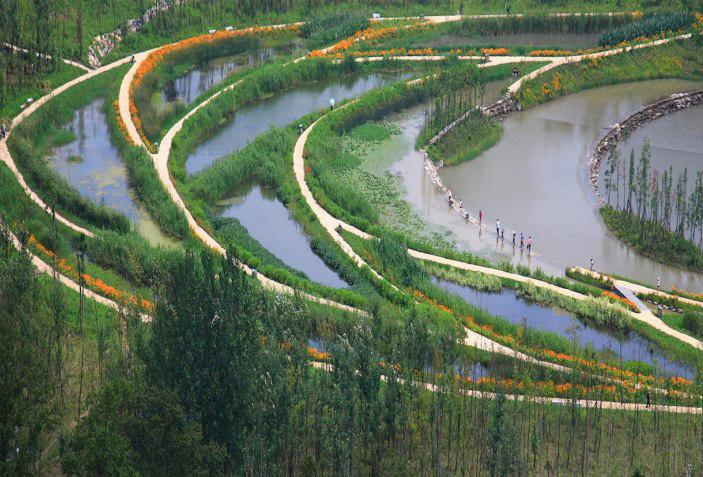
The Liupanshui Minghu wetland park is a city-wide ecological infrastructure project that provides multiple ecosystem services, including stormwater management, water purification and rehabilitation of native habitats while creating a public space for gathering and esthetic enjoyment. This project emphasizes both the Shuicheng River drainage basin and the city. The canalized river’s concrete embankment was demolished before creating a series of wetlands of varying capacities into the flood management and ecosystem purification scheme. The change of elevation along the river, creating a terraced riverside ecosystem has contributed to ecological restoration. This project also combines waterfront development and river restoration with the creation of continuous sidewalks for pedestrians and cyclists, which further improve the accessibility of the riverfront. (Turenscape, 2015)
From this case study, we can abstract the program’s advantage in the integration between waterfront development, river restoration and flood prevention using terrace wetland is worth considering for the riverfront strategy in our dissertation.
32 RIVER talise 33
2.2.3 RIPARIAN ZONE
DOMAIN RIVER FLOOD AND MITIGATION DOMAIN RIVER FLOOD AND MITIGATION
fig 2.2.3 (left): Liupanshui Minghu Wetland Park in Liupanshui City
2.3 OPEN BUILDING SYSTEM
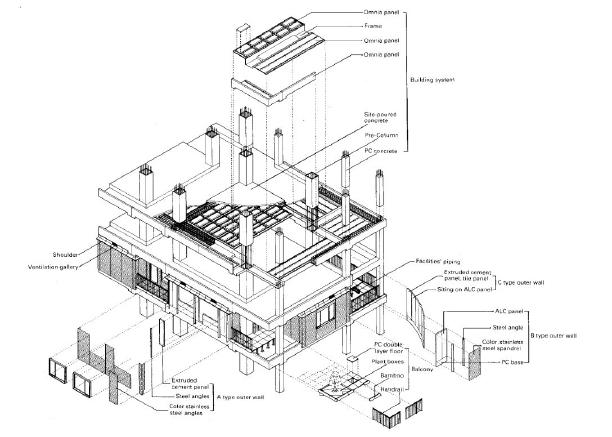
The “open building” concept was first proposed by Habraken in 1961 as an alternative approach for mass housing design by separating structure and services (supports) and the enclosures forming the dwellings (infill) (Towers 2005). Typically, the infill comprises of transformable components which meets the occupants’ changing requirements or preferences without affecting the existing support. By focusing on adaptability, “open building” approach provide the occupants with the forms and means that facilitate their home space needs (Friedman 2002) as well as means of evolving their homes as families grow or changing lifestyle (Towers 2005). To major incubators of residential Open Building are Netherlands and Japan, in which the idea of constructing residential base buildings without determining ahead of time the individual layouts of dwellings has become increasingly practical (Kendall 1999). For example, the Japan Urban and Housing Development Centre in 2002 developed an open building system with three considerations, namely the use of space, lifespan and decision making (Warouw 2010). These considerations will then inform the building components which are divided into four categories: skeleton, supporting elements, boundary elements and infill.
2.3.1 PRECEDENTS
Various feasibility studies and projects have been carried out in recent years for the “open building” approach (Kendall 1999, Warouw et al. 2010). Often, the “open building” approach is complemented with kit of parts system such as the NEXT 21 project in Japan and comprehensive infill system in the Netherlands and Finland (Kendall 1999). The concept of kit of parts system essentially involves organising millions of individual parts in a building into assemblies of standard easy to manufacture components with a set of rules such as requirement for materials, structural strength, thermal or sound insulation qualities and transparency (Howe et al. 1999). Standard connections between the assemblies are defined, which allows greater freedom in the form itself as long as the connection rules are observed. (Howe et al. 1999) defined three kit of part systems that can be implement: joint based, panel based and modules based; and argued that theoretically, the number of possible shapes and appearance of the final product is limitless.
The idea of manufacturing parts for residential houses began to grow post second world war to provide more affordable housing. Nevertheless, the system was not widely adopted and remained relatively expensive, such as Frank Lloyd Wright’s Usonian Automatic Building System (UABS) in the early 1950s due to the limitations to technology (Morse-Fortier 1994). With advancement in computer power and information modelling, Howe et al. (1999) argued that the open building philosophy should be exploited in the current era as it lends itself towards advanced manufacturing, automation, and computer and information technologies.
In recent years, the potential of using an open building system approach for social housing have also been explored in social housing projects such as Empower Shack by Urban Thinkthank in South Africa and Quinta Monroy by Elemental in Chile. Both projects have successfully empowered the local community economically which resulted in better living standard and amenities.
34 RIVER talise 35
DOMAIN OPEN BUILDING SYSTEM & KIT OF PARTS DOMAIN OPEN BUILDING SYSTEM & KIT OF PARTS
fig 2.3.1(right): NEXT 21 in Osaka, Japan
2.4 VERANCULAR ARCHITECTURE
Local vernacular architecture offers a rich repertoire of architectural knowledge in which social, cultural, spatial, physical, technological, and aesthetic factors combined into one complex definition (Rashid and Ara 2015). Stemming from the diversity of local cultures, vernacular architecture in Indonesia was prominent into the 20th century, although many of them have already disappeared or can be classified as endangered (Nas 1998). Nevertheless, recent studies in Indonesian vernacular architecture have highlighted many advantages of locally inspired residential dwellings such as natural ventilation (GhaffarianHoseini et al 2014, Hidayat and Suhendar 2018, Lee et al. 2020), resilience to local environment (Idham, 2018) and social cohesion (GhaffarianHoseini et al., 2014; Idham 2018; Fatimah 2018)
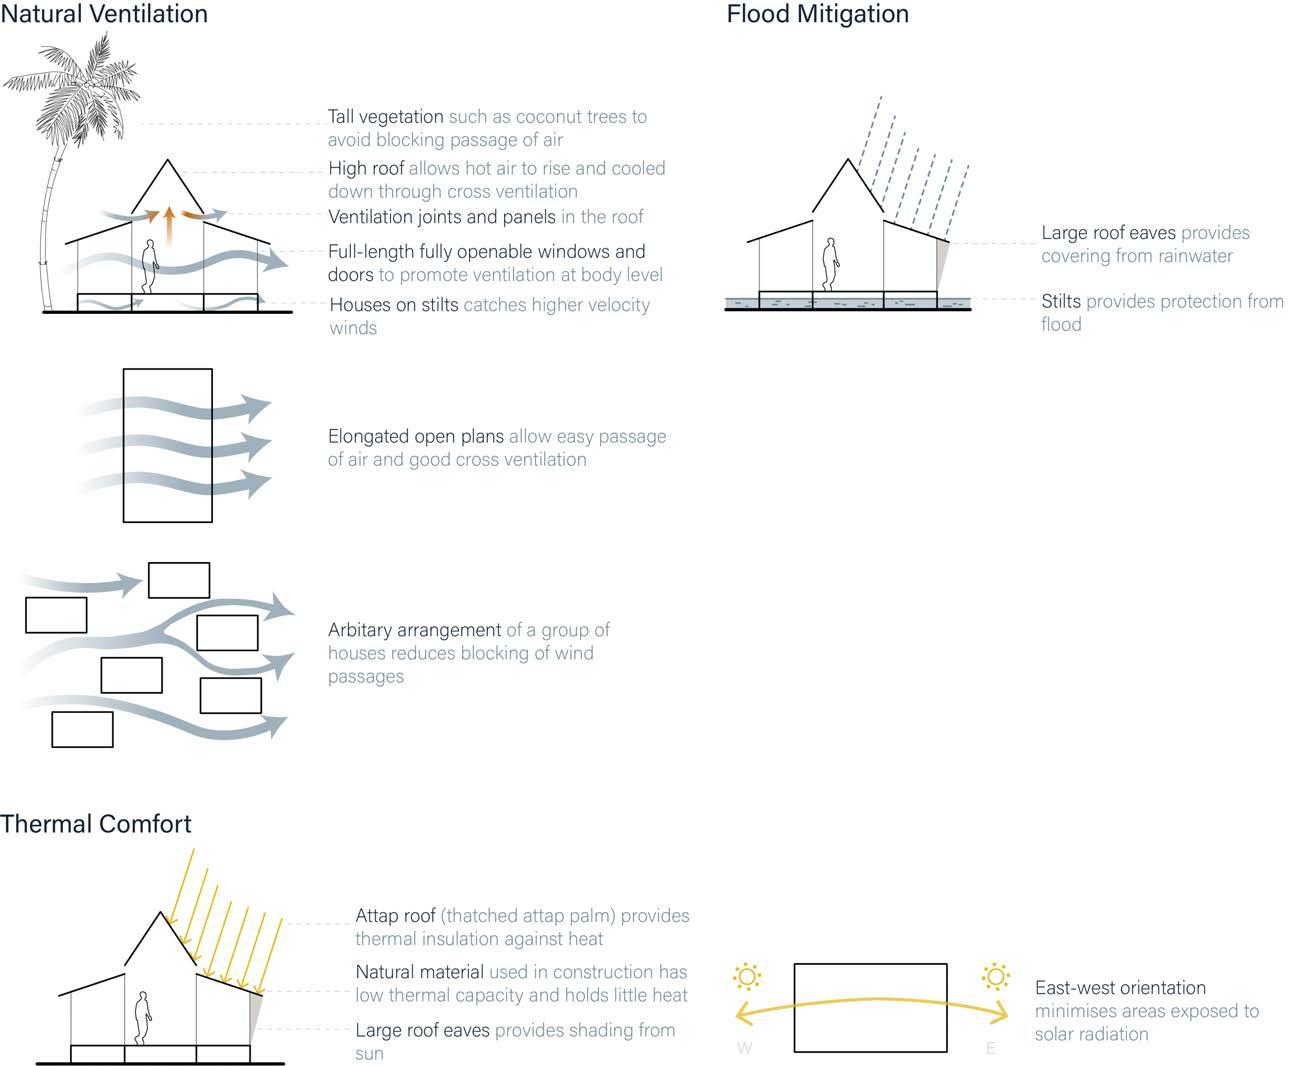
Indonesian vernacular architecture utilises local material such as bamboo and local timber which typically functioned as a post and beam structure. In general, there are distinctive physical similarities within the vernacular architecture in the region, such as thatched or tiled roof, huge windows and founded on stilts. According to Idham (2018), these features emerged to provide resilience to the local hot and humid climate, such as providing shade and protection from heat and rain, encouraging ventilation, maximising amount of fresh air and providing protection from flooding and wild animals
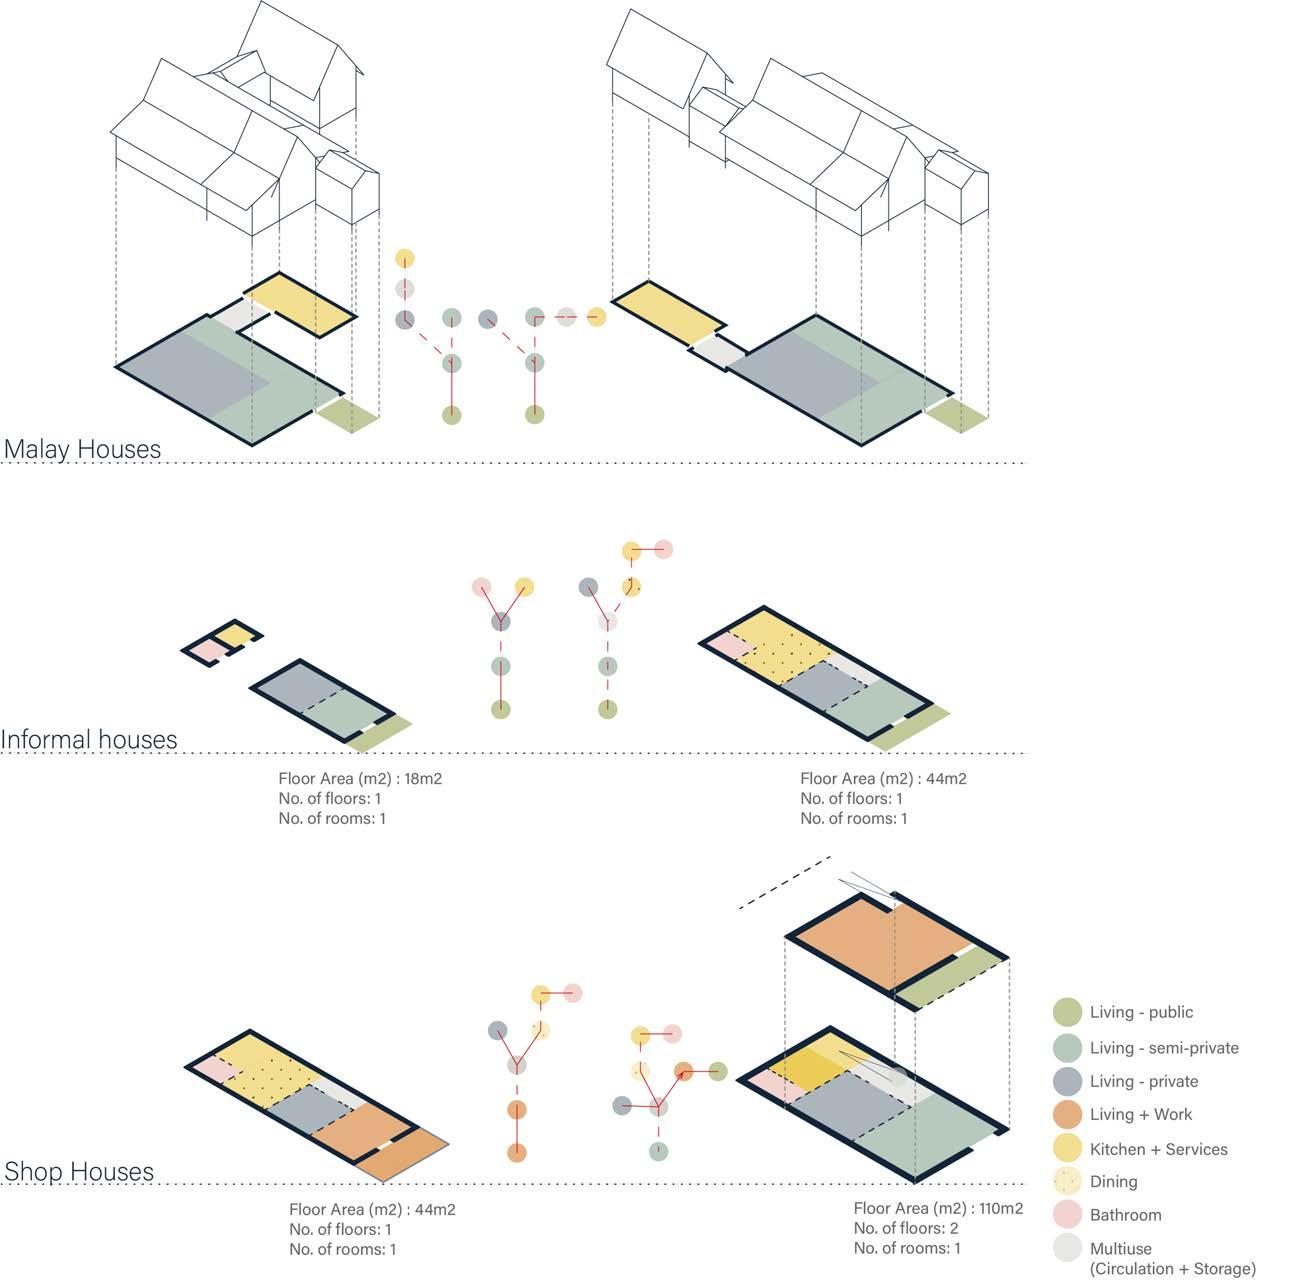
This indicates that there is local architectural knowledge that could be abstracted into a contemporary residential form, to improve the existing slum settlement along riverside in Jakarta in both social and environmental context. Single dwelling and communal dwelling vernacular architecture were explored to support this argument by looking at the two most common vernacular architecture in the region, Rumah Melayu (Malay Houses) and Rumah Panjang (Longhouses).
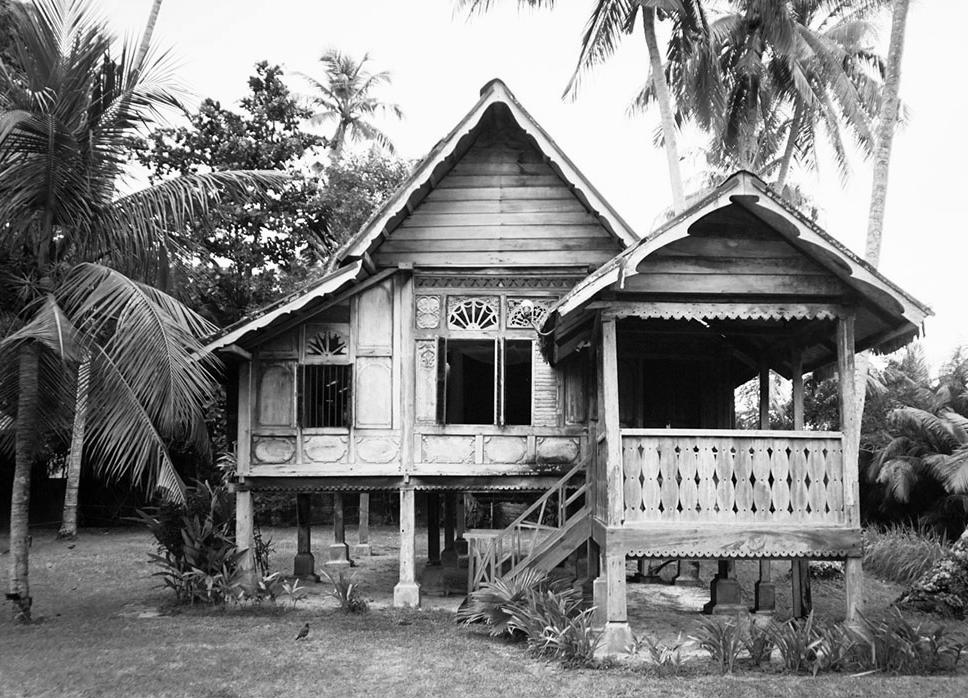
Malay Houses are traditional vernacular dwellings originating from the indigenous ethnic Malay from the region, typically in Malaysia and Indonesia. Although Malay Houses existed in various forms in different locations (Wan Ismail 2005), there is a consistency in form, structure and spaces of the houses that can be observed (GhaffarianHoseini et al. 2014).
36 RIVER talise 37
DOMAIN VERNACULAR ARCHITECTURE DOMAIN VERNACULAR ARCHITECTURE
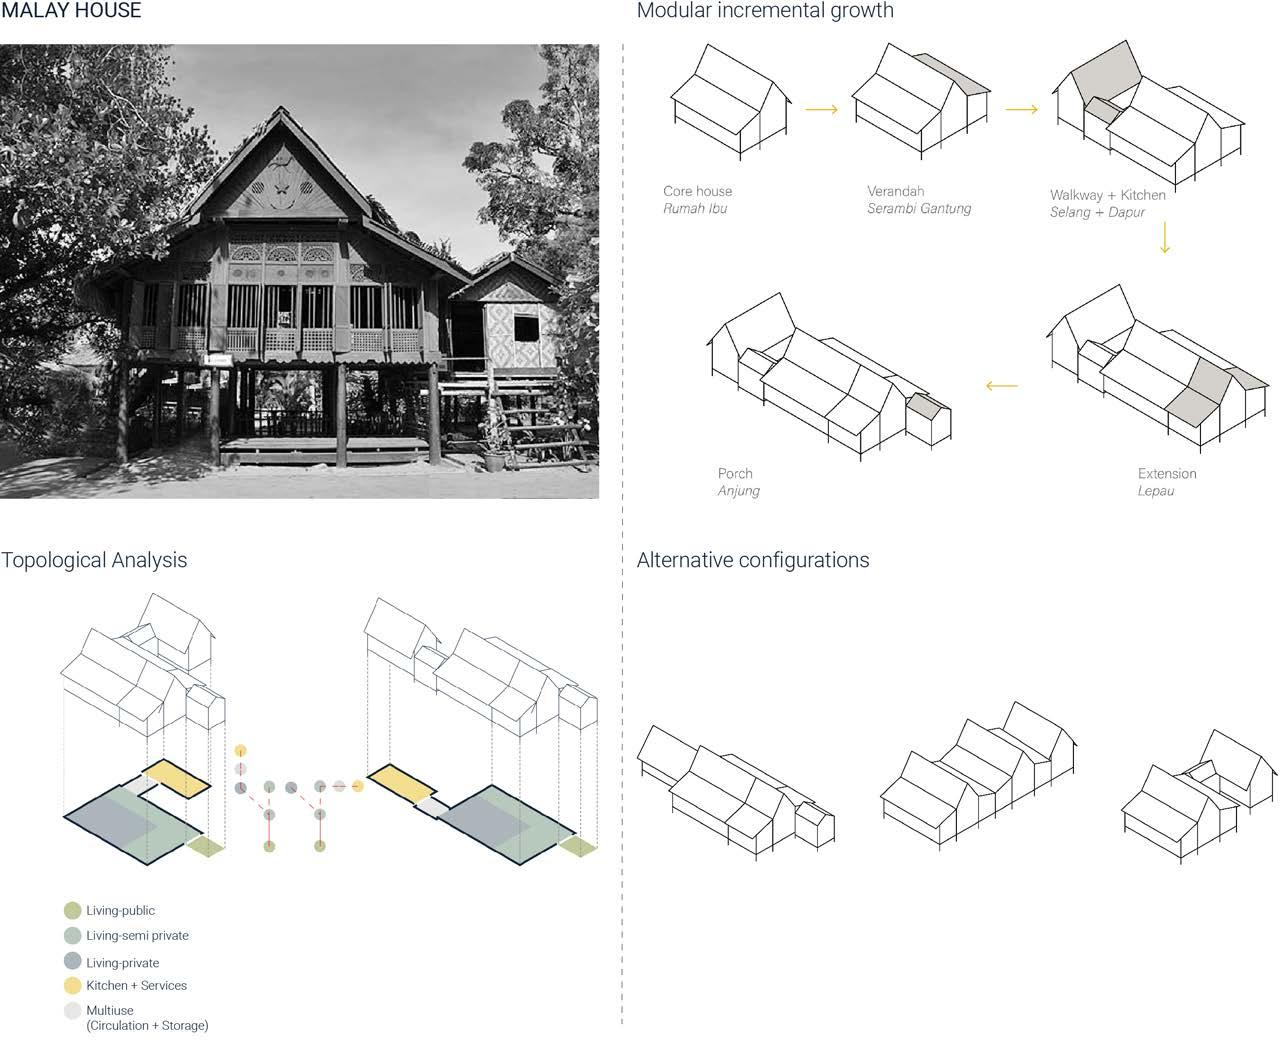
2.4.1 MALAY HOUSE
fig 2.4.1(right-top): Typical Malay House
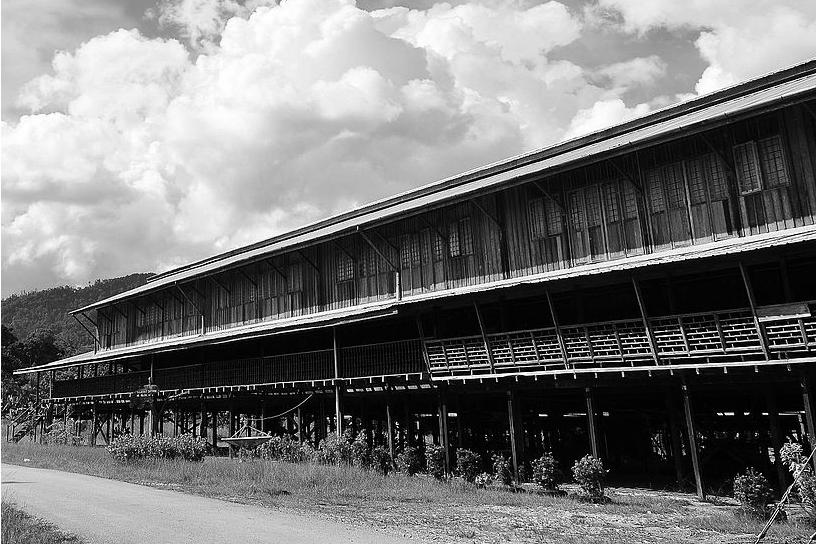
fig 2.4.2(right-bottom): Typical Longhouse
In general, the plan layout of a Malay house is comprised of two fundamental spaces, the front and back spaces. The front spaces are public / semipublic functional spaces and the back spaces are private (Yuan 1991). The Malay House also consists of two distinctive functional areas, rumah (rooms) and serambi. Serambi is an interior longitudinal space, attached to adjacent rumah and typically positioned asymmetrically to the main entrance (Masri et al 2016). Both functional areas and spaces in the Malay House are arranged in an open plan layout, which facilitates the optimal combination of space and function (GhaffarianHoseini et al. 2014). Consequentially, Malay House have limited walls and partitions due to this open plan layout which encourages ventilation within the house
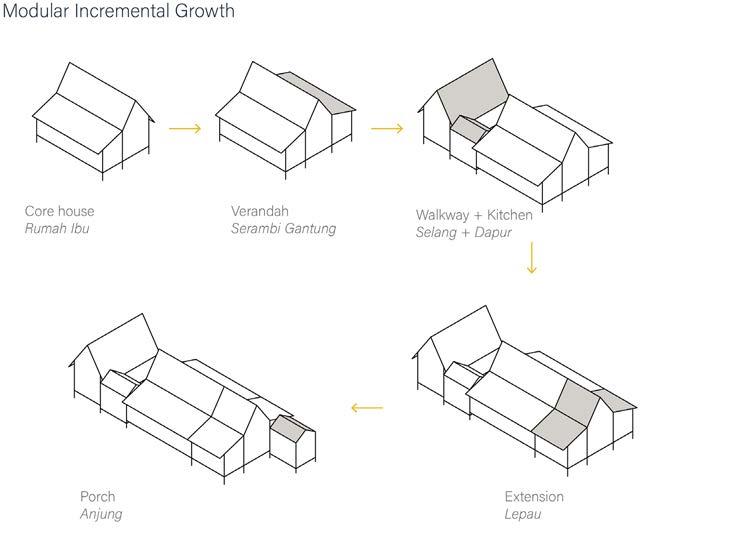
Original layout of a Malay Houses was designed around two main areas, the rumah ibu and rumah dapur. The rumah ibu acts a focal point of the house while rumah dapur (kitchen) acts as a private section for the female inhabitants of the house. The rumah ibu is considered as the core area of the house with its floor level being the highest. Full length windows can be found at the front and back of the rumah ibu (Said and Embi 2007), which encourages cross ventilation and act as a divider between public and private space. Said and Embi (2007) also indicated that the rumah ibu may exist entirely by itself as a basic form of Malay House, with all other spaces optionally added based on implicit rules as practised by the local carpenters and builders.
38 RIVER talise 39
DOMAIN VERNACULAR ARCHITECTURE DOMAIN VERNACULAR ARCHITECTURE
fig 2.4.1.1(left): Malay house - Modular incremental growth
fig 2.4.1.2(right): Climatic design of Malay house
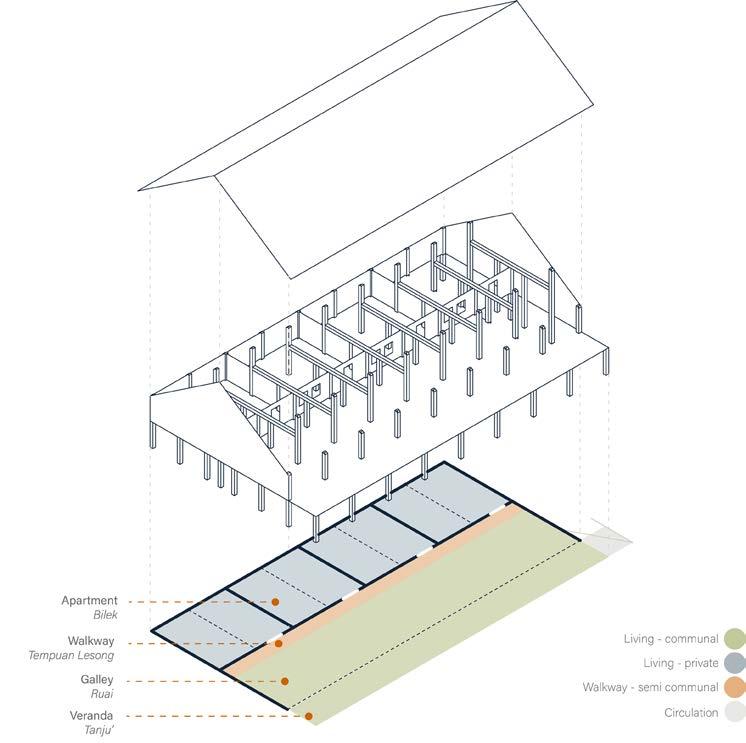
2.4.2 LONGHOUSE OF BORNEO
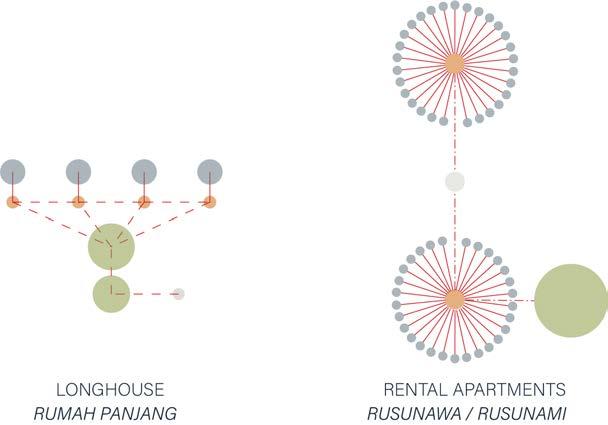
The longhouse is a common traditional dwelling that can be found on Borneo Island. The dwellings are mainly constructed by the Dayak community which are found in Sarawak, Malaysia, and Kalimantan, Indonesia. The longhouse is a form of communal dwelling sometimes referred to as “village under one roof”, which compromises of linearly arranged apartments that are interconnected. The apartments are all connected to a communal gallery space. (Winzeler 2004) While each of the apartments are privately occupied by each household, the gallery is shared by all dwellers to carry out daily chores, socialize, rest, and welcome guests. (Patterson and Chiswick, 1981) The lifestyle reflected by the spatial arrangement is one of strong community spirit, yet the individual can be respected. This can appear very different to many Western domiciliary arrangements in which the absence of walls allowed an easy flow of communality along the length of the longhouse. (Fox 2006).
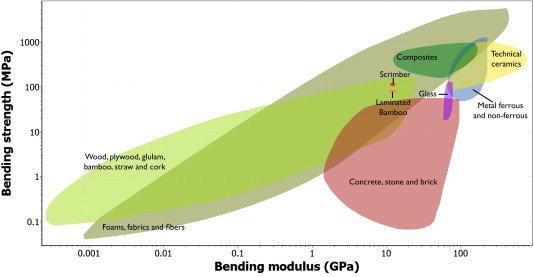
2.4.3 BAMBOO AS CONSTRUCTION MATERIAL
As indicated by Manandhar et al. (2019), bamboo has the potential to be a sustainable building material due to its resilient characteristics, socioeconomic benefits to the local community and environmental benefits. However, the difficulty in making connections and joint suitable for round and variable sections made bamboo prohibitive for mainstream constructions (Sharma et al, 2015). Hence, there is a developing interest in engineered bamboo in recent years as a building material due to the standardisation of shape and the relatively low variability in material properties (Sharma et al, 2014). Furthermore, Sharma (2014) also indicated that engineered bamboo such as bamboo scrimber and laminated bamboo have mechanical properties that are comparable to or exceed those of structural timber and laminated veneer lumber.
In socio-economic benefits, bamboo is a cost-effective material compared to timber and by involving the local community in sustainable bamboo cultivation, manufacturing, and construction, it strengthens the selfreliance of local communities (Manandhar et al. 2019). Environmentally, bamboo is regarded as suitable for afforestation due to its fast growth rate (Basumatary et al. 2015), which leads to additional carbon sequestration storage. (Manandhar et al. 2019) further demonstrated that a bamboostructure building requires less energy and emits less carbon compared to a typical brick-concrete building.
40 RIVER talise 41
DOMAIN VERNACULAR ARCHITECTURE DOMAIN VERNACULAR ARCHITECTURE
fig 2.4.2 (left): Longhouse
fig 2.4.3 (right): Bending modulus vs. bending strength for various construction materials including bamboo and engineered bamboo
The physical and spatial features of vernacular architecture in Indonesia exhibit great potential to be adapted for contemporary residential buildings.
Physically, both vernacular architectures were designed to adapt to its local environment such as high roofs and windows placed to encourage ventilation and stilts to provide resilience to flooding. The potential of these features is explored to inform the household units and building system in this project. The use of bamboo-based construction materials also enables a development which strengthens the socio-economic development of the local community while providing environmental benefits.
Spatially, Malay House and Longhouse emphasised the importance of communal spaces to encourage interaction within the households and community, without compromising privacy. Moreover, the Malay House concept of rumah ibu as a core demonstrated the potential of “open building” and “flexible design” concepts that are appreciated within the local community. The kit-of-parts construction technique, which allows a certain degree of freedom for buildings with a set of design rules (Howe and Yoshida 1999), has the potential to exploit this concept.
The Next21 in Japan have embraced the kit of parts technique to drive an Open Building design to individual housing units in an integral system building. Although fully designed by architects, the project was considered one of the most advanced projects adapting this concept (Kendall 1999).
42 RIVER talise 43
DOMAIN VERNACULAR ARCHITECTURE DOMAIN VERNACULAR ARCHITECTURE
2.4.4 EVOLVING THE VERNACULAR
fig 2.4.4.1 (left): Longhouse vs. Rusunawa fig 2.4.4.2 (right): Vernacular vs. Contemporary
As the problem of flooding in Jakarta is interlinked with complex social and housing issues, the development of river rehabilitation strategy in Ciliwung River would require bridging different disciplines. Engineered infrastructure solutions do not address the root cause to flooding in Jakarta nor does it consider the meaningful communities that characterises the riverfronts of Jakarta.
To overcome this issue, integration of the urban spaces within the riverfronts of Jakarta with river rehabilitation and flood mitigation strategies is explored as a potential solution. Design of flexible social spaces and river rehabilitation strategies are explored to assimilate with adaptive architectural system inspired by local vernacular architecture, which respond to both the bioclimatic and sociocultural issues on site, along with increasing the resilience of the system from the flooding issues.
In Phase 1 (Msc) of this research, the goals include clearly defined urban zoning and parameters, development of the building system and its distribution within the selected site.
The research question for this dissertation that we are hoping to answer is as follo
ws:
Can a resilient framework for riverfront development of Southeast Asian cities be developed responding to challenges caused by flooding and unplanned urbanization while adapting to future population growth through ecological landscaping and building system evolved from local vernacular typologies?
44 RIVER talise 45
DOMAIN VERNACULAR ARCHITECTURE DOMAIN VERNACULAR ARCHITECTURE
2.5 RESEARCH PROPOSAL
2.6 M.S c EVALUATION + M.A rch A MBITION
Through experimentation at both urban and architectural scale, the M.Sc. proposal outlines some initial ideas and strategies to develop a new urban fabric by integration of the two systems to a certain extent. Critical observations on the developed urban fabric were carried out to explore the potential opportunities for further improvement.
Firstly, there are possibilities for higher integration between the architectural system and urban system by incorporating street and pedestrian networks to link hydrological functions and building blocks. Analysis of the network to evaluate its syntactical performance would form an essential part in the integration workflow. This will help in achieving an urban fabric with high connectivity and greater coherence between the designed elements on an urban scale.
Secondly, an observation revealed that the spatial distributions on urban fabric resulted in unexpected empty plots, which might be due to the setup of the building distribution logic. One way to potentially solve this issue is to incorporate the path network in the integration strategy to allow a clearer and logical approach in the distribution of the buildings.
On an urban scale, a zoning experiment was carried out to compute environmental data and combine flood risk in the context of the site. Although, the information from this experiment is then used in allocating hydrological functions on this site, it fails to reflect the overall distribution of flood strategies on the site relative to its associated risk factor. Overall risk zoning in conjunction with different flood mitigation strategies and hydrological networks will be investigated in the M.Arch phase.
The potential of M.Sc. proposal lies at architectural scale, where the initial exploration of a building system was achieved. Although it proved that an architectural framework for community housing can be developed to preserve existing communal coherence while maintaining the informal characteristics of self-build, the system was restricted in the degree of flexibility achieved within the building system and lacked architectural design considerations.
This will be revisited in M.Arch phase by developing a framework for housing aggregations and communal spaces in the form of a 3D communal network within the building system. Another ambition on an architectural scale is to develop different building densities and block types in relation to the associated flood risk factors.
In the next phase of the project, the system should be further explored to balance and integrate the design in architectural, cluster and urban scale with suitable design logic. These additional logics require some initial experiments to be revised as this is an iterative process.
46 RIVER talise 47 DOMAIN M.SC EVALUATION DOMAIN | M.SC EVALUATION
METHODS
Jakarta’s urban flooding, unplanned urbanisation and housing shortage problems are intertwined and complex. To tackle these problems with a holistic approach, solutions and strategies on various scales need to be devised and integrated.
From the initial domain research on individual problems, strategies and principles were abstracted. These were then put to test through a series of interlinked experiments on urban, architectural and cluster scales.
Experiments on an urban scale focused on establishing rules and parameters with regards to flood mitigation. Analyses conducted involved environmental data and simulation of different aspects of a flood event. The outcome was manifested not only as urban zoning but also as design principles and parameters that would become the inputs to experiments on other scales.
On an architectural scale, design principles abstracted from vernacular and contemporary practices, along with those inherited from urban scale experiments, were translated into the design of physical and spatial elements of the building system.
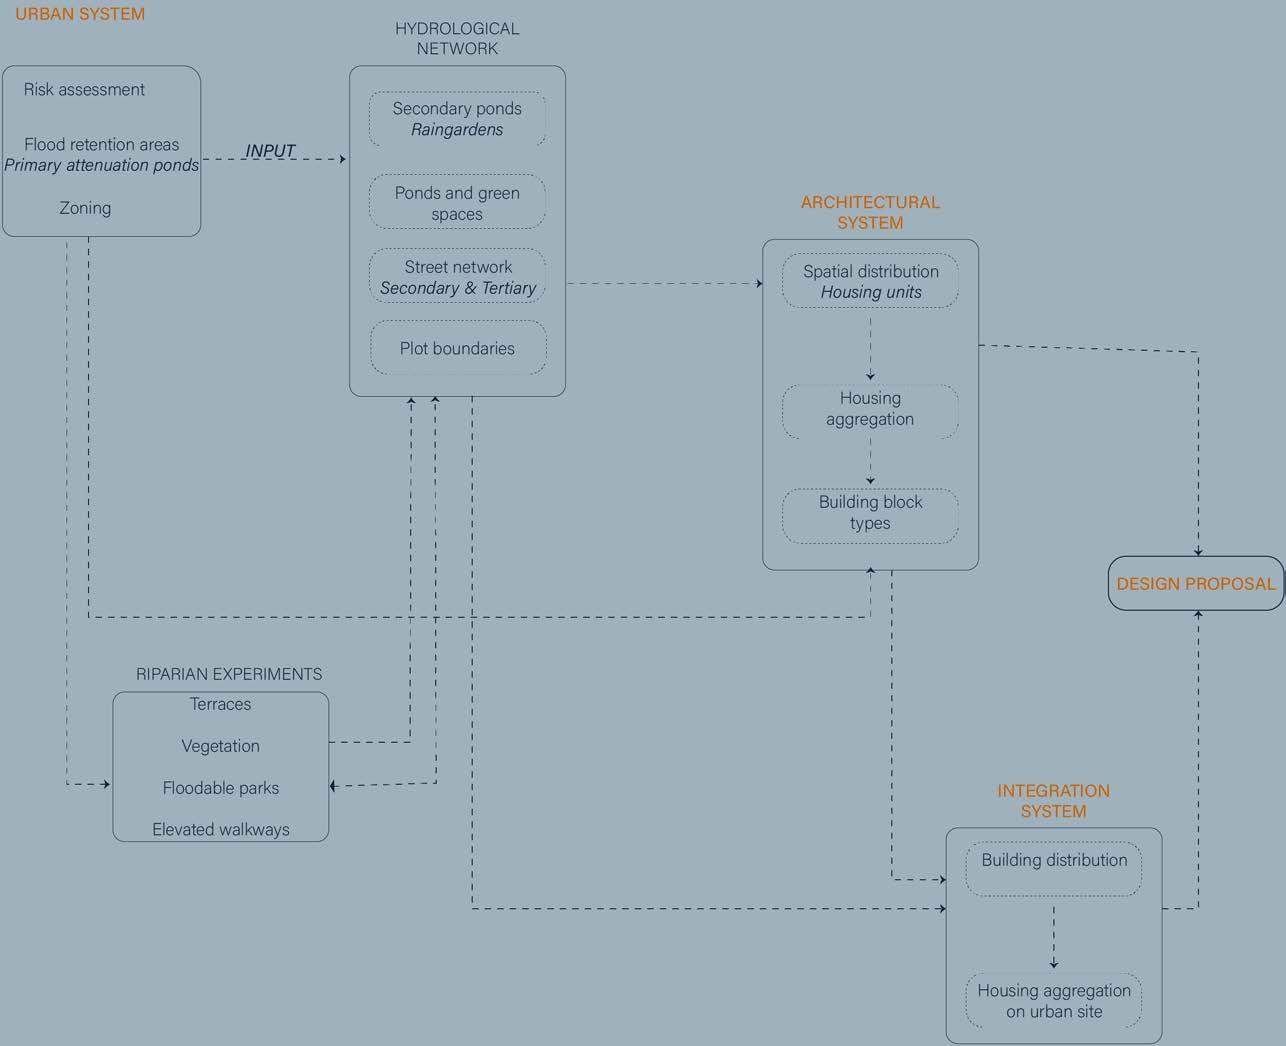
Finally, the integration experiments brings together the design priciples from urban and architectural scale through generation of housing aggregation on the urban fabric. The design solutions were evaluated and evolved through multi- objective optimisation to further respond to various aspects of the context. The outcome of these experiments allows the generation and contextualisation of individual buildings, leading to the final design proposal.
This chapter presents the detailed methodology undertaken for these experiments. It starts off with the outline of the experiments including the summary and interaction, followed by a detailed compilation of the tools and analyses used in the experiments.
48 RIVER talise 49
METHODS EXPERIMENTS OVERVIEW
FLOOD SIMULATION
Flood simulation is the modelling of flooding scenarios, considering hydraulic and hydrological behaviour of the river and the floodplain. In a 2-D flood simulation, the analysis contains both the river cross section (1D simulation) and the topographic information about the flood plain. A flood simulation could help understand the development of flood events over time, the inundation level and flow velocity, all of which contributes to the development of strategies for different elements both on an urban and architectural scale. Flood simulation was conducted for this research project using RiverFlow2D Flood Simulation for Autodesk Infraworks
COMPUTATIONAL FLUID DYNAMICS
Computational fluid dynamics (CFD) is a numerical analysis in fluid mechanics that harnesses the processing and calculation capacity of computers to analyse and solve problems about fluid flows. In this research project, CFD studies were carried out using the commercial software Autodesk CFD 2019


The CFD was used in analysis of water flow in a flooded scenario. CFD was used to analyse the flow velocity and impact on structures, to facilitate the development of suitable solutions in these areas.
ENVIRONMENTAL ANALYSIS/DATA MAPPING

Various environmental data, including the output from flood simulation and flow simulation, were remapped to values between 0 and 1. This allowed an overlay of the data, to compute an overall flood risk factor.
GENETIC ALGORITHM
Genetic algorithms (GA) are a tool to solve multi-objective optimisation problems, inspired by the process of natural selection. The process consists of the evolution of design solutions (phenotypes), by varying certain input parameters (genes), and evaluating them against several (often contradicting) fitness criteria. The fittest individuals are selected for mutation and reproduction to produce next generation solutions, similar to the principles observed in the field of evolutionary biology. This simulation was performed using the Grasshopper plugin Wallacei.
FLOW SIMULATION
Flow simulation was conducted to analyse the surface runoff during rainfall on the site’s topography. This was performed by dropping particles on the surface mesh and allowing them to flow down the slopes of the surface. Flow paths were recorded to understand the location of runoff accumulation. This simulation was performed using the Grasshopper plugin Groundhog.
SOLAR RADIATION ANALYSIS
In order to further analyse the performance of the GA results for housing aggregations on a block scale, the utilization of solar radiation analysis on the ground level aims to guide the selection of the design proposal from the selected individuals from the GA experiments. Considering the hot and humid climatic conditions of the site, the solar radiation analysis is carried out on a block scale to choose a solution with increased shading in the communal areas on the ground level to encourage social interactions vital to the community.
50 RIVER talise 51
METHODS TOOLS METHODS TOOLS
SPACE SYNTAX
Space Syntax analysis was performed to evaluate topological relationships on urban and architectural scales. On an urban scale, syntactical analysis is carried out to measure the closeness centrality of the generated street network. Closeness centrality is defined as the total length of the average shortest path between a vertex and all other vertices in a network. Syntactical analysis was performed using the Grasshopper plugin Decoding Spaces
On an architectural scale, an integration analysis were performed to evaluate the topological relationship between spaces. This is applied in assessing the topological quality of the spatial aggregation and distribution of functions within housing units. For instance, the higher integration measure of the network, the space is more connected and hence more favourable for communal/semi-public activities and lower the integration measure, the spaces are more favourable for private zones. The integration analysis was performed using the Grasshopper plugin

Spatial aggregation within a housing unit and housing aggregation on a building scale was carried out with the help of a Grasshopper plugin Wasp which contains a set of components developed in Python. The aggregation process relies on a framework of rulesets wherein the description of each individual part including basic information necessary for the aggregation process (part geometry, connections location and orientation) is set forth. The set of connections defines the topological graph of the part, which is then used to define the possibilities of aggregation with other parts.
52 RIVER talise 53 METHODS TOOLS METHODS TOOLS
Syntactic AGGREGATION
4.1 URBAN SYSTEM
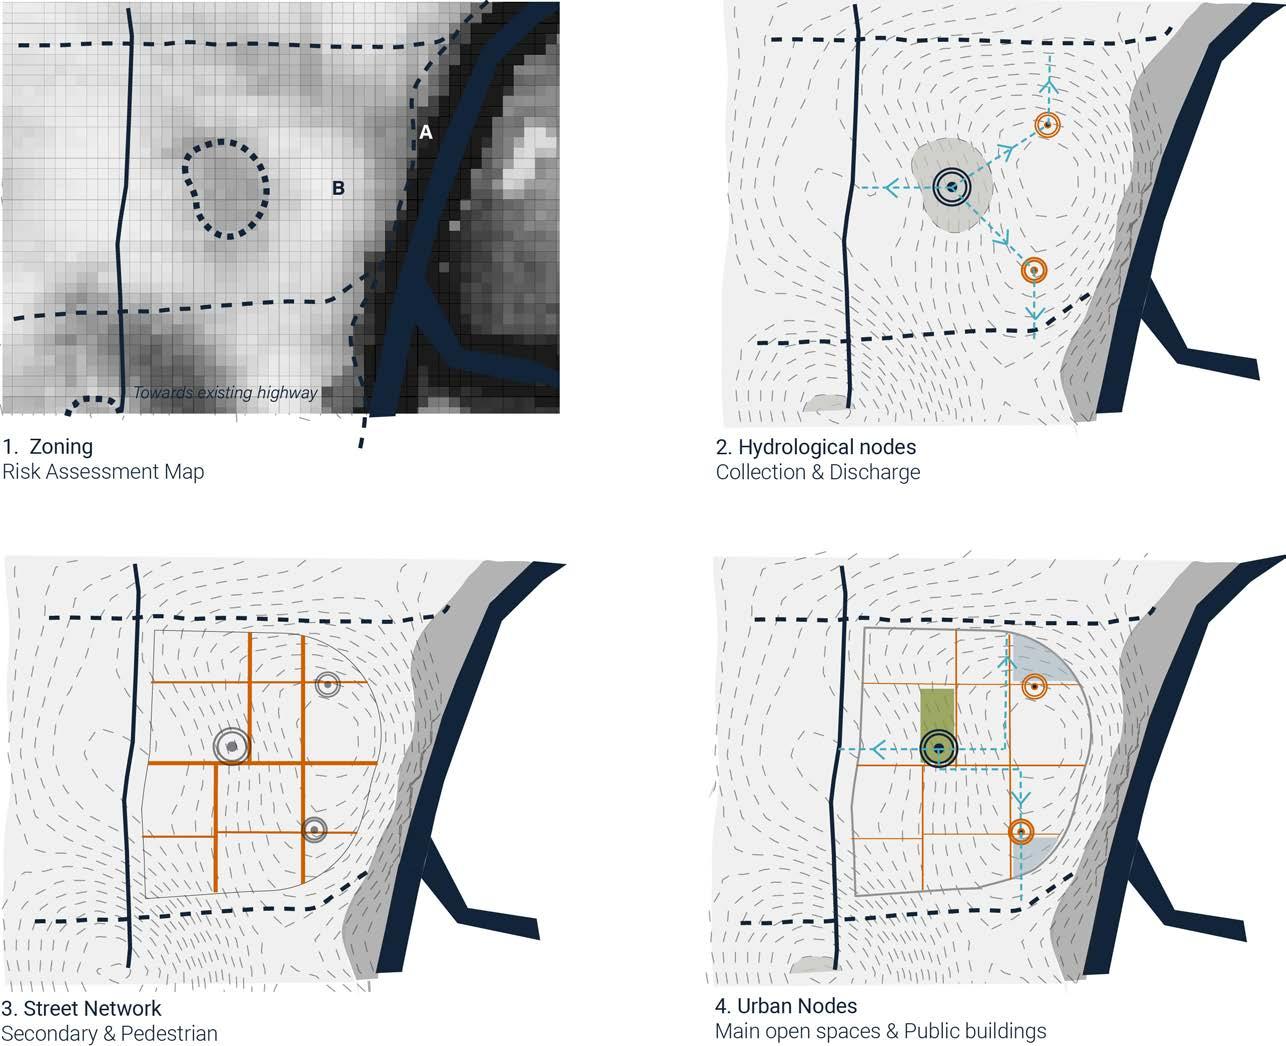
At an urban scale, the aim was to utilize flood mitigation strategies as the skeleton in urban zoning. This was first approached by a zoning experiment performed to compute and assess flood risk for the site, based on environmental data mapping and evaluation to create urban nodes. The flood risk assessment helped in identifying appropriate flood mitigation strategy based on the local river dynamics and the associated infrastructure network. Based on this as a framework, the hydrological network is established in dense urban areas which consequently helps in identifying street networks on the site. Hydrological networks along with street networks help in locating urban clusters on the site. The urban clusters created aims to reflect the existing administrative zones (RT/ RW)’s role in creating social cohesion.
4.1.1 FLOOD SIMULATION
4.1.2 ENVIRONMENTAL DATA MAPPING
4.1.3 RISK ZONING
4.1.4 RIPARIAN LANDSCAPE: ZONE A/B
4.1.5 INTERCONNECTIVITY BETWEEN ZONES: GREENWAYS
4.1.6 ZONE C: URBAN CLUSTERS
4.1.7 HYDROLOGICAL NETWORK
54 RIVER talise 55
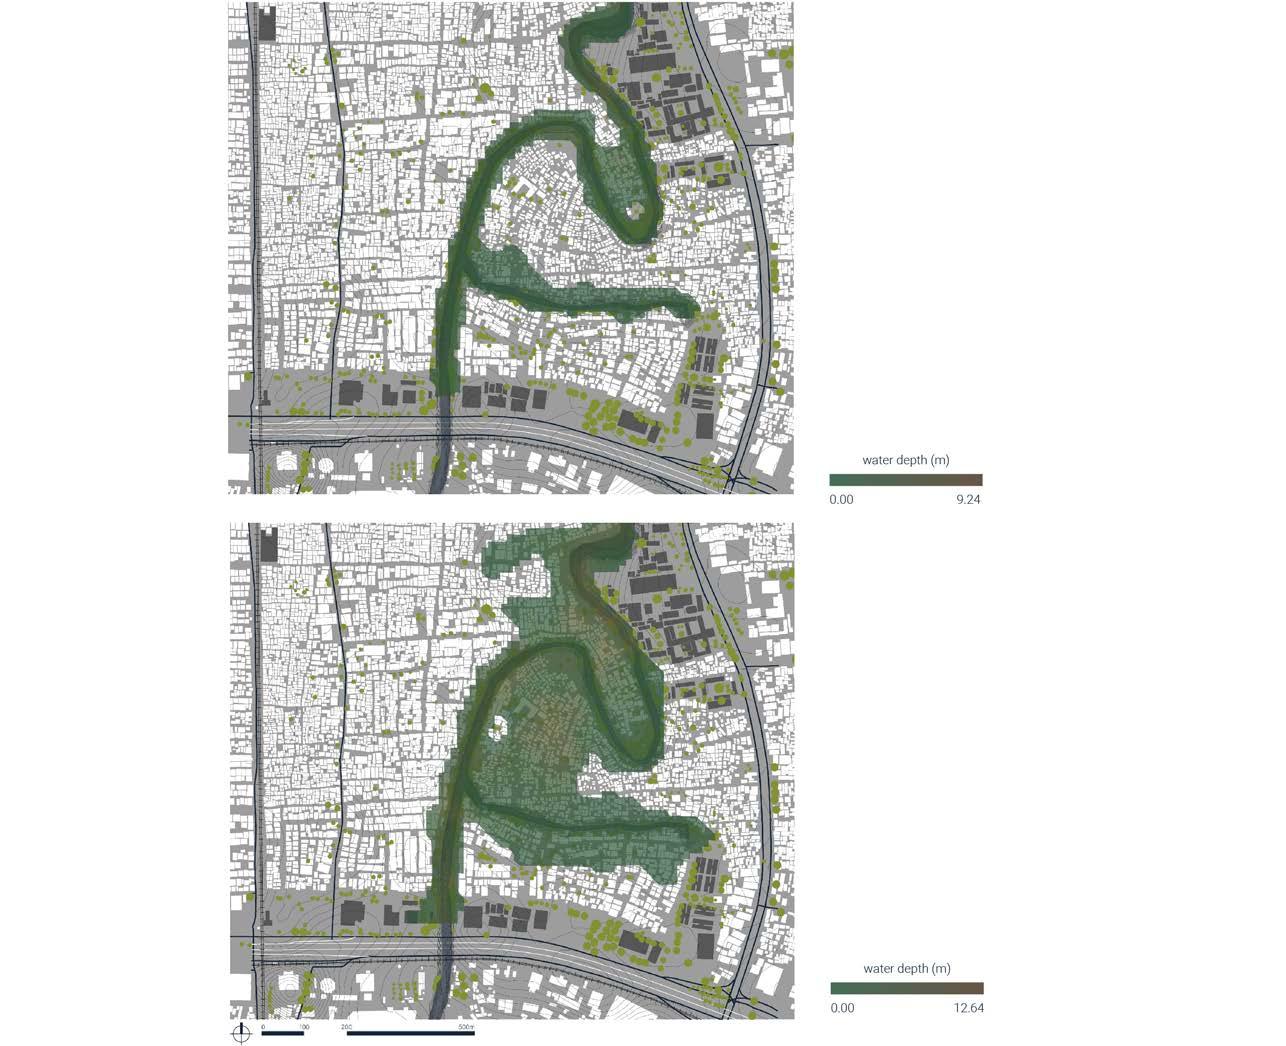
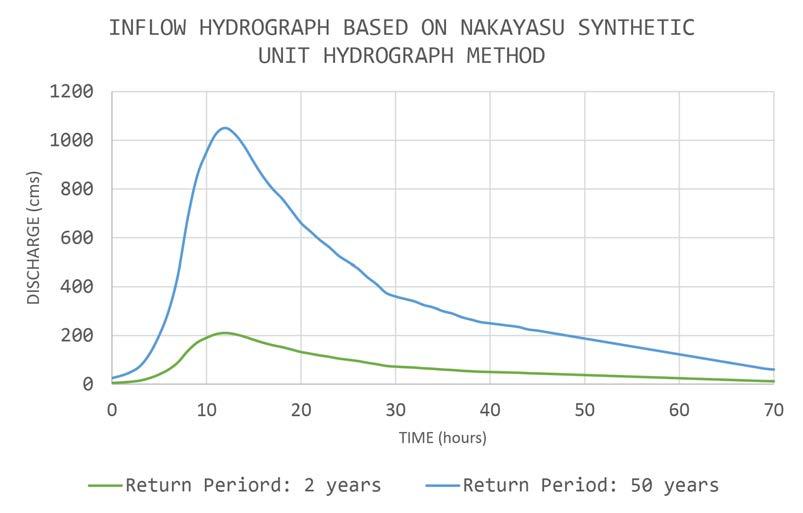
4.1.1 FLOOD SIMULATION Flood inundation was obtained from flood simulation in the site using Autodesk Infraworks and its flood simulation plugin. The simulation was based on upstream discharge hydrograph derived using the Nakayasu Synthetic Unit Hydrograph Method for a 2-year return period rainfall from a previous study1, and it was amplified to reflect the extreme event of 50year return period flood.
56 RIVER talise 57 RESEARCH DEVELOPMENT URBAN SYTEM RESEARCH DEVELOPMENT URBAN SYTEM
Fig 4.1.1 (left): Inflow hydrograph based on Nakayasu synthetic unit hydrograph method
Fig 4.1.2 (right): Flood simulation: flood inundation (Top: recurrent flood – 2 year return period; Bottom: extreme flood – 50 year return period)
4.1.2 ENVIRONMENTAL DATA MAPPING
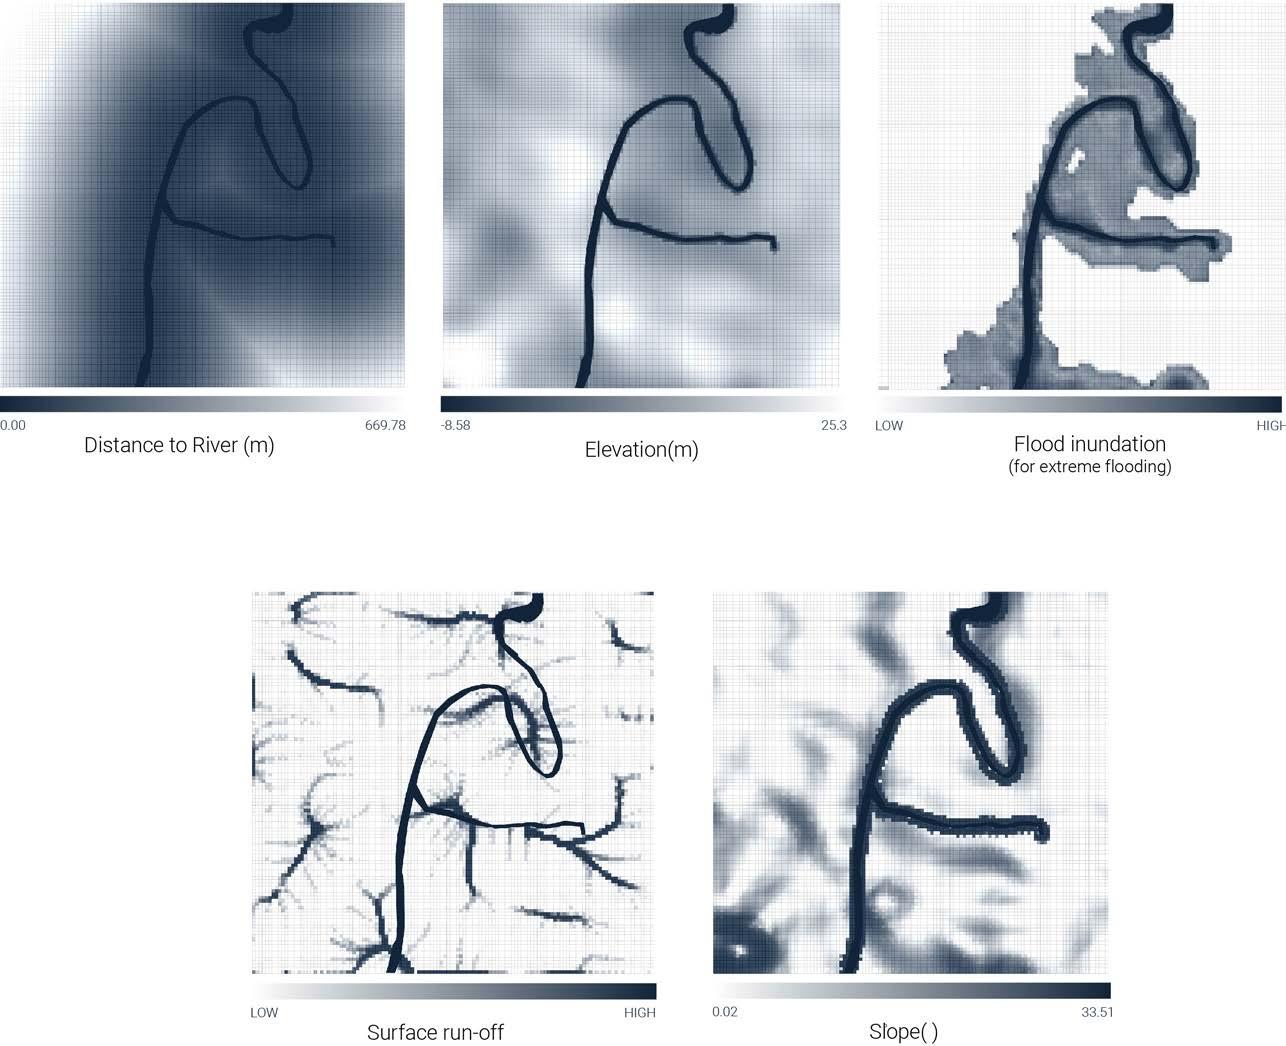
Various environmental factors were analysed and mapped in the context of the site. All analyses were carried out on the chosen site with a resolution of 10 x 10m. Elevation, distance to river and slope were calculated based on the topographic mesh of the site in Grasshopper. Flood inundation was obtained from the flood simulation outlined previously.
Surface runoff was simulated by a particle drop on the topographic mesh. The values mapped were the number of particles passing through each 10 x 10 cell during the surface runoff. This parameter helped to understand the possibility of surface runoff and water accumulation during the event of heavy rainfall.
58 RIVER talise 59 RESEARCH DEVELOPMENT URBAN SYTEM RESEARCH DEVELOPMENT URBAN SYTEM
fig 4.1.3(right): Environmental data mapping
All the environmental data was remapped to 0 – 1 and superimposed with appropriate weights to compute the combined flood risk factor.
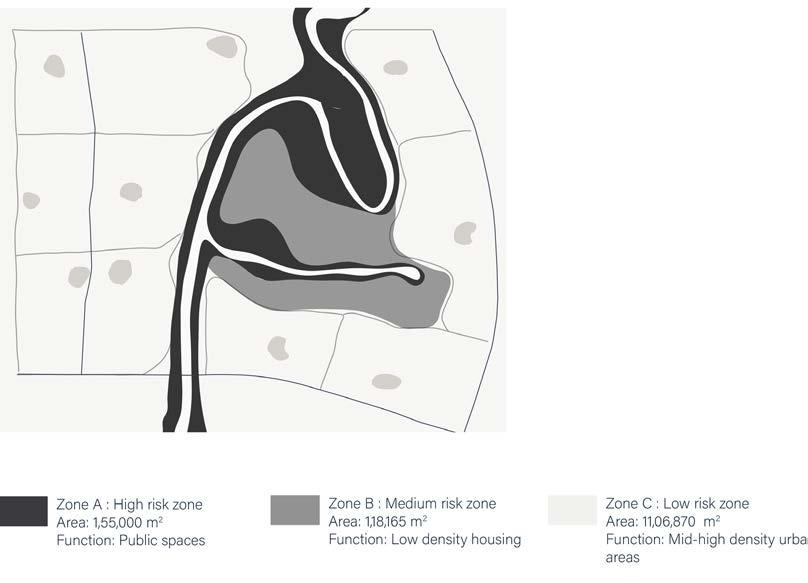
The combined flood risk assessment with site boundaries and incoming primary streets on the site, enabled identification of three zones on the site, with zone A being the most vulnerable zone to flooding and zone C being the safest zone. It also helped in identifying flood retention areas or areas where water would accumulate during a flood event or heavy rainfall.
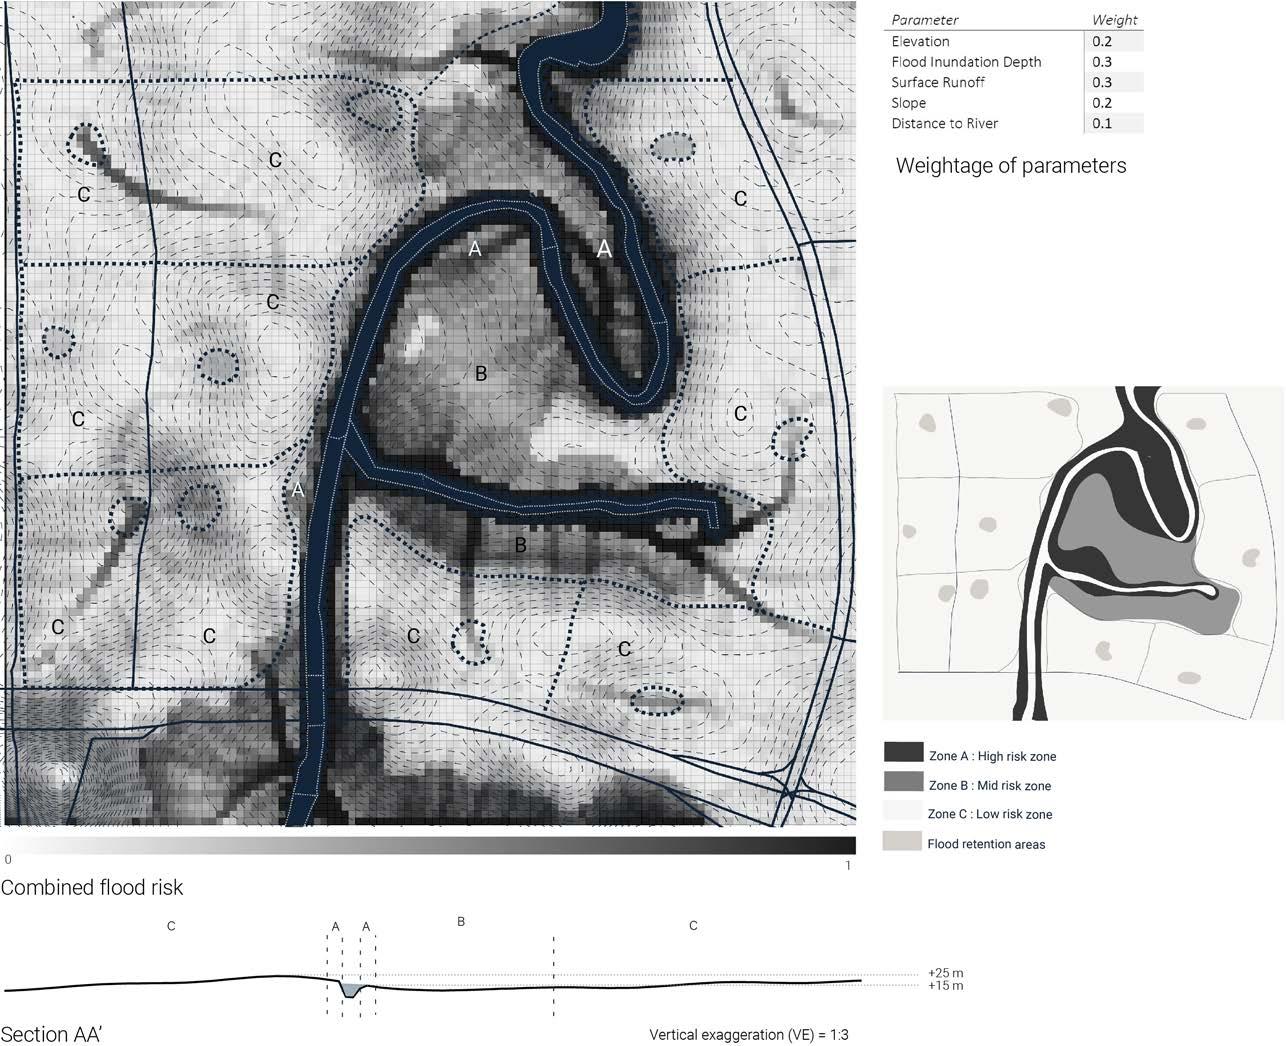
The land use of each zone is defined by the combined flood risk values. The zone values reflect adjacencies to the river and flood risks, enabling the development of different land-use as well as distribution of flood strategies on the site.
The lowest risk zone C will accommodate most of the residential blocks as well as the main open spaces and public buildings like mosques and schools. The highest risk zone A will be converted into a terraced riparian landscape with dense vegetation and open spaces for water accumulation during a flooding event which can also be used as riverfront public spaces otherwise. The Zone B, being moderately affected by flooding, thus making it less favourable for people to inhabit, will accommodate low-density housing on a terraced riparian landscape.
With regards to residential block types in zone B and zone C, each zone will incorporate distinctive characteristics that respond to flood mitigation strategy like elevated building blocks and varying block density with reference to number of floors, plot size and number of houses. The flood retention areas identified in zone C will be used as primary attenuation facilities for urban clusters.
60 RIVER talise 61 RESEARCH DEVELOPMENT URBAN SYTEM RESEARCH DEVELOPMENT URBAN SYTEM
4.1.3 RISK ZONING
fig 4.1.4 (righ): Combined flood risk
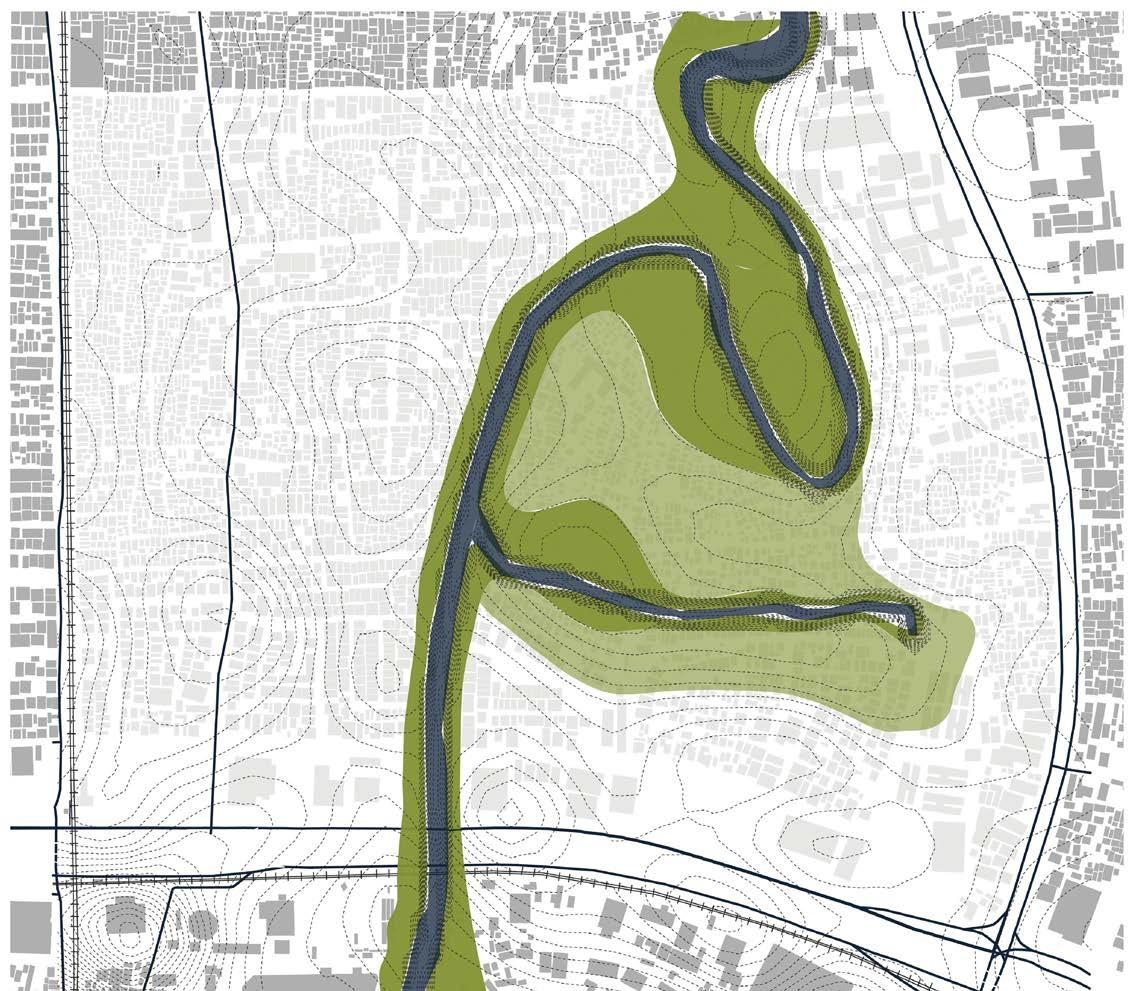
As highlighted in the domain studies on river flooding, flood simulation of the site and the risk zoning experiment, the areas most prone to fluvial flooding are those areas on the inside of a bend. There are two such areas within the extent of the site. Flood simulations have shown that some parts will be flooded even during recurrent flood events (2 years return period), thus the flood mitigation strategy in these areas is to change the landscape into a terraced riparian landscape. The terraced landscape acts as an absorptive landscape for collecting, filtering and dispersing floodwater during the stormy season.
The riparian landscape is introduced in two zones, zone A (High-risk zone) and zone B (Medium-risk zone). The extent of riparian landscape in these zones reflects the varying river edge conditions. Zone A is the closest to the river and has the highest flood risk and hence, it is translated into dense riparian vegetation, with open spaces for water accumulation during a flooding event which otherwise can also be used as riverfront public spaces. While zone B, being at medium flood risk, is converted into less dense vegetation zones with low-density housing. The riparian landscape is designed keeping in mind the topographic variation to support a range of ecological conditions from ponds, to seasonal wetlands, floodable parks and green spaces at higher elevations alongside the urban neighborhoods.
62 RIVER talise 63 RESEARCH DEVELOPMENT URBAN SYTEM RESEARCH DEVELOPMENT URBAN SYTEM
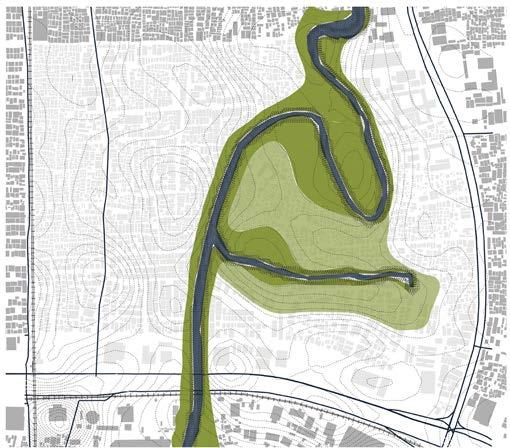
4.1.4 RIPARIAN LANDSCAPE: ZONE A/B
fig 4.1.5 (left): Risk zoning
fig 4.1.6 (right): Riparian zones, plan
The main purpose of riparian landscape is to increase the absorptive area in the high flood risk zones by integrating vegetation on terraced wetlands. There are several advantages of riparian vegetation including:
1. increased flood control by preventing soil erosion and decreasing water velocity
2. ecological restoration by revitalizing local plants and species
3. ecological purification system
4. creating space for public functions along the riverfront areas
The advantages of using local plants for ecological restoration was founded in research by Suryantini, Permata, Angelia, 2018 which was conducted with the Komunitas Ciliwung Condet (KCC). The research also proves that native vegetation is not only well adapted to local conditions (Abd El Aziz, 2016), but also crucial for stormwater intervention and improvement of riverbank ecosystem. (Gonzales, et al., 2015)
64 RIVER talise 65 RESEARCH DEVELOPMENT URBAN SYTEM RESEARCH DEVELOPMENT URBAN SYTEM
4.1.4 RIPARIAN VEGETATION
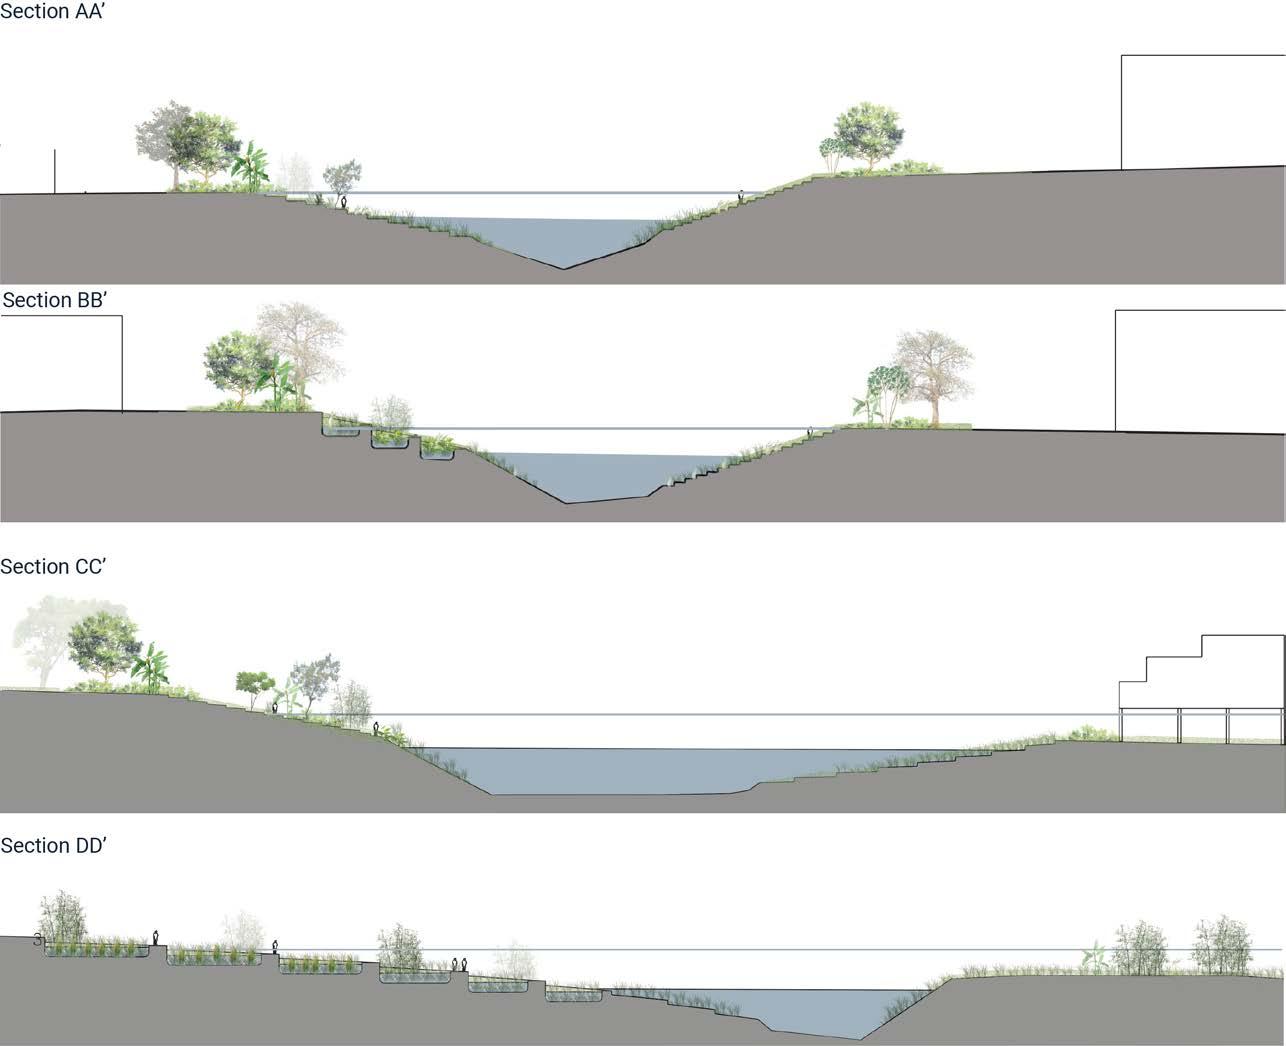
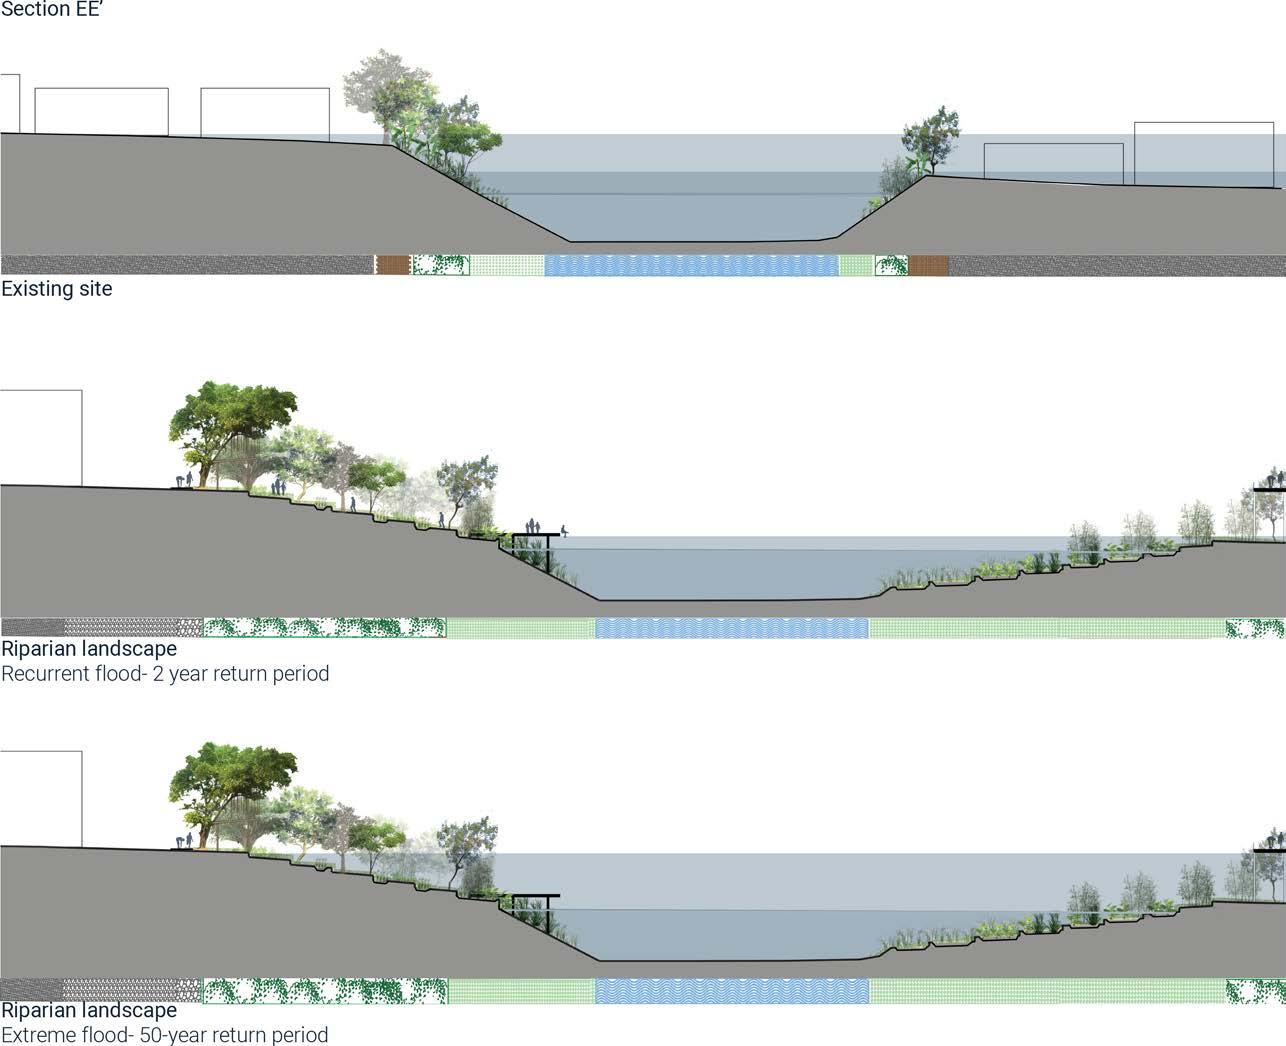
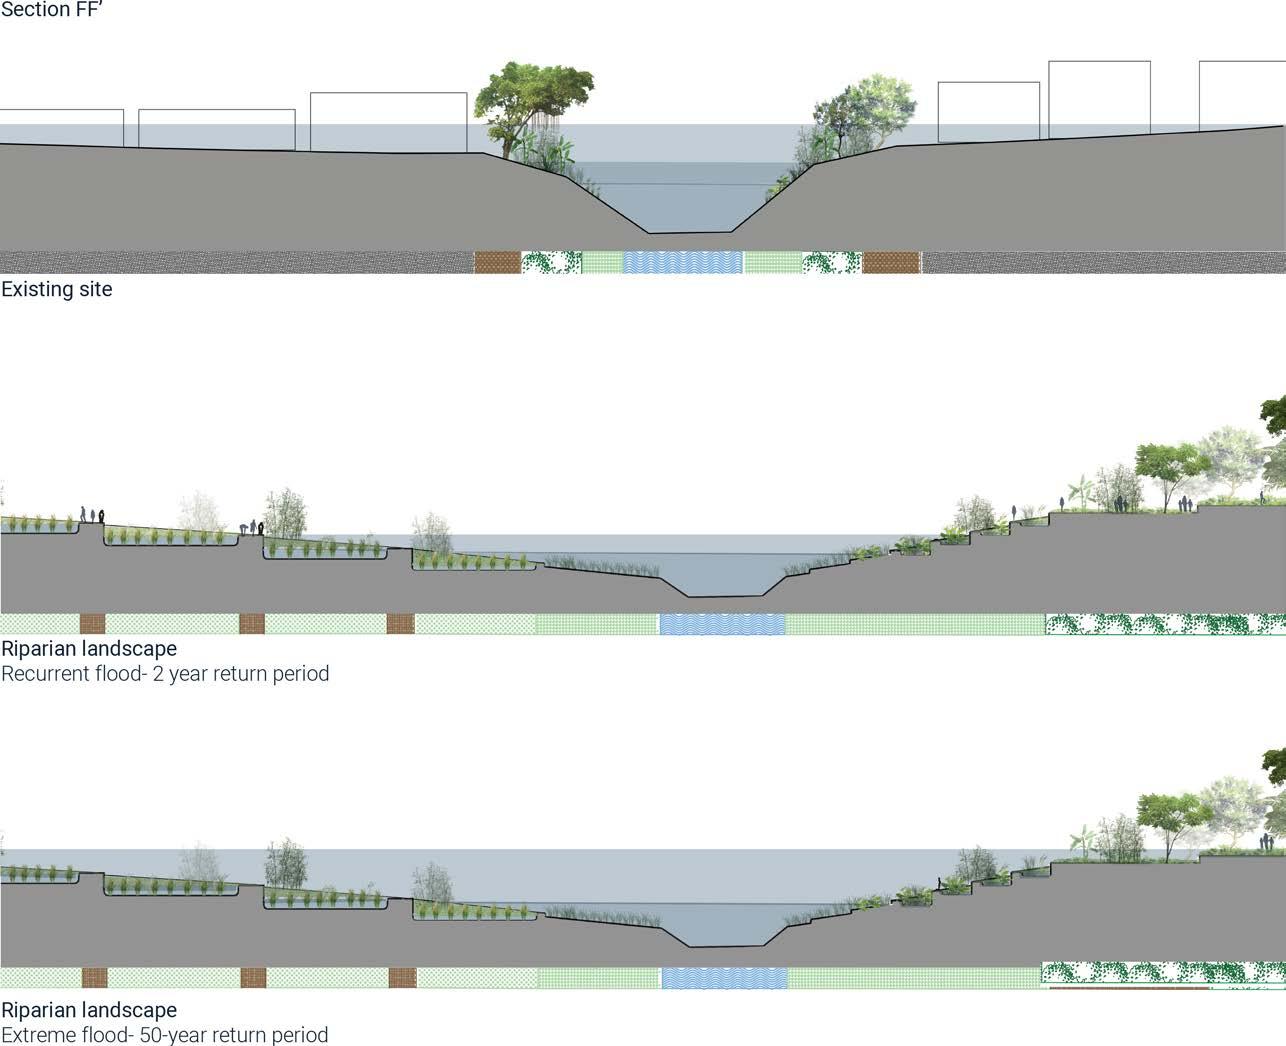
AA’ BB’ EE’ FF’ CC’ FF’
fig 4.1.7 (right): Riverbank sections showing riparian landscape fig 4.1.8 (pg 66, 67): Existing riverbank sections , riparian landscape sections: 2 year /50 year flood return period
66 RIVER talise 67 +16 m +20.6 m +14.2 m +16 m +14.2 m +20.6 m +14.2 m +16 m +20.6 m +14.2 m +16 m +14.2 m +20.6 m +14.2 m RESEARCH DEVELOPMENT URBAN SYTEM RESEARCH DEVELOPMENT URBAN SYTEM
4.1.4
The distribution of vegetation in the riparian zones is based on the different terrain conditions along the river, which can be broadly categorized into three types : high plain, intermediate plain and low plain. (Suryantini,Permata,Angelia,2018)
The high plain is an elevated area which has a flat surface and is fully shaded. The vegetation in this area includes shrubs, trees with a height of more than 6 meters, and extensive canopies such as picung tree.
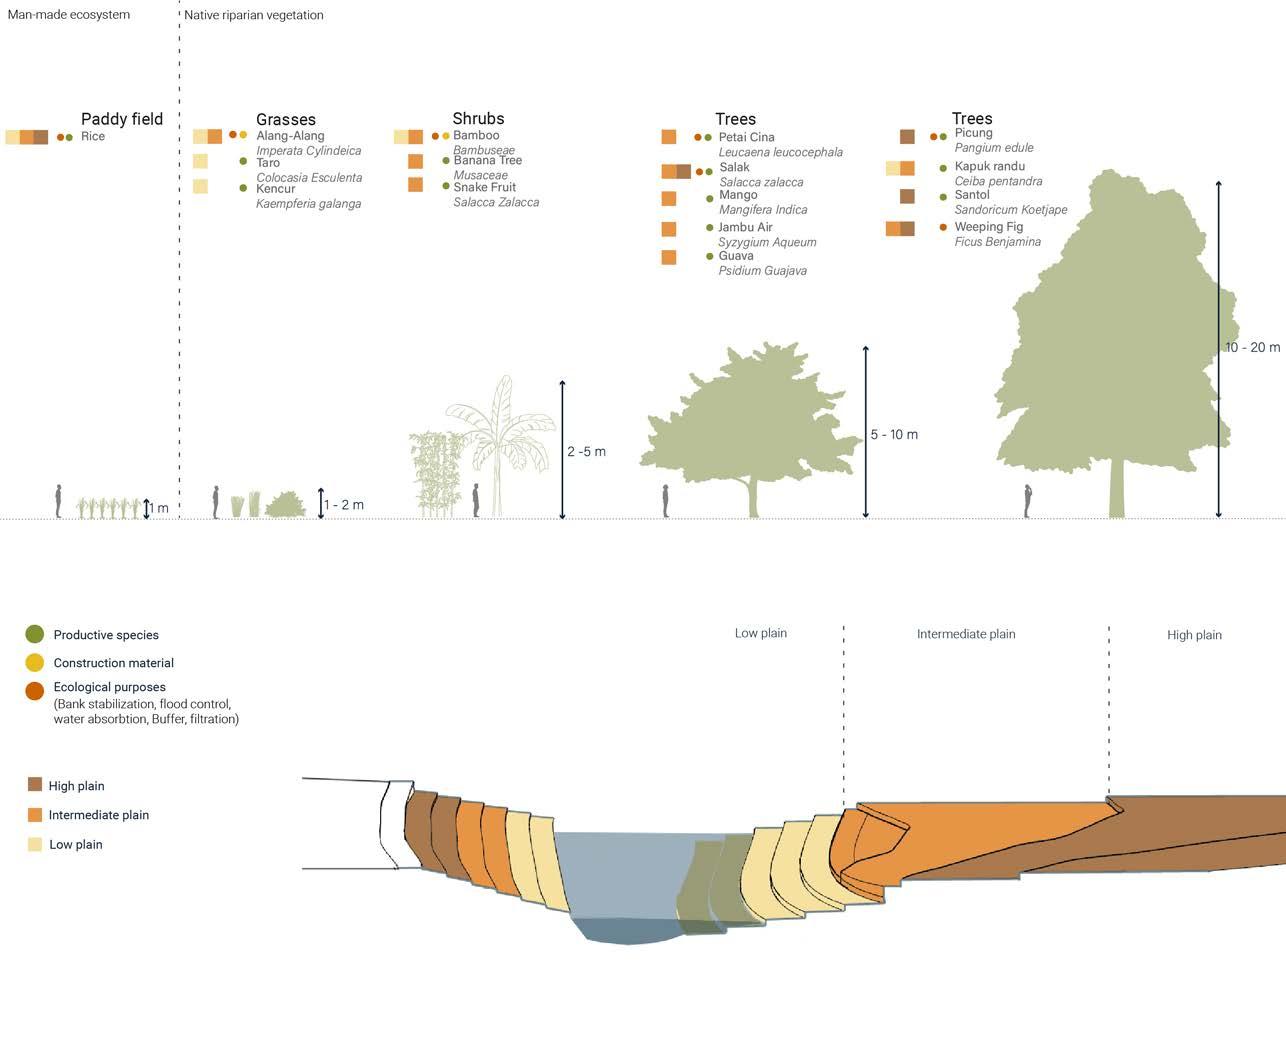
The intermediate plain has a combination of steep surfaces and large flat areas. The vegetation here includes trees, bamboos and small shrubs. Bamboos grown at the intermediate ridge prevent the floodplain’s erosion and serve as a bank stabilizers. (Suryantini,Permata,Angelia,2018)
Moreover, bamboos are also used by the locals as a construction material and for furniture making. As the intermediate plain is near the river, trees only cover half of the open ground area. However, this open ground can fill with water when the river overflows during the rainy season.
The lower part of the landscape is an area nearest to the river with a smaller surface area. It receives the most sunlight during the day. The vegetation in this area includes bamboos, small shrubs such as talas, katuk flood plain trees such as kapuk randu and wild ground cover as alang-alang, which acts as a buffer zone and helps in water filtration. During the rainy season, this area can be flooded with water and thus potentially become a wetland system.
Furthermore, paddy fields, a unique man-made ecosystem, can be located in any of the plains with larger flat areas. They are not only beneficial for food-production, but also help in maintaining several ecological functions like run-off drainage system regulation and groundwater recharging (Wu et al., 2001; Liu et al., 2004; Imaizumi et al., 2006; Tanaka et al., 2010).
68 RIVER talise 69
RIPARIAN VEGETATION
RESEARCH DEVELOPMENT URBAN SYTEM RESEARCH DEVELOPMENT URBAN SYTEM
fig 4.1.9 (right): Riparian vegetation
4.1.5
The objective of the greenway network is to encourage interconnectivity between different risk zones as well as to increase accessibility to the riverfront areas. A few incoming primary and secondary streets are identified on the site and are widened and translated into boulevards. These green corridors are designed to link dense urban areas to the terraced wetland ecosystem with multi-functional linear landscapes.
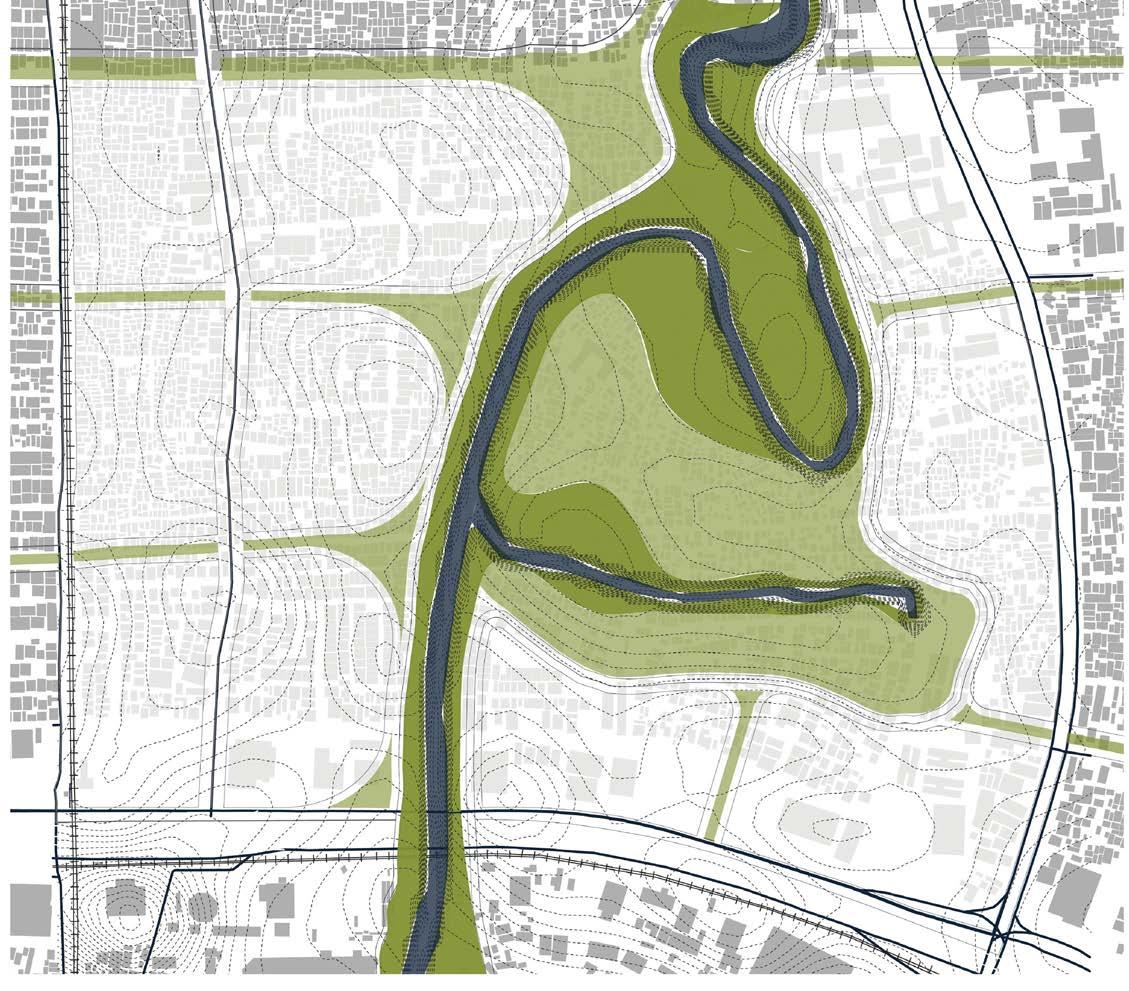
The greenway network also addresses vital issues related to flood management by increasing the water absorption area on the road with green vegetation patches and permeable pavements that allow the water to pass through the city’s sewage system.
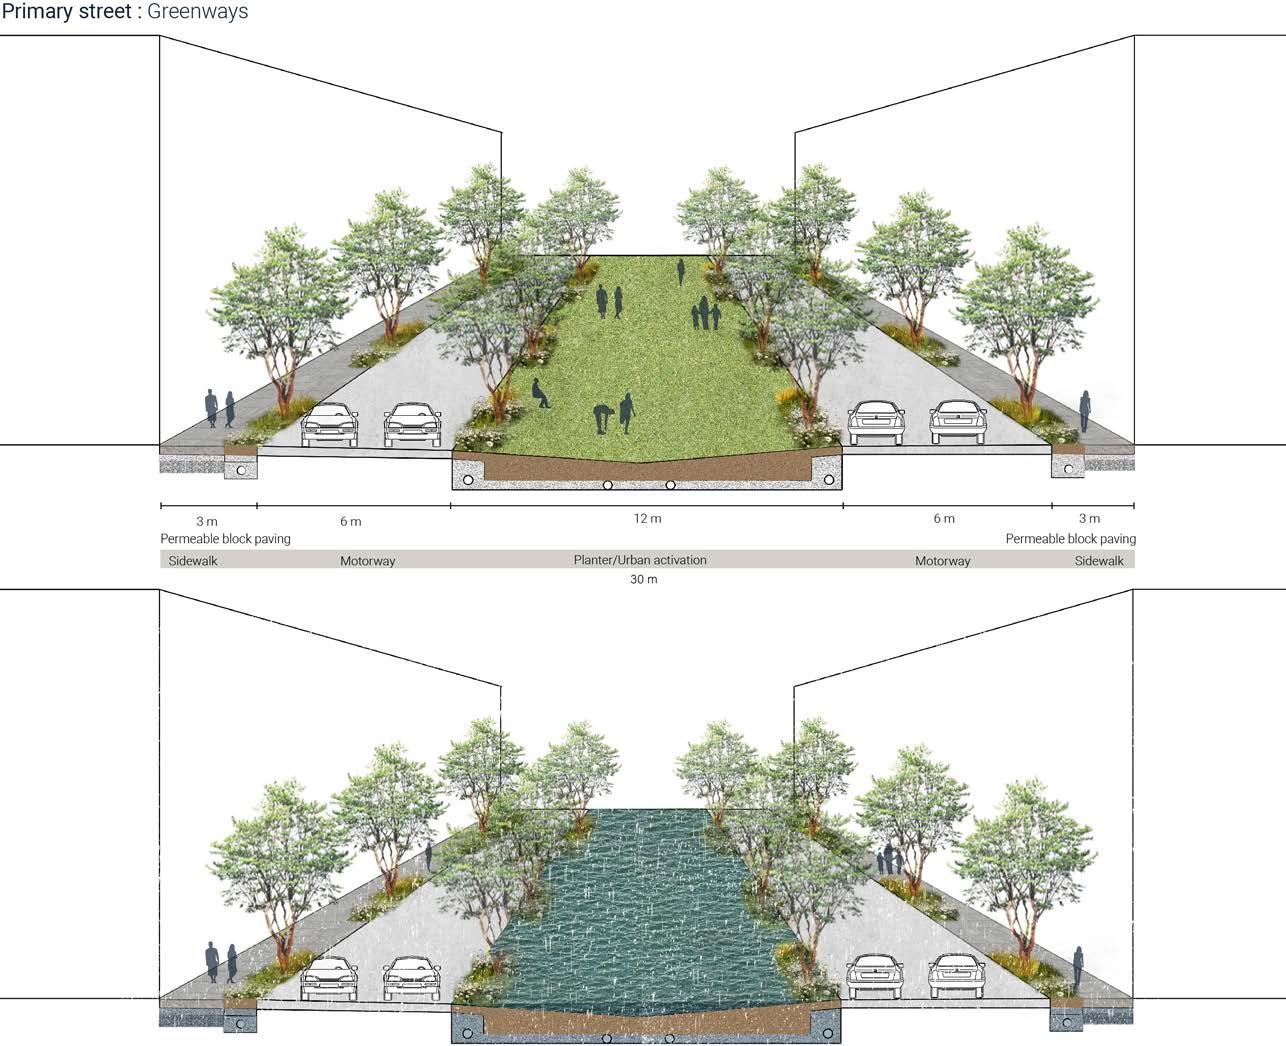
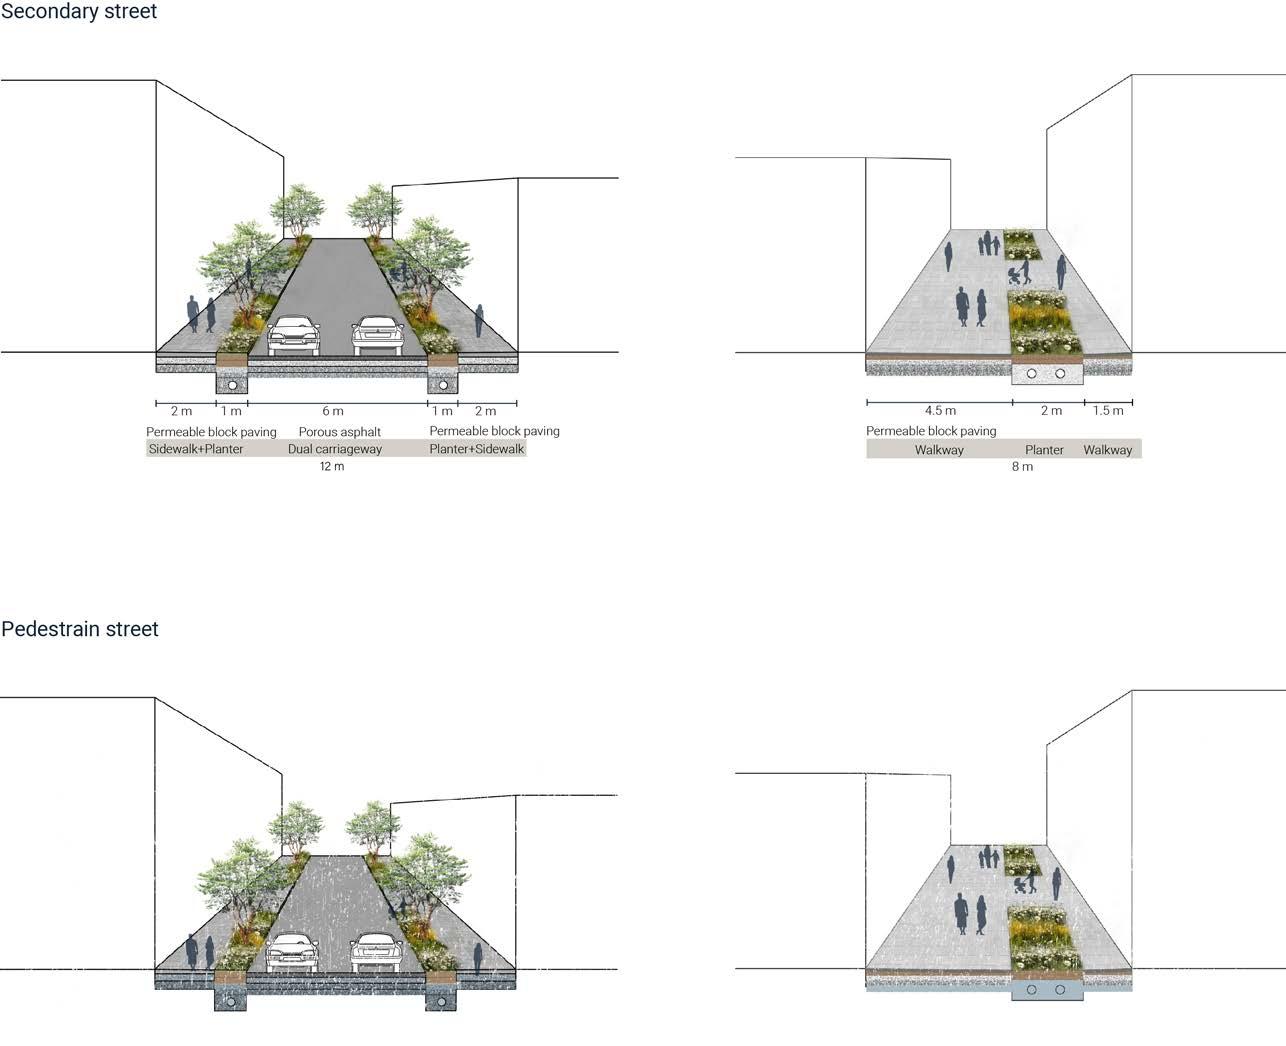
The primary streets are widened to incorporate a linear boulevard in the middle of the street section in addition to sidewalk landscaping. The linear landscapes in the middle can not only be used as space for public functions and recreational activities, but also form a part of the green stormwater infrastructure. These boulevards can be used for collecting and holding runoff and stormwater in vegetated systems before it is slowly releasedeither through infiltration or into the city’s sewage network- leading to an overall reduction in the additional pressure on the water infrastructure. The greenway strategies can also be applied to narrow secondary streets and pedestrian streets by incorporating sidewalk landscaping and permeable paving.
70 RIVER talise 71
GREENWAYS: INTERCONNECTIVITY BETWEEN ZONES
RESEARCH DEVELOPMENT URBAN SYTEM RESEARCH DEVELOPMENT URBAN SYTEM
fig 4.1.10 (right): Greenways (plan) fig 4.1.11 (pg72-73): Greenway strategies for primary, secondary and pedestrian streets
72 RIVER talise 73 RESEARCH DEVELOPMENT URBAN SYTEM RESEARCH DEVELOPMENT URBAN SYTEM
Pedestrian streets
4.1.6 ZONE C: LOW RISK: URBAN CLUSTERS
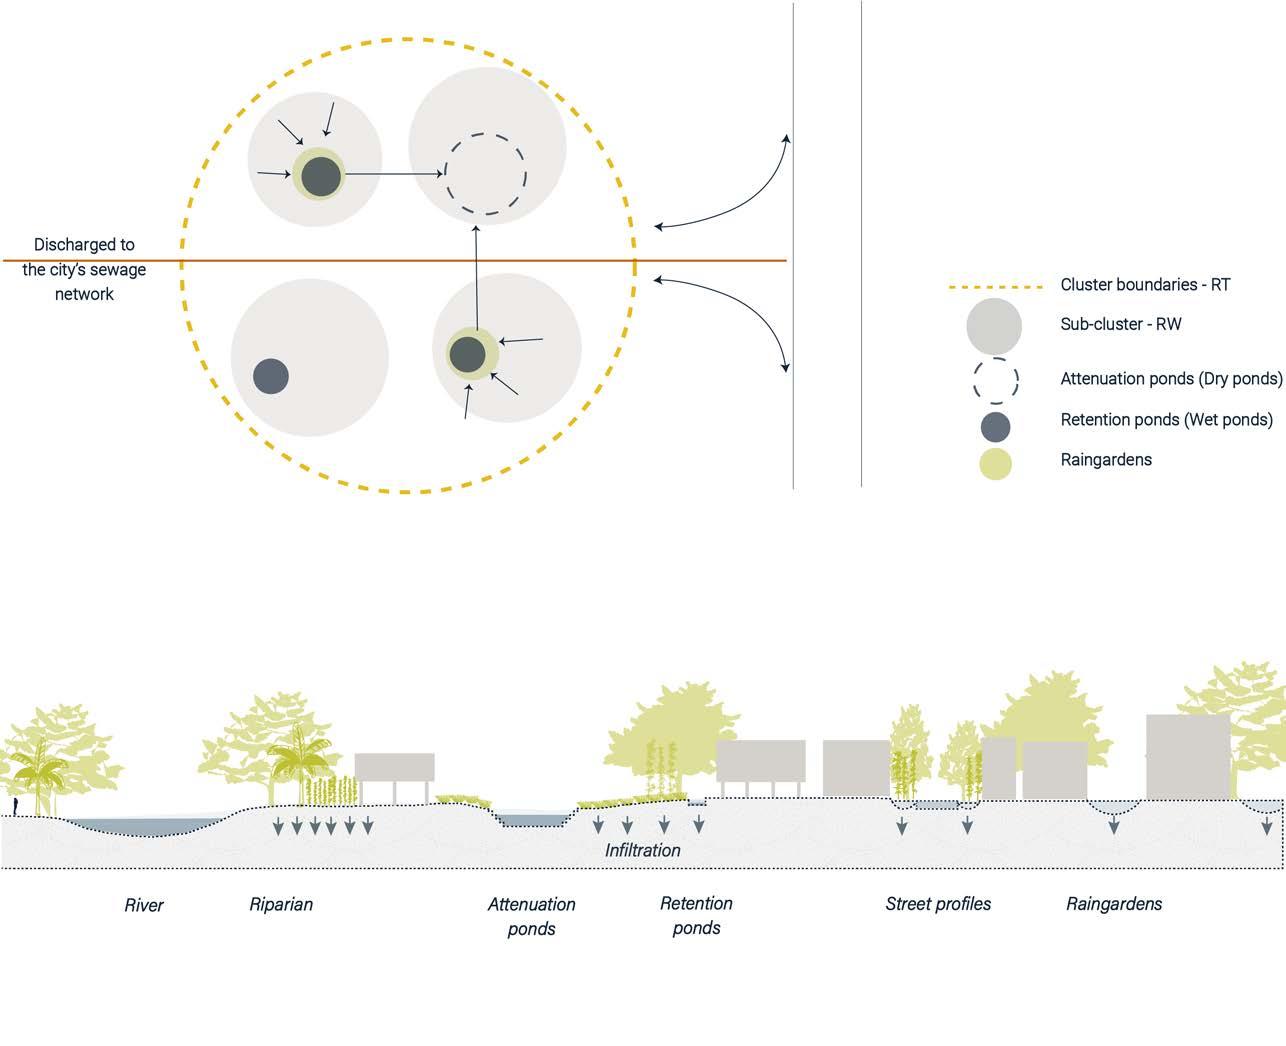
The rest of the site is less affected by fluvial flooding directly. However, as the whole area is located on the natural flood plain of Ciliwung River, any runoff naturally drains to the river. Dense build up and covering majority of the land with hard surfaces contributes to increased surface runoff during rainfall which leads to worsening of the flooding. It could also cause local pluvial flooding as there is simply nowhere for water to go. Therefore, the urban strategies for these areas are:
1. Encourage infiltration by densifying housing and restoring the land surface to more absorbent landscapes in appropriate locations.
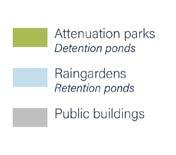
2. Attenuate water during extreme rainfall with detention ponds, which could be integrated with other public functions when not flooded.
3. Collect overflow of these attenuation ponds in retention ponds or rain gardens, which helps gardens to deal effectively with rainwater and also filter and clean the runoff.
Apart from the immediate benefit of making more space for water in the city, these strategies would also cause a reduction on the reliance of pumped water, and increased ground water replenishment, both of which further contributes to alleviating land subsidence.
74 RIVER talise 75
RESEARCH DEVELOPMENT URBAN SYTEM RESEARCH DEVELOPMENT URBAN SYTEM
fig 4.1.12 (right): Hydrological network strategy
4.1.7
A multi-objective optimization algorithm was designed to locate hydrological functions like attenuation facilities and retention ponds (or raingardens) within the low-risk zones of the site.
The set-up of the experiment considered the flood retention areas identified in risk zoning. Firstly, the hydrological node for the attenuation ponds was identified in the water accumulation areas. The possible locations were filtered by keeping the minimum distances between them between 150 to 200m, with the aim of creating completely walkable clusters.
Based on the location of the primary attenuation ponds, several secondary ponds were identified within these clusters which acted as retention ponds for rainwater collection, as well as to accommodate the overflow from primary attenuation facilities. To find the most suitable location in terms of natural drainage, as well as arriving at a more evenly spread-out network of ponds, the conditions below were followed:
1. within 50 to 75m from the primary ponds
2. beyond 50m away from the cluster boundaries
3. points of lowest elevation
4. at least 50m between each pond.
The ambition of ponds network is to increase surface area to maximise absorption of water through infiltration or to direct any excess water back to the city’s sewage network. Thus, in the second phase, the location of hydrological nodes is taken into consideration to generate a street and infrastructure network within these clusters while keeping in mind connectivity to the primary greenways and rest of the site. The hydrological network is thus formed parallel to the main street network and directs the excess water to the city’s existing sewage network.
Another ambition of the experiment is to locate the urban nodes for public functions like mosques and schools close to the hydrological nodes which are also the main open and green spaces.
76 RIVER talise 77
EXPERIMENT 1: HYDROLOGICAL NETWORK
RESEARCH DEVELOPMENT URBAN SYTEM RESEARCH DEVELOPMENT URBAN SYTEM
fig 4.1.13 (right): Hydrological network experiment set-up
FITNESS OBJECTIVES
The three fitness objectives of the genetic algorithm are as follows:
1. Minimize relative difference between the areas of the blocks
The axis of the street network generated will later act as a boundary condition for the generation of building plots. In order to generate evenly spread-out building plots, this fitness objective is to minimize the difference between the areas of the blocks.
2. Minimize elevation for secondary (raingardens) ponds
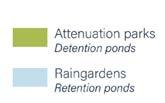
In order to further aid in surface water drainage, the algorithm attempts to minimize the elevation of secondary hydrological nodes.
3. Maximize the distance between street intersections
In order to generate a uniformly distributed street network, one of the fitness objectives was to examine the distance between the street intersections and to maximize it. The abstraction method is later further examined by syntactical analysis of the selected results from the genetic algorithm.
SELECTED SOLUTION
The experiment is carried out to generate 100 generations of 10 individuals per generation. A few fittest individuals are extracted from the simulation. Based on the diamond fitness graphs for the fittest individuals for each fitness criteria, it can be observed that although these individuals perform very well for one fitness objective, they are really unfit with respect to the other two fitness objectives. Hence, a few globally fittest individuals are extracted which address all the fitness objectives equally.
Additionally, a few other parameters are calculated for each solution, keeping in mind the objective of the objective of the experiment set-up. Parameters like total number of secondary ponds, total number of cells for secondary ponds and number of street sections are calculated to further evaluate the selected solutions. In addition to the extraction of the selected individuals, a post analysis was conducted on the generated street network. As the street network generated not only links various hydrological functions on the site but also form a basis of cluster formation on the urban fabric.
fig 4.1.14 (right): GA selected results
78 RIVER talise 79
RESEARCH DEVELOPMENT URBAN SYTEM RESEARCH DEVELOPMENT URBAN SYTEM
SYNTACTICAL ANALYSIS
One of the critical aspects of walkable communities was to ensure wellconnected motorways and non-vehicular streets to reduce travel distances and improve pedestrian and bicycle access. Thus, a syntactical analysis was carried out on the generated street network to measure their centrality closeness. Closeness centrality is defined as the total length of the average shortest path between a vertex and all other vertices in a network. Higher closeness centrality relates to a well-integrated street within the network.
The aim of this analysis was to choose a solution which not only has a better street centrality in comparison to other solutions, but also has better integration with primary greenways on the site and the rest of the site.
With regards to the closeness centrality and in order to evaluate the solutions better, a percentage was calculated for high, mid and low centrality streets in each solution. High centrality streets will be used more frequently and thus have better centrality in the network in comparison to mid and low frequency streets.
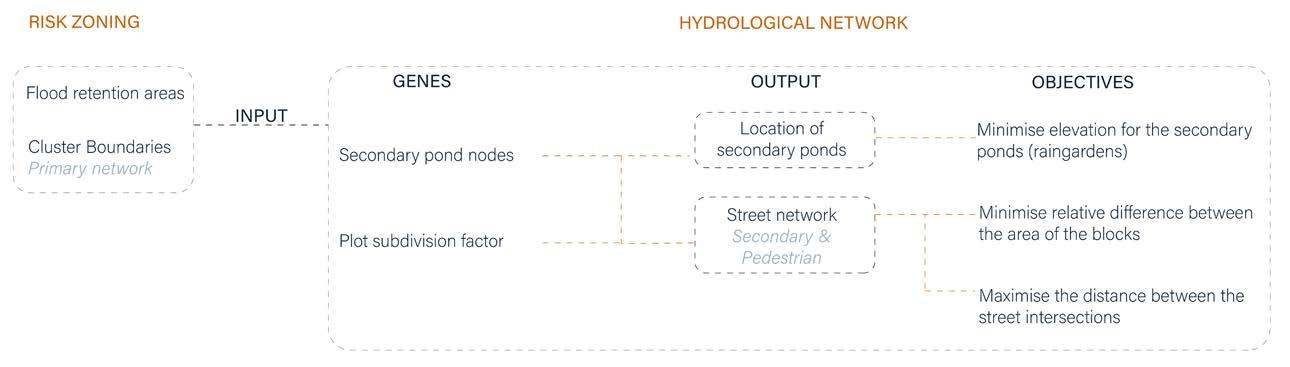
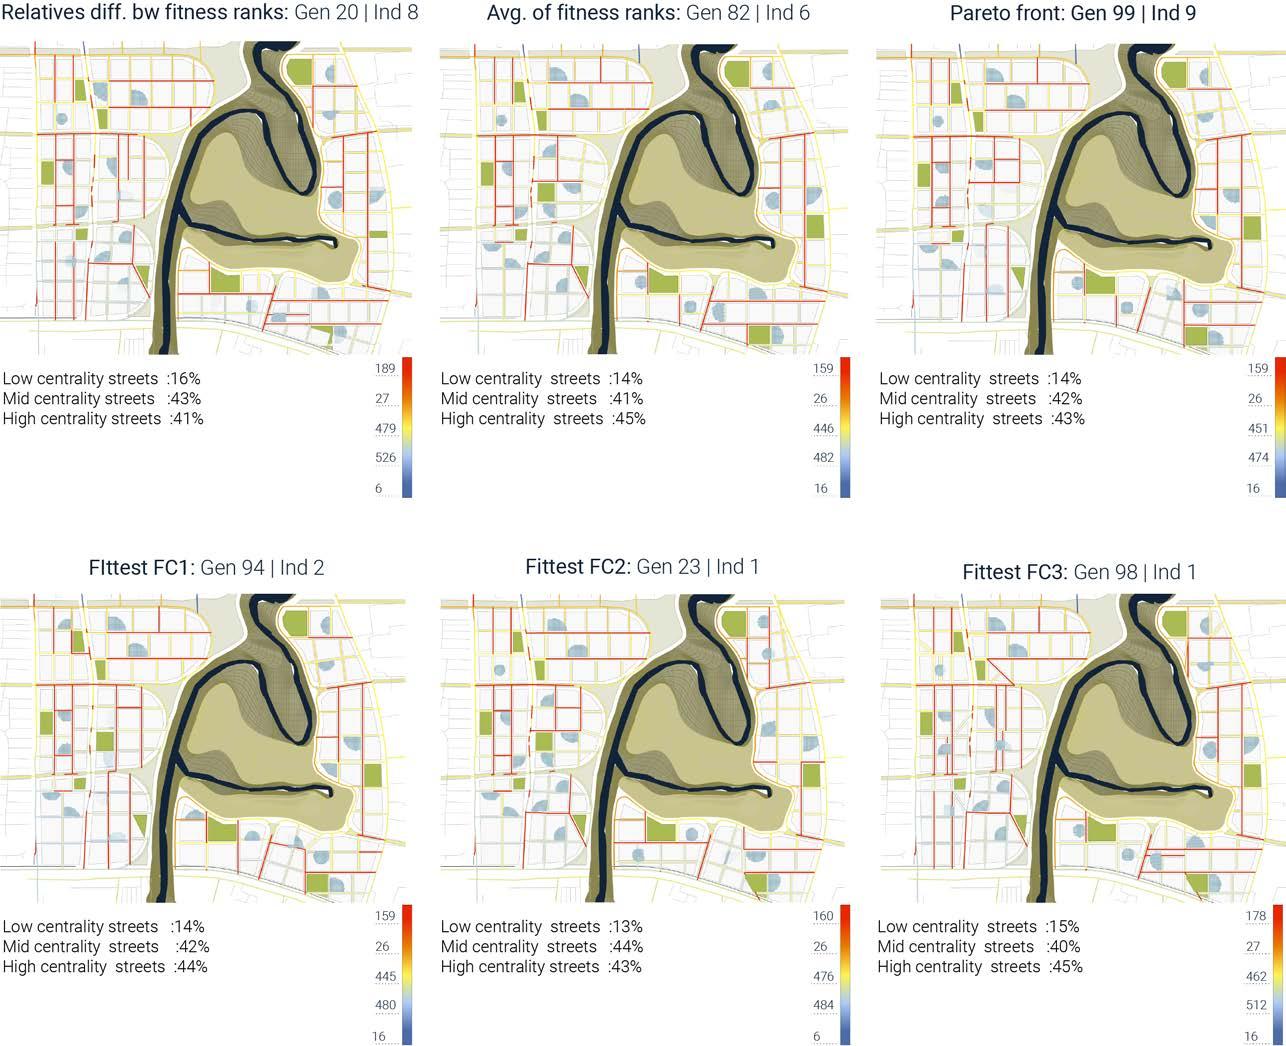
fig 4.1.15 (top): Gene chart
fig 4.1.16 (right): Syntactical analysis
The solution that was selected has the maximum percentage value for high centrality streets and a minimum percentage for low centrality streets. Another consideration, while selecting a solution, was the location of public buildings, ponds and green open spaces close to a street that is better integrated within the network.
80 RIVER talise 81
RESEARCH DEVELOPMENT URBAN SYTEM RESEARCH DEVELOPMENT URBAN SYTEM 0 1 o. of streets 0 1 No. of streets 0 1 No. of streets 0 1 No. of streets 0 No. of streets 0 No. of streets
CONCLUSION
One of the critical aspects of walkable communities was to ensure wellconnected motorways and non-vehicular streets to reduce travel distances and improve pedestrian and bicycle access. Thus, a syntactical analysis was carried out on the generated street network to measure their centrality closeness. Closeness centrality is defined as the total length of the average shortest path between a vertex and all other vertices in a network. Higher closeness centrality relates to a well-integrated street within the network.
The aim of this analysis was to choose a solution which not only has a better street centrality in comparison to other solutions, but also has better integration with primary greenways on the site and the rest of the site.
With regards to the closeness centrality and in order to evaluate the solutions better, a percentage was calculated for high, mid and low centrality streets in each solution. High centrality streets will be used more frequently and thus have better centrality in the network in comparison to mid and low frequency streets.
The solution that was selected has the maximum percentage value for high centrality streets and a minimum percentage for low centrality streets. Another consideration, while selecting a solution, was the location of public buildings, ponds and green open spaces close to a street that is better integrated within the network.
82 RIVER talise 83
RESEARCH DEVELOPMENT URBAN SYTEM RESEARCH DEVELOPMENT URBAN SYTEM
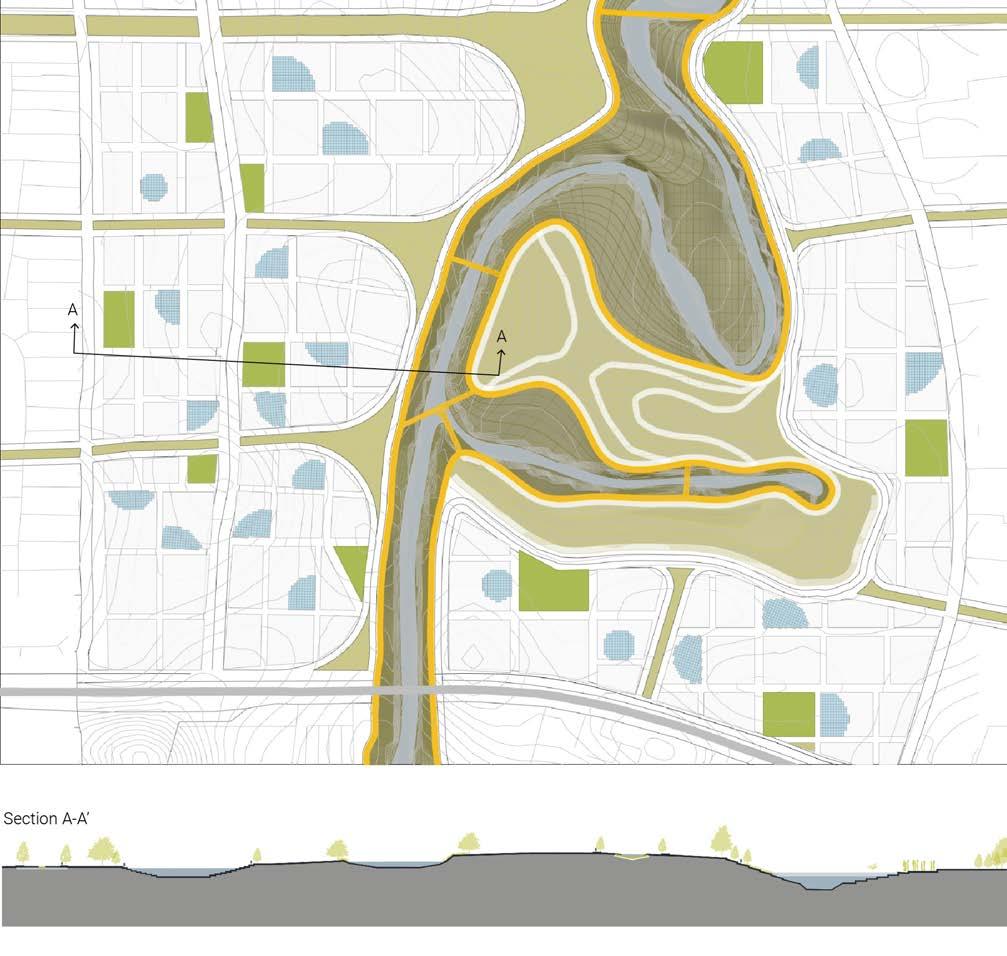
fig 4.1.17 (right): Selected solution
ARCHITECTURAL SYSTEM
4.2 SPATIAL AGGREGATION: HOUSING UNITS
4.2.1 PROGRAMMATIC ADJACENCIES IN MALAY HOUSE
4.2.2 HOUSING UNIT TYPES
4.2.3 RULES FOR SPATIAL AGGREGATION
4.2.4 SPATIAL AGGREGATION
At an architectural scale, the goal is to develop an architectural system framework suitable for the local social and environmental context, with the possibility of adapting its morphology when deployed in locations of different urban flood strategies.
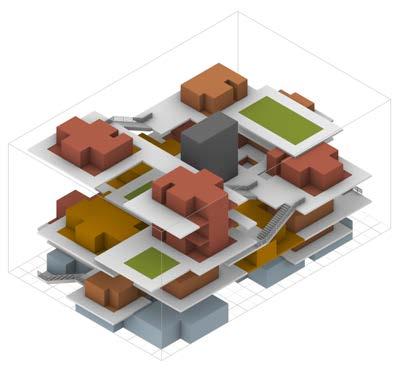
The overall building system was approached with a bottom-up strategy. Firstly, spatial relationships of single dwellings from both local vernacular precedents and existing typologies were extracted in the bottom-up approach to develop specific housing unit typologies that would be situated in this framework. Then, the housing aggregation was performed at the building scale where an open building framework was developed, based on the principles extracted from the vernacular longhouse typology with the aim of reinterpreting it while making provisions for the modern community and households.
The last phase of experiments in this section is aimed at exploring different building morphologies, density type and their distribution in relation to the different urban flood strategies distributed on the site.
4.2.5 INTEGRATION ANALYSIS
4.3 HOUSING AGGREGATION: BUILDING SCALE
4.3.1 LONGHOUSE
4.3.2 3D COMMUNAL NETWORK
4.3.3 RULES FOR HOUSING AGGREGATION
4.3.4 BUILDING TYPOLOGY: URBAN AND RIPARIAN
4.3.5 BUILDING DENSITY AND DISTRIBUTION
LOW DENSITY, RIPARIAN BLOCK TYPE
MID DENSITY, RIPARIAN BLOCK TYPE
MID DENSITY, URBAN BLOCK TYPE
HIGH DENSITY, URBAN BLOCK TYPE
84 RIVER talise 85 DOMAIN CONTEXT DOMAIN CONTEXT
4.2.1 PROGRAMMATIC ADJACENCIES IN MALAY HOUSE
As outlined in the domain studies, there is local architectural knowledge that could be abstracted into a contemporary residential form, to improve the existing slum settlement along the riverside in Jakarta in both social and environmental context.
The plan layout of a Malay house is comprised of two fundamental spaces, the front and the back spaces. The front spaces are public/semi-public functional spaces, and the back spaces are private. Malay houses consist of two distinctive functional areas, the rumah ibu and rumah dapur. The rumah ibu acts as a focal point of the house while rumah dapur acts as a private section for the female inhabitants of the house. The rumah ibu is considered the core area (central node) with its floor level being the highest. Both functional areas and spaces in the Malay house are in an open plan layout, which facilitates the optimal combination of space and functions (GhaffarianHoseini et al. 2014).
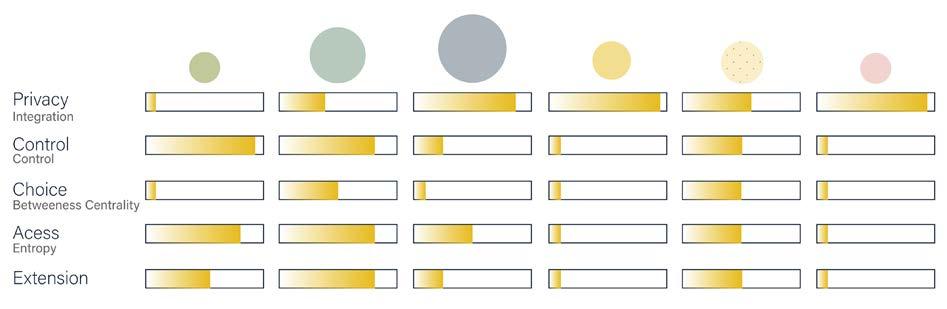
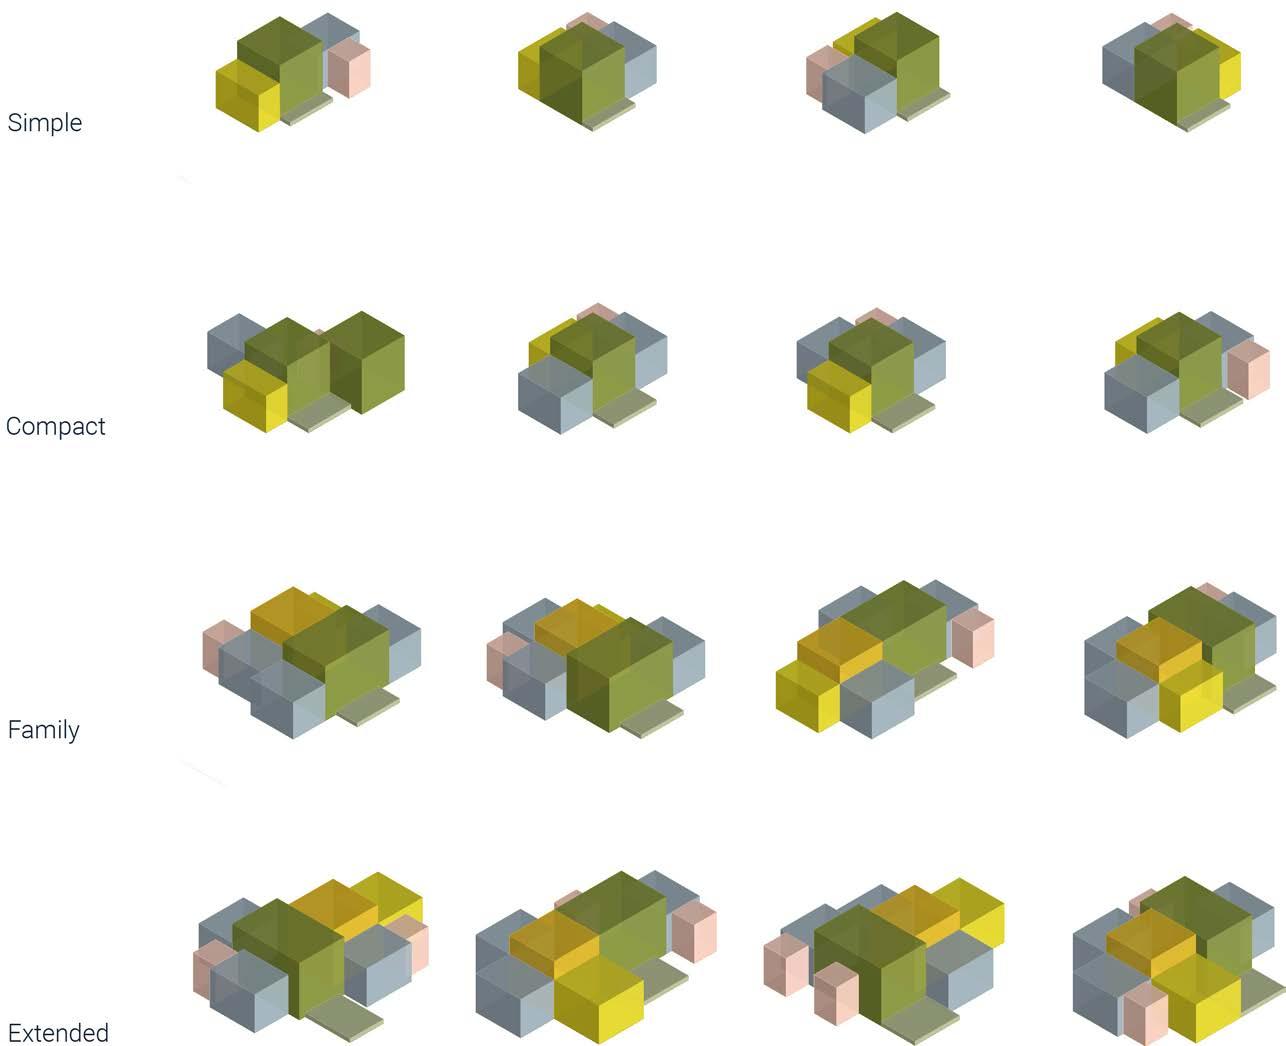
4.2.2 HOUSING UNIT TYPES
Four types of housing units have been identified: Compact, Simple, Family and Extended, based on the household distribution of Jakarta. The distribution of each type in a building block has been adjusted to suit trends in household distribution, which saw a decline in the number of large households and an increase in small families and single person dwellings. For each housing unit type, the spaces were derived with a grid of 0.9m x 0.9m, considering the spatial and programmatic requirements of local lifestyle.
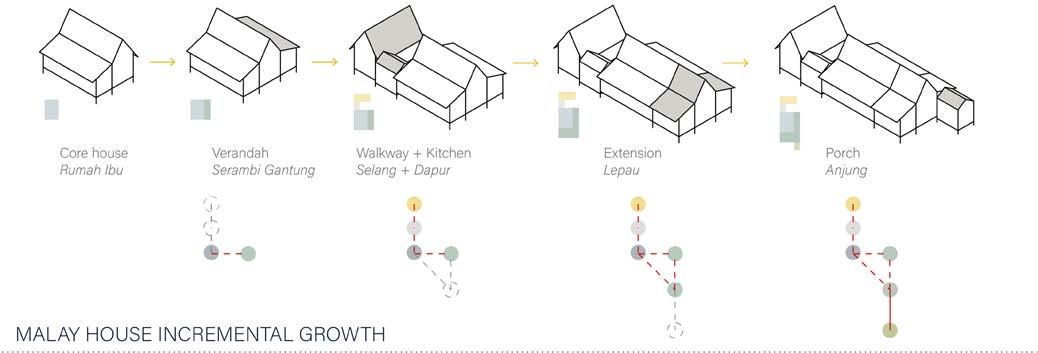
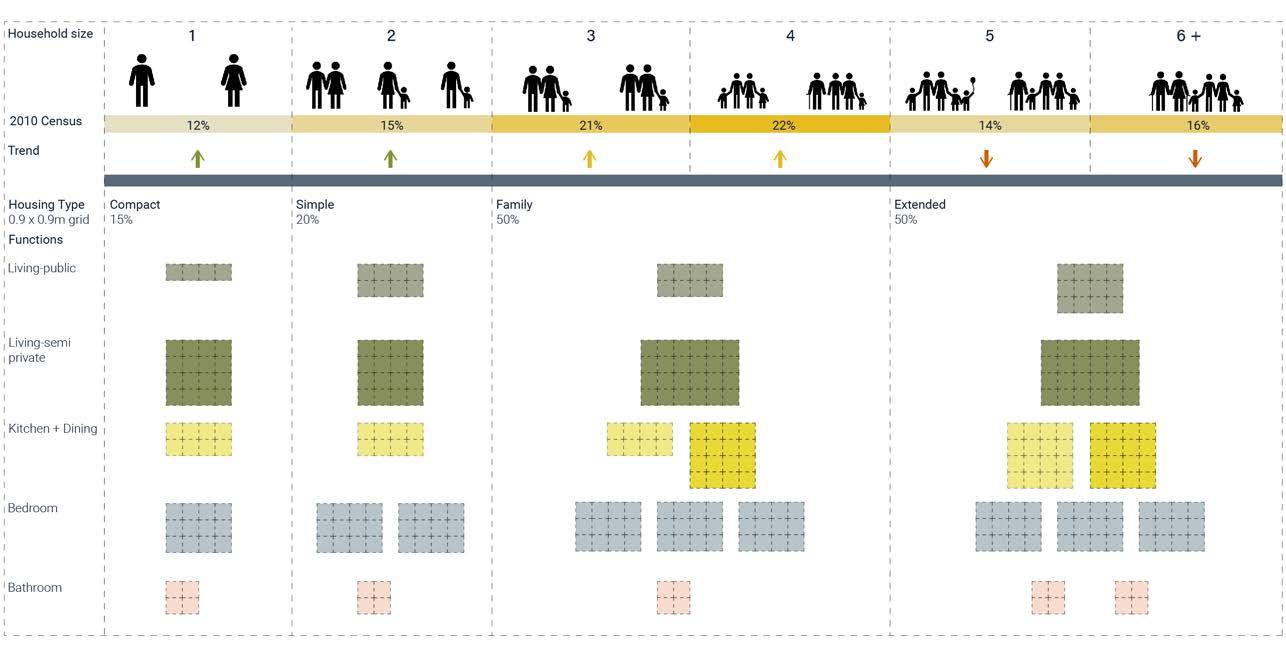
fig 4.2.1(left):Malay house incremental growth
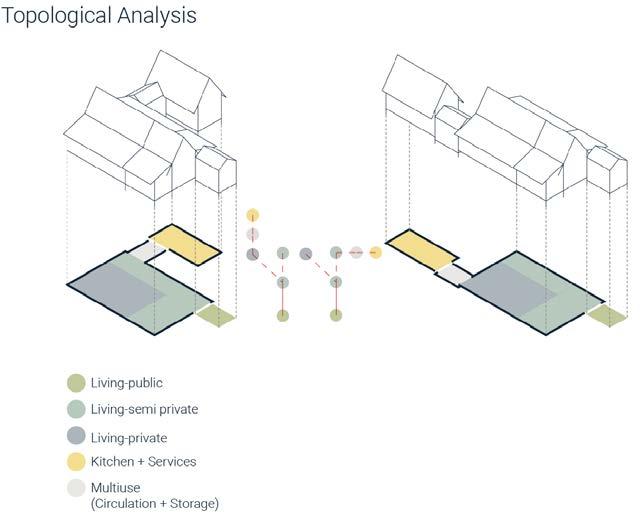
fig 4.2.2(right-top): Malay house topological analysis
(right-bottom): Household types
86 RIVER talise 87 RESEARCH DEVELOPMENT ARCHITECTURAL SYSTEM
RESEARCH DEVELOPMENT ARCHITECTURAL SYSTEM
4.2.3
The primary strategy of the aggregation of the spaces or zones within a housing unit is abstracted from the spatial logic of the Malay house based on rules of adjacency, sequential aggregation and compactness.
1. ADJACENCY
Based on the topological relationships observed in the Malay house and existing kampung practices, a set of parameters like privacy and access were calculated between different spaces within a housing unit and their relationships with neighboring zones.
2. INCREMENTAL AGGREGATION
The algorithm follows defined constraints of each zone to generate desired size and range of spatial units within the housing units. The aggregation starts from identifying a location for a primary function (living area) as a central node of the housing units. This is followed by aggregation of secondary functions (warung, kitchen, bedroom) with direct access to the central node and then aggregation of tertiary functions (bathroom, dining area) with no direct access to the primary function.
3. COMPACTNESS
The algorithm gives preference to orient zones along the longest side to enable generation of compact housing units and to allow more natural light into the units.
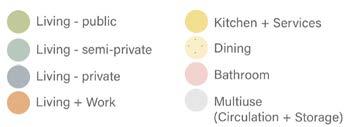
fig 4.2.3(left):Malay housespatial rules and parameters
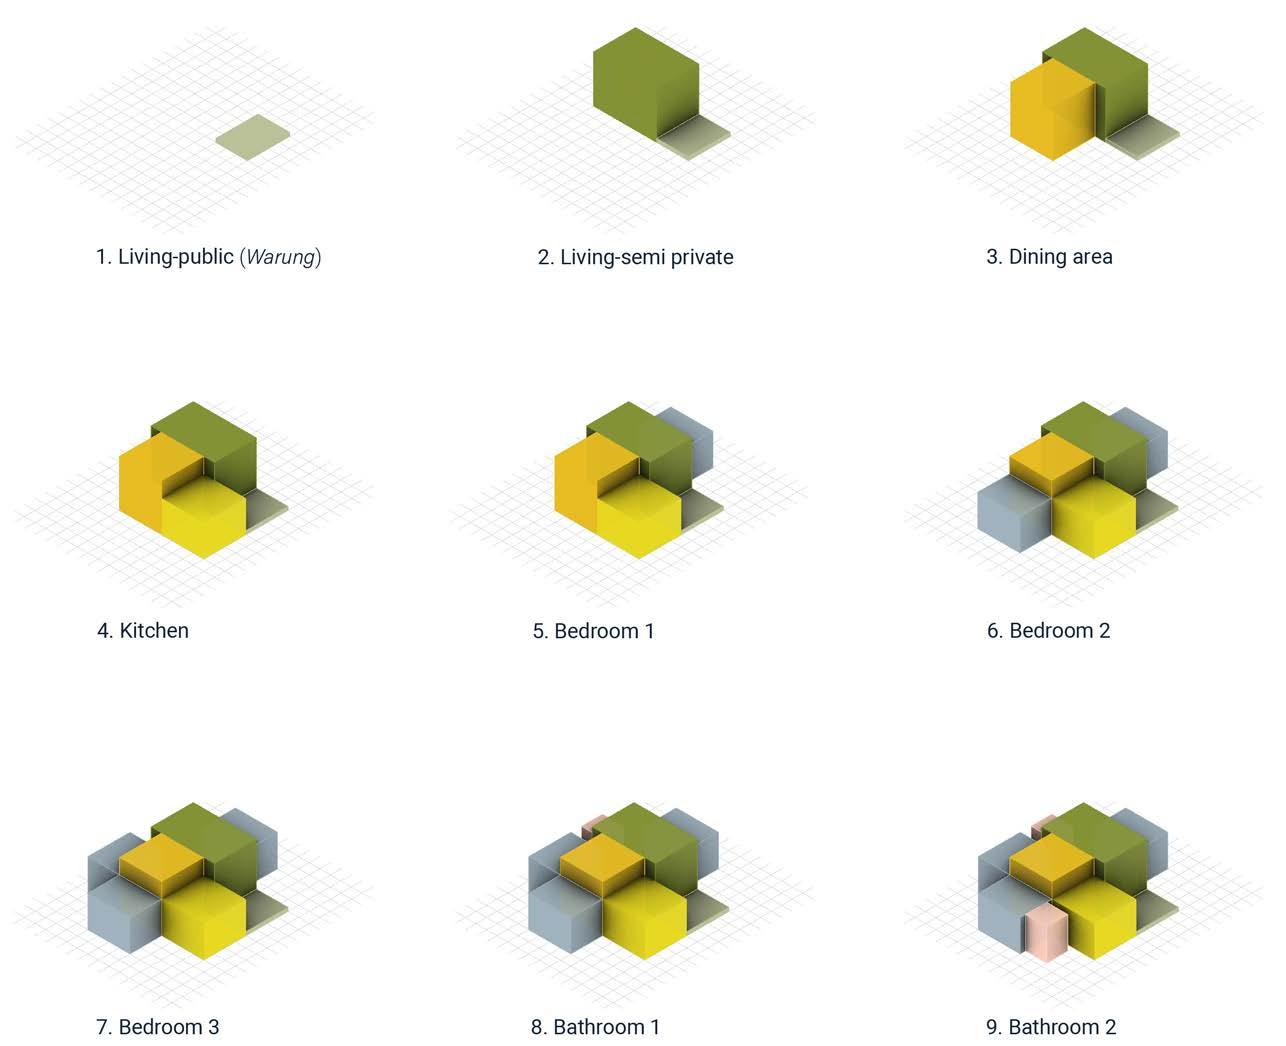
fig 4.2.4(right): Incremental aggregation
88 RIVER talise 89
RULES FOR SPATIAL AGGREGATION
RESEARCH DEVELOPMENT ARCHITECTURAL SYSTEM RESEARCH DEVELOPMENT ARCHITECTURAL SYSTEM
4.2.4 HOUSING AGGREGATION
Based on the rules defined for programmatic distribution within each housing unit, multiple aggregations are generated for each housing typology. The height of different zones generated within each housing type follows the spatial logic abstracted from vernacular studies, wherein the primary functions like living zones are higher in comparison to the secondary and tertiary functions.
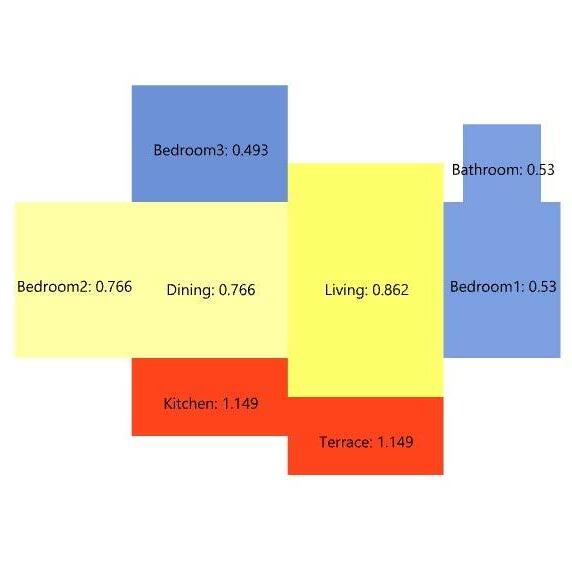
4.2.5 INTEGRATION ANALYSIS
In order to evaluate the integration of different spaces aggregated using the principles abstracted from the vernacular, a space syntax analysis is conducted on all generated aggregations for each housing type. The aim of the study is to choose a housing unit for each housing typology which can be further aggregated on a building scale.
Integration value for individual spaces is calculated in relation to other zones in the housing unit. A higher integration value represents a space which is well integrated and more accessible within aggregation while a lower integration value represents a space which is less accessible and hence segregated from other zones.
Thus, a housing unit is selected for each typology wherein the public and semi-public zones of the housing unit have a higher integration value while the private zones like bedrooms have a lower integration value.
fig 4.2.5(right): Spatial aggregation for household types
fig 4.2.6 (pg 92): Integration analysis of hosuing units
fig 4.2.7 (pg 93): Selected solutions
90 RIVER talise 91
RESEARCH DEVELOPMENT ARCHITECTURAL SYSTEM RESEARCH DEVELOPMENT ARCHITECTURAL SYSTEM
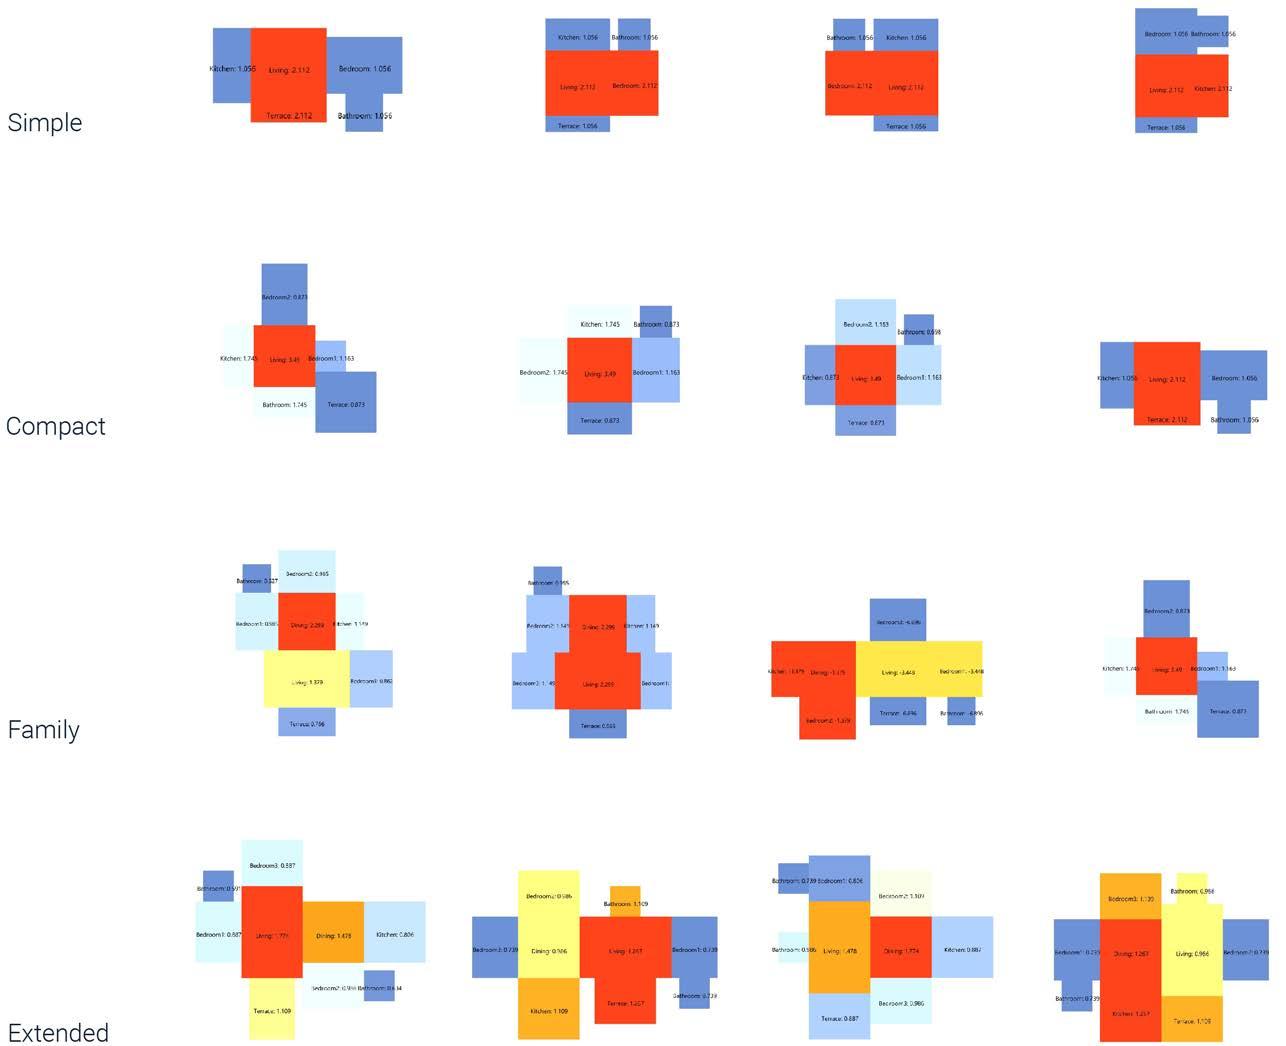
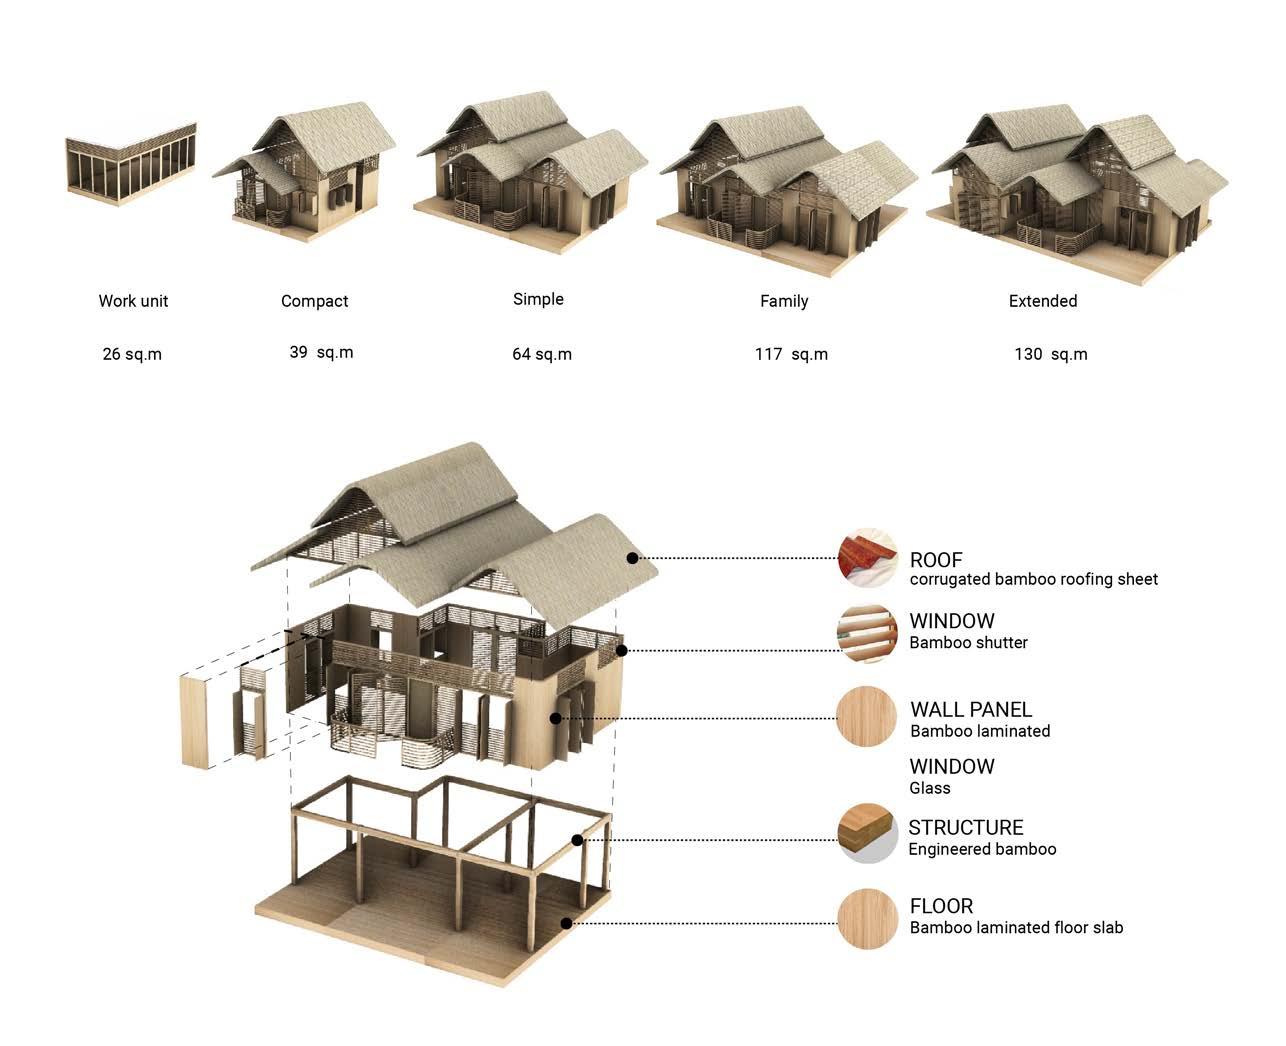
92 RIVER talise 93 RESEARCH DEVELOPMENT ARCHITECTURAL SYSTEM RESEARCH DEVELOPMENT ARCHITECTURAL SYSTEM
As outlined in the domain chapters, the longhouse is a form of communal dwelling sometimes referred to as “village under one roof,” which comprises of linearly arranged apartments that are interconnected. The apartments are all connected to communal gallery spaces. (Winzeler 2004) While each of the apartments are privately occupied by each household, the gallery is shared by all dwellers to carry out daily chores, socialize, rest and welcome guests. (Patterson and Chiswick,1981) The lifestyle reflected by the spatial organization puts an emphasis on communal spaces which is quite different to rental apartments. This inspired deriving the building phenotype with the aim of evolving the vernacular longhouse typology to suit the needs of modern households.
Informality of spatial arrangement plays an important part in shaping the local community. Majority of the social encounters occur spontaneously and unplanned, and a large proportion of these interactions take place in informal public spaces such as Nongkrong area (informal meeting places) and Warung (small street food stand, street shops, kiosks). In the existing urban fabric, these are scattered along the neighbourhood streets, rather than at one designated location.
To translate these social spaces, references were taken from the vernacular longhouse typology. In the longhouse, the ratio of private and communal spaces is 1:1. The communal spaces are used as social spaces, places to work and relax. Considering that the tendency to use informal spaces as places to work is much less in the contemporary and future context, this ratio is reduced to 2:1. For each building, 50% of area required for housing units are added as communal spaces.
Instead of recreating the longhouse typology in multiple storeys by specifying the location of the communal spaces, the communal spaces are aggregated after the distribution of housing units within the building system in a way where each house has access to these shared spaces. Part of these shared spaces also forms a network of circulatory pathways within the building system. This emerging network of communal spaces, joined by vertical circulation via stairs, forms the 3D street network within each building.
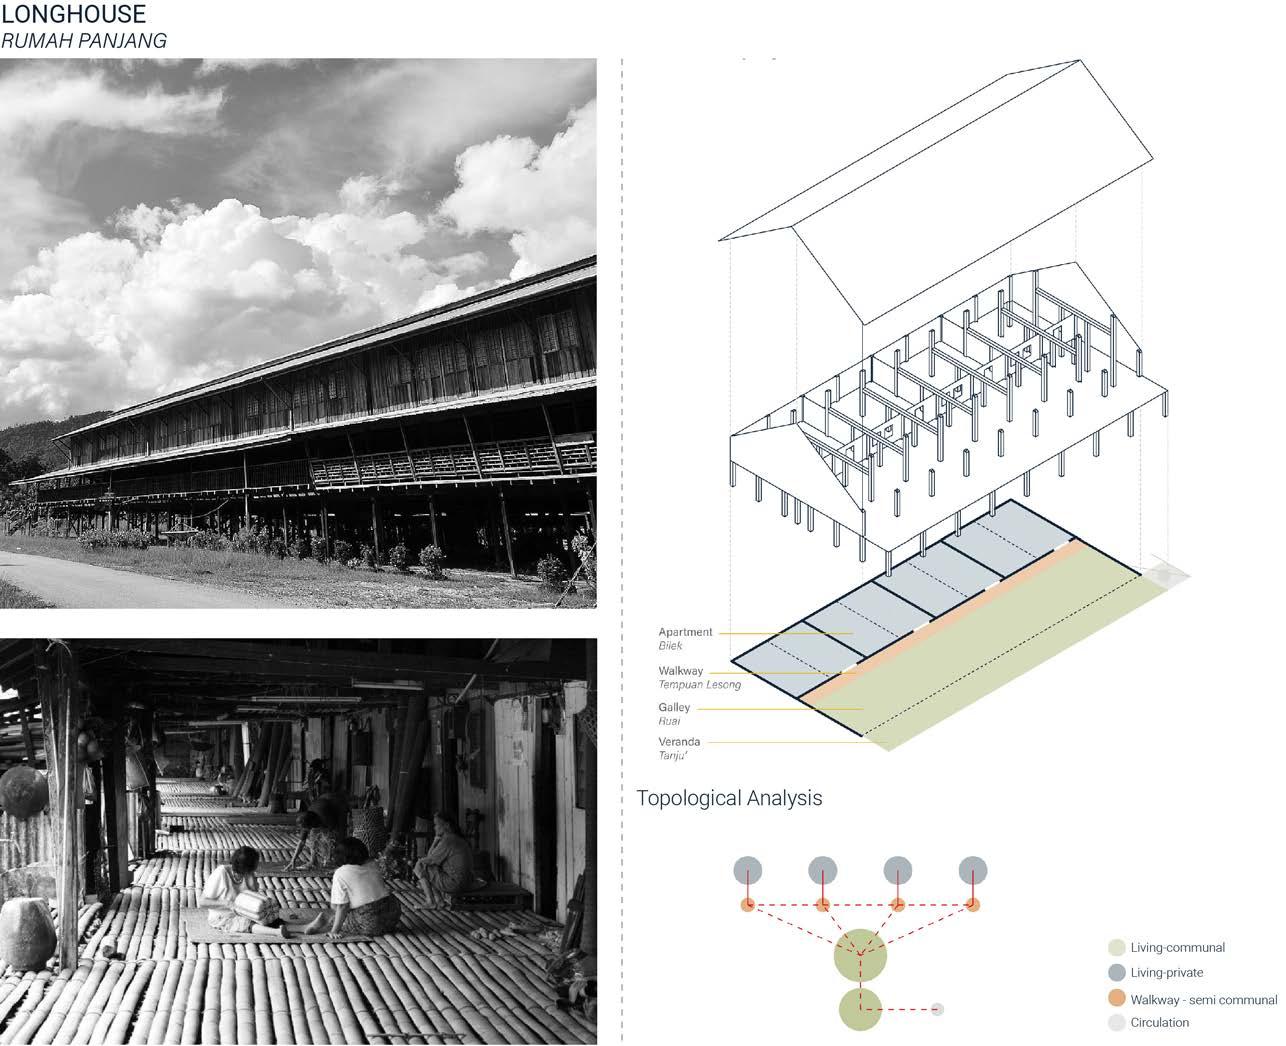
94 RIVER talise 95
4.3.2 3D COMMUNAL NETWORK
4.3.1 LONGHOUSE
RESEARCH DEVELOPMENT ARCHITECTURAL SYSTEM RESEARCH DEVELOPMENT ARCHITECTURAL SYSTEM
fig 4.2.8(right): Longhouse topological analysis
The ambition for the building system is to develop a framework that combines the planned provision of infrastructure with flexibility in spatial organisation. The building system is abstracted into five distinctive elements or modules: core, housing units (one of each typology), work units, circulatory grids, green spaces. The distribution of housing units within each building has been simulated with an algorithm written using Wasp, a set of components, developed in Python for Grasshopper.
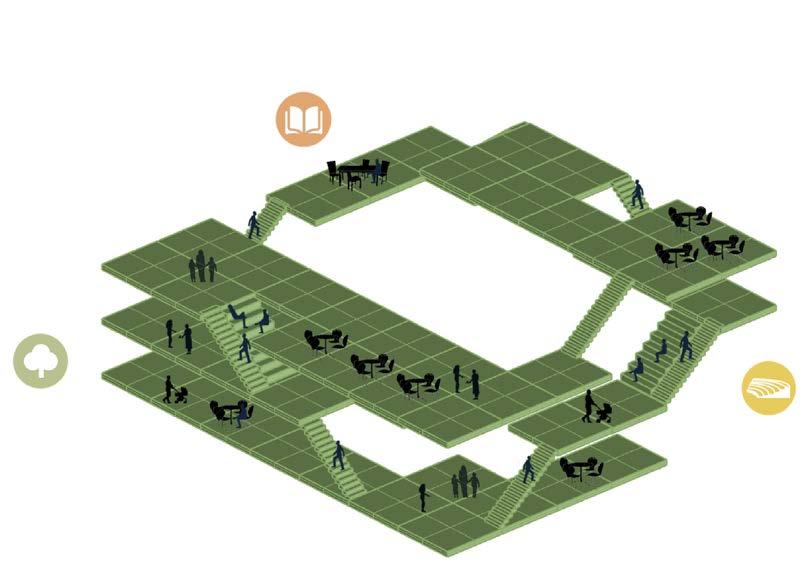
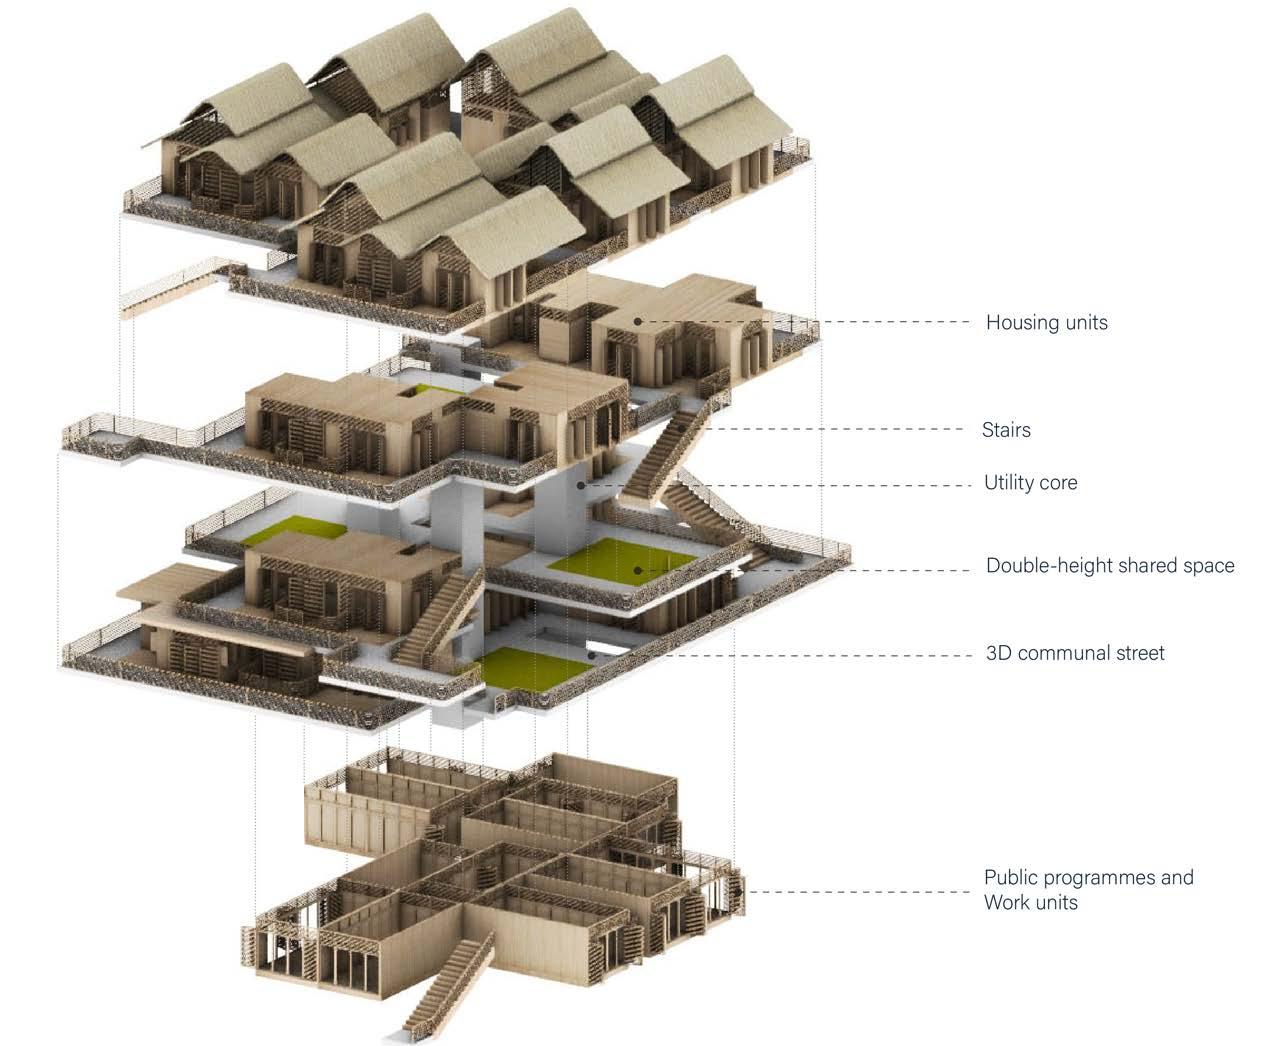
The process of housing aggregation relies on a set of rules, allowing the generation of specific structures from the combination of different modules. For each individual part or module included in the aggregation process, basic information like the part geometry, connection location and orientation are assigned. The set of connections defines the topological graph of the part, which is used to define the possibilities of aggregation with other parts or modules.
Thus, the algorithm for housing aggregation comprises of strategies for the selection of basic aggregation rules, described as an instruction to orient one module over a selected connection of another module.
96 RIVER talise 97
4.3.3 RULES FOR HOSUING AGGREGATION
RESEARCH DEVELOPMENT ARCHITECTURAL SYSTEM RESEARCH DEVELOPMENT ARCHITECTURAL SYSTEM
fig 4.2.9(left): 3D communal network fig 4.2.10(right): Building system
4.3.3 RULES FOR HOSUING AGGREGATION
The aggregation of the housing units within the building volume starts with a defined 3-dimensional building envelope, with several shared utility cores distributed within the building volume. The number of utility cores is determined by floor area, and the location of core is varied for each iteration of the aggregation experiment.
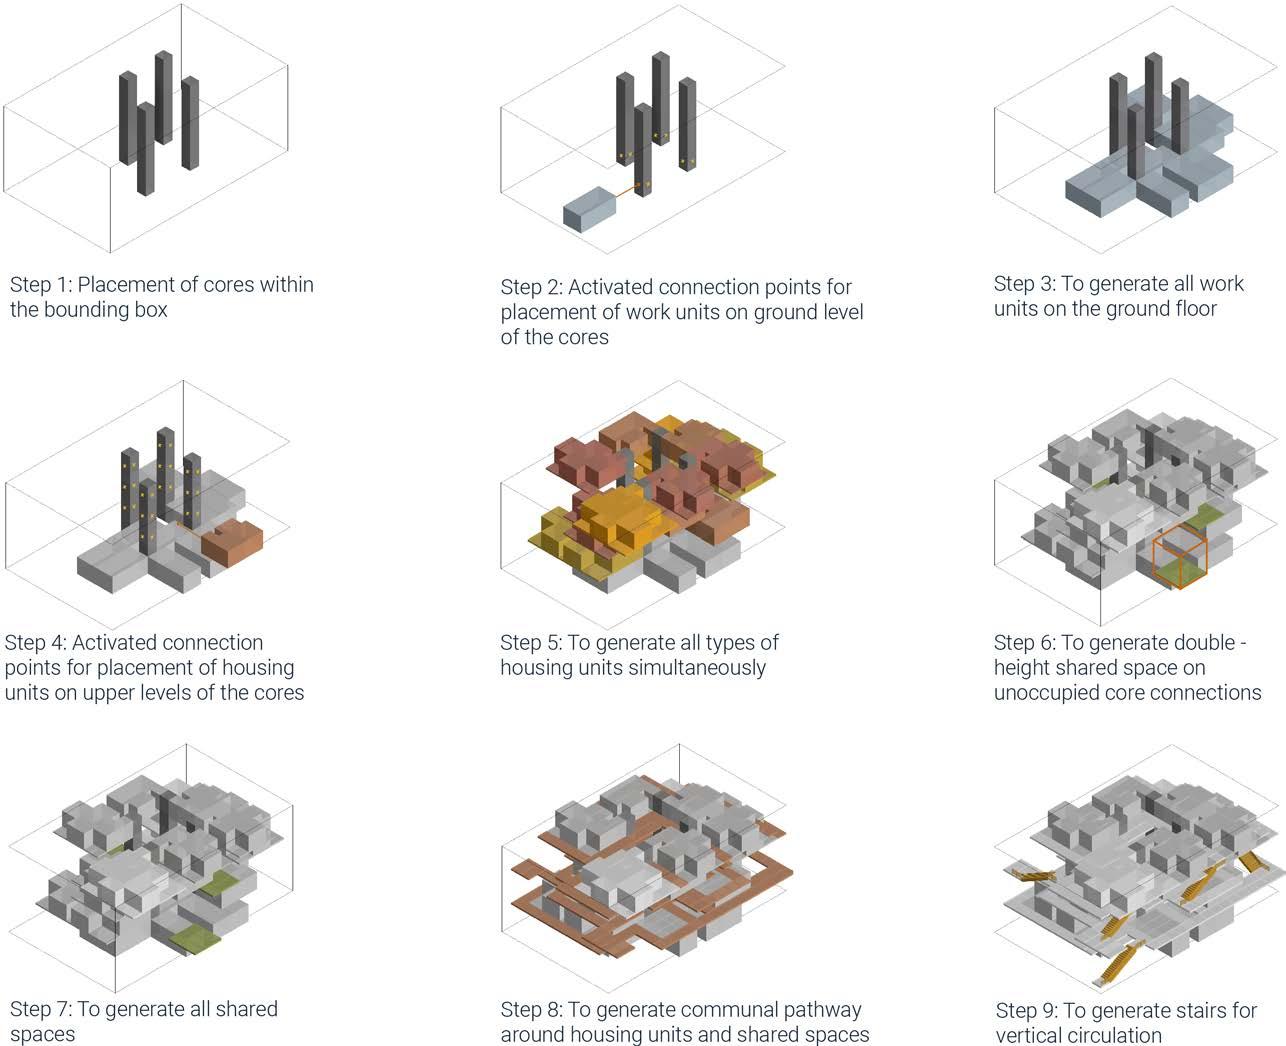
1. The aggregation starts with aggregation of the utility cores on predefined locations. The connection points on utility cores are unoccupied.
2. Starting from the ground floor, the algorithm aggregates work units and spaces for public programmes on the ground floor. The aggregation of work units and public spaces are restricted to the ground floor of the building blocks considering increased accessibility to these spaces.
3.This is followed by aggregation of living units on other floors. Housing units of each typology are aggregated within a certain ratio, while taking into account the housing trends and demography.
4.The algorithm then aggregates green shared spaces on unoccupied core connections.
5.The last phase of the algorithm is to generate a communal network for social spaces and circulation with respect to the location of work and housing units. This communal network is then joined by vertical circulation via stairs, to form the 3D street network.
98 RIVER talise 99
RESEARCH DEVELOPMENT ARCHITECTURAL SYSTEM RESEARCH DEVELOPMENT ARCHITECTURAL SYSTEM
fig 4.2.11(right): Rules for housing aggregation
4.3.4 BUILDING TYPOLOGIES
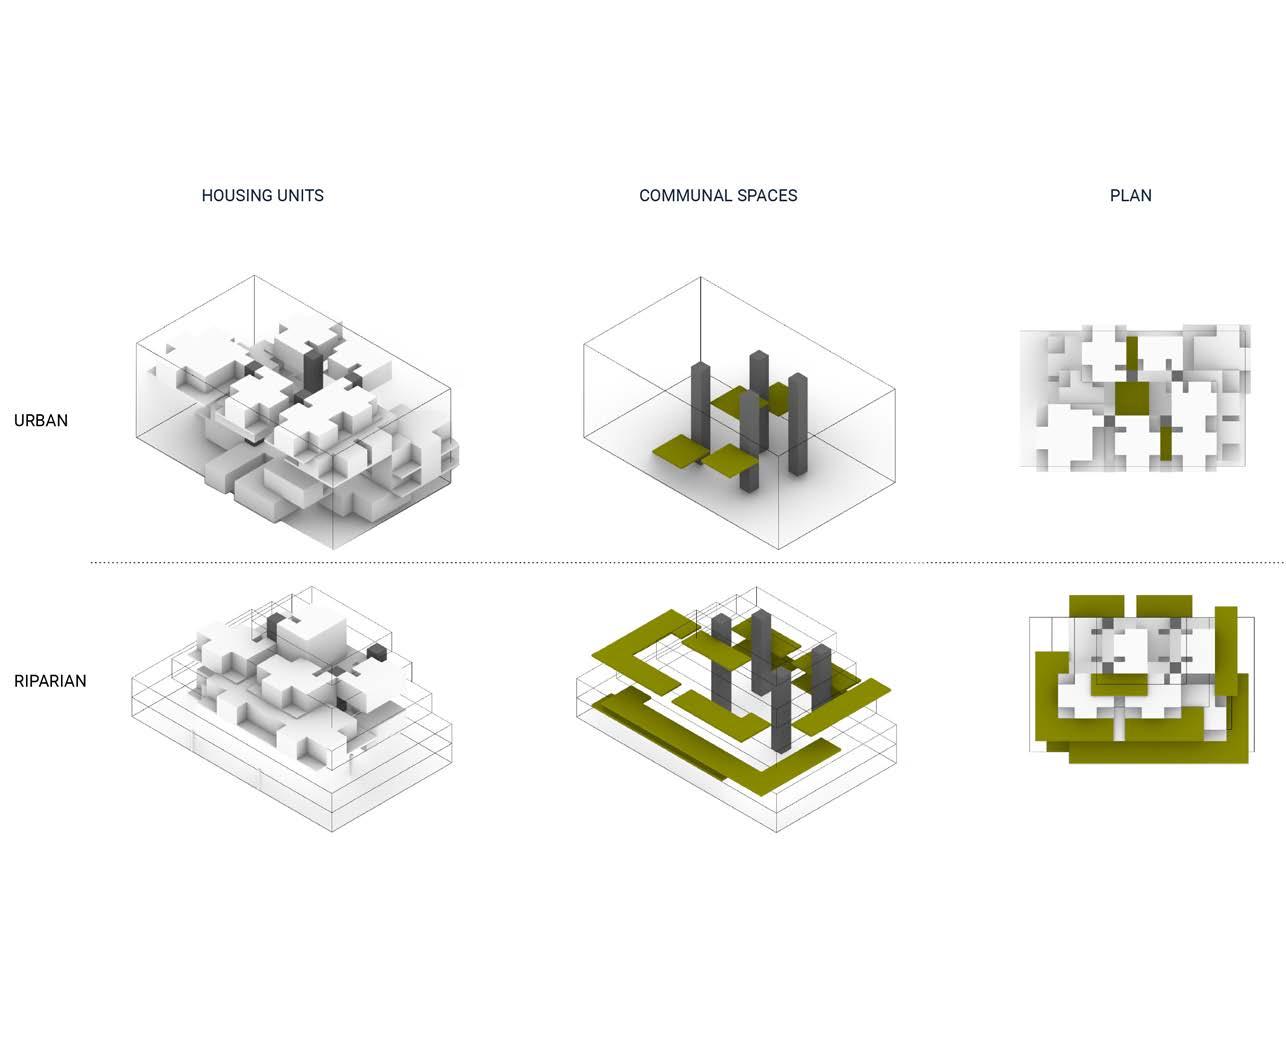
Two distinctive typologies were introduced to adapt to the different environmental conditions in the riparian and urban areas.
URBAN TYPOLOGY
In urban typology, the different family units are elevated onto the upper floor. In addition to work units, spaces for public programmes and workshops are introduced on the ground level. As the urban typologies are situated in the low flood risk zones, it is more desirable for residences. Thus, urban typologies are designed to be of larger plot sizes with a higher density of housing. At the same time, an increased distribution of voids and green spaces is taken into consideration within urban typologies, to generate a porous building envelope to encourage ventilation.
RIPARIAN TYPOLOGY
Similar to urban typology, the different housing units are elevated onto the upper floor. As the riparian typologies are located in medium risk zones, making these relatively less desirable for residences, a small number of housing units are aggregated within these blocks resulting in lower overall block height and smaller plot sizes. Also, the generation of public programmes and work units is restricted to urban typologies.
Considering the higher flood risk factor, riparian typologies are elevated on piers. In addition to the less dense housing within the riparian typologies, the building is of terraced morphology. The distribution of green open spaces within the building block is generated in the form of terraces oriented along the river edge.
100 RIVER talise 101
RESEARCH DEVELOPMENT ARCHITECTURAL SYSTEM RESEARCH DEVELOPMENT ARCHITECTURAL SYSTEM
fig 4.2.12(right): Urban typology vs. Riparian typology
4.3.5 BUILDING DENSITY AND DISTRIBUTION
Four block types are created with two varied sizes in each type for three risk zones. For each block type a selection pool of three building blocks is generated by varying utility core positions. Overall, 24 different building blocks are generated according to the initial placement of the utility core. These can be categorised into 8 groups based on the plot sizes as shown in the table on the right. All the aggregations generated indicate clear spatial organisation, which is reflected in the set-up of the aggregation algorithm.
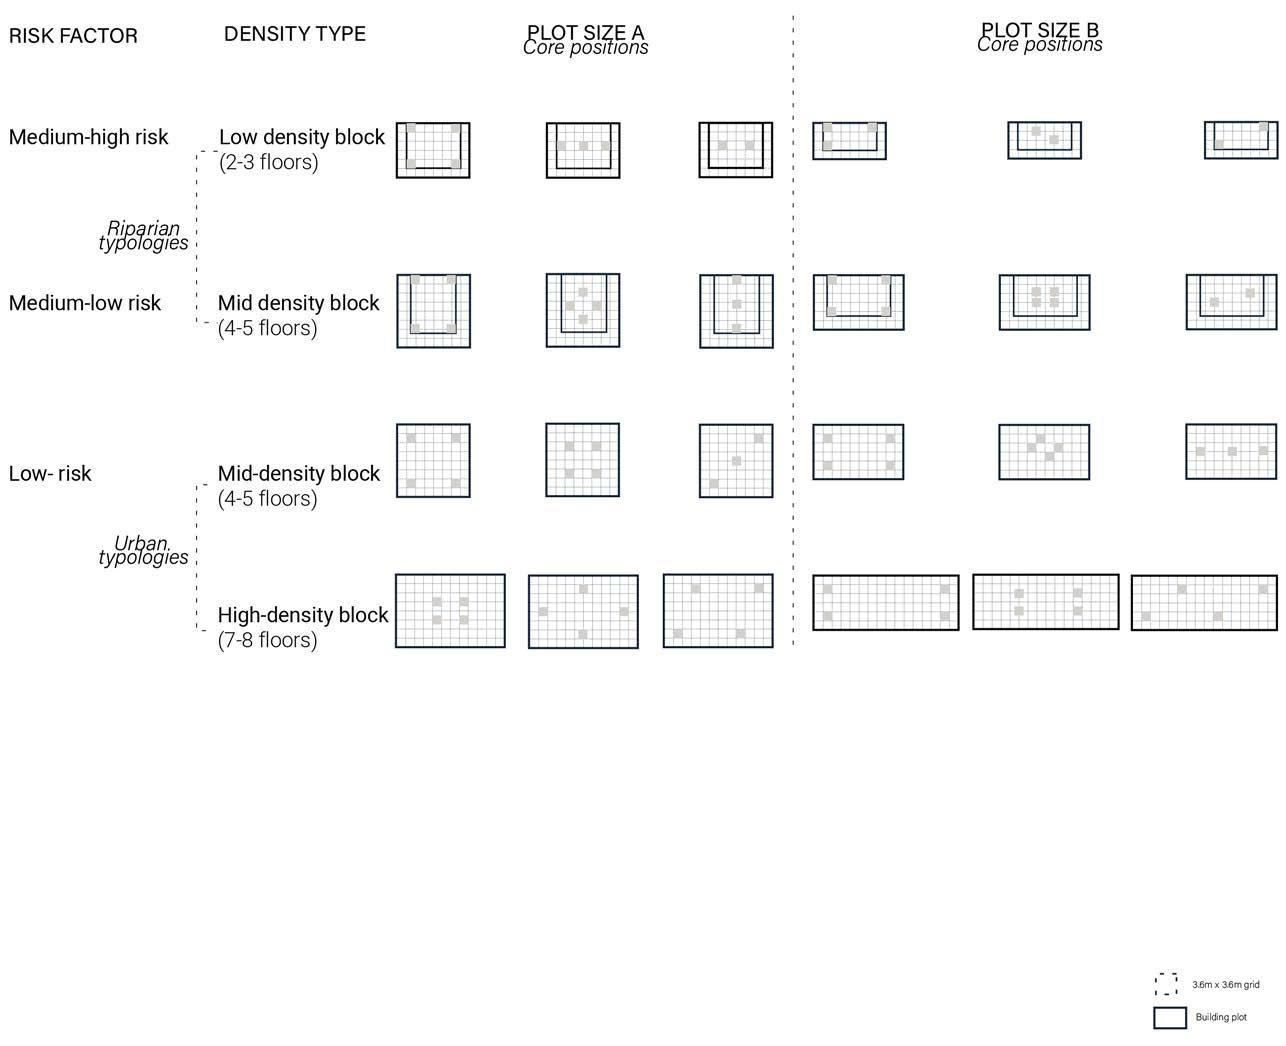
With regards to the connection to the urban scale flood strategies, the initial locations of the core provide for diverse types of building morphologies, building density, and voids within the building system with attributes for the urban fabric.
Even though the aggregation logic has a degree of flexibility to create building blocks, the use of adjacencies and connection points as a rule set created patterns which highlights relationship between placement of utility core and generated building morphology. The resultant building morphologies are studied in detail in relation to the placement of the utility core closer to periphery, more inwards and clustered towards the centre of the building block and linearly arranged core along the length of the building block.
102 RIVER talise 103 RESEARCH DEVELOPMENT ARCHITECTURAL SYSTEM RESEARCH DEVELOPMENT ARCHITECTURAL SYSTEM
fig 4.2.13(right): Building plot size, density and core positions
BLOCK TYPE: LOW DENSITY, RIPARIAN

Low density block types are created for zone B, responding to medium to high flood risk. Considering the substantial risk factor and its adjacency to the river, these units are elevated on piers. The building block height ranges from 2 to 3 floors. Taking into account the less favorable conditions of the zone due to the significant risk factor, the block is created on a smaller plot to accommodate fewer housing units.
Due to the smaller plot size and a smaller number of floors, the housing aggregations generated are very closely packed resulting in aggregation with less or no void area. However, there are ample open spaces along the periphery of the buildings in the form of terraces. Furthermore, the number of housing units generated is also fewer and that is reflected in the floor area space (FAR), which ranges from 1.25 to 2.14.
fig 4.2.14(right): Low density, riparian building blocks (all)
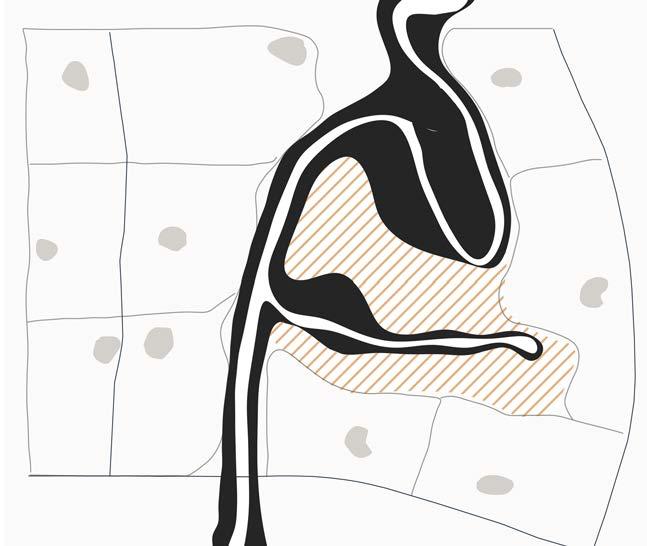
fig 4.2.15(106-111): Detailed aggregation for individual building block
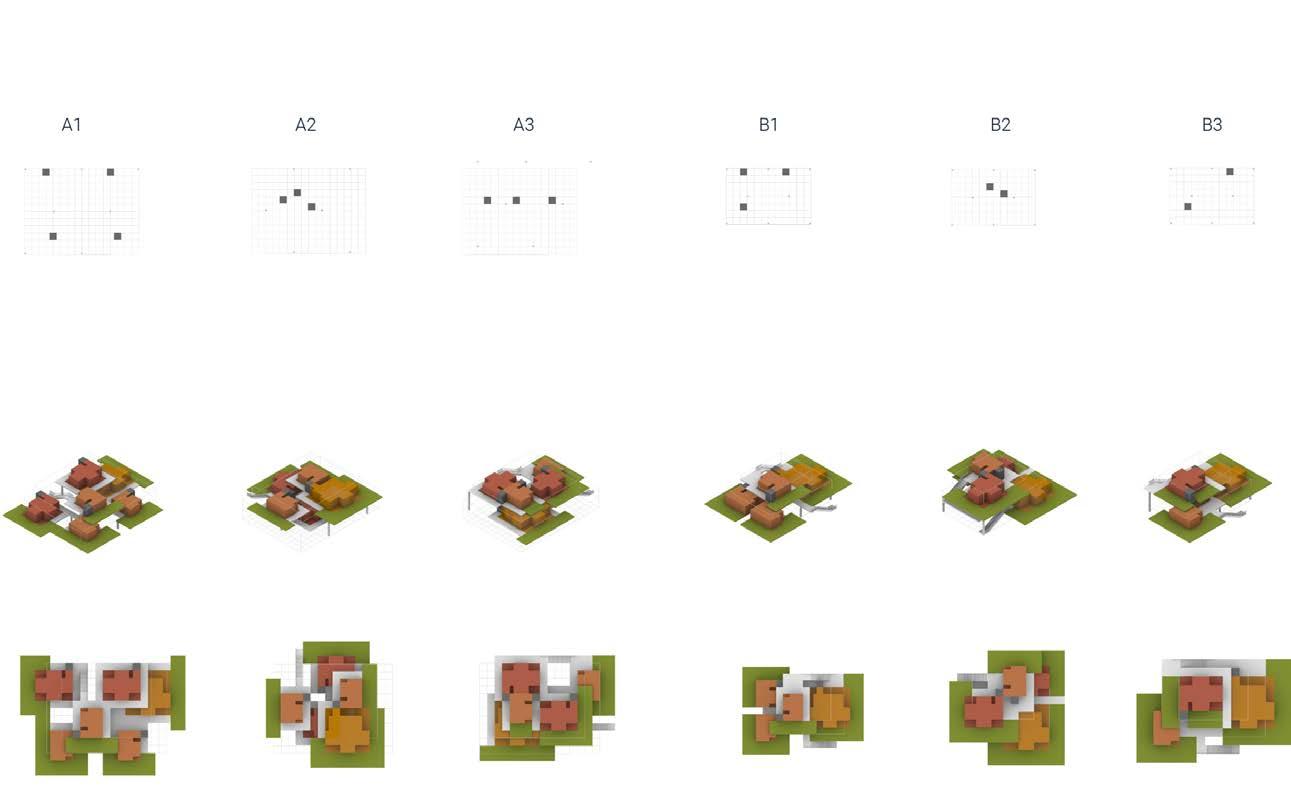
104 RIVER talise 105 Building footprint (m2): No. of floors: Emergent void area (m2): Floor area ratio: Private to communal space ratio: RESEARCH DEVELOPMENT ARCHITECTURAL SYSTEM RESEARCH DEVELOPMENT ARCHITECTURAL SYSTEM 622 3 430 1.31 0.91 622 3 467.3 1.25 0.81 622 3 469.6 1.25 1.02 415 3 0 2.14 0.56 415 3 0 2.13 0.63 415 3 79.5 1.81 0.58 Zone suitability Mid - high flood risk
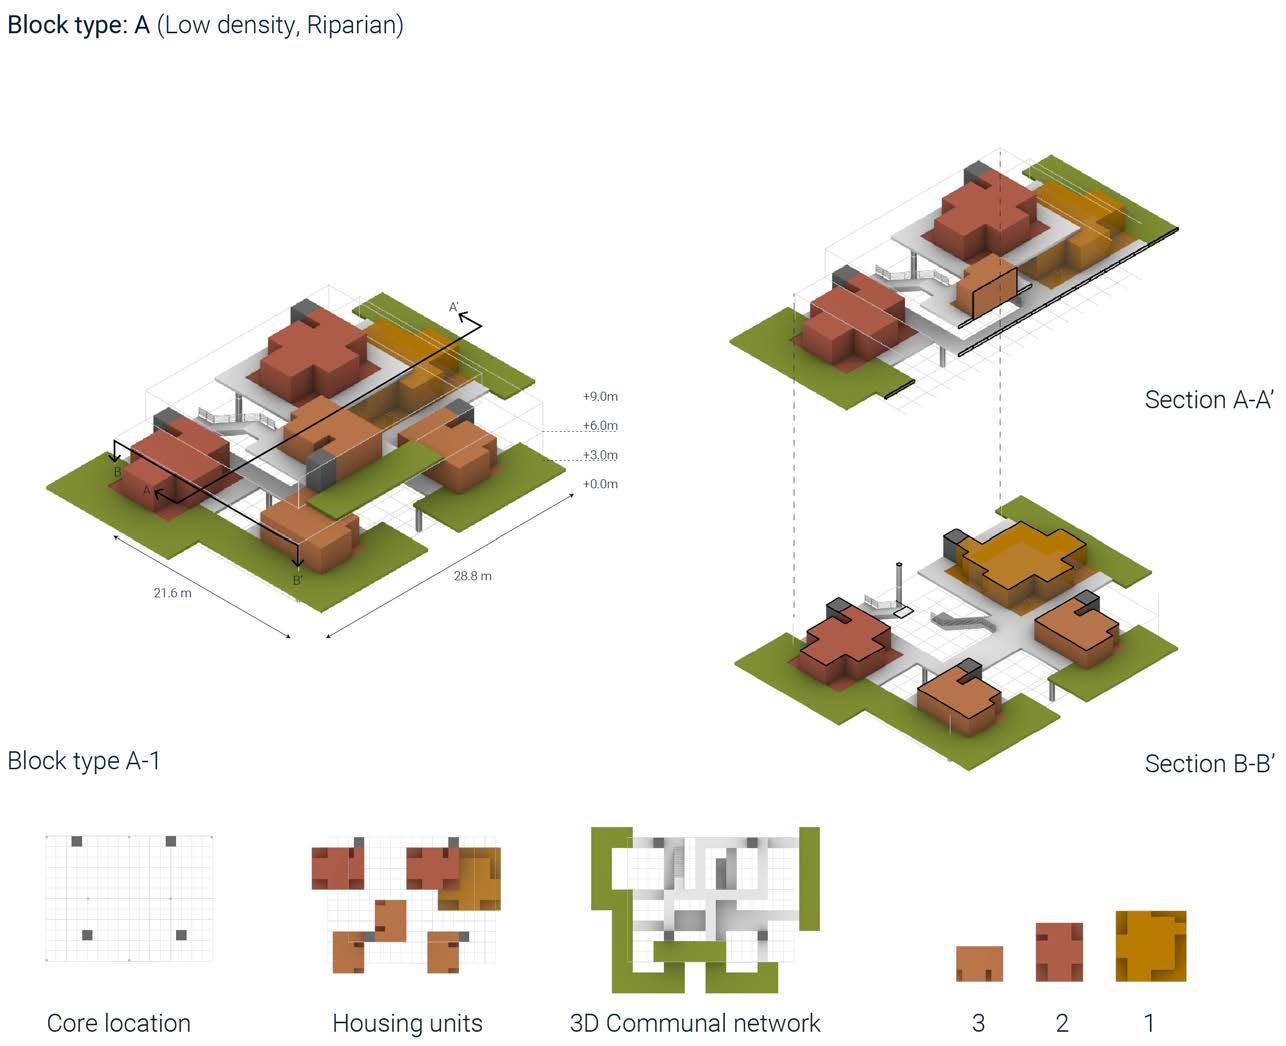
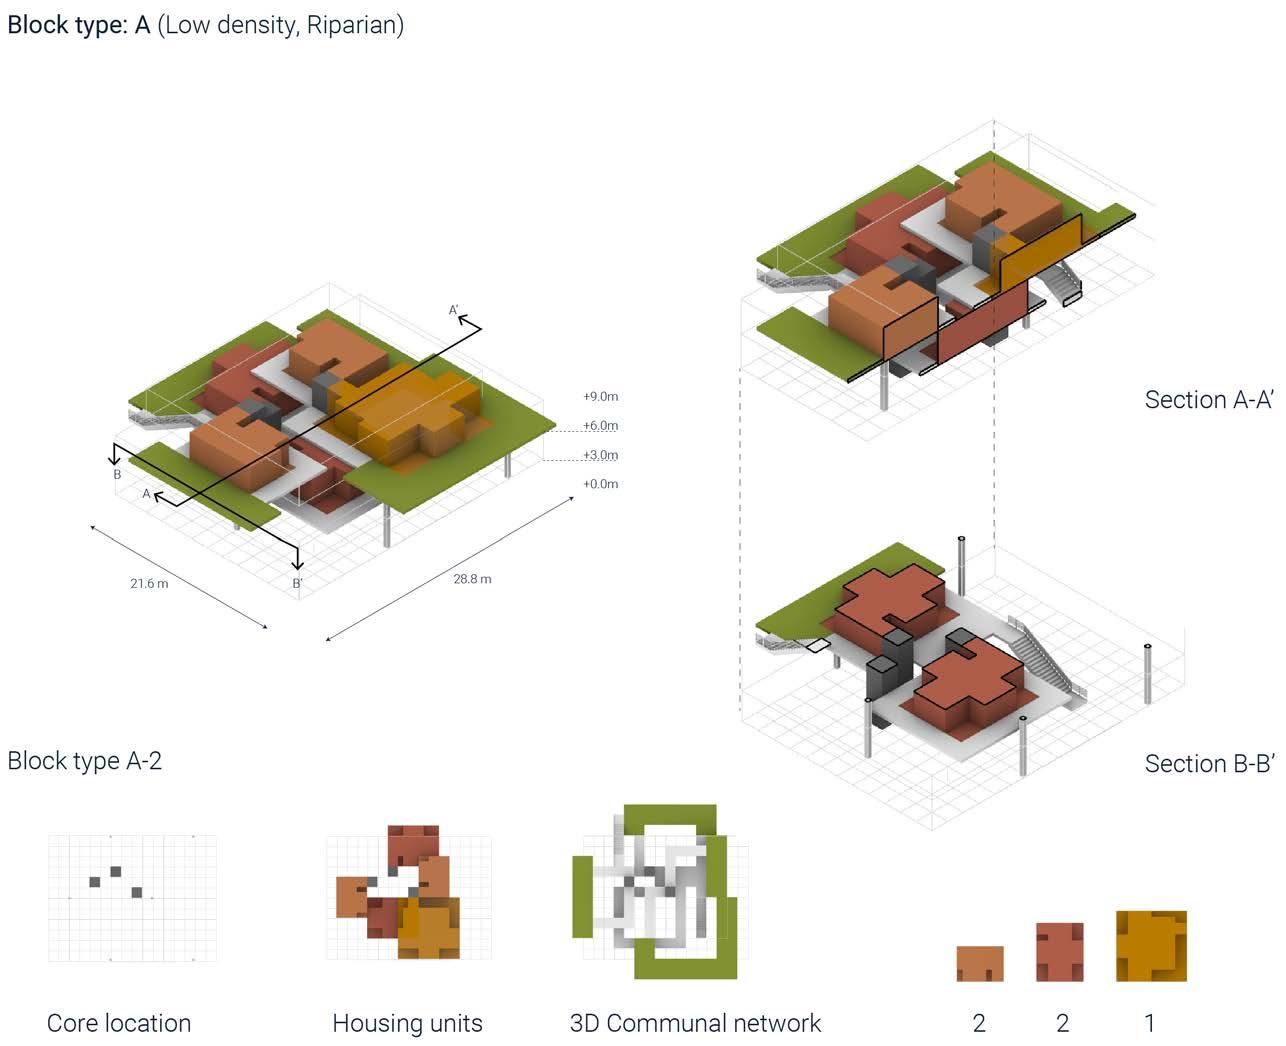
106 RIVER talise 107 RESEARCH DEVELOPMENT ARCHITECTURAL SYSTEM RESEARCH DEVELOPMENT ARCHITECTURAL SYSTEM Total housing area(m2): Total communal areas (m2): Total area of terraces (m2): 327 168.48 233 Emergent void area (m2): Floor area ratio: Private to communal space ratio: 467 1.25 0.81 Total housing area(m2): Total communal areas (m2): Total area of terraces (m2): 367 123.12 266 Emergent void area (m2): Floor area ratio: Private to communal space ratio: 430 1.31 0.94
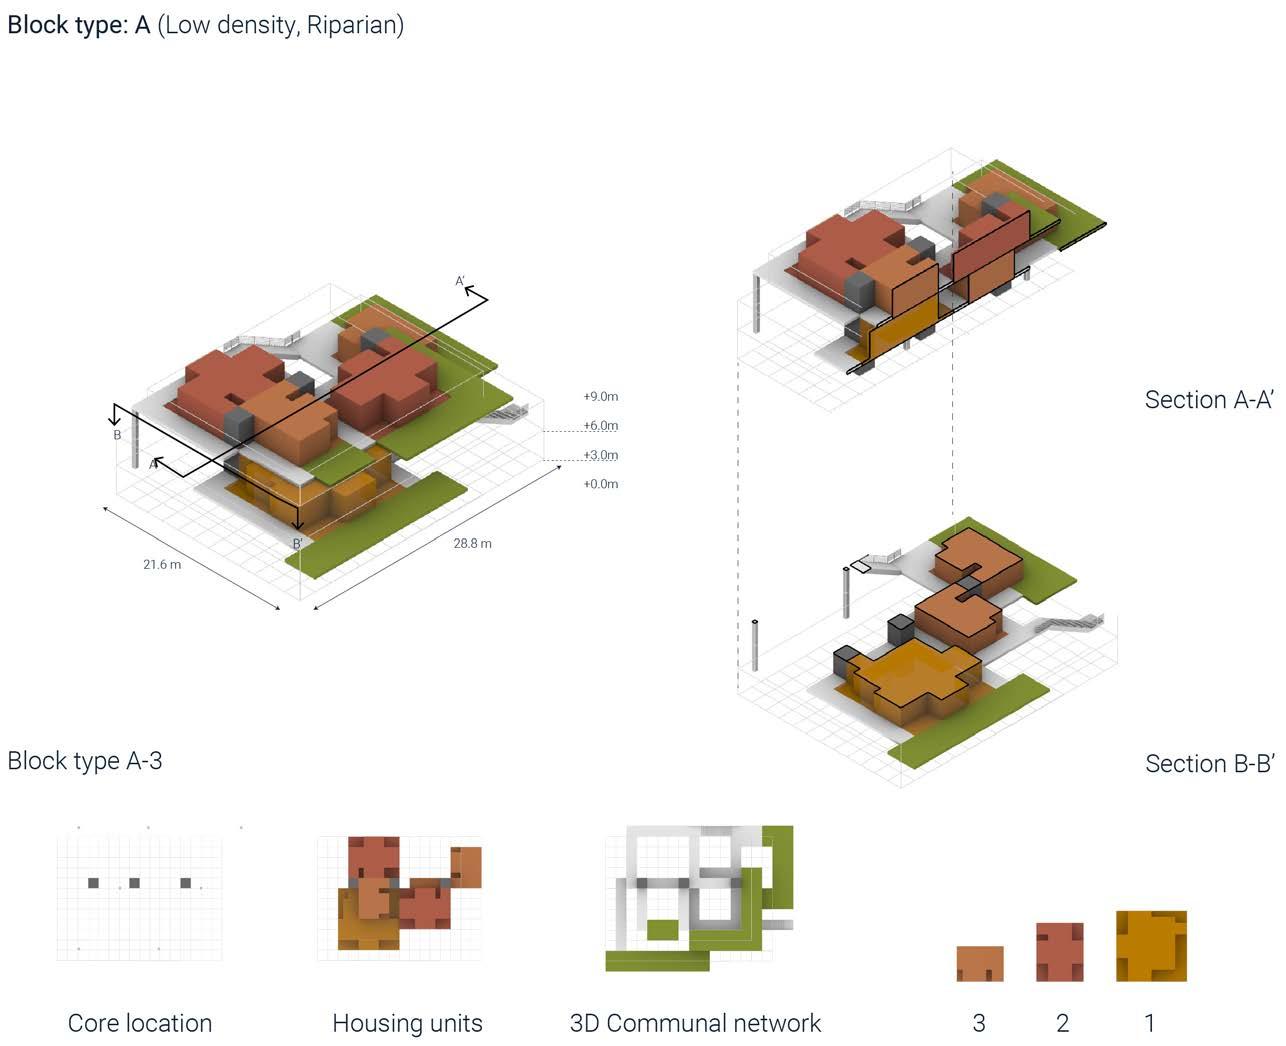
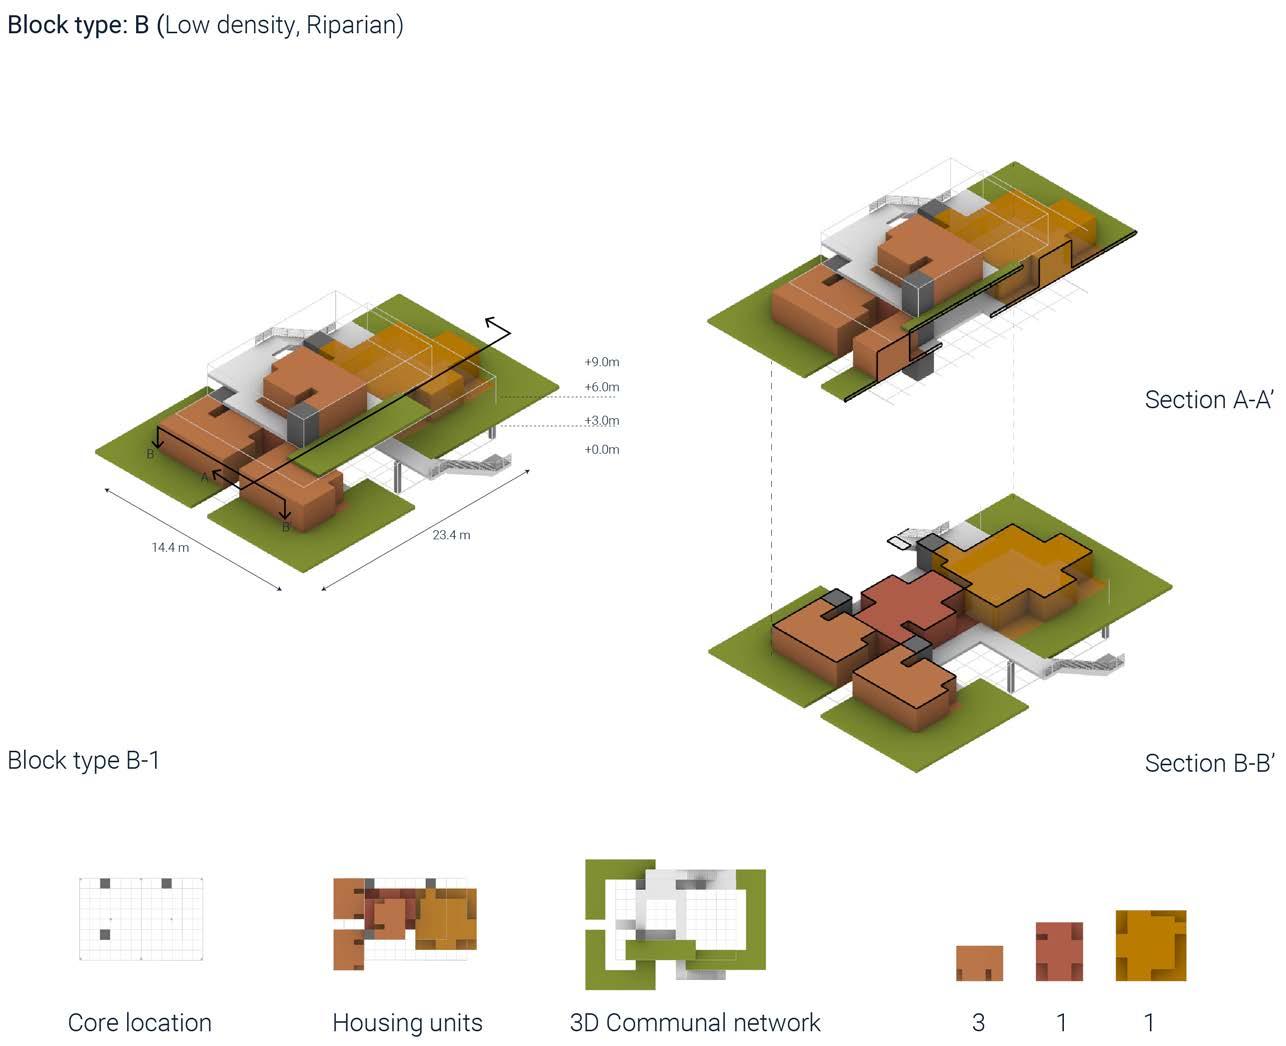
108 RIVER talise 109 Total housing area(m2): Total communal areas (m2): Total area of terraces (m2): 302 285.12 253 Emergent void area (m2): Floor area ratio: Private to communal space ratio: 0 2.14 0.56 Total housing area(m2): Total communal areas (m2): Total area of terraces (m2): 367 165.24 194 Emergent void area (m2): Floor area ratio: Private to communal space ratio: 469.6 1.25 1.02 RESEARCH DEVELOPMENT ARCHITECTURAL SYSTEM RESEARCH DEVELOPMENT ARCHITECTURAL SYSTEM
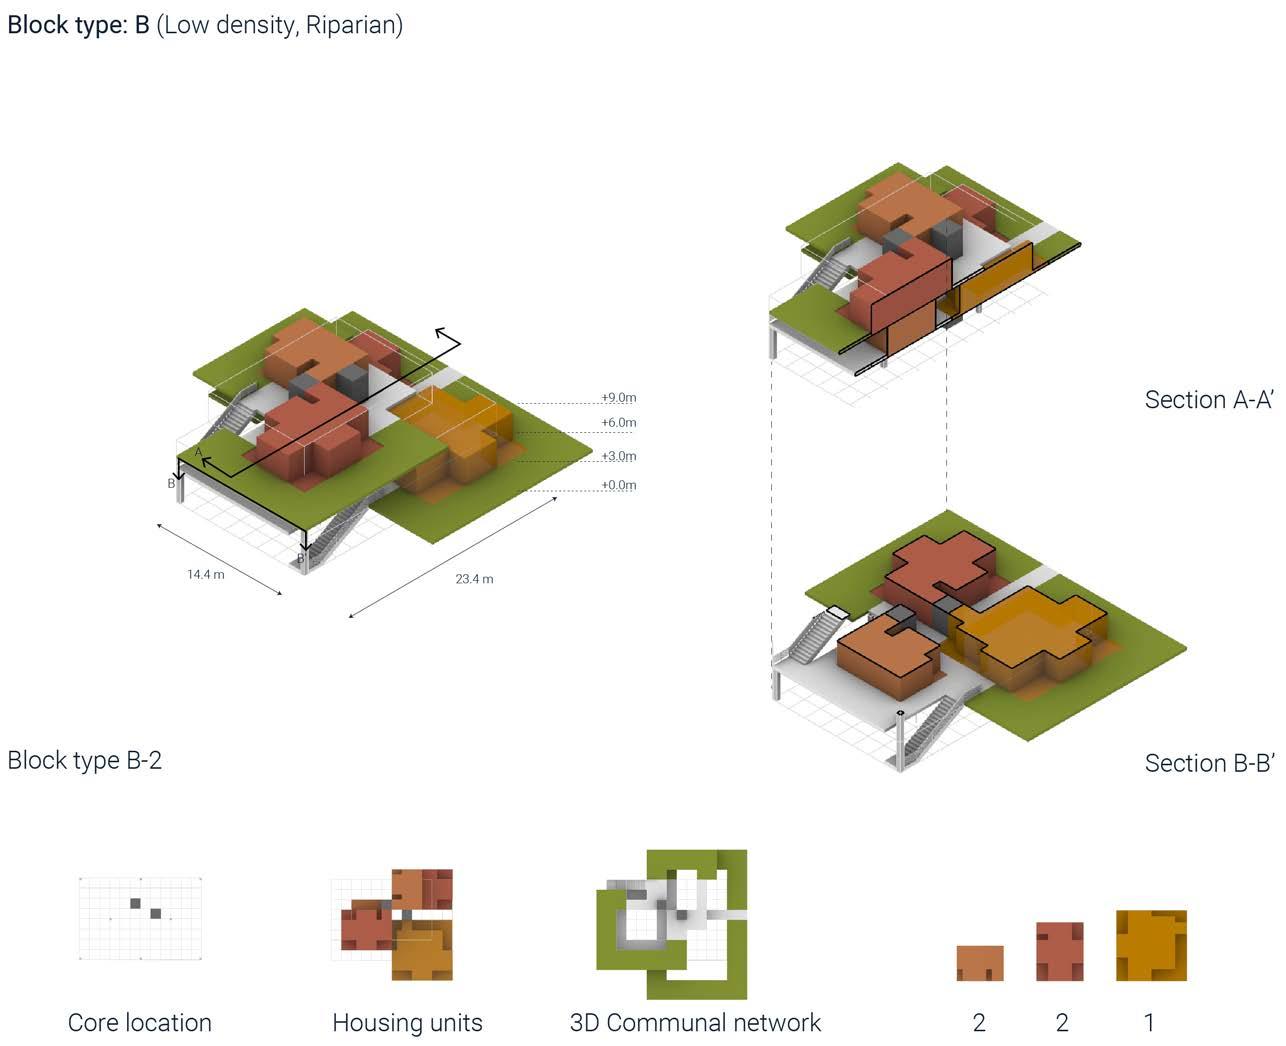
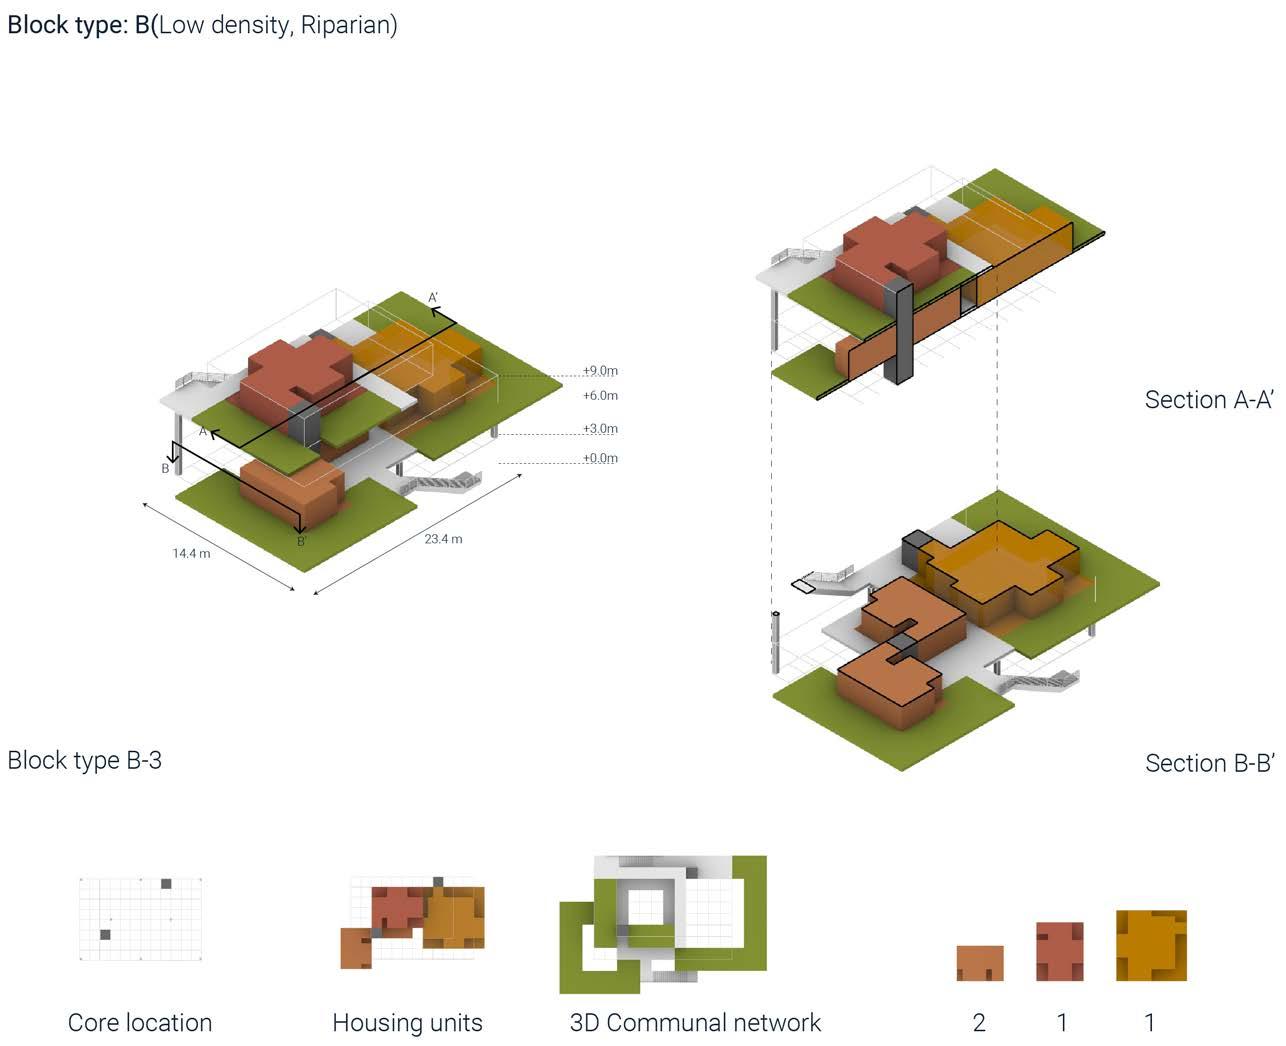
110 RIVER talise 111 Total housing area(m2): Total communal areas (m2): Total area of terraces (m2): 262 217.08 233 Emergent void area (m2): Floor area ratio: Private to communal space ratio: 79.48 1.81 0.58 Total housing area(m2): Total communal areas (m2): Total area of terraces (m2): 327 200.88 318 Emergent void area (m2): Floor area ratio: Private to communal space ratio: 0 2.13 0.63 RESEARCH DEVELOPMENT ARCHITECTURAL SYSTEM RESEARCH DEVELOPMENT ARCHITECTURAL SYSTEM
BLOCK TYPE: MID DENSITY, RIPARIAN
Mid-density riparian block types are created for zone B, responding to medium to low risk factor. Furthermore, considering the risk factor, these units are elevated on piers, which is advantageous for ventilation within the clusters. The building block is of 4 to 5 floors.
Although the plot size and number of floors for the building block is same as mid-density urban block, elevated building and terraced morphology results into a less dense aggregation in comparison to urban typologies, which can be observed in the floor area ratio. Another observation that can be made is that the aggregations are more closely packed, allowing for less void as well as communal spaces within the building blocks resulting in a low private to communal space ratio.
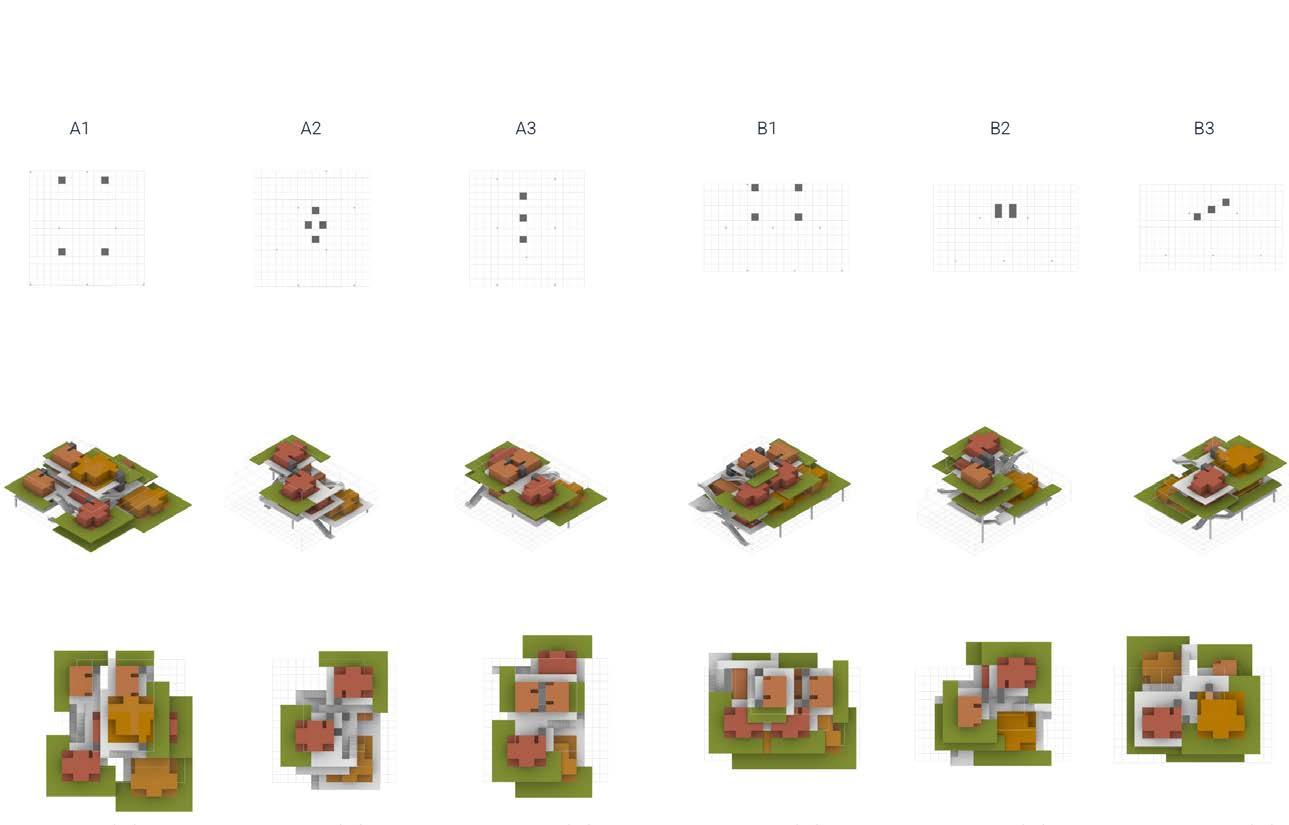
fig 4.2.16(right): Mid density, riparian building blocks (all)
fig 4.2.17(114-1119): Detailed aggregation for individual building block
112 RIVER talise 113 Building footprint (m2): No. of floors: Emergent void area (m2): Floor area ratio: Private to communal space ratio: 830 4 458 2.45 0.71 830 4 1372.2 1.35 0.74 830 4 891.2 1.93 0.45 778 5 1294 2.34 0.9 778 5 1258.96 2.38 1.03 778 5 1291.7 2.34 1.02 Zone suitability Mid flood risk
RESEARCH DEVELOPMENT ARCHITECTURAL SYSTEM RESEARCH DEVELOPMENT ARCHITECTURAL SYSTEM
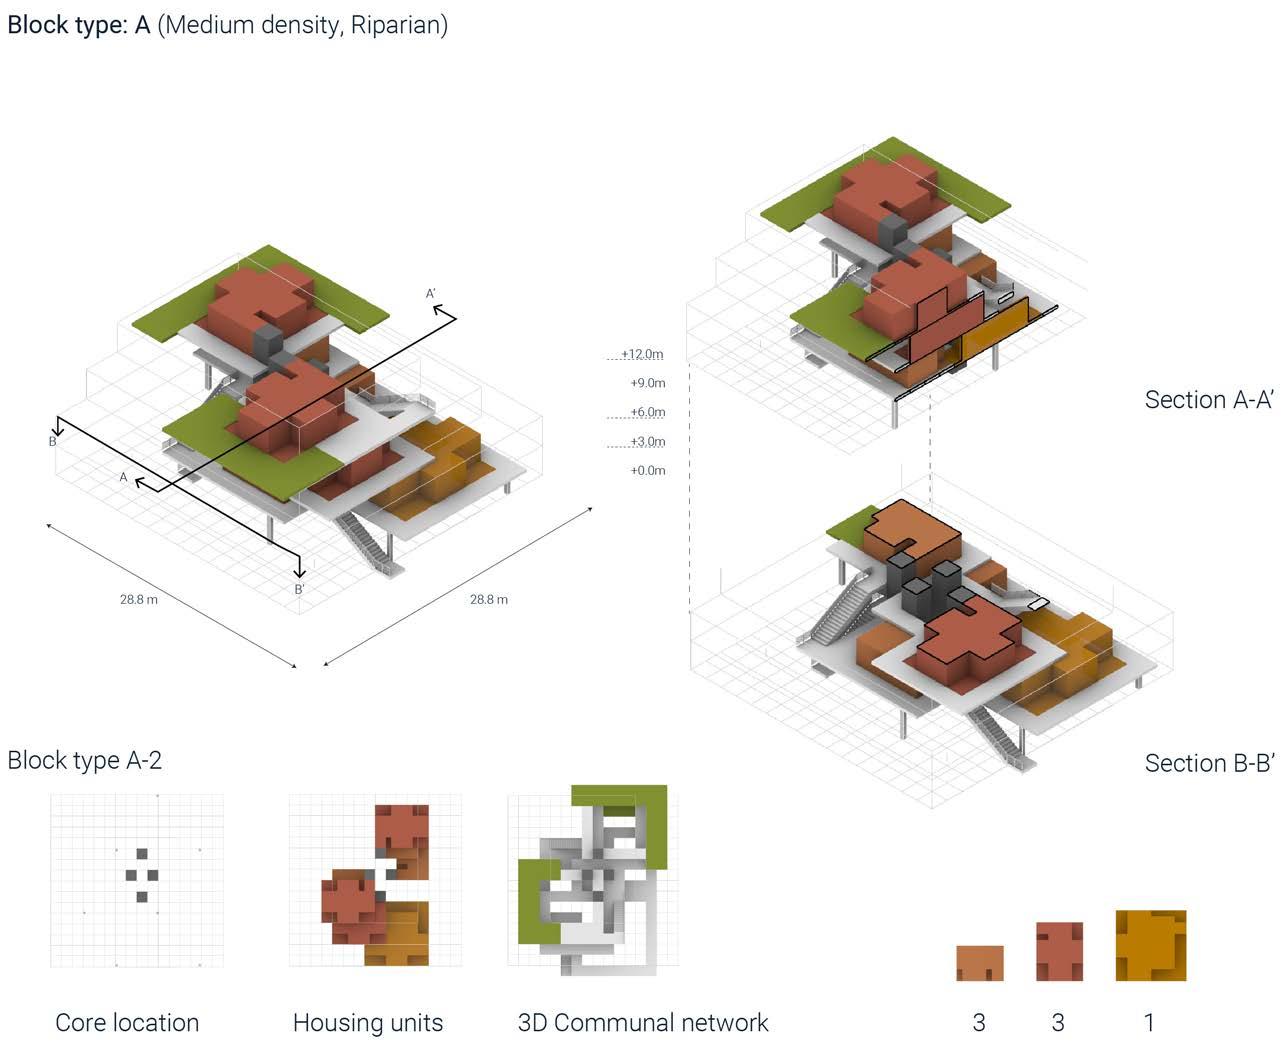
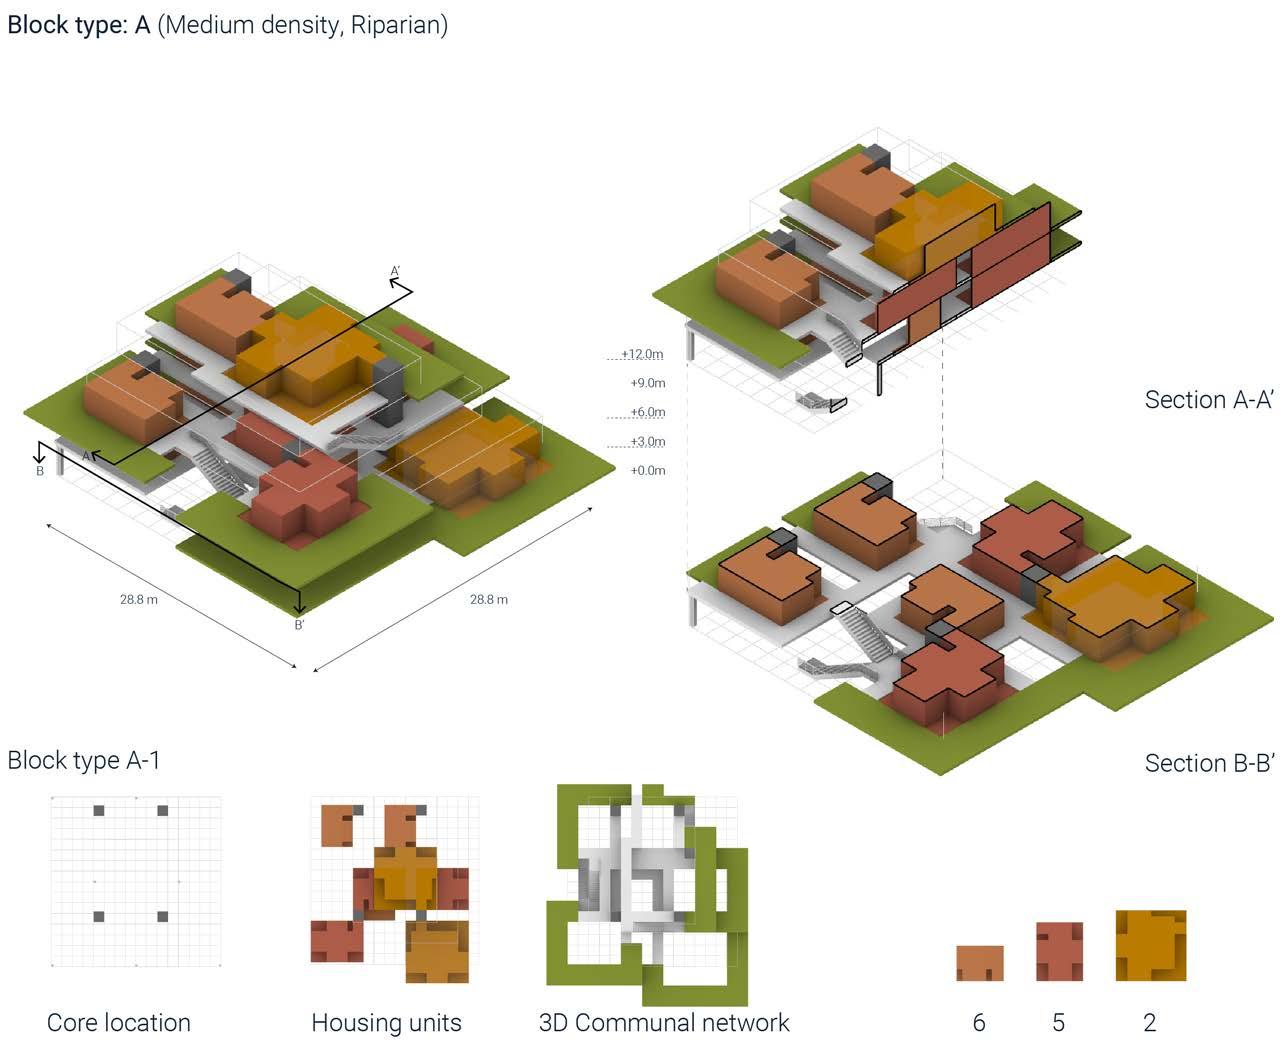
114 RIVER talise 115 Total housing area(m2): Total communal areas (m2): Total area of terraces (m2): 432 424.44 162 Emergent void area (m2): Floor area ratio: Private to communal space ratio: 1377 1.35 0.74 Total housing area(m2): Total communal areas (m2): Total area of terraces (m2): 799 528.12 596 Emergent void area (m2): Floor area ratio: Private to communal space ratio: 458 2.45 0.71 RESEARCH DEVELOPMENT ARCHITECTURAL SYSTEM RESEARCH DEVELOPMENT ARCHITECTURAL SYSTEM
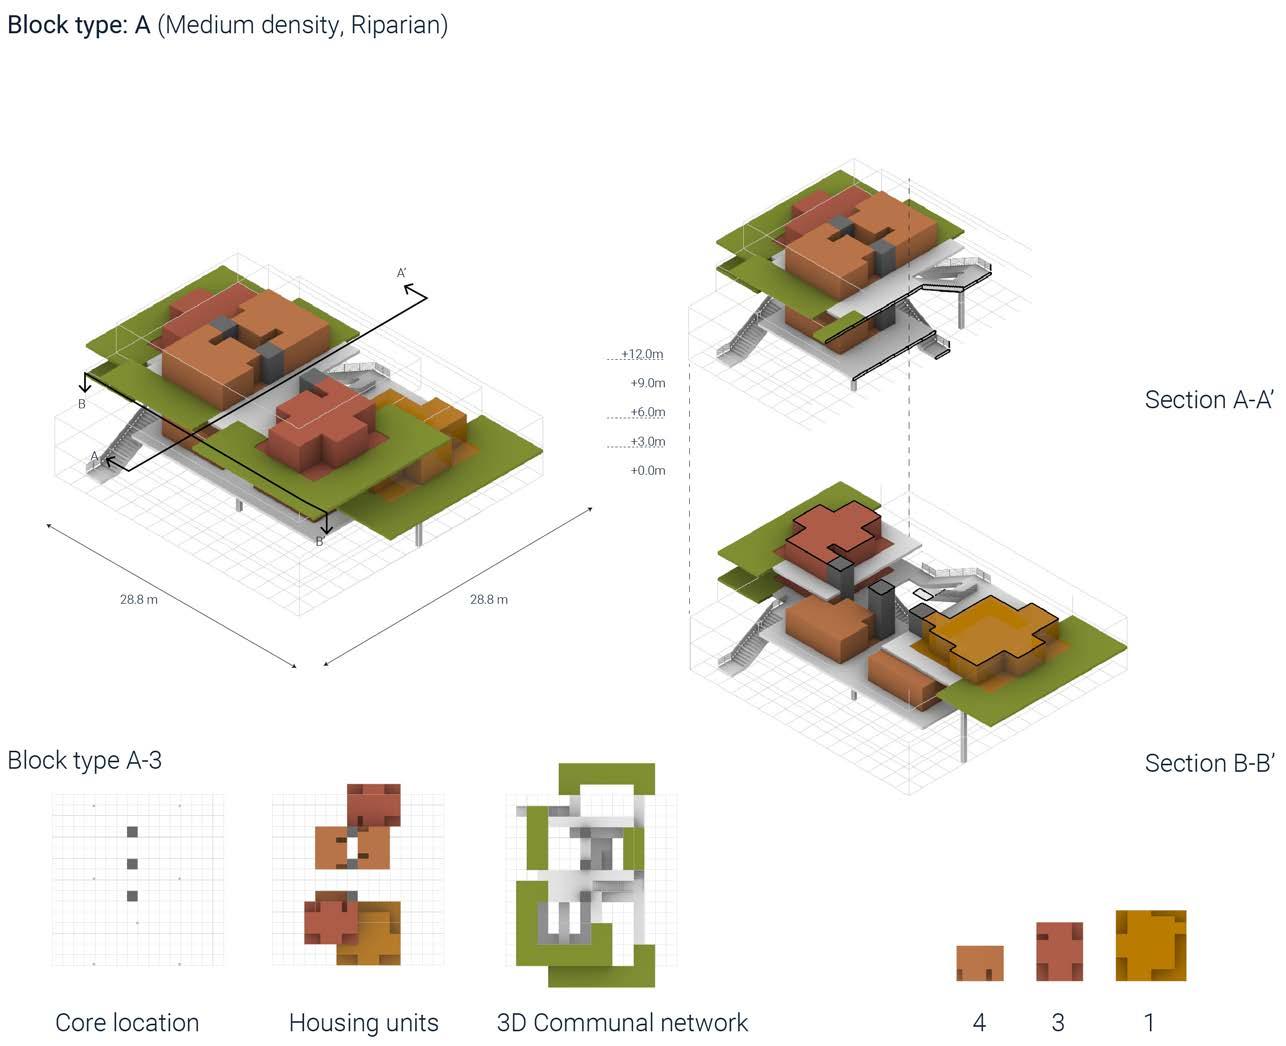
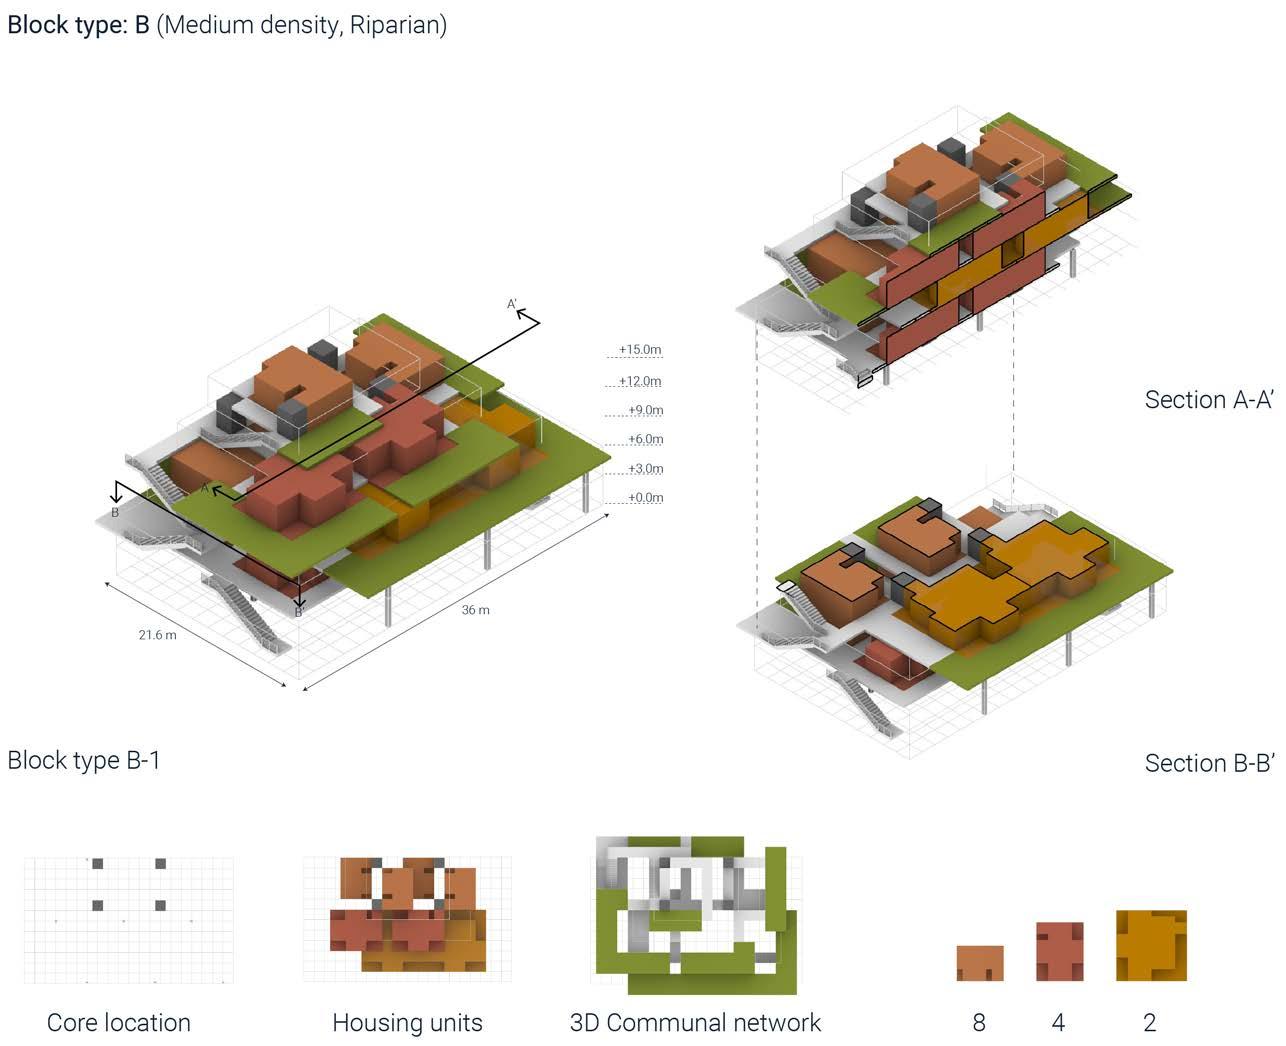
116 RIVER talise 117 Total housing area(m2): Total communal areas (m2): Total area of terraces (m2): 814 473 428 Emergent void area (m2): Floor area ratio: Private to communal space ratio: 1294 2.34 0.9 Total housing area(m2): Total communal areas (m2): Total area of terraces (m2): 472 699.84 350 Emergent void area (m2): Floor area ratio: Private to communal space ratio: 891 1.93 0.45 RESEARCH DEVELOPMENT ARCHITECTURAL SYSTEM RESEARCH DEVELOPMENT ARCHITECTURAL SYSTEM
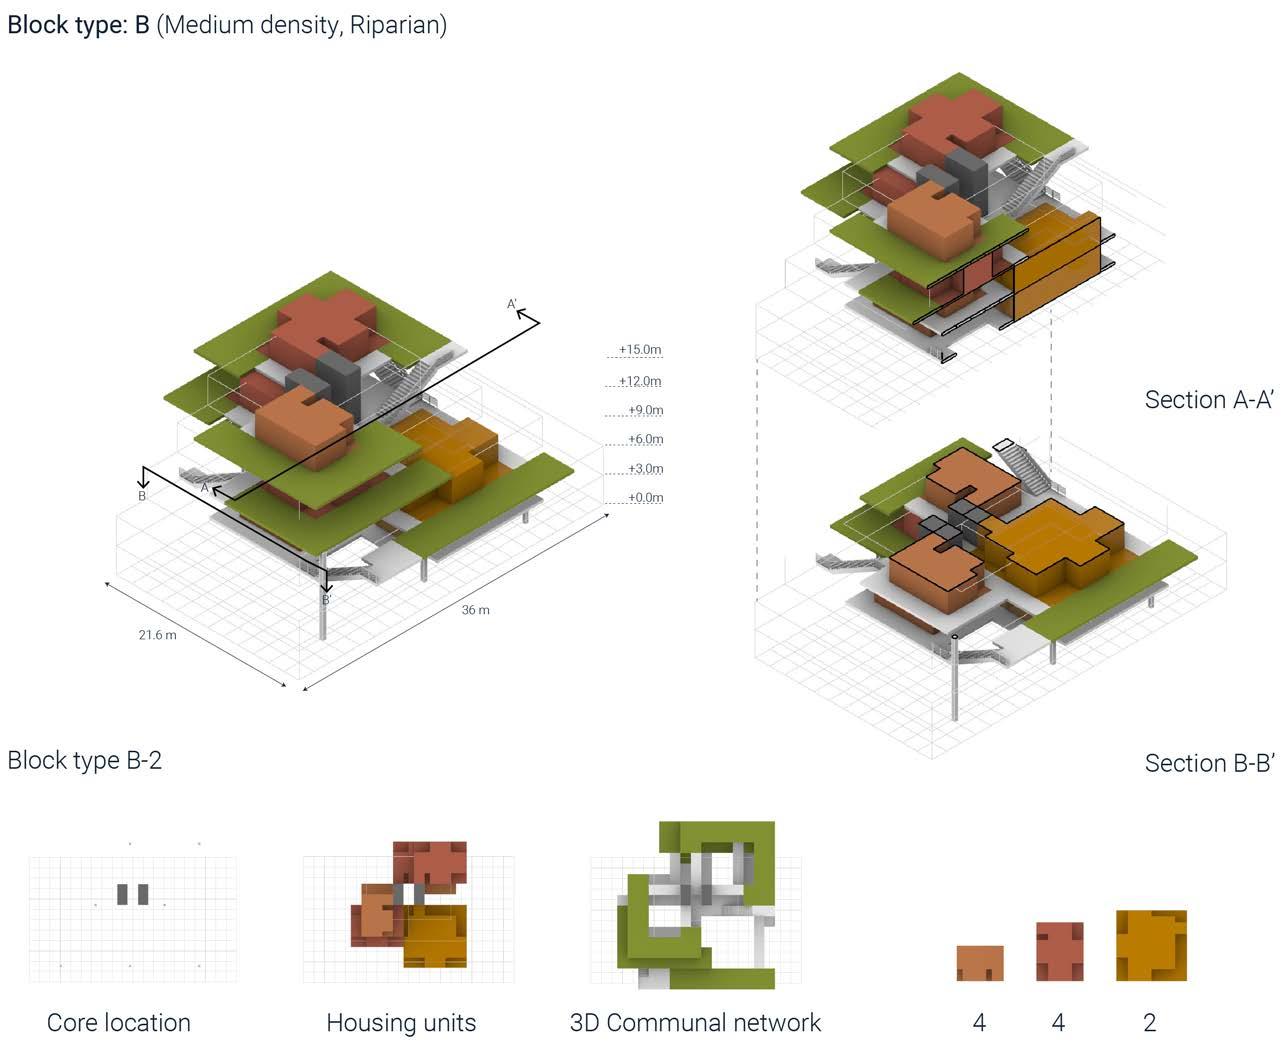
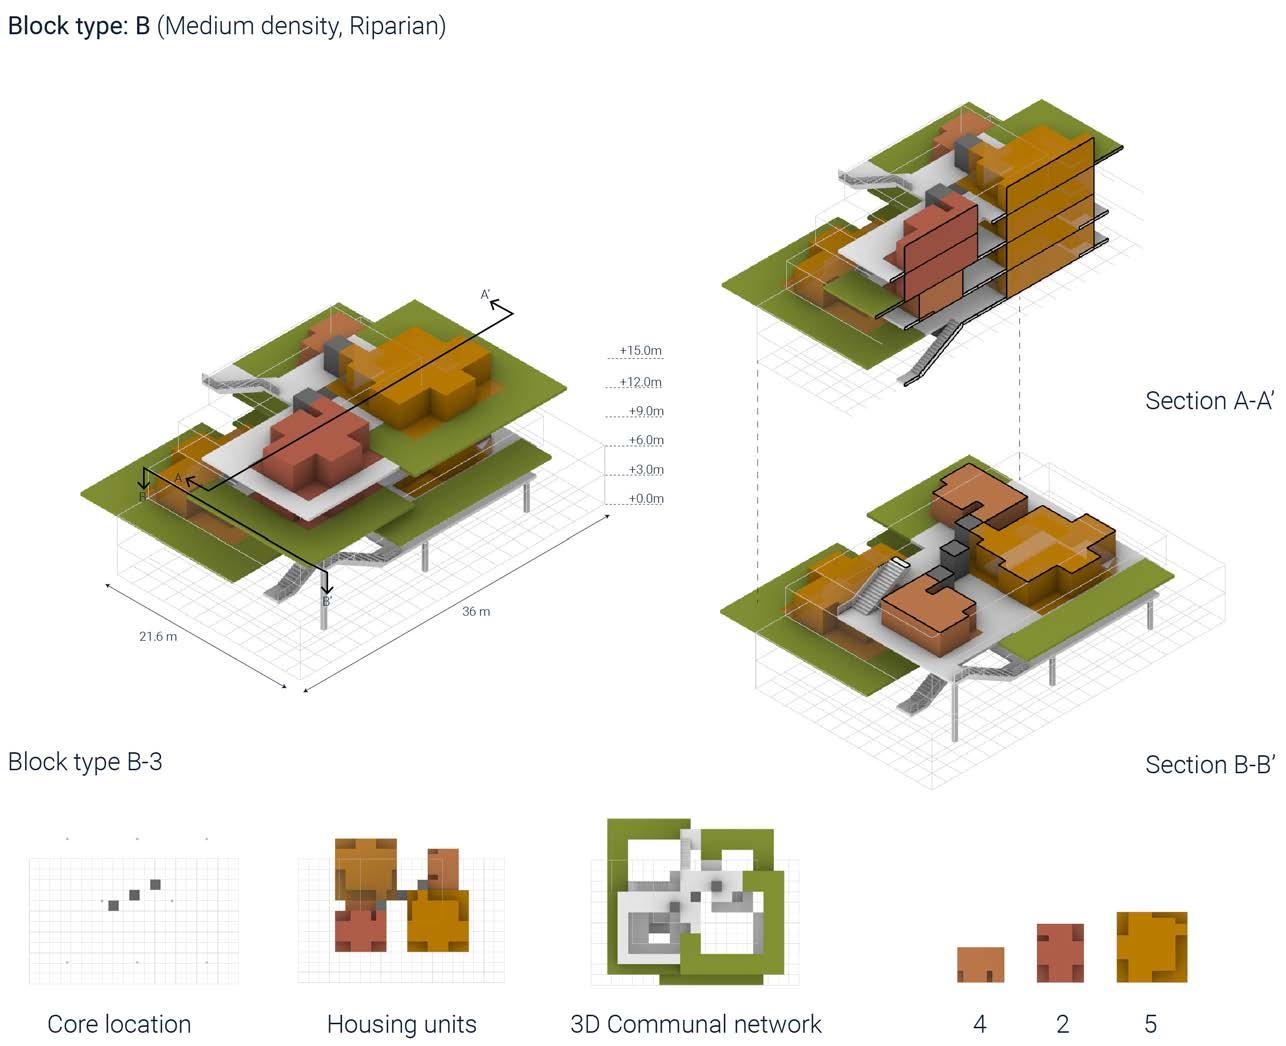
118 RIVER talise 119 Total housing area(m2): Total communal areas (m2): Total area of terraces (m2): 875 346.68 512 Emergent void area (m2): Floor area ratio: Private to communal space ratio: 1292 2.34 1.02 Total housing area(m2): Total communal areas (m2): Total area of terraces (m2): 888 408.24 454 Emergent void area (m2): Floor area ratio: Private to communal space ratio: 1258 2.38 1.03 RESEARCH DEVELOPMENT ARCHITECTURAL SYSTEM RESEARCH DEVELOPMENT ARCHITECTURAL SYSTEM
BLOCK TYPE: MID DENSITY, URBAN
Mid density block type is also created for zone C. However, these will be placed closer to the river in comparison to the high-density block. As the blocks will be in minimal risk zones, these are not elevated on piers. The block height ranges from 4 to 5 floors.
Even though the building block is comparable to mid-density riparian, the void area is significantly smaller. The morphologies of the aggregations generated by changing the core positions for the block type is quite varied, which can also be observed from the emergent void area which ranges from 433 to 1100 sq m. Additionally, this block type has the maximum values for private to communal space ratio, ranging from 1.09 to 1.82.

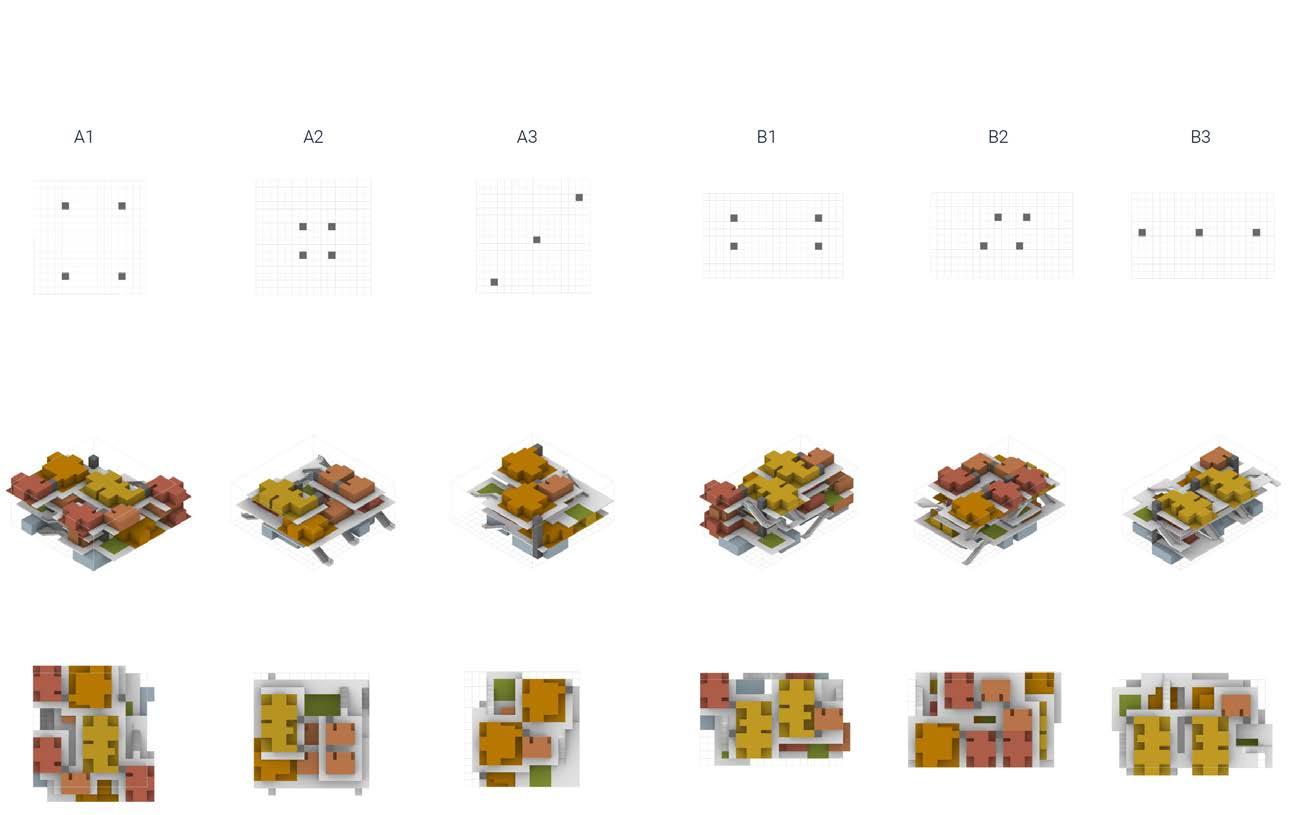
120 RIVER talise 121 Building footprint (m2): No. of floors: Emergent void area (m2): Floor area ratio: Private to communal space ratio: 830 4 433.5 3.48 1.38 830 4 985.2 2.81 1.45 830 4 1060 2.72 1.42 778 5 1080 3.61 1.82 778 5 661.9 4.15 1.21 778 5 1100 3.59 1.09 Zone suitability Low - mid flood risk
fig 4.2.18(right): Mid density, urban building blocks (all)
RESEARCH DEVELOPMENT ARCHITECTURAL SYSTEM RESEARCH DEVELOPMENT ARCHITECTURAL SYSTEM
fig 4.2.19(122-127) Detailed aggregation for individual building block
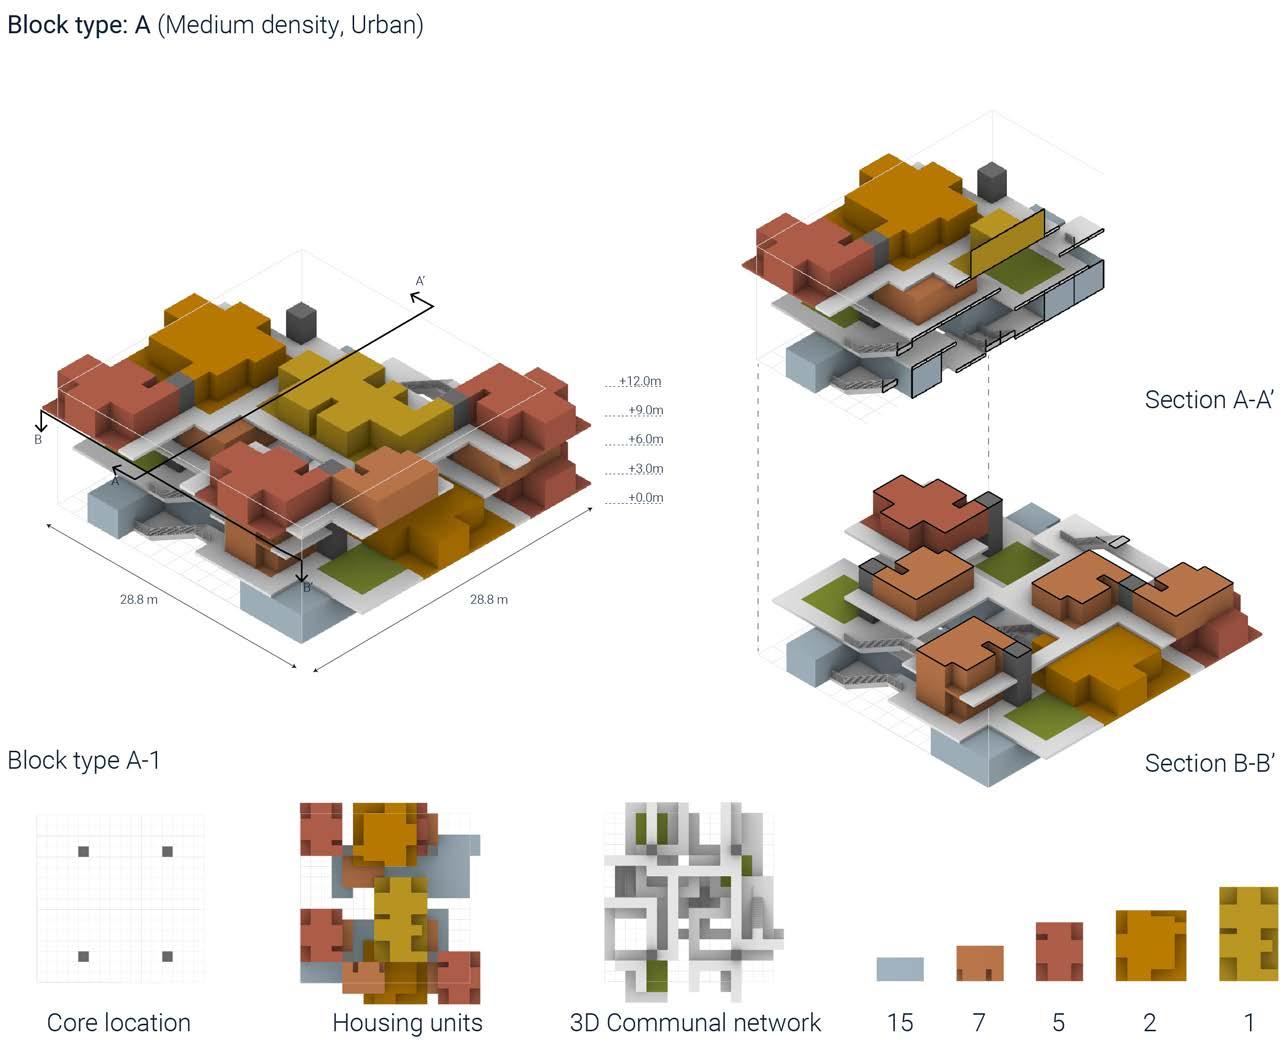
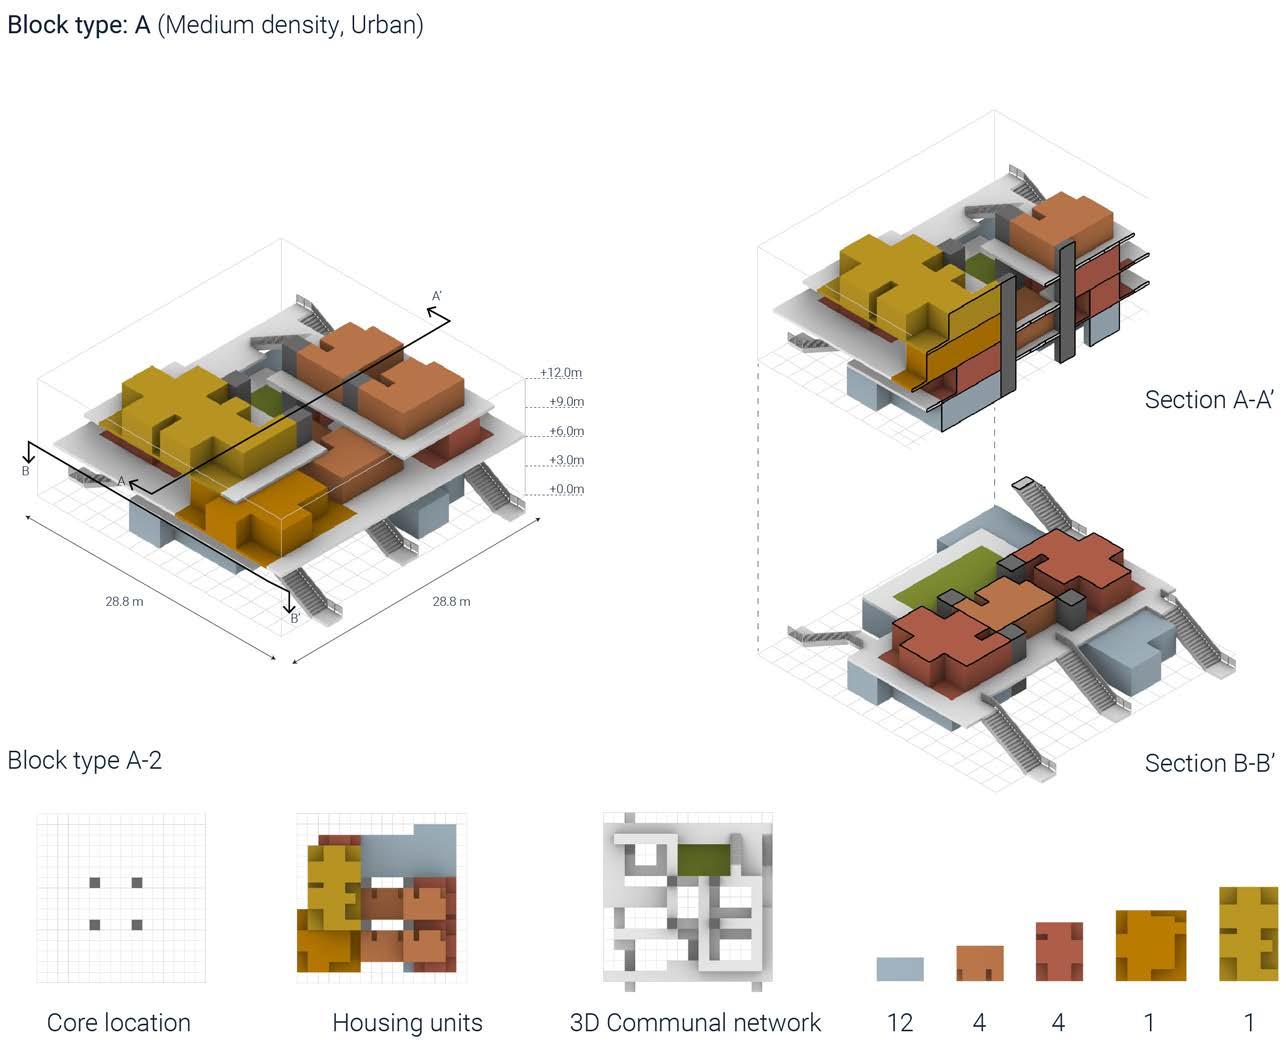
122 RIVER talise 123 Total housing area(m2): Total communal areas (m2): Total open space area (m2): 667 670.68 58.32 Emergent void area (m2): Floor area ratio: Private to communal space ratio: 985.2 2.81 1.45 Total housing area(m2): Total communal areas (m2): Total open space area(m2): 969 900.72 87.48 Emergent void area (m2): Floor area ratio: Private to communal space ratio: 434 3.48 1.38 RESEARCH DEVELOPMENT ARCHITECTURAL SYSTEM RESEARCH DEVELOPMENT ARCHITECTURAL SYSTEM
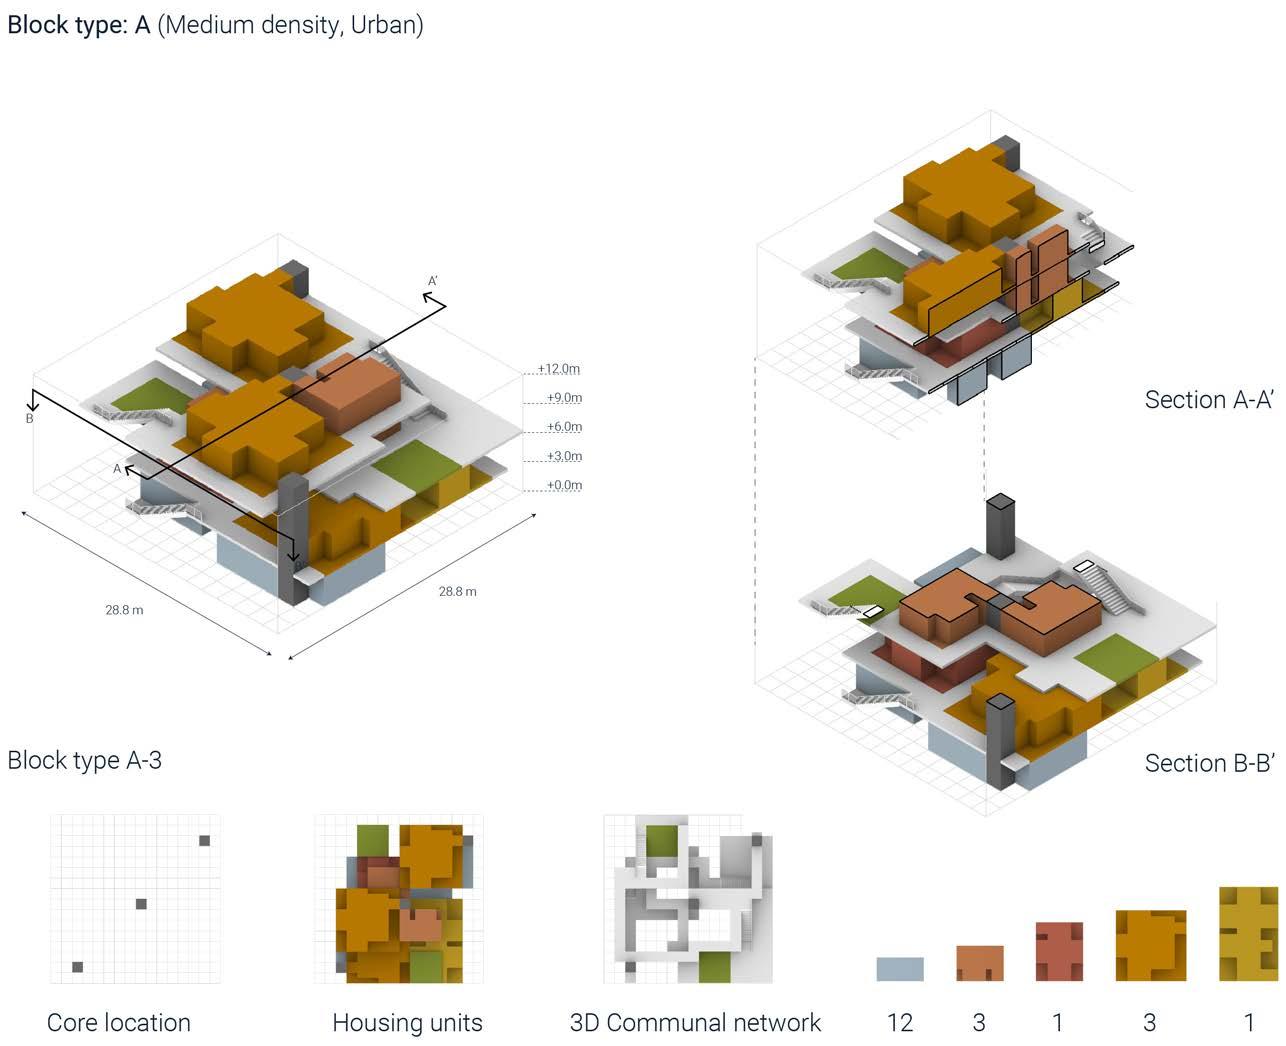
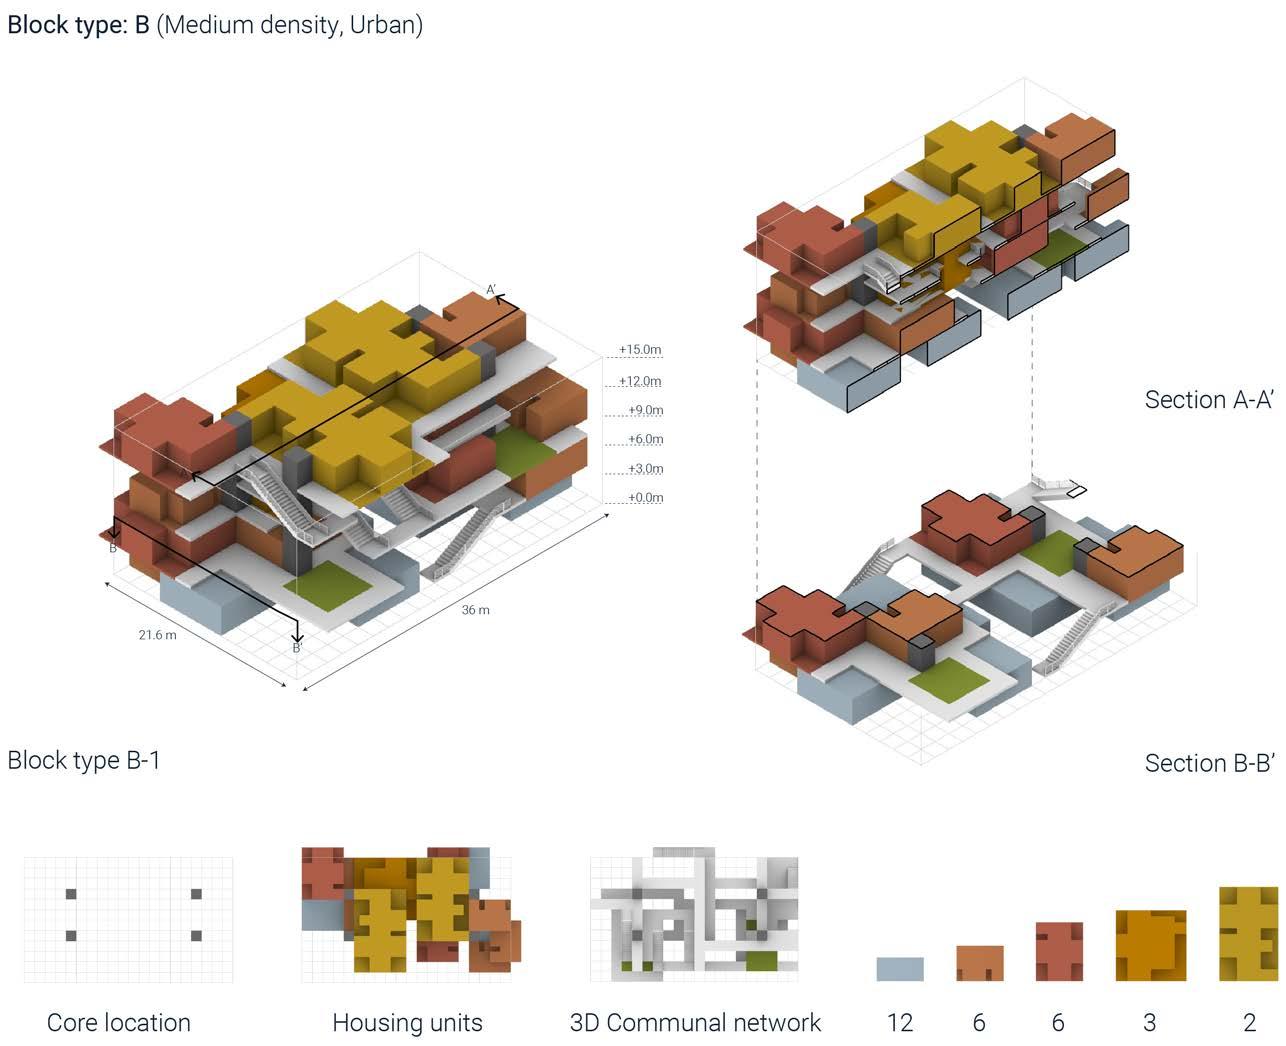
124 RIVER talise 125 Total housing area(m2): Total communal areas (m2): Total open space area (m2): 1124 700 87.48 Emergent void area (m2): Floor area ratio: Private to communal space ratio: 1080 3.61 1.82 Total housing area(m2): Total communal areas (m2): Total open space area(m2): 666 628.56 58.32 Emergent void area (m2): Floor area ratio: Private to communal space ratio: 1060 2.72 1.42 RESEARCH DEVELOPMENT ARCHITECTURAL SYSTEM RESEARCH DEVELOPMENT ARCHITECTURAL SYSTEM
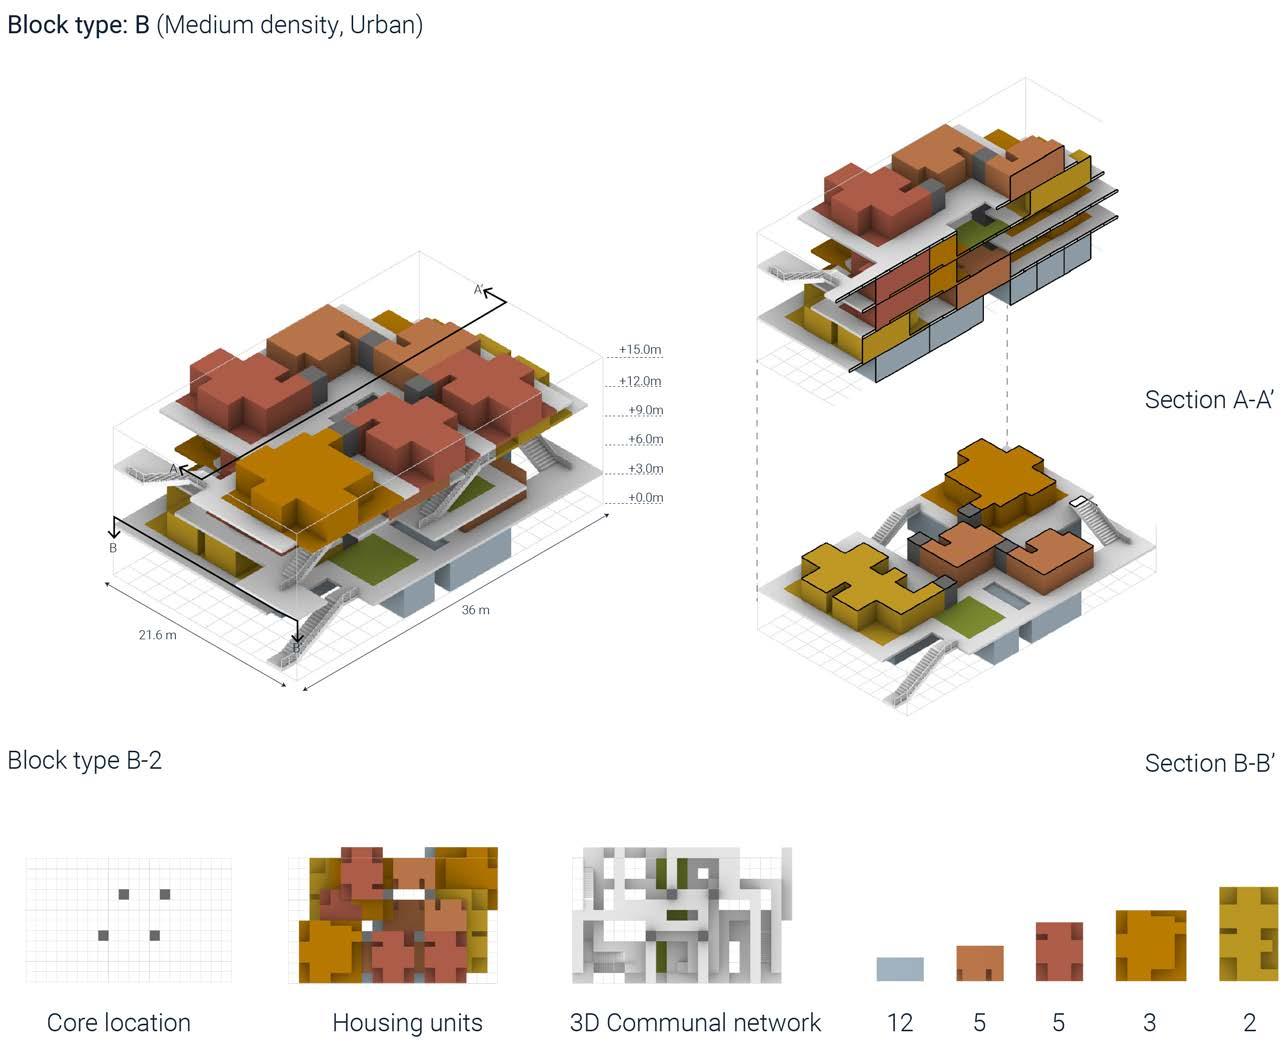
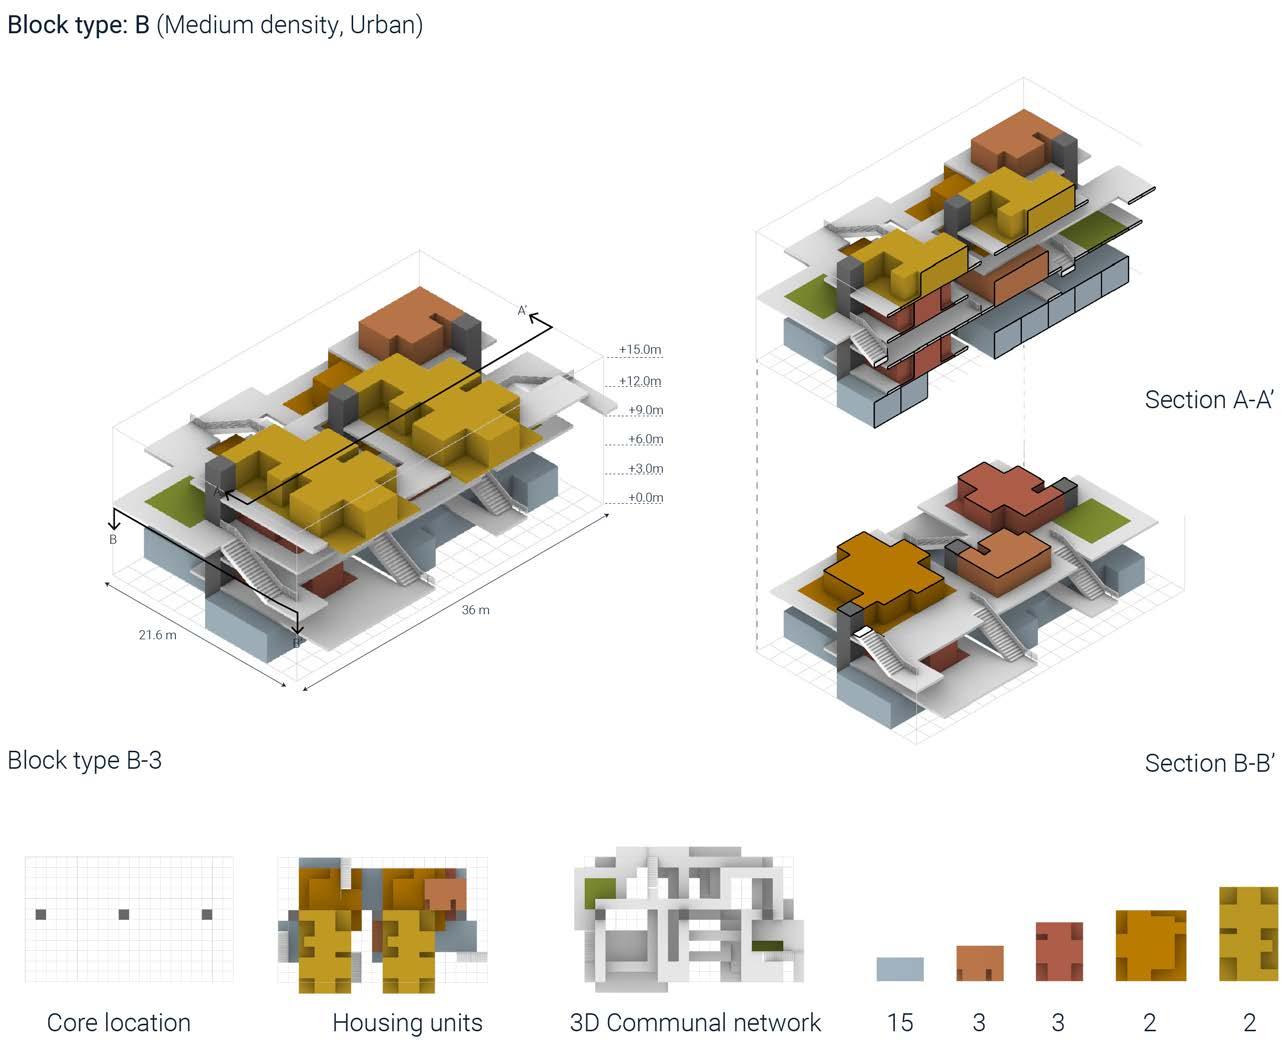
126 RIVER talise 127 Total housing area(m2): Total communal areas (m2): Total open space area (m2): 809 1040 58.32 Emergent void area (m2): Floor area ratio: Private to communal space ratio: 1099 3.59 1.09 Total housing area(m2): Total communal areas (m2): Total open space area(m2): 1136 1075.68 116.64 Emergent void area (m2): Floor area ratio: Private to communal space ratio: 661 4.15 1.21 RESEARCH DEVELOPMENT ARCHITECTURAL SYSTEM RESEARCH DEVELOPMENT ARCHITECTURAL SYSTEM
BLOCK TYPE: HIGH DENSITY, URBAN
High density block type is created for zone C, which is least susceptible to flood risk. The building blocks are not elevated as these will be located on higher elevated ground with low risk. However, only work units and spaces for public programs are aggregated on the ground floor. As block type is aimed for dense urban neighborhoods, they are typically 7 to 8 floors with larger plot sizes.
Due to the larger plot size and number of floors and hence the high-density of housing units, this block has the maximum floor area ratio or FAR ranging from 3.78 to 5.61. But despite that, larger volume of the building blocks allows for more voids within the aggregation. Consequently, the resultant morphologies are more porous yet dense typologies suitable for urban areas.
fig 4.2.20(right): High density, urban building blocks (all)
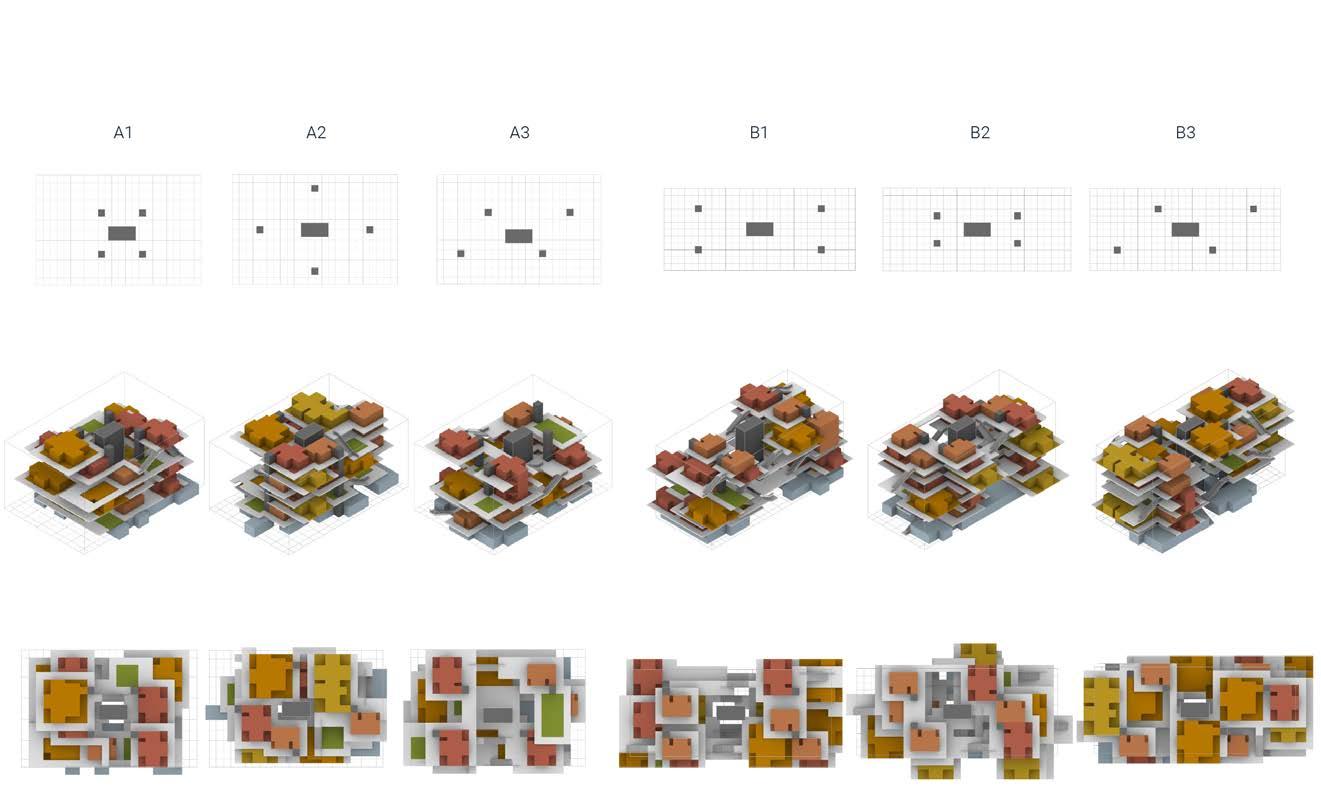
fig 4.2.21(130-135): Detailed aggregation for individual building block
128 RIVER talise 129 Building footprint (m2): No. of floors: Emergent void area (m2): Floor area ratio: Private to communal space ratio: 1244 7 2882 4.68 0.72 1244 7 3910 3.86 1.14 1244 7 2931 4.64 1.55 1089 8 3232 5.03 1.21 1089 8 2730.3 5.49 1.21 1089 8 2607.7 5.61 1.27 Zone suitability Low flood risk
RESEARCH DEVELOPMENT ARCHITECTURAL SYSTEM RESEARCH DEVELOPMENT ARCHITECTURAL SYSTEM
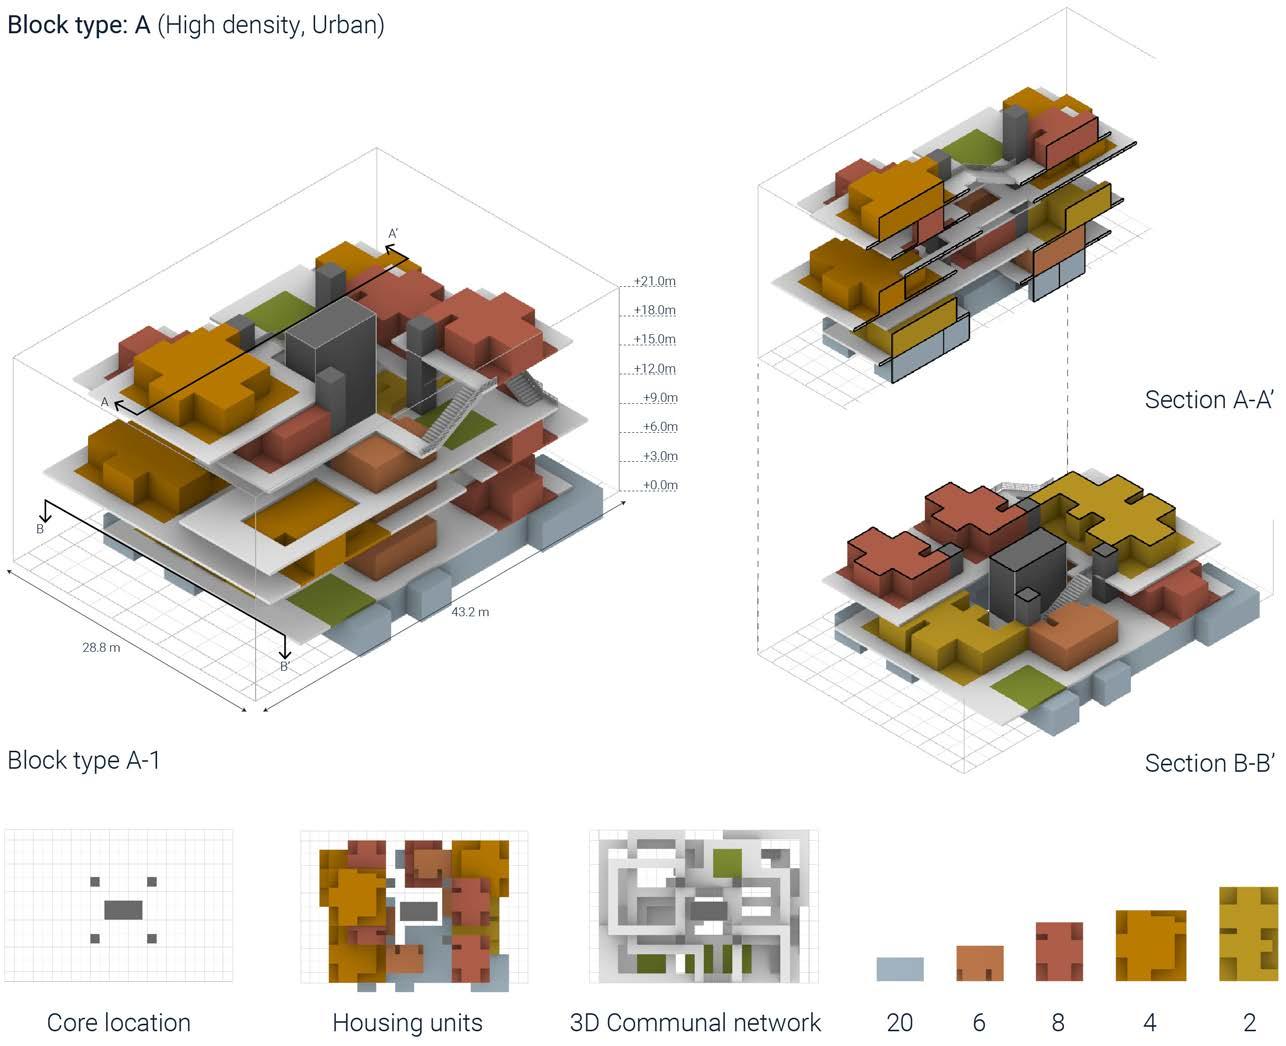
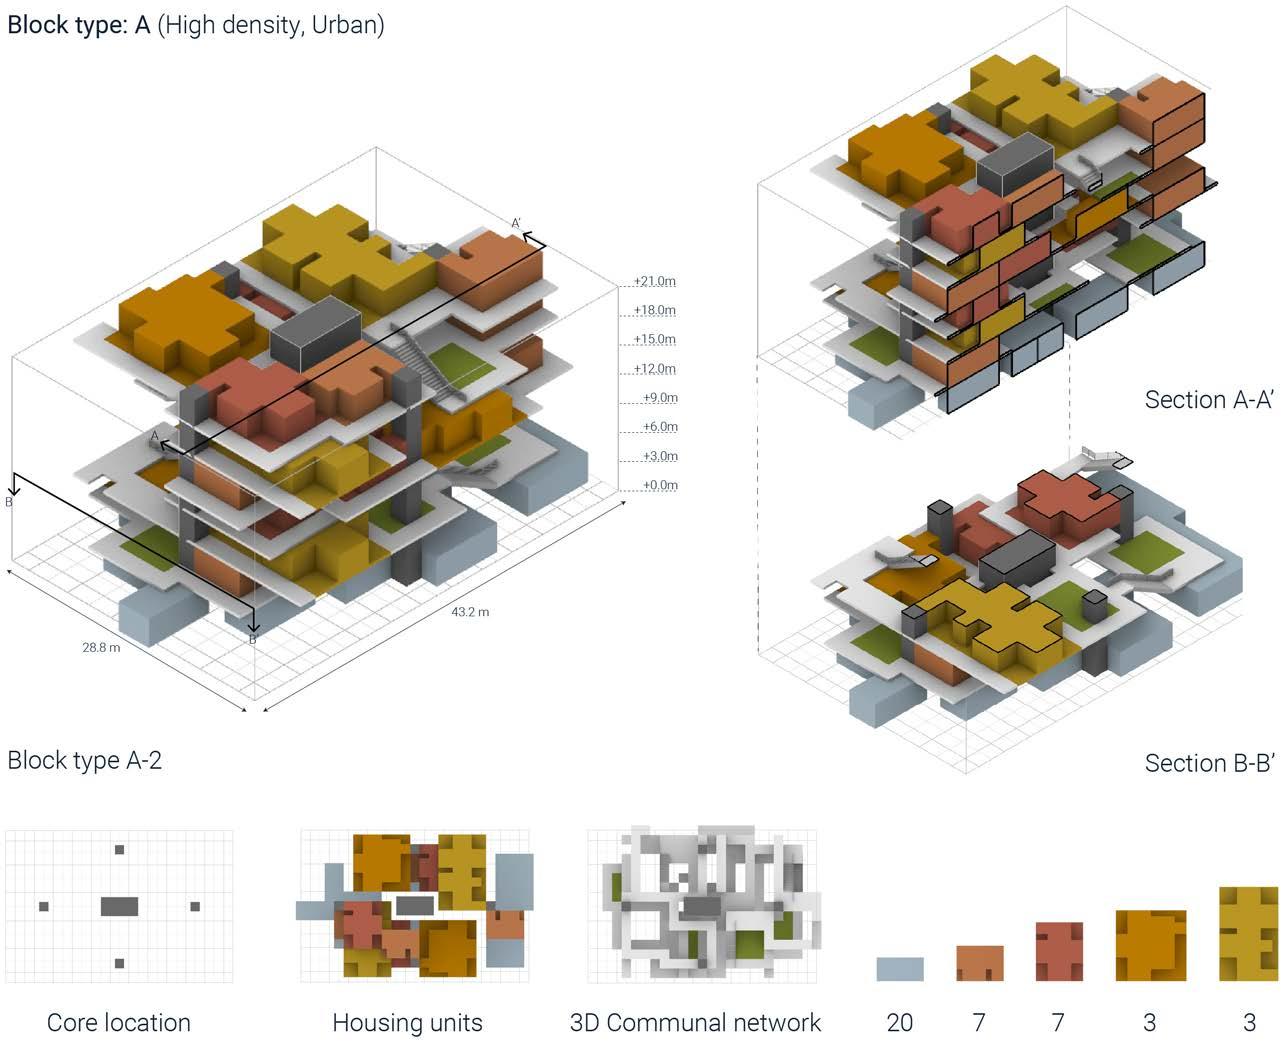
130 RIVER talise 131 Total housing area(m2): Total communal areas (m2): Total open space area (m2): 1476 1629.72 126.36 Emergent void area (m2): Floor area ratio: Private to communal space ratio: 3910 3.86 1.14 Total housing area(m2): Total communal areas (m2): Total open space area(m2): 1488 2673 116.64 Emergent void area (m2): Floor area ratio: Private to communal space ratio: 2882 4.68 0.72 RESEARCH DEVELOPMENT ARCHITECTURAL SYSTEM RESEARCH DEVELOPMENT ARCHITECTURAL SYSTEM
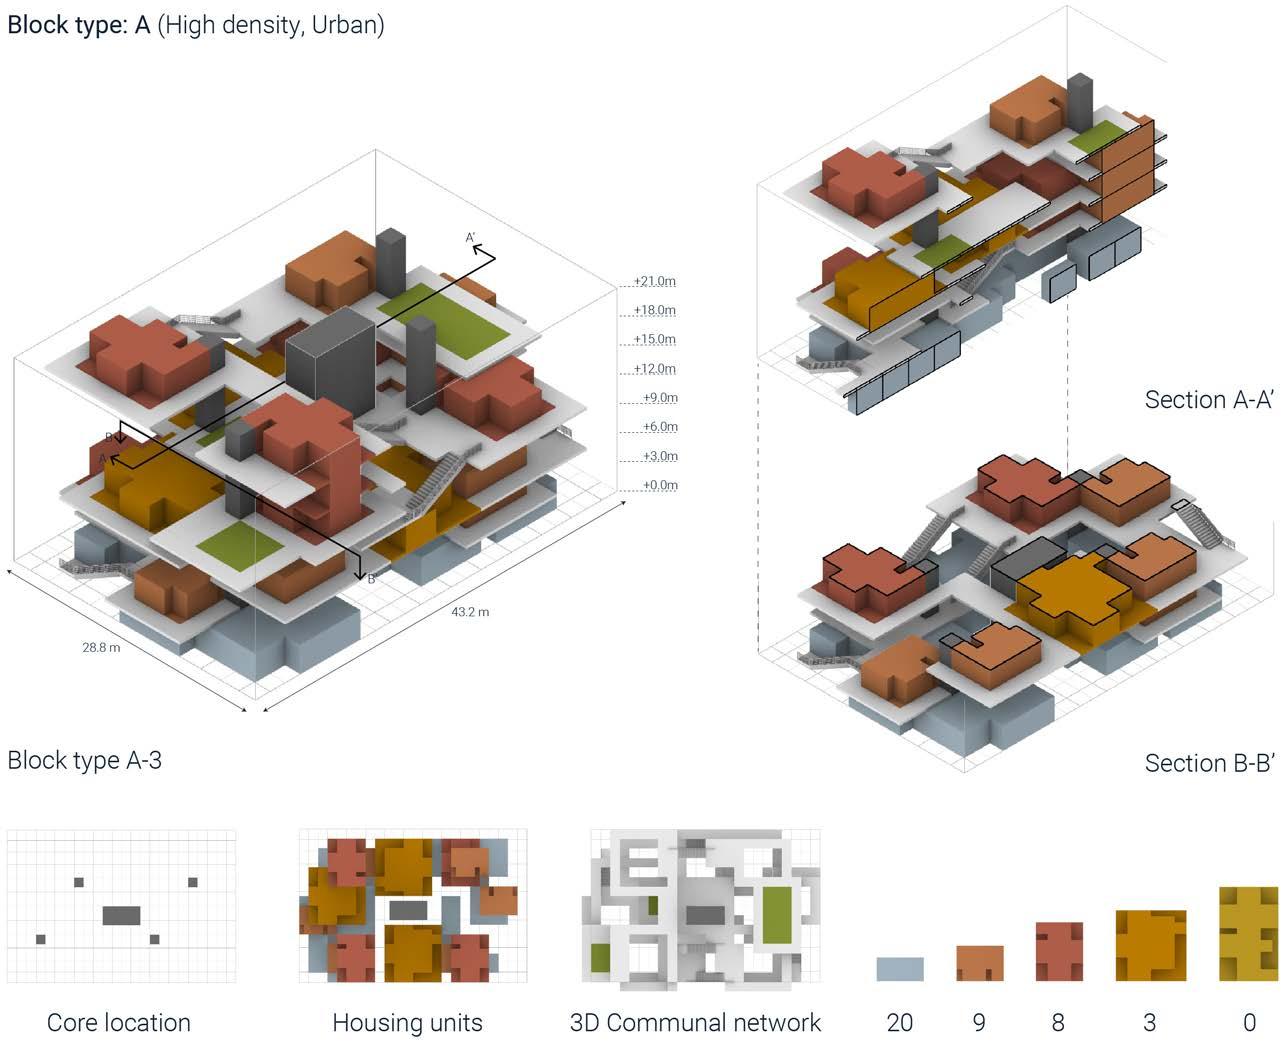
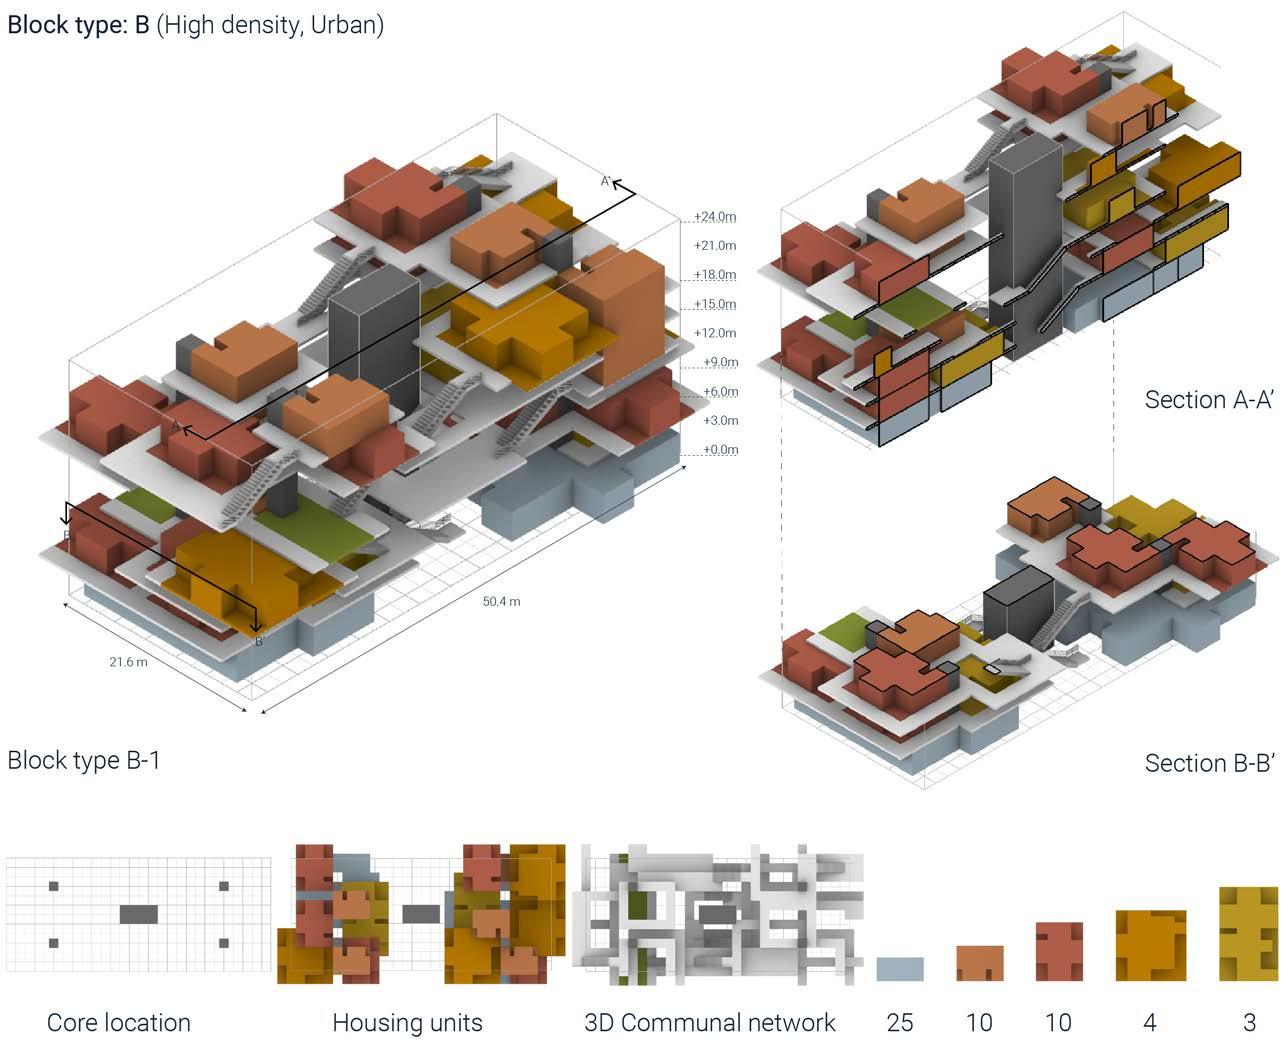
132 RIVER talise 133 Total housing area(m2): Total communal areas (m2): Total open space area (m2): 1908 1989.36 119.88 Emergent void area (m2): Floor area ratio: Private to communal space ratio: 3232 5.03 1.21 Total housing area(m2): Total communal areas (m2): Total open space area(m2): 2311 1791.72 116.64 Emergent void area (m2): Floor area ratio: Private to communal space ratio: 2931 4.64 1.55 RESEARCH DEVELOPMENT ARCHITECTURAL SYSTEM RESEARCH DEVELOPMENT ARCHITECTURAL SYSTEM
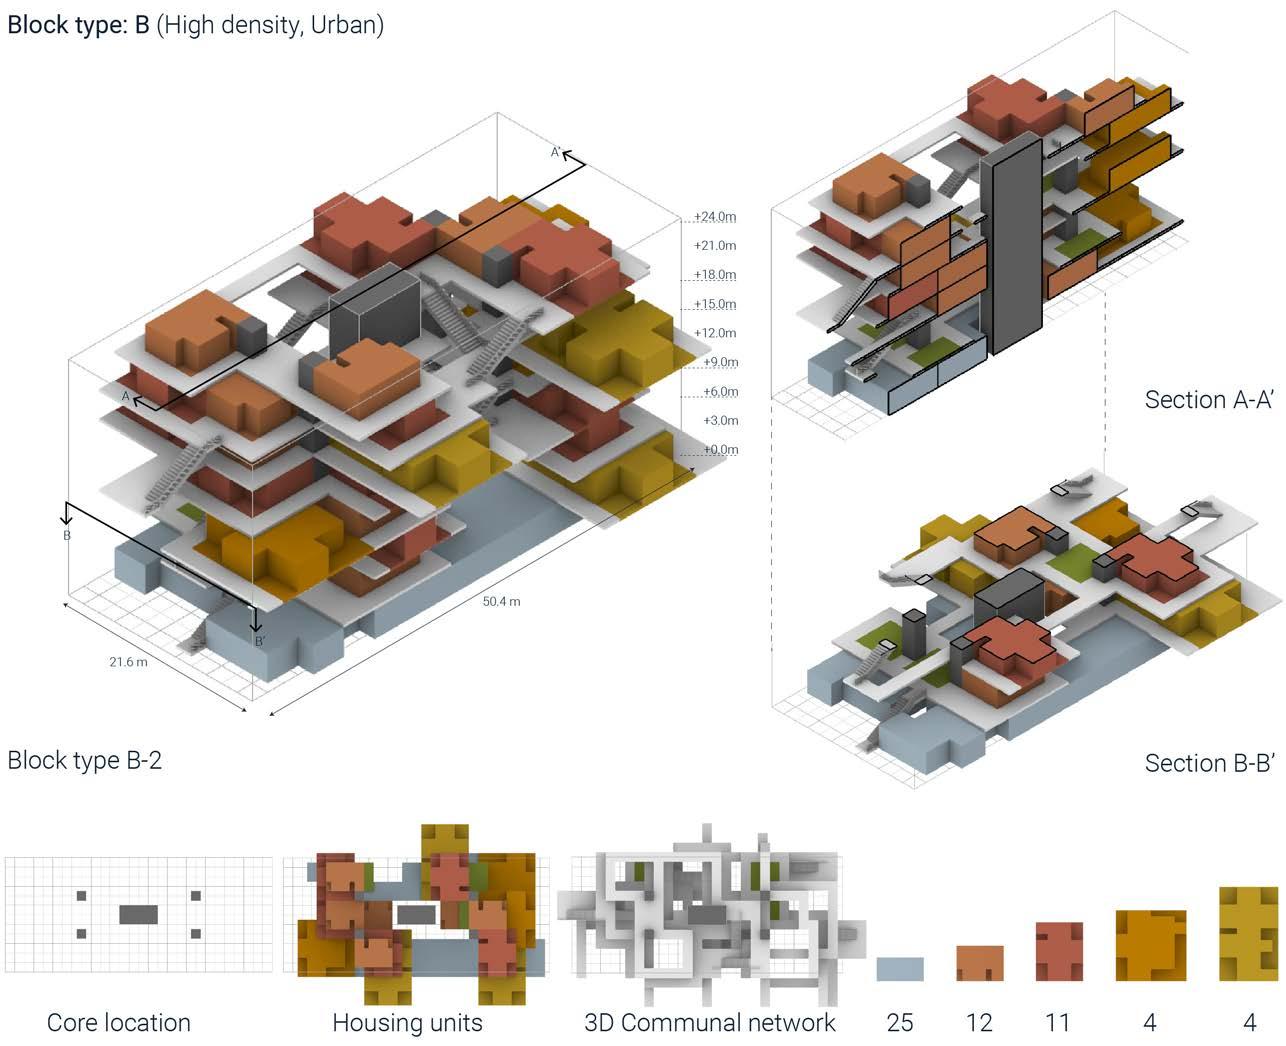
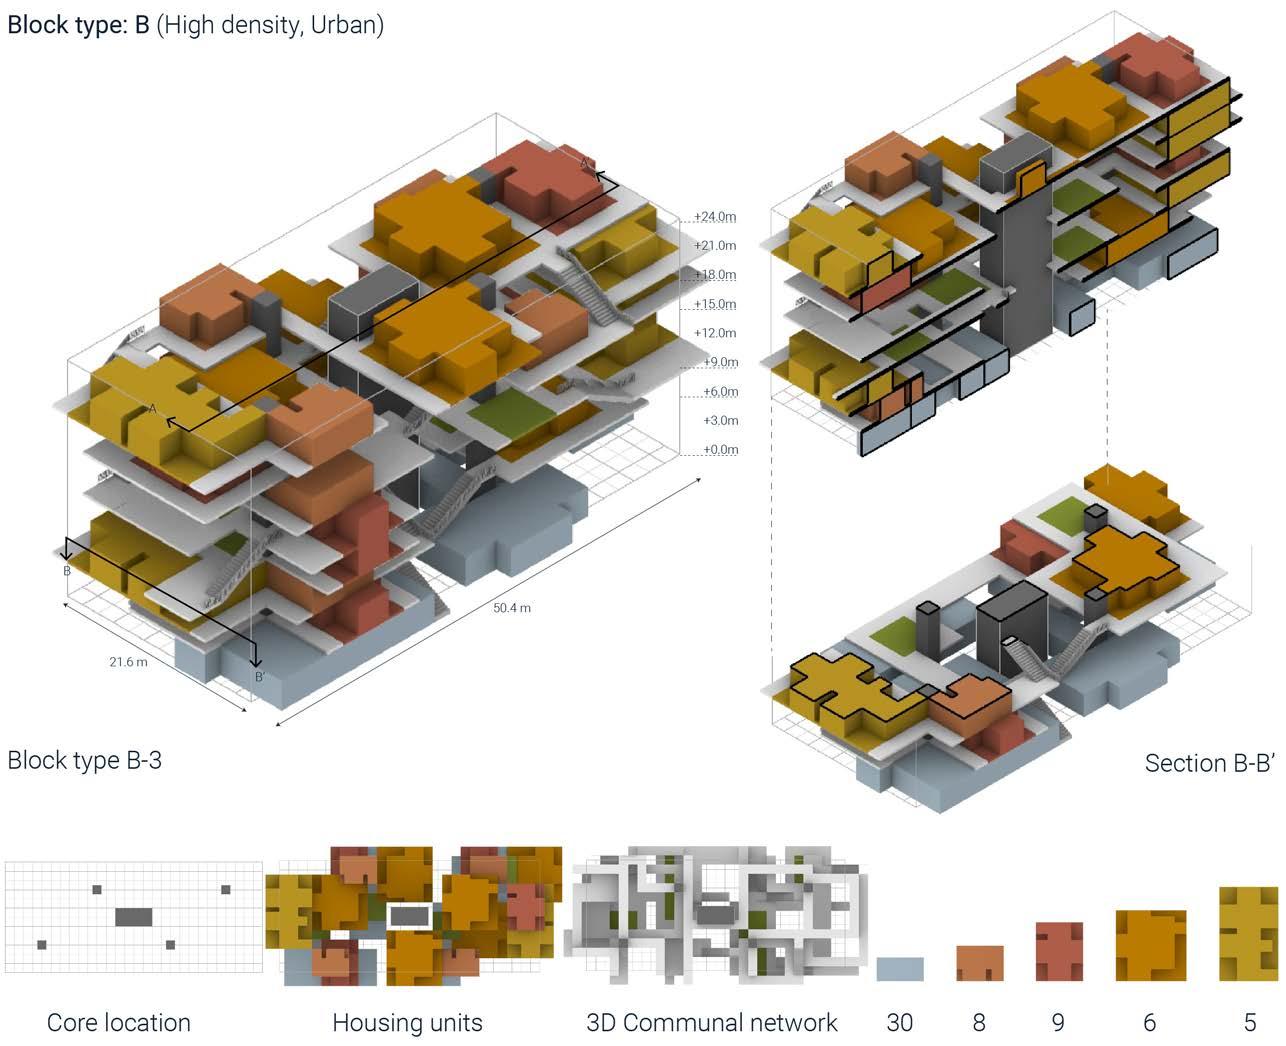
134 RIVER talise 135 Total housing area(m2): Total communal areas (m2): Total open space area (m2): 2257 2180.52 204.12 Emergent void area (m2): Floor area ratio: Private to communal space ratio: 2607 5.61 1.27 Total housing area(m2): Total communal areas (m2): Total open space area(m2): 2183 2219.4 116.64 Emergent void area (m2): Floor area ratio: Private to communal space ratio: 2730 5.49 1.21 RESEARCH DEVELOPMENT ARCHITECTURAL SYSTEM RESEARCH DEVELOPMENT ARCHITECTURAL SYSTEM
4.3.7 CONCLUSION
One of the potential issues of creating an open build system involving user self-build is the emergence of vertical slums due to the degree of freedom allowed for the users. To overcome this, the architectural system was developed by controlling the aggregation of spaces on the housing unit scale. The provision of utility core not only makes construction easier, but also regulates the aggregation of housing units. On top of this planned spatial distribution at building / housing unit scale, the user has the freedom to customise their house within the boundaries, which allows them to bring their character into the building and the community.
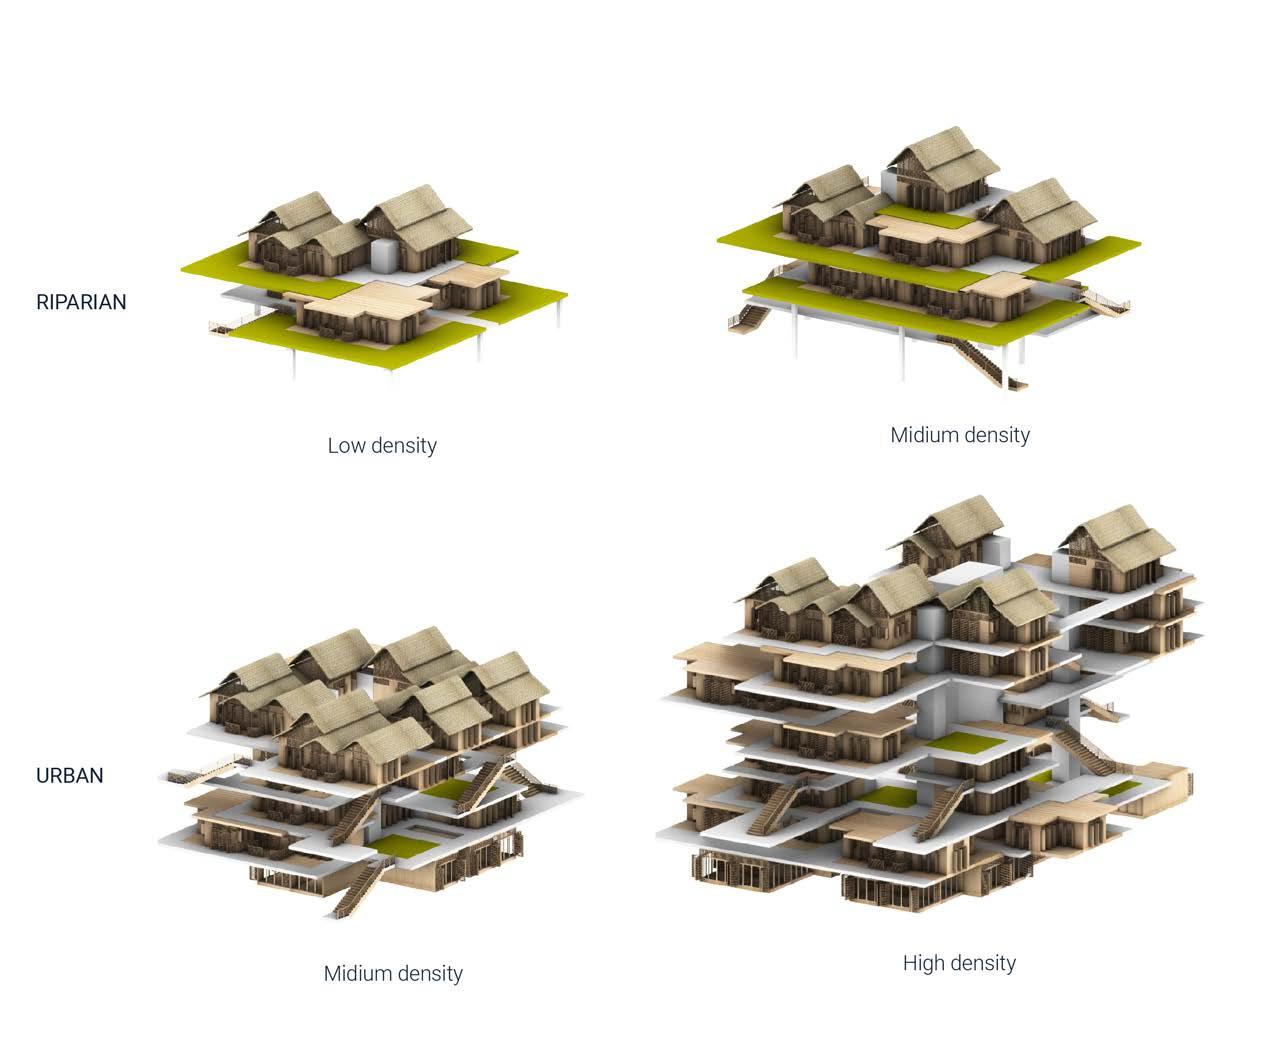
Another issue of building in a tropical climate is the thermal comfort of the users. In an uncontrolled self-built community, crowded spaces often occur with little room that encourages air flow. Again, this was managed on a building scale, along with the programmatic distribution within the building system, the resultant emergent voids were an important criterion while evaluating different housing aggregations.
Finally, informality in terms of communal and social spaces is an important aspect of the local social context. This was approached by distributing the communal spaces at all levels to form a 3D street network. Compared to the existing housing projects Rusunawa / Rusunami, the proposed architectural system provides more informal social spaces that are more easily accessed from each housing unit.
136 RIVER talise 137
RESEARCH DEVELOPMENT ARCHITECTURAL SYSTEM RESEARCH DEVELOPMENT ARCHITECTURAL SYSTEM M edium density M edium density
INTEGRATION
Following the individual experiments at an urban scale (flood risk assessment, hydrological network and street network) and architectural scale (housing aggregation, building system for different risk zones), synthesis of the strategies was explored to allow integration of the solutions on the two scales. This was approached by experimenting with a generation of building plots in mid-risk riparian zones and low-risk urban areas. Followed by distribution of previously generated aggregations on building scale on the urban fabric with a multi objective optimization through genetic algorithm (GA). The GA experiment considers the relationship between building morphologies and their placement based on attributes of urban fabric. The outcome of the GA experiment is the housing aggregation distribution on the extent of the site. Additionally, a post analysis is conducted on selected solutions to choose a solution which will form the basis of architectural proposal.
5.1.1 INTEGRATION EXPERIMENT
5.1.2 FITNESS OBJECTIVES
5.1.3 SELECTED RESULTS
5.1.4 SOLAR RADIATION ANALYSIS
5.1.5 EVALUATION
138 RIVER talise 139 DOMAIN CONTEXT DOMAIN CONTEXT
5.1.1 INTEGRATION EXPERIMENT
The integrated system experiment is carried out in the following steps:
Firstly, appropriate block types are identified for each risk zone identified on the urban patch. This is followed by the definition of the building plot configurations (plot size and no. of floors) using a rectangle packing algorithm (refer appendix), within initially generated clusters (or RTs). The different configurations of plot types as shown in different colors on the right page are distributed in relation to the associated risk zones.
RIPARIAN ZONE
The distribution of plots in the riparian zones is guided by the terraced landscape in the area. The placement of the plot configuration is done parallel to the river edge taking into account the view-factor to the surrounding river and to also avoid overlapping between the plot arrangement. Due to the general higher flood risk in this area, building plot typologies in these clusters are the low and medium density buildings.
URBAN ZONE
Buildings in these clusters are distributed through grids that are aligned with the neighbouring street network. The clusters or RTs thus formed by street network acts as boundary condition for distribution of plot configurations. As the flood risk is relatively low in these clusters, high and medium density building plots will be distributed.
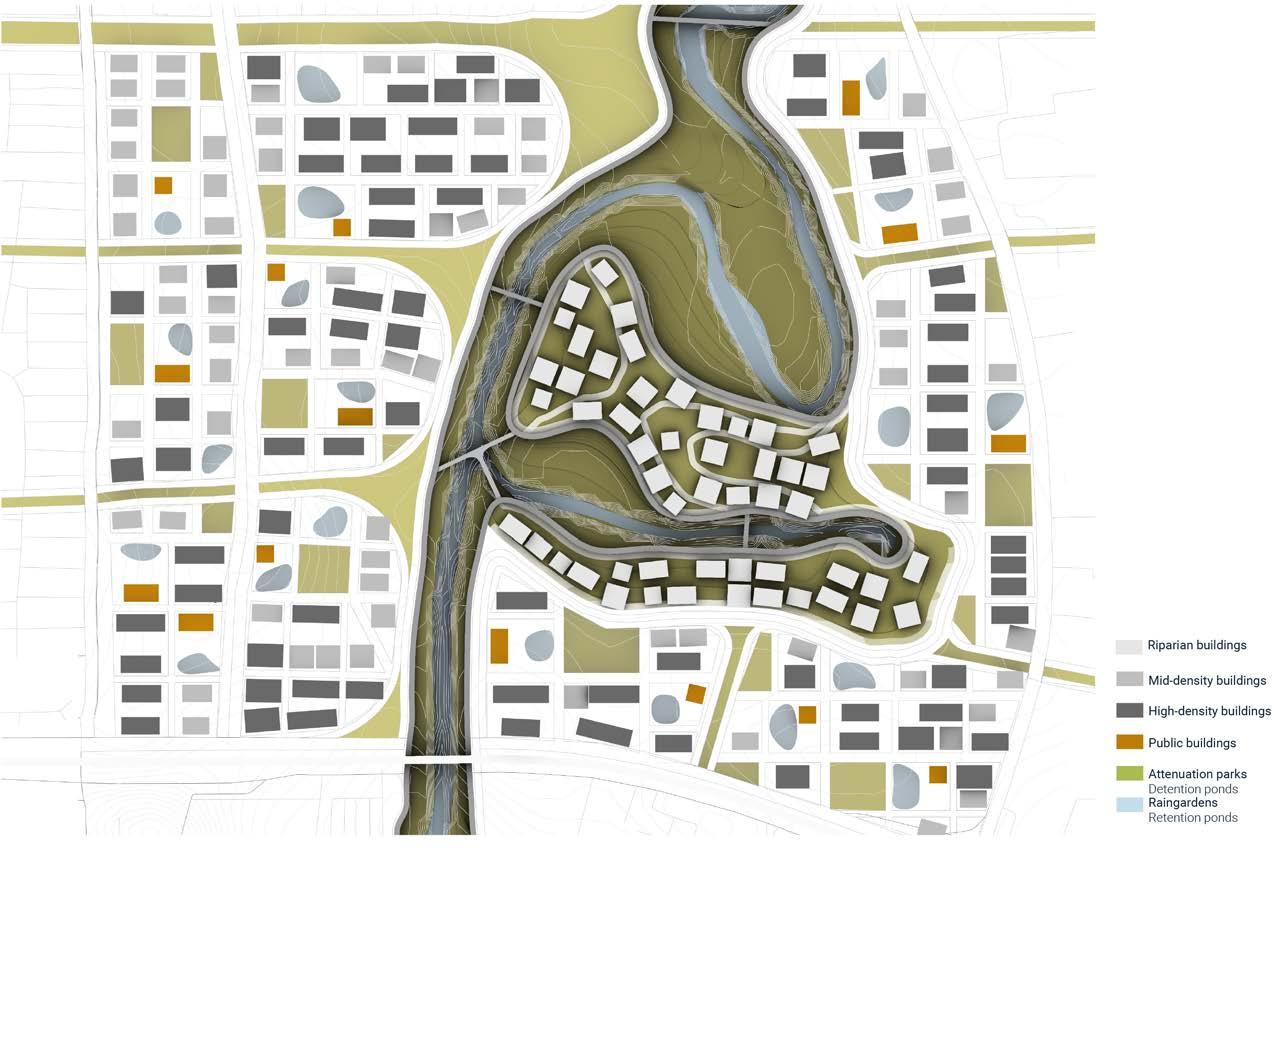
The experiment is conducted using genetic algorithm to achieve multiobjective optimization. After establishing building plot configurations within each cluster (or RT), a housing aggregation appropriate for the plot configuration is selected from the pool of the previously generated housing aggregation on building block scale.
The experiment is carried out to generate 100 generations of 10 individuals per generation. In addition to the extraction of selected individuals, various post analyses are conducted to select one individual which will form the basis of the architectural design proposal. Considering the resultant communal pathway in the selected result, elevated walkways are created through connections between shared spaces on the first and second floors of adjacent buildings.
140 RIVER talise 141
RESEARCH DEVELOPMENT INTEGRATION RESEARCH DEVELOPMENT INTEGRATION
fig 5.1.1 (right): Distribution of residential blocks in riparian and urban clusters
5.1.2 FITNESS OBJECTIVES The three fitness objectives of the genetic algorithm are as follows:
1. Minimize solar gain received by the housing units
Considering the hot and humid climatic conditions of the site, one of the fitness criteria was to minimize the overall solar gain received by the aggregations for increased shading within the dense urban areas and better thermal comfort within the housing units. The abstraction method is further examined by solar studies of the selected results from the genetic algorithm.
2. Housing density suitability
Taking into account the differentiated flood risks within the urban fabric, the amount of housing units distributed should be consistent with its associated risk zones. For instance, higher risk zones should have less housing units due to the unfavorable conditions in these zones during a flood event.
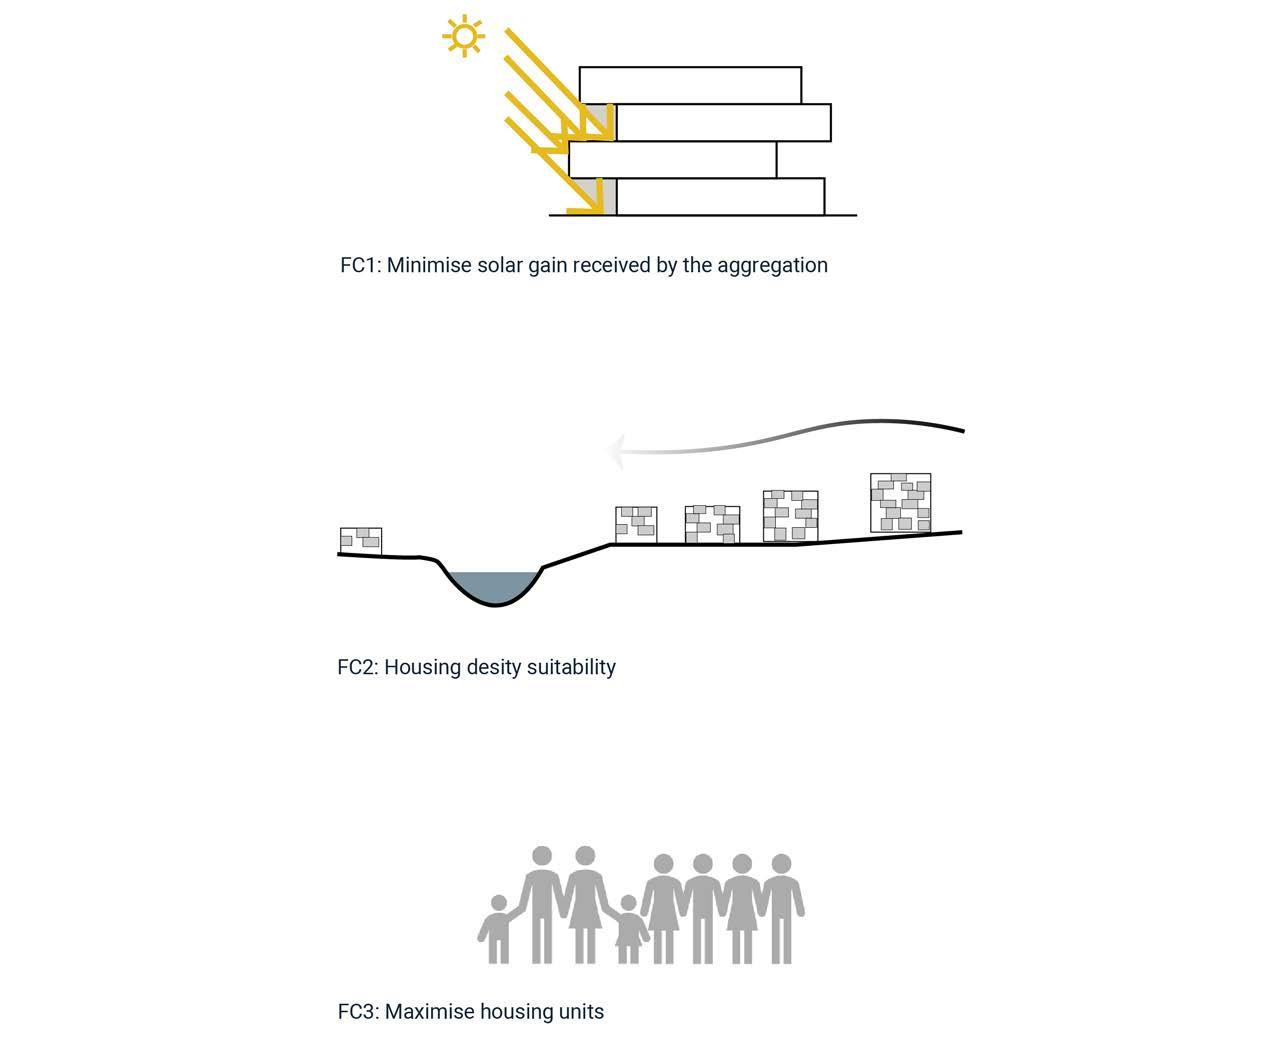
3. Maximize housing units
The last criterion that has been introduced is to maximize built housing areas, in order to accommodate for the requirements of current population growth.
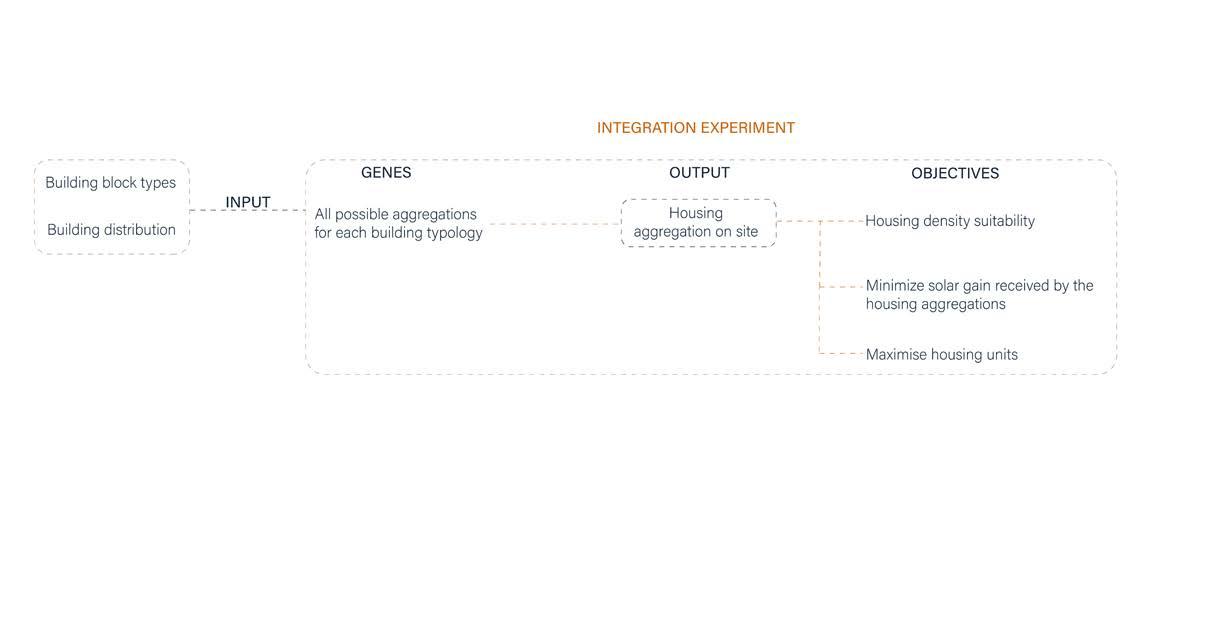
142 RIVER talise 143
RESEARCH DEVELOPMENT INTEGRATION RESEARCH DEVELOPMENT INTEGRATION
fig 5.1.2 (left): Gene chart fig 5.1.3 (right): Fitness objective for mutli-objective optimisation
5.1.3 SELECTED SOLUTIONS
The experiment is carried out to generate 100 generations of 10 individuals per generation. A few fittest individuals are extracted from the simulation. Based on the diamond fitness graphs for the fittest individuals for each fitness criteria, it can be observed that the fitness objective one and two correspond. For instance, the fittest individual for FC1 performs quite well for FC2 and vice versa. However, a solution that performs well with respect to FC1 and FC2 performs badly for FC3. Hence, a few globally fittest individuals are extracted which address all the fitness objectives equally.
Another observation on the GA experiment was that the solution for average fitness ranks is an individual from the last generation (Gen 99|Ind8). Additionally, most of the fittest individuals were of the last few generations of results. This also denotes that the simulation was moving towards optimization.
The primary difference between the selected results lies in distribution of housing aggregation on the urban context and consequently distribution of voids with the building system. The emergent voids will have an impact on ventilation, especially in dense urban areas.
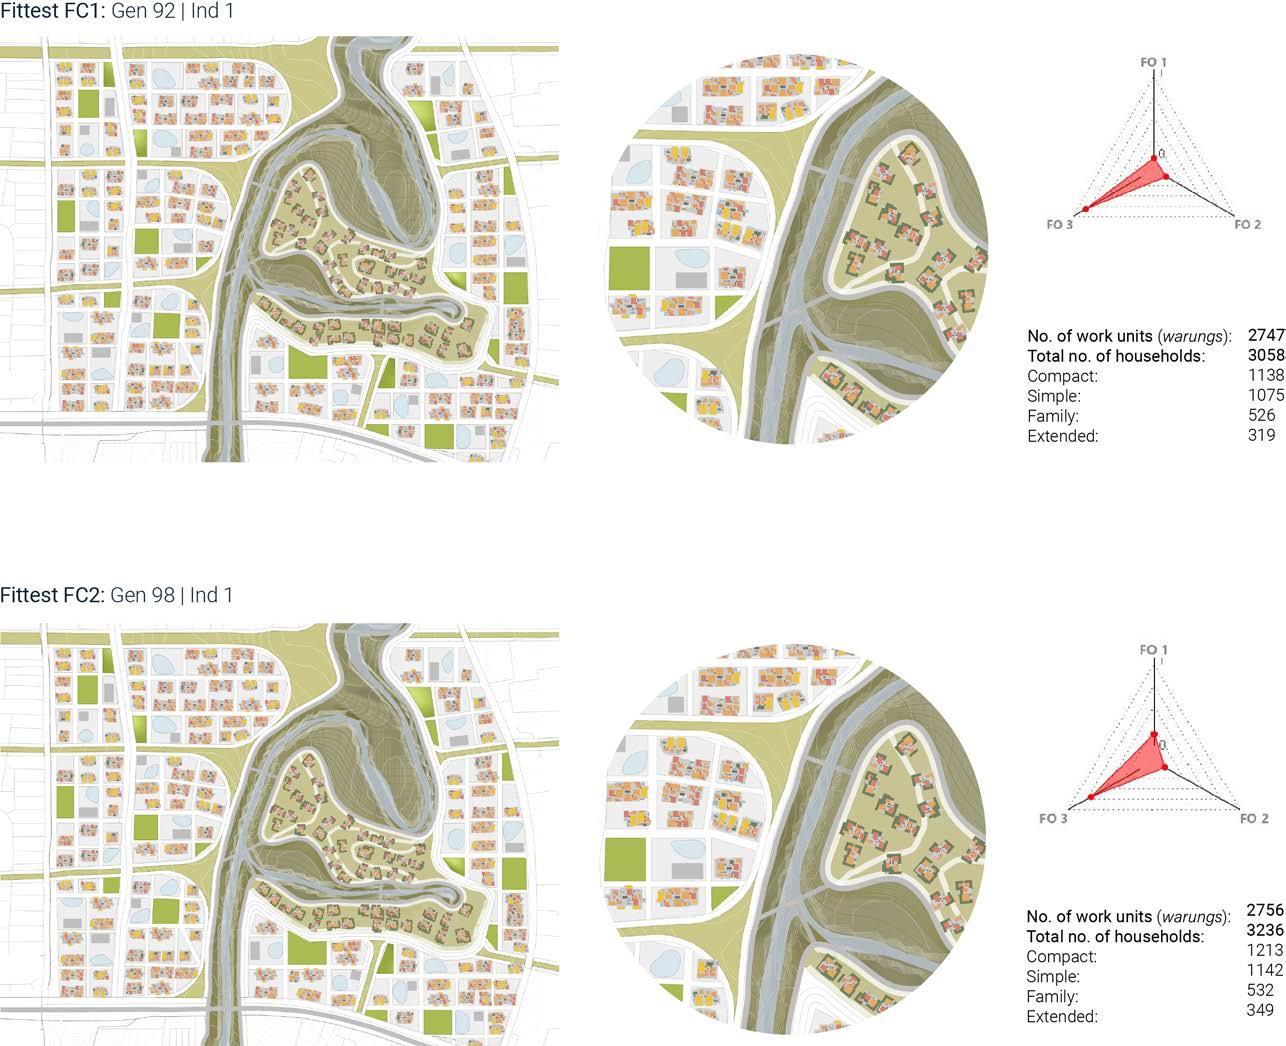
144 RIVER talise 145
fig 5.1.4 (right, 146-147): Selected results
RESEARCH DEVELOPMENT INTEGRATION RESEARCH DEVELOPMENT INTEGRATION
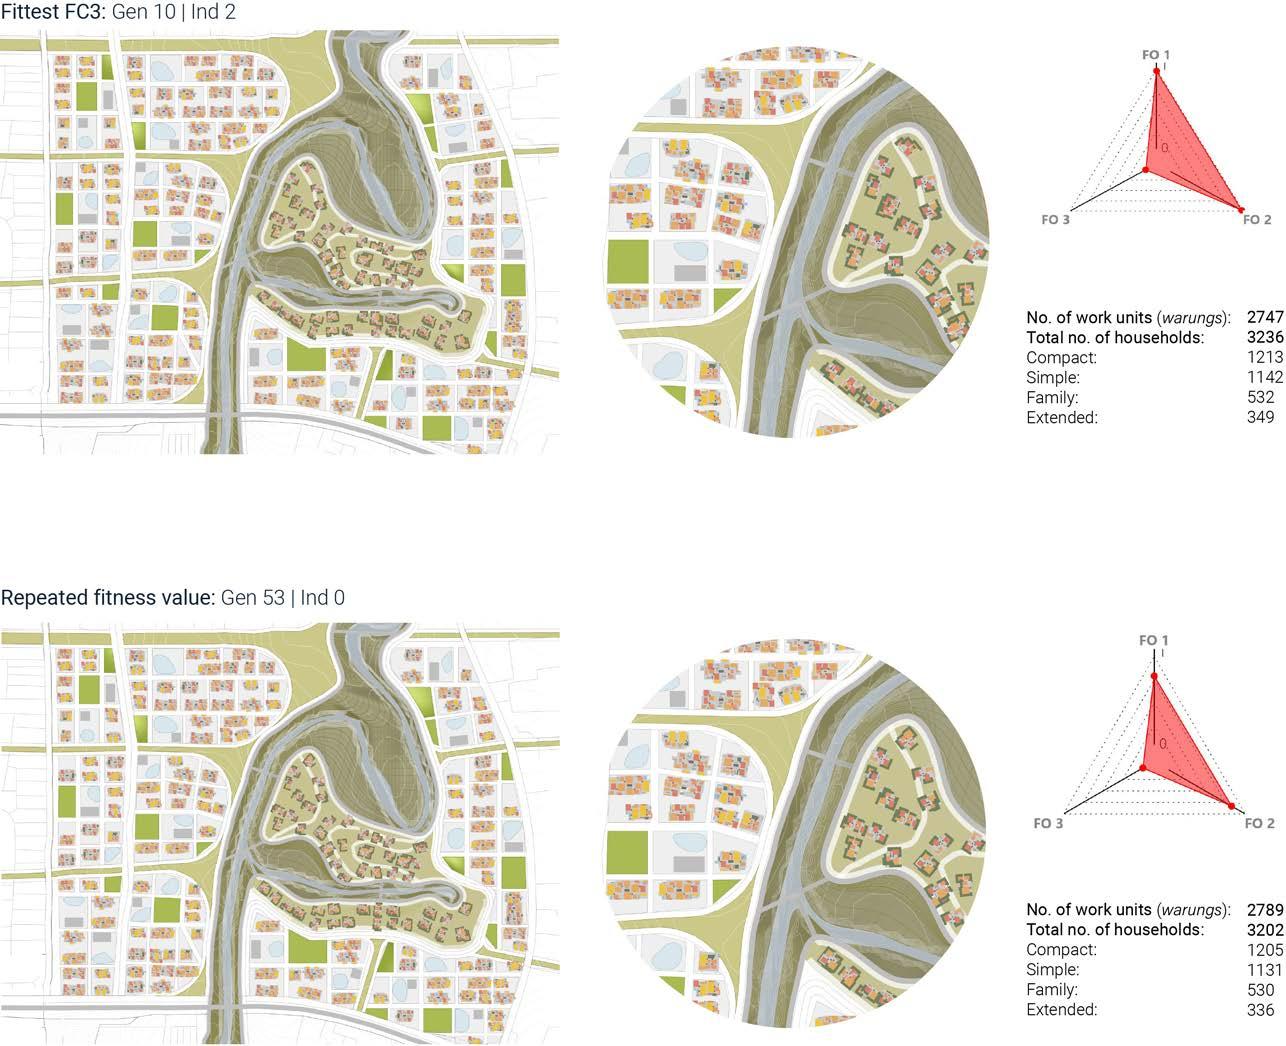
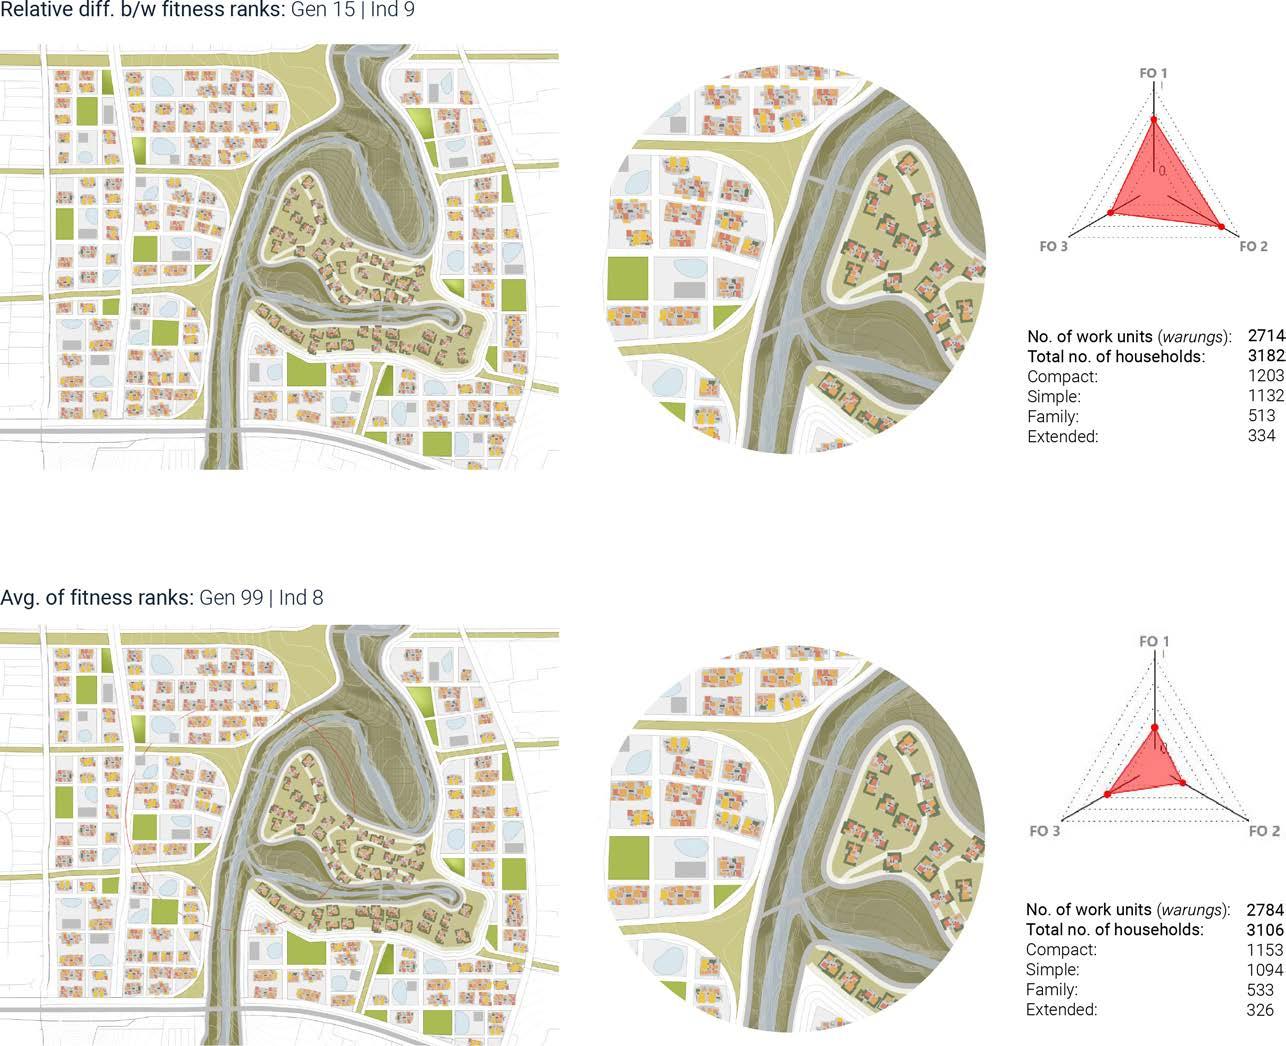
146 RIVER talise 147 RESEARCH DEVELOPMENT INTEGRATION RESEARCH DEVELOPMENT INTEGRATION
5.1.4 SOLAR RADIATION ANALYSIS
Another issue of building in a tropical climate is the outdoor thermal comfort. The objective is to create as much shaded areas as possible to minimize the solar exposure of the ground floor. An adequately shaded area will also encourage outdoor communal interaction. Thus, a post analysis was carried out to measure the solar exposure of the ground floor within the clusters.
The analysis was carried out for the month of September, which is also the hottest month on the site. Although there are only minute differences in radiation analysis, total ground solar exposure was calculated to evaluate the solutions better. The fittest individual for the FC3, which was to maximize housing units, performs the best in radiation analysis as it has the minimum value for ground solar exposure. However, this individual is unfit with respect to the first and second objectives and hence was not selected.
The solution which addresses all fitness objectives equally (Average of fitness ranks: Gen 99| Ind 8) also performs relatively well for ground solar exposure and thus was selected to form the basis of architectural proposal.
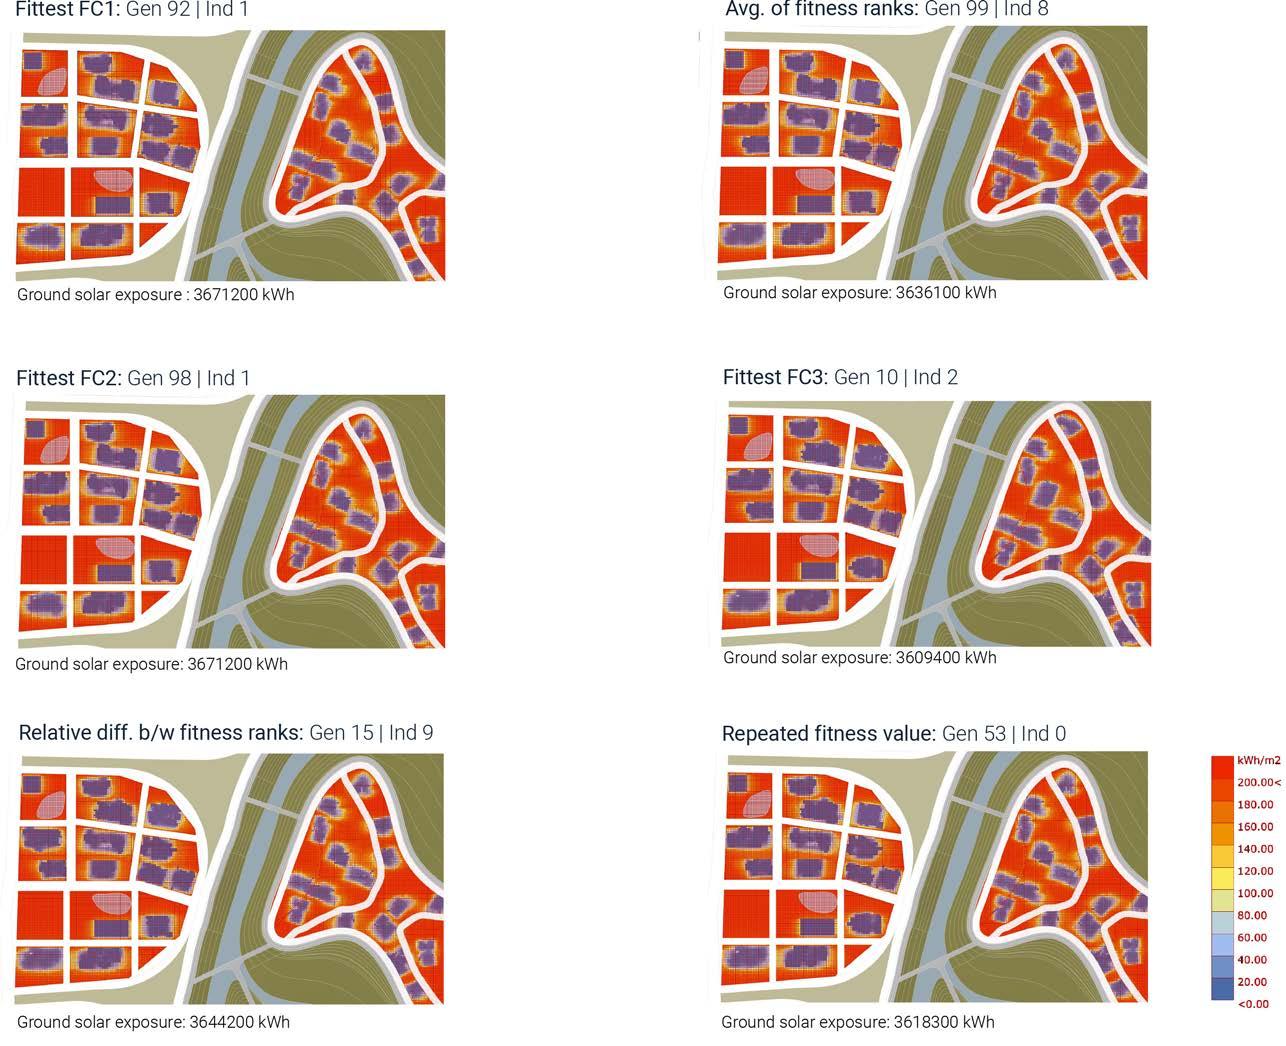
148 RIVER talise 149 RESEARCH DEVELOPMENT INTEGRATION RESEARCH DEVELOPMENT INTEGRATION
fig 5.1.5: Ground solar exposure analysis on generated blocks
5.1.5 EVALUATION
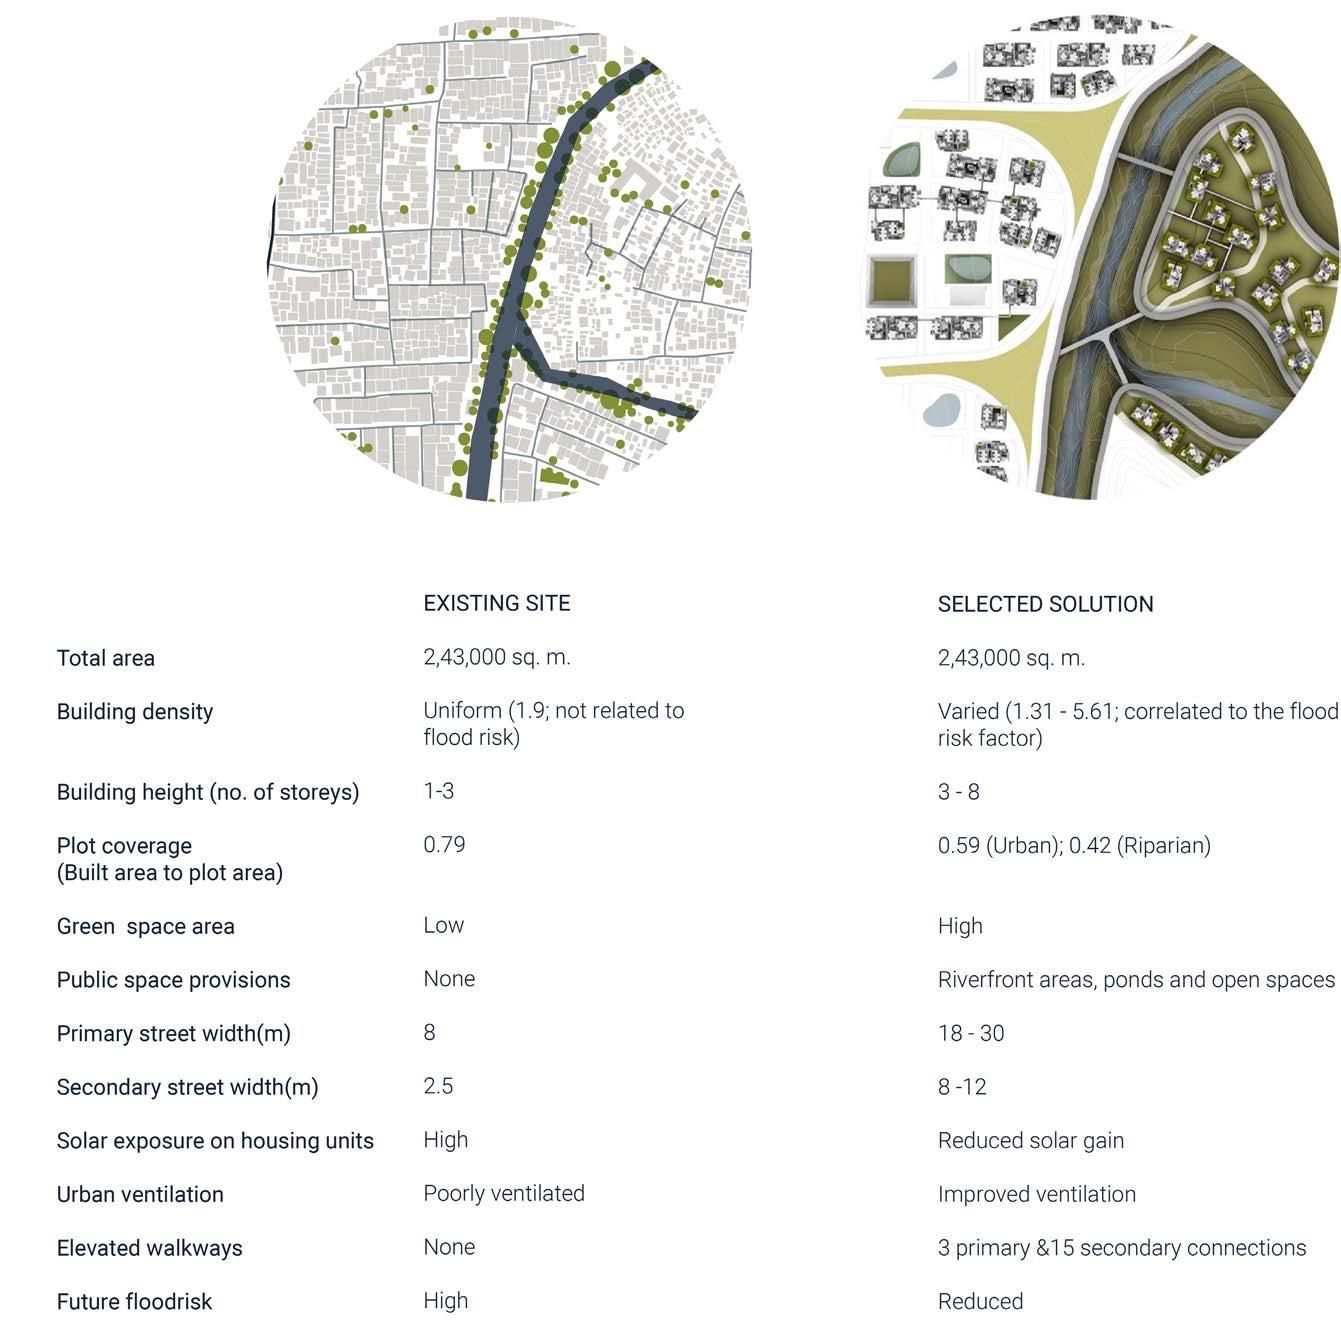

150 RIVER talise 151 RESEARCH DEVELOPMENT INTEGRATION RESEARCH DEVELOPMENT INTEGRATION
fig 4.1.18 (left): Selected solution fig 4.1.19 (right): Existing site vs selected solution
DESIGN PROPOSAL
This chapter presents sets of drawing: plans, sections, and perspectives, and renders to depict the final design proposal. The results of the research development experiments were taken further and complemented with many detailed design decisions.
At urban scale, the plans and sections will demonstrate the full scale of the design proposed, outlining how the integrated urban and architectural system function as a whole in terms of flood mitigation and provision of housing for a community. In a closer look at architectural scale, the building system was illustrated with its potential in constructing an urban fabric that is both adequately well planned and vibrantly informal.
6.1 CONSTRUCTION SEQUENCE
6.2 SITE PLAN + SECTIONS
6.3 BUILDING BLOCK DESIGN
6.4 SIMULATION
152 RIVER talise 153
6.1 CONSTRUCTION SEQUENCE
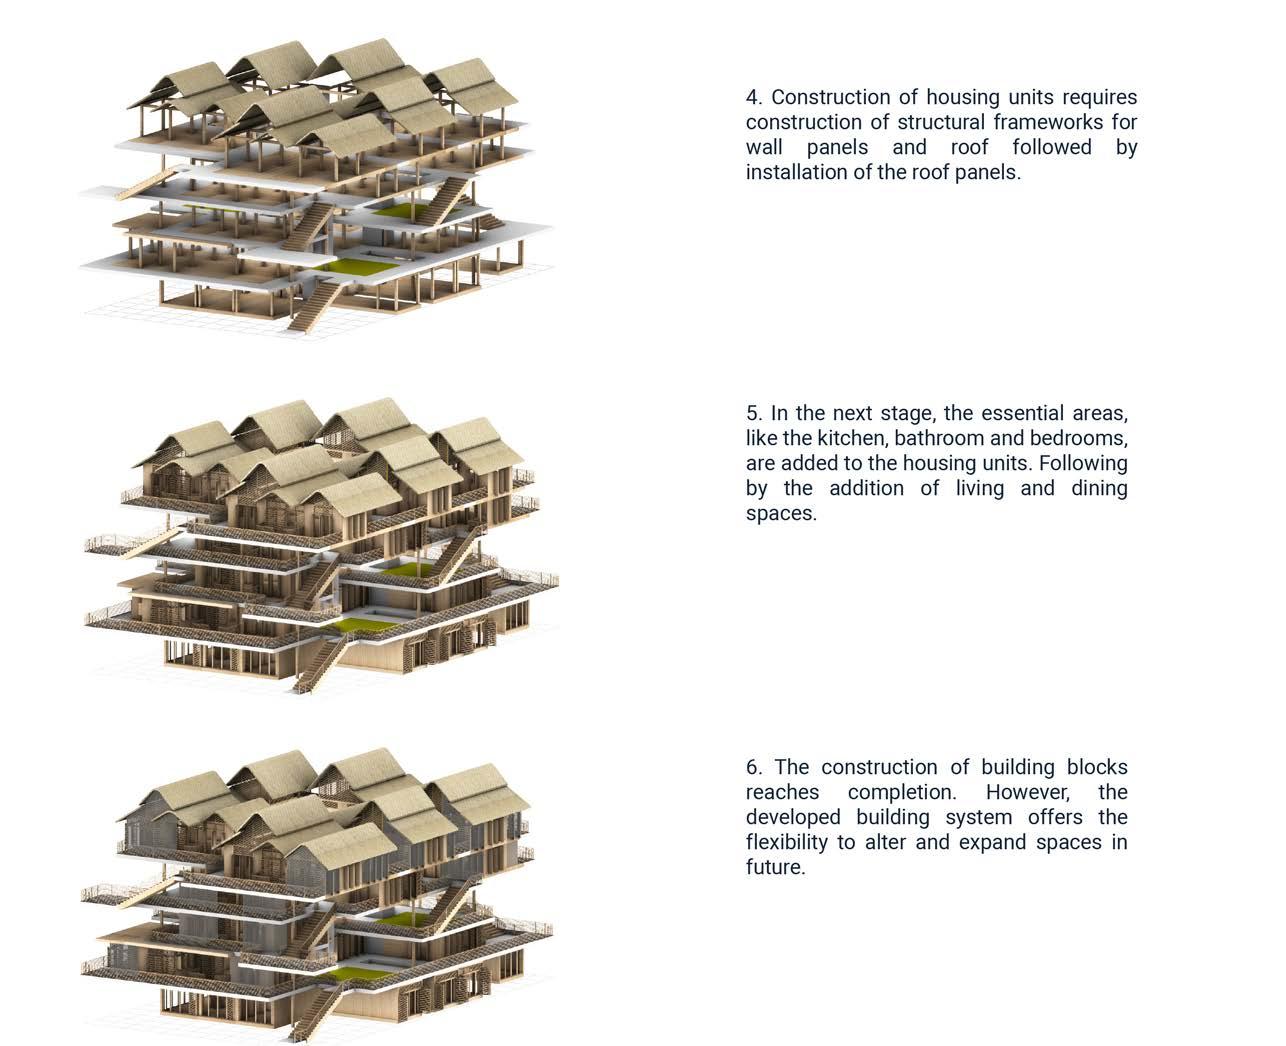
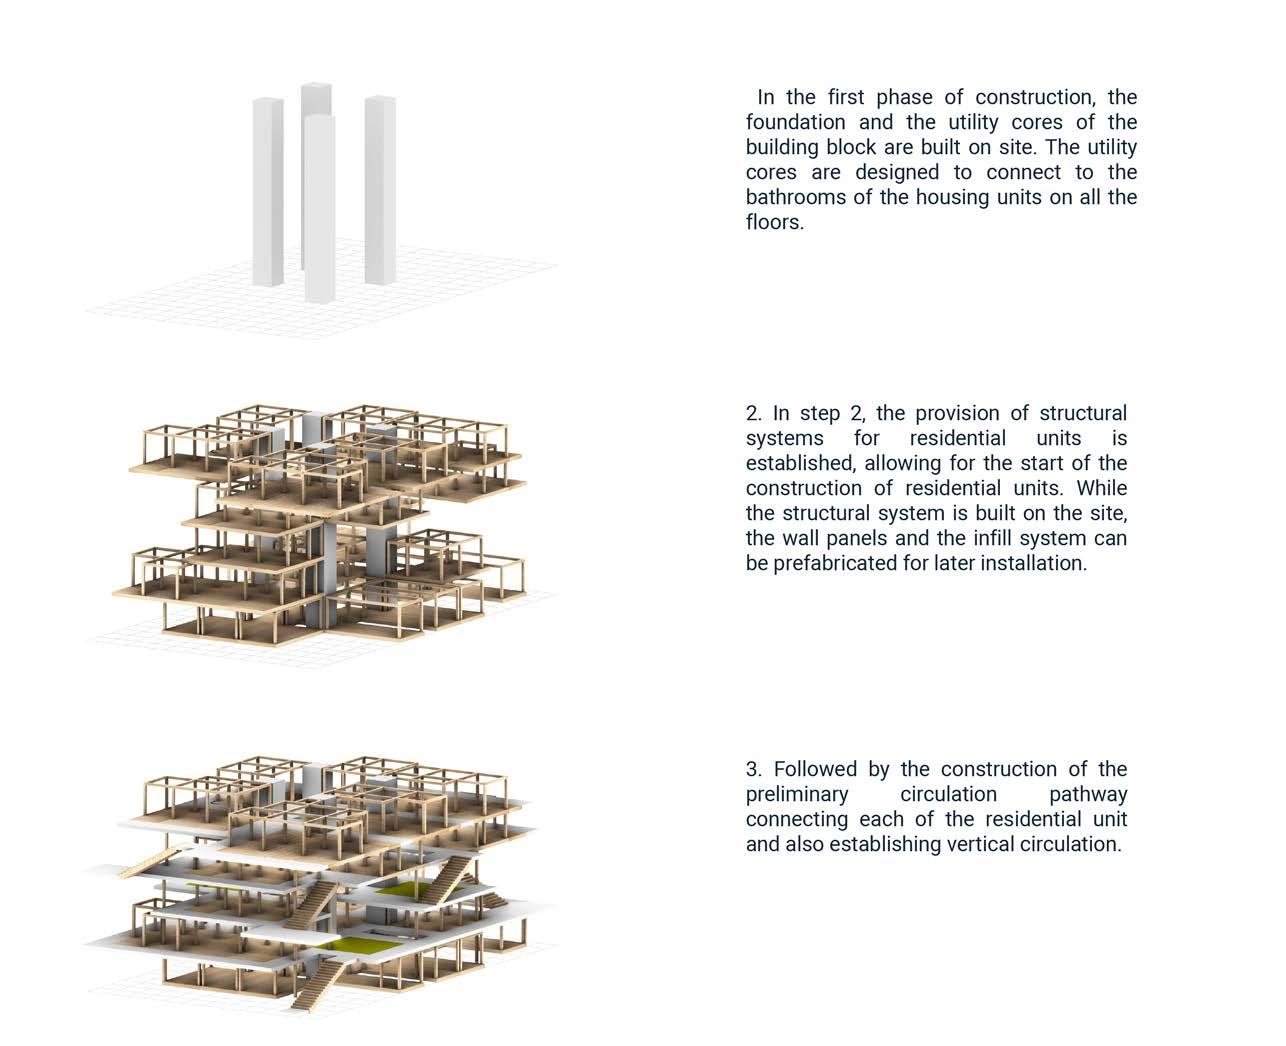
154 RIVER talise 155
DESIGN PROPOSAL CONSTRUCTION PHASE DESIGN PROPOSAL CONSTRUCTION PHASE
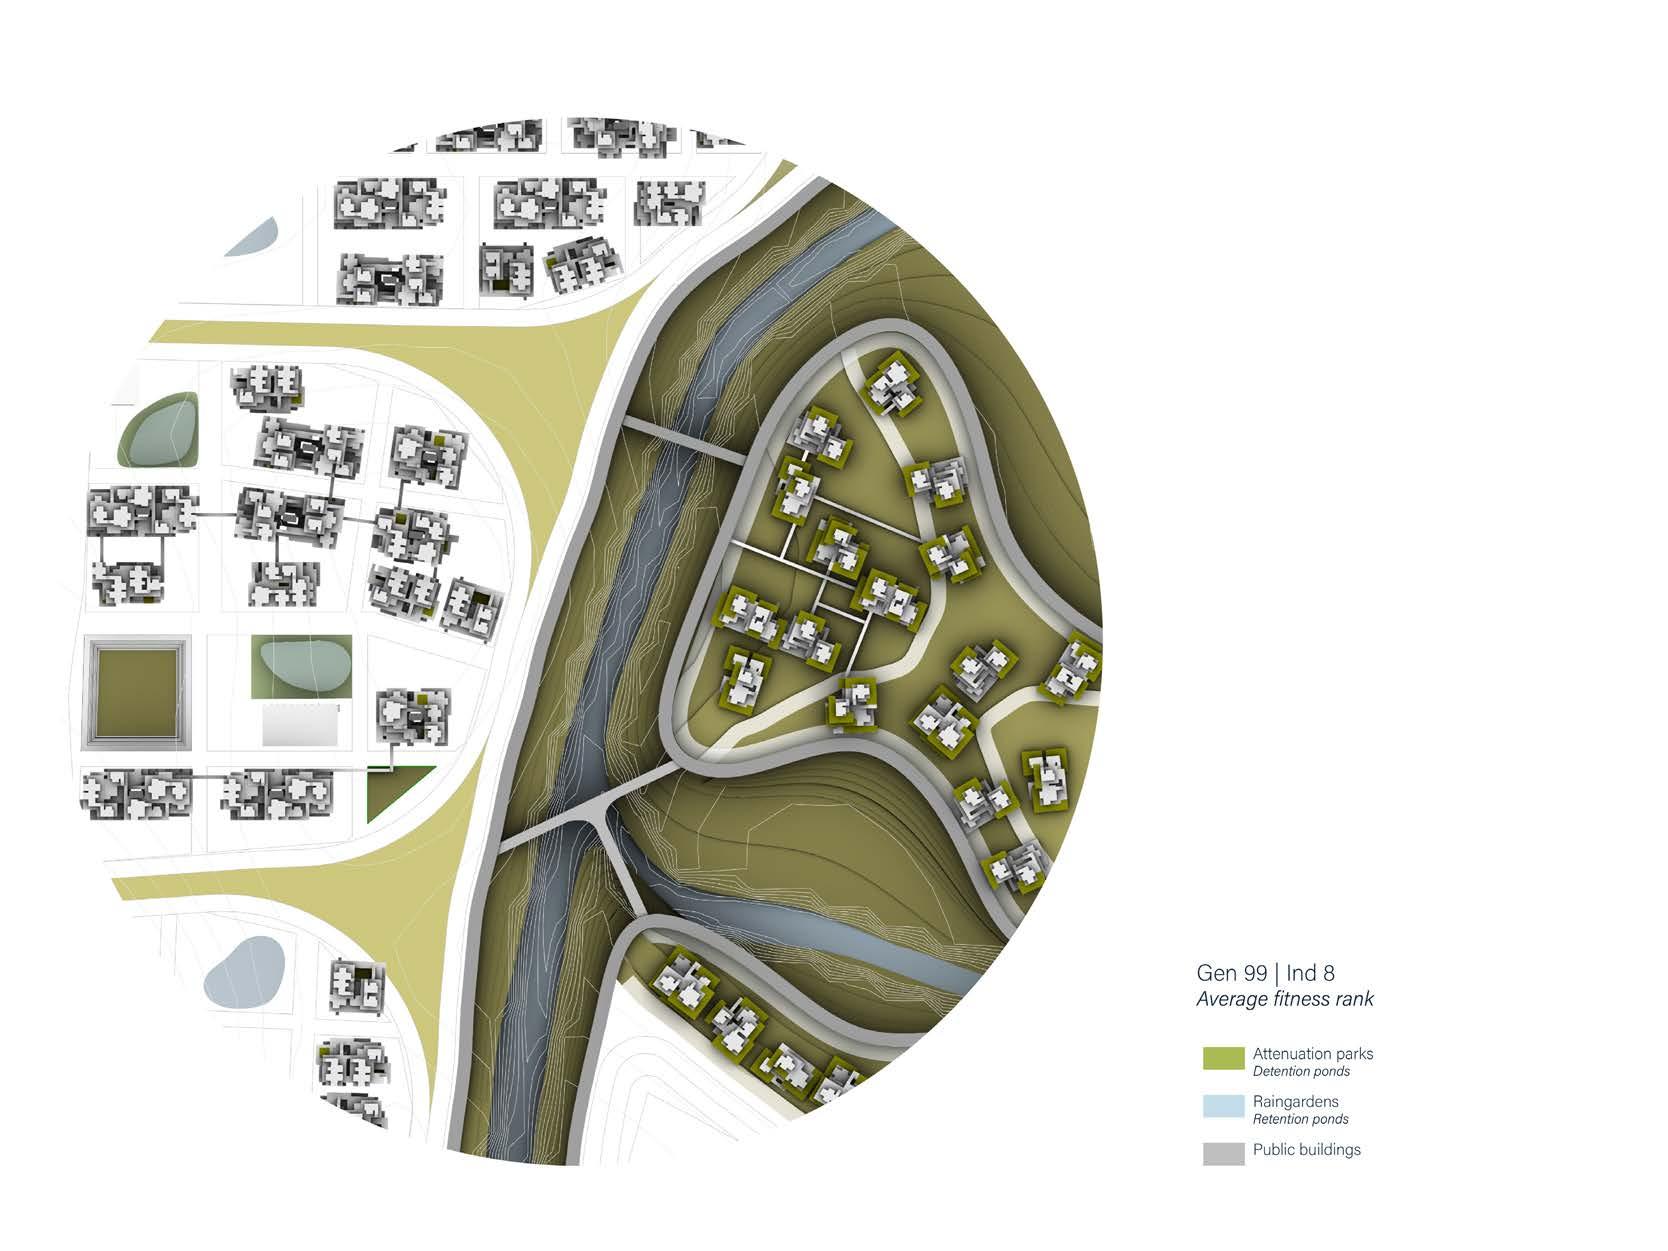
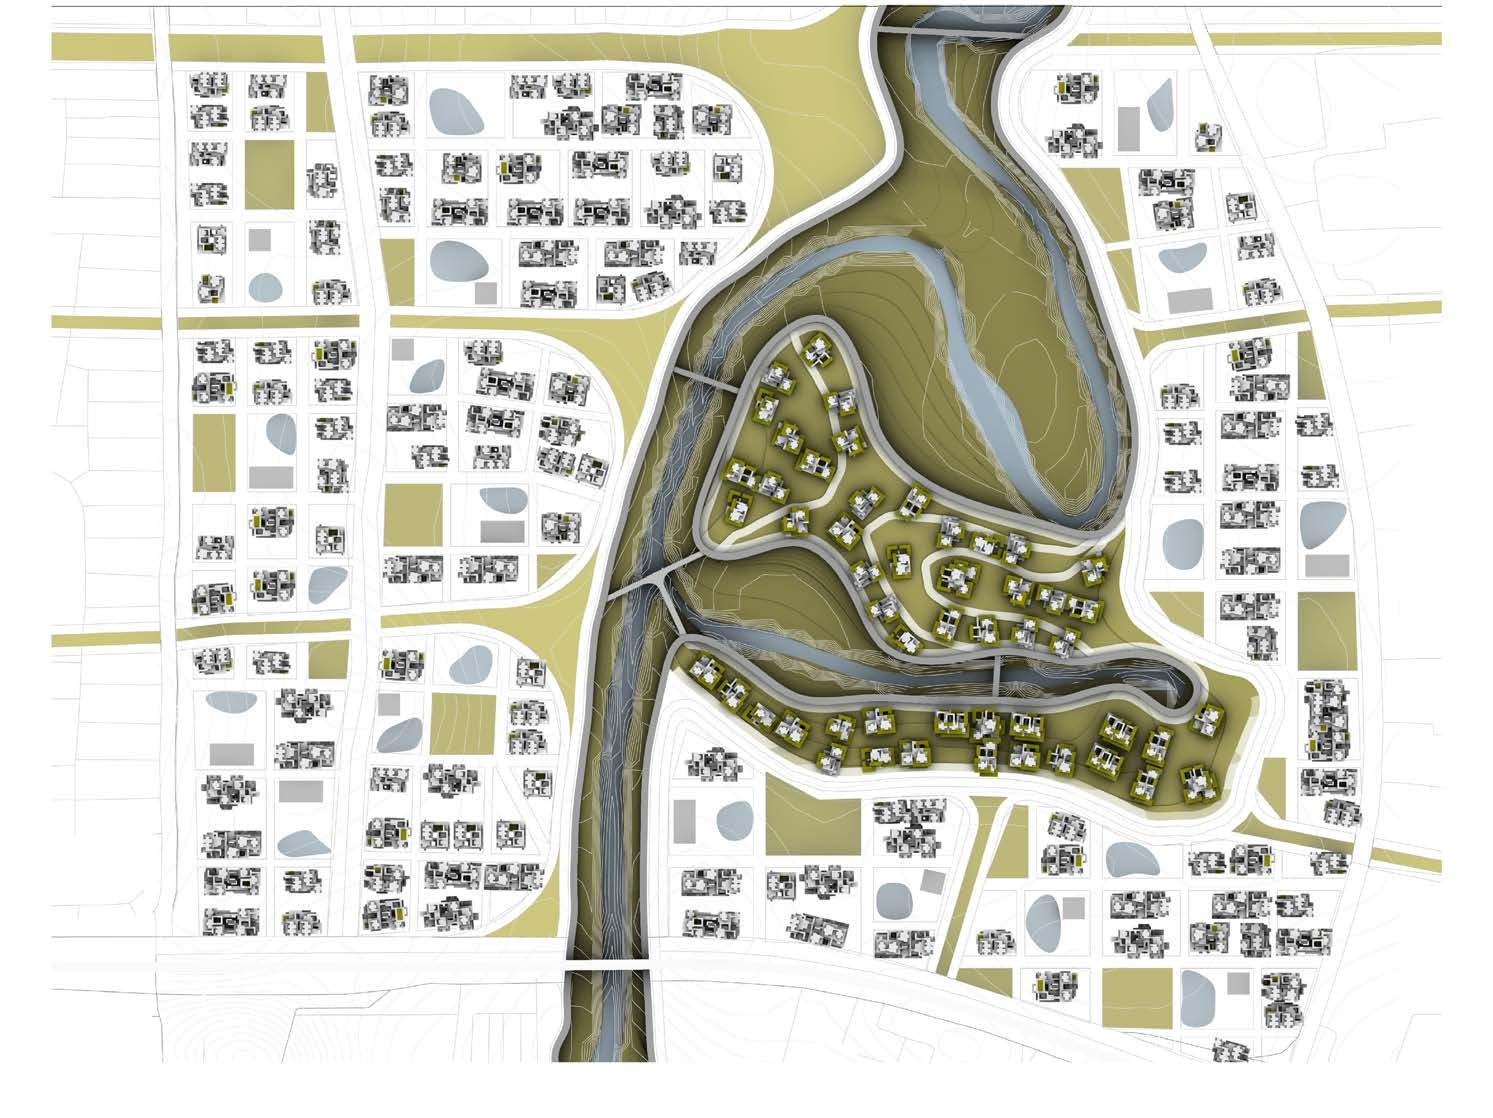
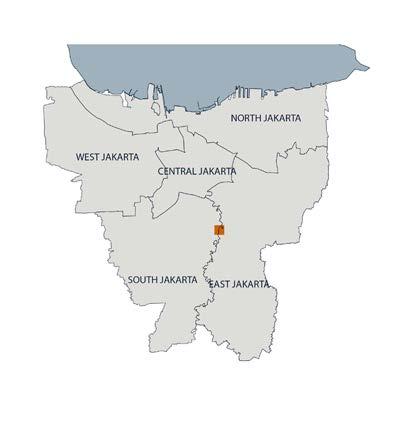
156 RIVER talise 157 DESIGN PROPOSAL | SITE PLAN + SECTIONS DESIGN PROPOSAL | SITE PLAN + SECTIONS
6.2 SITE PLAN + SECTIONS
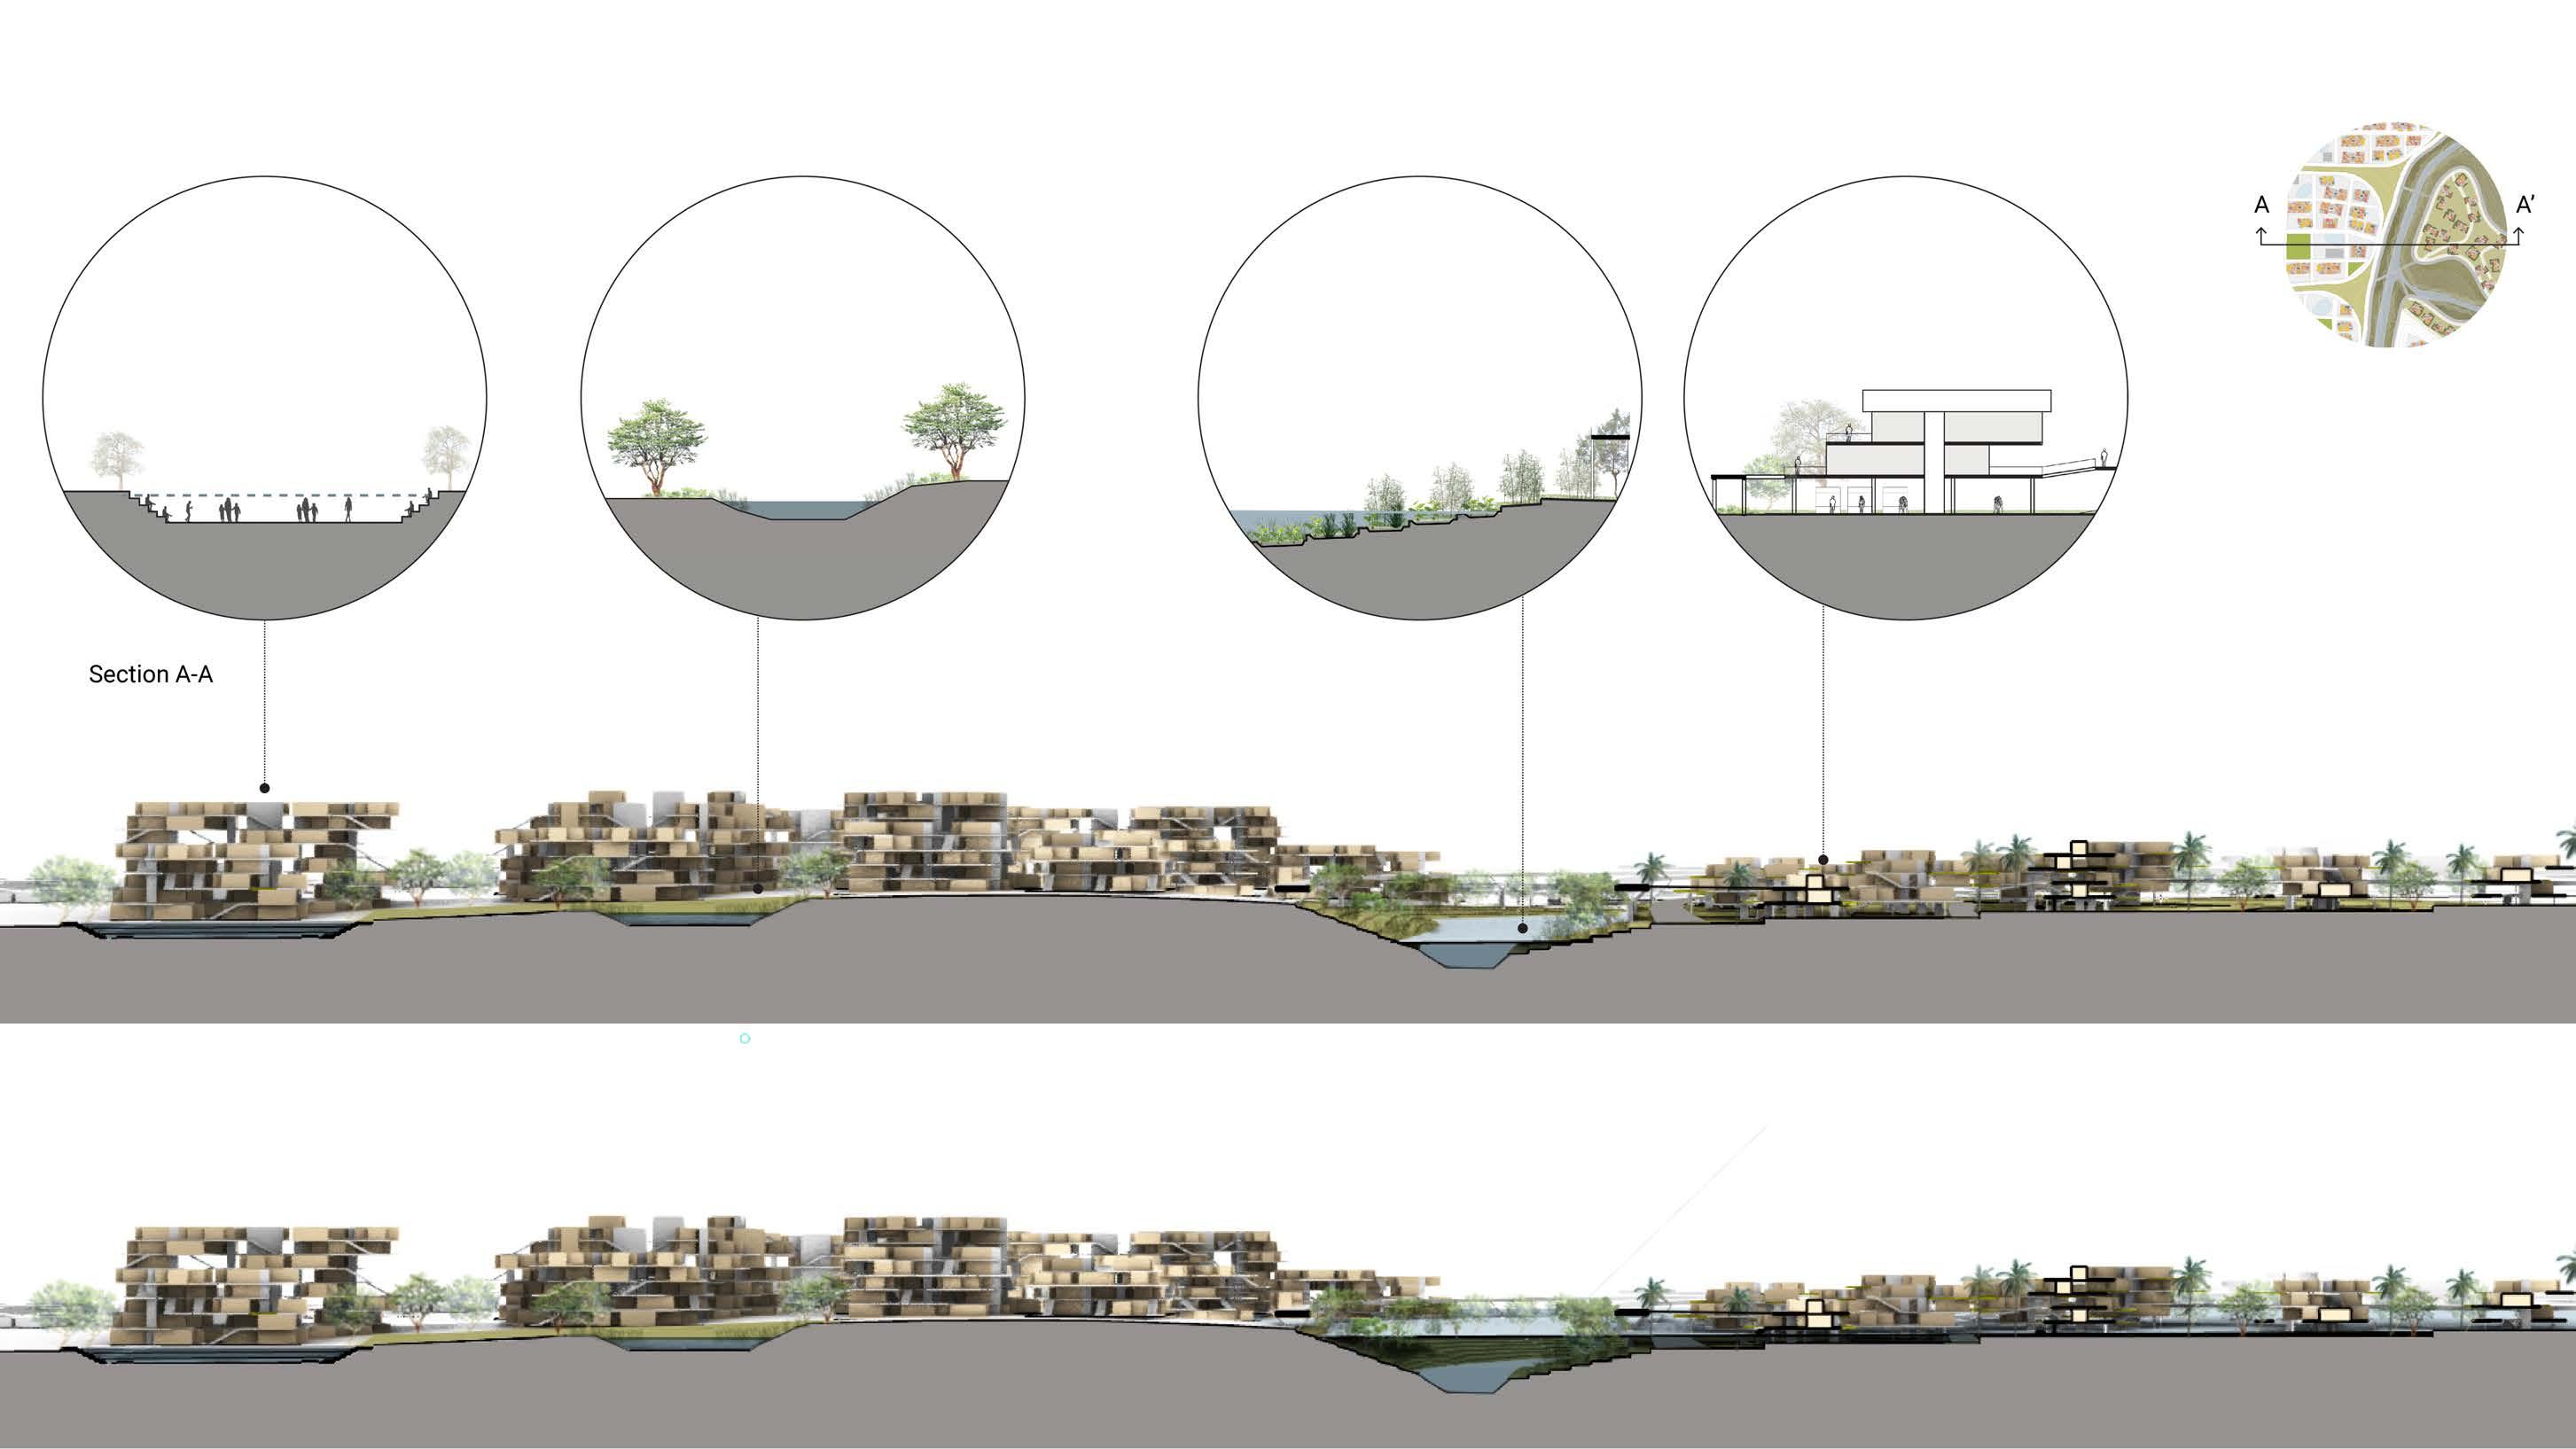
158 RIVER talise 159 DESIGN PROPOSAL | SITE PLAN + SECTIONS DESIGN PROPOSAL | SITE PLAN + SECTIONS
Primary attenuation ponds Raingardens Riparian landscape
Low density_riparian block
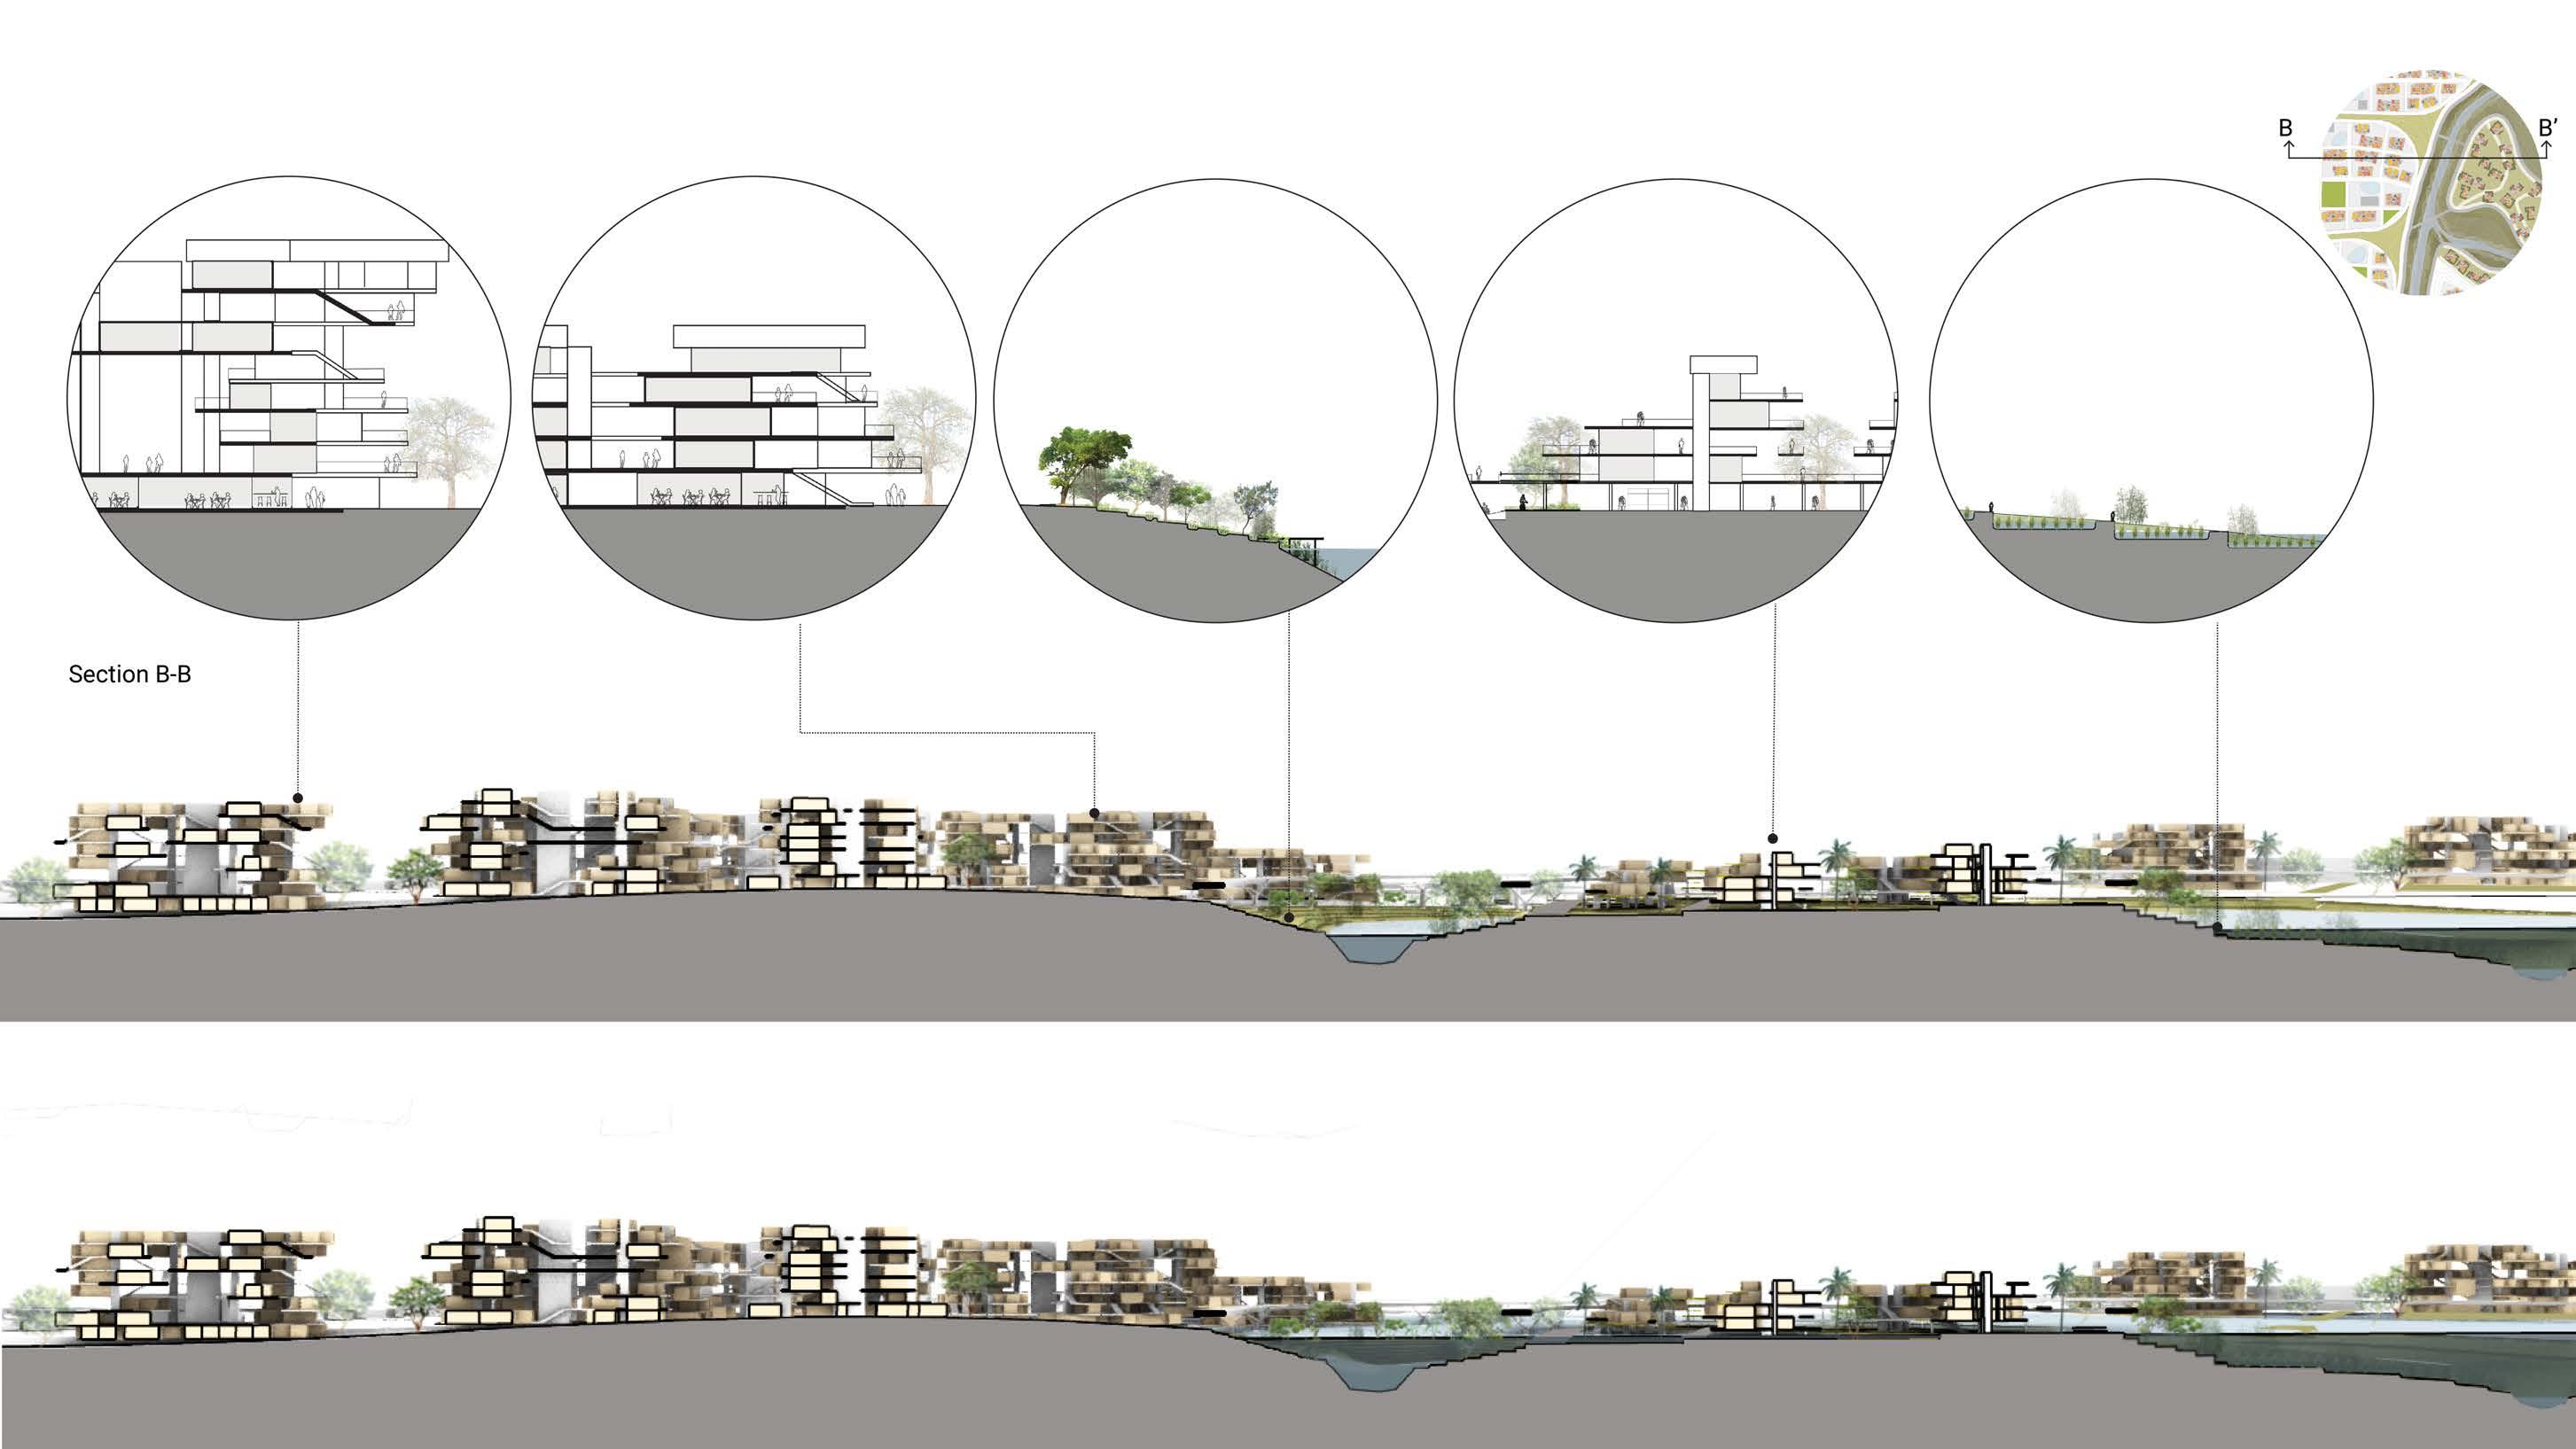
160 RIVER talise 161
High density_urban block
Mid density_urban block Riparian landscape
DESIGN PROPOSAL | SITE PLAN + SECTIONS DESIGN PROPOSAL | SITE PLAN + SECTIONS Shared communal
Mid density_riparian block Riparian landscape
6.3 BUILDING BLOCK DESIGN Utility cores Housing units
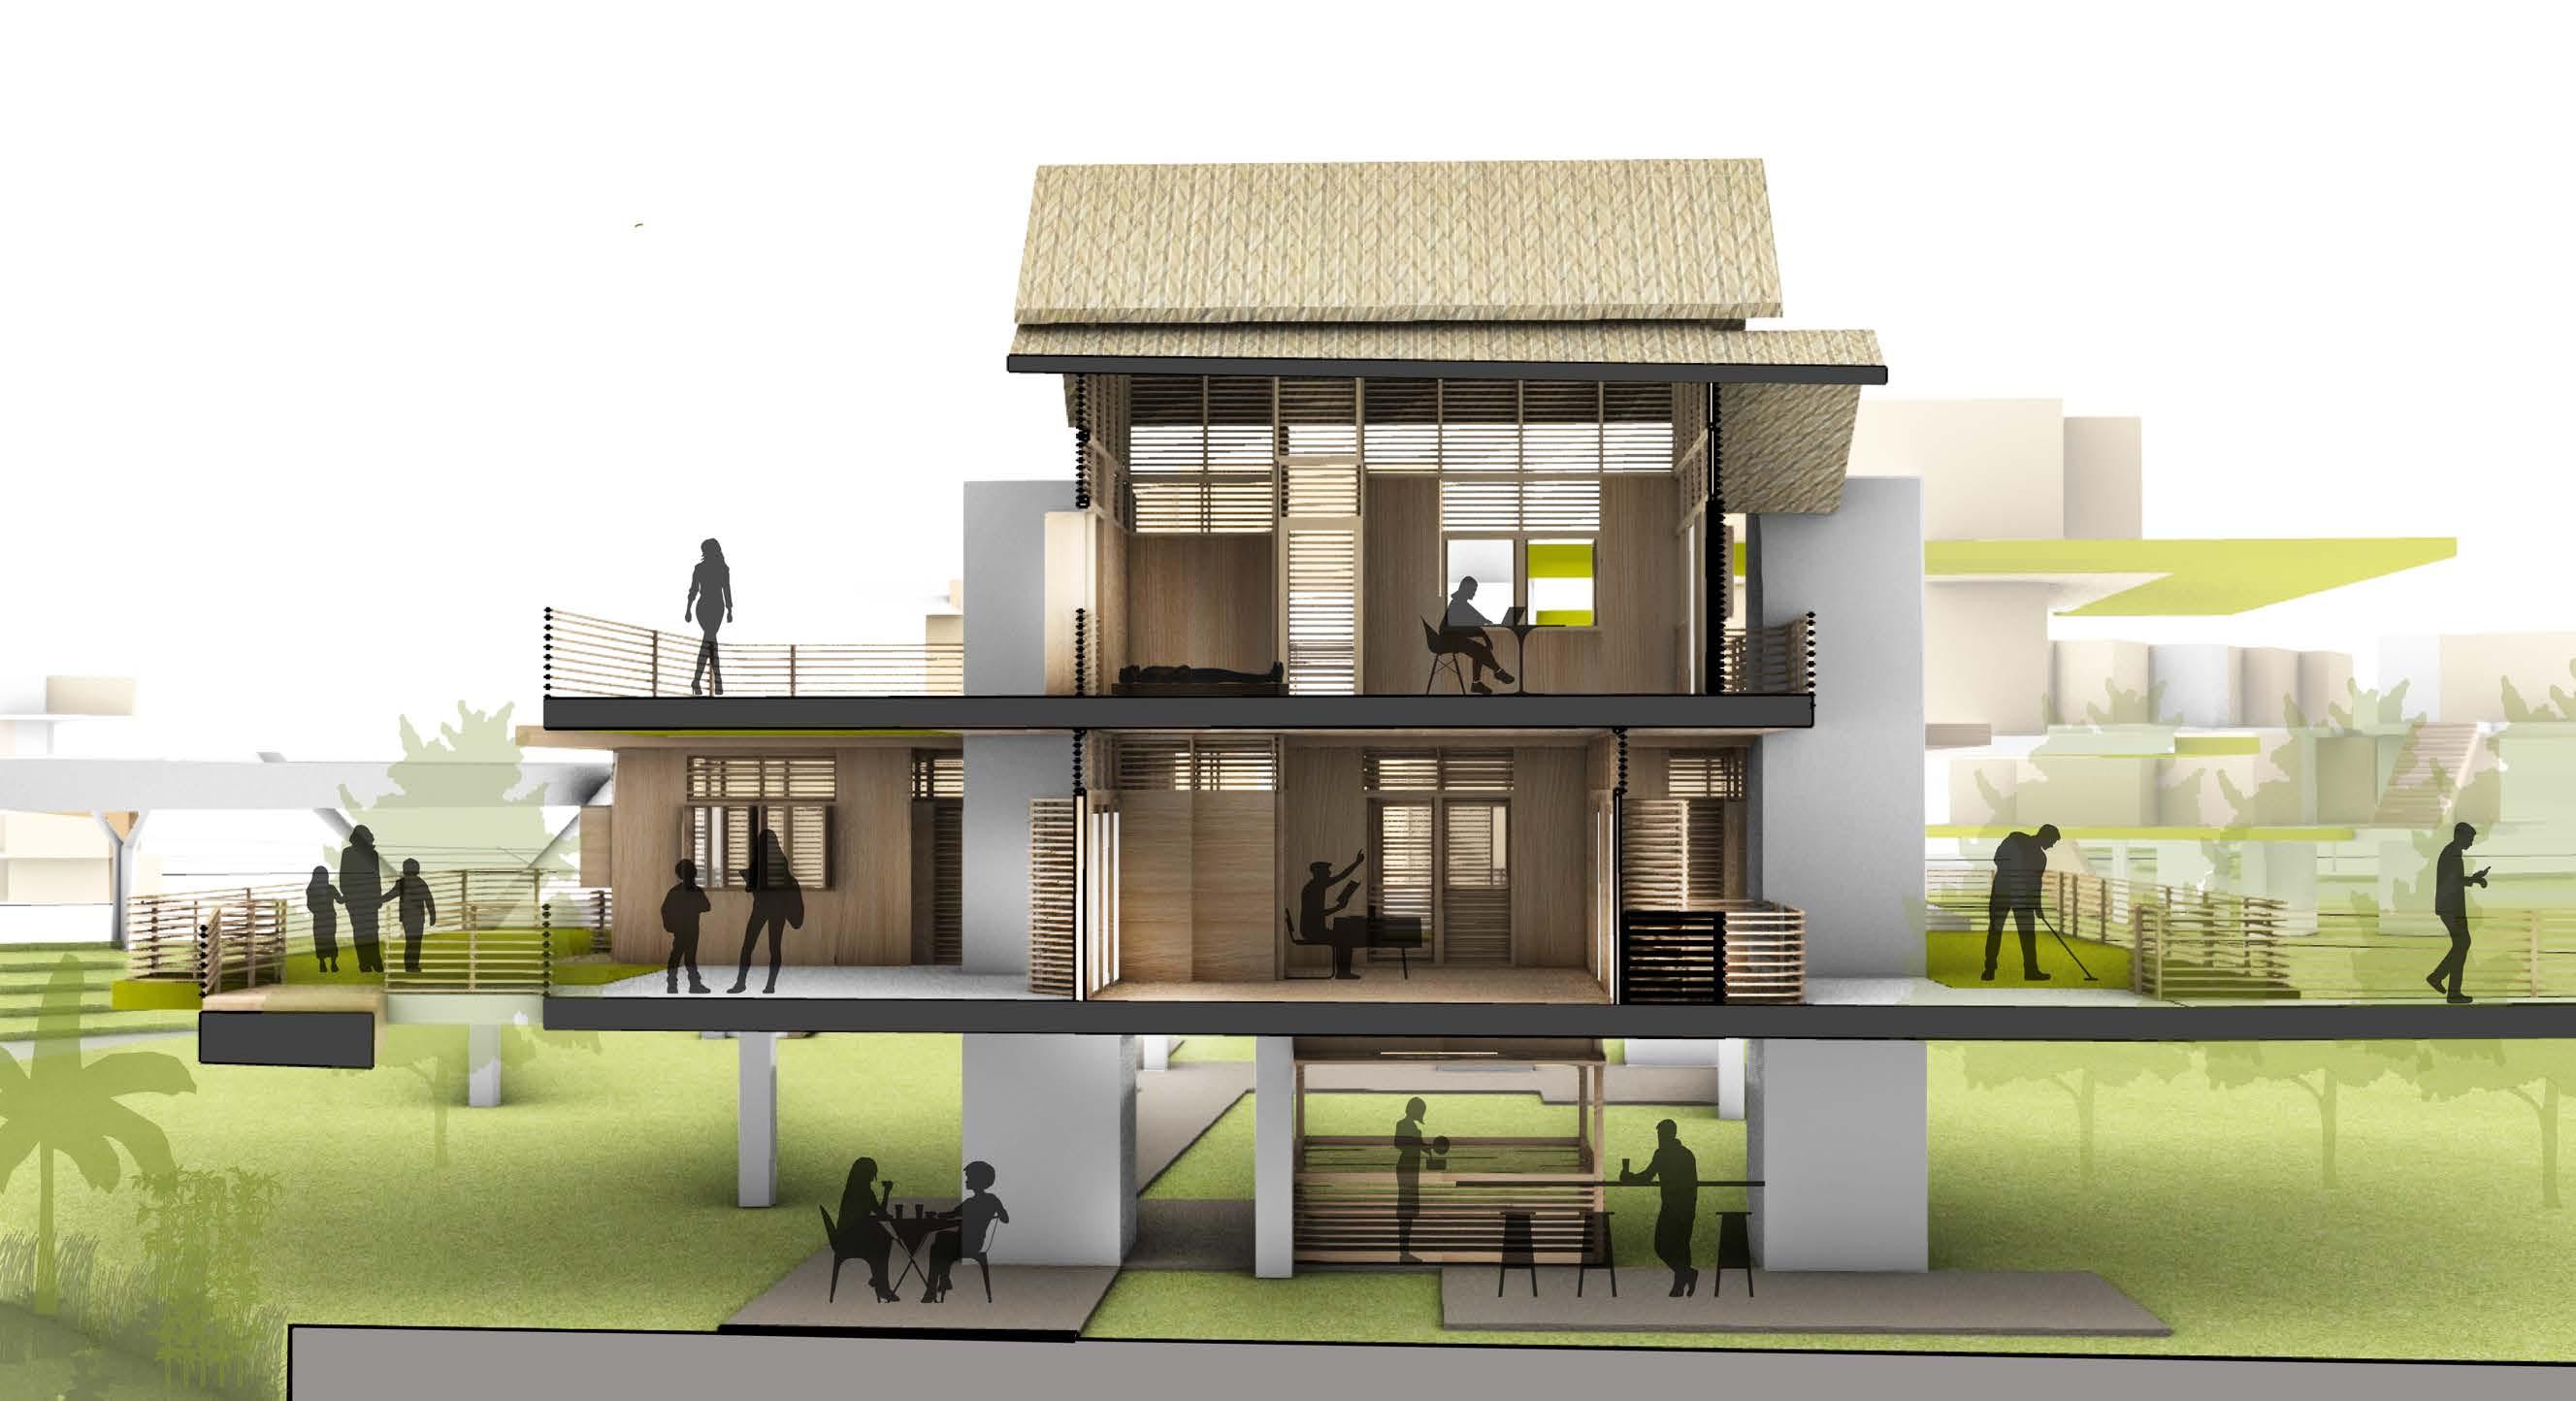
162 RIVER talise 163 DESIGN PROPOSAL| BUILDING BLOCK DESIGN DESIGN PROPOSAL| BUILDING BLOCK DESIGN
6.3.1 LOW DENSITY BLOCK - RIPARIAN Open terraces Elevated walkways Shared communal spaces Shared communal spaces
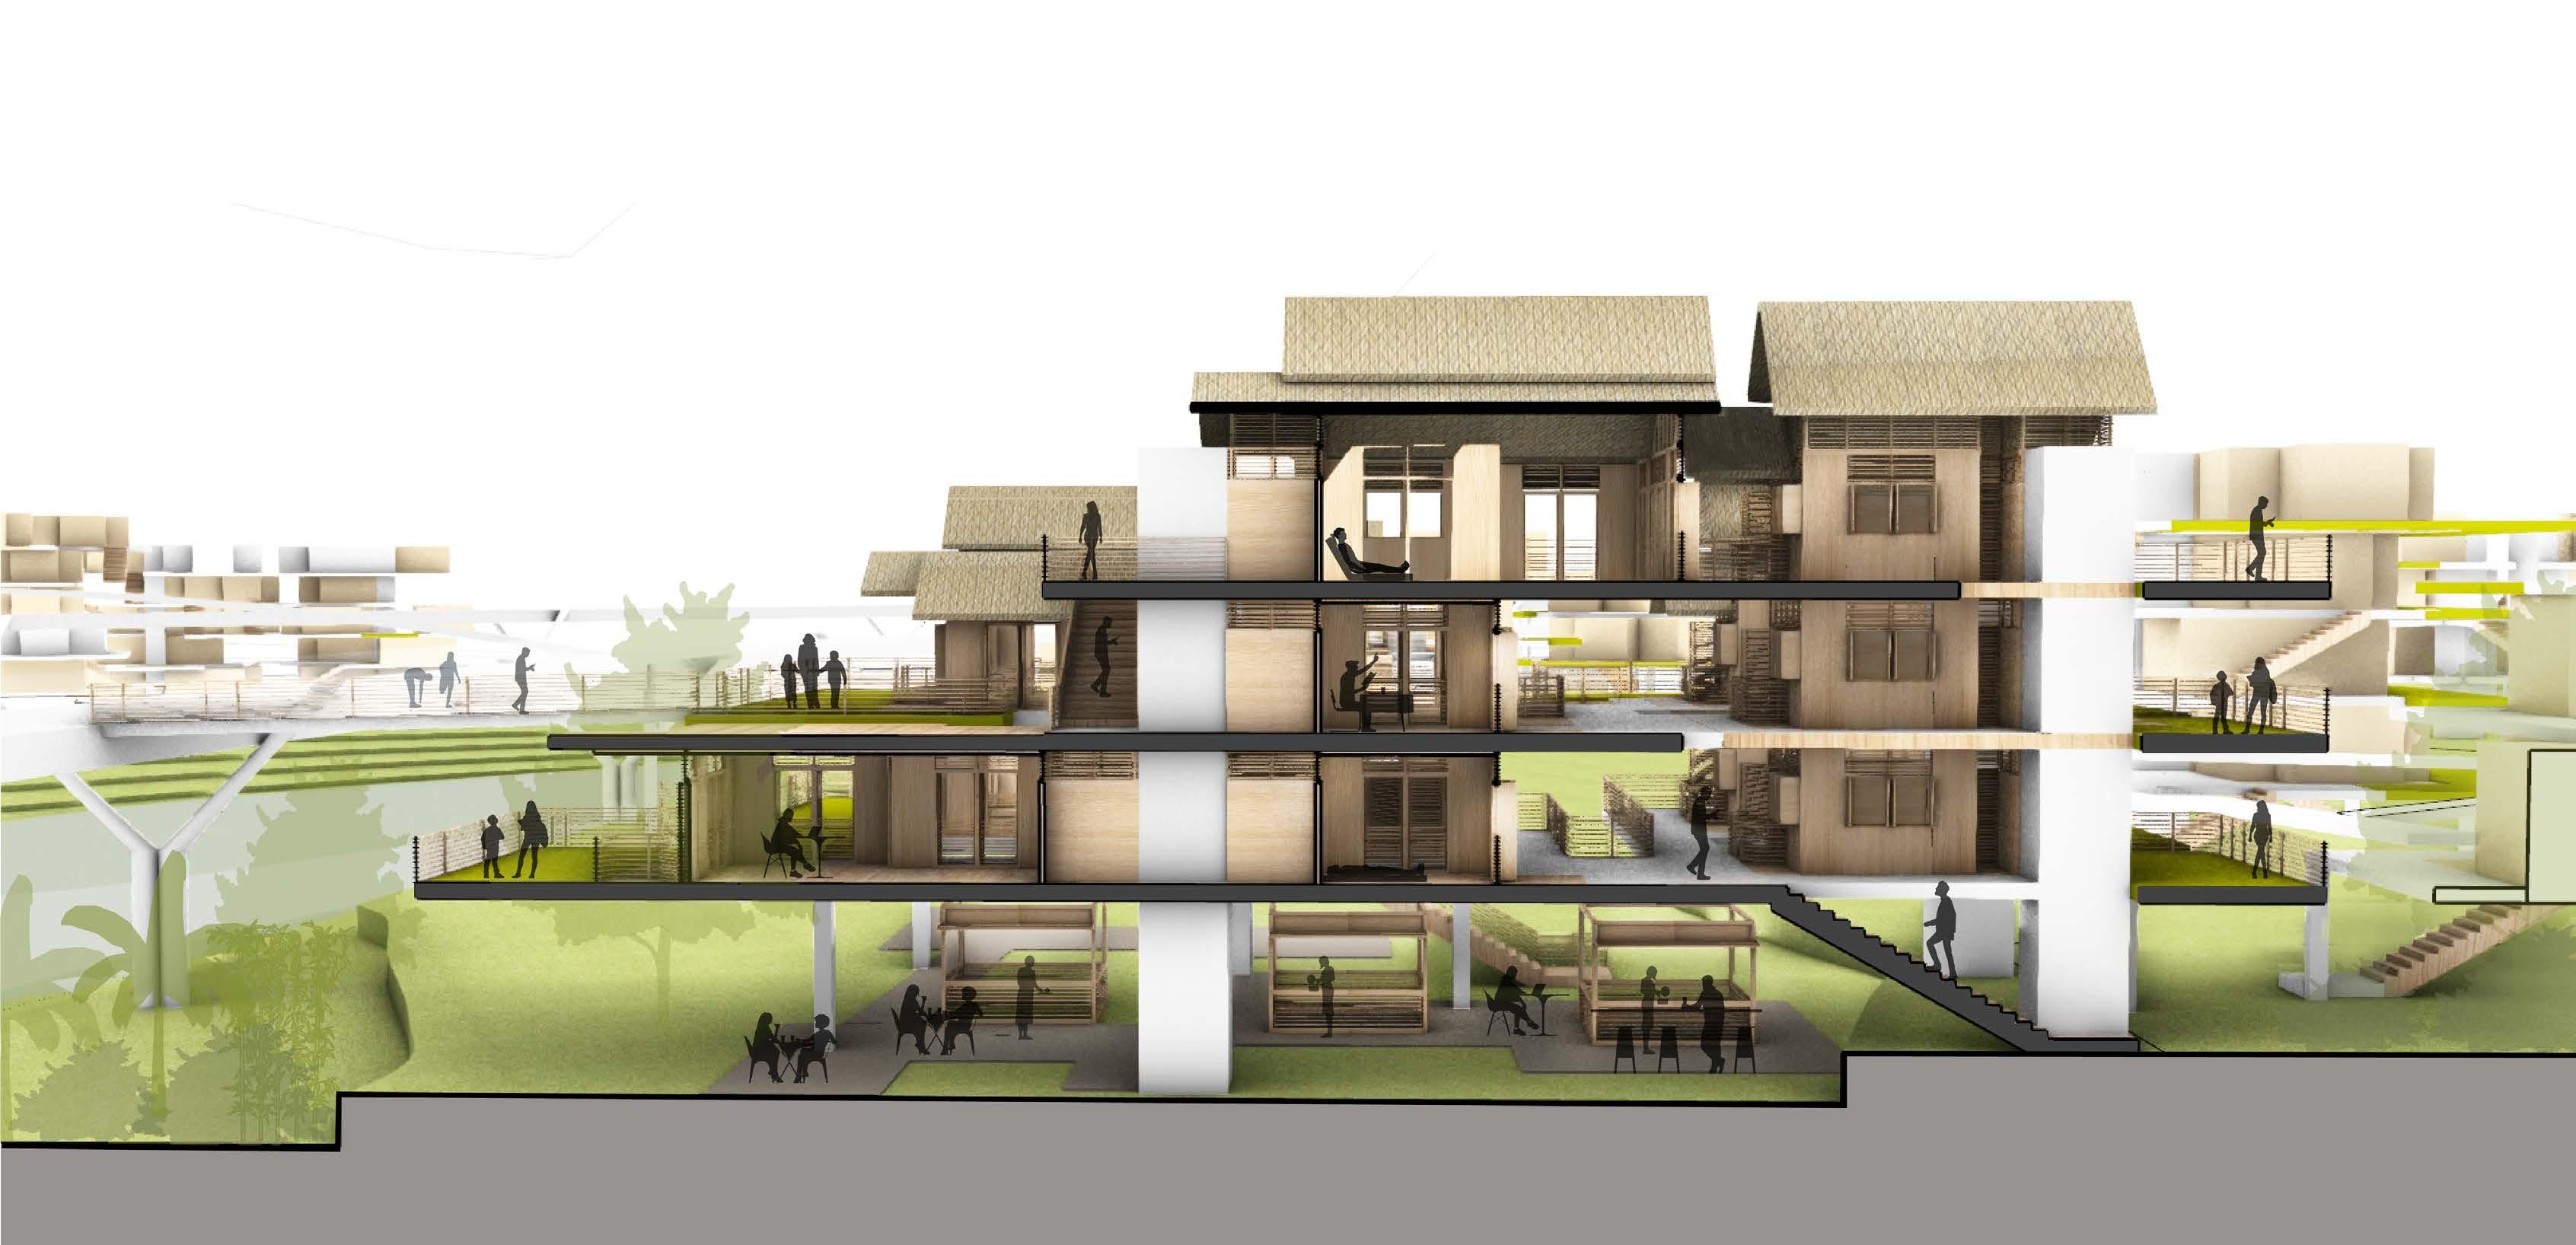
164 RIVER talise 165 DESIGN PROPOSAL| BUILDING BLOCK DESIGN DESIGN PROPOSAL| BUILDING BLOCK DESIGN
6.3.2 MEDIUM DENSITY BLOCK - RIPARIAN Open terraces Elevated walkway
Shared communal spaces Shared communal spaces Utility cores Housing units
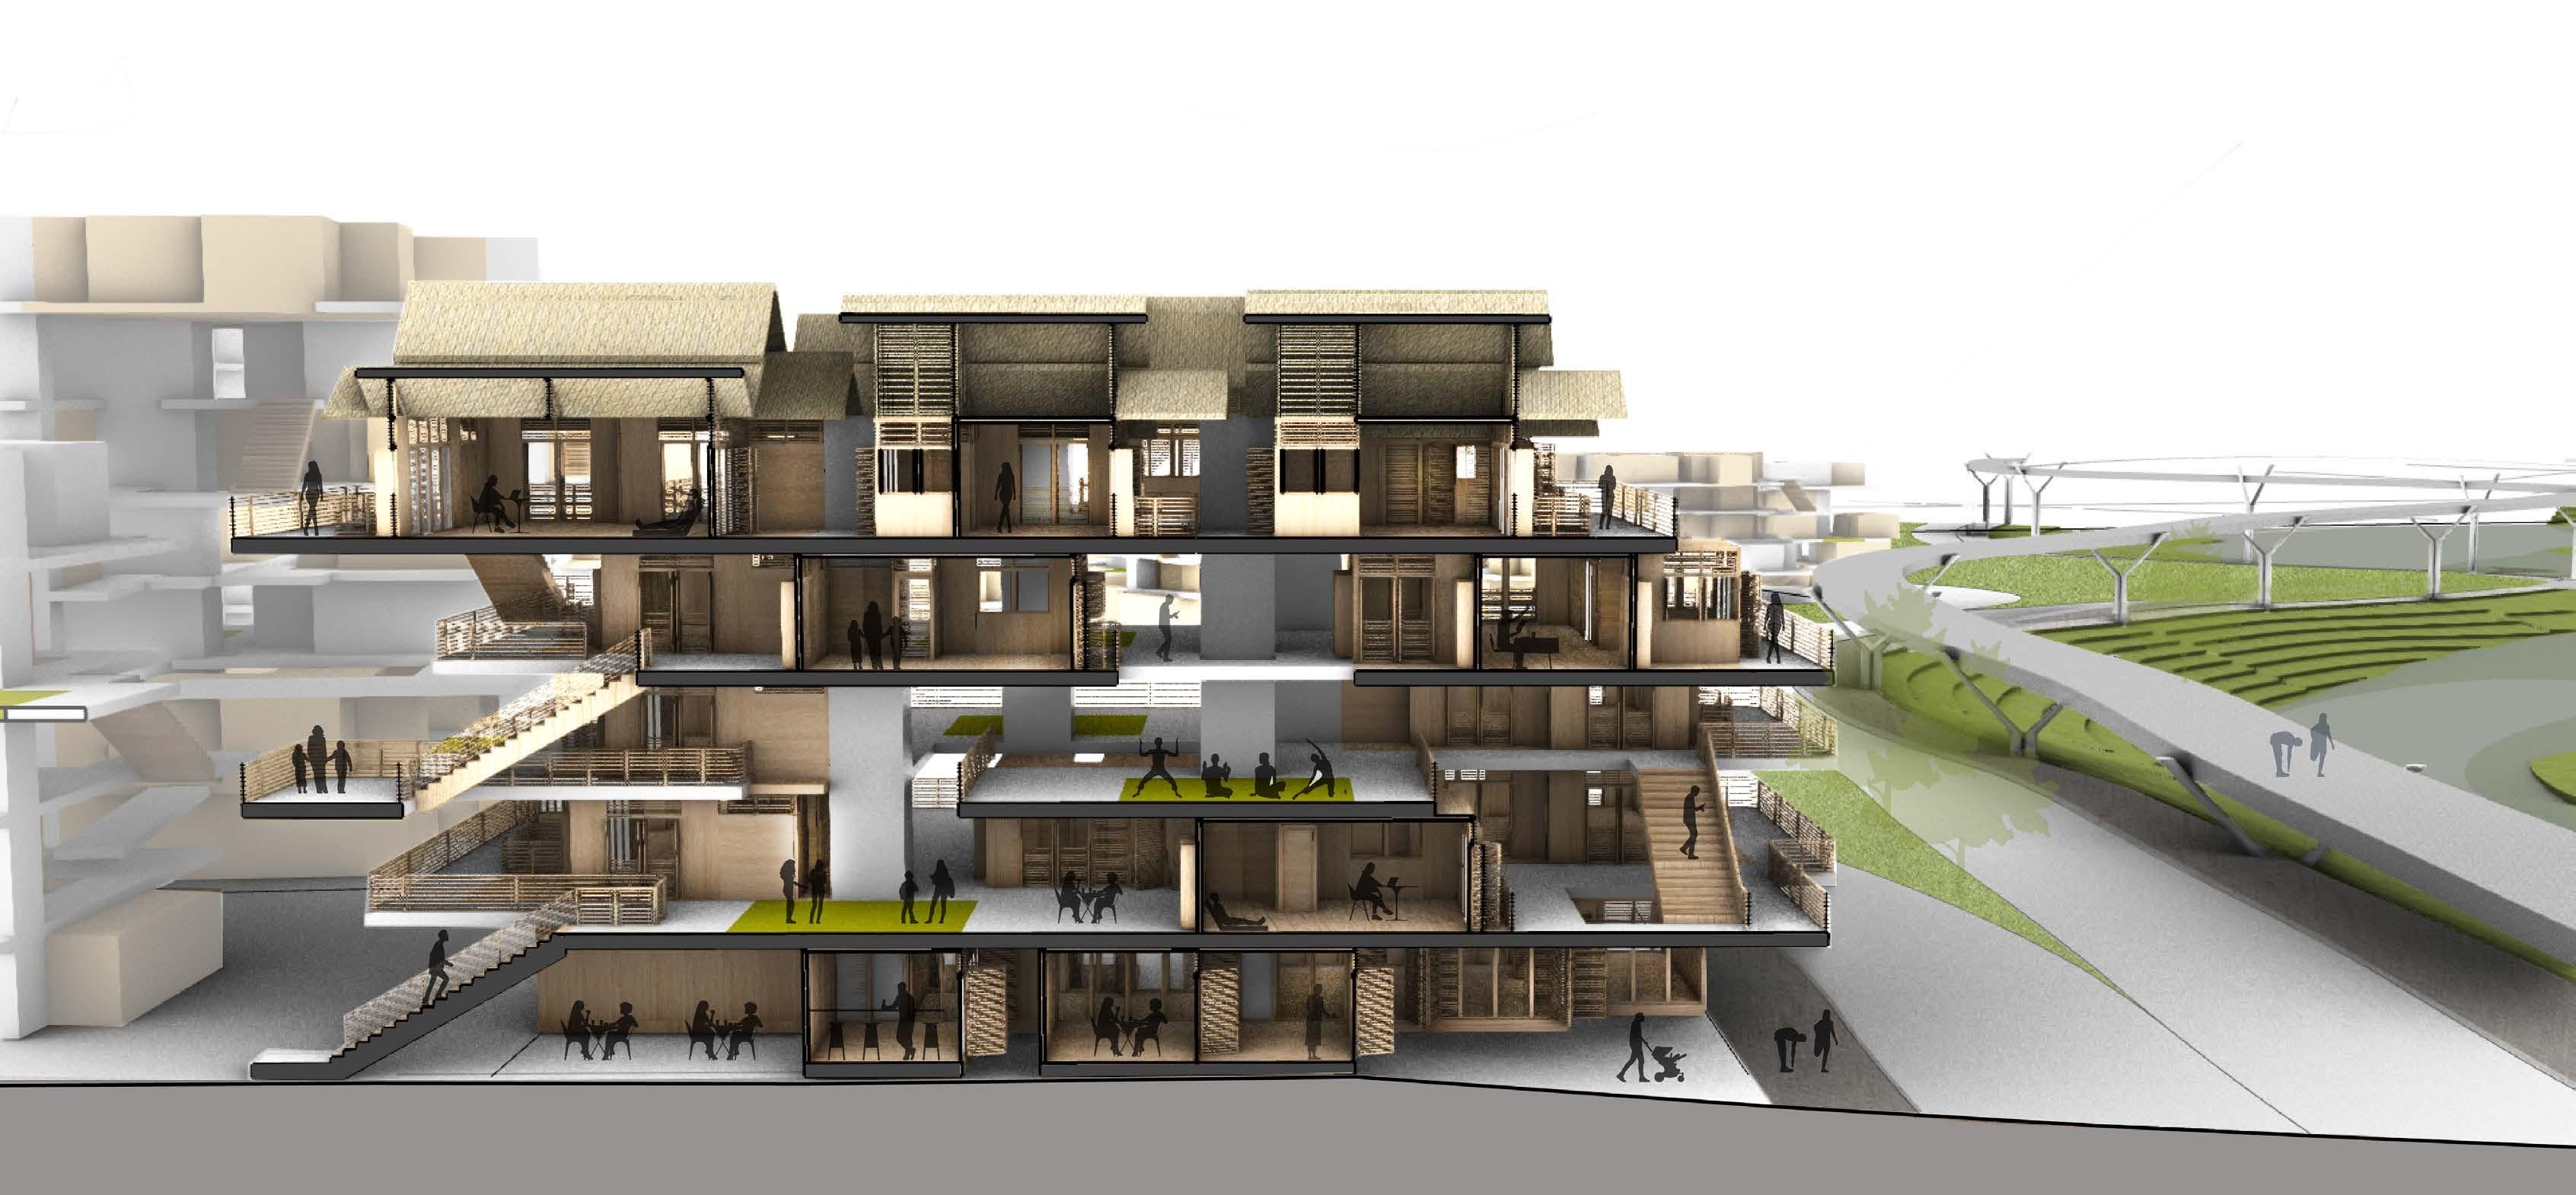
166 RIVER talise 167 DESIGN PROPOSAL| BUILDING BLOCK DESIGN DESIGN PROPOSAL| BUILDING BLOCK DESIGN 6.3.3 MEDIUM DENSITY BLOCK - URBAN Circulatory spaces Elevated walkways Shared communal spaces Shared communal spaces Utility cores Housing units Double height open spaces Work units (Warung) on ground floor
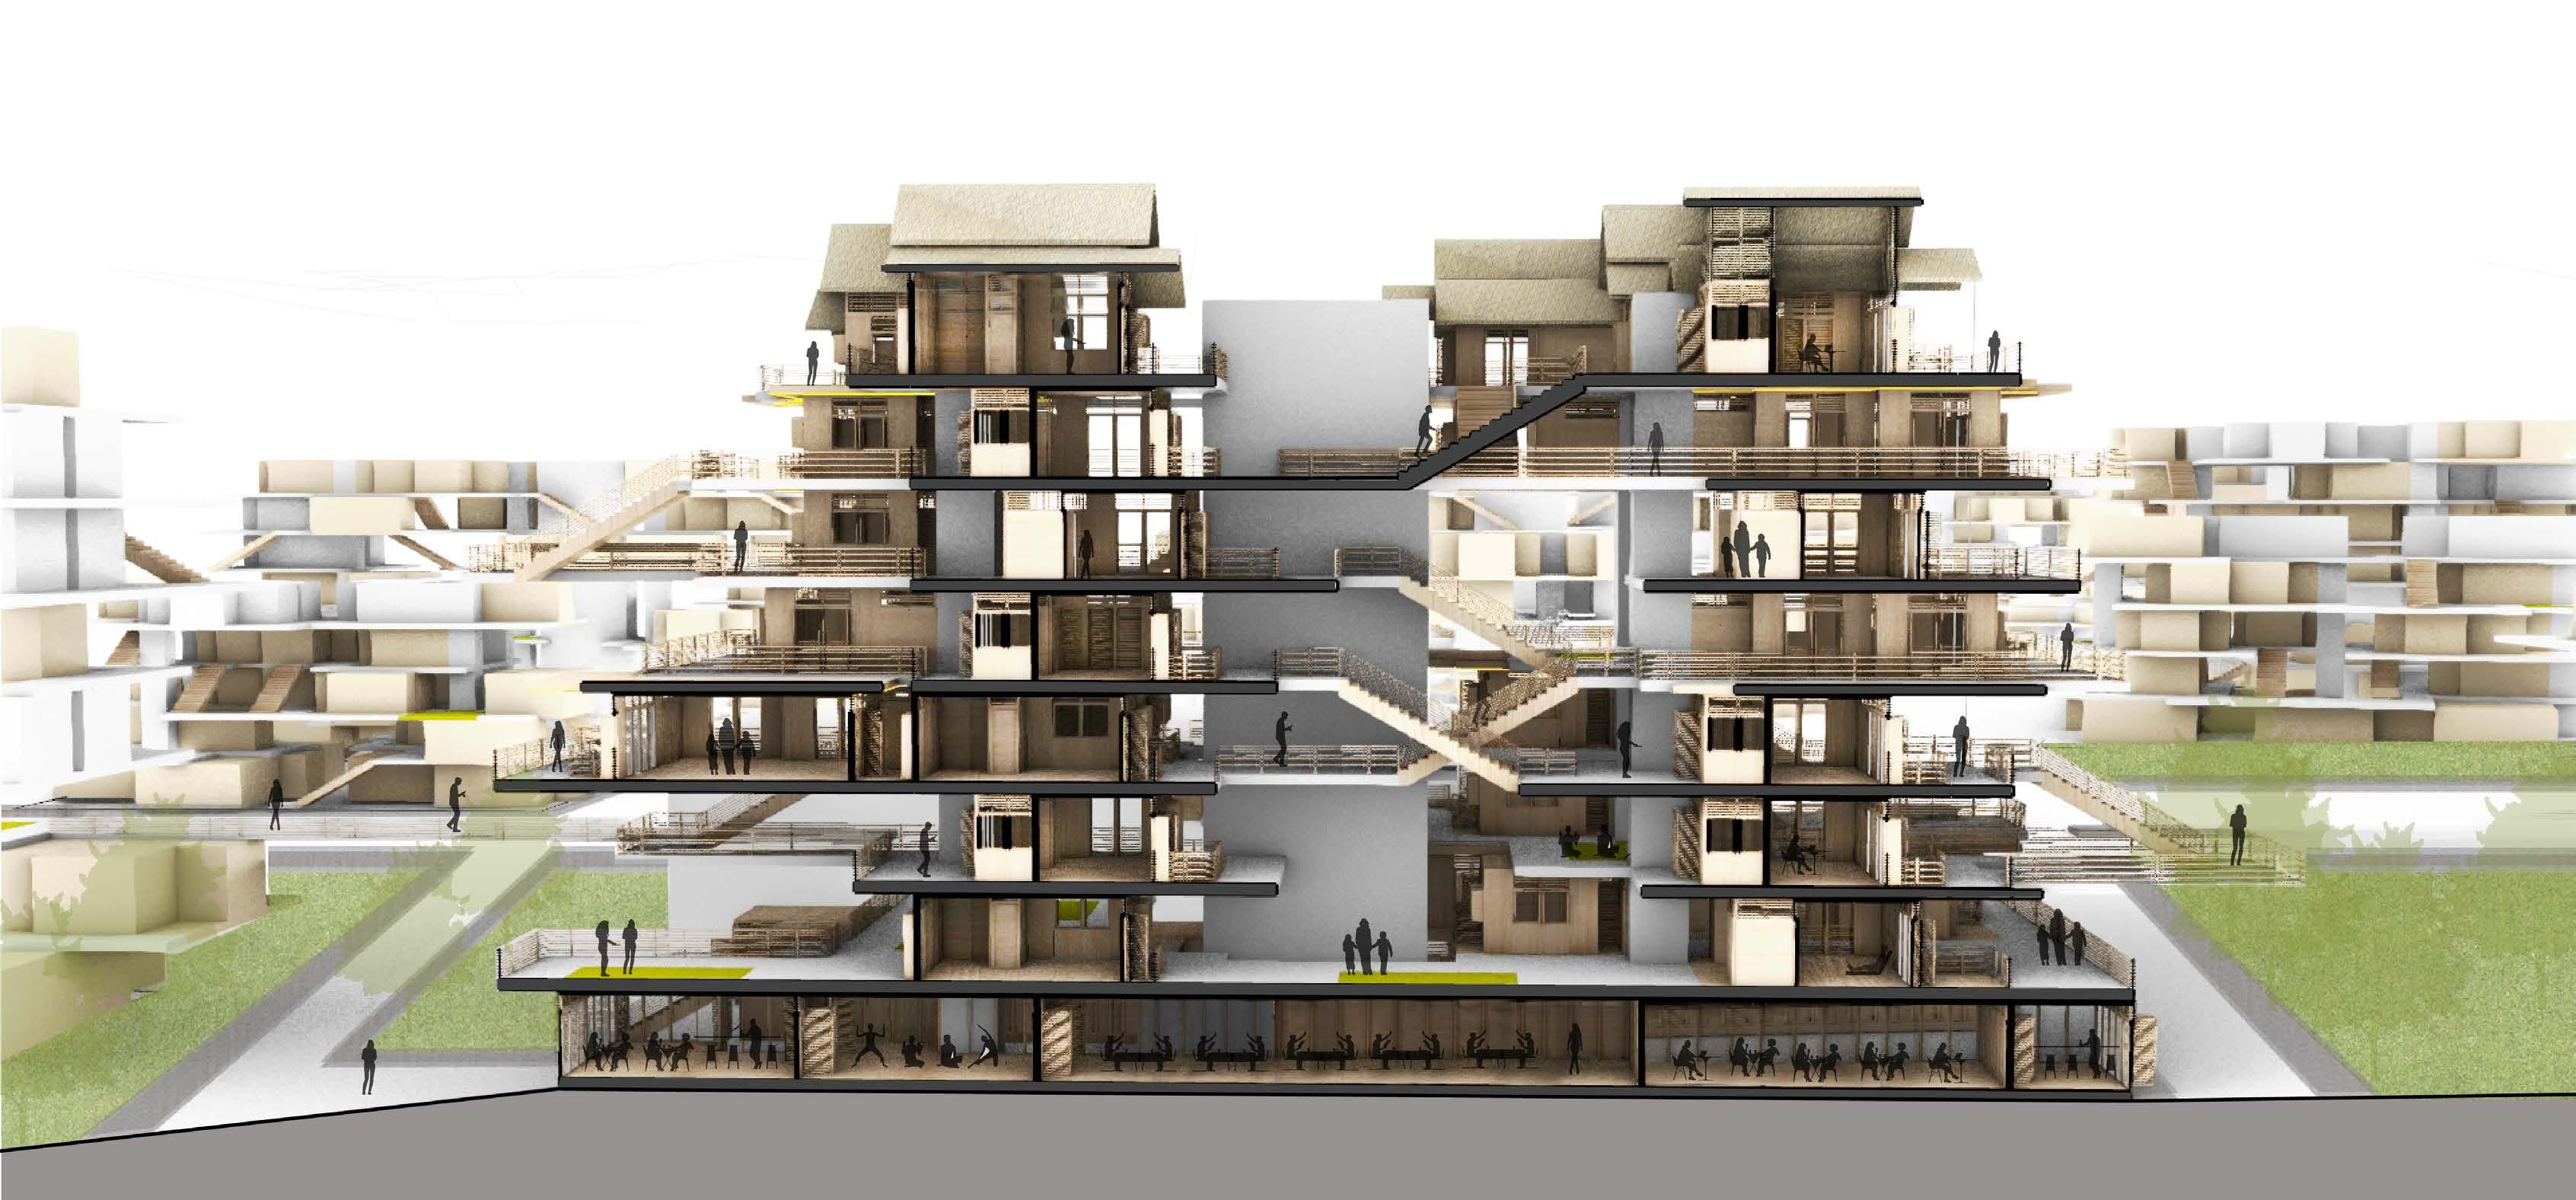
168 RIVER talise 169 DESIGN PROPOSAL| BUILDING BLOCK DESIGN DESIGN PROPOSAL| BUILDING BLOCK DESIGN 6.3.4 HIGH DENSITY BLOCK - URBAN Circulatory spaces Elevated walkway Shared communal spaces Lift core Utility core Double height open spaces Work units (Warung) on ground floor Shared communal space Housing units Circulatory spaces
6.4.1 RIPARIAN CLUSTER
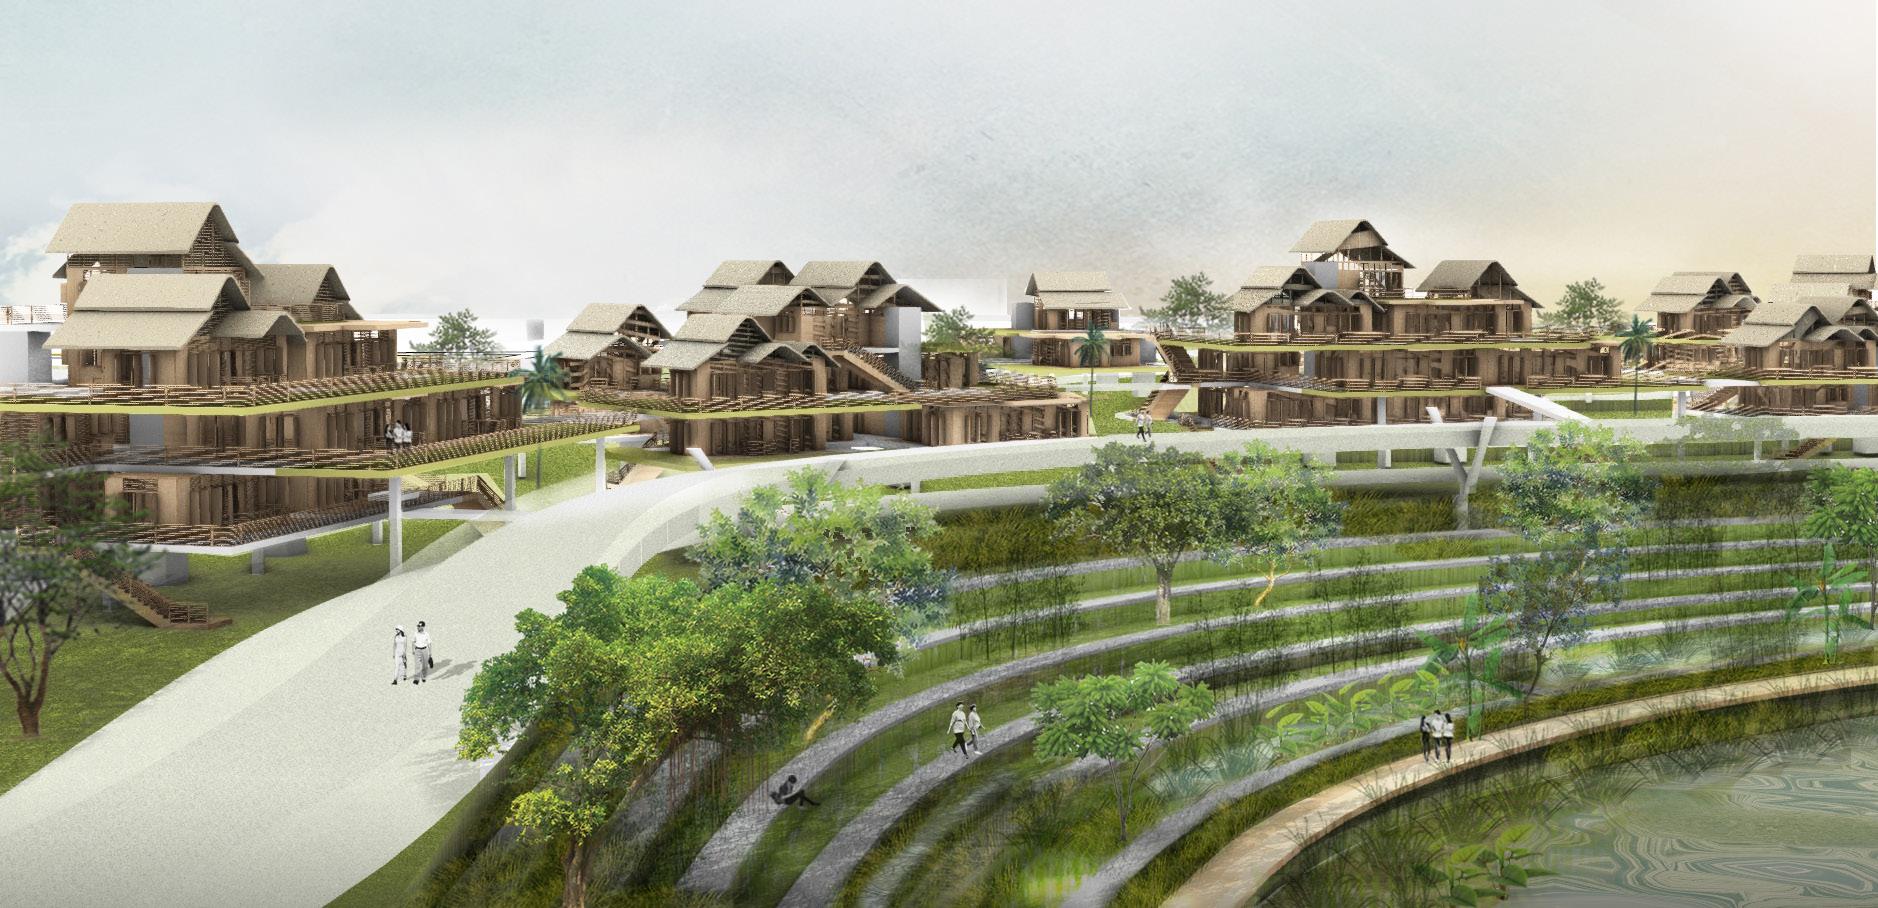
170 RIVER talise 171 DESIGN PROPOSAL| SIMULATION DESIGN PROPOSAL| SIMULATION
6.4.2 RIPARIAN CLUSTER - DURING FLOOD
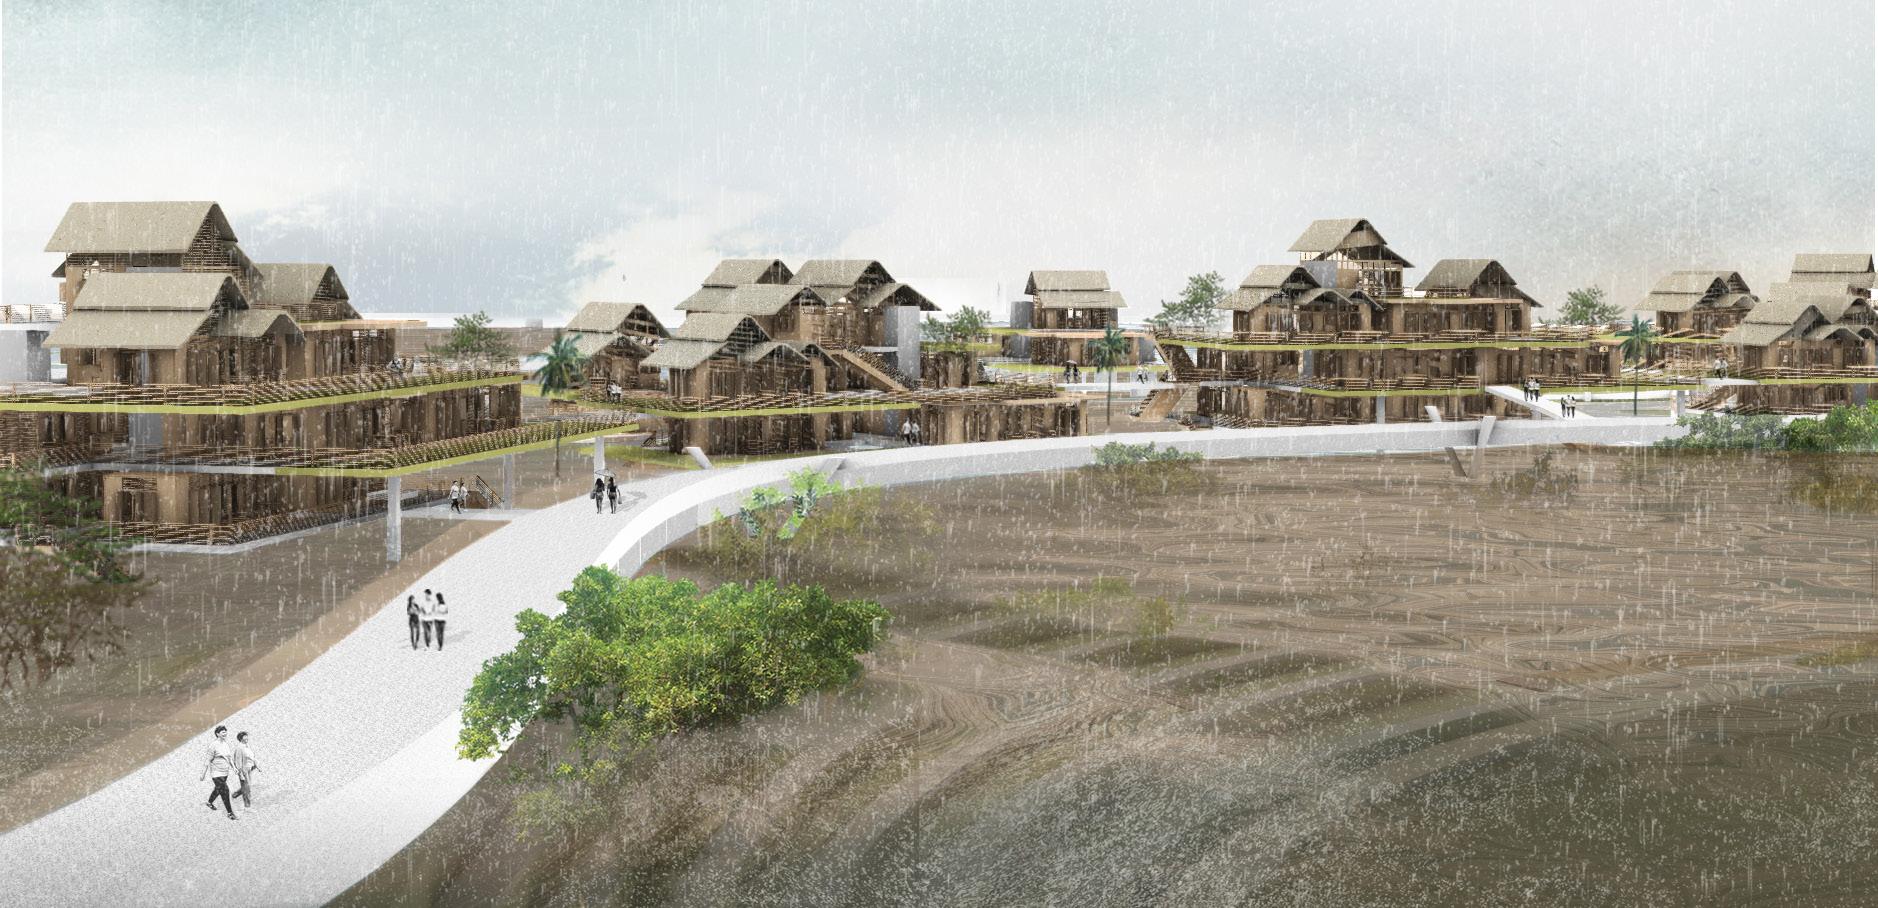
172 RIVER talise 173 DESIGN PROPOSAL| SIMULATION DESIGN PROPOSAL| SIMULATION
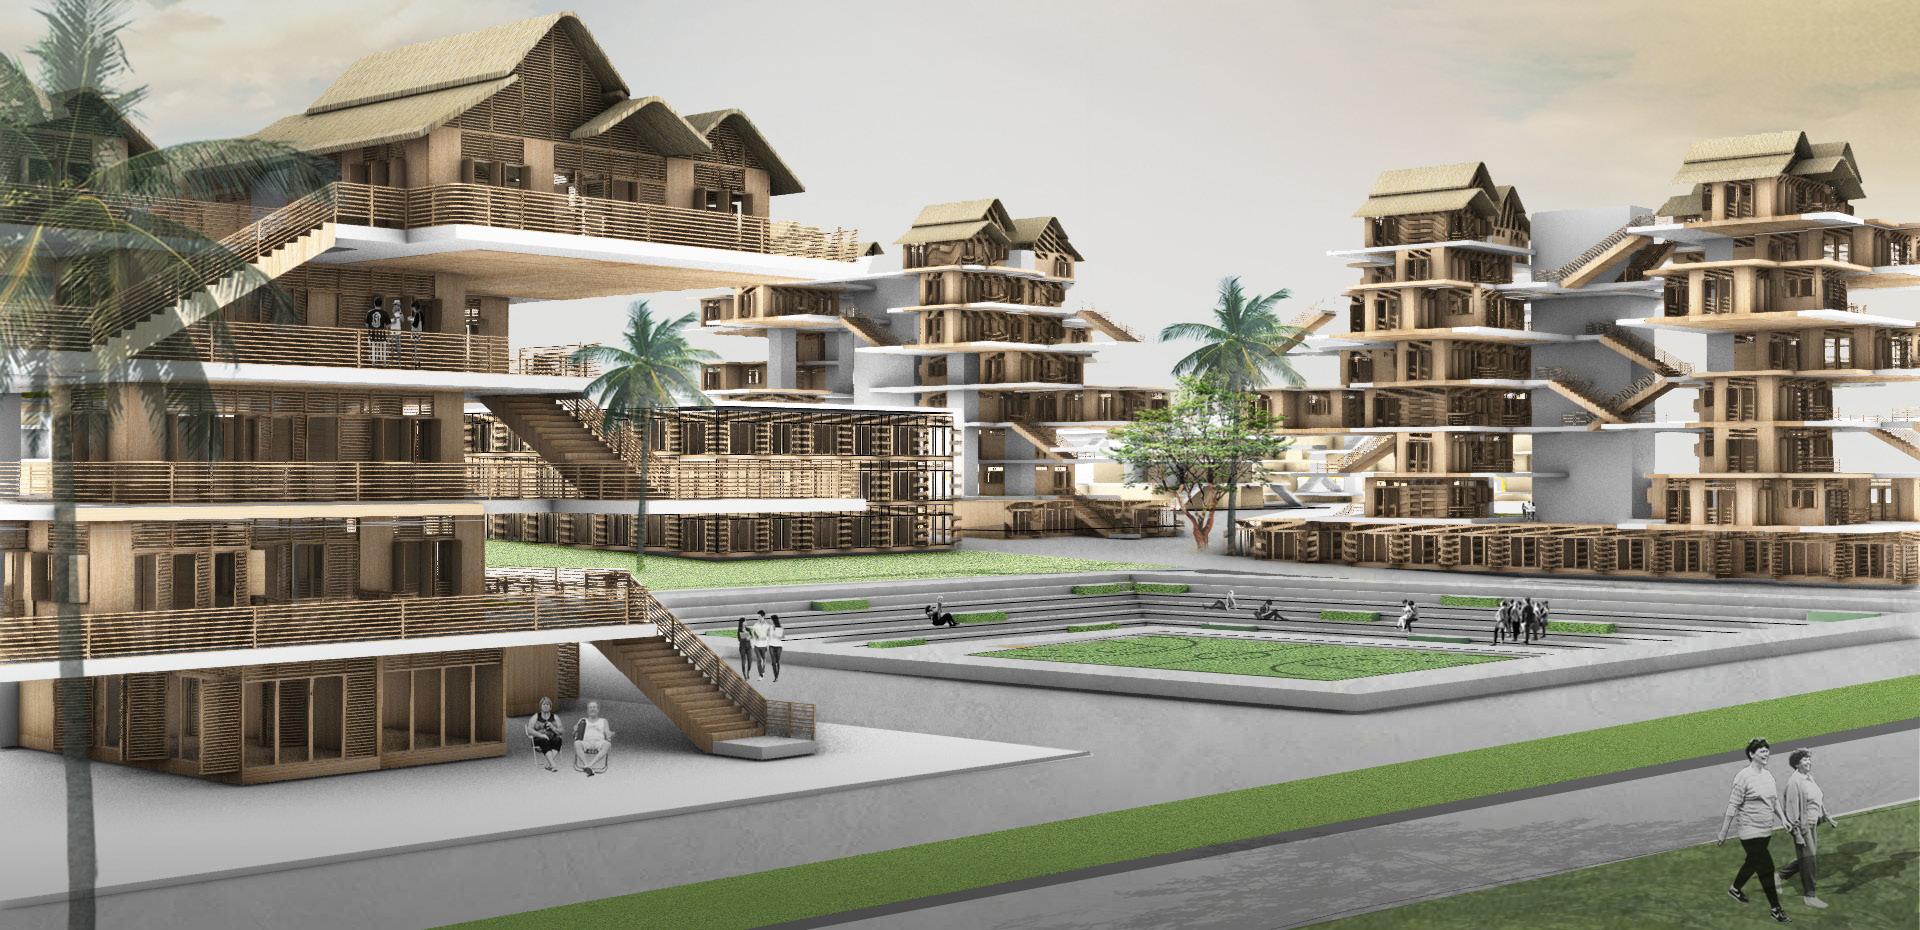
174 RIVER talise 175 DESIGN PROPOSAL| SIMULATION DESIGN PROPOSAL| SIMULATION 5.4.3
URBAN CLUSTER
5.4.4 URBAN CLUSTER - DURING FLOOD
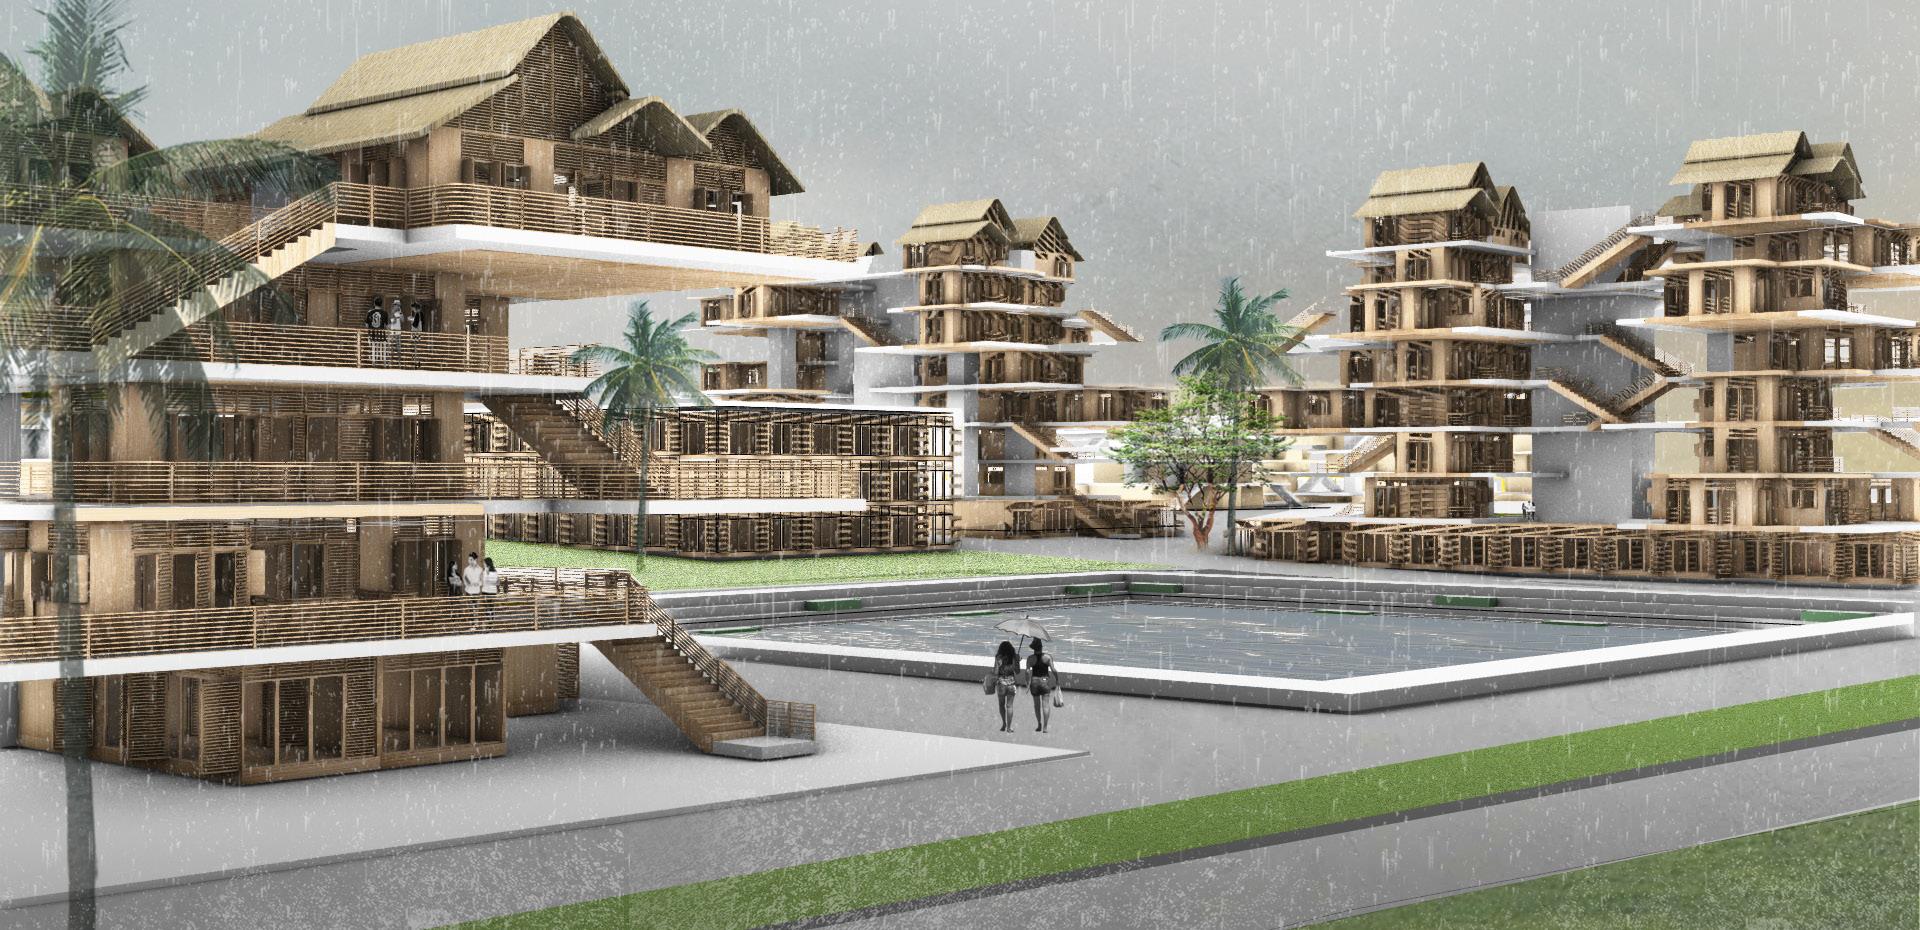
176 RIVER talise 177 DESIGN PROPOSAL| SIMULATION DESIGN PROPOSAL| SIMULATION
CONCLUSION
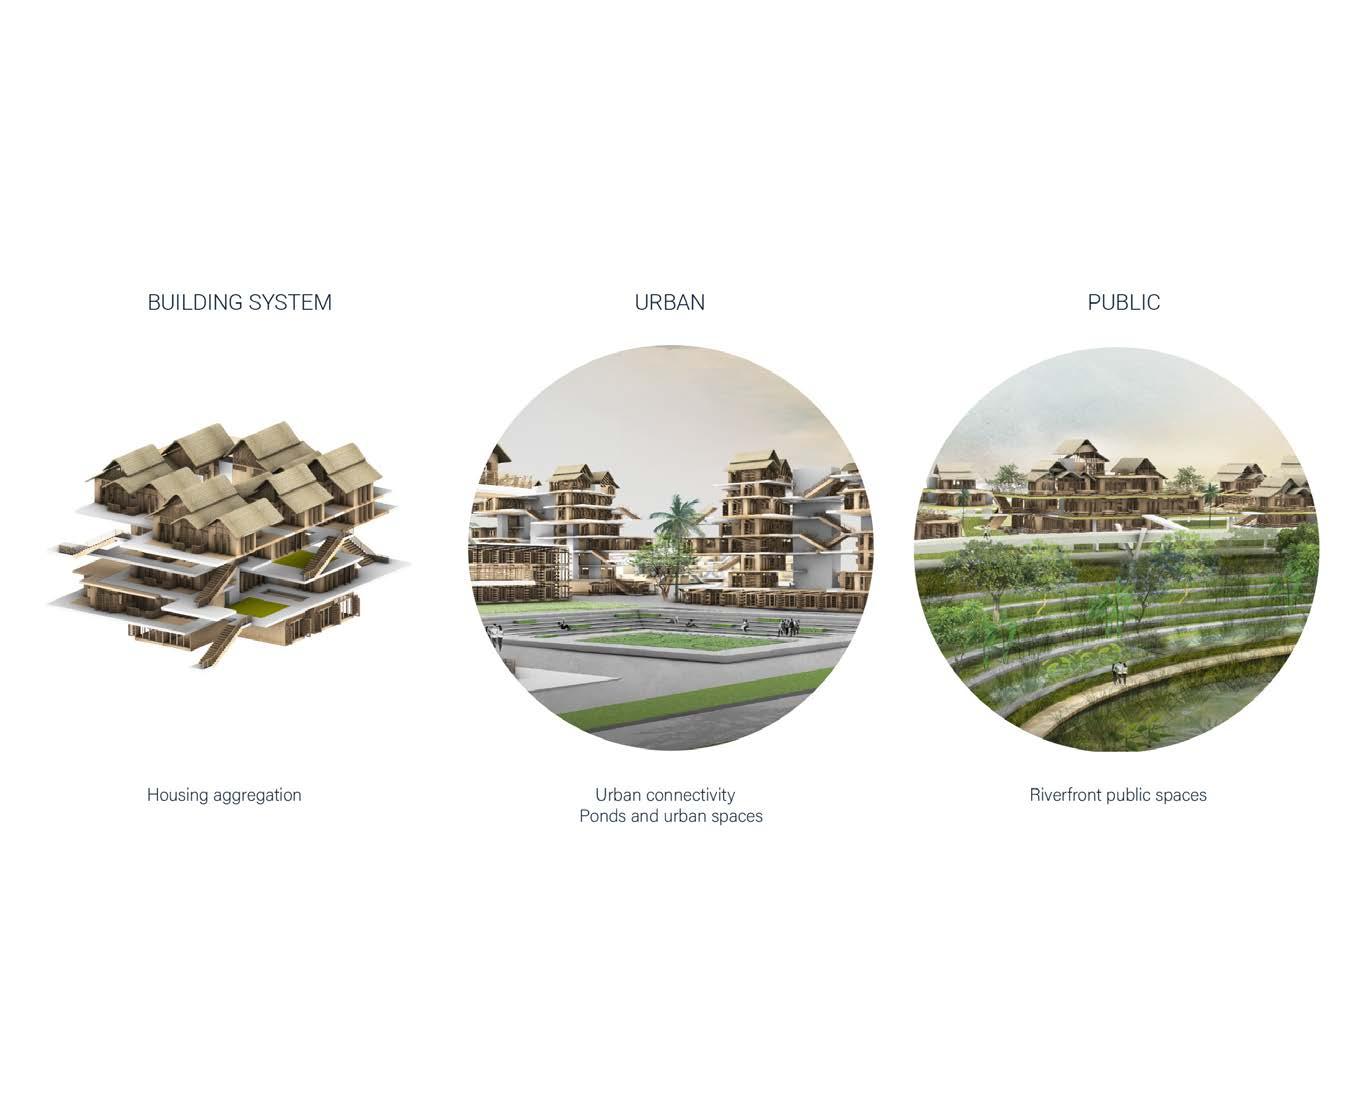
178 RIVER talise 179 DOMAIN CONTEXT DOMAIN CONTEXT
7.1 FLOOD MITIGATION
Flood mitigation strategies were integrated on multiple scales. On an urban scale, flood mitigation strategies were developed in correlation with risk assessment on the site. Even though risk assessment enabled different flood mitigation strategies, there are two possibilities of further development on an urban scale.
As outlined in the riparian section (refer section 3.1.5), there are various advantages of using terraced landscape and riparian vegetation and wetland ecosystem for flood mitigation as well as ecological restoration of riverfront areas. However, the exploration of riparian strategies was limited to riparian vegetation. There is a potential to develop this further into an integrated landscape strategy with the aim of establishing relationships between terrace geometry and size with the river dynamics.
Additional risk assessment helped in realizing the flood retention areas within the extent of the site, which formed the basis for establishing hydrological networks. This hydrological network on the site is generated parallel to the street network, taking into account the water infrastructure of the city. Some preliminary considerations were made with regard to the drainage of water within the dense urban areas through elevation and slope of land while distributing hydrological facilities on the site. There is a possibility of developing a more resilient water infrastructure within this framework of hydrological network as an enhanced drainage system would increase the capacity to discharge stormwater.
On an architectural scale, flood mitigation strategies were introduced in the form of elevated buildings, context-specific block types and elevated walkways between different blocks. The elevated walkways were generated while considering the position of shared communal spaces within the building system. However, there is potential of incorporating this within multi-objective optimization experiments with the fitness objective to maximize the placement of elevated walkways within the zones with substantial flood risk.
7.2 FORMALLY INFORMAL
On an architectural scale, a framework for the building system was achieved. It proved that an architectural framework for community housing can be developed based on a good level of planning to preserve existing communal coherence while maintaining the informal characteristic of selfbuild.
In the M.Arch phase of the project, the housing aggregation experiments were revisited to make provisions for context-specific block types in relation to the associated flood risk factor. Experiments focusing on relationships between plot sizes, density and distribution were carried out. The focal point while developing the building system was the architectural design considerations like programmatic distribution, circulation spaces and quality of communal spaces in the form of 3D communal network within the building system.
The environmental performance of the building blocks developed was also one of the main considerations. Environmental data has been critically analysed on various stages in the form of solar gain on the housing aggregation, solar exposure on the ground floor and emergent void spaces. These environmental studies prove that the building system has significantly enhanced and is adaptable to the tropical climate of the site, with the objective of enhancing ventilation and thermal comfort within the building blocks. Additionally, environmental studies and strategies can also be extended to enhance outdoor thermal climate while locating open public spaces and ponds considering the hot and humid climate of the site.
In the final section, it has been demonstrated that with different types of infill wall panels, the users could easily construct and adapt their living spaces to suit their unique needs. Building systems could be explored further by developing detailed components for the kit-of-parts construction for selfbuild. Further development could be undertaken to explore the possibility of these components to be designed for various requirements such as climate and privacy. Moreover, the development of the components could be integrated into both materiality and constructability of the bamboobased material which was discussed in domain studies. The frame structure can be developed in conjunction, to arrive at a holistic integrated system. A catalogue of kit-of-parts components can be developed based on these further explorations, to demonstrate that informal urban fabric that forms the lives and livelihoods of the local community can be evolved and constructed to be part of a formal settlement.
180 RIVER talise 181 CONCLUSION FORMALLY INFORMAL CONCLUSION FLOOD MITIGATION
REFERENCES
182 RIVER talise 183
2 DOMAIN
2.1 JAKARTA
CNN, Tara John. ‘Jakarta Floods Leave Dozens Dead and 60,000 Displaced’. CNN. Accessed 2 October 2020. https://www.cnn.com/2020/01/02/asia/jakarta-floods-intl/ index.html.
Padawangi, Rita, and Mike Douglass. ‘Water, Water Everywhere: Toward Participatory Solutions to Chronic Urban Flooding in Jakarta’. Pacific Affairs 88, no. 3 (1 September 2015): 517–50. https://doi.org/10.5509/2015883517.
Badan Pusat Statistik. ‘Data Sensus Penduduk 2010 - Badan Pusat Statistik Republik Indonesia’. Accessed 28 August 2020. https://www.bps.go.id/news/2011/11/01/5/bpstelah-merilis-hasil-sensus-penduduk-2010.html.
Leaf, Michael. ‘Land Rights for Residential Development in Jakarta, Indonesia: The Colonial Roots of Contemporary Urban Dualism’, 1993.
Lin, Ervine, Kashif Shaad, and Christophe Girot. ‘Developing River Rehabilitation Scenarios by Integrating Landscape and Hydrodynamic Modeling for the Ciliwung River in Jakarta, Indonesia’. Sustainable Cities and Society 20 (January 2016): 180–98. https://doi. org/10.1016/j.scs.2015.09.011.
Maharani, A. M., and E. Evawani. ‘Utilization of Residual Space on Ciliwung Riverbank’. IOP Conference Series: Earth and Environmental Science 248 (April 2019): 012072. https:// doi.org/10.1088/1755-1315/248/1/012072.
McCarthy, Paul. ‘Urban Slums Reports: The Case of Jakarta, Indonesia’, 2011. https:// www.ucl.ac.uk/dpu-projects/Global_Report/pdfs/Jakarta.pdf.
Padawangi, Rita, and Mike Douglass. ‘Water, Water Everywhere: Toward Participatory Solutions to Chronic Urban Flooding in Jakarta’. Pacific Affairs 88, no. 3 (1 September 2015): 517–50. https://doi.org/10.5509/2015883517.
Qibthiyyah, Riatu, and Ariane J. Utomo. ‘Family Matters: Demographic Change and Social Spending in Indonesia’. Bulletin of Indonesian Economic Studies 52, no. 2 (3 May 2016): 133–59. https://doi.org/10.1080/00074918.2016.1211077.
Ridwan, M., S. Widiyantoro, M. Irsyam, Afnimar, and H. Yamanaka. ‘Development of an Engineering Bedrock Map beneath Jakarta Based on Microtremor Array Measurements’. Geological Society, London, Special Publications 441, no. 1 (1 January 2017): 153. https:// doi.org/10.1144/SP441.7.
Salim, Wilmar. ‘Governing Housing Policies in Indonesia: Challenges and Opportunities’, 2015.
United Nations. ‘World Urbanization Prospects 2018 - Population Division - United Nations’. Accessed 22 July 2020. https://population.un.org/wup/.
Widoyoko, Danang. ‘Good Governance and Provision of Affordable Housing in DKI Jakarta’. WEDC, Loughborough University, 2007.
World Bank. ‘Jakarta Urban Challenges in a Changing Climate’, 2011. http://documents1.worldbank.org/curated/en/132781468039870805/ pdf/650180WP0Box360ange0Jakarta0English.pdf.
2.2 RIVER FLOOD AND MITIGATION
Cook, Edward A. ‘Urban Landscape Networks: An Ecological Planning Framework’. Landscape Research 16, no. 3 (1991): 7–15. https://doi.org/10.1080/01426399108706345.
Davis, Allen P. ‘Field Performance of Bioretention: Hydrology Impacts’. Journal of Hydrologic Engineering 13, no. 2 (2008): 90–95. https://doi.org/10.1061/(ASCE)10840699(2008)13:2(90).
Davis, McKenna, and Sandra Naumann. ‘Making the Case for Sustainable Urban Drainage Systems as a Nature-Based Solution to Urban Flooding’. In Nature-Based Solutions to Climate Change Adaptation in Urban Areas: Linkages between Science, Policy and Practice, edited by Nadja Kabisch, Horst Korn, Jutta Stadler, and Aletta Bonn, 123–137. Cham: Springer International Publishing, 2017. https://doi.org/10.1007/978-3-319-560915_8.
Ivers, B.C. Staging Urban Landscapes: The Activation and Curation of Flexible Public Spaces. Walter de Gruyter GmbH, 2018. https://books.google.co.uk/books?id=u36jswEACAAJ.
Lee, In-Keun. ‘Cheong Gye Cheon Restoration Project’, 2006, 7.
Lee, Jong Youl, and Chad David Anderson. ‘The Restored Cheonggyecheon and the Quality of Life in Seoul’. Journal of Urban Technology 20, no. 4 (2014): 3–22. https://doi.org/10.10 80/10630732.2013.855511.
Maharani, A M, and E Evawani. ‘Utilization of Residual Space on Ciliwung Riverbank’. IOP Conference Series: Earth and Environmental Science 248 (2019): 012072. https://doi. org/10.1088/1755-1315/248/1/012072.
Prominski, M., A. Stokman, D. Stimberg, H. Voermanek, S. Zeller, and K. Bajc. River.Space. Design: Planning Strategies, Methods and Projects for Urban Rivers. Walter de Gruyter GmbH, 2017. https://books.google.co.uk/books?id=1VoHvgAACAAJ.
Schoeneberger, Michele, Gary Bentrup, Henry de Gooijer, Raju Soolanayakanahally, Tom Sauer, James Brandle, Xinhua Zhou, and Dean Current. ‘Branching out: Agroforestry as a Climate Change Mitigation and Adaptation Tool for Agriculture’. Journal of Soil and Water Conservation 67, no. 5 (2012): 128A–136A. https://doi.org/10.2489/jswc.67.5.128A.
Vaculová, Veronika, and Roberta Štěpánková. ‘Application of Rain Gardens to an Urban Area – Housing Estate in Nitra, Slovakia’. Acta Horticulturae et Regiotecturae 20, no. 1 (1 May 2017): 1–5. https://doi.org/10.1515/ahr-2017-0001.
Vollmer, Derek, Diogo Costa, Ervine Shengwei Lin, Yazid Ninsalam, Kashif Shaad, Michaela F. Prescott, Senthil Gurusamy, et al. ‘Changing the Course of Rivers in an Asian City: Linking Landscapes to Human Benefits through Iterative Modeling and Design’. JAWRA Journal of the American Water Resources Association 51, no. 3 (June 2015): 672–88. https://doi. org/10.1111/1752-1688.12316.
Vollmer, Derek, and Adrienne Grêt-Regamey. ‘Rivers as Municipal Infrastructure: Demand for Environmental Services in Informal Settlements along an Indonesian River’. Global Environmental Change 23, no. 6 (2013): 1542–55. https://doi.org/10.1016/j. gloenvcha.2013.10.001. com/projects/wuhan-yangtze-riverfront-park/.
184 RIVER talise 185 REFERENCES
REFERENCES
1
INTRODUCTION
2.3 OPEN BUILDING SYSTEM & KIT OF PARTS
Vollmer, Derek, Andrea Nathalie Ryffel, Komara Djaja, and Adrienne Grêt-Regamey. ‘Examining Demand for Urban River Rehabilitation in Indonesia: Insights from a Spatially Explicit Discrete Choice Experiment’. Land Use Policy 57 (2016): 514–25. https://doi. org/10.1016/j.landusepol.2016.06.017.
Yang, Zesu, Qiang Zhang, and Xiaocui Hao. ‘Evapotranspiration Trend and Its Relationship with Precipitation over the Loess Plateau during the Last Three Decades’. Edited by Gang Liu. Advances in Meteorology 2016 (29 June 2016): 6809749. https://doi. org/10.1155/2016/6809749.
T U Z Noviandi et al IOP Conf. Ser.: Earth Environ. Sci. 91 012033
‘Riparian landscape management in the midstreamof Ciliwung River as supporting Water SensitiveCities program with priority of productive ‘,(2017 )
Accessed 8 June,2020.https://www.researchgate.net/publication/320952207_Riparian_ landscape_management_in_the_midstream_of_Ciliwung_River_as_supporting_Water_ Sensitive_Cities_program_with_priority_of_productive_landscape
Arifasihati Y, Kaswanto. ‘Analysis of Land Use and Cover Changes in Ciliwung and Cisadane Watershed in three Decades.’ (2016) Procedia Environmental Sciences 33:465-469.
Kaswanto.’ Land Suitability for Agrotourism Through Agriculture, Tourism, Beautification and Amenity (ATBA) Method’. (2015) Procedia Environmental Sciences 24:35-38.
Helfield J, Engström J, Michel J, Nilsson C, Jansson R. ‘Effects of river restoration on riparian biodiversity in secondary channels of the Pite River, Sweden’. (2015) J Environ. Manage. 49(1):130-141.
Rini Suryantini, Galavia Permata, Dini Putri Angelia Planning green patch: toward an ecological place of Ciliwung Condet’, (2018)
Accessed 8 June,2020. https://www.researchgate.net/publication/330956994_Planning_ green_patch_toward_an_ecological_place_of_Ciliwung_Condet
‘Liupanshui Minghu Wetland Park by Turenscape’
Accessed 18 December, 2020. https://www.metalocus.es/en/news/liupanshui-minghuwetland-park-turenscape
Sasaki. ‘Wuhan Yangtze Riverfront Park’. Accessed 22 July 2020. https://www.sasaki.
2.4
Friedman, A. The Adaptable House: Designing Homes for Change. McGraw-Hill, 2002. https://books.google.co.uk/books?id=B-qVb__HjxUC.
Howe, A. Scott, Ismau Ishii, and Tomohiro Yoshida. ‘Kit-of-Parts: A Review of ObjectOriented Construction Techniques’. In Proceedings of the 16th IAARC/IFAC/IEEE International Symposium on Automation and Robotics in Construction, edited by Carlos Balaguer, 165–72. Madrid, Spain: International Association for Automation and Robotics in Construction (IAARC), 1999. https://doi.org/10.22260/ISARC1999/0025.
Kendall, Stephen. ‘Open Building: An Approach to Sustainable Architecture’. Journal of Urban Technology 6, no. 3 (1999): 1–16. https://doi.org/10.1080/10630739983551.
REFERENCES
Warouw, Fela, Hideki Kobayashi, and Jiyoung Jung. ‘A Study on the Open Building System for Multi-Storey Housing in Indonesia’. Journal of Asian Architecture and Building Engineering 9, no. 2 (2010): 339–46. https://doi.org/10.3130/jaabe.9.339.
Basumatary, Anusriti, Sushil Middha, Usha Talambedu, Birendra Brahma, and Arvind GOYAL. ‘Bamboo, as Potential Sources of Food Security, Economic Prosperity and Ecological Security in North-East India: An Overview’.
Fatimah, Titin. ‘Community-Based Spatial Arrangement for Sustainable Village Environmental Improvement – Case Study of Candirejo Village, Borobudur, Indonesia’. Energy Procedia 153 (2018): 389–95. https://doi.org/10.1016/j.egypro.2018.10.074.
Helliwell, Christine. ‘Good Walls Make Bad Neighbours: The Dayak Longhouse as a Community of Voices’. In Inside Austronesian Houses, edited by James J. Fox, 21. ANU Press, 2006.
Hidayat, Mohd Syarif, and Riki Suhendar. ‘The Assessment of Building Envelope Performance of Vernacular Architecture in Betawi House’, 2018.
Idham, Noor Cholis. ‘Javanese Vernacular Architecture and Environmental Synchronization Based on the Regional Diversity of Joglo and Limasan’. Frontiers of Architectural Research 7, no. 3 (2018): 317–33. https://doi.org/10.1016/j.foar.2018.06.006.
Ismail, W.H.W. Houses In Malaysia: Fusion of the East and the West. Penerbit Universiti Teknologi Malaysia, 2005. https://books.google.co.uk/books?id=Q7jZBQAAQBAJ.
Lee, Chui Ying, Shinji Kaneko, and Ayyoob Sharifi. ‘Effects of Building Types and Materials on Household Electricity Consumption in Indonesia’. Sustainable Cities and Society 54 (2020): 101999. https://doi.org/10.1016/j.scs.2019.101999.
Lim, J.Y. The Malay House: Rediscovering Malaysia’s Indigenous Shelter System. Institut Masyarakat, 1987. https://books.google.co.uk/books?id=wnPbAAAAMAAJ.
Manandhar, Rashmi, Jin-Hee Kim, and Jun-Tae Kim. ‘Environmental, Social and Economic Sustainability of Bamboo and Bamboo-Based Construction Materials in Buildings’. Journal of Asian Architecture and Building Engineering 18, no. 2 (2019): 49–59. https://doi.org/10 .1080/13467581.2019.1595629.
Masri, Mawar, Rodzyah Mohd Yunus, and Sabarinah Sh Ahmad. ‘The Serambi: Inculcation of Socio-Cultural Values in Malay Traditional Home Design’. Procedia - Social and Behavioral Sciences 234 (2016): 255–64. https://doi.org/10.1016/j.sbspro.2016.10.241.
NAS, PETER J. M. ‘The House in Indonesia: Between Globalization and Localization’. Bijdragen Tot de Taal-, Land- En Volkenkunde 154, no. 2 (1998): 335–360.
Patterson, Arthur H., and Nancy R. Chiswick. ‘The Role of the Social and Physical Environment in Privacy Maintenance among the Iban of Borneo’. Journal of Environmental Psychology 1, no. 2 (1981): 131–39. https://doi.org/10.1016/S0272-4944(81)80003-5.
———. ‘The Role of the Social and Physical Environment in Privacy Maintenance among the Iban of Borneo’. Journal of Environmental Psychology 1, no. 2 (June 1981): 131–39. https://doi.org/10.1016/S0272-4944(81)80003-5.
186 RIVER talise 187
REFERENCES
VERNACULAR ARCHITECTURE
Rashid, Mamun, and Dilshad Rahat Ara. ‘Modernity in Tradition: Reflections on Building Design and Technology in the Asian Vernacular’. Frontiers of Architectural Research 4, no. 1 (2015): 46–55. https://doi.org/10.1016/j.foar.2014.11.001.
Sharma, Bhavna, Ana Gatoo, Maximilian Bock, Helen Mulligan, and Michael Ramage. ‘Engineered Bamboo: State of the Art’. Proceedings of the Institution of Civil EngineersConstruction Materials 168, no. 2 (2015): 57–67. https://doi.org/10.1680/coma.14.00020.
Sharma, Bhavna, Ana Gatóo, Maximilian Bock, and Michael Ramage. ‘Engineered Bamboo for Structural Applications’. Construction and Building Materials 81 (2015). https://doi. org/10.1016/j.conbuildmat.2015.01.077.
WINZELER, ROBERT L. The Architecture of Life and Death in Borneo. University of Hawai’i Press, 2004. www.jstor.org/stable/j.ctt6wqs0v.
———. ‘THE LONGHOUSE’. In The Architecture of Life and Death in Borneo, 49–78. University of Hawaii Press, 2004. www.jstor.org/stable/j.ctt6wqs0v.6.
3 RESEARCH DEVELOPMENT
ASIAN DEVELOPMENT BANK. INDONESIA COUNTRY WATER ASSESSMENT. ASIAN DEVELOPMENT BANK, 2016.
Bott, Lisa-Michéle, Leda Ankel, and Boris Braun. ‘Adaptive Neighborhoods: The Interrelation of Urban Form, Social Capital, and Responses to Coastal Hazards in Jakarta’. Geoforum 106 (November 2019): 202–13. https://doi.org/10.1016/j.geoforum.2019.08.016.
‘Household_size_and_composition_around_the_world_2017’. Accessed 2 October 2020. https://www.un.org/en/development/desa/population/publications/pdf/ageing/ household_size_and_composition_around_the_world_2017_data_booklet.pdf.
Lin, Ervine, Kashif Shaad, and Christophe Girot. ‘Developing River Rehabilitation Scenarios by Integrating Landscape and Hydrodynamic Modeling for the Ciliwung River in Jakarta, Indonesia’. Sustainable Cities and Society 20 (January 2016): 180–98. https://doi. org/10.1016/j.scs.2015.09.011.
Qibthiyyah, Riatu, and Ariane J. Utomo. ‘Family Matters: Demographic Change and Social Spending in Indonesia’. Bulletin of Indonesian Economic Studies 52, no. 2 (2016): 133–59. https://doi.org/10.1080/00074918.2016.1211077.
RIPARIAN LANDSCAPE
Rini Suryantini, Galavia Permata, Dini Putri Angelia Planning green patch: toward an ecological place of Ciliwung Condet’,2018
Accessed 8 June,2020. https://www.researchgate.net/publication/330956994_Planning_ green_patch_toward_an_ecological_place_of_Ciliwung_Condet
Gonzales, E., Sher, A. A., Tabacchi, E., Masip, A., & Poulin, M. . ‘Restoration of riparian vegetation: A global review of implementation and evaluation approaches in the international, peer-reviewed literature’ (2015). Journal of Environmental Management, 8594.
Rina Suprihati, Nuhfil Hanani, S. Gatot Irianto, Soemarno.’Buffering capacity of paddy field as the reservoir of rainwater and surface runoff in the Lowokwaru subdistrict, Malang, East Java’, (2018). J Journal of degraded and mining lands management, Volume 5, Number 2 : 1065-1076
Journal of degraded and mining land management
Accessed 8 June,2020. https://www.researchgate.net/publication/322210257_Buffering_ capacity_of_paddy_field_as_the_reservoir_of_rainwater_and_surface_runoff_in_the_ Lowokwaru_subdistrict_Malang_East_Java
Wu, R.S., Sue, W.R., Chien, C.B., Chen, C.H., Channg,J.S. and Lin, K.M. ‘A simulation model for investigating the effects of rice paddy fields on the runoff system. Mathematical and Computer Modelling’ (2001) 33(6–7): 649–658.
188 RIVER talise 189 REFERENCES
REFERENCES
APPENDIX
190 RIVER talise 191
RIPARIAN BUILDINGS DESIGN PRINCIPLES
For the building blocks in the riparian zone, the main strategy to tolerate flooding is to raise the buildings on piers. Design principles about pier arrangement patterns were explored with CFD experiments. The general aim for these experiments are to arrive at the design principles for riparian building piers such that they would disrupt and divert flood flow, reducing its speed and impact on the embankment structures, thus reducing their need for maintenance.
The experiment was conducted on 4 different pier patterns with variations of staggering and / or distance between piers with inflow velocity of 1.05 m/s
The pattern most efficient is one with regular spacing and staggering (top, right) in x and y directions.
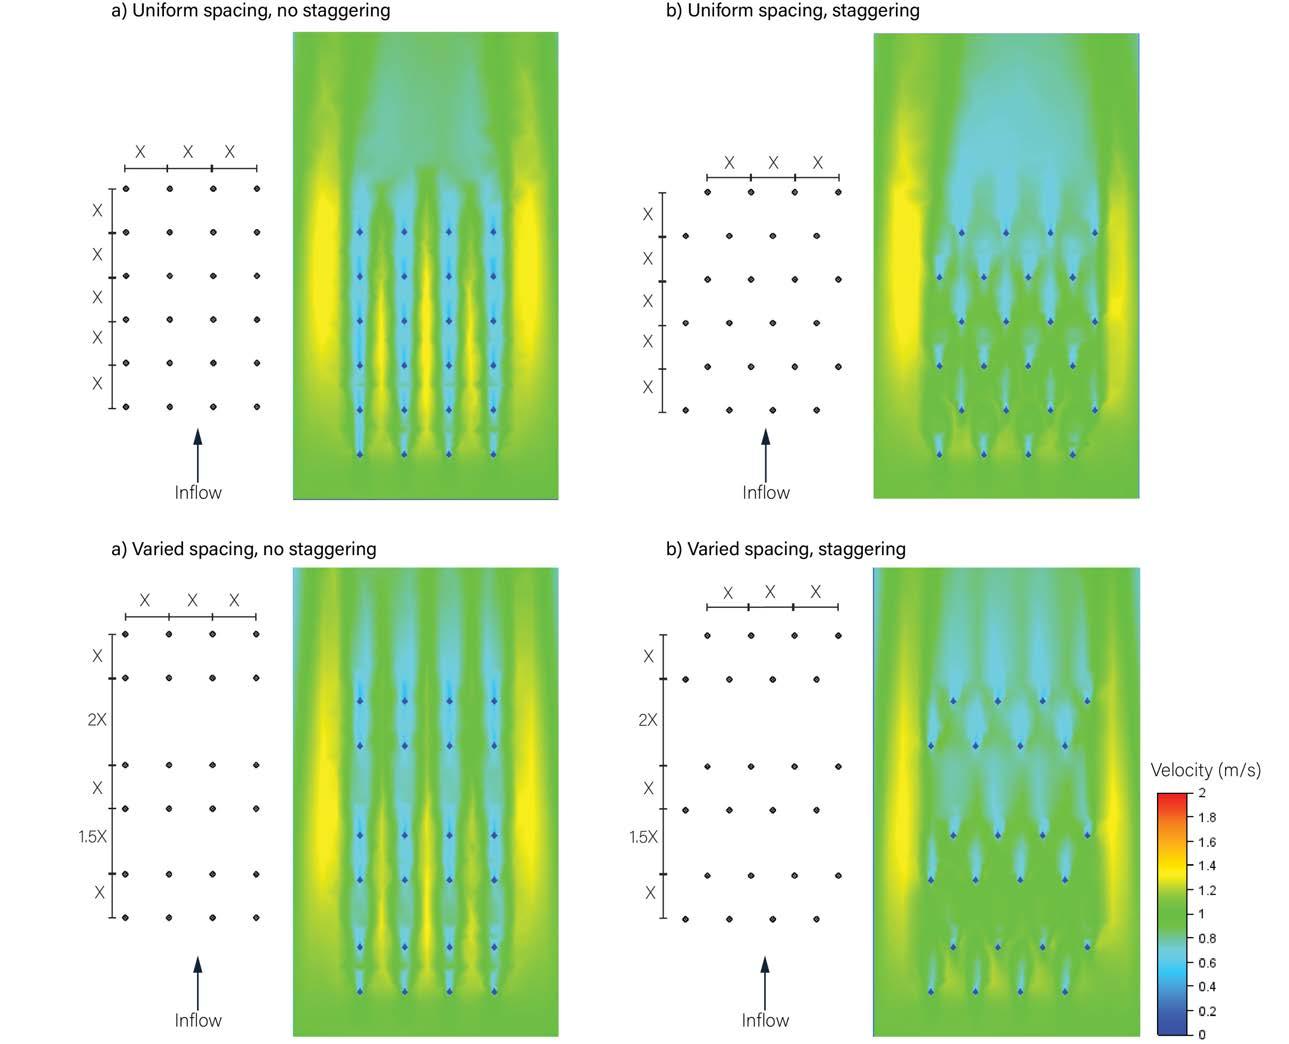
192 RIVER talise 193
APPENDIX APPENDIX
RIPARIAN DISTRIBUTION
PRINCIPLES
Following the individual explorations at urban and architectural scale, synthesis of the strategies was explored to allow integration of the solutions at the two scales. This was approached by experimenting with the distribution of buildings with multi objective optimisation through genetic algorithm (GA). The GA experiments considers the context of the two different types of clusters: the flood prone riparian clusters, and nonflood prone urban clusters. The outcome of the GA experiment, which is the building distribution at urban scale, were used as boundary conditions to generate individual buildings using the GA outlined in the previous section.
Initial CFD experiment has been carried out to explore effects that different geometry of building footprint and orientation have in terms of slowing flood flow and reducing impact on the embankment structures. The building outlines are generated with 3.6m x 3.6m building grid with staggering pattern, as derived in the previous section.
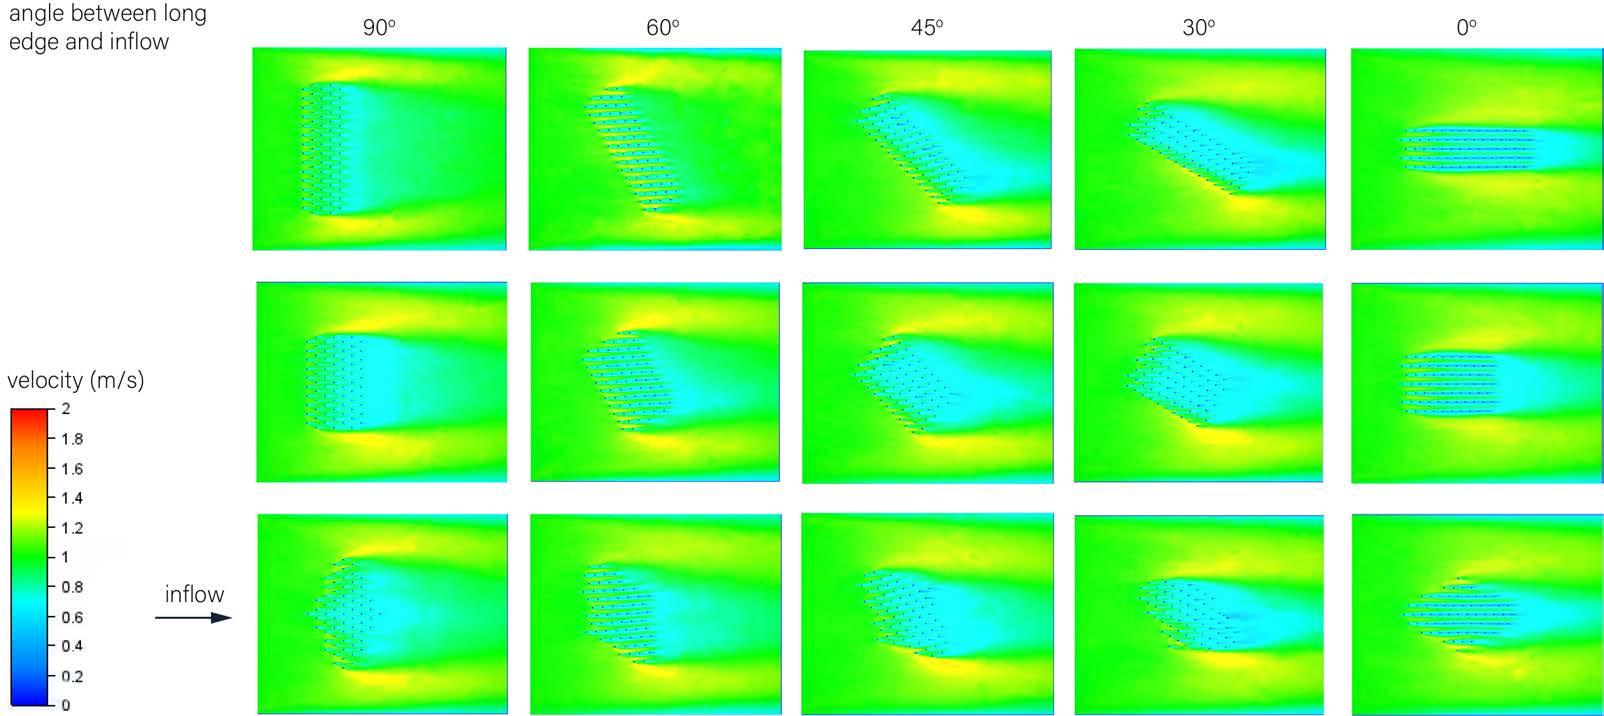
Inflow velocity: 1 m/s
fig 4.3.1.1(right-top): One direction flow
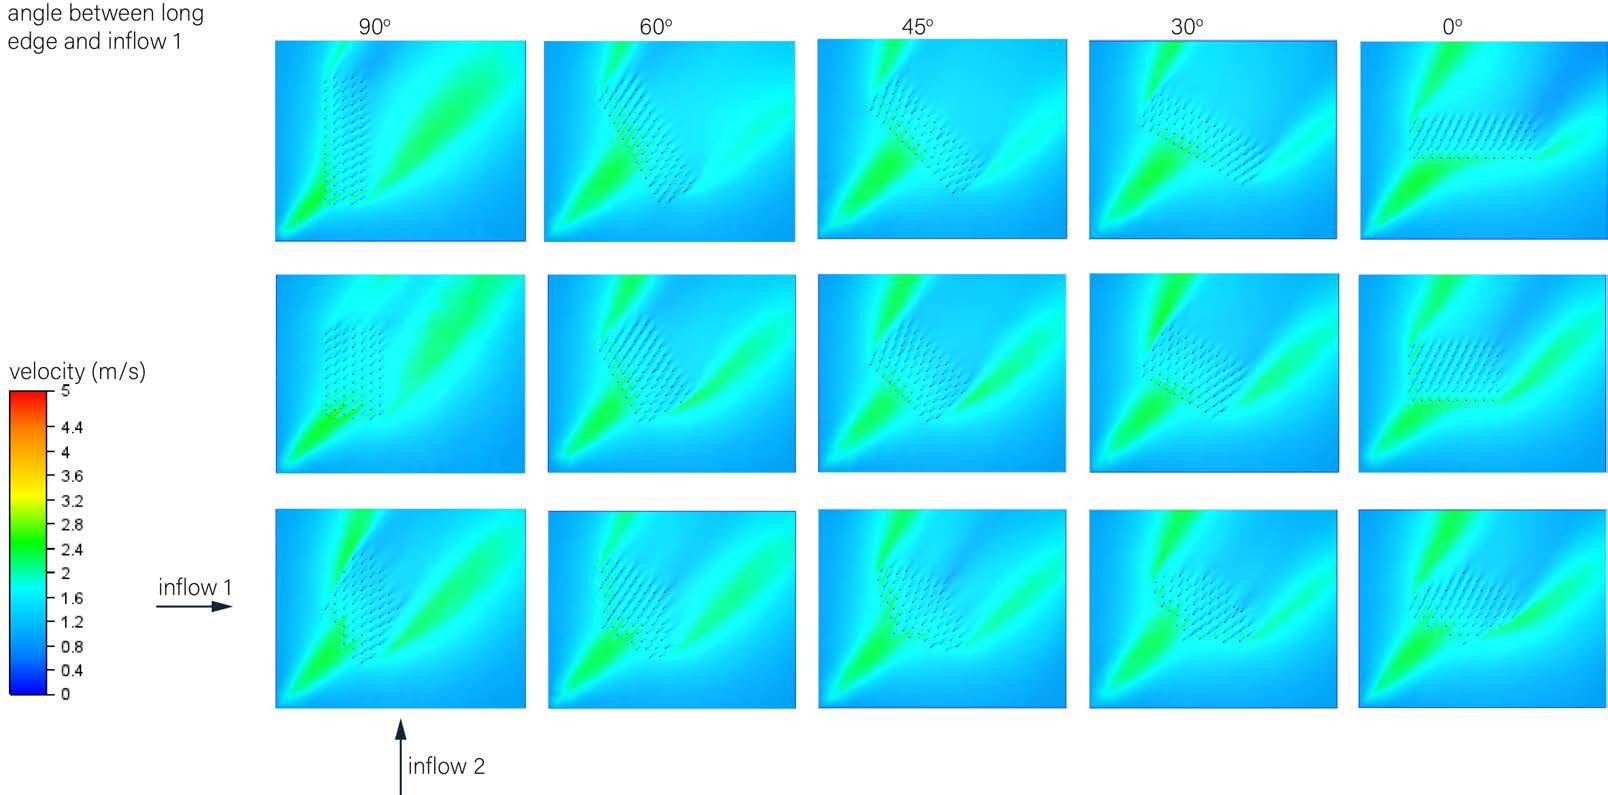
fig 4.3.1.2(right-bottom): Two direction flow
The rectangular outline has performed the best to slow down water velocity among other outlines based on water velocity behind the building. The most efficient orientation is when the long side of the building is aligned to 90o to the inflow. In the case of more than one direction of inflow is close to the building, average of the angel perpendicular to each inflow should be taken (45o in this experiment).
194 RIVER talise 195
APPENDIX APPENDIX
BUILDING DISTRIBUTION_ RIPARIAN
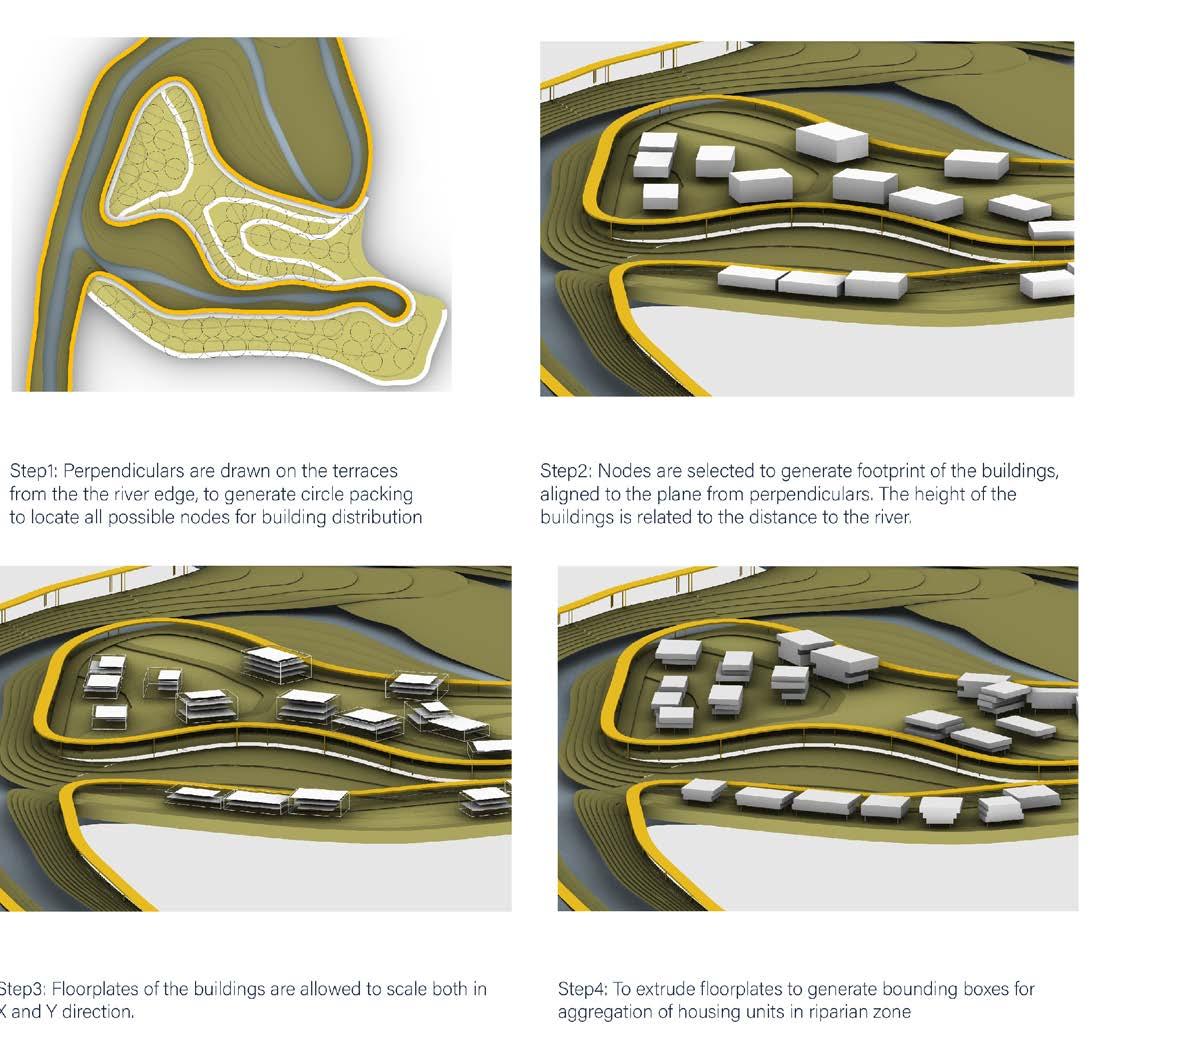
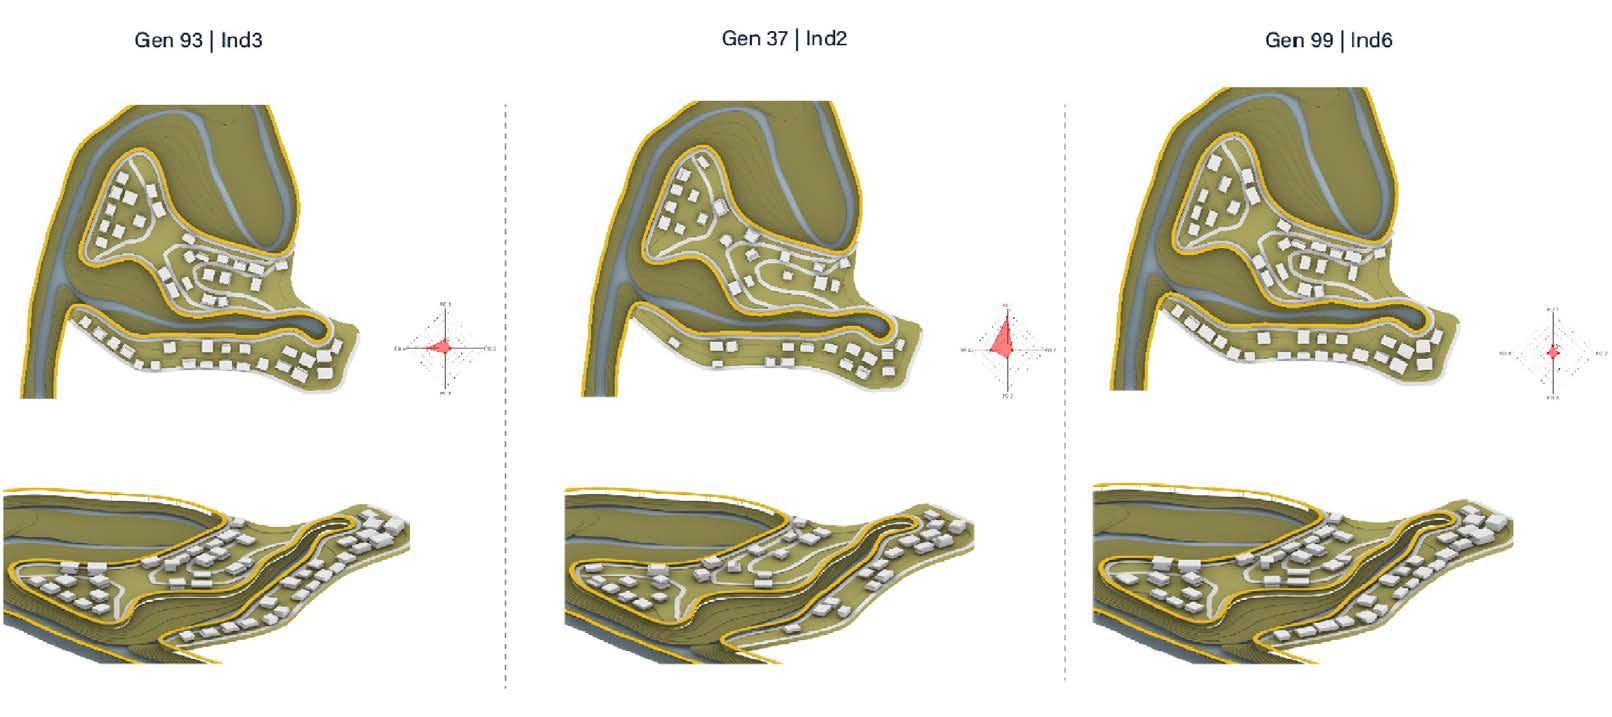
196 RIVER talise 197
APPENDIX APPENDIX
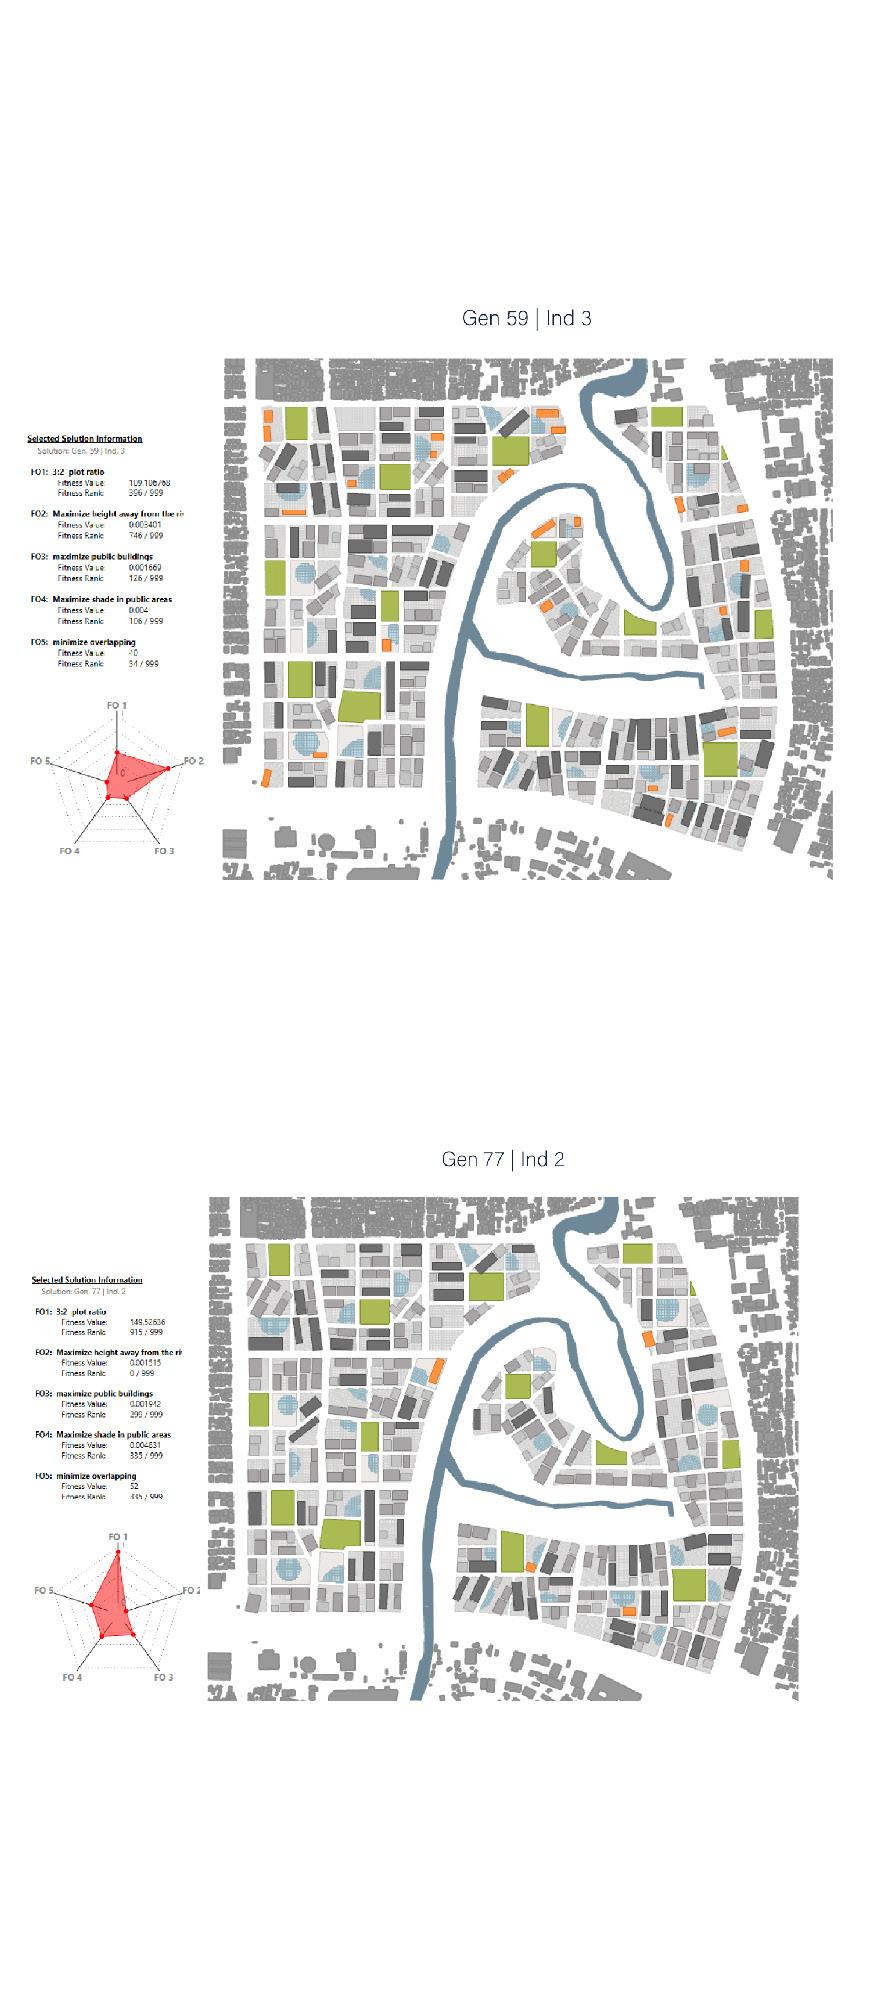
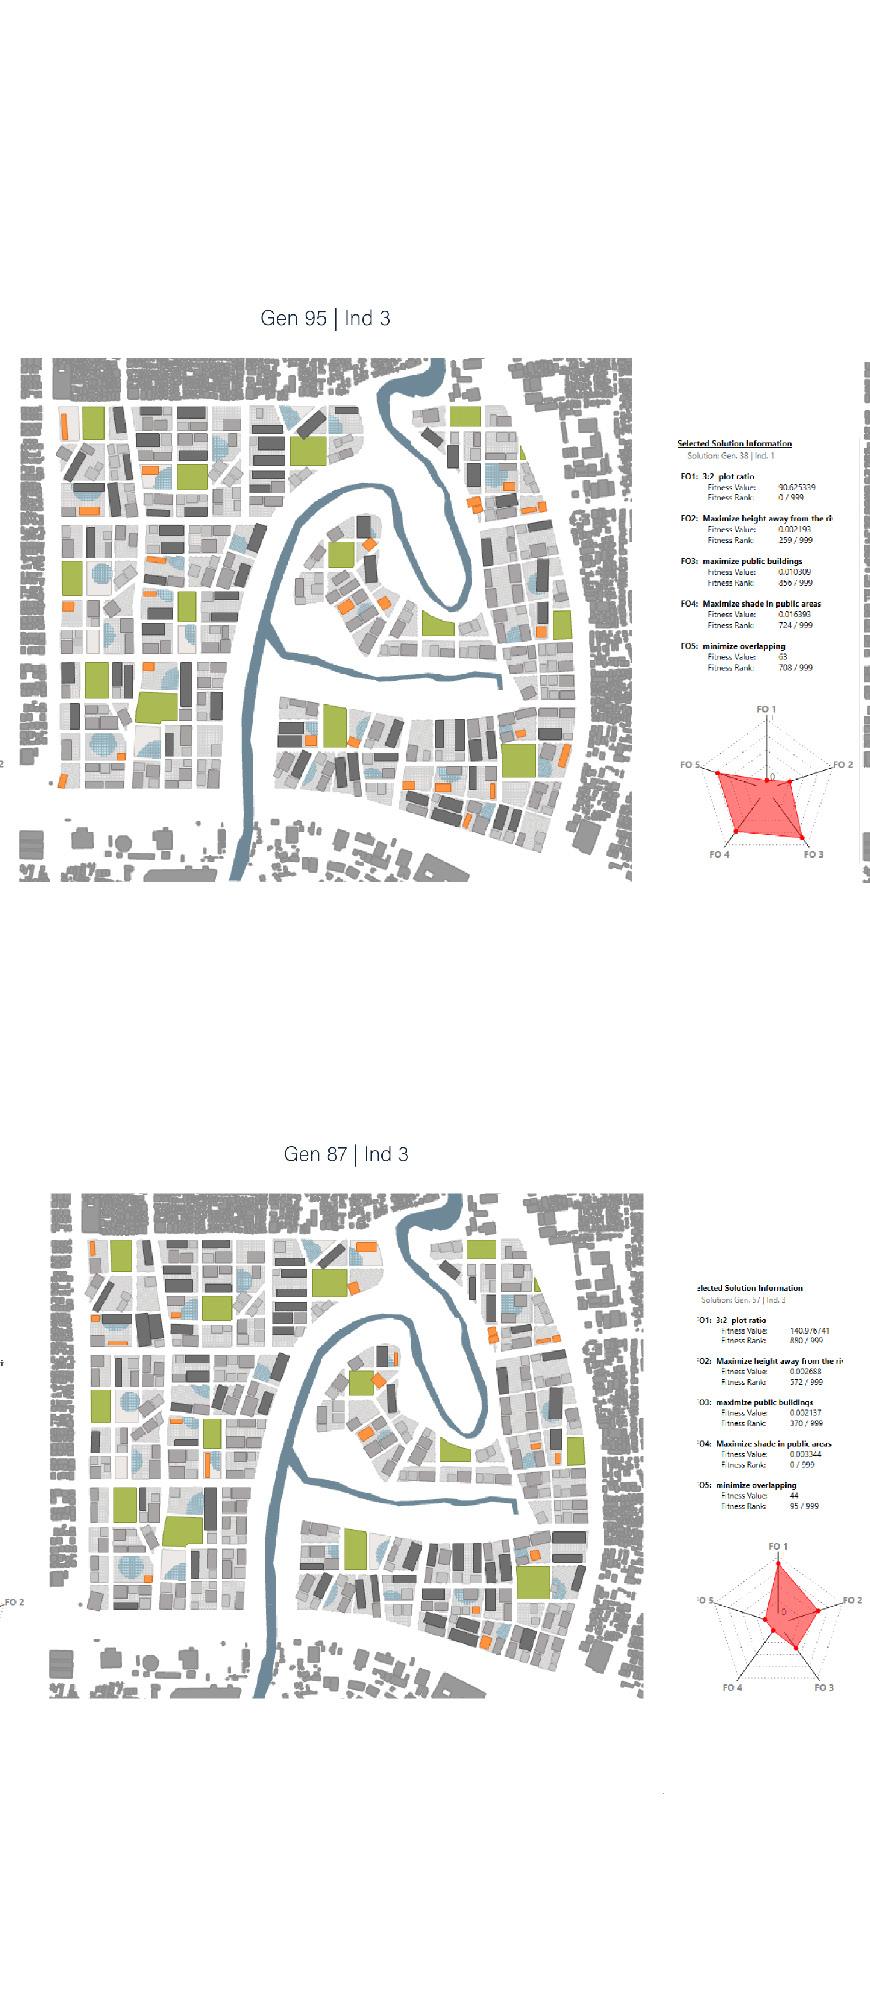
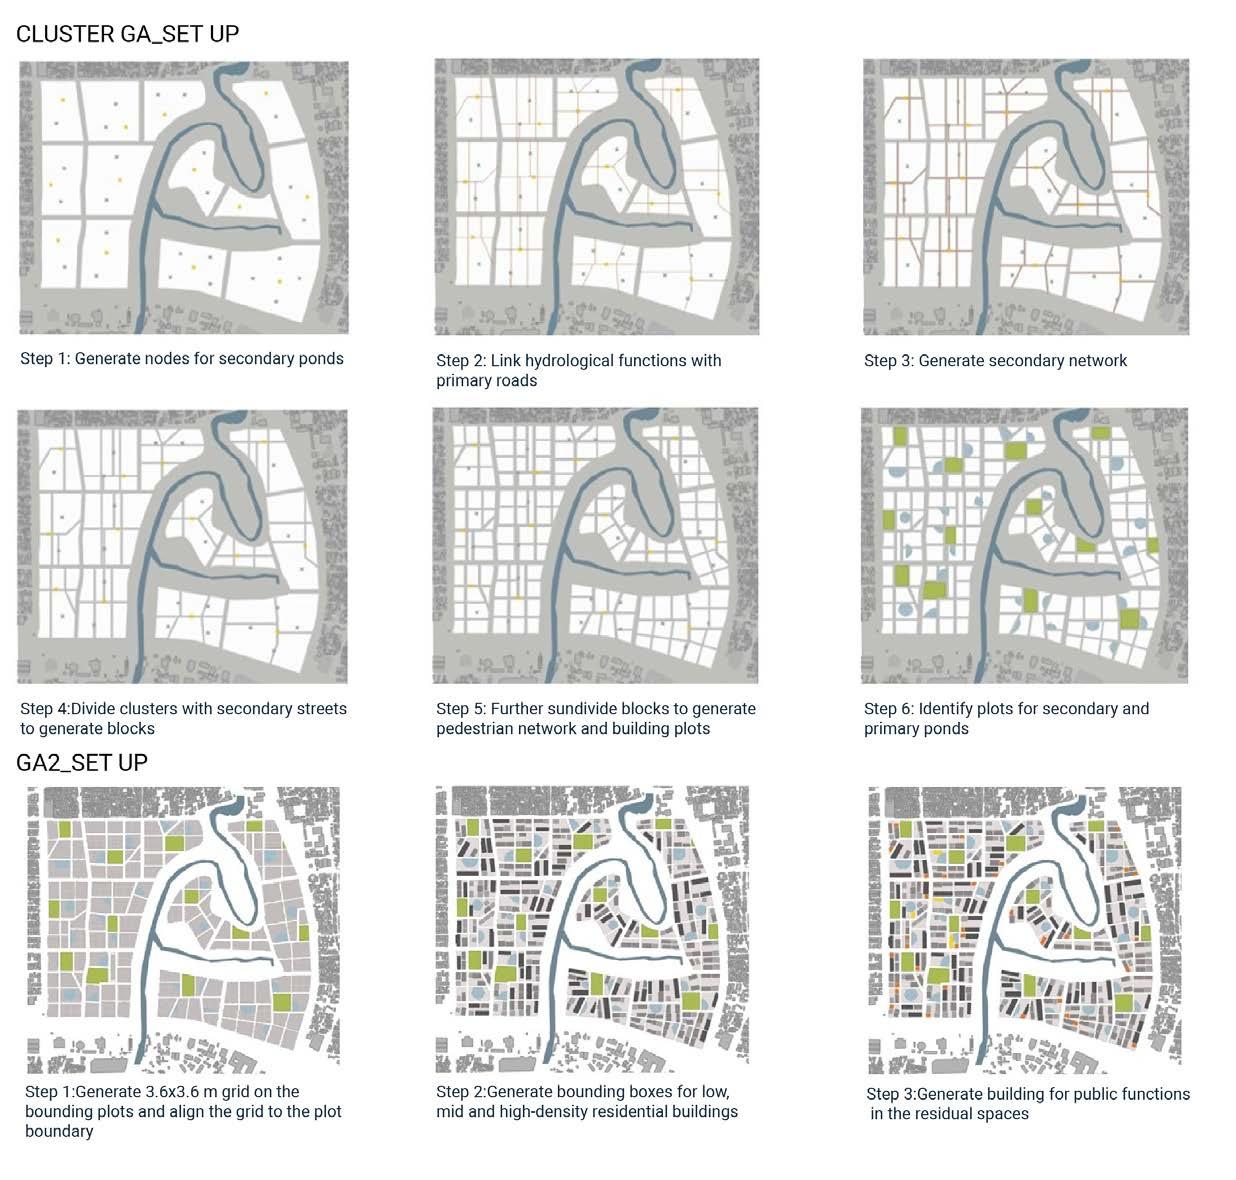
198 RIVER talise 199
URBAN APPENDIX APPENDIX
BUILDING DISTRIBUTION_
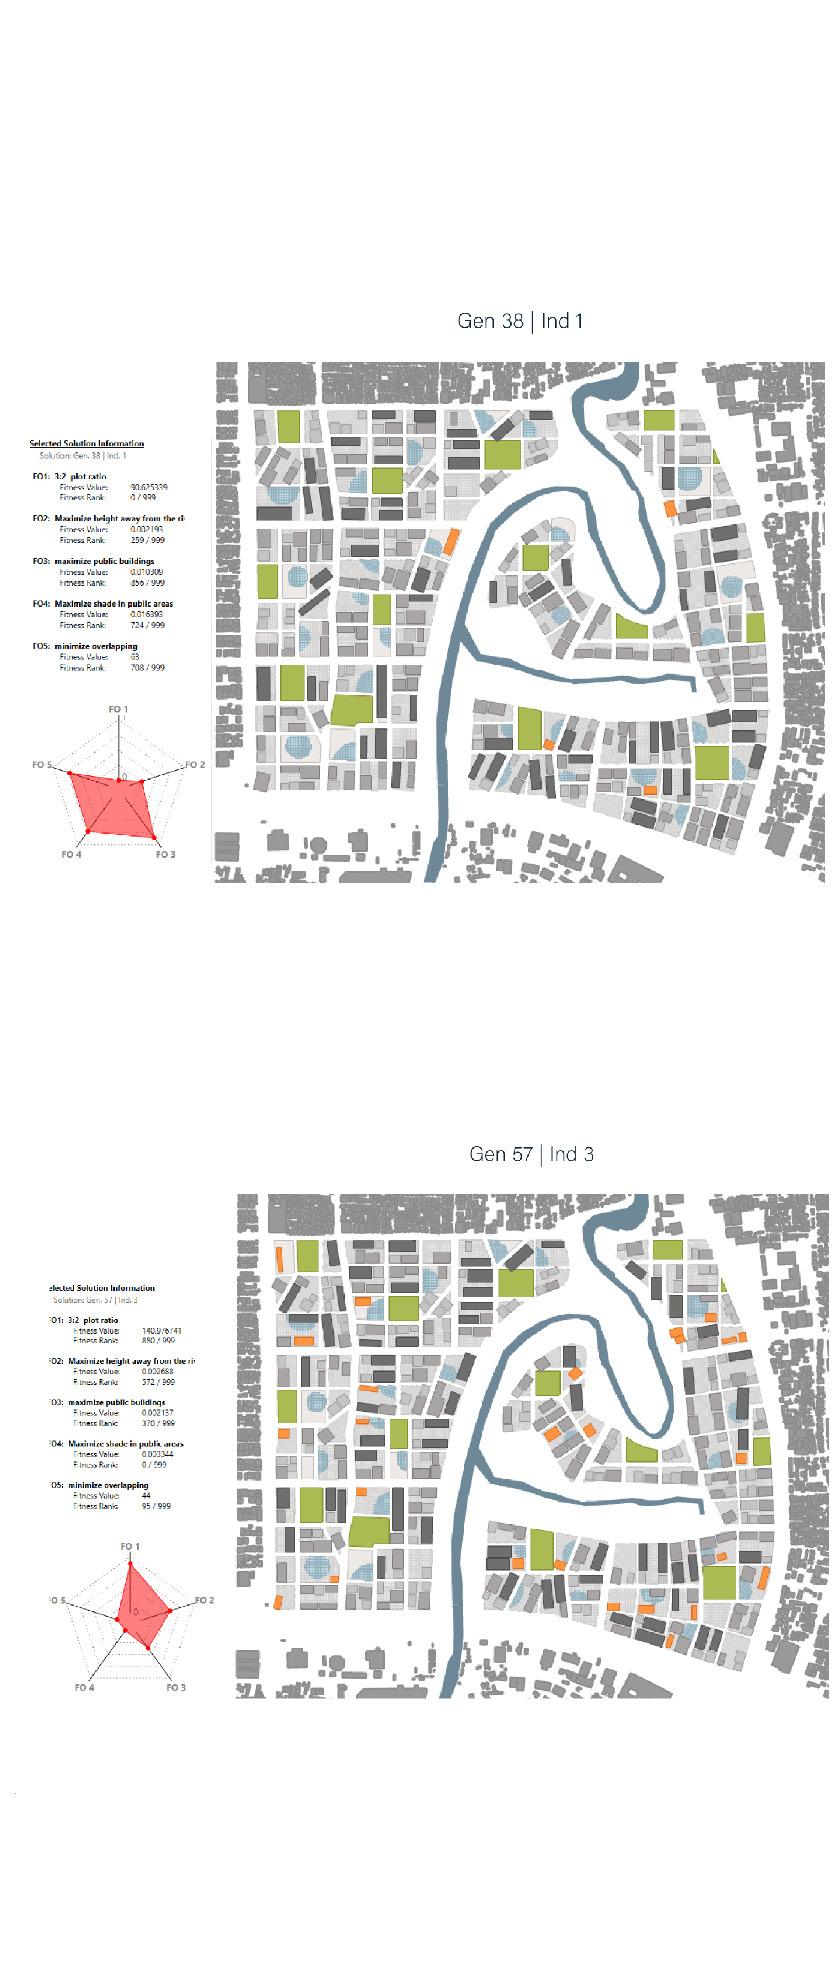
200 RIVER talise 201 APPENDIX APPENDIX
SPATIAL AGGREGATION ALGORITHM
Inputs:
Grid Unitised grid representing the building (unit dimension - 1)
Extended List of possible outlines for extended units
E_id List of indices for this solution (controlled by gene pool in grasshopper)
Above for Family, Simple, and Compact typologies
Utility - Location of utility cores (controlled by gene in grasshopper)”””
import rhinoscriptsyntax as rs import ghpythonlib.treehelpers as th
a_core = Utility
a_grid = Grid
E_no = len(E_id)
E_location =[] for e in range (0, E_no): outline = Extended.Branch(E_id[e]) cells = len(outline) found = False = 0
while < len(a_core) and found == False:
n = 0
while n < cells and found == False: temp = []
location = a_core[l]
start = outline[n]
for c in range (0, cells):
temp.append(outline[c]-start+location) valid = all(pt in a_grid for pt in temp) if valid == True: u=0
c_temp =[] for pt in temp: if pt in a_core: u = u+1
c_temp.append(a_core.index(pt)) if u == 2: found = True for i in sorted(c_temp, reverse=True): a_core.pop(i) else: n += 1 else: n += 1 += 1 if found == True:
E_location.append(temp)
g_temp =[]
for pt in temp:
g_temp.append(a_grid.index(pt))
for in sorted(g_temp, reverse=True):
a_grid.pop(i) print found
E_location = th.list_to_tree(E_location, source =[0])
F_no = len(F_id)
F_location =[]
for f in range (0, F_no): outline = Family.Branch(F_id[f]) cells = len(outline) found = False = 0
while < len(a_core) and found == False: n = 0
while n < cells and found == False: temp = [] location = a_core[l]
start = outline[n] for c in range (0, cells): temp.append(outline[c]-start+location) valid = all(pt in a_grid for pt in temp)
if valid == True:
u=0
c_temp =[] for pt in temp: if pt in a_core:
u = u+1
c_temp.append(a_core.index(pt)) if u == 1:
found = True
for in sorted(c_temp, reverse=True): a_core.pop(i)
else: n += 1
else: n += 1
l += 1
if found == True:
F_location.append(temp)
g_temp =[] for pt in temp:
g_temp.append(a_grid.index(pt))
for in sorted(g_temp, reverse=True): a_grid.pop(i)
print found
F_location = th.list_to_tree(F_location, source =[0])
S_no = len(S_id)
S_location =[]
for s in range (0, S_no):
outline = Simple.Branch(S_id[s]) cells = len(outline) found = False = 0
while < len(a_core) and found == False:
n = 0
while n < cells and found == False: temp = []
location = a_core[l]
star = outline[n]
for c in range (0, cells): temp.append(outline[c]-start+location)
valid = all(pt in a_grid for pt in temp)
if valid == True:
202 RIVER talise 203 APPENDIX
APPENDIX
The following algorithm was written in Python for Grasshopper as part of the building generation GA.
u=0
c_temp =[] for pt in temp: if pt in a_core: u = u+1
c_temp.append(a_core.index(pt)) if u == 1: found = True for i in sorted(c_temp, reverse=True): a_core.pop(i)
else: n += 1
else: n += 1 += 1 if found == True:
S_location.append(temp)
g_temp =[] for pt in temp:
g_temp.append(a_grid.index(pt)) for in sorted(g_temp, reverse=True): a_grid.pop(i)
print found
S_location = th.list_to_tree(S_location, source =[0])
C_no = len(C_id)
C_location =[] for c in range (0, C_no):
outline = Compact.Branch(C_id[c])
cells = len(outline)
found = False = 0
while < len(a_core) and found == False: n = 0
while n < cells and found == False: temp = [] location = a_core[l]
start = outline[n] for c in range (0, cells): temp.append(outline[c]-start+location)
valid = all(pt in a_grid for pt in temp) if valid == True:
u=0
c_temp =[] for pt in temp: if pt in a_core: u = u+1
c_temp.append(a_core.index(pt)) if u == 1:
found = True for i in sorted(c_temp, reverse=True): a_core.pop(i) else: n += 1 print found
C_location = th.list_to_tree(C_location, source =[0])
else: n += 1 += 1 if found == True:
C_location.append(temp)
g_temp =[] for pt in temp:
g_temp.append(a_grid.index(pt))
for in sorted(g_temp, reverse=True): a_grid.pop(i)
204 RIVER talise 205
APPENDIX
