22 minute read
Process Optimization of PVDF Piezoelectric Nanofiber Production via Electrospinning


Acta Universitatis Sapientiae Electrical and Mechanical Engineering, 13 (2021) 113 DOI: 10.2478/auseme-2021-0001
Advertisement
Attila Levente GERGELY1 , József KÁNTOR2
Sapientia Hungarian University of Transylvania, Cluj-Napoca,
Faculty of Technical and Human Sciences, Târgu Mureș, Department of Mechanical Engineering, e-mail: 1agergely@ms.sapientia.ro, 2kantorjozsef@ms.sapientia.ro
Manuscript received October 20, 2021; revised November 01, 2021
Abstract: The aim of this work was to investigate the effect of processing parameters of the electrospinning method on the resulting poly (vinylidene fluoride) (PVDF) fiber diameter. A three factorial Box-Behnken experimental design was employed to study the influence of applied voltage, the capillary-to-collector distance and the applied flow rate on the resulting fiber diameter. We successfully prepared bead-free PVDF nanofibers with fiber diameters ranging from 510-1300 nm. The experimental design analysis did not show significant influence of the studied process parameters under the used boundary conditions on the fiber diameter, thus indicating the robustness of the process.
Keywords: PVDF, electrospinning, nanofiber, piezoelectricity, polymer processing.
1. Introduction
There is a constant need to develop better and more efficient processes for sensor applications. In this respect the use of nanofibers offers high potential in several applications due to their unique properties. The deposition of nanofibers provides a fiber mat, a structure that has a high surface-area-to-volume ratio. The surface-to-volume ratio is inversely proportional to the characteristic crosssectional dimension of the fibers - usually referred to as fiber diameter, as most fibers have near-circular cross-section. Taking advantage of this property, research groups experimented with fiber mats in multiple domains, some noteworthy applications being filters, scaffolds for cell growth, carriers for drug delivery, catalysis, sensors and actuators [1], [2].
Electrospinning is a widely used method to create polymeric fibers, due to the simplicity of its setup for small scale production under laboratory
2 A. L. Gergely, and J. Kántor
conditions. The process involves the placement of a polymer solution droplet into an electric field, while the droplet is in contact with the positive electrode of the instrument. When there is adequate positive charge buildup on the surface of the droplet, it starts to deform, creating the Taylor cone. Eventually the electrostatic forces overcome the surface tension and an electrified jet is created [3]. If new solution is fed into the droplet with the appropriate volumetric flow rate, the Taylor cone and the jet can be maintained at a steady state. The electrified jet travelling from the positive electrode to the grounded electrode (collector) gets elongated by the Coulomb forces and in the process it loses mass by solvent evaporation. At some point the thinning jet becomes unstable due to the increasing volumetric charge density, arranging itself into a coil-like shape and starts a whipping motion. This is called the bending instability, and it causes the jet to travel a much longer distance until reaching the collector than a straight line between the positive electrode and the collector [4]. The elongation of the jet proceeds until it either reaches the collector or dries out enough that the viscoelastic forces become stronger than the Coulomb forces.
The size and morphology of the polymeric fibers produced with electrospinning have a great variety, depending on the materials involved and the process parameters. The fiber sizes range from several micrometers to tens of nanometers, but the most common is the several hundreds of nanometers. The fibers are usually deposited in a random manner (non-woven fiber mats), and extra effort is required to orient the fibers in certain ways. The different fiber mat morphologies can provide different uses [5], [6]. It was found that in keratinocyte cell cultures cell proliferation in a PVA fiber mat with fiber size of 70 nm wasn’t different from the control (natural extracellular matrix), while 300 nm fibers resulted in a 100% increase in cell proliferation during a 5-day period. Further increasing the fiber size to 1000 nm caused a decrease in cell proliferation rate compared to 300 nm, but it was still 30% higher than the control [5]. Bian et al. published results on filters made of nylon fibers which showed that the removal efficacy of particles (size smaller than 2.5 μm) was close to 98% at ~50 nm fiber size, and gradually dropped to 60% as fiber size increased to 250 nm. [6]
Thus, it is desirable to control the morphological aspects (e.g. fiber size, porosity, orientation, packing density, presence of beads) of the created fiber mats, and to determine which process parameter affects these the most.
Focusing on the fiber size, according to theory, the higher the volumetric charge density in a certain jet segment, the stronger the tensile force, thus the more intensive the elongation. Increasing the voltage increases the volumetric charge density in the solution [7], and in the model system of polyethylene oxide (PEO)/water it was proven that electrospinning at higher charge densities yields thinner fibers [8]. The distance between the positive and the grounded
Process Optimization of PVDF Piezoelectric Nanofiber Production via Electrospinning 3
electrode (needle-collector, NC distance) has multiple ways of interacting with the fiber size. At a given voltage the longer NC distance yields lower electric field strength, and thus causes the weakening of the electrostatic forces [7]. However, a longer NC distance also allows more time for the jets to elongate and for the solvent to evaporate. The rate of solvent evaporation is also crucial as it influences the viscoelastic properties of the jet [3], [9]. Other important factors include solution viscosity, ambient temperature and relative humidity, surface tension, relaxation delay [10].
Published experimental data on the correlation of electrospinning parameters and fiber size is somewhat controversial. For example some studies showed that increasing the applied voltage made the produced fibers thinner [11]–[13], but there are also studies that showed the opposite effect [14]. This indicates that, as of now, there is no generally applicable model for all polymer/solvent systems, and each system has to be studied individually in order to find the optimal electrospinning conditions.
Polyvinylidene fluoride (PVDF) is a semi-crystalline polymer that could exhibit piezoelectric properties [15]. There are five known crystal phases (α, β, γ, δ, ε), [16] and the β-phase and to a lesser extent the γ- and δ-phases contribute to the piezoelectic behavior. The β-phase is the parallel packing of the all-anti configuration of PVDF molecules (also referred to as all-trans in the relevant literature), which is polar in nature and capable of inducing the highest dipole moments out of all the crystal phases [17]. Due to its thermodynamic stability, the α-phase is usually overrepresented in the produced PVDF films. The transition from α- to β-phase was initially achieved with energy-intensive procedures requiring pressures up to 5000 atm and 285°C [17]. More recently electrical poling has been used, that involves the stretching of the sheet at elevated temperature and placing it in an electric field of 107 V/m order of magnitude [18].
During electrospinning PVDF undergoes a process similar to poling. The stretching of the fibers and the strong electric field facilitates the formation of βphase [19]. Experimental data showed that in electrospun fiber mats the β-phase content can reach 85-90% [19], [20]. The electrospinning of PVDF has been successfully used on multiple occasions to create fiber mats that exhibited piezoelectric properties and subsequently devices that incorporated these fiber mats. [21]–[23]
The aim of this work was to determine the significance of the electrospinning process parameters on the resulting PVDF fiber diameter. Thus, a three factorial Box-Behnken experimental design was used, in which the applied voltage, the needle-to-collector distance and the flow rate were selected as factors. In addition, the presence of β and γ crystalline phases in the PVDF
4 A. L. Gergely, and J. Kántor
nanofibers were confirmed by FTIR. A simple setup was used to determine the sensitivity of the produced piezoelectric PVDF fiber mats.
2. Experimental
2.1. Materials
Polyvinylidene fluoride (PVDF) (MFI 8g/10min, at 2.16 kg and 230 °C, ASTM D1238, Songhan Plastic Technology), acetone (ACS grade, Sigma Aldrich) and dimethyl formamide (DMF, ACS grade, Sigma Aldrich) were used as received.
2.2. Polymer Solution 20 wt% PVDF in 1:1 acetone:DMF (v:v) solution concentration was selected based on preliminary experiment. To dissolve the PVDF in the solvent mixture ultrasonication was employed at 70 °C for 3 hours, resulting in a clear viscous polymer solution.
2.3. Electrospinning
Electrospinning was carried out on a custom-built apparatus [24]. The PVDF solution was placed into a syringe, and the constant flow rate was ensured by a syringe pump (Fisher Scientific). The syringe was connected to a G21 needle via PTFE tubing. The collector was covered with Al foil and placed at the desired distance from the needle. The positive potential of the DC high voltage supply (Gamma Scientific) was connected to the needle and the collector was grounded. The electrospinning process was carried out at ~21 °C and ~30 % relative humidity.
2.4. Scanning Electron Microscopy (SEM)
The fiber mat morphology was examined with a JEOL JSM-5200 scanning electron microscope at 10 kV potential on neat, not sputter coated, samples. To calculate the fiber diameter at least 50 measurements per sample were averaged. ImageJ software was used to measure the fiber diameters.
2.5. Fourier-Transform Infrared Spectroscopy (FTIR)
Infrared spectra of the PVDF nanofibers were collected using a Frontier, PerkinElmer instrument in ATR (attenuated total reflection) mode between 600 - 1500 cm-1 wave number, with a resolution of 1 cm-1 .
Process Optimization of PVDF Piezoelectric Nanofiber Production via Electrospinning 5
2.6. Experimental Design
The Box-Behnken experimental design (BBD) was generated with the MiniTab software. The applied voltage (V), the needle-to-collector distance (ND) and the flow rate (F) of the polymer solution were selected as factors. Table 1 shows the boundary limits determined by scouting experiments to produce a stable electrospinning process. The reason we chose the BBD is that it is almost as powerful as a full factorial design but being a fractional factorial design, it requires significantly fewer experiments. With 3 factors it is 27 runs against 15 in favor of the BBD, and thus more efficient in terms of time commitment and resources. A trade-off is that the BBD is less robust, as each data point is critical to the model.
Table 1. Box-Behnken experimental design limits
Electrospinning parameter Low (-1) Mid (0) High (+1)
Flow rate [mL/h] 0.4 0.7 1
Voltage [kV] 14 17 20
Needle-to-collector distance [cm] 10 15 20
3. Results and Discussion
3.1. Fiber morphology
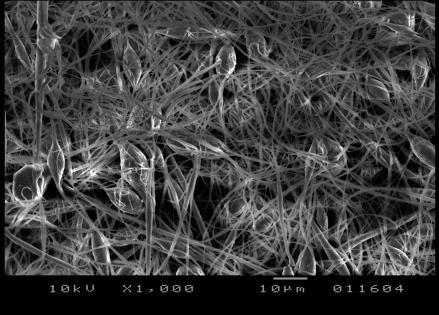
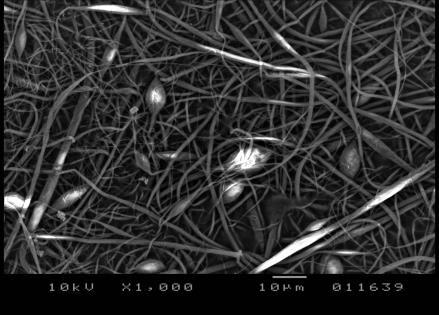
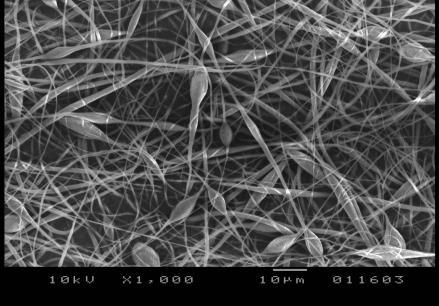
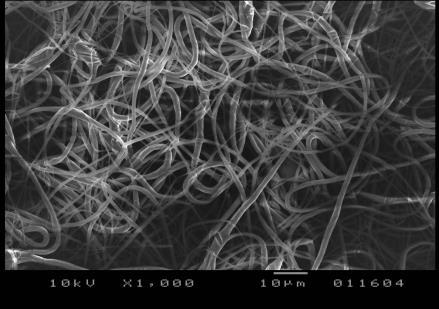
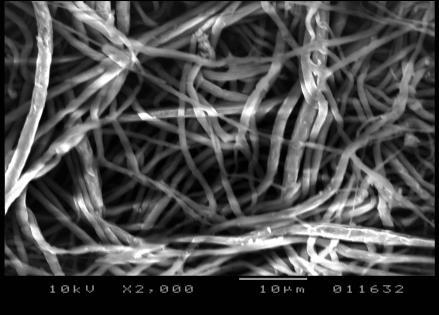
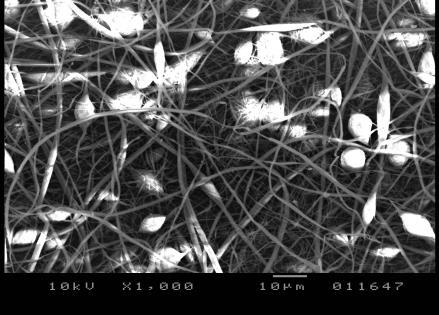
The fiber morphology and fiber diameter were determined by SEM investigation. The SEM images of some samples are shown in Fig. 1. The images as well as the tabulated data in Table 2 illustrate that out of the 15 experimental condition sets, only three produced PVDF fiber mats without beads. As it is illustrated, beads-on-fiber formation is prominent in the samples. It has been reported that in model systems with PEO low viscosity and high surface tension of the solution, and low charge density (which correlates with low applied voltage) favor the formation of beaded fibers [8]. Since there weren’t any viscosity or surface tension measurements performed on the PVDF solutions, it can only be proposed that the same applies here as well. Based on our observations the viscosity of the used PVDF solutions was high enough for continuous fiber formation (as the SEM images show). The produced fibers were smooth surfaced and have circular cross section.
6 A. L. Gergely, and J. Kántor
PVDF2
PVDF4

PVDF9
PVDF13 PVDF3
PVDF5
PVDF11
PVDF15
Figure 1: Representative SEM images of the tested samples
Process Optimization of PVDF Piezoelectric Nanofiber Production via Electrospinning 7
Table 2 presents the generated parameter sets for the BBD. Samples named PVDF5, PVDF9 and PVDF11 are the ones that did not contain beads. It can also be noted that the fiber diameters range from 510 nm to 1300 nm
Table: Fiber diameter and standard deviations.
Name Needle-collector distance [cm] Volumetric flow rate [mL/h] Voltage [kV] Fiber size, d [μm] Stdev. d [μm] Bead
PVDF1 15 0.7 17 0.70 0.36 Yes PVDF2 15 0.4 14 1.30 0.55 Yes PVDF3 20 0.7 14 0.93 0.52 Yes PVDF4 15 1 14 0.73 0.45 Yes PVDF5 10 1 17 1.09 0.44 No PVDF6 15 0.7 17 0.92 0.38 Yes PVDF7 15 0.7 17 0.80 0.36 Yes PVDF8 10 0.7 14 0.51 0.25 Yes PVDF9 10 0.7 20 0.92 0.23 No PVDF10 15 1 20 1.07 0.36 Yes PVDF11 20 0.7 20 1.24 0.36 No PVDF12 20 0.4 17 1.11 0.44 Yes PVDF13 15 0.4 20 1.06 0.46 Yes PVDF14 10 0.4 17 0.92 0.25 Yes PVDF15 20 1 17 0.76 0.40 Yes
3.2. Experimental design analysis
To investigate the effect of the electrospinning parameters on the fiber size and spread a 3-factor BBD was created. Tables 3 and 4, show the respective ANOVA tables.
Table 3: ANOVA table for fiber diameter of the studied fiber mats
Source DF Adj. SS Adj MS F-value p-value Linear 3 0.13734 0.04578 1.22 0.393
dist 1* 0.01051 0.01051 0.28 0.619 flow 1* 0.0931 0.0931 2.49 0.176 volt 1* 0.030637 0.030637 0.82 0.407 Square 3 0.103227 0.034409 0.92 0.495 Interaction 3 0.154200 0.051400 1.37 0.352 Residual Error 5 0.187167 0.037433 Total 14 R-Sq = 70.85% R-Sq(adj) = 18.38% * -accounted for in the DF of Linear source
8 A. L. Gergely, and J. Kántor
The data in Table 3 shows, that for the fiber diameter, none of the p-values were lower than 0.05 (the lowest being 0.176) and as such the effects of the selected electrospinning parameters indicated no statistical significance in the 95% confidence interval. A study done by Motamedi et al. showed that the diameter of PVDF nanofibers electrospun from dimethylacetamide/acetone mixture increased with increasing voltage (300 nm at 10 kV to 855 nm at 20 kV) and decreased with increasing distance (644 nm at 14 cm to 264 nm at 20 cm) [25]. On the other hand, according to the results published by Ribeiro et al. average fiber sizes spun from DMF solution decreased from 495 to 403 nm when they increased the voltage from 15 to 30 kV [20]. Neither publication provides statistical data, so the statistical significance of the results is unknown. While not observed for all material/solvent systems (as the first example shows, [25]), it is expected in general that a higher voltage through an increased volumetric charge density and larger tensile forces would yield thinner fibers [8]. As the opposite effect, larger distances would yield thicker fibers because of the weaker electric field and lower charge density [7]. It is theorized that in the case when fibers get thicker with increasing voltage/ higher charge density it is because more solution is drawn from the source and the increased volumetric flow rate results in a thicker jet [14]. In the previously mentioned study with PVDF there wasn’t a clear correlation between volumetric flow rate and deposited fiber size [25].
Table 4: ANOVA table for fiber diameter standard deviation of the studied fiber mats
Source DF Adj. SS Adj MS F-value p-value
Linear 3 0.031937 0.010646 2.28 0.197 dist 1* 0.025345 0.025345 5.42 0.067 flow 1* 0.001186 0.001186 0.25 0.636 volt 1* 0.001035 0.001035 0.22 0.658 Squared 3 0.028652 0.009551 2.04 0.227 Interaction 3 0.018125 0.006042 1.29 0.373 Residual Error 5 0.023392 0.004678 Total 14 R-Sq = 81.21% R-Sq(adj) = 47.39% * -accounted for in the DF of Linear source
For the standard deviation of the fiber size, Table 4, the distance had a pvalue 0.067, which is close to 0.05. While technically not significant by to the chosen convention of the <5% probability for the null hypothesis, it still might be an indication that the widening of the fiber size distribution with the increasing needle-collector distance is not entirely due to randomness. This trend can be observed in the data of Motamedi et al. as well, even though the deviation in their samples was roughly an order of magnitude lower [25]. A possible explanation is found in the relationship between solvent evaporation
Process Optimization of PVDF Piezoelectric Nanofiber Production via Electrospinning 9
and the needle-collector distance. It is known that the elongation of the fibers is limited by the drying process [6]. In each electrospinning setup, especially in the more unstable systems there is a variation in the initial jet diameter (i.e. close to the Taylor cone). The initially thin jet segments dry out quickly, and after that point no additional distance will affect the fiber size. On the other hand, for the initially thick jet segments there is more time for the solvent to evaporate if the distance is longer, and thus the result will be a narrower size distribution.
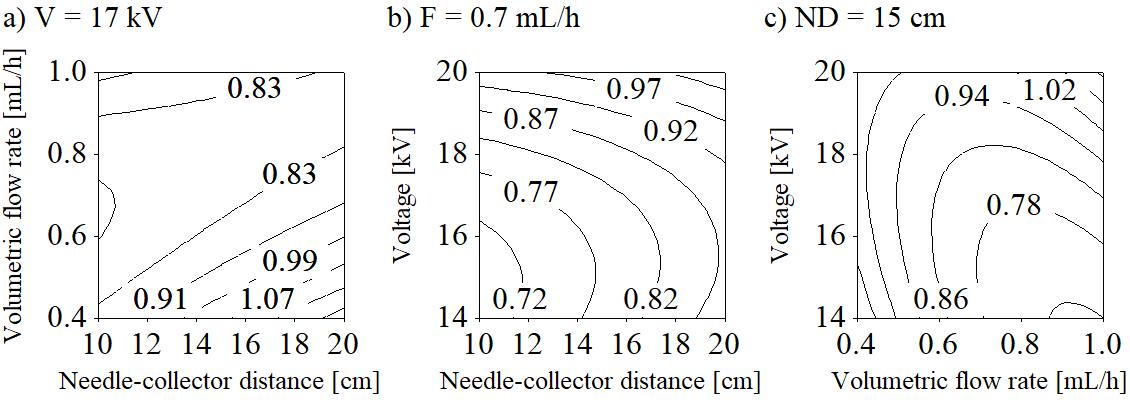
Figure 2: Contour plots of the mean fiber diameter, d [μm], versus a) F-ND, b) V-ND, and c) V-F when the respective third parameter was held at its middle value
While the statistical analysis indicated no significance for the effect of the electrospinning parameters on fiber diameter, some conclusions regarding the process can be drawn from the observations. The contour plots seen in Fig. 2 show that in the studied region increasing the voltage caused an increase in average fiber size from 600 to 900 nm at F = 0.7 mL/h and ND = 10 cm (Fig. 2b), and from 700 to 1000 nm at F = 1 mL/h and ND = 15 cm (Fig. 2c). The increase in distance also resulted in thicker fibers in general (Fig. 2a-b). Increasing the flow rate caused the average fiber size to decrease. At V = 14 kV and ND = 15 cm it went down from 1100 nm to 700 nm (Fig. 2c) and at V = 17 kV, ND = 20 cm from 1200 nm to 800 nm (Fig. 2a), however in both cases it seems to have reached a local minimum, after which the fiber size would have started increasing again if the flow rates were to become higher. The low distance favored more uniform fibers, and at higher voltages the bead formation became less prevalent. The most stable condition was at 10 cm distance, 20 kV, and 0.7 mL/h (sample PVDF9), with the fiber mat having submicron fiber size, one of the narrowest fiber size distributions, and no beads.
10 A. L. Gergely, and J. Kántor
3.3. Piezoelectric properties
The presence of β and γ crystalline phases, thus the piezoelectric properties of the samples were confirmed by FTIR spectroscopy. A representative FTIR spectrum can be seen in Fig. 3. Based on the work of Cai et al. the β and γ crystalline phase content relative to the α phase was calculated for each sample, using eq. (1):
(1)
where FEA represents the β and γ crystalline phase percentage, IEA and I763 represents the absorbance values at 840 and 763 cm-1 respectively, whereas K840 = 7.7*104 and K763 = 6.1*104 cm2/mol are the absorbance coefficients at the particular wave number [26]. The FTIR spectra was normalized at ware number 1072 cm-1, since the absorbance of this band is influenced only by the thickness of the sample and not the crystalline structure [27].
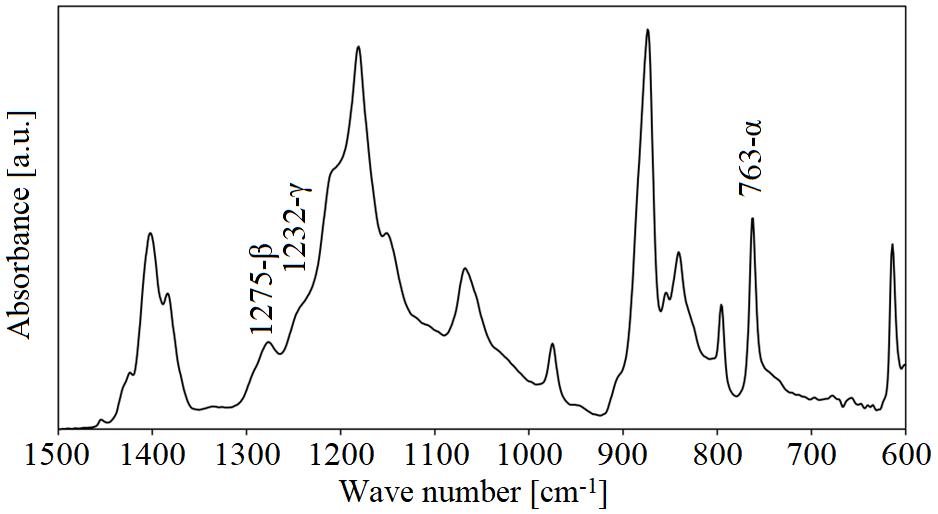
Figure 3: Representative FTIR spectrum
The calculated β and γ crystalline phases for all the samples were within 3642% with respect to the α phase. To test the piezoelectric properties of the samples a test cell was built in which the samples were placed between two masked copper plates and were subjected to compression forces, while the generated voltage was measured. The samples generated potential difference in response to the loading, however the highest sensitivity (generated
Process Optimization of PVDF Piezoelectric Nanofiber Production via Electrospinning 11
voltage/applied force) of 0.027 mV/N was obtained for sample PVDF11 with 11 μm thickness. The control, 100 μm thick PVDF film produced 0.063 mV/N sensitivity. Thus, the sensitivity of the prepared PVDF nanofiber samples was in the same order of magnitude as the sensitivity of the commercially available PVDF film.
4. Conclusion
In summary, we successfully prepared bead-free smooth surfaced PVDF fiber mats with piezoelectric properties. The 3-factorial Box-Behnken experimental design did not show significant influence of the studied electrospinning parameters on the resulting fiber diameter, thus indicating the robustness of the process. FTIR study confirmed the presence of the electroactive β and γ crystalline phases in all samples in the range of 36-42 % with respect to the α phase. The sensitivity of the electrospun piezoelectric PVDF nanofiber samples was comparable to the control, a commercially available PVDF film.
Acknowledgements
Attila Levente Gergely wishes to thank the Transylvanian Museum Society for the financial support, contract nr. 220.10.1/2020. The authors wish to thank the technical support for Peter Johannes and dr. Marcus Stommel for the FTIR study and the sensor sensitivity measurements.
References
[1] Xue, J., Wu, T., Dai, Y., and Xia, Y., “Electrospinning and electrospun nanofibers: Methods, materials, and applications” , Chem. Rev., vol. 119, no. 8, pp. 5298–5415, 2019. [2] Sipos, E. et al., “Preparation and characterization of fenofibrateloaded PVP electrospun microfibrous sheets” , Pharmaceutics, vol. 12, no. 7, 2020. [3] Yarin, A. L., Koombhongse, S., and Reneker, D. H., “Taylor cone and jetting from liquid droplets in electrospinning of nanofibers” , J. Appl. Phys., vol. 90, no. 9, pp. 4836–4846, 2001. [4] Yarin, A. L., Koombhongse, S., and Reneker, D. H., “Bending instability in electrospinning of nanofibers” , J. Appl. Phys., vol. 89, no. 5, pp. 3018–3026, 2001. [5] Pelipenko, J., Kocbek, P., and Kristl, J., “Nanofiber diameter as a critical parameter affecting skin cell response”, Eur. J. Pharm. Sci., vol. 66, pp. 29–35, 2015. [6] Bian, Y., Wang, S., Zhang, L., and Chen, C., “Influence of fiber diameter, filter thickness, and packing density on PM2. 5 removal efficiency of electrospun nanofiber air filters for indoor applications”, Build. Environ., vol. 170, p. 106628, 2020.
12 A. L. Gergely, and J. Kántor
[7] Theron, S. A., Zussman, E., and Yarin, A. L., “Experimental investigation of the governing parameters in the electrospinning of polymer solutions” , Polymer (Guildf)., vol. 45, no. 6, pp. 2017–2030, 2004. [8] Fong, H., Chun, I., and Reneker, D. H., “Beaded nanofibers formed during electrospinning” , Polymer (Guildf)., vol. 40, no. 16, pp. 4585–4592, 1999. [9] Tripatanasuwan, S., Zhong, Z., and Reneker, D. H., “Effect of evaporation and solidification of the charged jet in electrospinning of poly (ethylene oxide) aqueous solution” , Polymer (Guildf)., vol. 48, no. 19, pp. 5742–5746, 2007. [10] Thompson, C. J., Chase, G. G., Yarin, A. L., and Reneker, D. H., “Effects of parameters on nanofiber diameter determined from electrospinning model” , Polymer (Guildf)., vol. 48, no. 23, pp. 6913–6922, 2007. [11] Amiraliyan, N., Nouri, M., and Kish, M. H., “Effects of some electrospinning parameters on morphology of natural silk-based nanofibers”, J. Appl. Polym. Sci., vol. 113, no. 1, pp. 226–234, 2009. [12] Beachley, V., and Wen, X., “Effect of electrospinning parameters on the nanofiber diameter and length” , Mater. Sci. Eng. C, vol. 29, no. 3, pp. 663–668, 2009. [13] Nasouri, K., Bahrambeygi, H., Rabbi, A., Shoushtari, A. M., and Kaflou, A., “Modeling and optimization of electrospun PAN nanofiber diameter using response surface methodology and artificial neural networks” , J. Appl. Polym. Sci., vol. 126, no. 1, pp. 127–135, 2012. [14] Jia, Z., Li, Q., Liu, J., Yang, Y., Wang, L., and Guan, Z., “Preparation and properties of poly (vinyl alcohol) nanofibers by electrospinning” , J. Polym. Eng., vol. 28, no. 1–2, pp. 87–100, 2008. [15] Kawai, H., “The piezoelectricity of poly (vinylidene fluoride)” , Jpn. J. Appl. Phys., vol. 8, no. 7, p. 975, 1969. [16] Lovinger, A. J., “Annealing of poly (vinylidene fluoride) and formation of a fifth phase” , Macromolecules, vol. 15, no. 1, pp. 40–44, 1982. [17] Hasegawa, R., Kobayashi, M., and Tadokoro, H., “Molecular conformation and packing of poly (vinylidene fluoride). Stability of three crystalline forms and the effect of high pressure”, Polym. J., vol. 3, no. 5, pp. 591–599, 1972. [18] Ramos, M. M. D., Correia, H. M. G., and Lanceros-Mendez, S., “Atomistic modelling of processes involved in poling of PVDF” , Comput. Mater. Sci., vol. 33, no. 1–3, pp. 230–236, 2005. [19] Gee, S., Johnson, B., and Smith, A. L., “Optimizing electrospinning parameters for piezoelectric PVDF nanofiber membranes” , J. Memb. Sci., vol. 563, pp. 804–812, 2018. [20] Ribeiro, C., Sencadas, V., Ribelles, J. L. G., and Lanceros-Méndez, S., “Influence of processing conditions on polymorphism and nanofiber morphology of electroactive poly (vinylidene fluoride) electrospun membranes” , Soft Mater., vol. 8, no. 3, pp. 274–287, 2010. [21] Lang, C., Fang, J., Shao, H., Ding, X., and Lin, T., “High-sensitivity acoustic sensors from nanofibre webs” , Nat. Commun., vol. 7, no. 1, pp. 1–7, 2016. [22] Wang, Y. R., Zheng, J. M., Ren, G. Y., Zhang, P. H., and Xu, C., “A flexible piezoelectric force sensor based on PVDF fabrics” , Smart Mater. Struct., vol. 20, no. 4, p. 45009, 2011. [23] Fang, J., Wang, X., and Lin, T., “Electrical power generator from randomly oriented electrospun poly (vinylidene fluoride) nanofibre membranes” , J. Mater. Chem., vol. 21, no. 30, pp. 11088–11091, 2011. [24] Gergely, A., Kántor, J., Bitay, E., and Biró, D., “Electrospinning of Polymer Fibres Using Recycled PET”, Acta Mater. Transylvanica, vol. 2, no. 1, pp. 19–26, 2019. [25] Motamedi, A. S., Mirzadeh, H., Hajiesmaeilbaigi, F., Bagheri-Khoulenjani, S., and
Shokrgozar, M., “Effect of electrospinning parameters on morphological properties of PVDF nanofibrous scaffolds” , Prog. Biomater., vol. 6, no. 3, pp. 113–123, 2017.
Process Optimization of PVDF Piezoelectric Nanofiber Production via Electrospinning 13
[26] Cai, X., Lei, T., Sun, D., and Lin, L., “A critical analysis of the $α$, $β$ and $γ$ phases in poly (vinylidene fluoride) using FTIR” , RSC Adv., vol. 7, no. 25, pp. 15382–15389, 2017. [27] Benz, M. and Euler, W. B., “Determination of the crystalline phases of poly (vinylidene fluoride) under different preparation conditions using differential scanning calorimetry and infrared spectroscopy” , J. Appl. Polym. Sci., vol. 89, no. 4, pp. 1093–1100, 2003.