9 minute read
How to Use DPS for QC in Paving


BY BRYCE WUORI
Imagine using a quality control (QC) tool that displays real-time volumetric data anywhere on your asphalt mat within seconds. With such a tool, users scan the entire asphalt mat making pro-active changes with paver setup and rolling patterns to increase density and uniformity of newly placed asphalt in the field. One technology that makes this possible is the Density Profiling System (DPS).
The DPS is a non-destructive asphalt assessment tool that implements ground penetrating radar technology to collect surface dielectric of compacted asphalt roadways. Within the asphalt industry, the DPS has, so far, been used as a quality assessment tool for owners.
The main objectives of using this tool within a quality assessment process would be to increase safety in the field, decrease the amount of destructive coring performed on new asphalt roads, and generate more data sets that better represent the newly placed asphalt. Using the DPS technology as a quality assurance (QA) tool has a great deal of potential within the industry with many states performing pilot projects and developing new specifications that integrate the technology into current methods.
Because DPS can offer such confidence to departments of transportation as a QA tool, it is gaining ground for QC in the field, too. The DPS is Wuori Consulting LLC’s “go to” QC tool when issues develop in the field with density or uniformity. Within this article, users will learn the practice of implementing the DPS as a QC tool for improved project success.
DPS SETUP FOR QC
Within the technology industry, there are numerous equipment companies that have developed a DPS that will satisfy the requirements for implementing the tool for QC. The specific DPS unit that we use at Wuori Consulting LLC is the PaveScan RDM 2.0 developed by GSSI. We feel that it is user friendly, durable and able to produce accurate data sets with maps for real-time evaluation.
Getting the PaveScan RDM 2.0 DPS ready for collection takes a few simple steps for assembly and calibration. 1. Connect antennas to the unit 2. Install batteries for power source 3. Mount the collection screen to the unit handle 4. Connect the chords in the correct locations
This process takes approximately five minutes and once assembled the unit can fold up into a more compact position for loading or transporting. Once the DPS unit is assembled, users can power up the transmitter and collection screen and move into the project setup and calibration.
Project setup within the collection screen establishes your current project and the amount of detail you want included for the project is entirely dependent on the user’s preference. Typically, for QC applications, users will set up a project and input variables that may include project name, mix type and project location.
Following the project setup, users can begin the antenna calibration procedure. The air calibration and metal plate calibration will take less than two minutes to complete but must be performed correctly for accurate data collection in the field. With the DPS assembled and calibrated, users can begin data collection procedures in the field.
DPS SETUP FOR ROLLER PATTERNS
Roller pattern setup will differ from one project to the next depending on the variables presented and the project conditions that need to be satisfied. Using the DPS to identify what roller pattern generates the best results to match your project variables and conditions will develop a higher quality project. Higher profits and incentives for ride and density will follow.
When implementing the DPS as a QC tool in the field for roller pattern setup, Wuori Consulting LLC will collect most of the DPS data behind the intermediate and finish roller positions. Typically, behind the intermediate roller we have achieved most of our required project density on the asphalt mat, and the user can still make pro-active adjustments if required.
Another reason data is typically collected in these locations in the field, is because the DPS does not respond well to water on the surface of the asphalt mat. If the rollers are using too much water and leaving water lines on the surface of the asphalt, the DPS will identify these areas and produce distorted data for the user. Managing water for rollers is a best practice that should always be monitored in a roller plan and this variable becomes even more important with the introduction of a DPS as a QC tool in the field.
DPS SWERVE PATTERN
There are two methods users will most commonly implement when verifying and modifying roller patterns in the field. These methods consist of the DPS swerve pattern and the transverse slice pattern. The swerve pattern will be the most common method used to collect data behind rollers and identify uniformity and density conditions.
This collection method is performed just as it sounds. Users will identify a starting point behind the intermediate roller
This image shows the DPS swerve method for quality control data collection.
and then collect data in a swerving motion with the DPS from roughly one foot inside the centerline joint to roughly one foot inside the shoulder edge or outside edge. DPS data is collected in the direction of construction—or toward the paver—and the user swerves from one edge of the asphalt mat to the next making sure data is collected on the entire compacted asphalt roadway.
This data collection method allows users to discover the uniformity of the density across the entire asphalt mat through multiple rolling pattern locations. Users will also recognize data trends that may be caused from improper rolling procedures or improper paver operations. If a specific data trend continues to present itself with DPS data, the user can make an adjustment with rolling patterns or the paver setup to combat this trend and increase quality.
One example of a common data trend that Wuori Consulting LLC identifies with the DPS on projects is lower density on the shoulder/unconfined edge of the asphalt roadway. When there is nothing to confine the asphalt from pushing out, density can become an issue in these specific areas. Pay extra attention to these areas to achieve uniform density in these situations. Depending on what the conditions of the project are, users can make a roller plan modification to combat this issue and increase uniform density across the asphalt section. Roller plan modifications to correct these issues may consist of changing knockdown and intermediate temperature zones, moving in static mode to the section of roadway that needs attention, or adjusting roller frequency or amplitude to assist with asphalt pushing or shoving. Once an adjustment has been implemented, users can perform the DPS swerve method again and re-evaluate the data and modifications that took place for quality improvements in the field.
DPS TRANSVERSE SLICE METHOD
The DPS transverse slice method is also a good way to identify asphalt uniformity across a specific transverse section of a recently compacted asphalt roadway. Typically used as verification technique, the transverse slice method ensures that rolling patterns are generating uniform density from centerline to shoulder.
Users will collect data behind the intermediate roller from one foot away from the centerline joint to one foot away from the shoulder edge, performing a transverse slice across the asphalt mat. This method takes approximately 20 seconds to perform, and users can pick random transverse locations behind rolling operations for verification of asphalt uniformity.
If DPS data is identifying asphalt uniformity that is not falling within the project’s quality limits, users can perform swerve method through these areas to verify data and then make modifications to rolling patterns or paver setup if necessary. Generally, if paving and rolling conditions have not changed on the project, the transverse slice method is a quick verification procedure.
DPS LONGITUDINAL JOINT VERIFICATION
When a longitudinal joint specification is required on a project, every QC manager understands the frustrations of getting accurate data on the joint. Using the DPS as a QC tool for longitudinal joint management has become one of Wuori Consulting LLC’s favorite applications of the technology. Not only is the user getting accurate data from the DPS on the joint, but he is also getting real-time data of the uniformity and condition of the asphalt.
The data the DPS provides to the user can assist with setting up correct rolling patterns and evaluating the average density per lot for the longitudinal joint. When collecting joint data with the DPS, the user will follow the seam line within two to three inches on the matching side of the asphalt section. Depending on what the specification of the project allows with longitudinal joint density, the location of the DPS antenna can be shifted to take scans on the exact match line of the joint or in the locations the extracted cores will be taken from the existing asphalt mat. When using a DPS for longitudinal joints, users will find that the tool will provide them with the data needed to be more effective in the field.
DPS CORE VERIFICATION METHOD
Destructive coring is currently the QA method that almost all owners and agencies use to verify field density. Prior to extraction of a specific core location, users can perform the DPS core verification process to determine a projected core density in that identified core location.
The core verification method allows users to calibrate the DPS and ensures that the core result data that is developed from standard testing procedures of extracted cores equals the results the DPS generated prior to extraction. Errors can occasionally be performed during core extraction procedures and in the lab, so having a tool that confirms the precision of these results will allow the user to be more confident in actual field density conditions. When control strips are required on a specific project, the DPS core verification process can give the user expected density results of random core locations in a matter of minutes to move forward with the project paving or plan for mainline operations when conventional results are presented.
Overall, the DPS core verification method assists users in verifying field density results and planning for operation procedures. As a quality control manager, it is always nice to have an idea of what results will be expected from extracted cores, and the DPS is the tool that generates this data for the user.
What the DPS technology does for users in the field for quality is straightforward. The technology identifies issues with real-time data and allows users to make pro-active modifications for increased quality.
This image shows the DPS transverse slice method for quality control data collection.
CRUSH RAP COSTS
with the HONEY BADGER
From replaceable abrasion-resistant steel wear liners to a 1/2" steel pulverizing hopper, this machine is ready for wear and tear. And by reducing material handling and minimizing moisture, the Honey Badger increases production and saves on fuel costs. Average return on investment is 1/8 the cost of other crushing operations. Fully-equipped with max power, reliable operation, and easy maintenance, the Honey Badger is ready to crush your costs!
Reduced RAP moisture = lower fuel consumptions
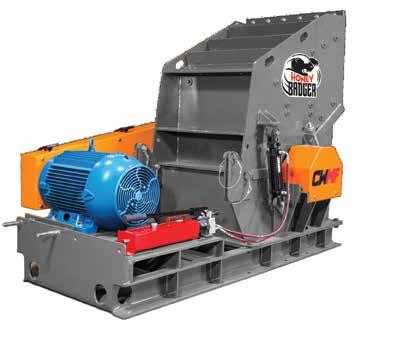
Reduce or eliminate crushing costs
Typical 6 month ROI
(300,000 ton/season plant)
Minimize material handling
STATIONARY PORTABLE


