24 minute read
Influence of ultraviolet light on the stability of allicin in aqueous garlic extract


James Wilson
Barker College
Garlic has been recognised and exploited as a medicinal panacea for thousands of years and is widely utilised as a flavouring agent for foods. Since its discovery in 1944, extensive research has been dedicated to investigating the nature and stability of allicin, the primary organosulfur accredited for garlic’s therapeutic properties. However, the extent to allicin’s photostability remains undefined. The present study examines allicin’s potential for photodecomposition by investigating whether exposure to artificial ultraviolet light of wavelength 366 nm in storage affects allicin’s rate of degradation in an aqueous garlic extract. Two aqueous garlic extract samples were stored over a 25 hour period; one exposed to UV of wavelength 366 nm, and the other to darkness as a control. Utilising an established indirect colourimetric assay, the allicin concentration of the two samples was monitored and content loss was analysed using an ANOVA test and PostHoc Tukey HSD. The discovery of significant differences in allicin content loss between the two samples demonstrated that allicin exposed to UV light degraded at a faster rate, thus providing evidence for its susceptibility to photodecomposition.
Literature review
Garlic (allium sativum) has occupied a prominent position amongst bulb vegetables for millennia due to not only its utility as a condiment, but its exploitable therapeutic potentials (Borlinghaus et al., 2014). Its health benefits have been attributed to the antioxidant activity of a variety of organosulfurous compounds, however in 1944 the sulfur-containing defence molecule allicin (diallyl thiosulfinate) (1) was isolated and accredited as the primary organosulfur of the thirty-three identified compounds responsible for crushed garlic’s pharmacological potentials (Cavallito and Bailey, 1944) (Table 1).
Table 1: Types and concentrations of prominent thiosulfinates in garlic extract (After: Herng, 2014)
Thiosulfinate (TS) %mol
Allyl-2-propenTS (allicin) (1) 50 – 90 AllylmethaneTS 3 – 20 trans-1-propenyl-2-propeneTS 5 – 18 methyl-2-propeneTS 1.5 – 8 Allyl-trans-1-propeneTS 1.5 – 2 methylmethaneTS 1 – 2 trans-1-propenylmethaneTS 1 – 2 methyl-trans-1-propeneTS 0.5
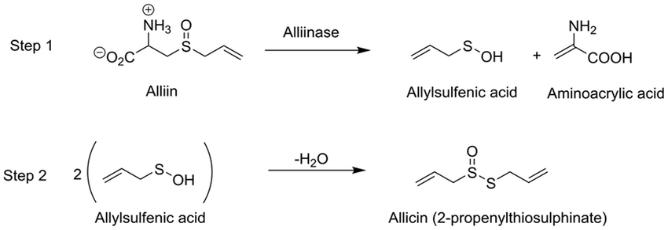
The organosulfur presence within fresh garlic is approximately four times greater (per gram of weight) than that of other food sources such as cruciferous vegetables (Prati et al., 2014), with 1 g of fresh garlic containing between 11 and 35 mg of organosulfurous compounds, of which, allicin constitutes approximately 70% (Mansor et al., 2016). Allicin is not present in raw garlic, but is produced in an enzymatic reaction catalysed by the crushing of garlic cloves. Upon cell lysis, the odorless non-proteinogenic amino acid alliin, (S-allylcystein sulfoxide) (2) (Figure 1), originally compartmentalised in mesophyll cells, reacts with the enzyme alliinase that is released from the cell vacuoles, thus creating allicin (Prati et al., 2014) (Figure 1). Hence, in vivo and most dietary applications for allicin require the garlic to be in an aqueous extract form.
Allicin has been discovered to possess a range of antimicrobial activities that are responsible for crushed garlic’s therapeutic potentials. These antimicrobial properties include antibacterial activity against Gramnegative and Gram-positive bacteria including strains of Escherichia Coli and salmonella, as well as a broad spectrum of bacterial isolates, many of which are resistant to antibiotics (Ankri and Mirelman, 1999). Allicin has also shown antiparasitic activity, including but not limited to in vitro inhibition of the major human intestinal protozoan parasite, Entamoeba histolytica (Mirelman, Monheit and Varon, 1987), which is responsible for 100,000 global deaths per year (Gunther et al., 2011). Additionally, this thiosulfinate demonstrates antifungal activity, particularly against low concentrations of species of Candida, Cryptococcus, Trichophyton, Epidermophyton and Microsporum in vitro, and antiviral activity, with influenza B and herpes simplex viruses showing sensitivity to crushed garlic (Tsai et al., 1985).
Figure 1: Chemical formation of allicin (1). Alliin (2) hydrolyses with alliinase to form allylsufenic acid, which spontaneously condenses to produce allicin (Source: Wallock-Richard et al., 2014
Allicin stability
Unfortunately, these therapeutic properties are limited due to the unstable nature of allicin. The organosulfur is known to readily decompose into a variety of organosulfur compounds including diallyl trisulfide, diallyl disulfide and diallyl sulfide (Levy, 2019) (Figure 2) in the presence of air and water, and more rapidly in adverse temperatures or pH solutions, accounting for the characteristic odour of garlic present when cooking or after ingestion (Prati et al., 2014).
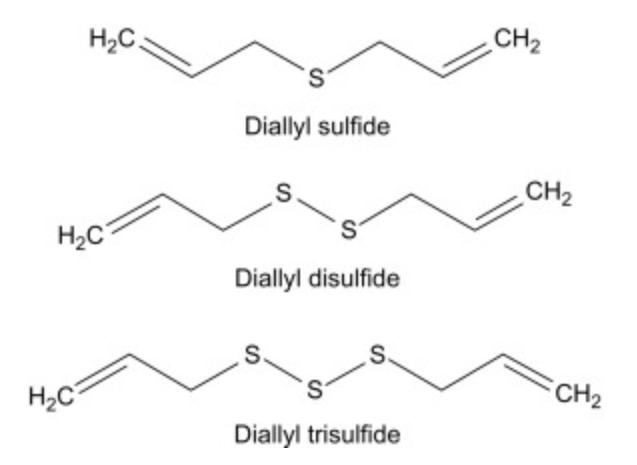
Figure 2: Chemical structures of diallyl sulfide, diallyl disulfide and diallyl trisulfide (Source: Bansal et al., 2018)
Thus, purified allicin isn’t commercially available (Levy, 2019), but is instead a constituent in powdered garlic supplements. Hence, expanding the literature upon the stability of allicin is of great interest to scientific researchers in the pursuit of advancing allicin’s medical implementation and versatility.
Previous studies have identified that allicin in an aqueous garlic solution is most stable at storage temperatures between -20 ⁰C to 30 ⁰C (Wang et al., 2014). However, it is very susceptible to decomposition at higher temperatures due the disulfide bond’s dissociation energy of 250 kJ/mol being overcome easily by increased heat energy in the system (Mansor et al., 2016), and thus, cooking with garlic involving frying or boiling will cause almost all the allicin to decompose and hence diminish the garlic’s total therapeutic potential (Jiménez-Monreal et al., 2009). In regard to allicin’s pH tolerance, both Mansor et al., (2016) and Wang et al., (2014) concluded that the optimal environmental pH for allicin is 5-6, with it being very unstable at pH levels lower than 1.5 and greater than 11, due to the disulfide bond’s susceptibility to break under acidic conditions (Han et al., 1995). Considering allicin isn’t formed in whole garlic, heat-dried garlic can still produce allicin once crushed.
Light exposure
Whilst allicin’s sensitivity to temperature and pH has been heavily scrutinised, literature on its tolerance to light is limited. Only Wang et al., (2014) has investigated allicin’s photosensitivity to visible light in storage and concluded no difference to storage in darkness (Figure 3). Moreover, no ultraviolet (UV) light experimentation on allicin has been performed, and therefore allicin’s stability under the influence of UV radiation is unknown.
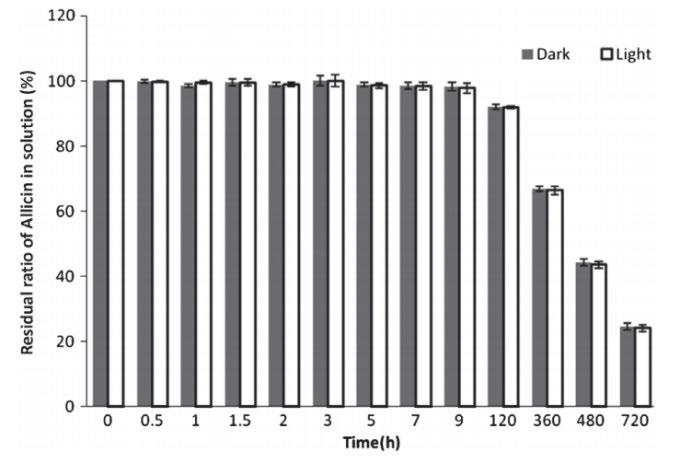
Figure 3: Allicin (1) decomposition in an aqueous garlic extract under light and dark conditions. Light is of a moderate intensity of 903���������������������������������������� −2��������
−1 (Source: Wang et al., 2014)
Ultraviolet light
UV radiation appears beyond visible light in the electromagnetic spectrum, and exhibits shorter wavelengths and higher frequencies. Additionally, since the energy of a photon is inversely proportional to the wavelength, UV waves have higher energy than visible light (Figure 4). UV light is categorised into three spectral bands: UVA (315 – 400 nm), UVB (280 – 315 nm) and UVC (200 – 280 nm) (Paul et al., 2011). Any intensity of electromagnetic radiation including UV can catalyse the degradation of organic matter through a process known as photolysis or photodecomposition (Paul et al., 2011) which is a reaction whereby chemical bonds are broken due to the transfer of photon energy. A compound’s susceptibility and rate of photolysis is influenced by factors including the chemical’s reactivity, light absorption properties and bond energy, as well as the intensity of the applied radiation (Speight, 2018).
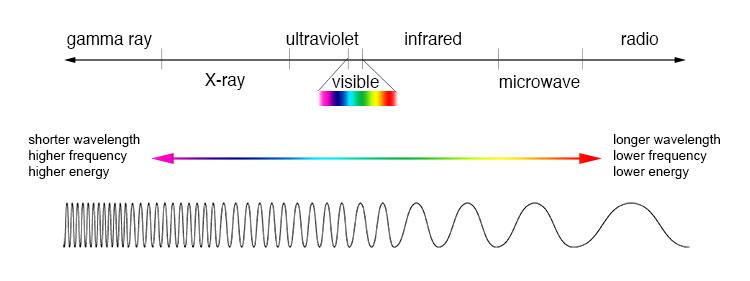
Figure 4: The electromagnetic spectrum (Source: NASA, 2013)
Quantification methods
For the quantification of thiosulfinates such as allicin, conventional methods include the use of High Performance Liquid Chromatography (HPLC) and Gas Chromatography (GC) to directly determine concentration. However, both procedures require the use of external standards, and cannot be performed in a high-school laboratory due to the need for specialised equipment. Instead, an indirect spectrophotometric assay developed by Han et al., (1995) and reused by Mansor et al., (2016) can be utilised in the absence of this equipment. The method quantifies the concentration of allicin through a reaction with L-cysteine (3) with the proven basis that one mole of allicin, as well as the other thiosulfinates, reacts with two moles of L-cysteine (3) to produce two moles of S-allyl mercaptocysteine (Han et al., 1995) (Figure 5). Unreacted L-cysteine (3) is reacted with 5,5’-dithiobis-(2-nitrobenzoic acid) (DTNB) (4) to form a yellow-coloured compound, 2-nitro-5thiobenzoate (NTB) (5) in a 1:1 stoichiometric ratio. NTB (5) has a molar absorptivity (��������) of 14150��������−1����������������−1 and an optimal absorbance (��������) at 412 nm in a colourimeter. Beer-Lambert’s law (Equation 1) can then be used to relate the NTB (5) absorbance readings to its concentration (��������) and that of the unreacted L-cysteine (3), and the amount of allicin reacted is backcalculated using stoichiometry.
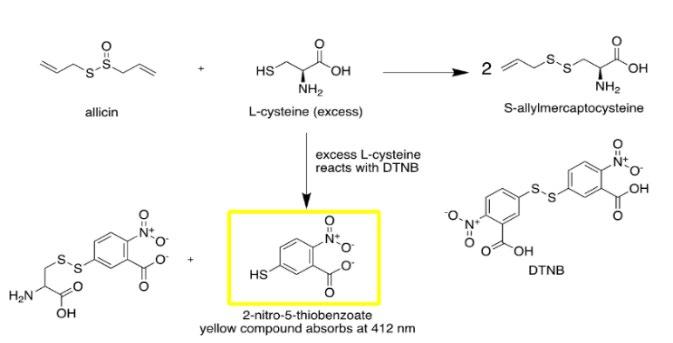
Figure 5: Chemical diagram for the quantification of allicin using colourimetry or spectrophotometry
Equation 1: Beer-Lambert’s law
Hence, this report has chosen to investigate the influence of ultraviolet light due to the absence of reports in this area. UVA light was specifically chosen due to its prevalence in sunlight, and it being only slightly more intense than visible light, thus allowing for an extension of the literature upon the threshold of allicin’s photostability. A wavelength of 366 nm was selected due to its availability in a school laboratory. The hypothesis formed stems from the fact that UV waves emit more energy than visible light waves, and thus the potential for the organosulfur compounds to undergo photolysis is increased.
Scientific research question
How does exposure to artificial ultraviolet light of wavelength 366 nm in storage affect the degradation rate of allicin in aqueous garlic extract?
Scientific hypothesis
That aqueous garlic extract exposed to ultraviolet light of wavelength 366 nm in storage will exhibit a greater rate of allicin concentration loss than extract not exposed to ultraviolet light.
Methodology
General experimental details
For the determination of thiosulfinate concentration at each time interval of this procedure, the spectrophotometric indirect method for quantifying garlic thiosulfinates used by Han et al., (1995) was adopted and modified for this experiment. Prepared garlic powder can be stored at room temperature without loss of allicin content for at least one year (Han et al., 1995). Solutions and materials were also prepared in accordance to procedures outlined in Herng, (2014), and all chemicals were purchased from Sigma-Aldrich.
Preparation of solutions and materials
Preparation of 5.0 mM DTNB solution DTNB (4) powder (0.3964 g) was weighed using an electronic balance. The powder was introduced into a 200 mL conical flask and dimethyl sulfoxide (DMSO) (200 mL) was added. The solution was magnetically stirred until the powder visibly dissolved.
Preparation of 50 mM HEPES buffer at 7.6 pH A pH-meter was calibrated by placing in a pH 7.0 buffer solution. HEPES buffer powder (23.8 g) was weighed using an electronic balance, and then added to a 250 mL beaker. 70 mL of distilled water was introduced to the beaker and the resulting mixture was magnetically stirred for 10 minutes. Sodium hydroxide (10 M solution) was slowly added dropwise using a glass pipette whilst the pH of the solution was being measured using the pH meter, until a pH of 7.6 was measured. The solution was transferred to a 100 mL volumetric flask and distilled water was added to reach the 100 mL mark, resulting in a 1.0 M solution.
To dilute to 50 mM, 5.0 mL of 1.0 M HEPES buffer was transferred into a separate 100 mL volumetric flask. Distilled water was added until the solution reached the graduation mark. The solution was hand-shaken for 30 seconds for homogenisation.
Preparation of 2.0 mM L-cysteine L-cysteine (3) crystals (0.09696g) were weighed using an electronic balance. The crystals were introduced into a 500 mL conical flask and 200 mL of distilled water was added to the flask. The solution was magnetically stirred until the L-cysteine (3) visibly dissolved, and then another 200 mL of distilled water was added.
Preparation of garlic powder Cloves from fresh garlic bulbs commercially purchased from the same batch were peeled and sliced into approximately 3 mm thick slices. The slices were dried in an oven at 60 °C for 12 hours, and then grinded into a fine powder with a mortar and pestle. The powder was stored in an air-tight container in the dark.
Experimental procedure
Preparation of garlic extract To create the stock garlic extract solution, 5 g of garlic powder was mixed with 150 mL of distilled water in a 250 mL conical flask. The mixture was homogenised using a magnetic stirrer for 1 hour at room temperature. A vacuum pump was used to filter larger insoluble particles from the mixture, and the resulting filtrate was left to sit in the dark for 18 hours to allow the fine suspension to settle. Storage of garlic extracts 20 mL of the garlic extract was placed in two separate petri dishes. One dish was placed in a light-proof 366 nm UV cabinet and the other dish was placed in a separate light-proof cabinet in the dark as a control. Measurements were taken immediately before storage, and after storage times of 0.75 hours, 8.75 hours, and 25 hours under 366 nm. In addition, thiosulfinate content was also quantified after 25 hours in the dark. For each measurement, five 0.5 mL samples were extracted from each dish and the allicin concentration for each was quantified using the colourimetric assay outlined below, with the room lights turned off to minimise the effect of exposure to visible light.
Analysis of thiosulfinate content by colourimetry 0.5 mL of garlic extract was transferred into five separate 10 mL beakers and 1.2 mL of 2 mM L-cysteine (3) was added to each beaker. The beakers were swirled and left to sit at room temperature for 10 minutes. 3 mL of 50 mM HEPES buffer (pH 7.6) and 1 mL of 5 mM DTNB (4) were added to the beakers, and the solutions were magnetically stirred for 30 seconds, before sitting at room temperature for a further 2 minutes. Each sample was transferred into separate cuvettes and absorbance readings for each were taken at 400 nm using a PASCO colourimeter, which was limited to readings at increments of 50 nm.
Results
Upon creation of NTB (5) and determination of its concentration through Beer-Lambert’s law(Equation 1), allicin concentration could be back-calculated with the formula in Equation 2.
����������������−����������������������������������������������������������������(��������������������������������������������������������) −�������������������������������� 2
Equation 2: Stoichiometrically derived formula for the concentration of allicin
Time = 0 results from both samples are the same due to them being measured from a stock solution. Due to proportionality between absorbance and concentration in Beer-Lambert’s law (Equation 1), greater absorbance readings corresponded to higher concentrations of NTB (5) (Appendix, Table A1, A2, A3 and A4). Since NTB (5) forms from reaction of L-cysteine (3) and DTNB (4) with a 1:1 molar ratio, the calculated NTB (5) thus conveys the excess L-cysteine (3) from the reaction with allicin (Appendix, Table A3 and A4). Hence, greater absorbance readings corresponded to greater residual Lcysteine (3) and thus less allicin present in the initial reaction. Considering that crushed garlic thiosulfinates and L-cysteine (3) react in a 1:2 stoichiometric ratio, the allicin content in each extract was therefore back
calculated, and is shown in Tables 2 and 3. Figure 6 graphically captures the degradation of allicincontent as a function of storage time for each sample. Similar absorbance values in Tables A1 and A2 for time A and B as well as graphical results indicate no conclusive allicin photodecomposition within the first 8.75 hours. However, the results show a greater decrease in allicin concentration over the 25 hour period in the sample exposed to UV.
Statistical test results
A one-way analysis of variance (ANOVA) statistical test of the calculated thiosulfinate concentration indicated significant differences between the means for various time points with a p value < 0.00001, which was less than �������� = 0.05 (Table 4). The pairs of storage time points that demonstrate significant mean concentration differences were identified using a Post-Hoc Tukey test and the differences are outlined in Table 5.
Table 2: Average results values for UV sample
(����������������)
Thiosulfinate
concentration (����������������)
Estimated allicin
concentration (����������������)
A 0 0.0235 1.66077 0.20969593 0.146787151 B 0.75 0.0274 1.93639 0.20955812 0.146690684 C 8.75 0.0245 1.73144 0.20966059 0.146762413 D 25 0.0398 2.81272 0.20911995 0.146383965
Table 3: Average results values for controlled sample
(����������������)
Thiosulfinate
concentration (����������������)
Estimated allicin
concentration (����������������)
0.2098
Allicin Content (mM)
0.2097
0.2096
0.2095
0.2094
0.2093
0.2092
0.2091
0.209
0
Allicin content over time
5 10 15 20 25 Hours
UV Controlled
Figure 6: Graph of the allicin content in the UV and controlled sample throughout storage
Table 4: ANOVA test output for comparing the mean thiosulfinate concentration for each storage time. H0 = there is no difference in the means; HA = the means are not all equal
A B C D E
Alpha value 0.05
P value < 0.00001
Analysis p < 0.05, significant difference in means
Table 5: Post-Hoc Tukey Test p values for comparing the thiosulfinate concentration for each storage time.
Pair Q-stat p-value Analysis
A:B 2.52 0.41073 Insignificant
A:C 0.00 0.000001 Significant
A:D 15.12 0.00000 Significant
A:E 7.56 0.00027 Significant
B:C 2.52 0.41073 Insignificant
B:D 12.60 0.00000 Significant
B:E 5.04 0.1486 Insignificant
C:D 15.12 0.00000 Significant
C:E 7.56 0.00027 Significant
D:E 7.56 0.00027 Significant
Discussion
The significant pairwise comparisons (Table 5) not only demonstrate allicin degradation across both samples during storage, but verify a greater loss of allicincontent in the UV sample as shown with the D:E comparison, therefore implying the occurrence of UV direct photolysis. Hence, the alternate hypothesis (HA) is accepted as it is shown that allicin decomposed at a faster rate when exposed to UV light in storage.
To ensure validity, multiple preliminary tests were conducted to identify key limitations in the method appropriated from Mansor et al., (2016). Upon initial testing of the colourimetric quantification process, it was discovered that the reaction times of at least one of these two reactions significantly affected the concentration of the NTB (5) formed. After having allowed the L-cysteine (3) and allicin to react for 10 minutes and then allowing the DTNB (4) and excess Lcysteine (3) to react for multiple hours instead of two minutes, the solutions produced an absorbance reading approximately 3.5 times greater than that of the previous trial when mixed for the prescribed time. This suggested that the NTB (5) concentration, and thus the final allicin concentration calculation was dependent on the time the system was allowed to react, implying that this method may not be as suitable for calculating a definite value for allicin concentration in an aqueous extract at particular time points. However, as long as the reaction times during all trials were kept consistent, the relative rate of allicin decomposition could still be determined, thus satisfying the scientific research question. Hence, modifications were made to the final procedure to ensure consistency in reaction times, with greater detail applied to the method of reaction, such as substituting hand-shaking for magnetic stirring, to ensure a valid experiment. However, in the absence of HPLC, greater attention should be applied to eliminating ambiguity in the reaction method and timing for greater precision in future research.
Another limitation of this method is its inability to determine exact allicin concentration, but rather the total thiosulfinate concentration. Assay of exact allicin concentration in garlic extract would require the HPLC method. However, since it is known that allicin constitutes 60-80% of total garlic thiosulfinates (Han et al., 1995; Mansor et al., 2016) (Table 1), and that the method used for this experiment quantifies total present garlic thiosulfinates, an estimation can be made for allicin concentration by multiplying the value for total thiosulfinates by a factor of 0.7 (Table 2 and 3). Moreover, since this report aims to determine the relative rate of allicin degradation, obtaining a specific value for allicin content is not a requirement for a valid conclusion.
Due to the nature of a high-school laboratory, additional adjustments to the broader method attained from Mansor et al., (2016) were required which increased uncertainty. Instead of homogenising the garlic solution with an incubated shaker and then filtering off insoluble solids with a centrifuge in preparation of the aqueous extract, homogenisation was achieved less effectively with a magnetic stirrer, and a vacuum pump was used for filtration. Large fluctuations in absorbance values during preliminary testing due to slight cloudiness in the mixture substantiated this uncertainty, however it was found that a clear mixture could still be generated if the solution was left for approximately 18 hours after the filtering to allow the suspension to settle. Despite this, minor fluctuations in absorbance readings still occurred, which may have accounted for the apparent initial decrease then increase in the UV sample’s allicin content over the first two measuring points (Figure 6).
Moderately low standard deviation between the absorbance value measurement trials (Appendix, Table A1 and A2) indicates high precision through repetition, therefore reflecting a high reliability of the experiment. However, there did exist some uncertainty due to the limitation of the colourimeter only being able to read up to increments of 50 nm, therefore the absorbance readings weren’t taken at the optimal wavelength (412 nm) for NTB (5).
In the absence of significant uncertainties, it can be reasoned that the allicin in the UV sample dissociated faster due to the presence of UV radiation through photodecomposition. Whilst a molecule’s light absorption properties determine its susceptibility to photochemical processes as quantified under its molar absorptivity coefficient (��������), organic compounds will decompose when subjected to a high enough intensity of applied radiation (Speight, 2018). The photolytic process is initiated through the molecule’s absorption of a quantum of light energy from a photon, causing it transform into a transient state. In this exited state, molecules are subject to undergo a number of photochemical processes including photodissociation, intramolecular rearrangement (photoisomerisation),
reaction with other molecules, or deexcitation through emittance of luminescent radiation. Photodissociation occurs when the exited molecule deexcites, and results in the molecule dissociating in a chain reaction (Speight, 2018). Compounds more susceptible to photolysis are characterised by higher molar absorptivity coefficients (��������) and have a higher threshold wavelength for photodecomposition. However, allicin’s light absorptivity properties are unknown. Hence, the acceptance of the alternate hypothesis indicates that 366 nm surpasses the threshold for photodecomposition in allicin, and that this threshold maylie anywhere between the UVA and low visible light range, depending on the visible light’s luminous intensity.
Future research
Whilst the results captured significant differences between the degradation rate of allicin in aqueous garlic extract when stored under UV than in darkness, this conclusion was founded upon only 4 measurement points due to equipment availability and time constraints. Hence, a greater storage period with increased measurement points for both samples similarly to that of Wang et al., (2014) (Figure 3) would facilitate a more comprehensive conclusion and understanding of allicin’s photodecomposition under 366 nm UV. Furthermore, this experiment investigated exposure to waves of a minor increase in intensity from visible light, UVA, in an attempt to discern the upper threshold of allicin’s photostability. Further experimentation and analysis with higher frequency electromagnetic waves should be considered as to map allicin’s rate of degradation in more extreme conditions and to complement our understanding of its thermostability. Moreover, additional testing with wavelengths between 366 nm and the lower range of the visible light spectrum is recommended for identifying a more exact threshold frequency for allicin photostability.
Conclusion
This experiment investigated whether allicin decomposed faster when exposed to artificial ultraviolet light of wavelength 366 nm, hypothesising a greater rate of allicin content loss in UV storage conditions than in darkness. Through an indirect colourimetric assay, the allicin content of the sample exposed to ultraviolet light was monitored, and compared to the control at the end of the time period. The data analysis involved an ANOVA and Post-Hoc Tukey test of the allicin concentrations at each time point of measurement. Significant differences between the final data points demonstrated a difference in allicin degradation rates, leading to an acceptance of the hypothesis that allicin exposed to UVA in storage decomposes at a faster rate compared to the control experiment. Future experimentation should look to investigating a greater range of frequencies and period of storage.
Acknowledgements
I would like to thank Dr Katie Terrett for her tremendous assistance and invaluable support with all aspects of the project. This report would not have been possible without her guidance in developing an area of research, and aid in appropriating a method for data collection. I wish to extend my appreciation to the Barker College Science Department for providing the necessary chemicals and allowing me flexible access to the laboratory to complete the time-dependent data collection process. Finally, I would like to thank my colleague, Mr Charles Scholefield, for his support and enthusiasm throughout the duration of the work.
References
Ankri, S. and Mirelman, D. (1999). Antimicrobial properties of allicin from garlic. Microbes and Infection, [online] 1(2), pp.125–129. Available at: http://www.bashaar.org.il/files/6130.pdf [Accessed 16 Oct. 2020].
Bansal, M., Singh, N., Pal, S., Dev, I. and Ansari, K.M. (2018). Chemopreventive Role of Dietary Phytochemicals in Colorectal Cancer. Advances in Molecular Toxicology, 12, pp.69–121.
Borlinghaus, J., Albrecht, F., Gruhlke, M., Nwachukwu, I. and Slusarenko, A. (2014). Allicin: Chemistry and Biological Properties. Molecules, [online] 19(8), pp.12591–12618. Available at: https://www.mdpi.com/14203049/19/8/12591/htm [Accessed 17 Dec. 2020].
Cavallito, C.J. and Bailey, J.H. (1944). Allicin, the Antibacterial Principle of Allium sativum. I. Isolation, Physical Properties and Antibacterial Action. Journal of the American Chemical Society, 66(11), pp.1950–1951.
Gunther, J., Shafir, S., Bristow, B. and Sorvillo, F. (2011). Amebiasis-Related Mortality among United States Residents, 1990–2007. The American Journal of Tropical Medicine and Hygiene, [online] 85(6), pp.1038–1040. Available at: https://www.ncbi.nlm.nih.gov/pmc/articles/PMC3225148/#:~ :text=Amebiasis%2C%20caused%20by%20the%20intestinal [Accessed 11 Oct. 2020].
Han, J., Lawson, L., Han, G. and Han, P. (1995). Spectrophotometric Method for Quantitative Determination of Allicin and Total Garlic Thiosulfinates. Analytical Biochemistry, 225(1), pp.157–160.
Herng, H.J. (2014). Quantification and Characterization of Allicin in Garlic Extract. [Dissertation] core.ac.uk. Available at: https://core.ac.uk/reader/301117439.
Jiménez-Monreal, A.M., García-Diz, L., Martínez-Tomé, M., Mariscal, M. and Murcia, M.A. (2009). Influence of cooking methods on antioxidant activity of vegetables. Journal of food science, [online] 74(3), pp.97–103. Available at: https://www.ncbi.nlm.nih.gov/pubmed/19397724.
Levy, J. (2019). The Healthiest Part of Garlic? [online] Dr. Axe. Available at: https://draxe.com/nutrition/allicin/#Best_Way_to_Obtain_It [Accessed 17 Apr. 2021].
Mansor, N., Herng, H.J., Samsudin, S.J., Sufian, S. and Uemura, Y. (2016). Quantification and Characterization of Allicin in Garlic Extract. Journal of Medical and Bioengineering, 5(1), pp.24–27.
Mirelman, D., Monheit, D. and Varon, S. (1987). Inhibition of Growth of Entamoeba histolytica by Allicin, the Active Principle of Garlic Extract (Allium sativum). Journal of Infectious Diseases, 156(1), pp.243–244.
NASA (2013). Electromagnetic Spectrum - Introduction. [online] Nasa.gov. Available at: https://imagine.gsfc.nasa.gov/science/toolbox/emspectrum1.h tml.
Paul, A., Dziallas, C., Zwirnmann, E., Gjessing, E.T. and Grossart, H.-P. (2011). UV irradiation of natural organic matter (NOM): impact on organic carbon and bacteria. Aquatic Sciences, 74(3), pp.443–454.
Prati, P., Henrique, C.M., Souza, A.S. de, Silva, V.S.N. da and Pacheco, M.T.B. (2014). Evaluation of allicin stability in processed garlic of different cultivars. Food Science and Technology (Campinas), 34(3), pp.623–628.
Speight, J.G. (2018). Reaction mechanisms in environmental engineering : analysis and prediction. Kidlington, Oxford, United Kingdom ; Cambridge, Ma, United States: Butterworth-Heinemann, An Imprint Of Elsevier, pp.231–267.
Tsai, Y., Cole, L., Davis, L., Lockwood, S., Simmons, V. and Wild, G. (1985). Antiviral Properties of Garlic:In vitroEffects on Influenza B, Herpes Simplex and Coxsackie Viruses. Planta Medica, 51(05), pp.460–461. Wallock-Richards, D., Doherty, C.J., Doherty, L., Clarke, D.J., Place, M., Govan, J.R.W. and Campopiano, D.J. (2014). Garlic Revisited: Antimicrobial Activity of Allicin-Containing Garlic Extracts against Burkholderia cepacia Complex. PLoS ONE, 9(12), p.e112726.
Wang, H., Li, X., Liu, X., Shen, D., Qiu, Y., Zhang, X. and Song, J. (2014). Influence of pH, concentration and light on stability of allicin in garlic (Allium sativumL.) aqueous extract as measured by UPLC. Journal of the Science of Food and Agriculture, 95(9), pp.1838–1844.
Appendix
Raw data
Tables A1 and A2 convey the recorded absorbance values for each sample throughout storage, whilst the concentration of the yellow compound NTB (5) is shown in Tables A3 and A4. Tables A3 and A4 thus correspond to the excess Lcysteine (3) from the reaction due to the 1:1 stoichiometric ratio between L-cysteine (3) and NTB (5).
Table A1: Absorbance readings for UV sample throughout storage
Absorbance
Table A2: Absorbance readings for controlled sample at time = 0 and time = 25
Absorbance
Table A3: Concentration of NTB (5) and excess L-cysteine (3) for UV sample calculated by Beer-Lambert’s law
Concentration (����������������)
Table A4: Concentration of NTB (5) and thus excess L-cysteine (3) for controlled sample calculated by Beer-Lambert’s law
Concentration (����������������)


