41 minute read
Synthesis of the 3,4-methylenedioxy analogue of Pyrimethamine
Scientific research question
Can humans generate random sequences and does the methods of writing and speaking act as a variable in the randomness of the sequence generated?
Scientific hypothesis
That, humans are more effective at generating a string of random numbers when they are spoken aloud rather than when they write them on a piece of paper.
Methodology
Ethics Statement
Each participant was informed that their involvement in the study was voluntary, and that the results of their participation would not be traced or impact their relationship with researcher and school. The research was deemed to have minimal impact to participants with approval from the Barker Institute.
Preparation
A pilot test, of 6 participants who were asked to recite or write 200 digits in an order they considered to be random, was conducted to determine how to best conduct the actual experiment. The results concluded that providing 200 digits did not prove too difficult for the participants, however we do not believe participants would be comfortable giving over 300 digits as they were already struggling by the last 20 digits in the 200. Some participants took longer than other and the entire process for each individual averaged around 10 minutes, with the recording of each set of digits taking 3-4 minutes and the supplementary questions being 1 - 2 minutes. As each of these participants only did one, their results were only used for the pilot study and not used in the 21 described below.
Data Collection
A sample group of 21 student subjects (min. age: 15, max. age: 18) with no previous knowledge of the experiment were asked to provide a string of 200 from the digits (0,1,2,3,4,5,6,7,8,9) via two different methods (written and spoken); a larger sample size than Persaud (2005) as argued by Figurska et al. (2008). Each participant was asked to write down the digits in a 20x10 grid or asked to speak out loud and have their sequence recorded by the researcher. They were then asked to complete the other activity via the other method; the order of method s was alternated between participants (see Table 4). The participant was then asked supplementary questions, asking them to comment and reflect on their own performance. This was to ensure data from participants were from an “engaged attempt”. The data was typed and analysed in excel (see Table 3: Results).
Data Analysis
With the independent variable speaking or writing the numbers, the dependent variable is how random the generated sequence is. This was calculated with the suggested method (Barbasz et al., 2008) of two indexes used in conjunction with one another, with the slight adjustment to the correlation function over 10 steps rather than only 9 to ensure repetition is caught and for ease of interpretation
The results were analysed in three ways:
1. Two t-tests were used to compare speaking and writing on each quantitative metric, providing the simplest answer to the research question. If both metrics return p < 0.05 the result will be considered significant as there is still only a one-in-twenty probability that a false positive would be returned from a non-different sample.
However, if only one returns p < 0.05 then a higher threshold will be required (α=0.025), as there is a one-in-ten probability that a false positive would be returned for just one of the two metrics if α=0.05.
2. The quantitative measures were compared to the Shannon’s Entropy and Correlation
Function for a known random sequence (��������) and classified categorically as either highly random (if it is closer to the ideal value than ��������), random (if it is within twice the distance of ��������, nonrandom (within three times the distance of ��������), or highly non-random. Histograms were produced indicating the randomness across each of these functions. Results for speaking and writing were then compared with two X2 tests of difference.
3. Finally, case studies were investigated including closer inspection of the distribution of the frequency of each digit (related to
Entropy) and distribution of the Correlation
Function to explore what was preventing individuals (if anything) from achieving randomness.
The following (Tables 3 and 4) are the processed values for Entropy and Correlation Function.
Table 3: Resultant values for H and Cf
Spoken Written
Written First
Subject Number
H (ideal = 3.322)
Cf (ideal = 1.000)
H (ideal = 3.322)
Cf (ideal = 1.000)
1 3.283 0.690 3.263 0.80 2 3.158 0.810 3.035 1.00 3 3.275 0.770 3.273 0.72 4 3.284 0.740 3.302 0.70 5 3.274 0.675 3.274 0.76 6 3.306 0.730 3.228 0.82 7 3.273 0.740 3.257 0.87 8 3.284 0.725 3.293 0.74 9 3.220 0.760 3.199 0.86 10 3.297 0.720 3.271 0.76 11 3.243 0.830 3.268 0.94
Spoken First 12 3.240 0.760 3.241 0.83
13 3.286 0.685 3.277 0.74
14 3.288 0.800 3.282 0.79
15 3.144 0.795 3.105 0.93
16 3.243 1.130 3.282 1.19
17 3.284 0.885 3.267 0.84
18 3.307 0.675 3.287 0.72
19 3.286 0.720 3.274 0.78
20 3.305 0.670 3.292 0.80
21 3.299 0.615 3.246 0.78
Average 3.283 0.690 3.248 0.82
Table 4: Summary Table
Spoken Written
H Cf H Cf
Spoken first 3.268 0.774 3.255 0.837 Written First 3.263 0.745 3.242 0.812
Because both tests returned values less than 0.05, it can be reported that there was a significant difference in both metrics. RSG of 200 digits when writing was quantitatively more random then when speaking.
Analysis
1. T-tests Two two-tailed t-tests (for dependent means) were performed comparing the mean Entropy for speaking and writing (t=-2.253307, p=0.03562) and mean Correlation Function for speaking and writing (t=4.683825, p=0.00014).
2. Comparing Entropy and Correlation function to that of a sequence often accepted as showing traits of randomness – �������� The first 200 digits of �������� have an entropy of 3.29416 and correlation function of 0.895. This establishes a threshold for considering the randomness of a sequence. If the distance from the ideal Entropy and Correlation Function for any 200-digit string is no more than the distance of �������� from the ideal, then by the measures used in this paper it can be classified as “highly random”. If it is no more than twice the distance of �������� from the ideal, it is classified as “random”. Any further it is non-random with more than four times the distance of �������� from the ideal being classified as “Highly non-random”. These criteria are shown in Table 5. Table 6 is a reproduction of the full results table (Table 3) with the colour coding in relation to ��������.
Table 5: Classifications for levels of randomness
H Cf If the values for a particular string are equal or closer to the ideal value
of ��������, then
Ideal 3.32193 1.000 �������� 3.29419 0.895 |Ideal - �������� | 0.02774 0.105 Highly random 2*|Ideal- �������� | 0.055 0.210 random 3*|Ideal- �������� | 0.083 0.315 non-random 4*|Ideal- �������� |+ 0.111+ 0.420+ Highly non-random
Table 6: Values of H and Cf for each sequence, colour coded by classifications of randomness determined from Table 5.
Spoken Written
Written First
Spoken First
H Cf H Cf
Subject Number (ideal = 3.322) (ideal = 1.000) (ideal = 3.322) (ideal = 1.000)
1 3.283 0.69 3.263 0.80 2 3.158 0.81 3.035 1.00 3 3.275 0.77 3.273 0.72 4 3.284 0.74 3.302 0.70 5 3.274 0.675 3.274 0.76 6 3.306 0.73 3.228 0.82 7 3.273 0.74 3.257 0.87 8 3.284 0.725 3.293 0.74 9 3.22 0.76 3.199 0.86 10 3.297 0.72 3.271 0.76 11 3.243 0.83 3.268 0.94 12 3.24 0.76 3.241 0.83 13 3.286 0.685 3.277 0.74 14 3.288 0.8 3.282 0.79 15 3.144 0.795 3.105 0.93 16 3.243 1.13 3.282 1.19 17 3.284 0.885 3.267 0.84 18 3.307 0.675 3.287 0.72 19 3.286 0.72 3.274 0.78 20 3.305 0.67 3.292 0.80 21 3.299 0.615 3.246 0.78
Average 3.283 0.69 3.248 0.82 Highly random 5 0 1 3 Random 9 6 12 8 nonrandom 3 10 3 9 Highly nonrandom
From the last four rows of Table 6, figures can be produced to compare the categories of randomness for speaking and writing. Figure 2 presents a histogram for the degree of randomness (as measured by Entropy) for both speaking and writing,
14
12
10
Count 8
6
4
2
0 5
1
Highly random 12
9
3 3 3 2
random non-random Highly nonrandom
Entropy Spoken Entropy Written
Figure 2: Distribution of levels of randomness in terms of entropy
It can be seen in Figure 2 that six times students were able to have at least the same entropy as �������� and so are classified as “highly random”. This occurred five times when speaking, and only once when writing. However, a X2 test for independence was performed and found no significant difference between the randomness of speaking and writing (X2 = 3.2952, p = .348306).
Correlation Function
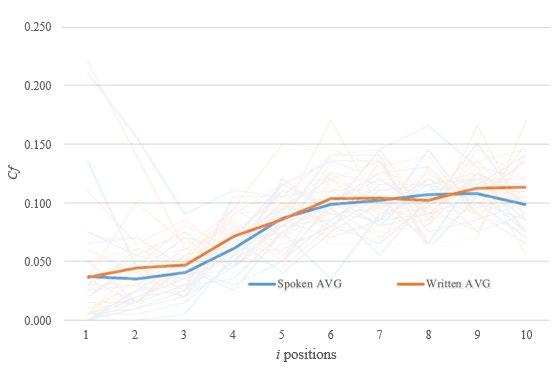
It can be seen in Figure 3 that the only three times a “highly random” was achieved was under writing and the only four times “high non-random” was given was under speaking. However, a X2 test for independence was performed and found no significant difference between the randomness of speaking and writing (X2 = 7.338, p = .062). This is supported by Figure 4 where the average Cf graph for both methods is a similar curve.
12
10
8 6Count 4
2
0 3
0
Highly random 6 8 10
9
4
0
random non-random Highly nonrandom
CF Spoken CF Written
Figure 3: Distribution of levels of randomness for correlation function
Discussion
Further explanation of the result can be seen in the following analysis.
As shown in Figure 4, Cf in the first three stages typically was visibly lower than later stages which fluctuate about 0.1 (the predicted value). This suggests that a reason why some subjects scored further from the ideal correlation function was that they were too unlikely to repeat digits within one, two or three places in the sequence. In a truly random sequence, a higher amount of repetition should occur than did for human RSG. This is the first clear improvement that can be made to human RSG.
Shown in Table 7, the digit 0 had the greatest difference from the expected value. This reflects the overall distribution of digits, revealing 0’s infrequent use.
Table 7: Frequency of digits from combined data of all sequences
Digit Frequency Expected 0 682 840 1 847 840 2 903 840 3 941 840 4 828 840 5 819 840 6 805 840 7 824 840 8 883 840 9 868 840
As entropy is a calculation of distribution of digits, again, this suggests a simple ‘lesson’ can be made to improve human RSG; a reminder that the digit “zero” should not be neglected.
Figure 4: Graph of Cf value in stages for averages of spoken and written sequences
Connections to Literature
Though the literature pointed towards a human inability to consciously generate randomness (Figurska, et al. 2008; Barbasz, et al. 2008) and hence suggesting spoken results to have yielded higher numbers in the Highly Random’ and ‘Random’ category, in accepting the null hypothesis, these results suggest that there is no clear indication in humans generating ‘better’ randomness in either metric.
This study thus concludes three statements:
1. That humans can produce a more random sequence when writing rather than speaking 2. That humans are not wholly bad at randomness 3. That there is potential for humans to improve randomness to a certain extent with simple advice.
The first statement is supported by the t-tests that showed written sequences as significantly closer to the ideal value on both metrics of Entropy and Correlation function than spoken sequences.
The second statement is supported by the distribution of the sequences in the categories Highly Random, Random, Non-Random, Highly Non-Random, where if H and Cf were separate results, the distributed ratio is 44:36 favouring Highly Random – Random. Although the category boundaries are arbitrary and the sample size on the smaller side, along with Persaud (2005) it suggests that though imperfect, humans are not ‘dreadful’ at conscious RSG.
The third statement relates to the ‘lessons’ which this study believes are possible for improving RSG from humans. Participants’ results were shown to be held back by a lack of the digit 0 and hesitancy in repetition consecutively and up to 3 digits apart. This is supported by Lopes & Oden (1987) who concluded randomness as ‘improvable’, to an extent.
Hesitancy for repeating numbers immediately as a significant factor detracting from ‘potential randomness’ is evident in the lower values in the first three stages of the Cf graphs (Figure 4) while ‘forgetting’ the digit 0 over other digits is noted in its significantly smaller frequency in the data over all (Table 7). They are also both supported by the participant answers to the supplementary questions.
However, the identified ‘mistakes’ had an equal chance of occurrence under both spoken and written circumstances, suggesting for future research, a
second round of data collection should be conducted with the same participants after being provided adequate feedback (Lopes & Oden, 1987) in order to analysed ‘improved’ results, before the investigating the relationship between spoken and written RSG. This study thus proposes that further research should have sequences resemble ‘optimal’ randomness before conducting research into various factors that may affect RSG.
Conclusion
My research project was on models to quantify the randomness of a sequence of numbers. It involved extracting (and slightly modifying) specific randomness metrics including Entropy (equal distribution of digits) and Correlation function (an appropriate amount of repetition) and justifying the complex mathematical models for each. These were then applied in the context of the human ability for conscious Random Sequence Generation, with focus in particular on the differences between spoken and written sequences. I asked 21 participants to give what they believed to be a random sequence of 200 digits (from 0-9). Data was collected from the participant for spoken and written. The data analysis involved performing two two-tailed t-tests (for dependent means) on the means of Entropy and Correlation Function for speaking and writing, as well as two X2 tests on their categorical proximity to the randomness of ��������.The results on my data analysis showed the difference in both Entropy and Correlation Function to be significant according to the t-tests, with a higher level of randomness for writing rather than speaking, contrary to my initial hypothesis.
Acknowledgements
I wish to extend my special thanks to Dr Matthew Hill for the extensive supervisory support throughout the whole project, both in data collection and in writing up the report, as well as for the advice and encouragement provided. Thank you also to the students from Year 10 - 12 who participated in the data collection and the teachers who facilitated it.
References
Baddeley, A.D. (2001). Is working memory still working? American Psychologist 56, 851–864.
Barbasz, J., Stettner, Z., Wierzchoń, M., Piotrowski, K., Barbasz, A. (2008). How to estimate the randomness in random sequence generation task? Polish Psychological Bulletin 39. Brugger, P. (1997). Variables That Influence the Generation of Random Sequences: An Update. Perceptual and Motor Skill 84, 627–661. Church, A. (1940). On the concept of a random sequence. Bulletin of the American Mathematical Society, 46, 130–135.
Eagle, A. (2005). Randomness is Unpredictability. British Journal for the Philosophy of Science. Evans, F. J. (1978). Monitoring attention deployment by random number generation: An index to measure subjective randomness. Bulletin of the Psychonomic Society, 12, 35-38. Figurska, M., Stan ́czyk, M., Kulesza, K. (2008). Humans cannot consciously generate random number sequences: Polemic study. Medical Hypotheses 70, 182–185. Haldane, J. B. S. (1941) ‘The Faking of Genetical Results’, Eureka 6 (8) 21-24 Kareev, Y. (1992). Not That Bad After All. Generation of Random Sequences. Journal of Experimental Psychology: Human Perception & Performance 18 (4), 1189-1194. Kolmogorov, A. N. (1933). Grundbegriffe der Wahrscheinlichkeitsrechnung. Springer. Lopes, L. L. & Oden, G. C. (1987). Distinguishing between random and nonrandom events. Journal of Experimental Psychology: Learning, Memory and Cognition, 13(3), 392-400. Martin-Löf, P. (1966). The definition of random sequences. Information and Control, 9, 602–619. Pandit, J. J. (2012) ‘On Statistical Methods to Test If Sampling in Trials Is Genuinely Random: Editorial’, Anaesthesia 67 (5), 63. Persaud, N. (2005). Humans can consciously generate random number sequences: A possible test for artificial intelligence. Medical Hypotheses 65, 211–214. Shannon, C. (1948). A Mathematical Theory of Communication, Reprinted with corrections from The Bell System Technical Journal, Vol. 27, pp. 379–423, 623–656 Terwijn, S.A. (2016). The Mathematical Foundations of Randomness, in: Landsman, K., van Wolde, E. (Eds.), The Challenge of Chance: A Multidisciplinary Approach from Science and the Humanities, The Frontiers Collection. Springer International Publishing, Cham, pp. 49–66. Towse, J. N. & Neil, D. (1998). Analysing human random generation behavior: A review of methods used and a computer program for describing performance. Behavior Research Methods, Instruments & Computers. 30(4), 583591.
von Mises, R. (1919). Grundlagen der Wahrscheinlichkeitsrechnung. Mathematische Zeitschrift, 5, 52–99. Wald, A. (1936). Sur la notion de collectif dans la calcul des probabilités. Comptes Rendus des Seances de l’Académie des Sciences, 202, 180–183.
Wald, A. (1937). Die Wiederspruchsfreiheit des Kollektivbegriffes der Wahrscheinlichkeitsrech-nung. Ergebnisse eines Mathematischen Kolloquiums, 8, 38–72.
Chemistry

This year’s chemistry projects were focused in the area of medicinal chemistry, a vitally important research area with the potential to unlock new pathways to treat diseases.
Thomas, Maxine and Jess were part of the Breaking Good project; a citizen science project targeing the availability and cost of essential medicines. Building on previous projects, Thomas and Maxine were able to synthesise new analogues of the antimalarial drug, pyrimethamine. Jess focused on assessing the reliability of the synthesis of this original drug of interest, pyrimethamine, which has been developed by Sydney Grammar School. New areas of research this year were explored by James, Brianna and Kyle. James and Brianna tackled projects investigating the concentration of allicin in garlic cloves. Allicin is a potent natural compound with impressive anti-inflammatory and antioxidant benefits. James made new discoveries about the effects of UV light on the stability of allicin extracted from garlic, an area of research that has yet to be reported on and has potentially vast applications. Brianna’s attention was focused on the effect of temperature on the concentration of allicin extracted. Kyle was interested in spinach and the concentration of chlorophyll measured after harvest. All of these projects took inspiration from nature and a desire to maximise our intake of these medicinally important compounds present in common foods.
Both Charlie and Ollie built on previous research published in this journal. Charlie’s project aimed to investigate the effect of tomato variety on the lycopene concentration extracted and Ollie chose to combine his interests in chemistry and biology by investigating the antibacterial properties of isothiocyanate compounds. By making small changes to the chemical structure of simple compounds, the antibacterial properties can be dramatically altered. Finally, Cleo’s chemistry project probed a very different aspect of the field, how the difficult and abstract concepts in chemistry can be represented using analogies and the effect this has on student learning.
Tom Abbott
Barker College Malaria remains one of the most pervasive and impactful diseases in tropical regions. This can be attributed to the development of resistance to popular anti-malarial agents through point mutations in the dihydrofolate reductase domain. There is significant potential to overcome such resistance by replacing the substituents on the phenyl ring of Pyrimethamine, a widely used anti-malarial agent. The 3,4-methylenedioxy analogue of Pyrimethamine was successfully synthesised in a high school laboratory following a simplified synthetic procedure compared to that reported in the literature. Time constraints did not allow for biological testing to be undertaken, and further steps must be taken to purify the compound in both steps 2 and 3 of the synthesis.
Literature Review
Malaria, a treatable and preventable disease, continues to be a significant public health concern, with over 400,000 deaths occurring yearly because of the parasite (WHO, 2020). Due to insufficient access to cheap and effective antimalarial drugs, the problem of parasite resistance (particularly in malaria) has posed significant humanitarian and health issues to impacted regions. In sub-Saharan Africa, there were 380,000 deaths due to Malaria in 2019, with 99.7% of these deaths being directly caused by the Plasmodium Falciparum strain of the parasite (Weiss et al., 2019). While the global incidence rate of malaria has been decreasing, there has recently been a dramatic decrease in the rate of reduction of both its morbidity and mortality in the sub-Saharan African region. While this could be a result of many factors - such as increasingly turbulent weather leading to optimised mosquito breeding conditions - the leading theory for this alarming change is that drug resistance in the parasite, manifesting through rapid mutations in the plasmodial dihydrofolate reductase (DHFR) enzyme, has led to dramatic decreases in the efficacy of several well-established antimalarial agents which act by inhibiting this particular enzyme (Endo et al., 2017). DHFR is an essential target for most antifolate classed anti-malarial drugs. It catalyses the reaction of dihydrofolate to tetrahydrofolate which is part of the thymidylate cycle (Figure 1), making it responsible for the production of thymidylic acid (dTMP), which is an essential nucleotide for DNA synthesis. Inhibition of DHFR thus leads to a deficiency of dTMP, and subsequently DNA, which is crucial for enzyme reproduction (McKie, 1998). Therefore, the efficacy of anti-malarial agents lies in their ability to inhibit the folate biosynthetic pathway, stopping the proliferation

Figure 1: The biosynthesis of tetrahydrofolate. After: (Tropak et al., 2015).
and causing the death of the parasite (Chon, Stover, & Field, 2017). Pyrimethamine (1) is a potent inhibitor of P. Falciparum DHFR and was effectively used to treat P. Falciparum malaria until the widespread appearance of anti-folate resistance significantly diminished its efficacy as an antimalarial agent (Gatton et al., 2004). This resistance was first reported in rural Tanzania during the 1970’s, and in 2006 the enzyme mutations were declared as significant threats to the efficacy of Pyrimethamine and other DHFR inhibitors(Ebel, 2021; Mharakurwa, 2011). Sequencing of the gene from Pyrimethamine resistant strains indicates that resistance has ensued from widespread point mutations in DHFR (Sirawaraporn, 1997). In wild-type DHFR, the critical interaction with
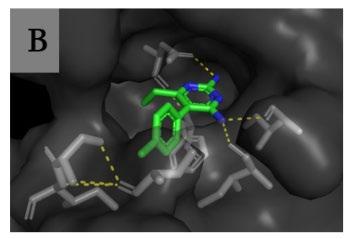
Figure 2 A) Pyrimethamine, B) Pyrimethamine’s position and hydrogen bonding in plasmodial DHFR.

Figure 2:Evolutionary tree for the development of resistance in malaria. The red text highlights mutations that have been observed, and solid arrows indicate the anticipated pathways by which resistance develops. (After: Sirawaraporn, 2003).
Pyrimethamine (1) is the hydrogen bonding that occurs at the active site between the amine groups in the drug, and the active site amino acids (Figure 2B), allowing the drug to inhibit the tetrahydrofolate biosynthetic pathway (Tropak, 2015; Gatton, 2004). The correlation between Pyrimethamine resistance and mutations in the DHFR domain has been demonstrated in vitro via mutagenesis of synthetic P. Falciparum DHFR genes (Durland et al., 2021). Mutagenesis involves the transformation of specific malarial parasites with gene constructs carrying individual mutations. Moderate levels of Pyrimethamine resistance initially occur from a single point mutation (S108N) in the DHFR domain, in which a small structural change to the serine residue causes new structural-interference interactions with Pyrimethamine’s benzene ring, prohibiting successful docking and inhibition (Xu et al., 2013). However, double and triple mutations impart much higher levels of resistance. The most common resistant strains contain the double mutations (S108N + C59R) or (S108N + N51), or the triple combination of these mutations (S108N + C59R + N51R) (Figure 3) (Tarnchimpoo et al. 2002). Recently, treatment failure has been reported due to the quadruple mutation (S108N + C59R + N51R + I164L) (Ahmed, 2006; Das et al., 2013). This is of concern to antimalarial efforts as the presence of such mutations places pressure on anti-folate drug availability and efficacy. The exact evolutionary pathways of such mutations are difficult to determine, but it is generally accepted that they develop sequentially according to the pathway outlined in Figure 3 – with single mutant strains predicating the existence of double, triple, and then quadruple mutant variants. The most common mutation occurs at the serine 108 residue (Kamchonwongpaisan, 2004). Resistance follows from a steric clash with Pyrimethamine (1) at the active site due to the compound’s inability to form hydrogen bonds between the NH2 groups on the heterocyclic pyrimidine component and the active site amino acids. While the mutations do not directly interact with Pyrimethamine, they change the structural features of DHFR, creating spacial and polarity differences in the substituents of the active site, and therefore the nature of the active site bonding (Figure 4) (Nattee et al., 2017).
The kinetics of inhibition suggests that the introduction of multiple mutations leads to a lower affinity between the enzyme and Pyrimethamine. In biochemistry, the enzyme inhibition constant (Ki), is an important indicator of the efficacy of a specific substrate against specific enzymes. The value of the Ki constant is numerically equal to the substrate concentration at which the reaction rate is half of its maximum, which occurs at its saturating point. Triple and quadruple mutant DHFR enzymes demonstrate a decreasing range of Km values that are 2% - 40% of wild-type, indicating that a significantly higher concentration of the substrate is necessary for successful enzyme inhibition. (Sirawaraporn, 1997). While this is the leading hypothesis for increasing levels of drug resistance, the exact structure of the bio-functional enzyme is unknown, and further research must be completed to determine Pyrimethamine’s interactions with both mutant and wild-type DHFR. The most common approach to designing novel medicines is through the continuous re-development of analogues of drugs that have lost their potency. Furthermore, the development of new Pyrimethamine derivatives contributes to our understanding of how
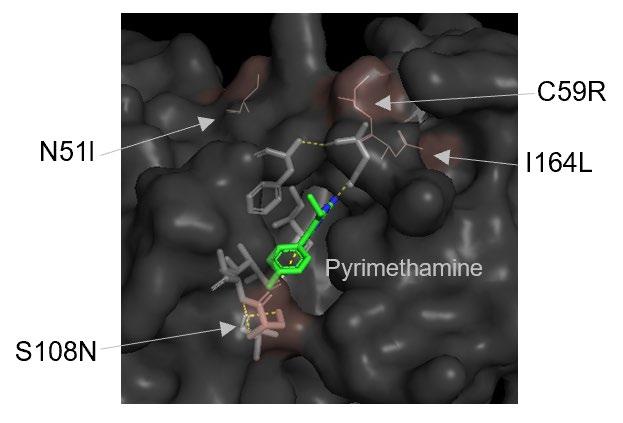
Figure 4: Position of mutations in DHFR in relation to Pyrimethamine (1) complexed with the enzyme.
molecular structure affects specific interactions with wild-type and mutant DHFR. The majority of analogues that have been synthesised to date consist of various halogen substitutions at positions R2-R6 on the phenyl ring (Figure 5A) (Kamchonwongpaisan, 2017). The focus of this study will be to synthesise and test the 3,4methylenedioxy analogue of Pyrimethamine (2). This analogue shows promising signs of being an effective antimalarial agent, with molecular models indicating an enzyme inhibition constant (Ki) of 1.1 ± 0.3 against S108N single mutant plasmodial DHFR (Nattee et al., 2017) Furthermore, the relatively large size of the methylenedioxy group situated at the R3 and R4 positions on the phenyl ring (Figure 5B) significantly changes the general shape of the molecule, which will provide interesting structure-activity information that may contribute to a more sophisticated understanding of Pyrimethamine’s interactions with DHFR. While molecular modelling has suggested that a large atom in the R4 position may lead to lower inhibition rates due to a spacial clash with the substituents in the enzyme active site, this is not the case in experimental analysis, possibly due to the conformational flexibility of the DHFR enzyme (Chu, 1996). The following research aims to gather data about the methylenedioxy analogue’s antimalarial activity by testing it in vitro against single and double mutant DHFR.
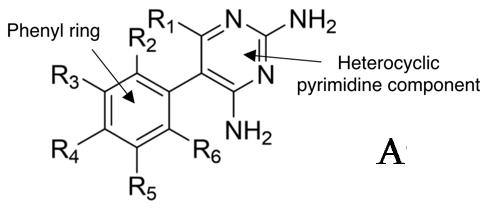
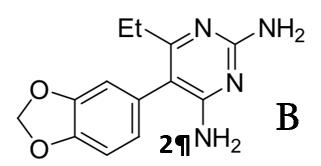
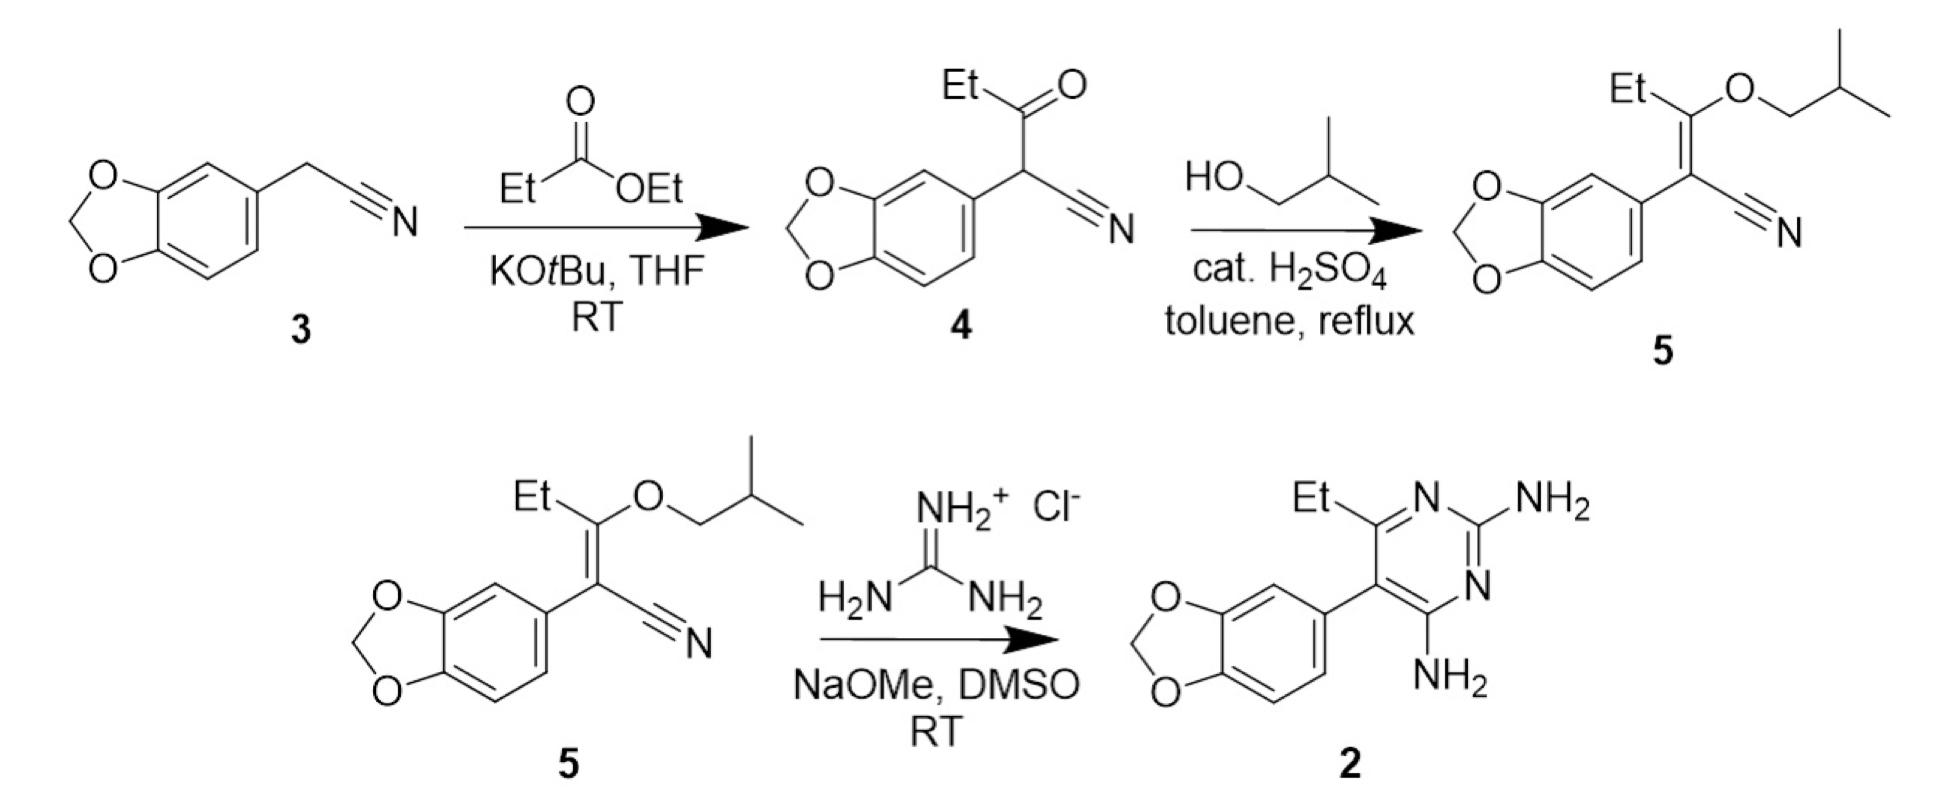
Figure 5: Position of mutations in DHFR in relation to Pyrimethamine (1) complexed with the enzyme. The synthetic pathway for Pyrimethamine (1) developed by Sydney Grammar students will be the focus of this methodology (Figure 6) (OSM, 2016). Students have successfully synthesised Pyrimethamine from 4chlorophenylacetontrile in collaboration with the Breaking Good Project and Sydney University. Furthermore, in 2020 a Barker College student successfully used this method to synthesise the iodoanalogue of Pyrimethamine for the first time, which consists of an iodine substitution at the R4 position (Figure 3) (Barker College, 2020). When considering the methylenedioxy analogue (2), the synthetic pathway - outlined in Figure 6 - remains the same; however, the initial reactant will be changed to 3,4(methylenedioxy)phenylacetonitrile (3) to reflect the structural changes in the final molecule.
Scientific research question
Can the methylenedioxy analogue (2) of Pyrimethamine be synthesised from 3,4-(methylenedioxy) phenylacetonitrile (3) in a school laboratory, and its effectiveness as an anti-plasmodial agent be subsequently tested?
Scientific hypothesis
That the methylenedioxy analogue (2) of Pyrimethamine can be synthesised from 3,4(methylenedioxy) phenylacetonitrile (3) in a school laboratory, and be tested as an anti-malarial agent against single and double mutant Plasmodium Falciparum.
Methodology
General experiment details
1H NMR spectra were recorded at 300K with a Bruker Avance DRX400 NMR spectrometer. Residual chloroform (δ 7.26) was used as an internal reference for
the 1H NMR spectra. The data is reported in terms of chemical shift (δH ppm), relative integral, multiplicity (s = singlet, d = doublet, t = triplet, q = quartet, m = multiplet) and assignment. Atom labels on structures are to illustrate 1H NMR spectral assignments and do not necessarily correspond to the IUPAC identifiers provided. Mass spectra were recorded by the Mass Spectrometry Unit of the School of Chemistry at the University of Sydney using an amaZon SL mass spectrometer, and analysed using Bruker Compass DataAnalysis 4.2 software. The molecular ion ([M + H+] or [M – H+]) is listed.
Throughout the reaction process, analytical Thin Layer Chromatography (TLC) was conducted in order to gauge the progress of the reaction, and determine the point of completion. TLC was performed using Merck Kieselgel 60 F254 pre-coated aluminium sheets (0.2 mm), and visualisation was enabled by inspection under UV light at 254 nm. The TLC was conducted with either, 50:50 Dichloromethane (DCM) : Hexane, 100% DCM, or 100% ethyl acetate. The eluent for each specific TLC is assigned in the following methodology.
Step 1: Synthesis of 3,4-(methylenedioxyphenyl)-3oxopentanenitrile (4)
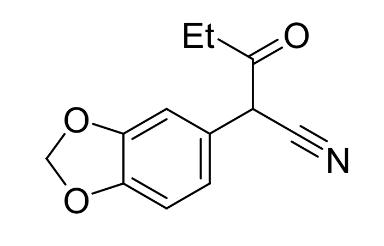
Figure 7:3-4-(methylenedioxy)phenylacetonitrile
3,4-(methylenedioxy)phenylacetonitrile (10.03 g, 0.062mol, 1 equiv.), ethyl propionate (6.67g, 0.065 mol, 1.05 equiv.) and potassium tert-butoxide (13.97g, 0.12mol, 2 equiv.) were combined in THF (100 mL) at room temperature, stirred in a round bottom flask. The reaction mixture turned a dark red and heated up rapidly. When the mixture appeared homogeneous stirring was turned off. The reaction was sealed and left to sit for 6 hours. The reaction mixture was worked up by pouring onto a 1.0 M HCl in a separating funnel (100 mL). The aqueous layer was extracted with DCM (3 x 50 mL). The combined organic layer was washed with saturated aqueous NaHCO3 (100 ml) and brine (100mL), dried with anhydrous sodium sulfate, filtered, and concentrated in vacuo to afford 3,4(methylenedioxyphenyl)-3-oxopentanenitrile (4) (13.25 g, 0.61 mol, 98%) as a reddish oil. TLC was conducted with 50:50 DCM : Hexane as the eluent. The crude 3,4(methylenedioxyphenyl)-3-oxopentanenitrile was not purified further before being used in step two.
Step 2: Synthesis of 2-(benzo[d][1,3]dioxo-5-yl)-3isobutoxypent-2-enenitrile (5)
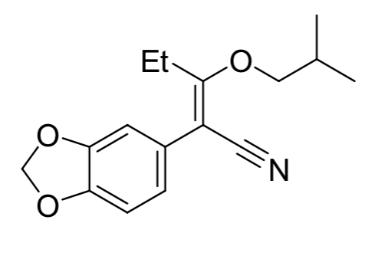
Figure 3: 2-(benzo[d][1,3]dioxo-5-yl)-3- isobutoxypent-2enenitrile
3,4-(methylenedioxyphenyl)-3-oxopentanenitrile (4) (13.25 g, 0.61 mol) was dissolved in a mixture of toluene (65.0 mL) and 2-methylpropan-1-ol (6.50 mL). 18M H2SO4 (2.00 mL) was added, and the mixture was refluxed for 10 hours in a Dean Stark apparatus. The reaction mixture was poured onto a saturated sodium hydrogen carbonate solution (100 mL) in a separating funnel and the aqueous phase was extracted with DCM (2 x 50 mL). The combined organic extracts were dried over anhydrous sodium sulfate. Addition of 2.5 mL of triethylamine to the reaction mix converted the unreacted starting material to its very polar triethylammonium enolate salt. Chromatography silica (25g) was added to the organic phase, which was made up to 200mL with DCM and stirred for two hours. The organic phase was then filtered under vacuum and rinsed with 1M HCl (100 mL) and deionised water (50 mL) to remove all traces of triethylamine. The solvent was removed in vacuo to yield 2-(benzo[d][1,3]dioxo-5yl)-3-isobutoxypent-2-enenitrile (5) (12.03g, 0.044 mol, 73%) as a reddish oil. The product was used without further purification in the next step of synthesis.
Step 3: Synthesis of 3,4-methylenedioxy pyrimethamine analogue (2)
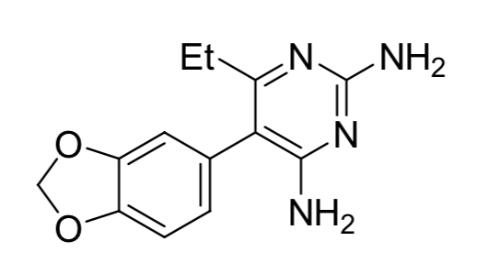
Figure 9: 3,4-methylenedioxy pyrimethamine analogue 2-(benzo[d][1,3]dioxo-5-yl)-3-isobutoxypent-2enenitrile (12.03 g, 0.044 mol, 1 equiv.) was dissolved in DMSO (225 mL). Guanidine hydrochloride (9.07 g, 0.095 mol, 2.2 equiv.) was stirred into the solution followed by sodium methoxide powder (5.95 g, 0.11 mol, 2.5 equiv.). The solution became dark red in colour on addition of the sodium methoxide, which dissolved into the solution within an hour. No precipitation of sodium chloride was observed.
The solution was allowed to stand at room temperature for 24 hours before being poured onto water and extracted with DCM. An emulsion formed in the separating funnel and was left to settle over 48 hours. Crystals formed in the DCM/water mixture and were isolated to afford 2.7g of sandy orange organic compound. TLC was conducted in 100% ethyl acetate to confirm the existence of a polar compound.
Results
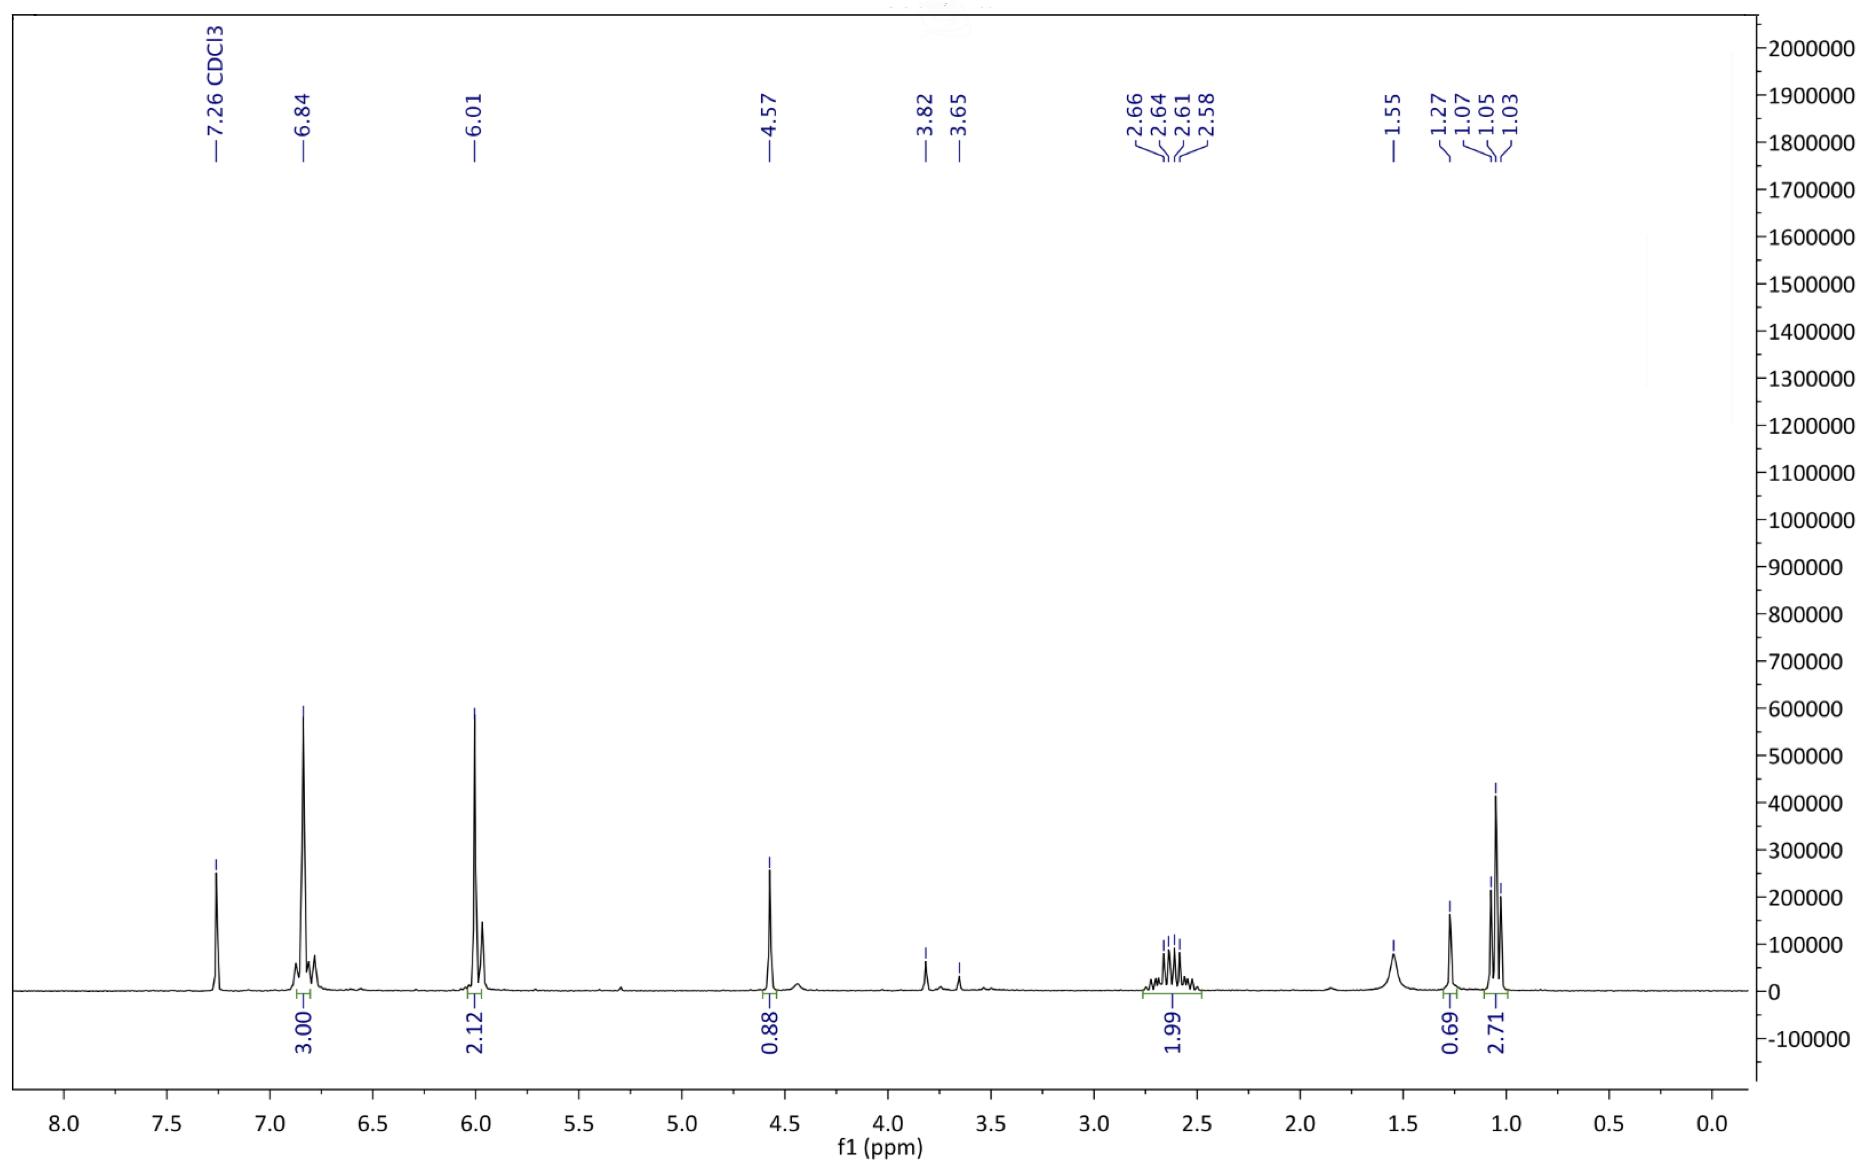
Figure 10: : 1H NMR spectrum after step 1. 1H NMR (500 MHz, chloroform-d): δ 1.05 (t, J = 7.2 Hz, 3H), 2.62 (m, 2H), 4.57 (s, 1H), 6.01 (s, 2H), 6.84 (m, 3H)
A
B

Figure 41: Mass spectrum after step 1. A Compound in positive ESI zoomed around peak at 345.05 Da. B Compound in negative ESI zoomed around peak at 216 Da.

Step 2: Synthesis of 2-(benzo[d][1,3]dioxo-5-yl)-3-isobutoxypent-2-enenitrile
Step3: Synthesis of 3,4-methylenedioxy pyrimethamine analogue
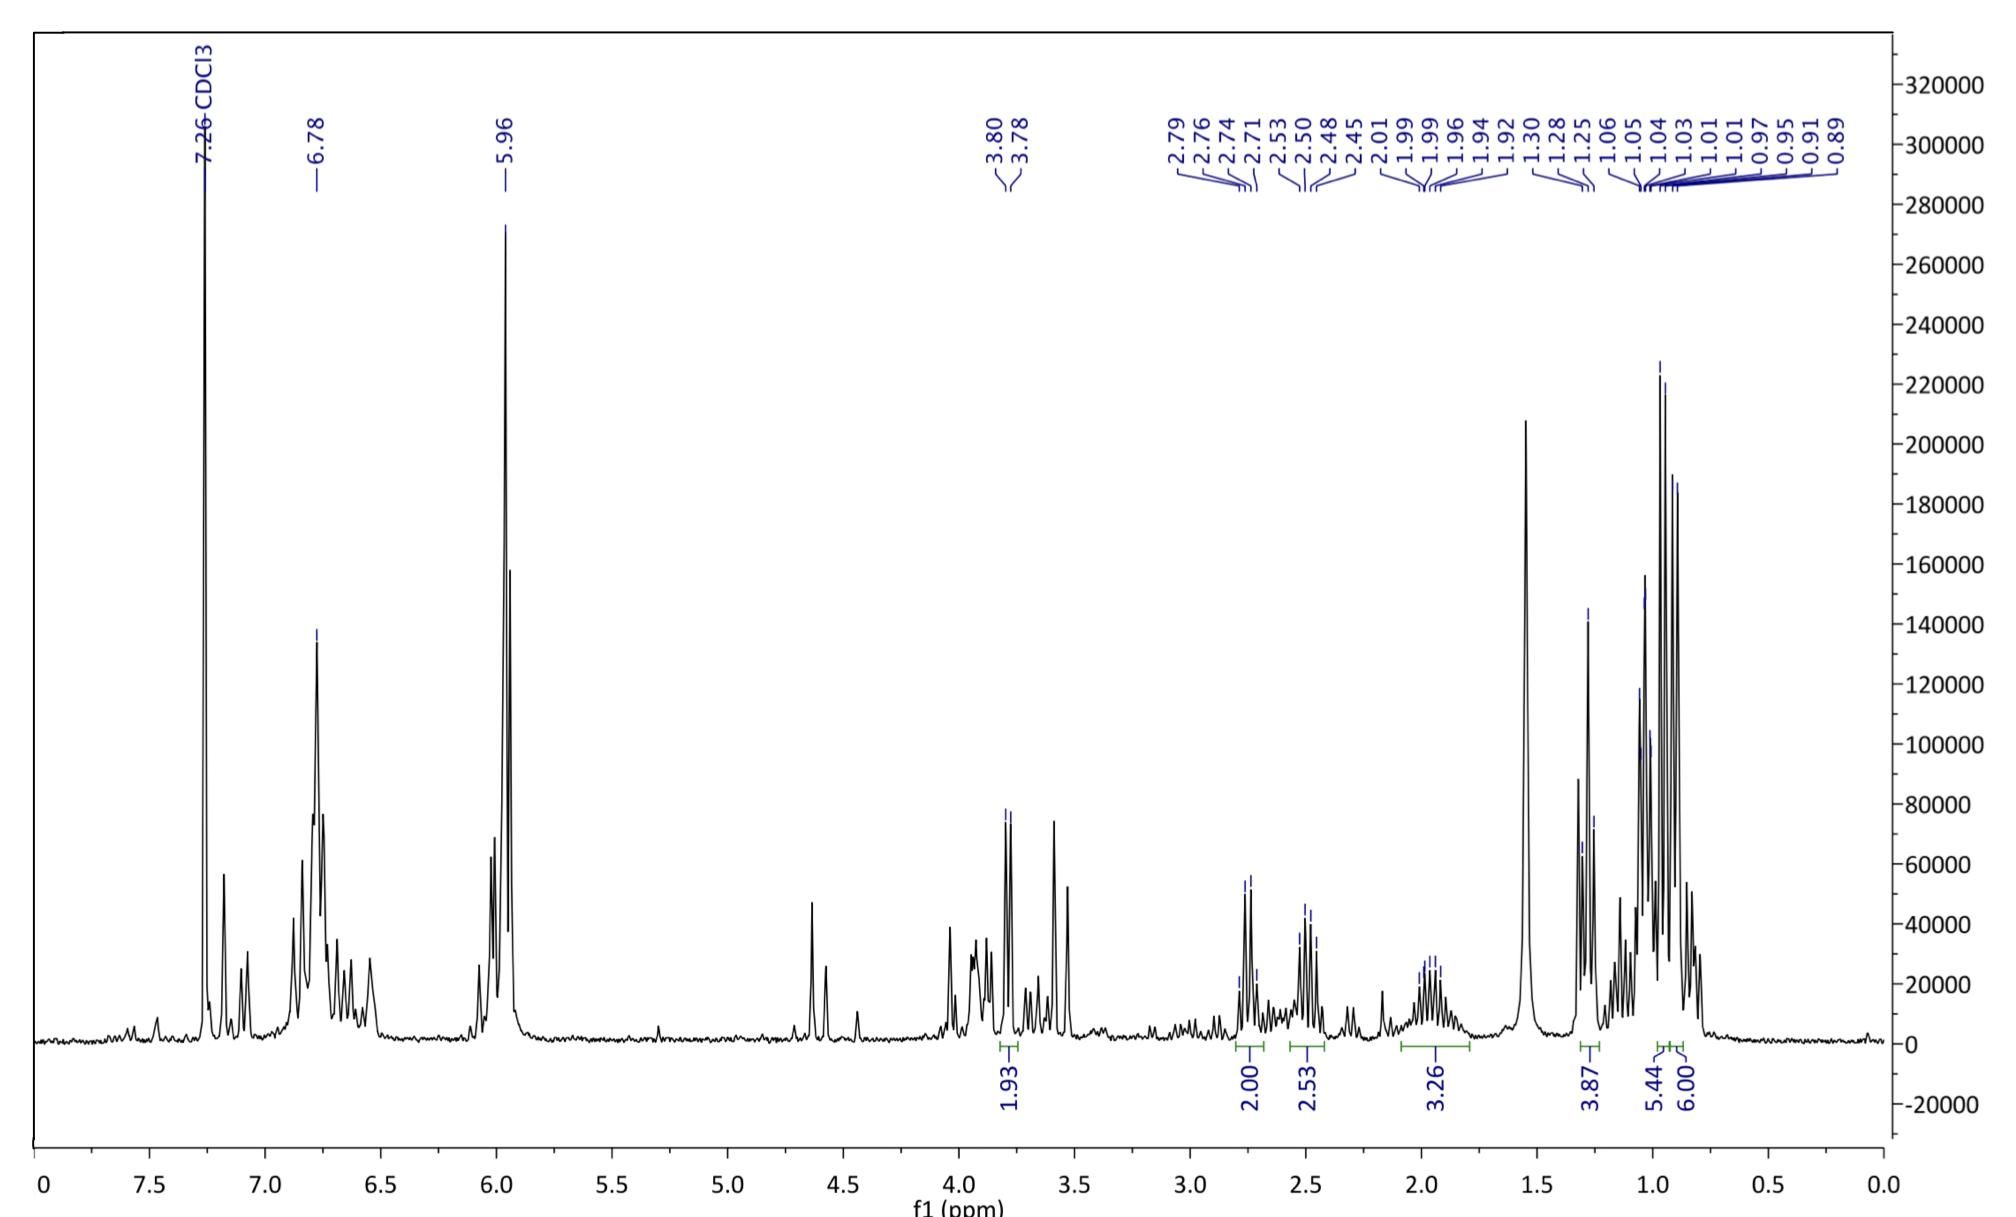
Figure 125: 1H NMR spectrum after step 2. 1H NMR (500 MHz, chloroform-d): δ 1.05 (t, J = 7.2 Hz, 3H), 0.95-0.90 (d, 6H), 1.98 (m, 1H), 1.28 (t, 3H), 2.71 (q, 2H), 3.78 (d, 2H), 5.59 (s, 2H), 6.78 (s, 2H)
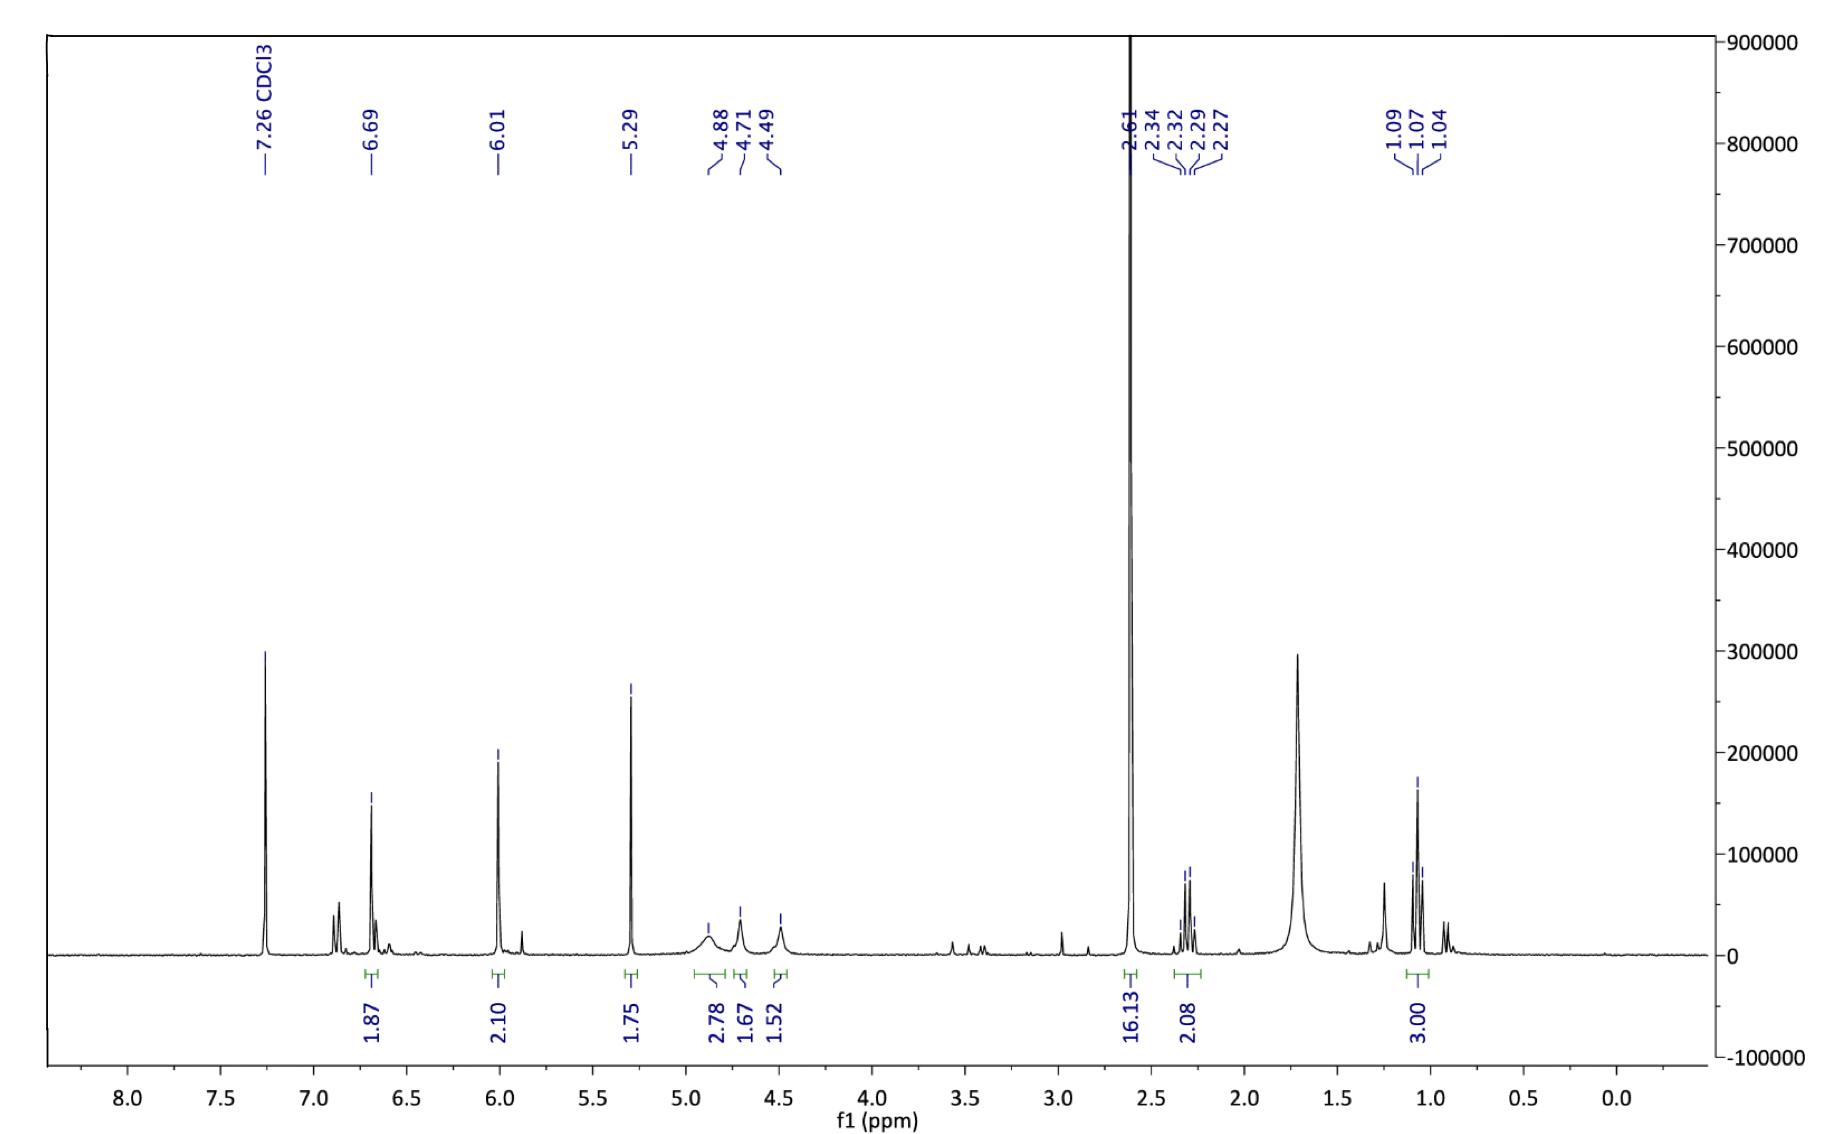
Figure 13 : 1H NMR spectrum after step 3. 1H NMR (500 MHz, chloroform-d): δ 1.05 (t, J = 7.2 Hz, 3H), 1.07 (t, 4H), 2.32 (m, 6H), 4.49 (s, 2H), 4.71 (s, 2H), 4.88 (s, 2H), 6.01 (s, 2H), 6.69 (s, 3H)
TLC for steps 1,2 and 3
A B C
Figure 14: Thin Layer Chromatography (TLC) performed with 100% DCM for steps 1 (A), 2 (B) and 3 (C) as labeled.
Discussion

Figure 15: Overview of the reaction in step 1, forming 3.4(methylenedioxyphenyl)-3-oxopentanenitrile.
Step 1 of the synthetic pathway (Figure 15) involved a condensation reaction between 3,4-(methylenedioxy) phenylacetonitrile (3) and ethyl propionate, forming compound 4. Initially, addition of potassium tertbutoxide, a strong base, enabled the deprotonation of the CH2 group of compound 3 (Figure 16). Subsequently, reaction with the highly volatile ethyl propionate led to elimination of an ethoxide group, enabling the condensation reaction in Figure 17 to afford 3,4(methylenedioxyphenyl)-3-oxopentanenitrile (Compound 4).

Figure 15: Visualising the deprotonation of the CH2 group in 3,4-(methylenedioxy)phenylacetonitrile.
Figure17: Mechanism of the reaction between 3,4(methylenedioxy) phenylacetonitrile and ethyl propionate. The yield for this reaction was 98.5%, significantly higher than both Sydney Grammar’s 2016 Pyrimethamine synthesis which had a yield of 90%, and the Barker College 2020 iodo-Pyrimethamine analogue synthesis, which had an estimated yield of 68% (OSM 2017; Barker College 2020). This can be attributed to more optimised reaction conditions, as well as an increased quantity of the starting material (0.06 mol) in comparison to previous synthesis attempts using the same pathway. Furthermore, the highly electronegative nature of the oxygen atoms at the R3 and R4 positions could have led to a more polar, and thus more soluble compound, creating a more homogenous reaction mixture and further optimising the reaction process. Supporting this high yield, the 1H NMR confirmed the existence of the desired compound, and only indicated the existence of some slight impurities, with a 1H NMR spectrum comparable to that which was already available in the literature (Havel et al., 2018). The multiplet at 2.62ppm was assigned to the ethyl CH2 protons, which is expected to appear as a quartet due to coupling with the neighbouring methyl group. This signal may have been complicated due to a slight impurity such as the presence of the enol tautomer in the reaction mixture, or due to restricted rotation of the molecule. The singlet further downfield at 4.59ppm was assigned to the CH proton H4 (Figure 1). This was likely shifted downfield from the ethyl group signals due to the electron withdrawing nature of the nitrile group causing a deshielding of the hydrogen atom. Similarly, the singlet at 6.01ppm was assigned to the methylenedioxy hydrogens due to even more pronounced deshielding from the two adjacent oxygen atoms. Meanwhile, the multiplet at 6.84ppm was assigned to the aromatic protons H1 – H3, which likely appeared downfield due to the deshielding effect of the benzene ring.

Mass spectroscopy (Figure 13) supported the formation of the desired compound, with a peak in the negative mode at m/z 215.71, which is close to the desired M-H peak molecular weight. With a high yield, indicative of a sufficiently optimised reaction, and the production of a sufficiently clean crude compound which was confirmed to be compound 4, step 1 of the synthesis provided a good baseline for further reactions.

Figure 18: Overview of the reaction in step 2, forming 2(benzo[d][1,3]dioxo-5-yl)-3-isobutoxypent-2-enenitrile.
Step 2 of the synthesis (Figure 18) involved a dehydration reaction performed under reflux between 3,4-(methylenedioxyphenyl)-3-oxopentanenitrile and 2methylpropanol, forming compound 5. Initially, addition of 2-methylpropanol to compound 4 and subsequent protonation afforded intermediate ß. Spontaneous elimination of water and regeneration of the H+ catalyst afforded the desired compound 4. (Figure 20)
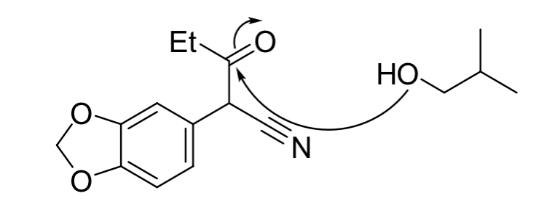
Figure 6: : Mechanism of the substitution reaction between 3,4-(methylenedioxyphenyl)-3-oxopentanenitrile and 2methylpropanol.
Perhaps the most challenging aspect of step 2, was the production of a relatively large amount of water (Figure 20), which was removed in a Dean Stark apparatus under high temperatures, driving the equilibrium reaction in its forward, endothermic direction in order to maximise yield.

Figure 7: Mechanism of the substitution reaction resulting in the formation of water, explaining the need for reflux.
The yield for this step was 73%, which was higher than Sydney Grammar’s step 2 yield of 58%, but also does not account for impurity and residual toluene in the reaction product. Due to the difficulty of this step, likely caused by the equilibrium nature of the reaction, the 1H NMR spectrum was difficult to assign as there was some impurity in the compound, possibly left over starting material (Compound 4). The singlet at 6.78ppm was assigned to the aromatic protons, primarily because of their proximity to the deshielding benzene ring pulling them downfield. Similarly, the protons on the methylenedioxy group were assigned to the signal at 5.95ppm. The doublet at 3.78ppm is characteristic of the isopropyl CH2 protons, while the ethyl CH2 and CH3 protons were assigned to the multiplets in the 1-2.5ppm range due to their location in the molecule. These signals characteristically appear as quartets, but may not appear as expected due to impurities. Mass spectrometry was not able to be performed, however the placement and integration of the 1H NMR signals were sufficient in confirming the existence of compound 5. Further purification of the reaction product would be required to obtain full characterisation data for this compound as it has thus far not been reported in the literature. Although work needs to be carried out to improve the purity of compound 5, it was decided that there was a sufficient quantity of the desired product to proceed with the next step of the synthesis.

Figure 8:Synthesis of 3,4-methylenedioxy pyrimethamine analogue
Step 3 of the synthetic pathway (Figure 21) involves a complex reaction which is initiated by the deprotonation of guanidine hydrochloride by sodium methoxide. Following this, a reaction occurs between the nitrile carbon of compound 5 and the guanidine which results in an electron rearrangement that facilitates the elimination of the 2-methylpropanol group, allowing the formation of the heterocyclic pyrimidine component of compound 2.
The product was difficult to isolate, and 72 hours after the reaction no crystals had come out of the solution. Because of this, the residual solid at the bottom of the round bottom flask was separated and run through a vacuum filter affording a highly insoluble compound. 1H NMR analysis of this solid indicated no 1H peaks in the NMR spectrum, suggesting that this product was an inorganic salt. After leaving the remaining mixture in a separating funnel with water for several days, 1.94g of another solid was isolated. While this appears to be a relatively small yield of <30%, it is likely that there is additional product in the remaining solution which
could be isolated at a later time and purified. Gratifyingly, 1H NMR analysis indicated that this isolated solid was the methylenedioxy analogue, compound 2.
As with step 2, the 1H NMR spectra for this compound was complex and hard to assign, likely due to minor impurities. The appearance of polar baseline material in the TLC (Figure 14C) confirmed the existence of a highly polar compound, which is characteristic of Pyrimethamine analogues such as 5 due to the highly polar amino groups on the pyrimidine ring. The appearance of two broad singlets at 4.49 and 4.71 ppm are characteristic of these NH2 groups. Furthermore, the triplet at 1.07 ppm was indicative of the CH2 on the ethyl group. Two more singlets at 6.01 and 6.69 ppm were likely caused by the aromatic protons and the methylenedioxy protons respectively, these signals being pulled downfield due to the highly electronegative oxygen atoms and deshielding benzene ring. The signal at 1.75 ppm was characteristic of water, which is difficult to remove from the reaction product.
25 Furthermore, a large singlet at 2.62 ppm indicated that a significant volume of solvent (DMSO) remained in the reaction mixture, due to the high boiling point of this solvent. As the relevant signals were clearly apparent in the 1H NMR spectrum alongside minor impurities, the evidence was strong enough to confirm the formation of compound 2. Time constraints and an impure final compound did not allow for biological testing of the compound as an anti-malarial agent. Compound 2 is currently at Sydney University awaiting further purification. If this results in a pure sample of this compound, biological testing will be carried out very soon.
Future Research
The successful high school synthesis of Pyrimethamine analogues helps to widen our understanding of the synthesis process developed by Sydney Grammar, and also provides new interesting structural-activity information in regards to Pyrimethamine’s interactions with the DHFR enzyme. With regard to this report, the synthesis of the 3,4methylenedioxy analogue needs to be revised and subsequently revisited. Particular areas of interest include: • Step two of the synthesis, in which compound 3 needs to be recreated with a higher purity such that further 1H-NMR and 13C-NMR can be conducted, and the spectra for this compound confirmed before being included in the Breaking
Good database. • Step three of the synthesis, in which further optimisation needs to be completed in order to
obtain a higher yield and subsequent purification, allowing for biological testing to be undertaken. It is imperative that further research is done in order to ‘stay ahead’ of mutations in the virus. Generally, this can be done by continuing to develop and synthesise new analogues of Pyrimethamine in an attempt to develop both affordable and accessible medicines. If not, we could observe alarming exponential growth in both the mortality and morbidity rates of P. Falciparum, particularly in the Sub-Saharan Africa region.
Conclusion
The research described in this report resulted in the successful synthesis of the 3,4-methylenedioxy analogue (2) of Pyrimethamine using the synthetic pathway developed by Sydney Grammar School. The formation of the appropriate product after each step was confirmed using 1H NMR spectroscopy and mass spectroscopy. Being the second analogue synthesised using this pathway, this synthesis confirms the feasibility of using the Sydney Grammar pathway to create affordable analogues of Pyrimethamine, particularly those which include various non-halogenic substitutions at the R3-5 positions on the phenyl ring. However, due to a relatively small yield because of impurities and isolation difficulties introduced in steps 2 and 3 of the synthesis, the analogue was not able to be submitted for biological testing against P Falciparum and to obtain its enzyme inhibition data. The reaction pathway should be refined, and the product purified after each step to allow for biological testing in the future. Doing so will allow more structural-activity information to be collected regarding Pyrimethamine’s interactions with the DHFR enzyme.
Acknowledgements
I would like to thank Dr Katie Terrett. Throughout this project, she has invaluable guidance and assistance, providing insights into my report, and making herself available to explain concepts and help me understand the intricacies of the research. This would not have been possible without her. I would like to thank Dr Michael Tropak, for providing assistance and guidance about using PyMol, as well as directing me towards the RCSB structure of DHFR complexed with Pyrimethamine. I would also like to thank collaborators of the Breaking Good project at Sydney University, who ran NMR and mass spectroscopy analysis of my compounds throughout the reaction process.
References
Ahmed, A. (2006). Quadruple Mutations in Dihydrofolate Reductase of Plasmodium falciparum Isolates from Car
Nicobar Island, India. Antimicrobial Agents and Chemotherapy, [online] 50(4), pp.1546–1549. Available at: https://dx.doi.org/10.1128%2FAAC.50.4.1546-1549.2006 [Accessed 6 Jun. 2021].
Chon, J., Stover, P.J. and Field, M.S. (2017). Targeting nuclear thymidylate biosynthesis. Molecular Aspects of Medicine, 53, pp.48–56.
Chu, E. and Allegra, C.J. (1996). The role of thymidylate synthase in cellular regulation. Advances in Enzyme Regulation, [online] 36, pp.143–163. Available at: https://pubmed.ncbi.nlm.nih.gov/8869745/.
Das, S., Chakraborty, S.P. and Hati, A. (2013). Malaria treatment failure with novel mutation in the Plasmodium falciparum dihydrofolate reductase (pfdhfr) gene in Kolkata, West Bengal, India. International Journal of Antimicrobial Agents, 41(5), pp.447–451.
Durland, J. and Ahmadian-Moghadam, H. (2021). Genetics, Mutagenesis. [online] PubMed. Available at: https://www.ncbi.nlm.nih.gov/books/NBK560519/# [Accessed 6 Jun. 2021].
Ebel, E.R., Reis, F. and Petrov, D.A. (2021). Historical trends and new surveillance of Plasmodium falciparum drug resistance markers in Angola. Malaria Journal, 20(1).
Endo, N., Yamana, T. and Eltahir, E.A.B. (2017). Impact of climate change on malaria in Africa: a combined modelling and observational study. The Lancet, 389(Special Issue), p.S7.
Gatton, M.L., Martin, L.B. and Cheng, Q. (2004). Evolution of Resistance to Sulfadoxine-Pyrimethamine in Plasmodium falciparum. Antimicrobial Agents and Chemotherapy, 48(6), pp.2116–2123.
Gottlieb, H.E., Kotlyar, V. and Nudelman, A. (1997). NMR Chemical Shifts of Common Laboratory Solvents as Trace Impurities. The Journal of Organic Chemistry, 62(21), pp.7512–7515.
Havel, S., Khirsariya, P. and Akavaram, N. (2018). Preparation of 3,4-Substituted-5-Aminopyrazoles and 4Substituted-2-Aminothiazoles. The Journal of Organic Chemistry, 83(24), pp.15380–15405.
Hyde, J.E. (2007). Drug-resistant malaria − an insight. FEBS Journal, 274(18), pp.4688–4698.
Issuu. (2020). Barker College Science Extension Journal. [online] Available at: https://issuu.com/barkercollege/docs/2020_science_ext_journ al_in_pdf_ [Accessed 6 Jun. 2021].
Kamchonwongpaisan, S. (2004). Inhibitors of Multiple Mutants ofPlasmodiumfalciparumDihydrofolate Reductase and Their Antimalarial Activities. Journal of Medicinal Chemistry, 47(3), pp.673–680.
McKie, J.H. (1998). Rational Drug Design Approach for Overcoming Drug Resistance: Application to Pyrimethamine Resistance in Malaria. Journal of Medicinal Chemistry, 41(9), pp.1367–1370.
Mharakurwa, S., Mkulama, M.A.P. and Musapa, M. (2011). Malaria antifolate resistance with contrasting Plasmodium falciparum dihydrofolate reductase (DHFR) polymorphisms in humans and Anopheles mosquitoes. Proceedings of the National Academy of Sciences, 108(46), pp.18796–18801.
Nattee, C. and Khamsemanan, N. (2017). A novel prediction approach for antimalarial activities of Trimethoprim, Pyrimethamine, and Cycloguanil analogues using extremely randomized trees. Journal of Molecular Graphics and Modelling, 71, pp.13–27.
Open Source Malaria. (2016). Sydney Grammar School Synthesis. [online] Available at: http://malaria.ourexperiment.org/daraprim_synthesis/15813/P yramethamine_synthesis_Status_at_the _end_of_2016.html [Accessed 6 Jun. 2021]. Ouellette, M., Leblanc, É. and Kündig, C. (1998). Antifolate Resistance Mechanisms from Bacteria to Cancer Cells with Emphasis on Parasites. Resolving the Antibiotic Paradox, pp.99–113.
Quan, H. (2020). High multiple mutations of Plasmodium falciparum-resistant genotypes to sulphadoxinepyrimethamine in Lagos, Nigeria. Infectious Diseases of Poverty, 9(1).
Sardarian, A. (2003). Pyrimethamine analogs as strong inhibitors of double and quadruple mutants of dihydrofolate reductase in human malaria parasites. Organic & Biomolecular Chemistry, 1(6), pp.960–964.
Sirawaraporn, W., Sathitkul, T., Sirawaraporn, R., Yuthavong, Y. and Santi, D.V. (1997). Antifolate-resistant mutants of Plasmodium falciparum dihydrofolate reductase. Proceedings of the National Academy of Sciences, [online] 94(4), pp.1124–1129. Available at: https://www.pnas.org/content/94/4/1124.
Tarnchompoo, B. and Sirichaiwat, C. (2002). Development of 2,4-Diaminopyrimidines as Antimalarials Based on Inhibition of the S108N and C59R+S108N Mutants of Dihydrofolate Reductase from Pyrimethamine-Resistant Plasmodium falciparum. Journal of Medicinal Chemistry, 45(6), pp.1244–1252.
Tropak, M.B. (2015). Pyrimethamine Derivatives: Insight into Binding Mechanism and Improved Enhancement of Mutant βN-acetylhexosaminidase Activity. Journal of Medicinal Chemistry, 58(11), pp.4483–4493.
Weiss, D.J. (2019). Mapping the global prevalence, incidence, and mortality of Plasmodium falciparum, 2000–17: a spatial and temporal modelling study. The Lancet, 394(10195), pp.322–331.
World Malaria Report 2020: 20 years of global progress and challenges. (2020). [online] Geneva: World Health Organisation. Available at: https://apps.who.int/iris/rest/bitstreams/1321872/retrieve [Accessed 4 Jun. 2021].
Xu, M. and Zhu, J. (2013). Novel Selective and Potent Inhibitors of Malaria Parasite Dihydroorotate Dehydrogenase: Discovery and Optimization of Dihydrothiophenone Derivatives. Journal of Medicinal Chemistry, 56(20), pp.7911–7924.


