2 minute read
B. Other Owner-Occupied Markets


distribution, and more than 80% of the households cannot afford a median-priced house in the Charlotte region.
B. Other Owner-Occupied Markets
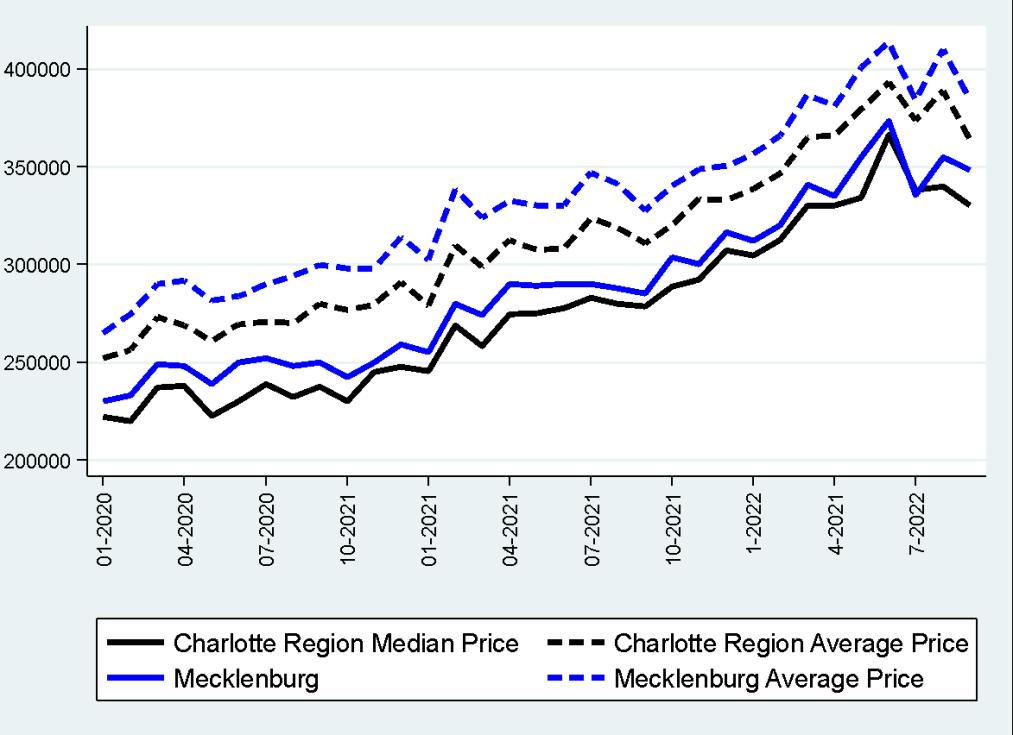
Besides single-family houses, there are other owner-occupied houses, such as condos, townhomes and apartments in the market. We therefore conduct a similar analysis for the singlefamily market to gain more insights into this market. We first plot the median and average prices for the region and Mecklenburg County in Figure III.12. The prices of other owner-occupied houses are lower than those of single-family houses. In January 2020, the median price of other owner-occupied houses was $222,000, while the median price of single-family houses was $273,500. However, the price dynamics are remarkably similar. The growth rate of the median price from September 2020 to September 2021 is 16.4%, which is very close to the 16.3% growth rate of the single-family median house over the same period. From September 2021 to September 2022, however, the growth rate of the median price is 18.4%, about 4 percentage points higher than that for the single-family house price. The other interesting thing to look at is the composition of the owner-occupied housing markets, which could gauge whether COVID-19 has changed the preference for housing. To this end, the percentage of the sales for other owner-occupied housing has not changed much from January 2020 (16.3%) to September 2022 (17.5%).
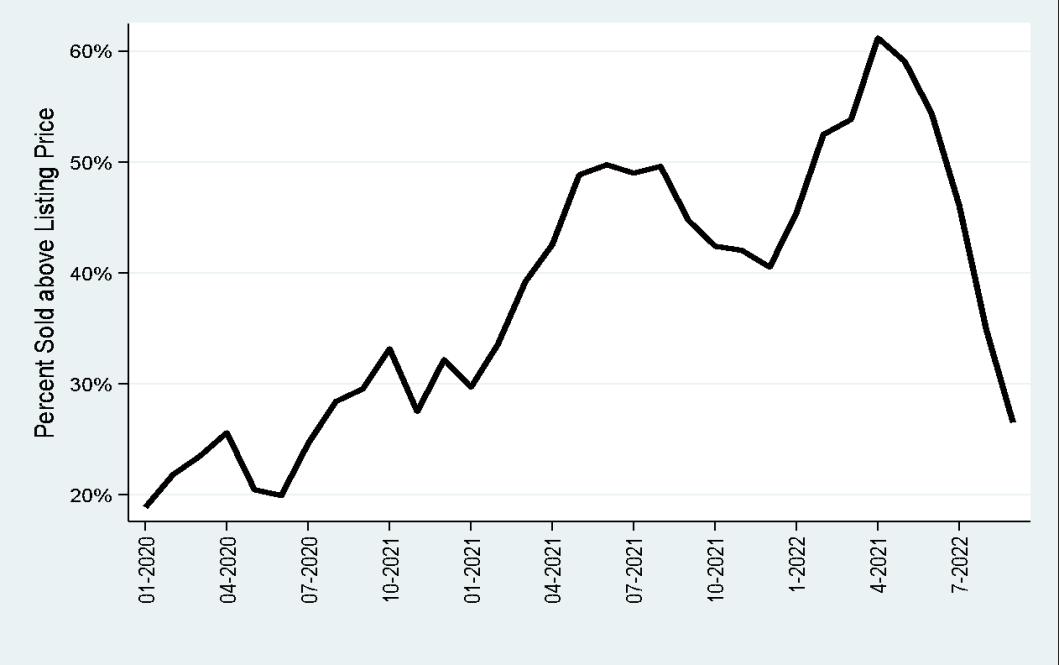
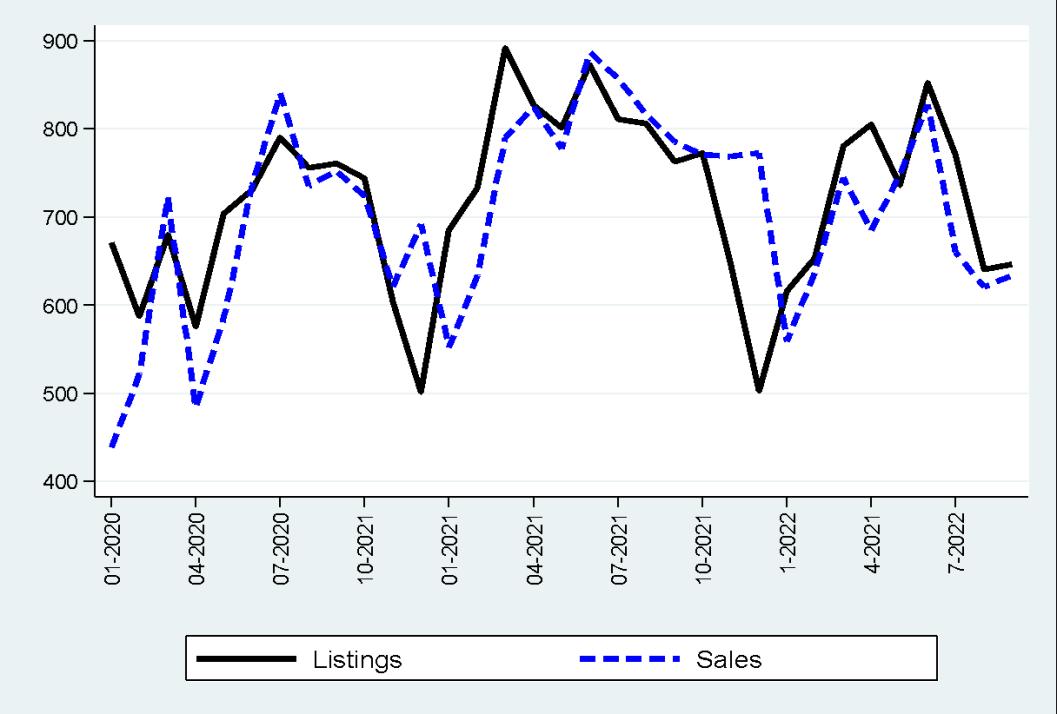
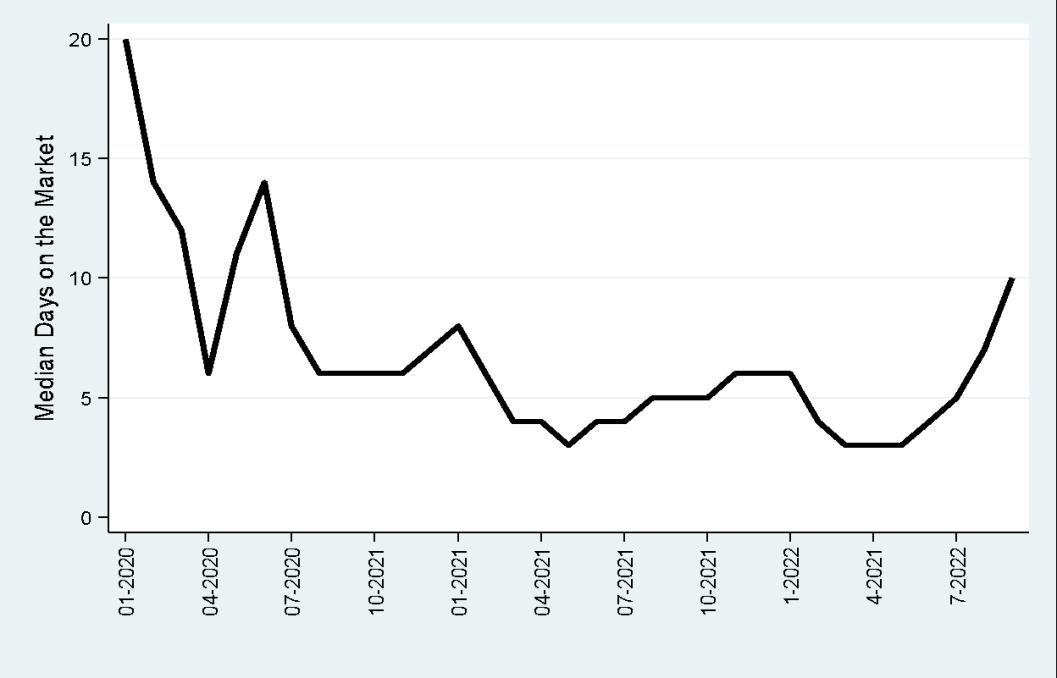
Next, we also try to gain more insights into the supply side of this market. We again first compare the listings and sales in Figure III.13. While this market is also pretty tight, it is not nearly as bad as the single-family market. For most months, the number of listings was higher than the number of sales. We then continue to assess the tightness of this market by looking at the median days on the market (Figure III.14) and the percent of homes sold above listing prices (Figure III.15). Both figures are remarkably similar to that of the single-family market. In particular, the median days on the market also hit a low for three days in May 2021, and the percentage of homes sold above listing prices hit an astonishing 50% in June 2021. The trends of both numbers have begun to change since the second quarter of 2022, suggesting a softening in the other owneroccupied market as well.
The State of Housing in Charlotte Report 2022
Figure III.12 Prices of Other Owner-Occupied Houses January 2020-September 2022
Figure III.13 Listings and Sales of other Owner-Occupied Houses January 2020-September 2022
The State of Housing in Charlotte Report 2022
Figure III.14 Median Days on the Market of other Owner-Occupied Houses January 2020-September 2022
Figure III.15 Percent of Other Owner-Occupied Homes Sold Above Listing Prices January 2020-September 2022
The State of Housing in Charlotte Report 2022