
2 minute read
B. Population


B. Population
As illustrated in Figure II.1, the population of the Charlotte MSA has grown from 2,333,358 in 2014 to 2,701,046, although the rate of growth declined slightly in 2021. Figure II.2 shows the distribution of the sources of population growth from 2020 to 2021. As we noted in last year’s report, there are three sources for population growth. The first is the “natural increase” in population, or the number of live births in the region less the number of deaths of residents. The second source is international migration, including both documented and undocumented immigrants. Finally, the third source of population increase is domestic migration, defined as migration from any location within the United States.
Domestic migration is the largest source of population growth in 2021, accounting for 76.4% of the population growth. Natural increase accounts for 15.1%, and international migration accounts for 8.5%. The COVID-19 pandemic has dramatically changed the sources of population growth in the Charlotte MSA. From 2018 to 2019, domestic migration only accounted for 61.7% of the population growth, while international migration accounted for 14.2% and natural increase accounted for 24.1%, as shown in Figure II.4. The Charlotte MSA has become one of the favorite places for domestic migration during and after the COVID-19 pandemic.
The total population view gives a broad sense of what is happening in the housing market. However, the rate of household formation is at least equally important. If the size of households is, on average, changing, the region might need to adjust its housing stock at a rate greater or less than the population growth. Figure II.5 shows the average household size in the Charlotte region over time. From 2014 to 2019, the average household size has been steady at approximately 2.66 people per household. However, since then the average household size has dramatically decreased to 2.54 people per household.
The State of Housing in Charlotte Report 2022
Figure II.3 Charlotte MSA Source of Population Growth 2019 to 2020
Figure II.4 Charlotte MSA Source of Population Growth 2018 to 2019

The State of Housing in Charlotte Report 2022
Figure II.5 Charlotte MSA Household Size 2014-2021
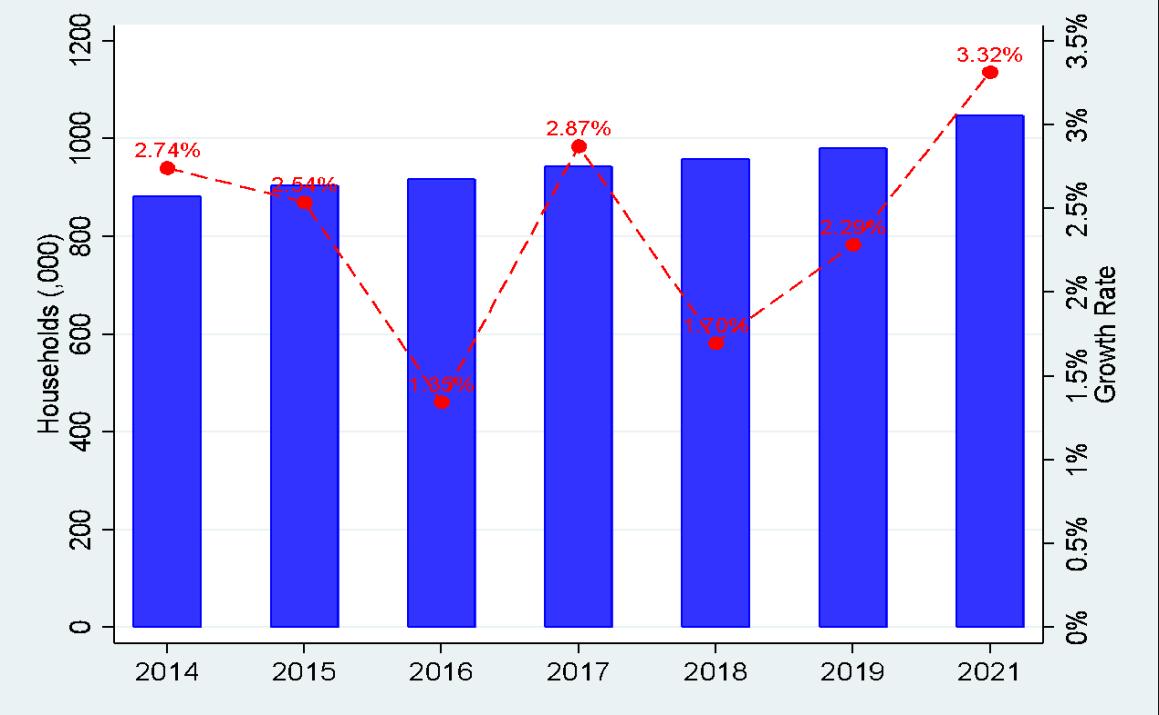
Figure II.6 Charlotte MSA Number of Households 2014-2021

The State of Housing in Charlotte Report 2022


