4 minute read
C. The Single-Family Rental Markets


C. The Single-Family Rental Markets
Next, we turn to the single-family rental markets. Because many of the single-family rental properties are owned and managed by individual investors, it is very difficult to get comprehensive data on the single-family rental markets. In this part of the analysis, we again rely on the MLS data provided by the Canopy Realtor© Association. Some individual real estate investors use real estate agents to list their rental properties, and these listings are covered by the MLS. We want to emphasize that it is very difficult to assess what percentage of single-family rental properties are listed on the MLS. But nonetheless, we can still gain some insights into the general trends of the market by just looking at the MLS data.
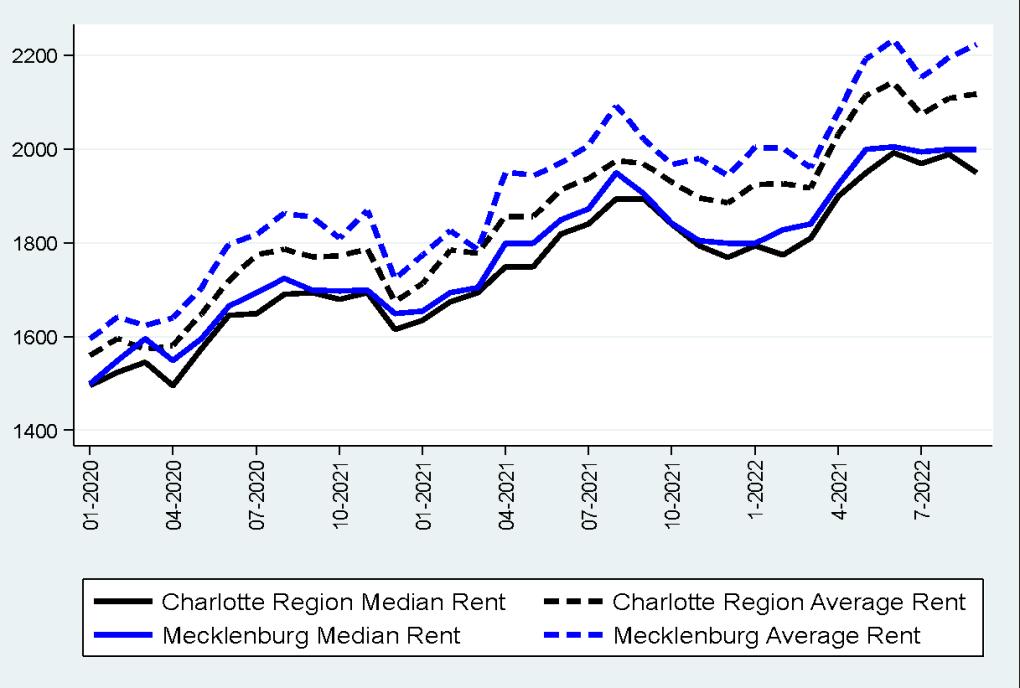
We first present the median and average single-family house rents during the COVID-19 pandemic in Figure IV.11. Before the pandemic, in January 2020, the median rent in the region was slightly below $1,500 per month. By September 2022, however, the median monthly rent dramatically increased to almost $1,950, a 30.4% increase. These results again show that the demand for rental housing was also extremely strong during the pandemic.
Figure IV.11 Median and Average Single-Family House Rent January 2020-September 2022
The State of Housing in Charlotte Report 2022
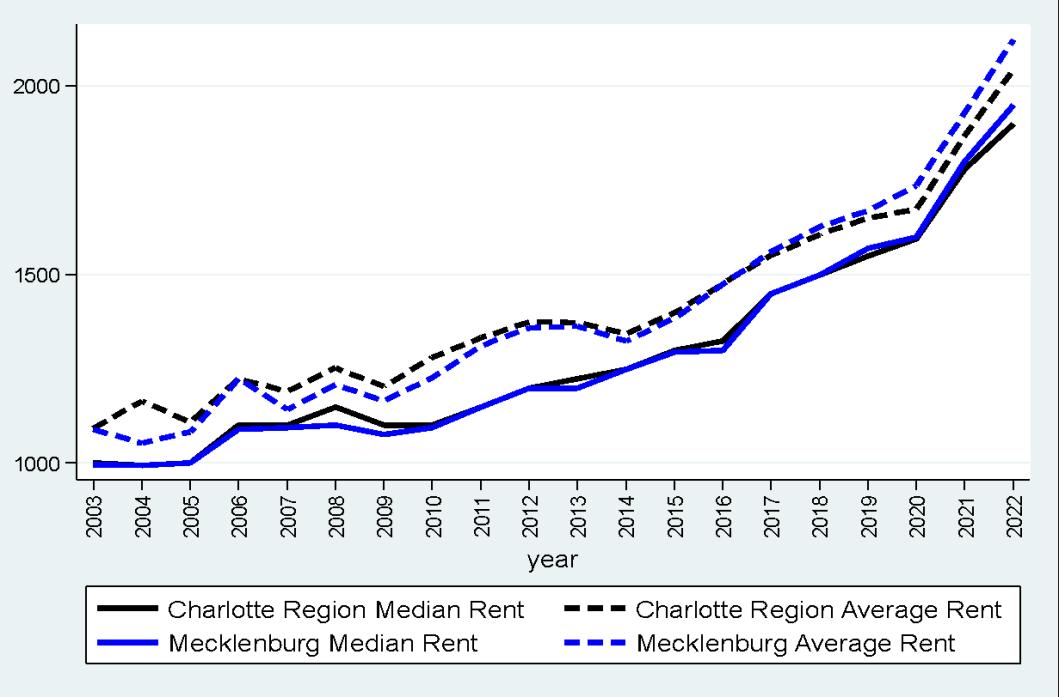
We then again take a long-term perspective and look at single-family rents from 2003 to 2021. The Canopy MLS data started to cover rental listings in 2003, which is why we start the analysis in 2003 as well. We plot the annual median and average rents in Figure III.12. From 2003 to 2021, the median single-family rent went from $1,000 per month to $1,787 per month, a 79% increase. The average annual growth rate is 3.26%, much lower than the 5-6% single-family price growth rate over the same period. From this, we can see that the COVID-19 pandemic dramatically sped up the rental growth rate in this region.
Figure IV.12 Median and Average Single-Family House Rent 2003-2021
The State of Housing in Charlotte Report 2022
Figure IV.13 Dynamics of the Single-Family Rent Distribution 2003-2021
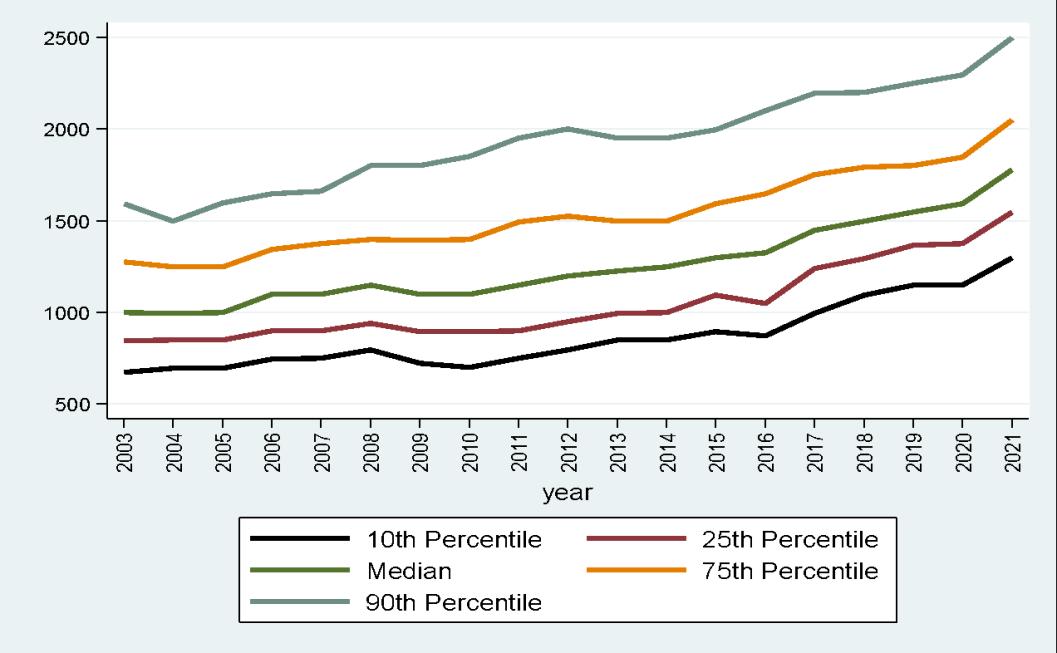
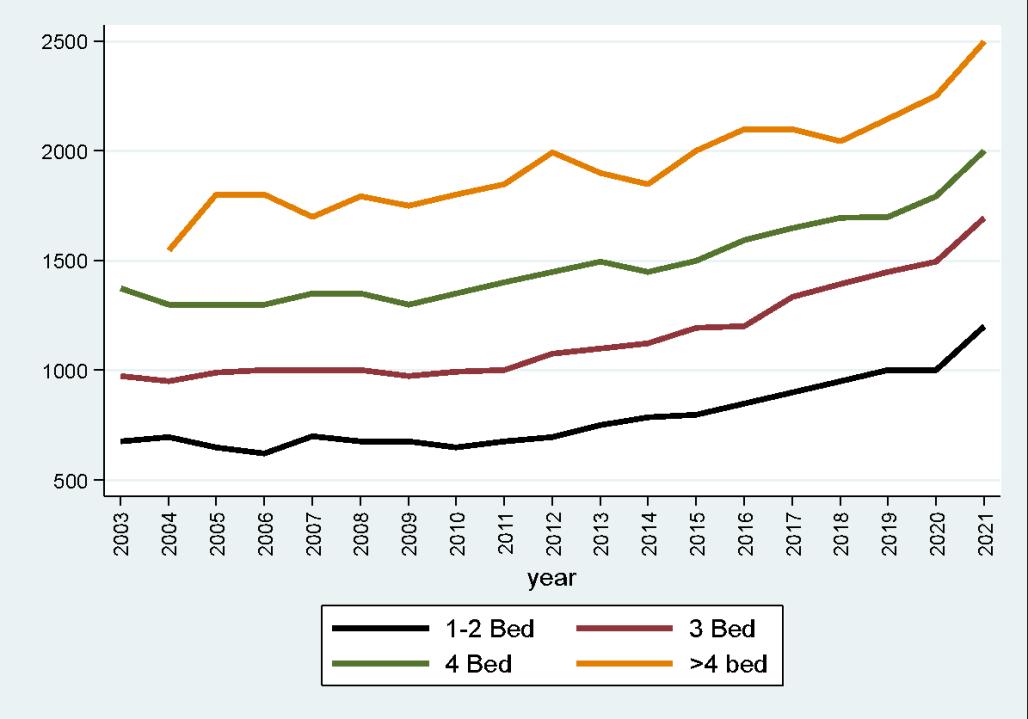
We then also try to understand whether there is also a shift in the distribution by looking at the 10th, 25th, 75th and 90th percentiles of the monthly rents. Similar to single-family house prices, single-family rents at the lower end also increase at a faster rate than rents at the higher end. From 2011 to 2021, the annual growth rate is 5.65% for the 10th percentile, 5.59% for the 25th percentile, 3.21% for the 75% percentile and 2.52% for the 90th percentile. While the overall growth rates on single-family rentals with different numbers of bedrooms are similar, the growth rate for three- and four-bedroom rentals have much higher growth rate from 2019-21, that is, during the COVID-19 pandemic.
Figure IV.14 Single-Family House Rents by Size
The State of Housing in Charlotte Report 2022
2003-2021
Figure IV.15 Single-Family Rental Listings and Closings January 2020-September 2022
The State of Housing in Charlotte Report 2022
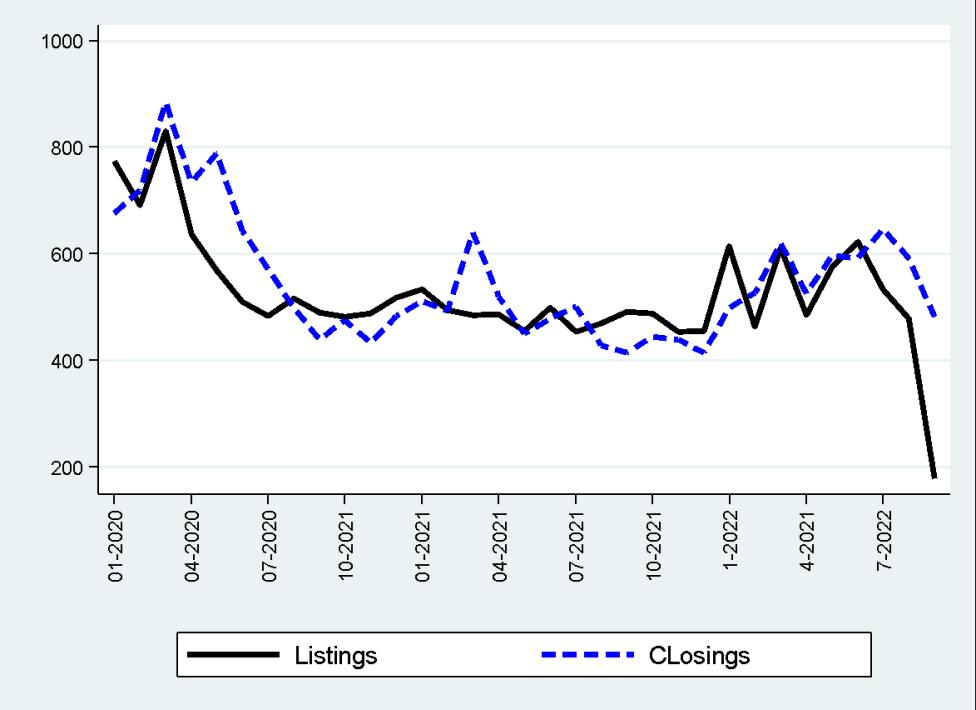
The results above clearly suggest that the demand for single-family rental housing is getting stronger. We next turn to the supply side by first looking at the number of listings and closings. We first plot the monthly listings and closings during the COVID-19 pandemic from January 2020 to September 2022 in Figure IV.15. Similar to single-family listings and sales, in most months during the pandemic, the number of closings is higher than the number of listings, suggesting that the supply of single-family rentals is also very tight. We then also take a longer-term perspective and plot the listings and closings from 2003 to 2021 in Figure IV.16.
We then also look at the median days on the market for single-family rentals during the pandemic, as shown in Figure IV.17. Before the pandemic in January 2020, the median days on the market was 35 days. However, in June and July of 2021, the median days on the market dropped to seven days, suggesting that the single-family rental market also became extremely tight during the pandemic. But the number of days on the market has since increased to about 15 days. We then also put this into a long-term perspective, as shown in Figure IV.18. Again, the market has never been so tight until during the COVID-19 pandemic.
Figure IV.16 Single-Family Rental Listings and Closings 2003-2021

The State of Housing in Charlotte Report 2022
Figure IV.17 Median Days on the Market for Single-Family Rentals January 2020-September 2022
Figure IV.18 Median Days on the Market for Single-Family Rentals 2003-2021


The State of Housing in Charlotte Report 2022


