Wind Woven | Ecological restoration of Breda’s urban fabric through wind
Wind woven
Ecological restoration of Breda’s urban fabric through wind | Rachel Borovska
Academie van Bouwkunst Amsterdam 23 | 24 | Rachel Borovska
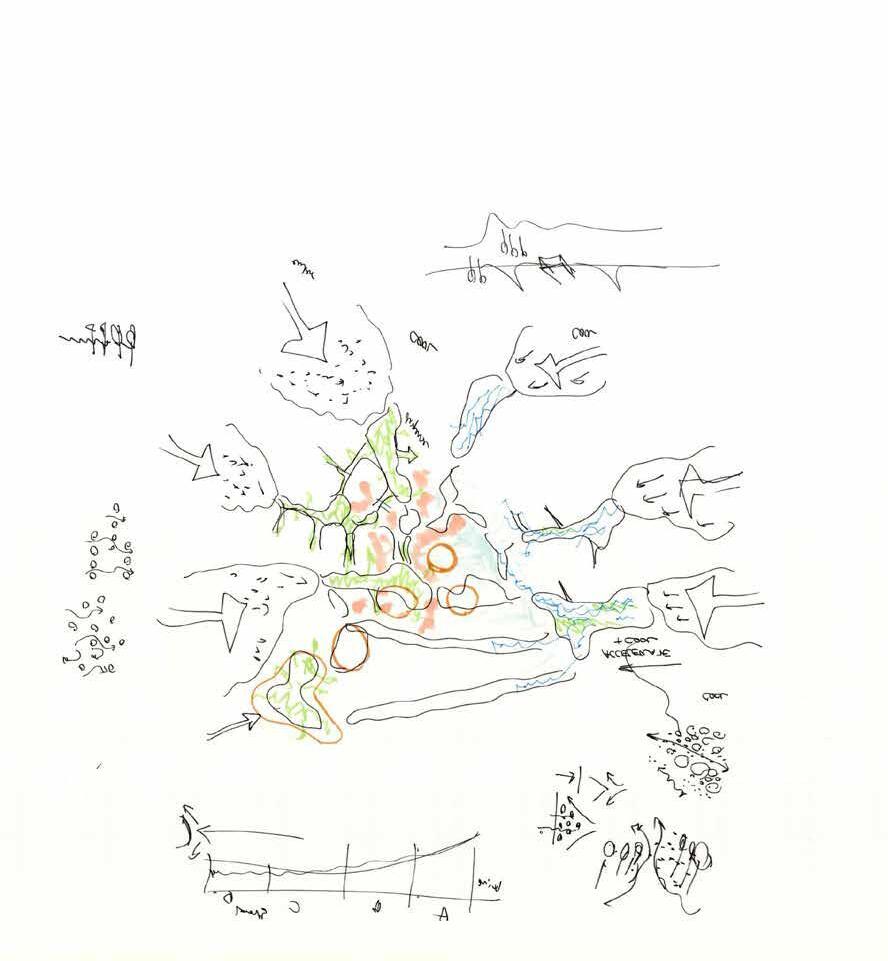
Being in the landscape means being immersed in the “weather-world”. 1 Just as architecture actively envelopes space against meterorological elements, so landscape architecture actively engages and sculpts with them.
Academie van Bouwkunst Amsterdam 23 | 24 | Rachel Borovska
Introduction
Urban heat islands pose a significant challenge in today’s cities, and the need for cooling and preserving biodiversity are pressing issues. While efforts to combat urban heat islands often revolve around interventions like de-paving, greenifying and reclaiming space for green-blue networks, the impact of ventilation for cooling is frequently overlooked in design. Stemming from a deep fascination with the thermodynamic performance of wind this project aims to rectify this oversight by focusing on understanding wind behavior and patterns in our everyday environment, using weather, climate, and atmosphere as design mediums.
City outdoor spaces are essential as they attract pedestrian traffic, host outdoor activities, provide habitats and shelters, and contribute to the liveliness and quality of urban life. One of the key factors influencing the quality of outdoor spaces is the urban microclimate.
URBAN ATMOSPHERE
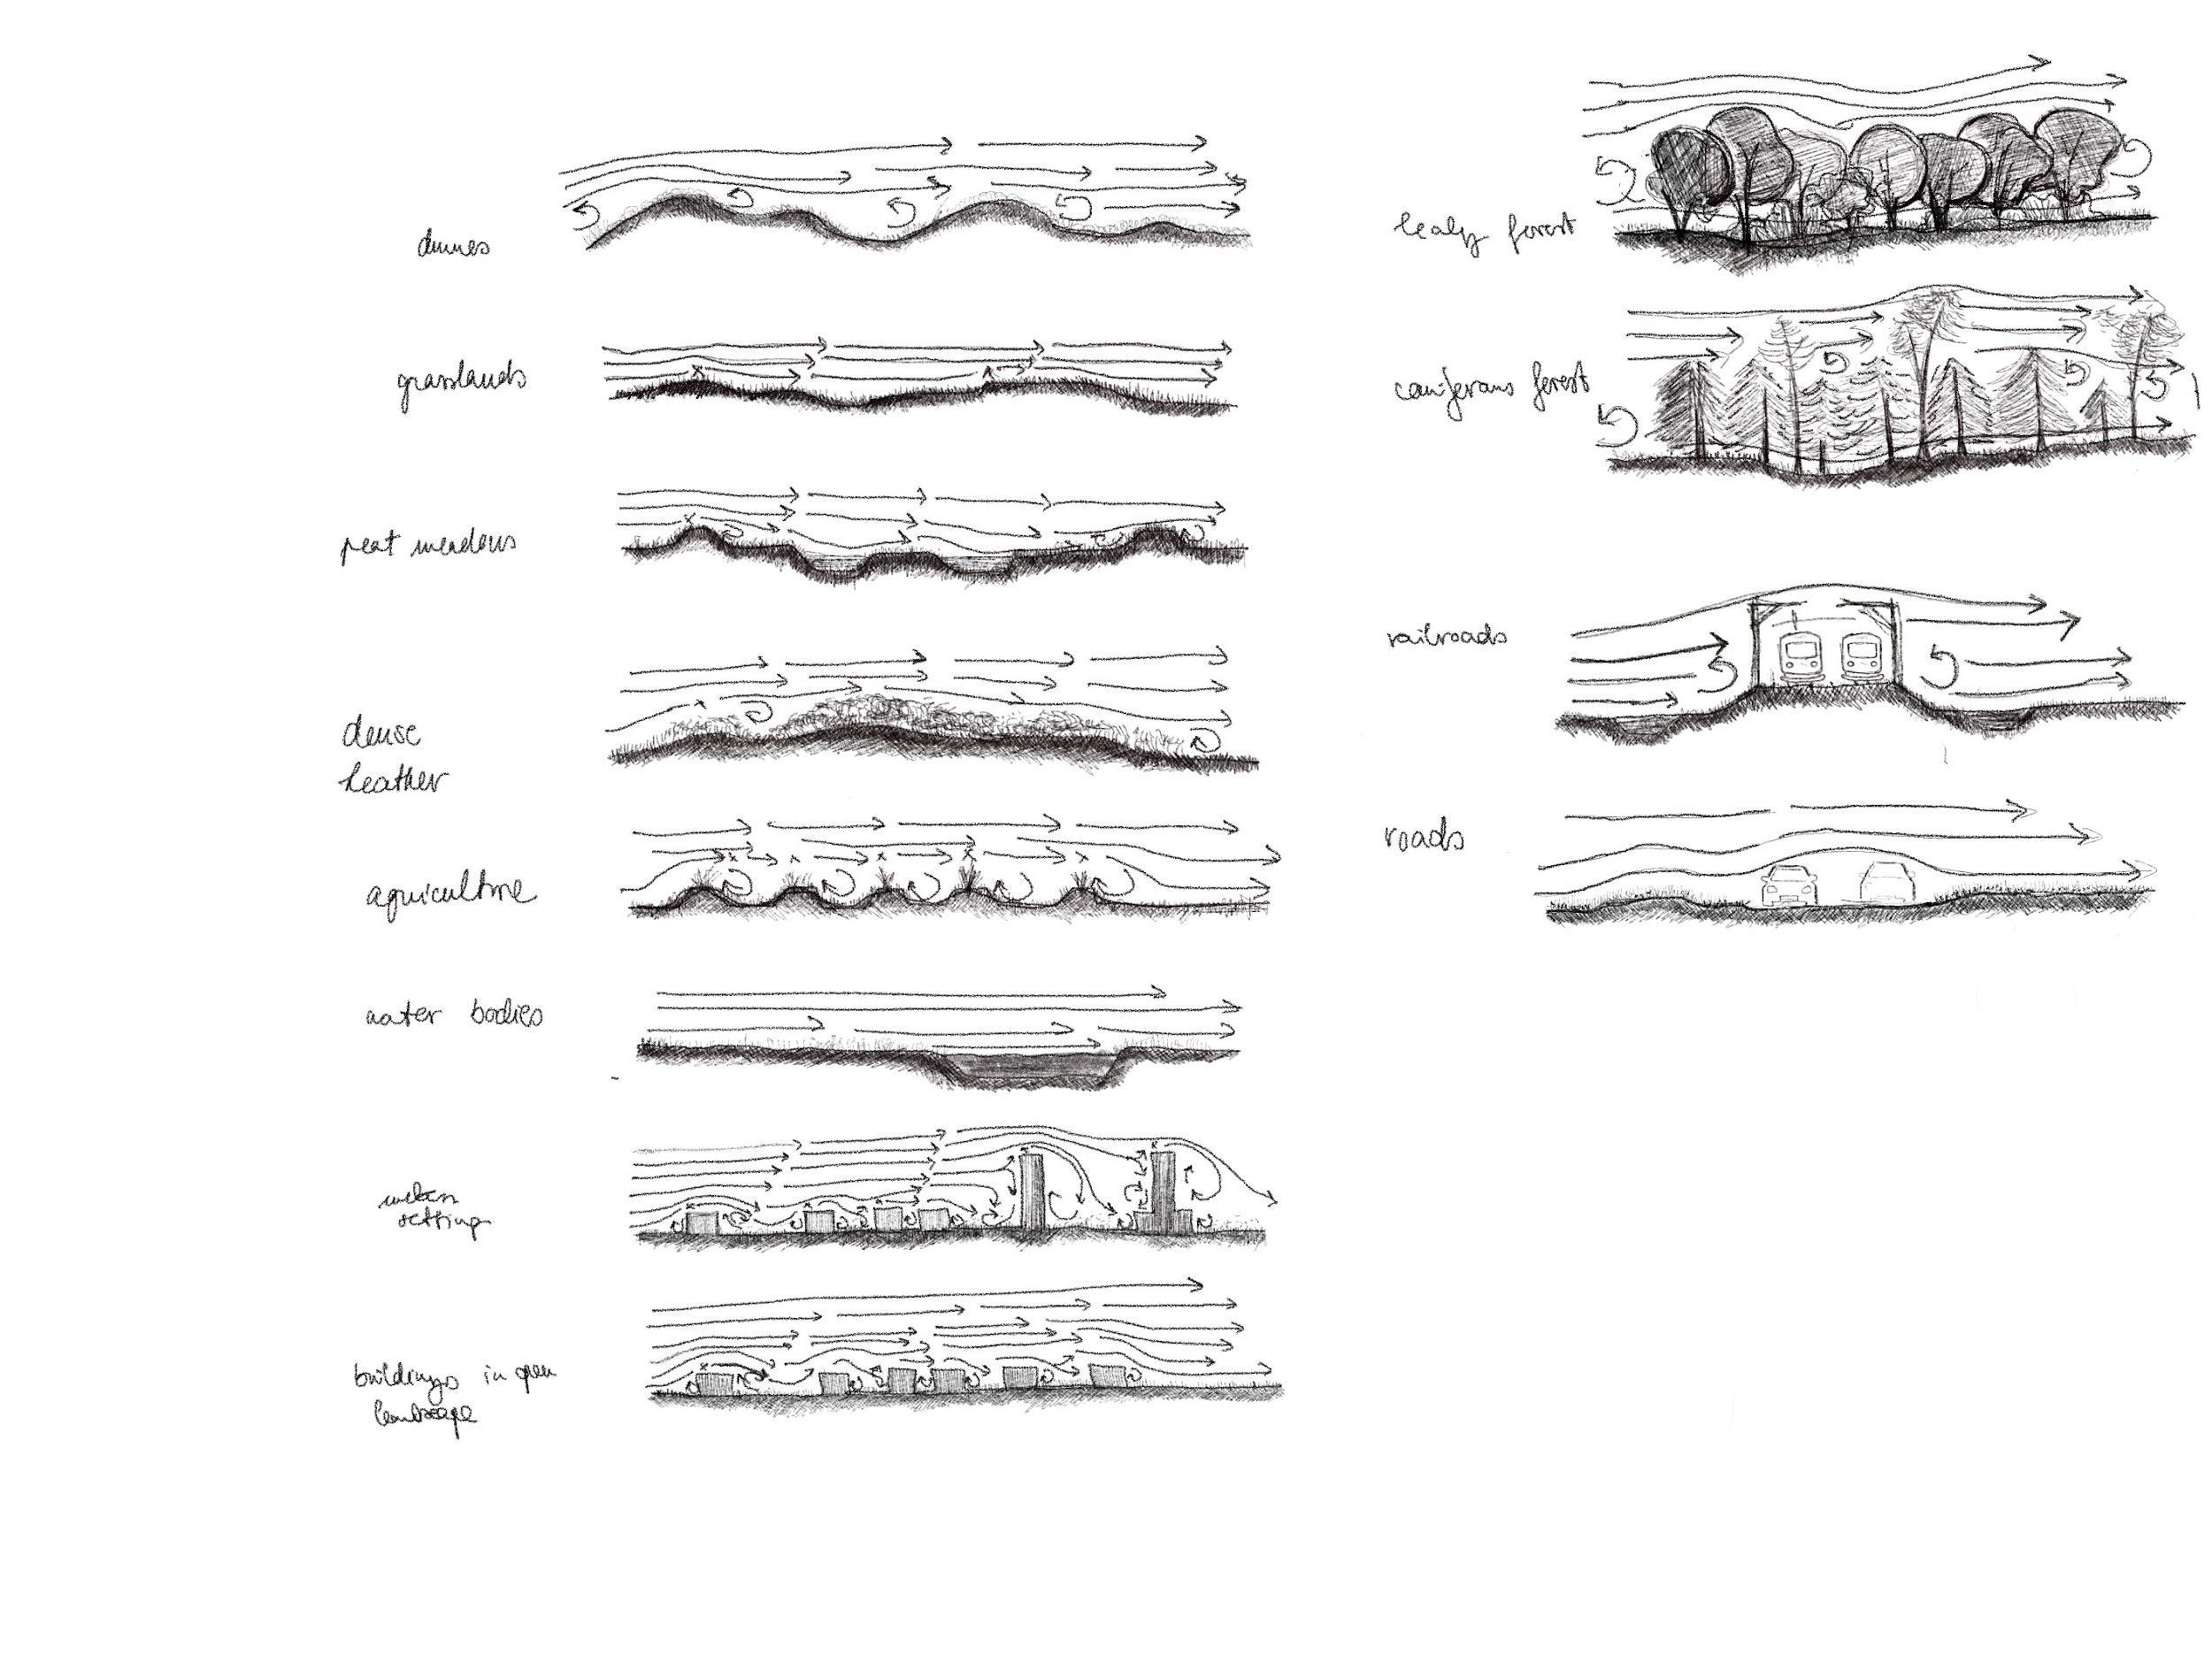
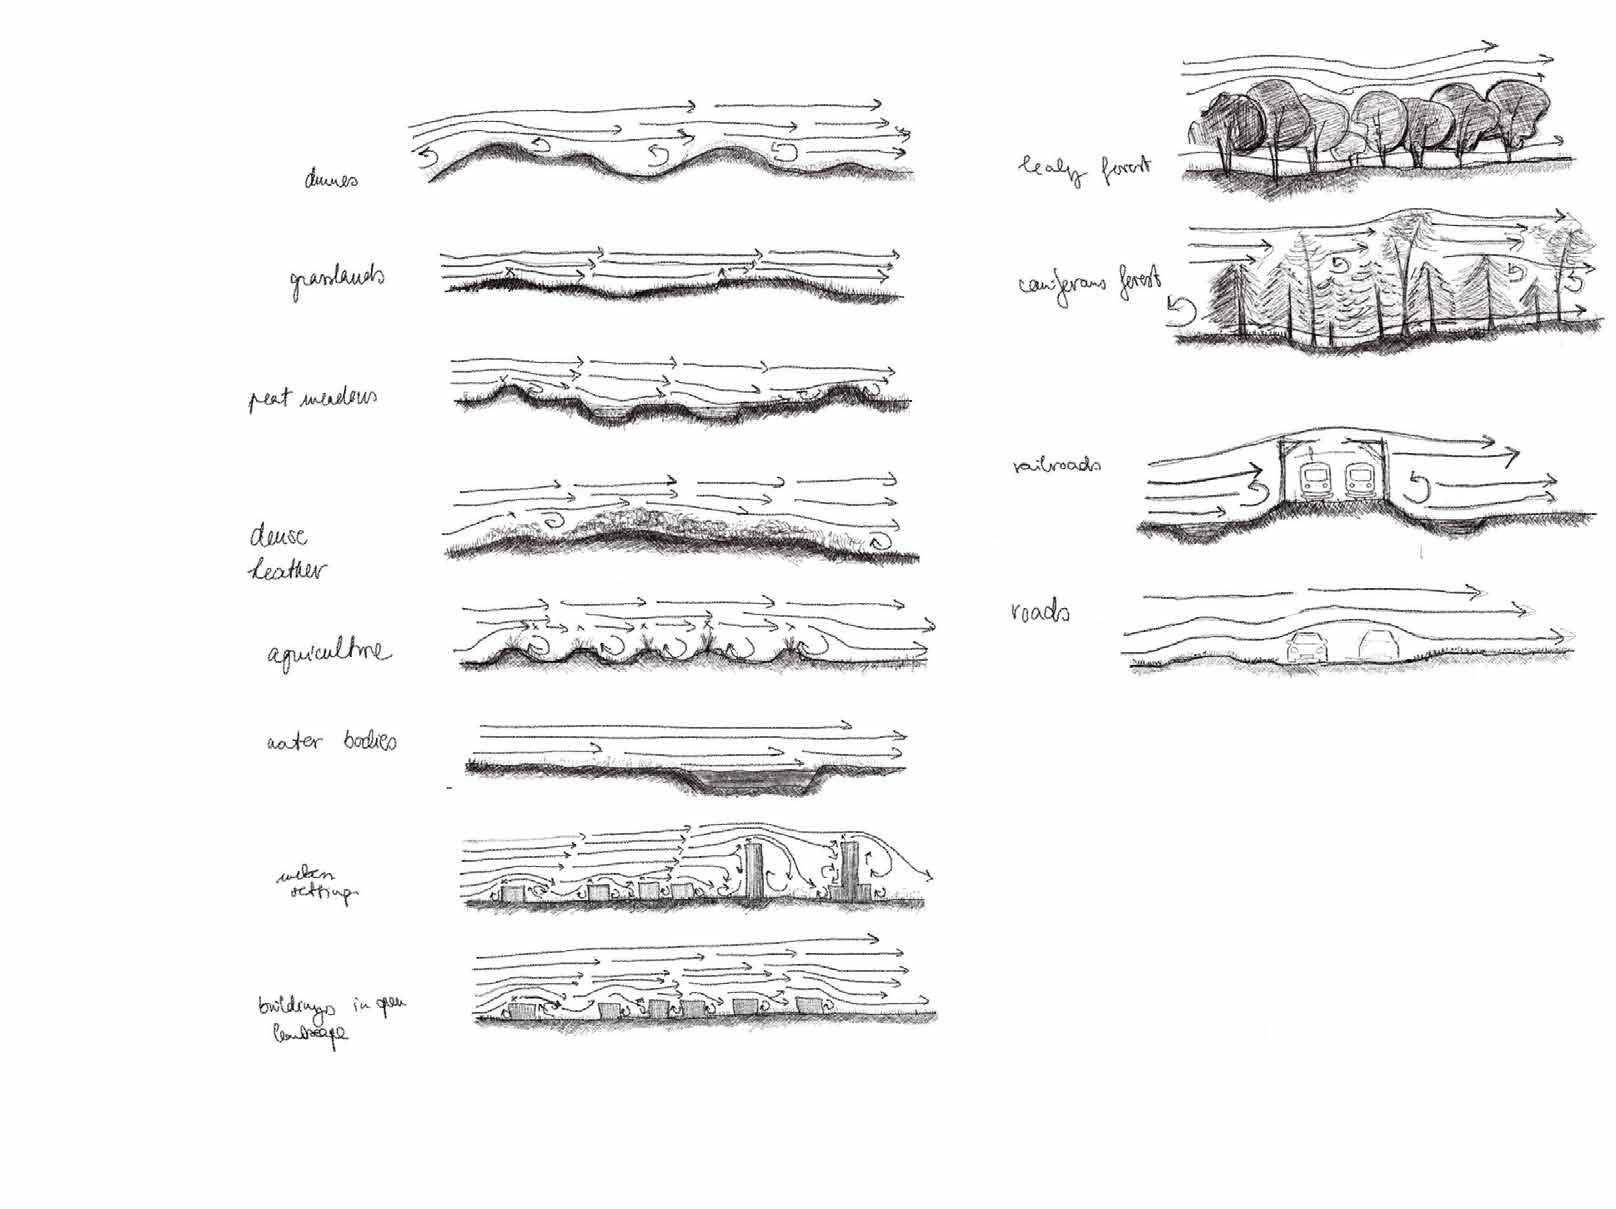
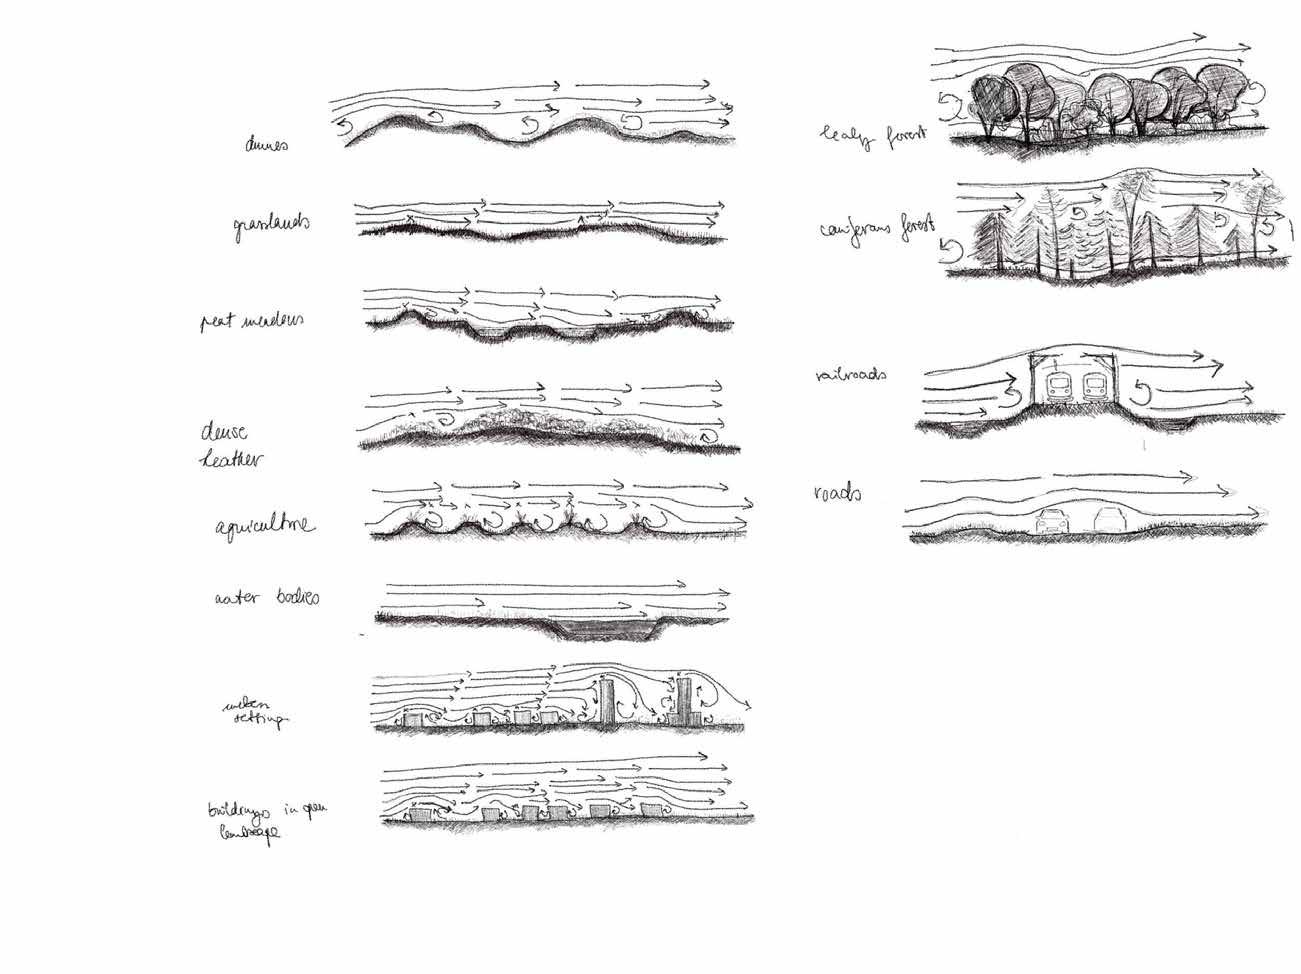
Urban ventilation encompasses the airflow through a city, which is affected by factors such as building heights, street layouts, and topography. Insufficient urban ventilation can lead to elevated levels of air pollutants, exacerbate the urban heat island effect, and have a detrimental impact on the health and overall comfort of the population. It can also cause damage to city infrastructure and result in a decrease in species diversity and the loss of precious habitats in terms of ecology.
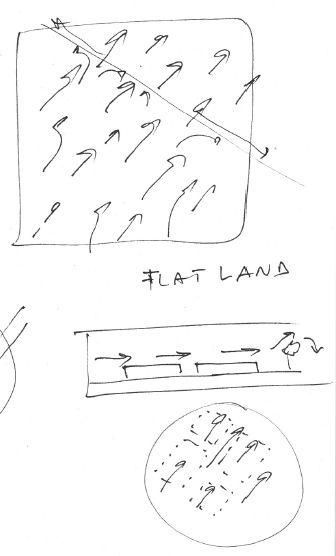
Urban areas and their outdoor spaces have diverse structures and specific morphological features. They are situated in landscapes with varying levels of humidity and ecology, and are surrounded by larger landscape structures that influence the local climate of each city. The unique morphology of urban environments influences their climates. For instance, city wind patterns can pose challenges but also offer opportunities. They can help ventilate and cool urban areas or swiftly move through the city. All elements, including landscapes and building volumes, and their arrangements, contribute to creating distinct wind flow patterns and microclimates.2
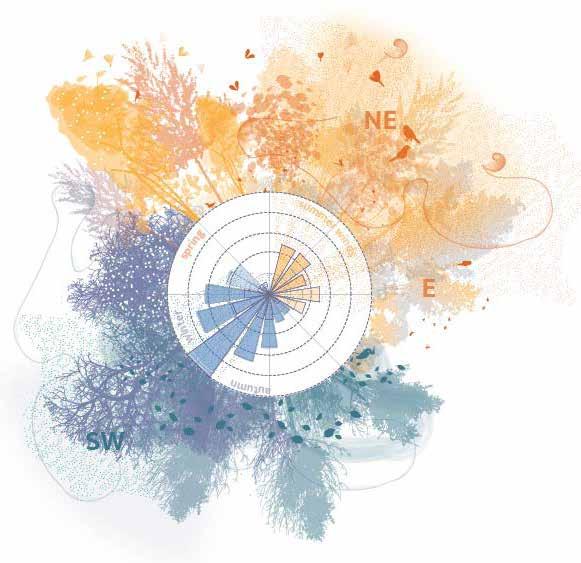
Through delving into multiple scales, this research-by-design project is dedicated to uncovering the conditions necessary to enhance the cooling capacity of wind, starting from two primary wind directions. In the Netherlands, the southwesterly winds typically bring strong cold winds, peaking from autumn to spring. Conversely, during summer, warm air from the east can exacerbate the urban heat effect if it’s unable to surpass urban obstacles such as closed streets, densely built or planted areas.3
TESTING GROUND
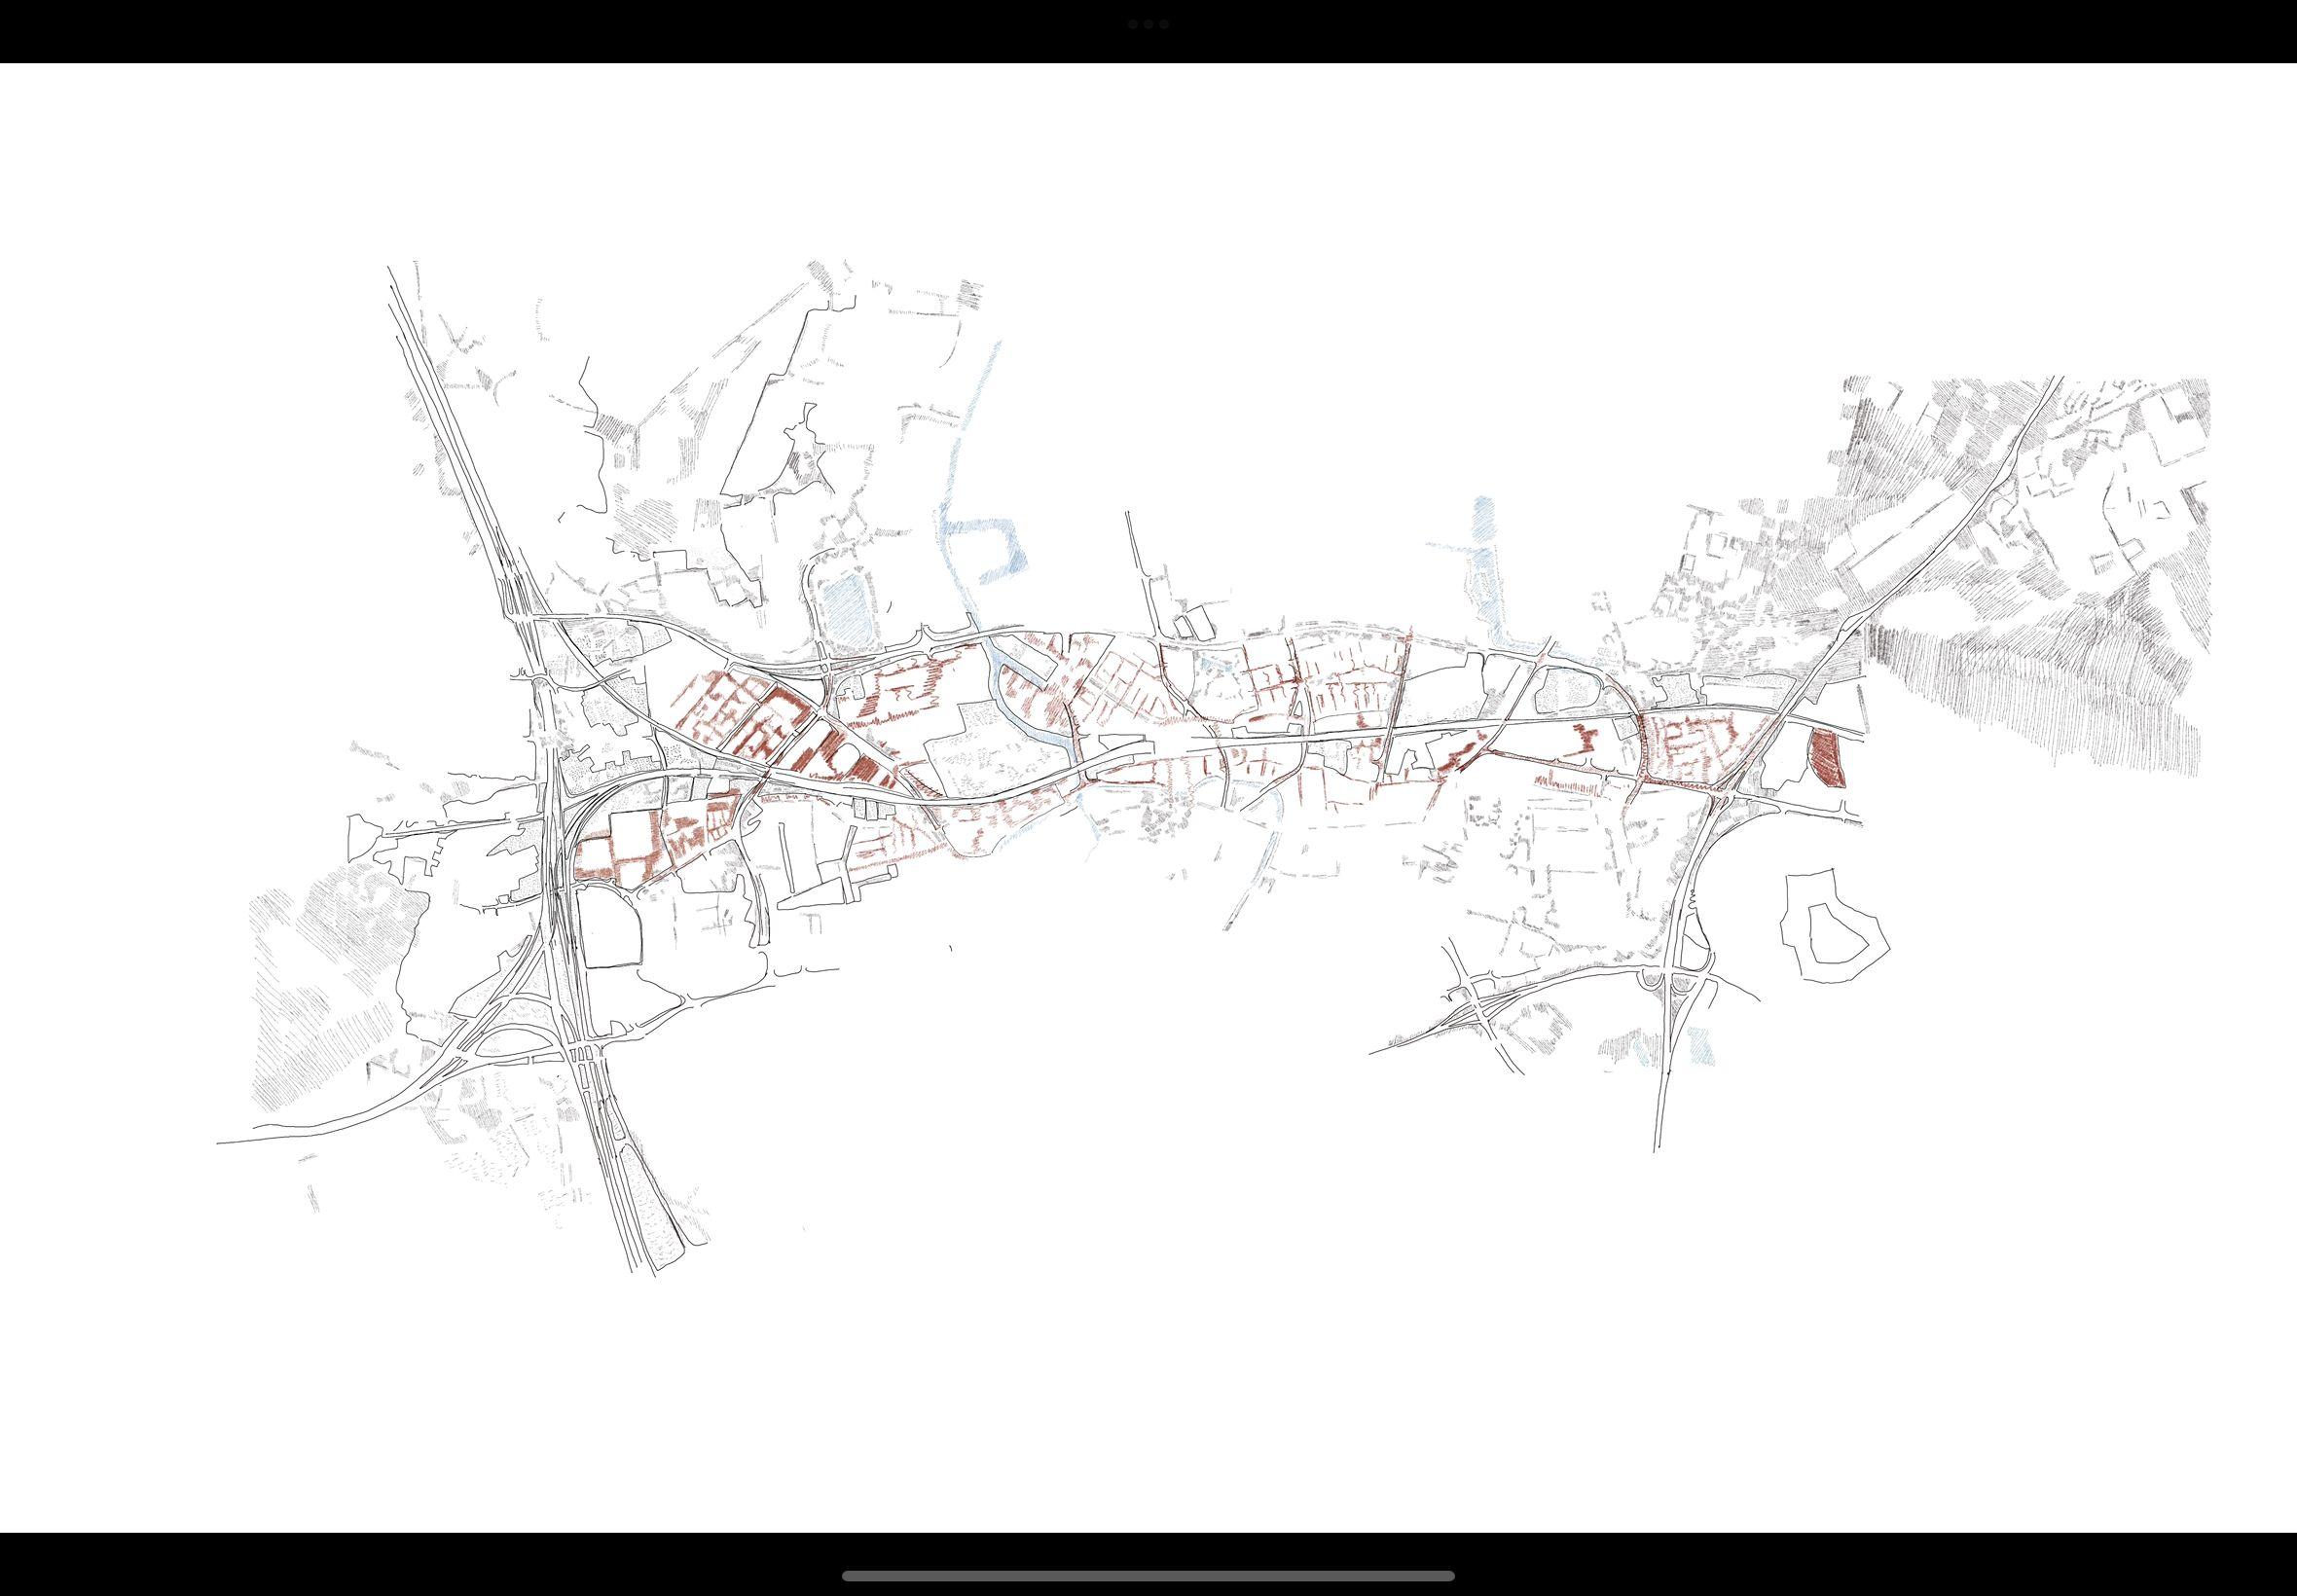
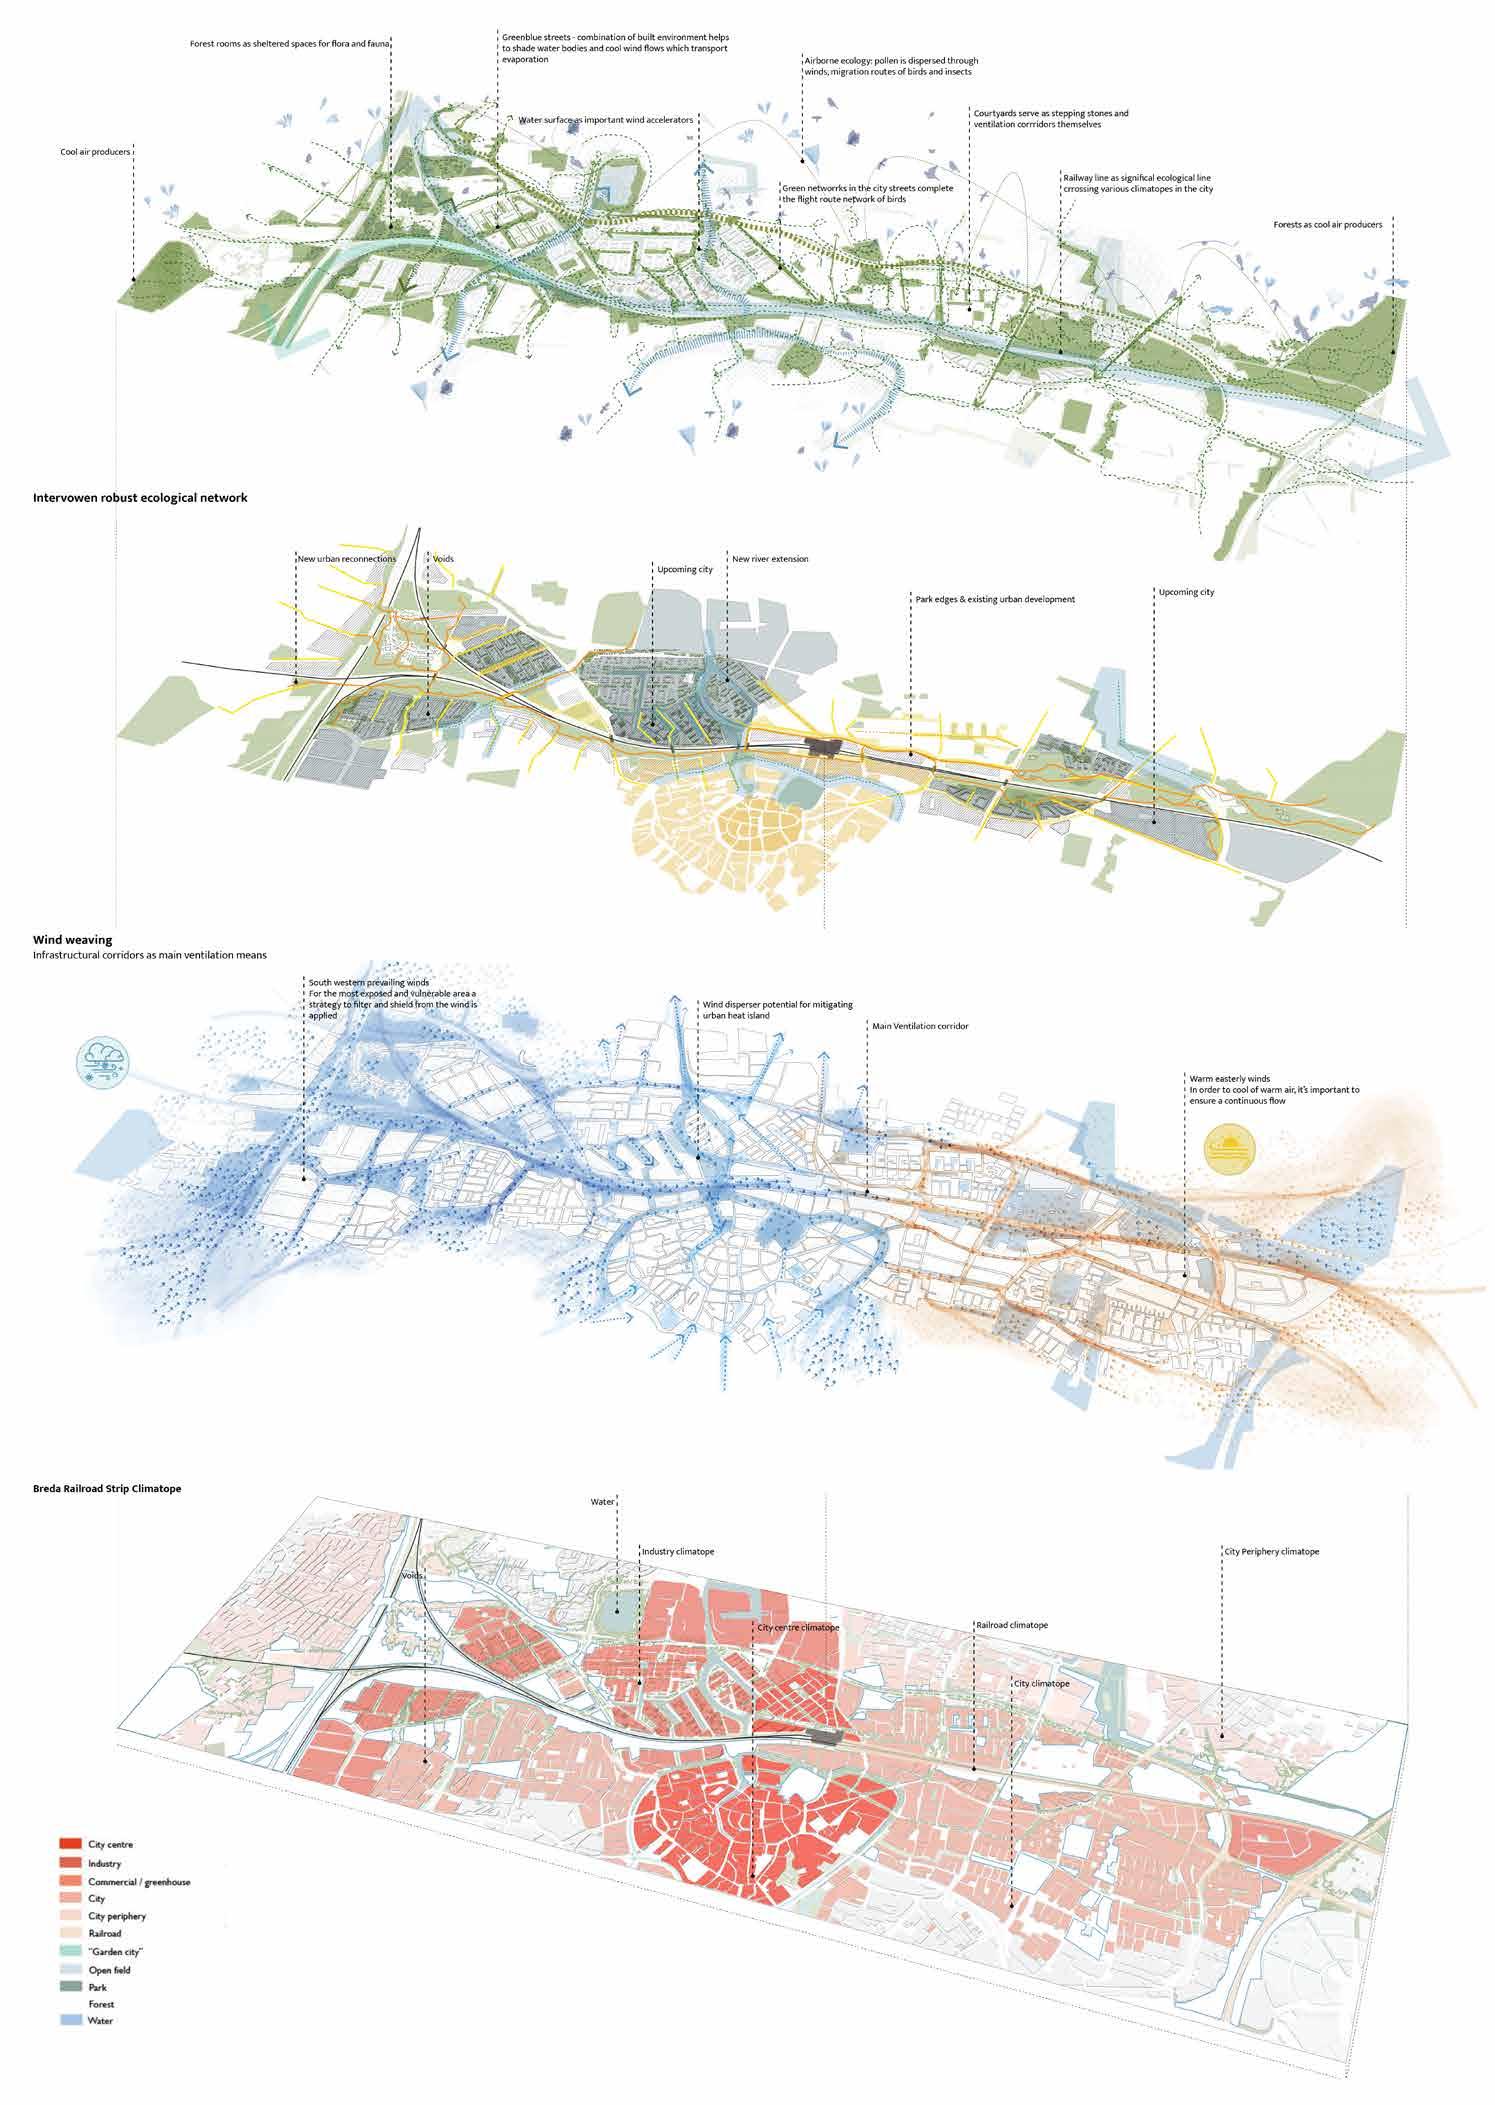
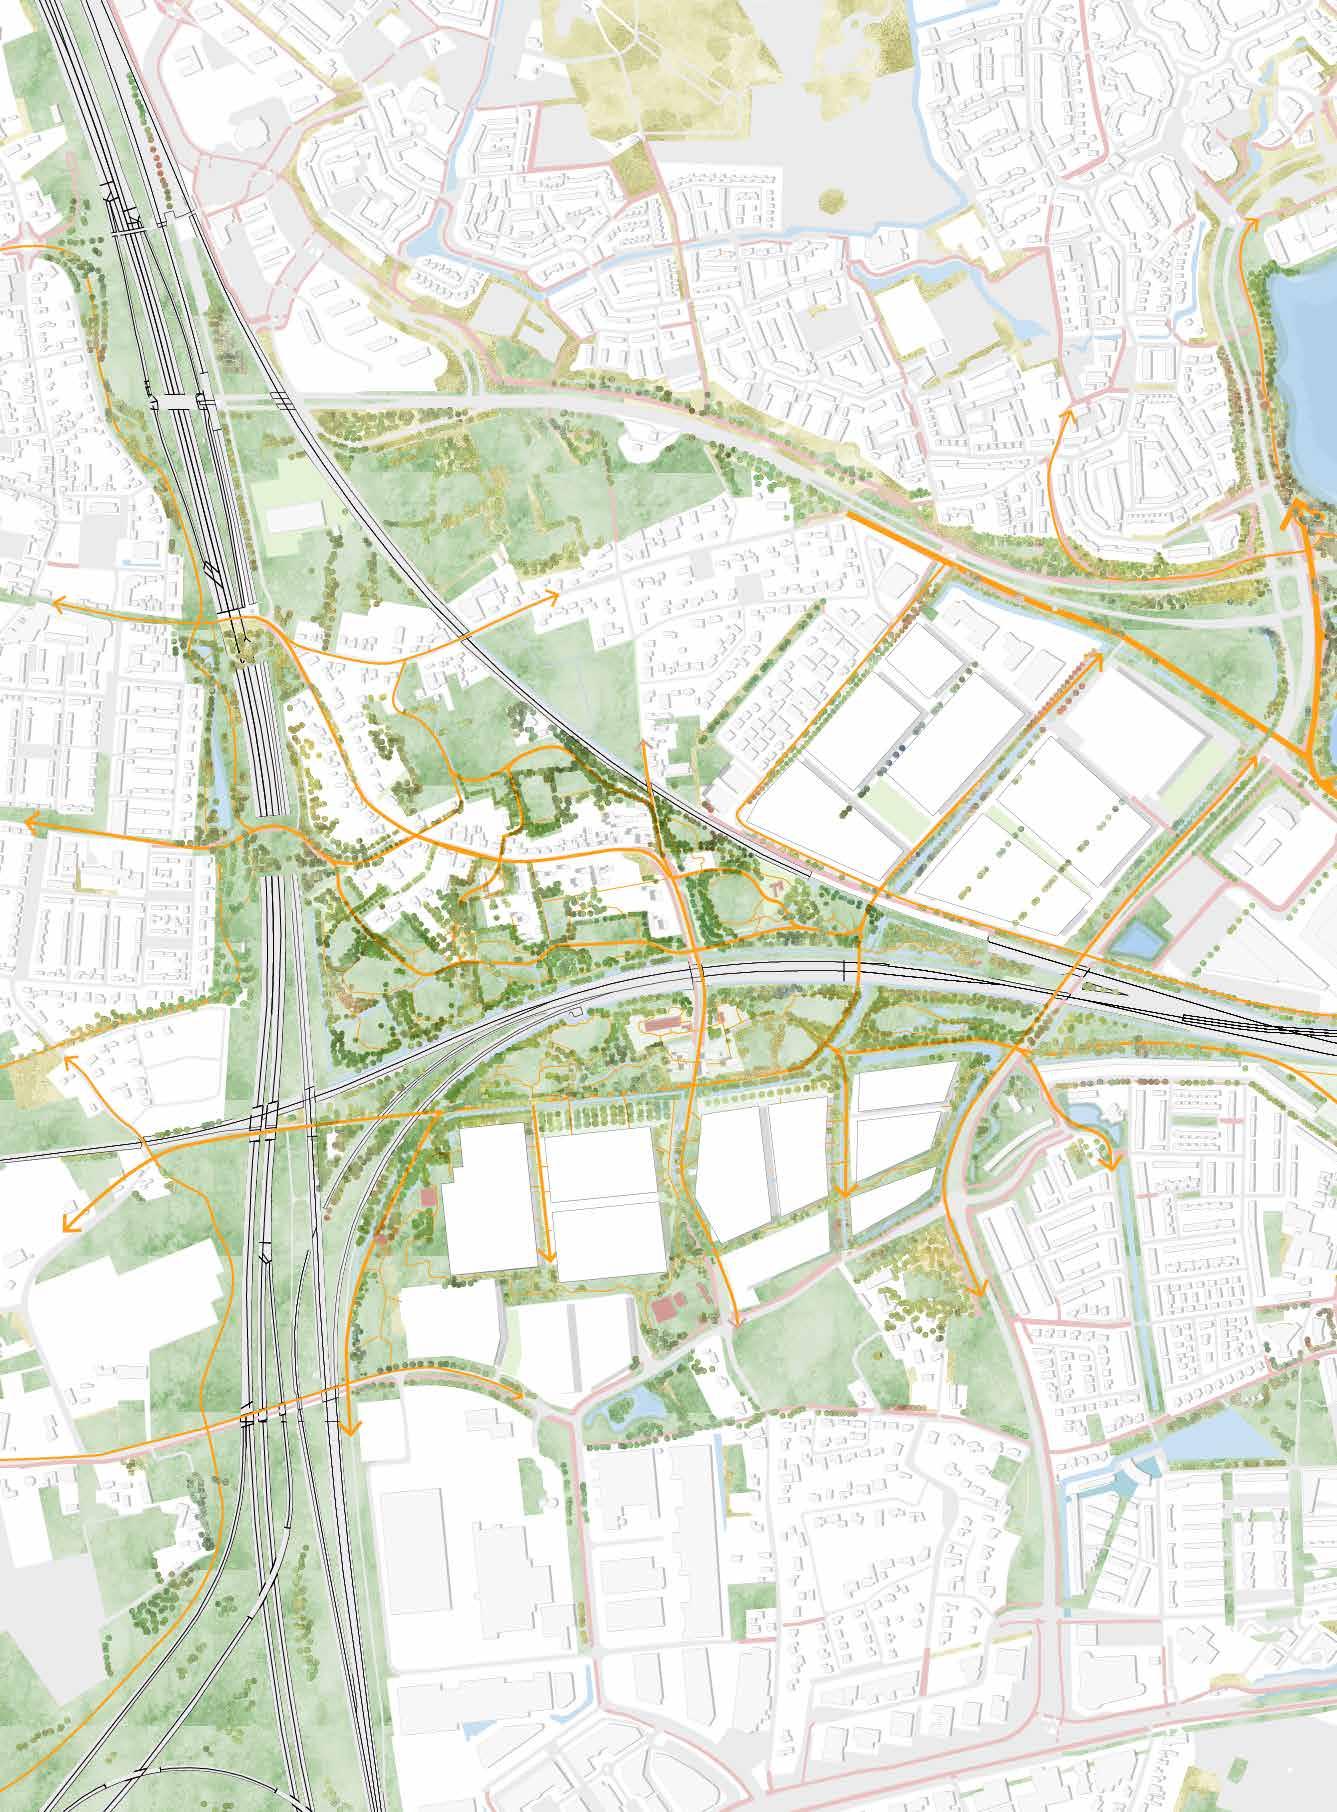
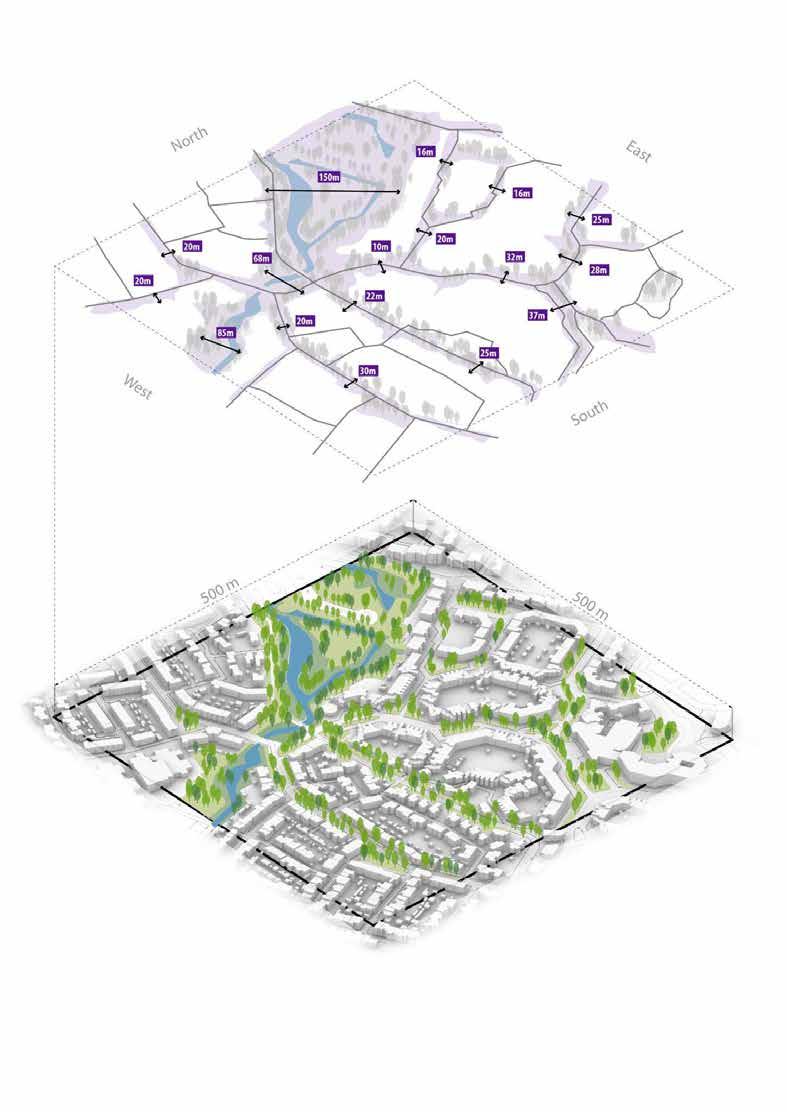
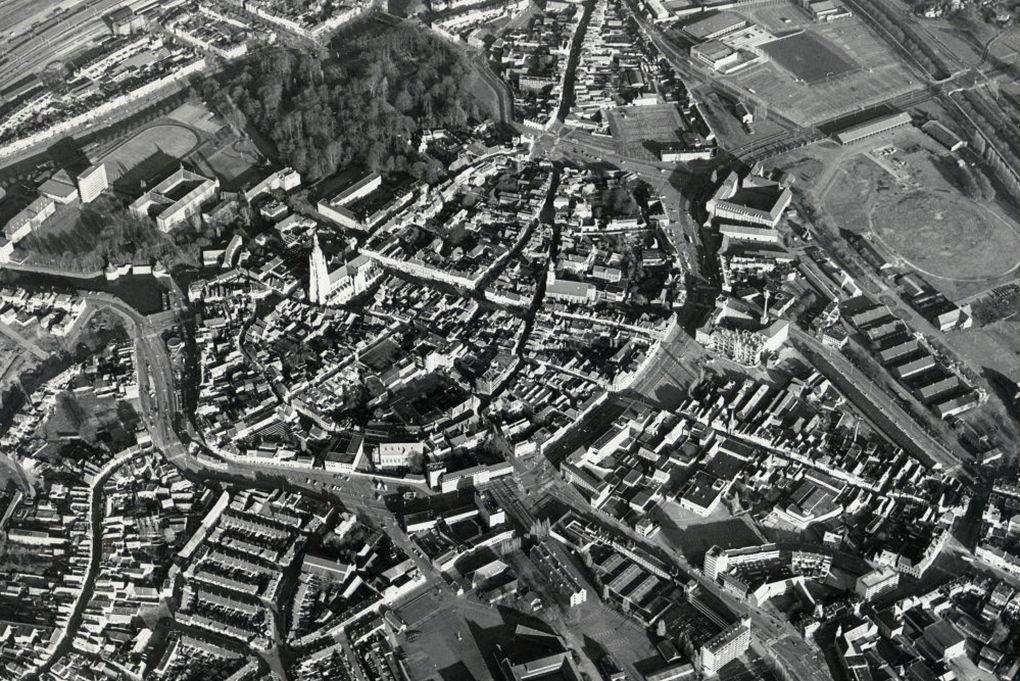
Wind patterns are explored as a design tool along the 8km long railway corridor site of Breda, stretching from east to west. Railway corridors play a crucial role in ventilating urban environments due to their expansive linear profiles and open surfaces, making them essential in shaping the local climate. They also serve as crucial ecological corridors providing extensive linear migration routes for various wildlife and generate airborne trails for seeds. Paired with the ventilating capacity of the railway, the areas surrounding this 8km stretch are transforming, providing an ideal testing ground for landscape architecture and urbanism disciplines to explore and implement various landscape interventions and cooling compositions.
Rather than treating these design areas as blank slates, they are seen as integral elements contributing to ventilation, (airborne) ecology and cooling principles. They are infused with wind as a medium, composing a green wedge that weaves through the existing context and structures, connecting neighborhoods through a biodiverse, ecological network. A park-like necklace woven by wind alongside the railway strip of Breda.
“Our environment is not a composite object comprising of closed, hermetic spaces, but a place that is very much exposed to the seasons, prevailing weather, climatic variations, and meteorological shifts.”4 JP Thibaud in Loenhart 2021 166
Academie van Bouwkunst Amsterdam 23 | 24 | Rachel Borovska
Academie van Bouwkunst Amsterdam 23 | 24 | Rachel Borovska
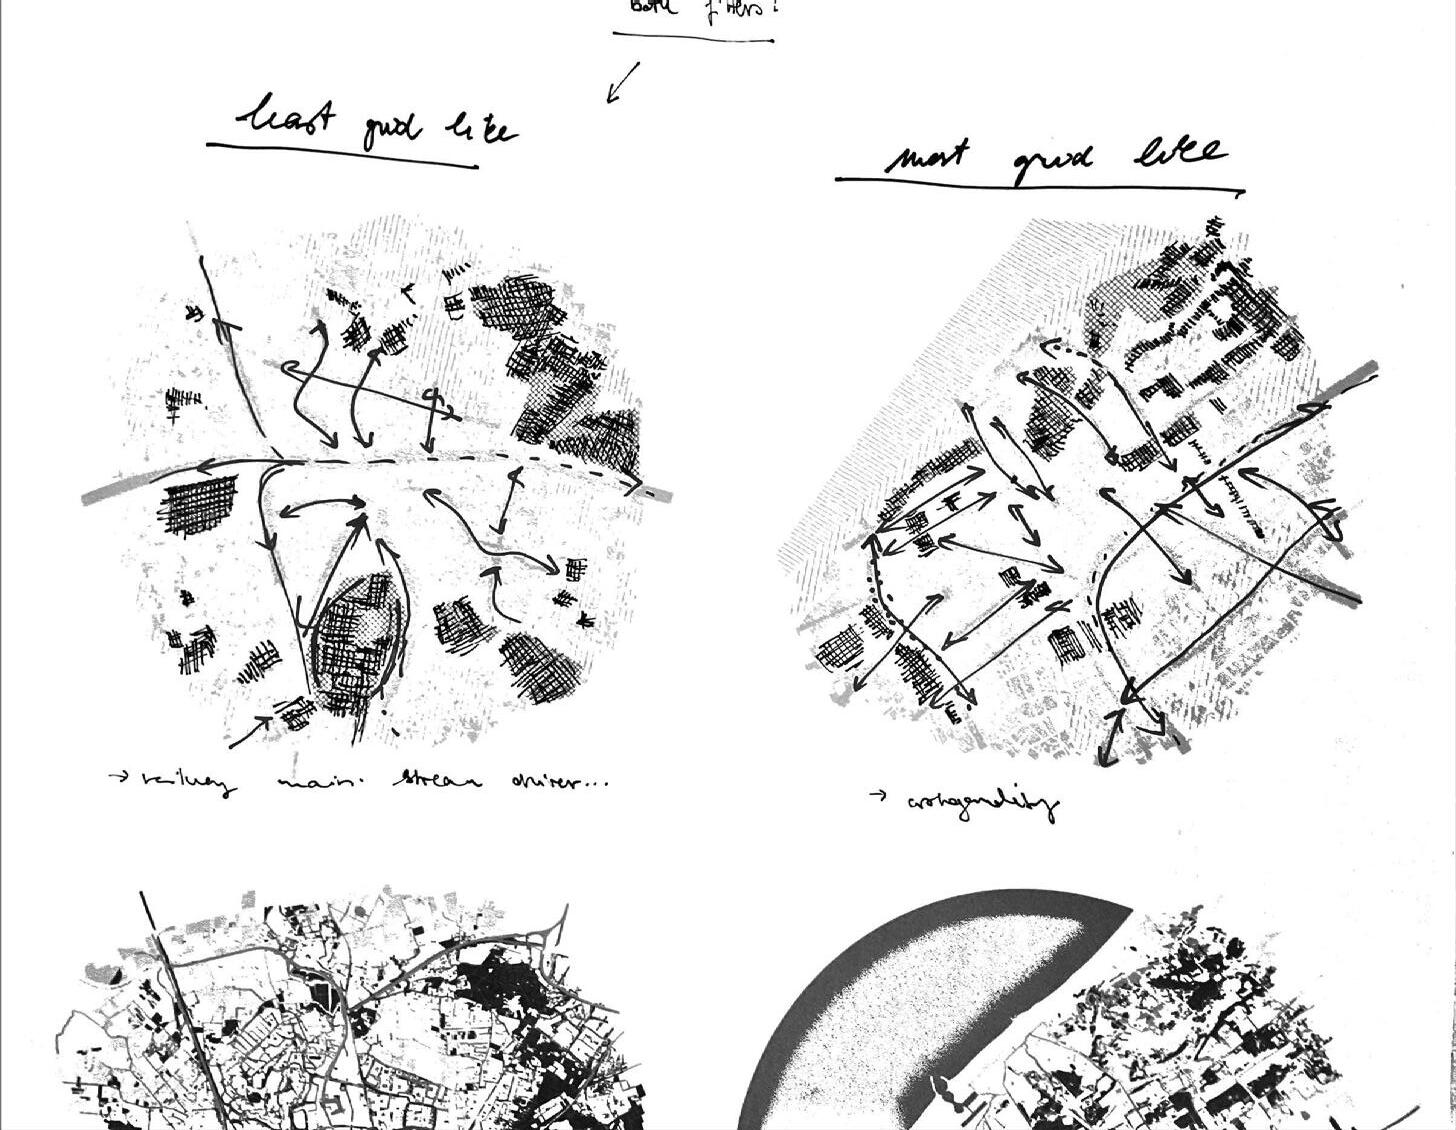
Analysis criteria to determine wind streams
Comparative analysis
“Macro scale” Geography
“Mesoscale”
Stream
Location
Orientation
Topography
Location
Orientation
Topography
“Micro scale”
Stream
Roughness
Roughness
Position of the city between landscape types
Soil types
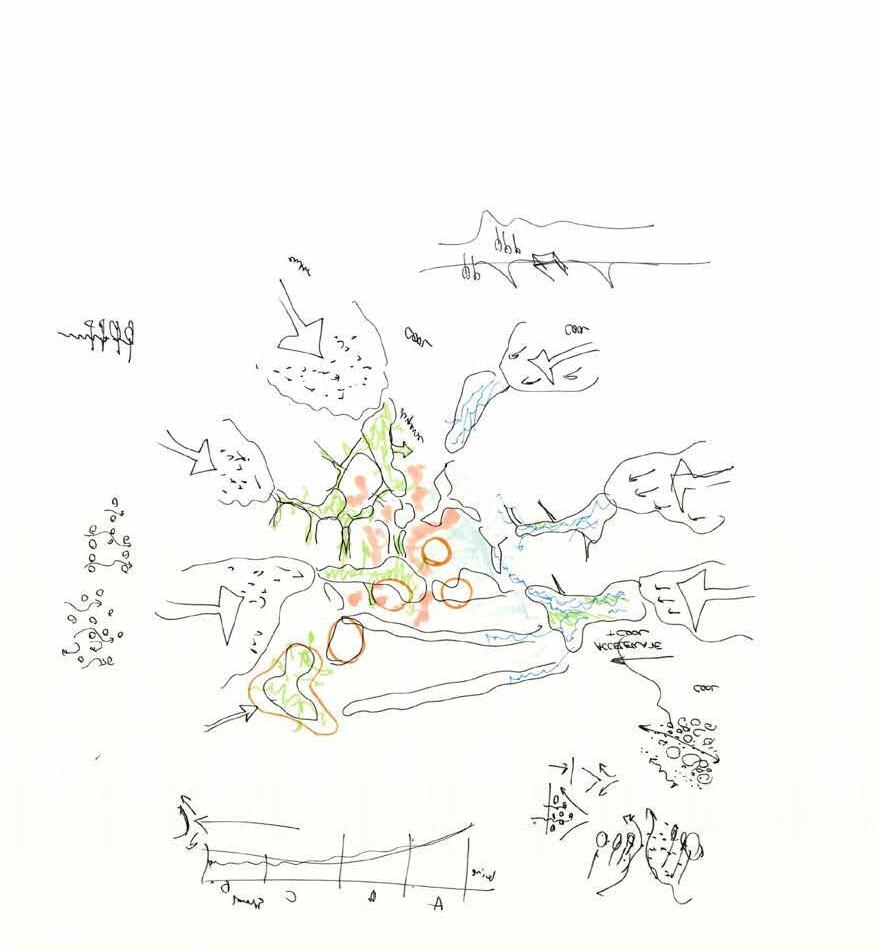
Wind flow patterns & Spatial and qualitative criteria
New city development
Obstacles
Voids
Areas under transformation
Open & Closed
Two season approach
Interconnectedness
Diversification of biotopes
Variety of densities
Continuity & Perforation
Habitats
Wind flow patterns & Spatial and qualitative criteria
Open & Closed
Location
Orientation
Topography
Roughness
Parallel Perpendicular Oblique Voids
Obstacles
Variety of densities
Continuity & Perforation
Habitat
Programme
Forests
Agriculture/ Grasslands
Wetlands
Meadows
Dunes
Brooks
Barriers
Entry points
Corridors
Accelerators
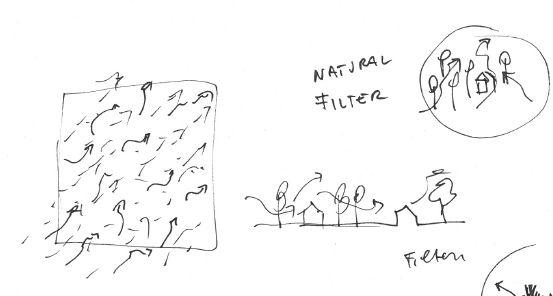
Filters Filters
Infrastructure
Neighbourhood typology
Green-blue infrastructure
Park structure composition
“Park necklace”
Ecological stepping stones
Corridors
Routing
Entry points
Crossings Nodes Patches Gradients
Accelerators
Microscale composition
“Microclimate”
Planting type
Planting density / porosity
Building height
Building mass
Corridor width
Materialisation
Micro Topography
Wind Woven | Ecological restoration of Breda’s urban fabric through wind
Thermodynamic performance/ identity
Humidity
Evaporative cooling
Heat capturing capacity
Free convection
Radiant cooling
Stream network
Evaporation
Funneling
Dispersion
Performance
Evaporation
Funneling
Dispersion
Sheltering
Sheltering Acceleration Acceleration
Cooling/ Heat mitigation
Pollination
Cooling/ Heat mitigation
Pollination
Reduction | Dispersion of air pollution
Preservation of landscapes of importance
Reduction | Dispersion of air pollution
Preservation of landscapes of importance
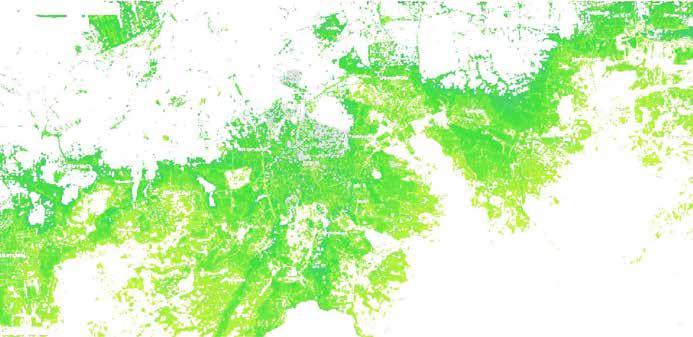
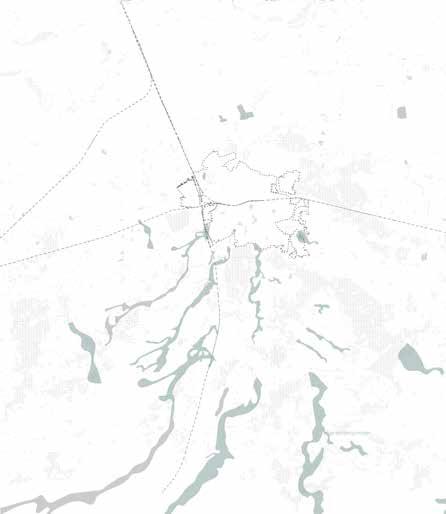
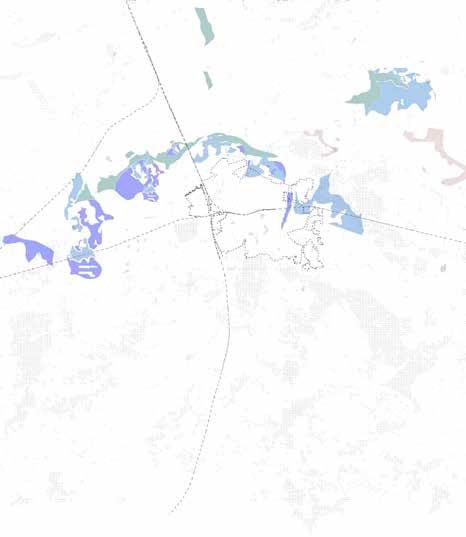
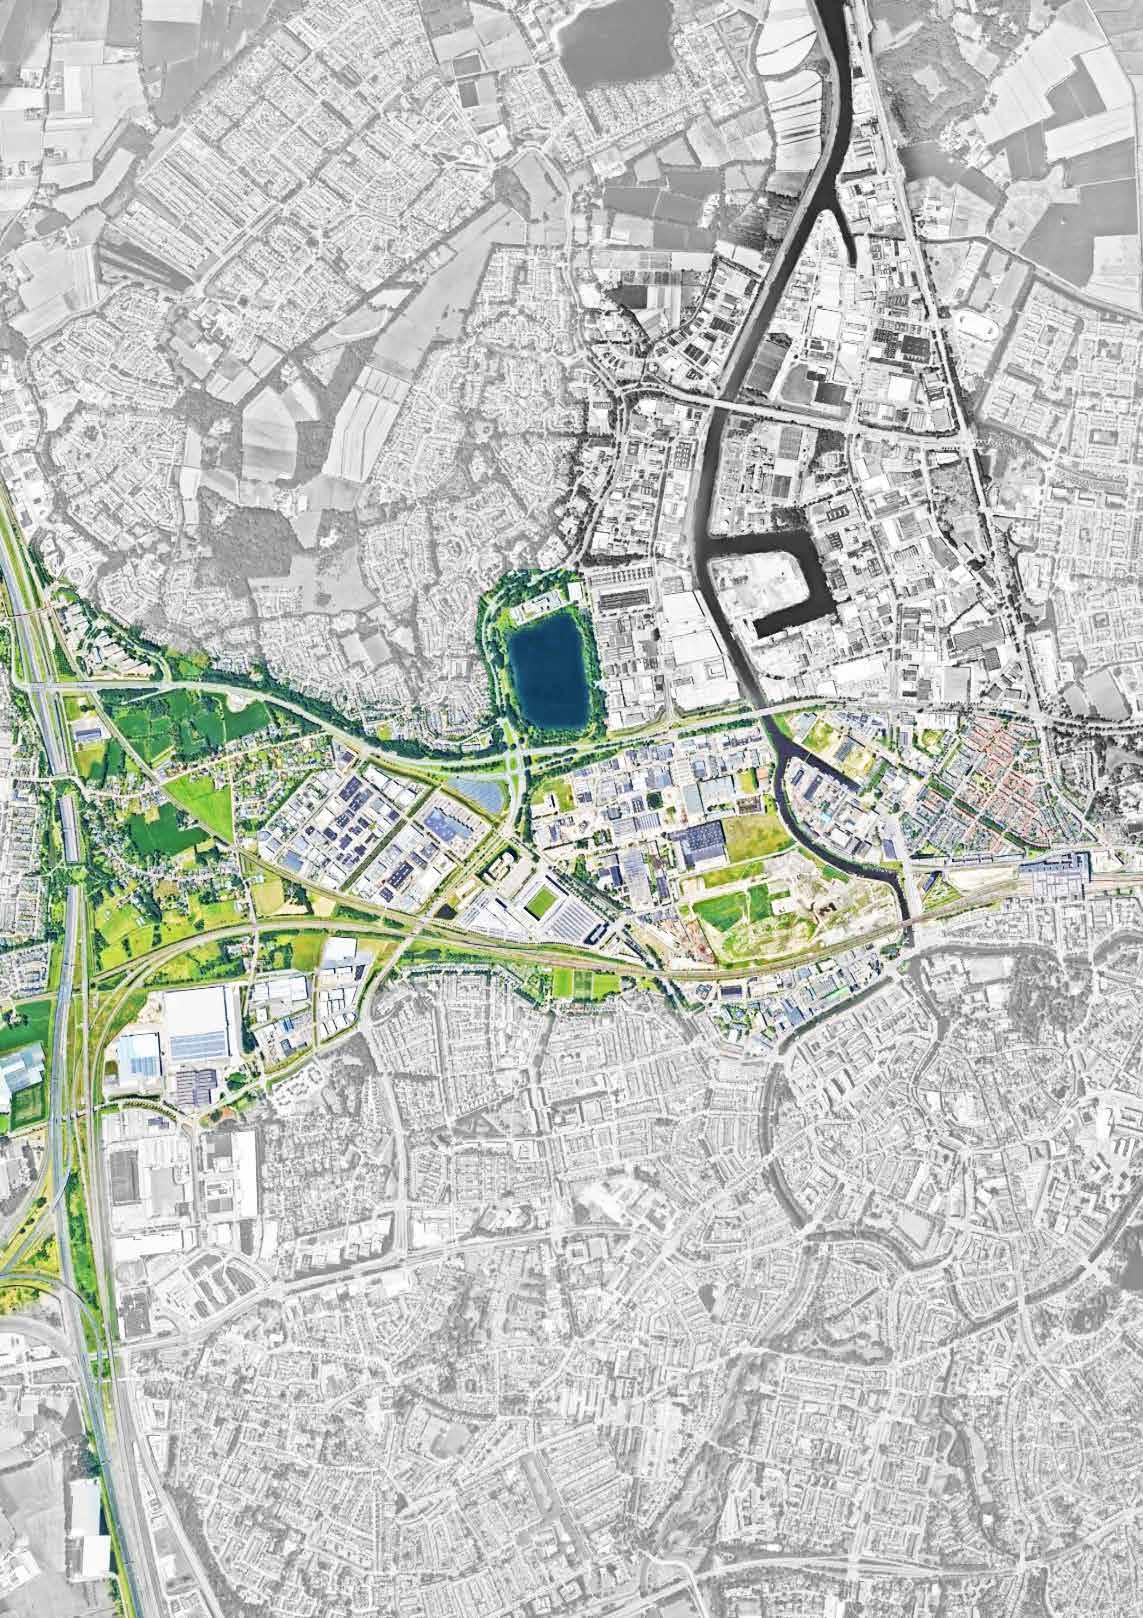
Humidities of Breda’s surrounding landscapes
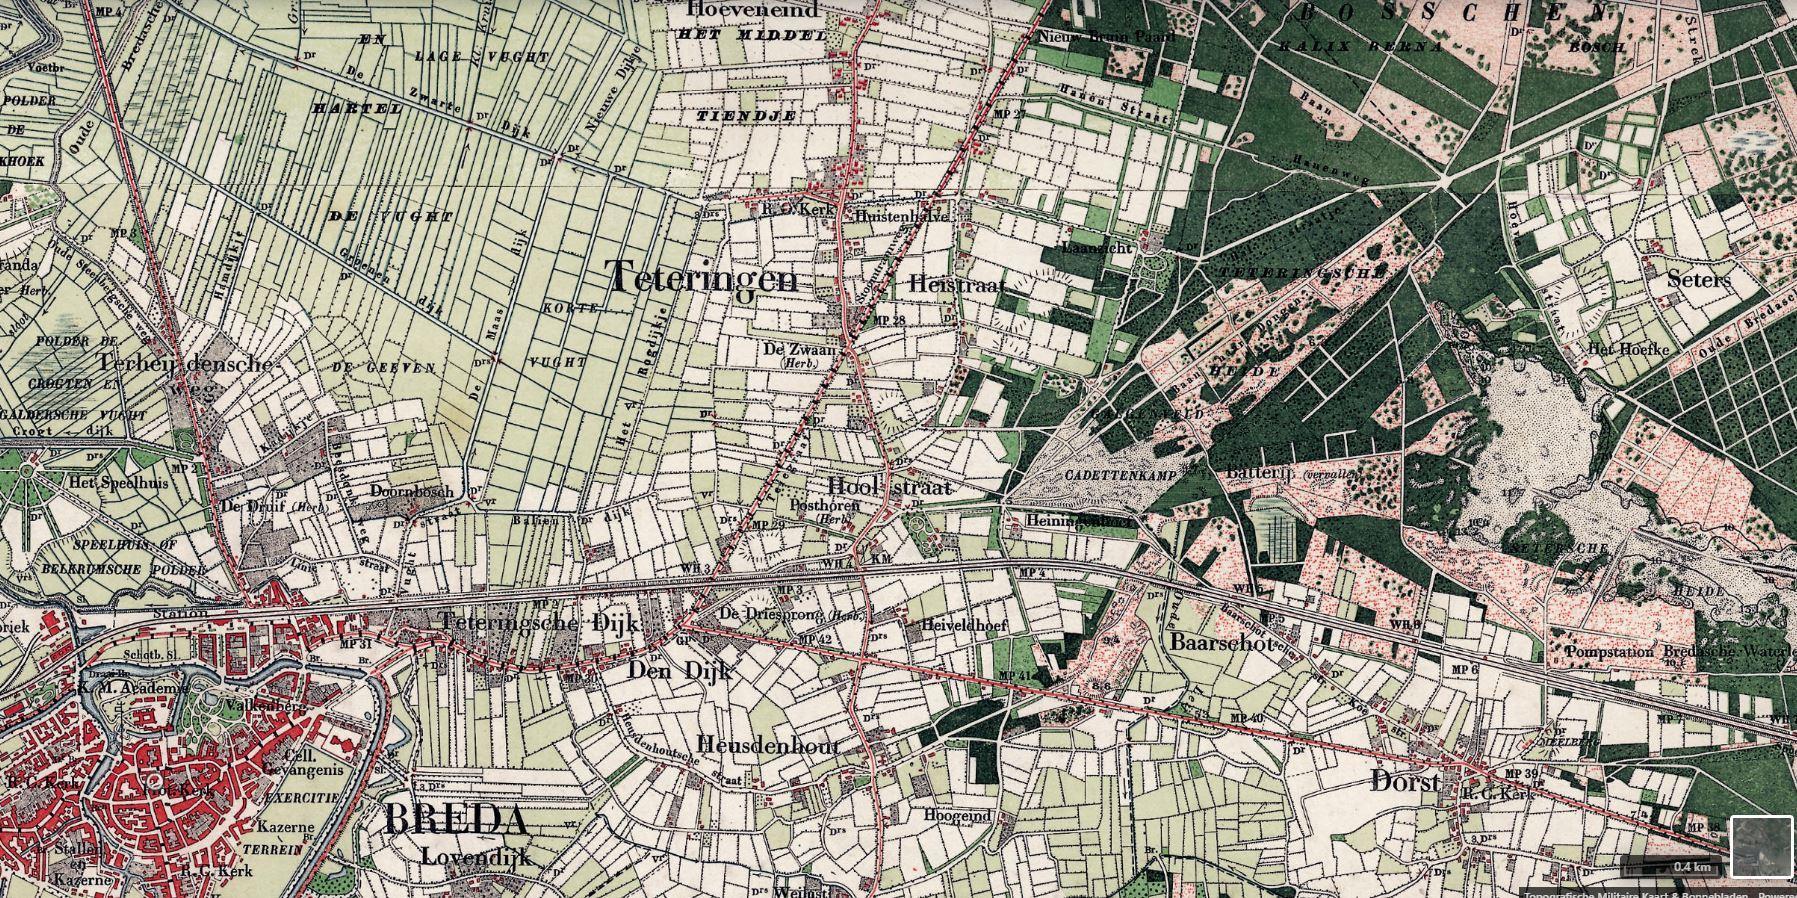
Breda is located at the meeting point of various landscapes and streams that flow into and impact the city. The area is rich in vegetation, national parks, and diverse landscapes. It is part of the Van Gogh National Park, and includes the Zuiderwaterlinie with its city fort. To the north, it is bordered by Biesbosch and sits at the junction of the River Mark and Weerijs.
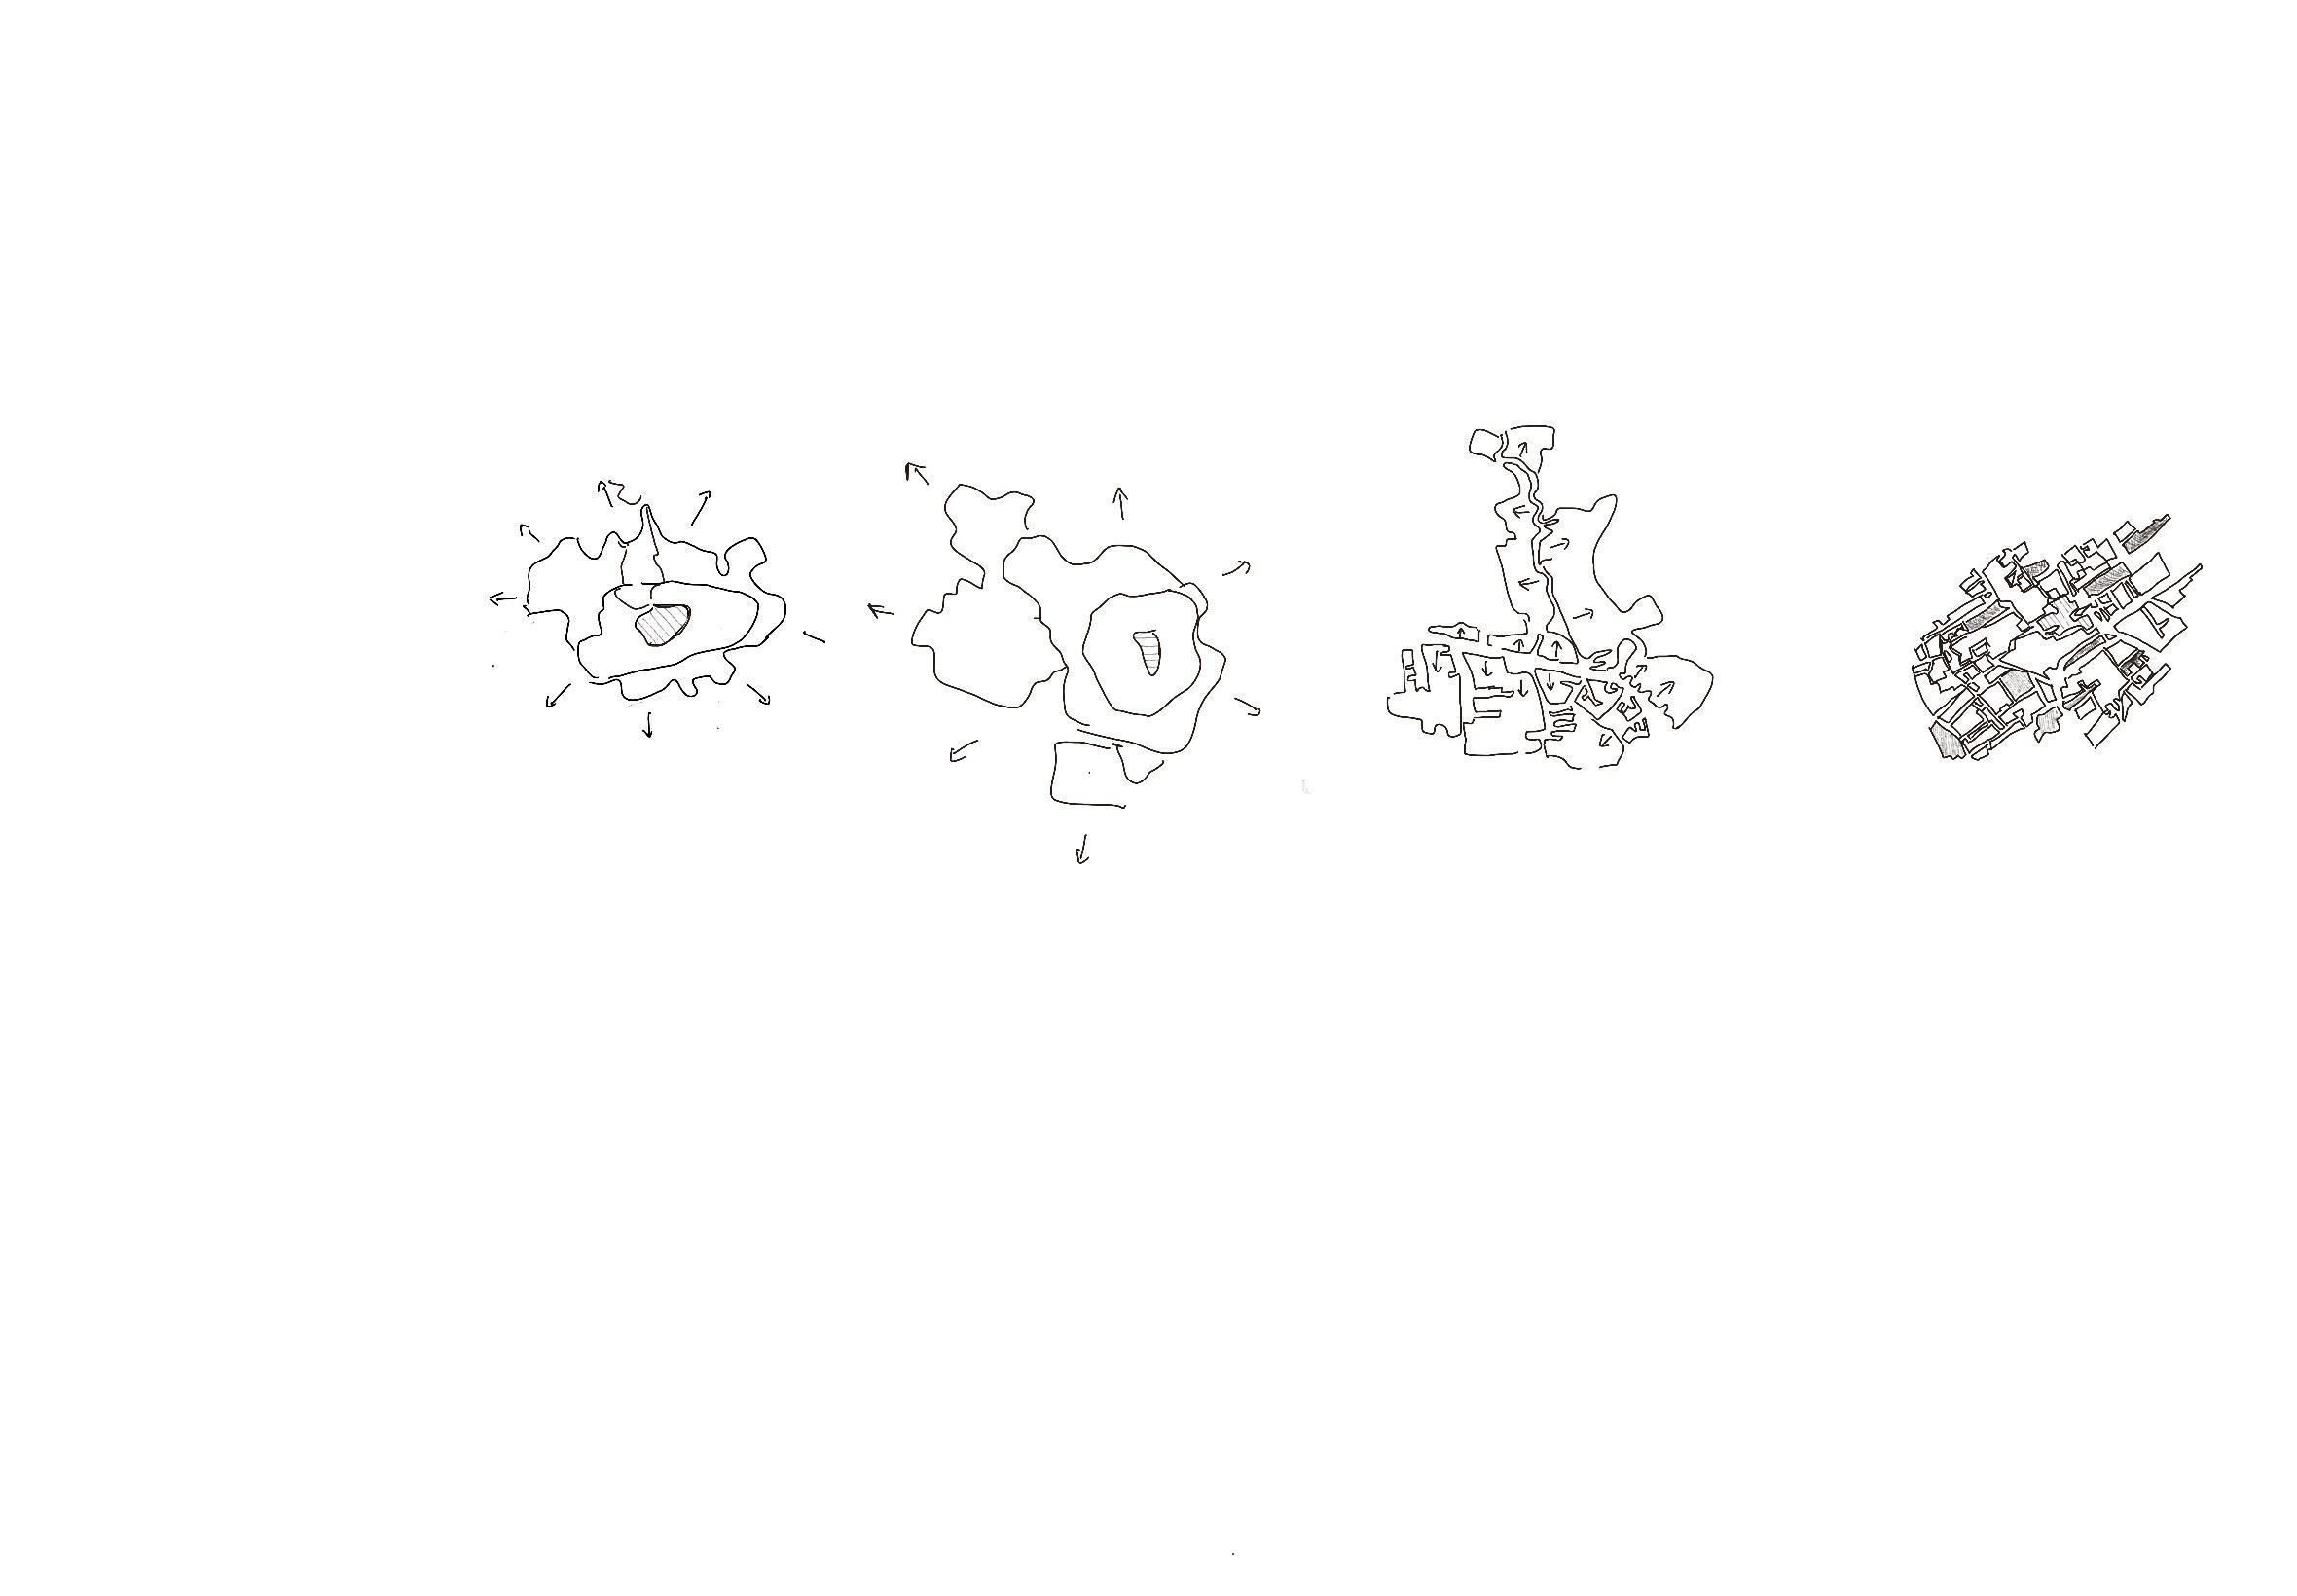
Breda was established at the convergence of the Aa and Mark brooks. The area had ideal conditions for early urbanization, with a water system suitable for drinking, transportation, and defense, along with fertile land. The walled Nassau city evolved into a center for food and technical industry, and later expanded to include a wide range of production and service industries. Throughout its history, the city has maintained a military presence.
The urbanization strategy is based on three types of landscapes: the network of stream valleys on the sandy soils in the south, the flood zone with seepage areas in the middle, and the complex river clay landscape in the north. This results in a highly desirable urban environment intertwined with a diverse landscape. 5
5 CrossMark Breda, Notitie Reikwijdte en Detailniveau t Zoet (Breda: CrossMark Breda, 2024), 12, https://www.crossmarkbreda.nl/sites/default/files/2024-07/Notitie%20Reikwijdte%20en%20Detailniveau%20t%20Zoet_0.pdf.
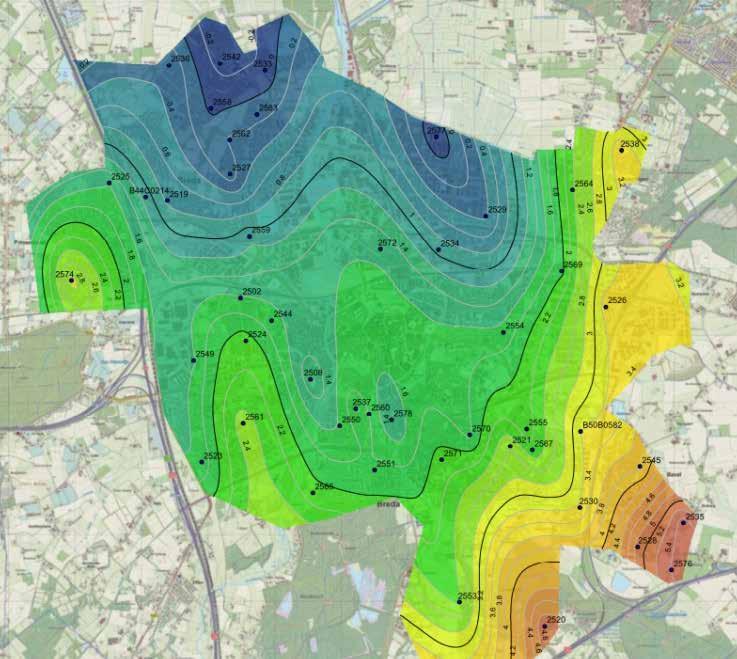
In the western area, groundwater levels typically range between 80-120 cm below ground level, while in the eastern part, which lies at a lower elevation, groundwater levels can rise to between 40-80 cm below ground level.
To the north, the soil is primarily composed of peaty materials, characteristic of hydroclay soils. These loamy and clay-rich soils are prone to periodic high groundwater levels. The surface layer consists of clay, which transitions into peat at depths of 40-80 cm. Groundwater levels and soil composition play a crucial role in urban cooling by influencing evapotranspiration, soil moisture retention, and thermal properties of the landscape. In areas with higher groundwater levels, such as the eastern and northern parts, moisture is more readily available for vegetation, supporting higher rates of evapotranspiration and contributing to natural cooling. In contrast, the western area, where groundwater lies deeper, may experience reduced cooling potential due to limited water accessibility for plants.6
Wind Woven | Ecological restoration of Breda’s urban fabric through wind
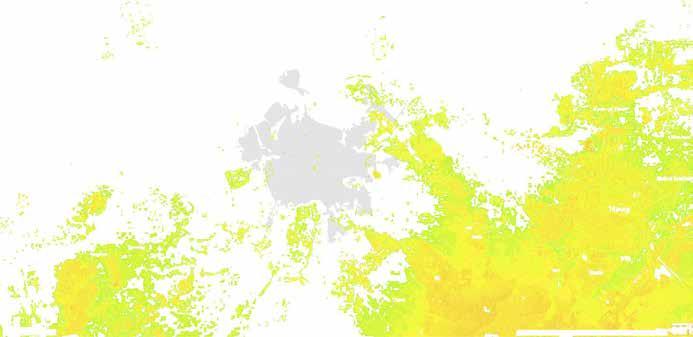
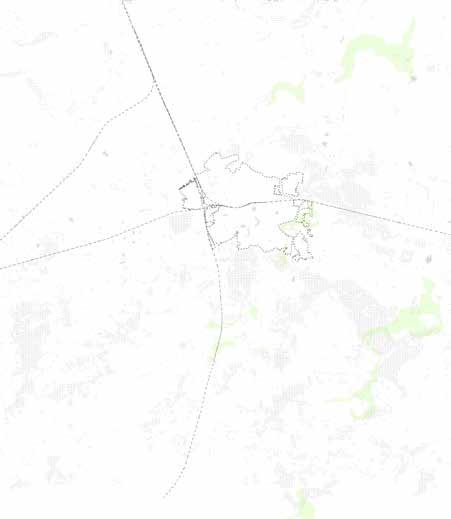
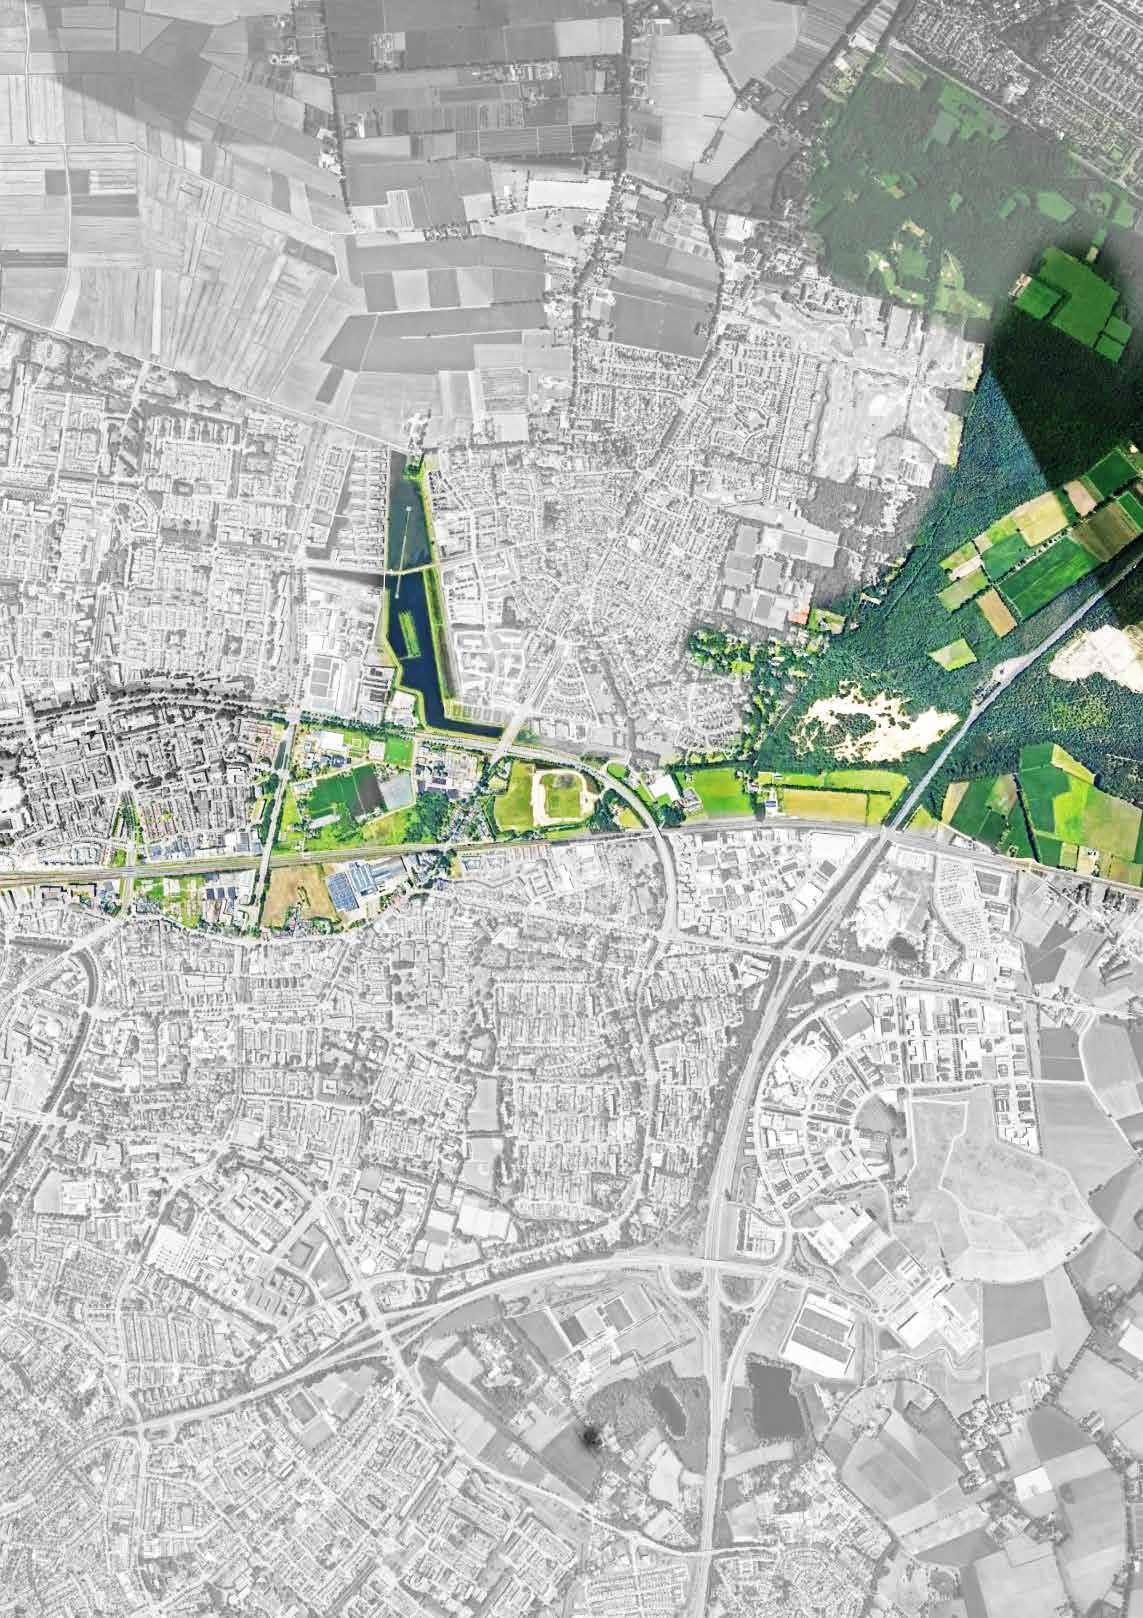
Topographies
Humidities
The landscape of Breda slopes down from south to north and ends in a low-lying plain. There is a 34 meter drop from Merksplas (just across the border with Belgium) to Breda.
Academie van Bouwkunst Amsterdam 23 | 24 | Rachel Borovska
low-lying plain. There is a 34 meter drop from Merksplas (just across the border with Belgium) to Breda. Most of the territory consists of sandy soils with a radial structure of stream valleys. Almost all streams flow in the direction of the city center and converge in the canals. The water flows via the Mark through the plain on the north side of Breda, which is relatively wet and consists of peat and marine clay.
Pleistocene. system in manure and C-horizon, Both hydrosoils saturated derived often forest. belong to which The soils
Thermodynamics of Soils
The diverse soils in and around Breda support a wide range of vegetation and contribute to distinct thermodynamic effects in the city. In the southern areas, sandy soils formed around brooks extend toward the city center, characterized by nutrient-rich humus layers that transition into nutrient-poor cover sand. These soils influence local microclimates, with the sandy texture aiding in heat absorption during summer, contributing to the urban heat island effect in the absence of sufficient vegetation cover.
The surrounding forests, located mostly on enk soils and podzols, are found in sandy landscapes formed during the Pleistocene. These soils
Fig.0.4SoilprofilefromvariouslocationsinBreda.
Beekeerdgronden
Beekeerdgronden
were historically fertilized with animal manure and turf, fostering plant growth deep into the C-horizon (0-80 cm). Enk soils contribute to cooling through evapotranspiration, while podzols—often saturated with water—can buffer temperature extremes by retaining moisture, helping to moderate heat buildup in surrounding areas. The presence of Laarpodzols, which are periodically saturated with water, also acts as a natural regulator of temperature, especially in forested areas, mitigating the urban heat island effect.
To the north, peaty soils predominate, with hydroclay properties that experience high groundwater levels. These loamy and clay-rich soils, with a peat layer between 40-80 cm, have a cooling effect on their surroundings, absorbing and slowly releasing moisture. This characteristic is particularly beneficial for moderating temperatures in the urban landscape, enhancing the role of green spaces in cooling the city.
Together, these varying soil types play an essential role in mitigating the urban heat island effect by supporting vegetation that cools the air and regulates moisture. The combination of these natural features, particularly when considered in relation to wind corridors, offers a unique opportunity to address climate challenges. Wind can be channeled through the city, aided by the cooling influence of these soils, providing natural ventilation that helps reduce heat buildup, especially in urban areas undergoing densification.7
Soil profiles were retrieved from Dinoloket, Ondergrondmodellen Kaart, accessed March 2024, https://www.dinoloket.nl/ ondergrondmodellen/kaart.
Laarpodzol
Laarpodzol
Academie van Bouwkunst Amsterdam 23
24
Rachel Borovska
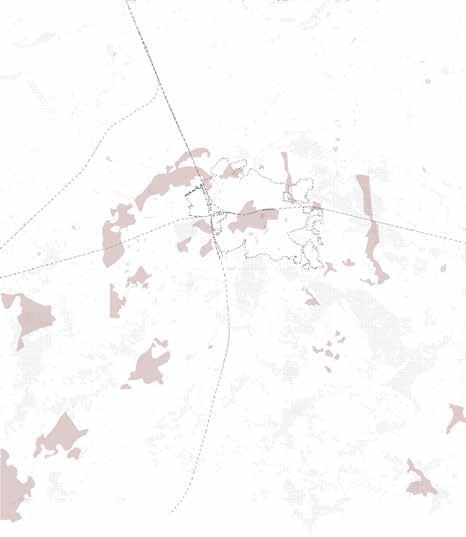
Diversity of vegetation
The diverse soils in and around Breda create opportunities for a rich variety of biotopes within the city, enhancing both ecological diver sity and the city’s resilience to climate challenges. The landscape of Breda is shaped by a mix of akkers and beemden—low-lying clay areas designed for water retention, and raised sandy zones originally created for drainage. This variety of soils supports a range of habitats, from wet grasslands to sandy forests, each playing a crucial role in the city’s ability to mitigate urban heat. 8
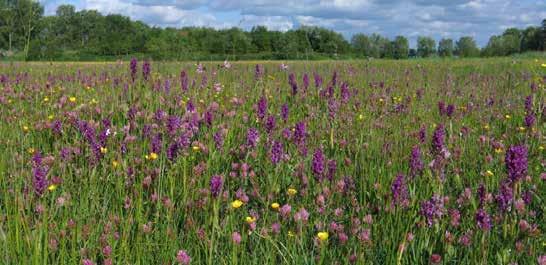
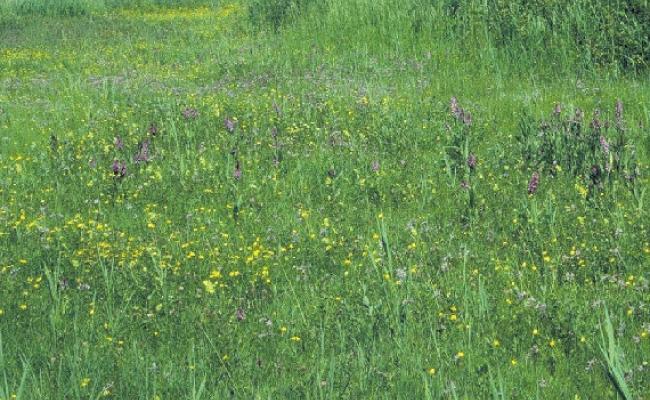
For example, marsh marigold grasslands thrive on moist to wet, mod erately nutrient-rich soils, particularly in stream or river valleys that experience brief flooding in winter and have a high groundwater level in summer. These grasslands act as natural coolants, with their dense herb layers providing cooling through evapotranspiration and helping regulate temperatures. The absence of a tree or shrub layer, combined with the limited moss cover, allows these grasslands to remain open and absorb heat during the day, but they also cool the surrounding environment as temperatures drop, helping to counteract urban heat islands.9
Transitions between these biotopes, such as acidic peat, meadow sweet scrub, or dune grasslands, further enhance the city’s cooling potential. Each of these habitats offers unique temperature-regulat ing properties, from the moisture-retaining capabilities of peat soils to the cooling effects of dune grasslands, which provide shade and help absorb moisture, moderating heat.
Opportunity for Biotopes
The Breda landscape slopes down from south to north and ends in a low-lying plain. There is a 34 meter drop from Merksplas (just across the border with Belgium) to Breda. Most of the territory consists of sandy soils with a radial structure of stream valleys. Almost all streams flow in the direction of the city center and converge in the canals. The water flows via the Mark through the plain on the north side of Breda, which is relatively wet and consists of peat and marine clay.
9Junjie Fang et al., “Responses of Wetland Plants to Climate Warming: A Meta-Analysis of Experimental Warming Studies,” Frontiers in Plant Science 12 (2021): Article 860188, https://doi.org/10.3389/fpls.2021.860188.
Veenmosrietland, Borstelgrasland, Blauwgrasland, Dotterbloemgrasland en Grote Zeggeverbond
In de goed ontwikkelde Blauwgraslanden met Klokjesgentianen komt het Gentiaanblauwtje voor. Deze sterk bedreigde soort is zowel afhankelijk van de waardplant (Klokjesgentiaan) als het voorkomen van een aantal knoopmiersoorten (Bossteekmier en Voor deze soorten is een gradiënt in zowel vocht als begroeiing van belang (V1a).
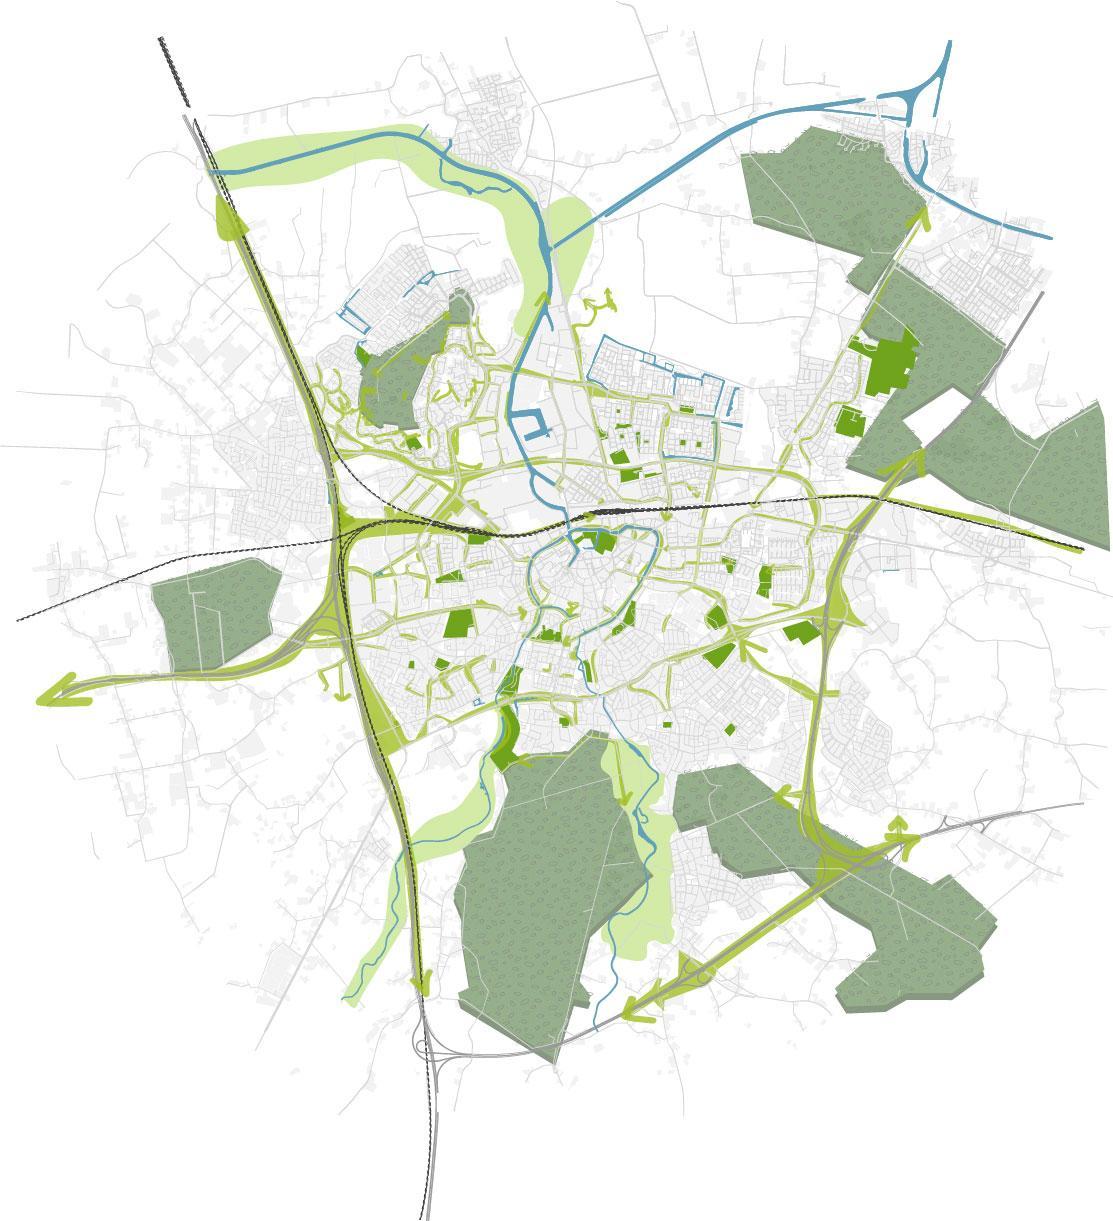
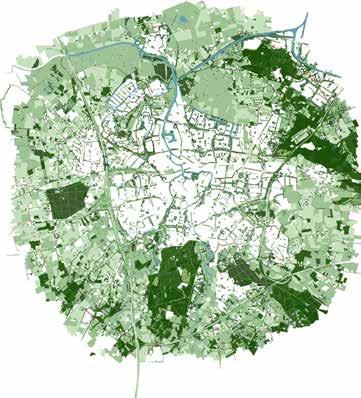
Breda is surrounded by a mosaic of grasslands and agricultural fields and framed by forests mainly at its outskirts to the South and West. On the north, it is surrounded by low-lying polders with high groundwater levels, river clay landscapes, and wet peat areas. Within the city, the majority of green is positioned along infrastructure. Several smaller park patches are radially organized and scattered in the urban fabric of Breda. Brooks Aa and Mark enter the city from the South.
Landscape / Biotopes
These diverse landscapes not only shape ecological conditions but also influence how wind moves through and connects different bio-
A16
topes. Open fields and polders allow winds to travel freely, carrying seeds, moisture, and airborne species across the landscape. Forests and urban greenery create sheltered zones, altering wind speed and direction while providing microhabitats for flora and fauna.
By understanding these interactions, urban planning can enhance wind-driven ecological connectivity—positioning green corridors, open spaces, and vegetation in ways that guide and amplify beneficial wind flows, fostering biodiversity and resilience across Breda’s urban and natural fabric.
Liesbos
Teteringse Heide
Haagse Beemden
Mosaic of grasslands, agricultural
Climatopes glossary:
In her book Weather in the City: How Design Shapes the Urban Climate, Sanda Lenzholzer introduces the concept of climatopes—distinct urban areas characterized by specific microclimatic conditions.10
Forest climatope: tempered temperature fluctuations, constant relative air humidity, retaining heat during night and keeping cool during the day
Water climatope: Water bodies larger than 50m, tempering effect The atmospheric humidity is higher, there is more wind because water surfaces do not intercept wind
Open landscape climatope: large open fields, openness sky factorheat radiates quickly at night, no obstacles, these areas are important ‘producers’ of cold airflows
Park climatope: more extreme temperature fluctuations, bigger sky factor allows warmth to radiate at night, shadows & evapotranspiration, park like structures often important ‘producers’ of lower air temperatures, can enhance ventilation
Garden city climatope: low building density of up to three building layers with trees in them, fairly tempered temperature
City periphery climatopes: more built up than garden cities, uup to five building layers, ventilation is slowed by the buildings and planting
City climatope: historical centers, limited vegetation and limited cooling, clear heat island effect
City center climatope: very densely built up with massive and partly high rise buildings, hardly any vegetation, strong warming during the day and limited cooling during the night
Industrial climatope: intensive heat characteristic, residual heat from the production activities heats up these areas in addition to solar radiation, roofs cool down rather quickly, streets and enclosed areas remain warm for a long time
Railway climatope: large, open areas of at least 50m wide, gravel becomes very hot during the day but because of the large sky view factor it cools down more quickly during the night, large open areas can help provide ventilation, however they are a lot warmer than unsurfaced areas
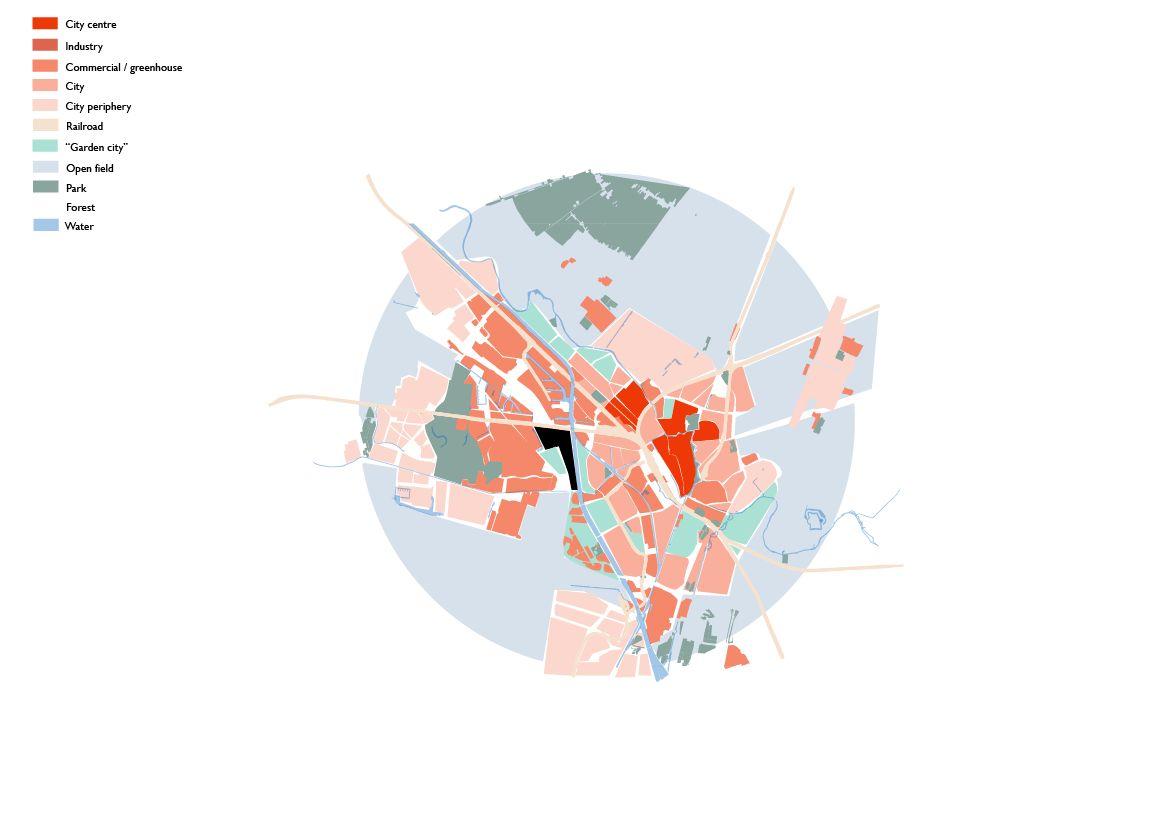
A climatope map portrays the various climate zones present within a city. Sanda Lenzholzer’s research defines climatope maps as a representation of the ‘climatope concept,’ which indicates that different areas and districts within a city exhibit distinct microclimatic characteristics. This includes factors such as the impact of building structure, vegetation, soil surfaces, and human-made heat in different parts of the city. The urban building structure, density, and types of vegetation and materials play a crucial role in determining climatope classification. 11
The city center of Breda and the area extending northward alongside the river are the most susceptible to overheating on a city scale. This is largely attributed to the presence of industry along the riverbank and the historical center located at the core of the radially shaped city. Both of these areas are predominantly paved and have minimal vegetation.
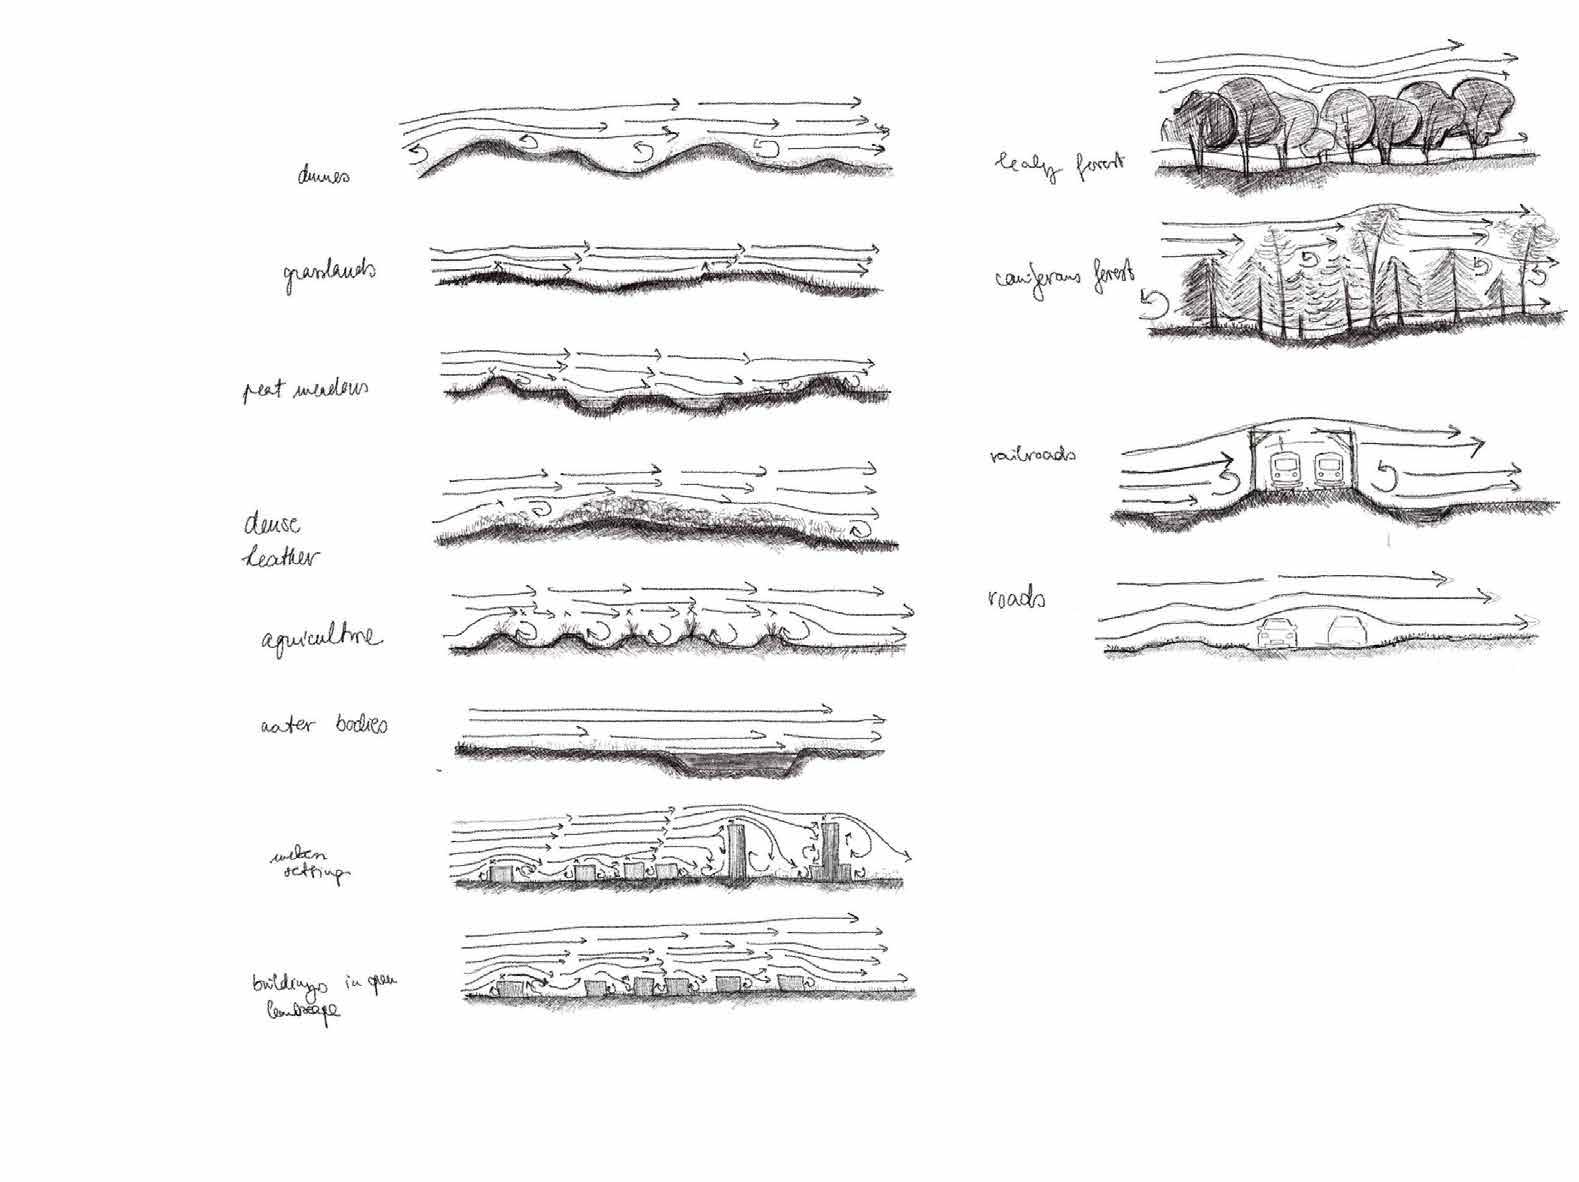
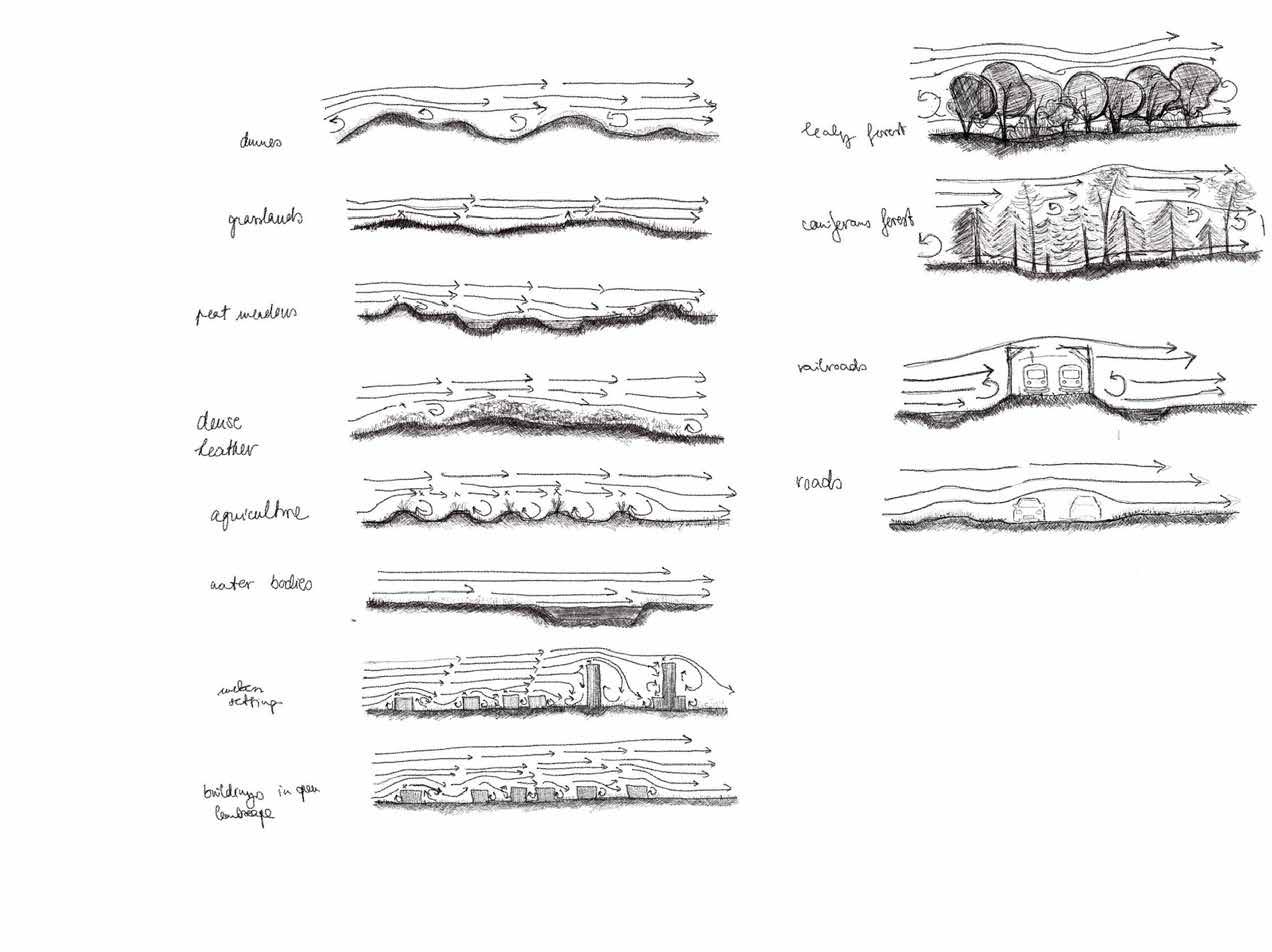
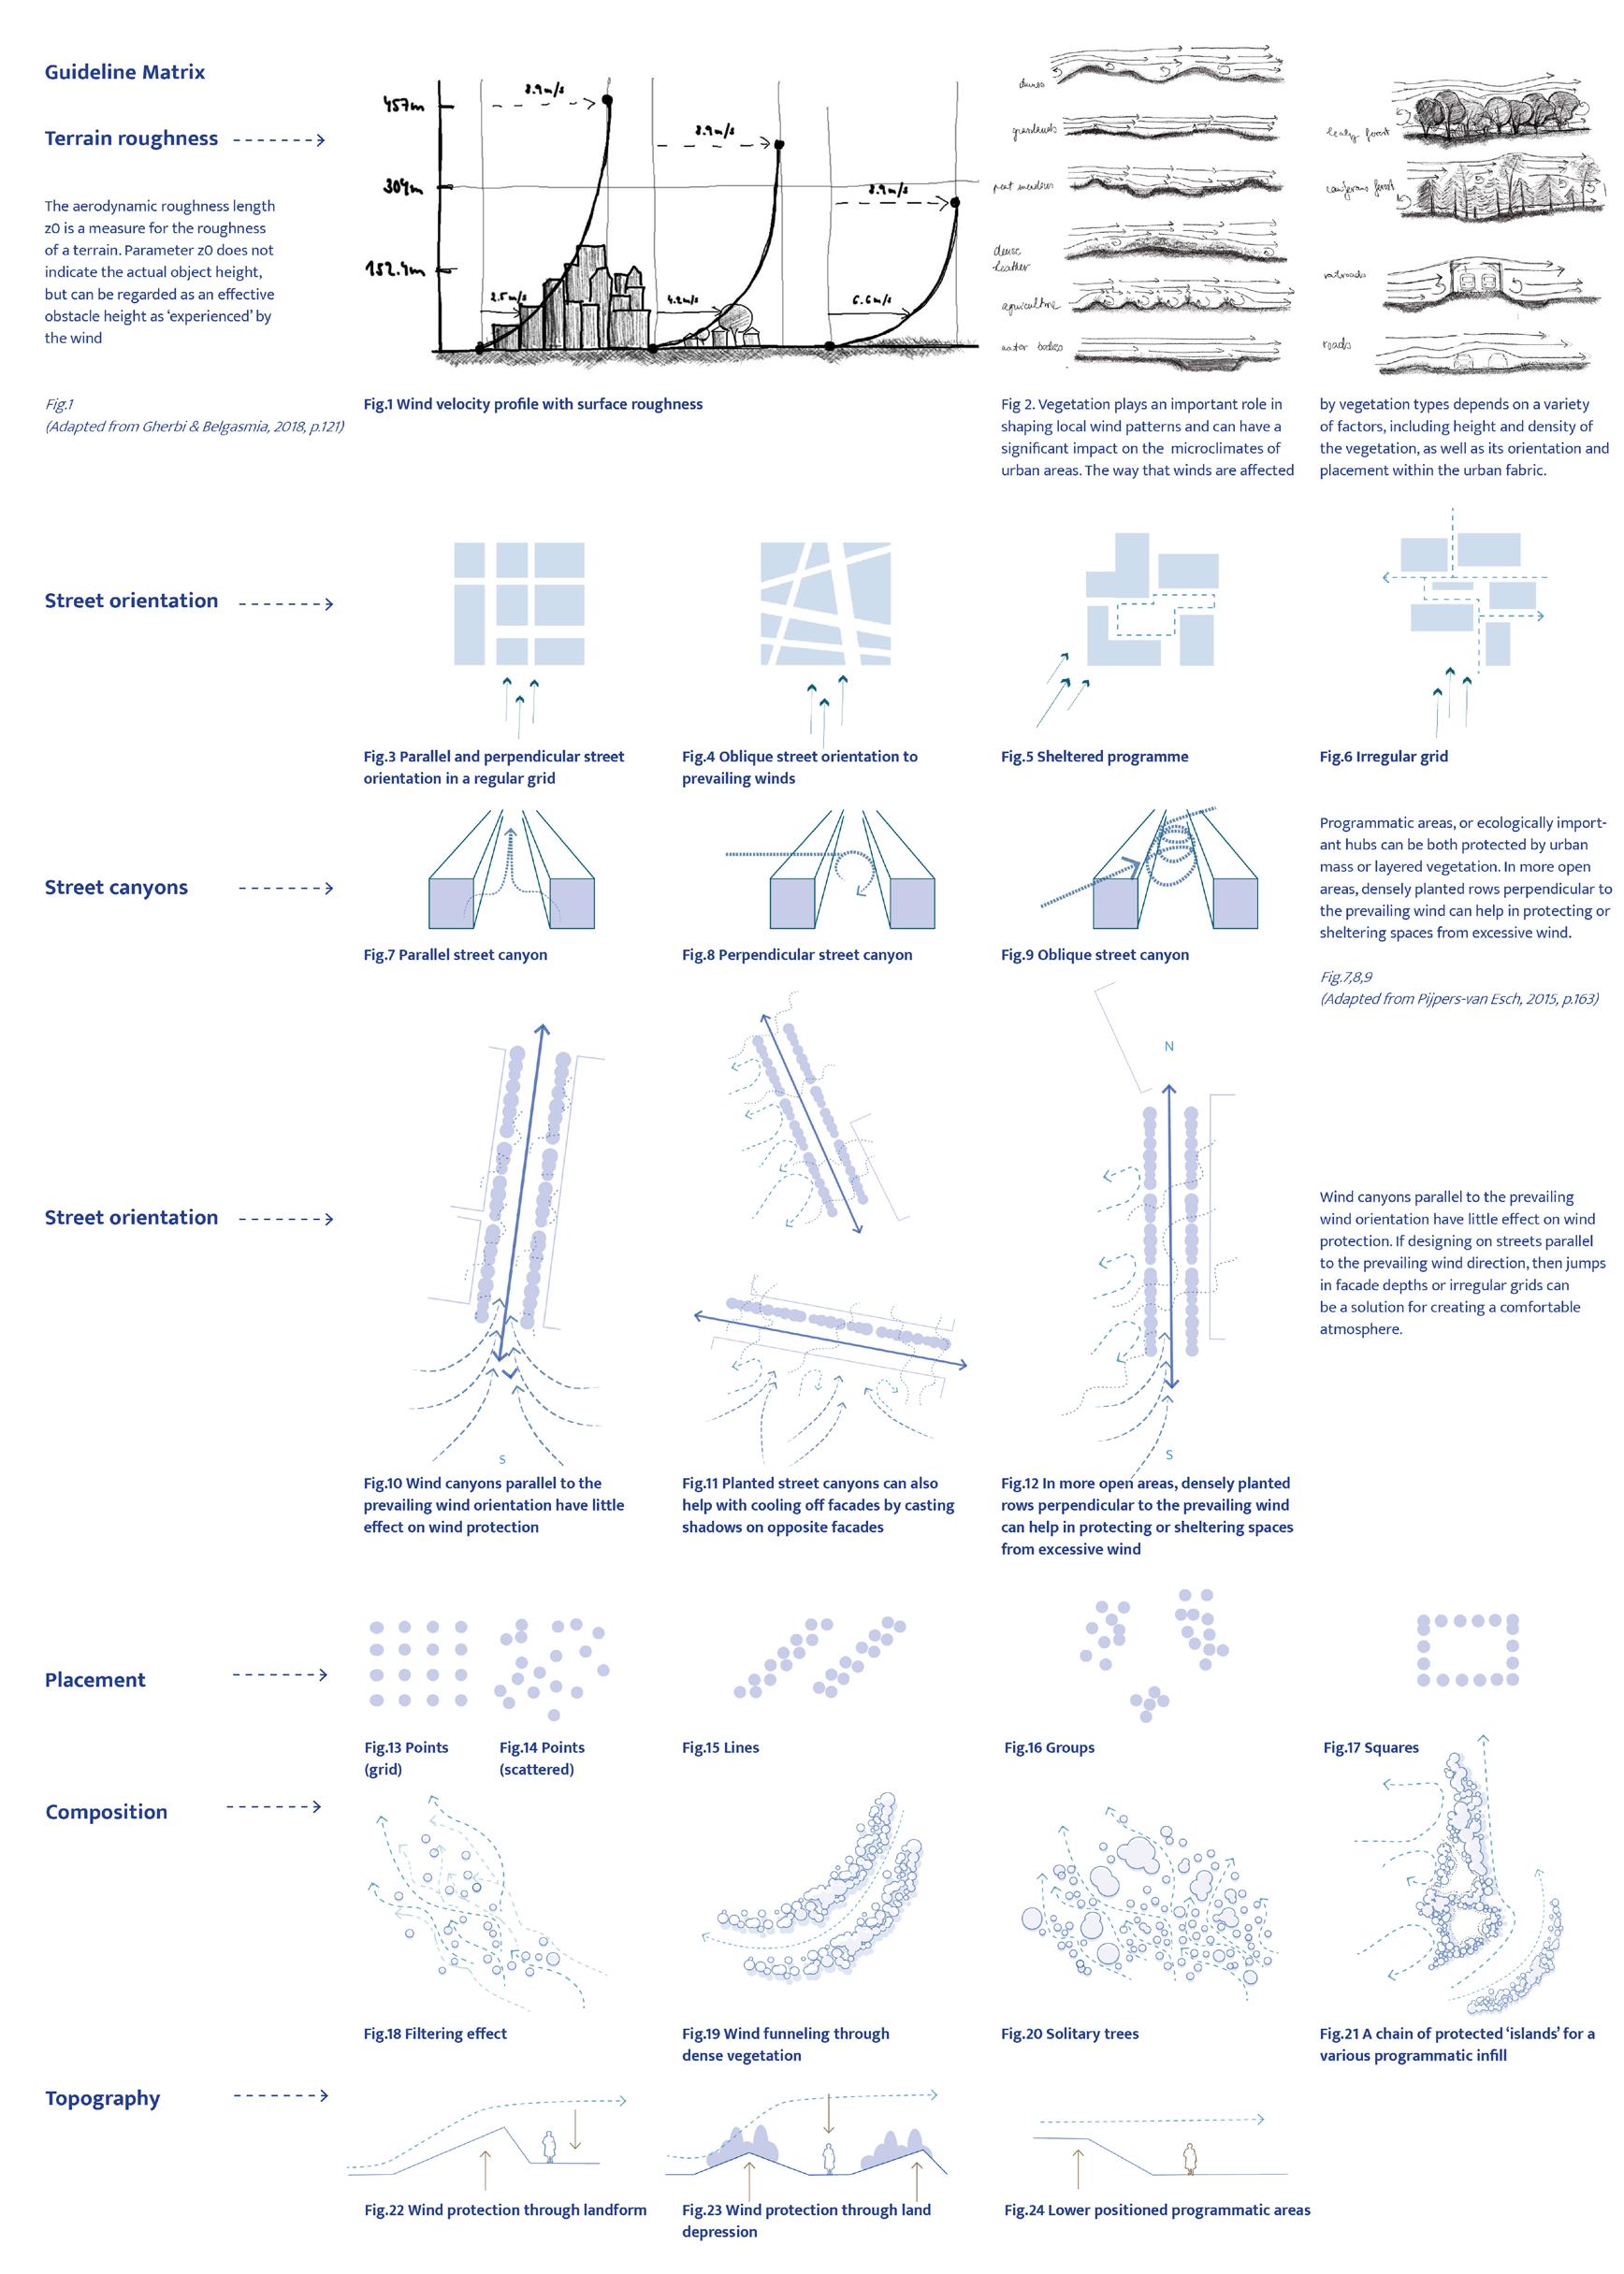
reduced wind speed and change in its direction while passing through the canopy.
On the other hand, low-growing vegetation like ground cover or shrubs may have minimal effects on wind patterns as the wind can move over them relatively freely. Nevertheless, even low-growing vegetation can create pockets of still air that benefit plant growth and help reduce air pollution in urban areas.
z 0 = roughness length in the current wind direction.
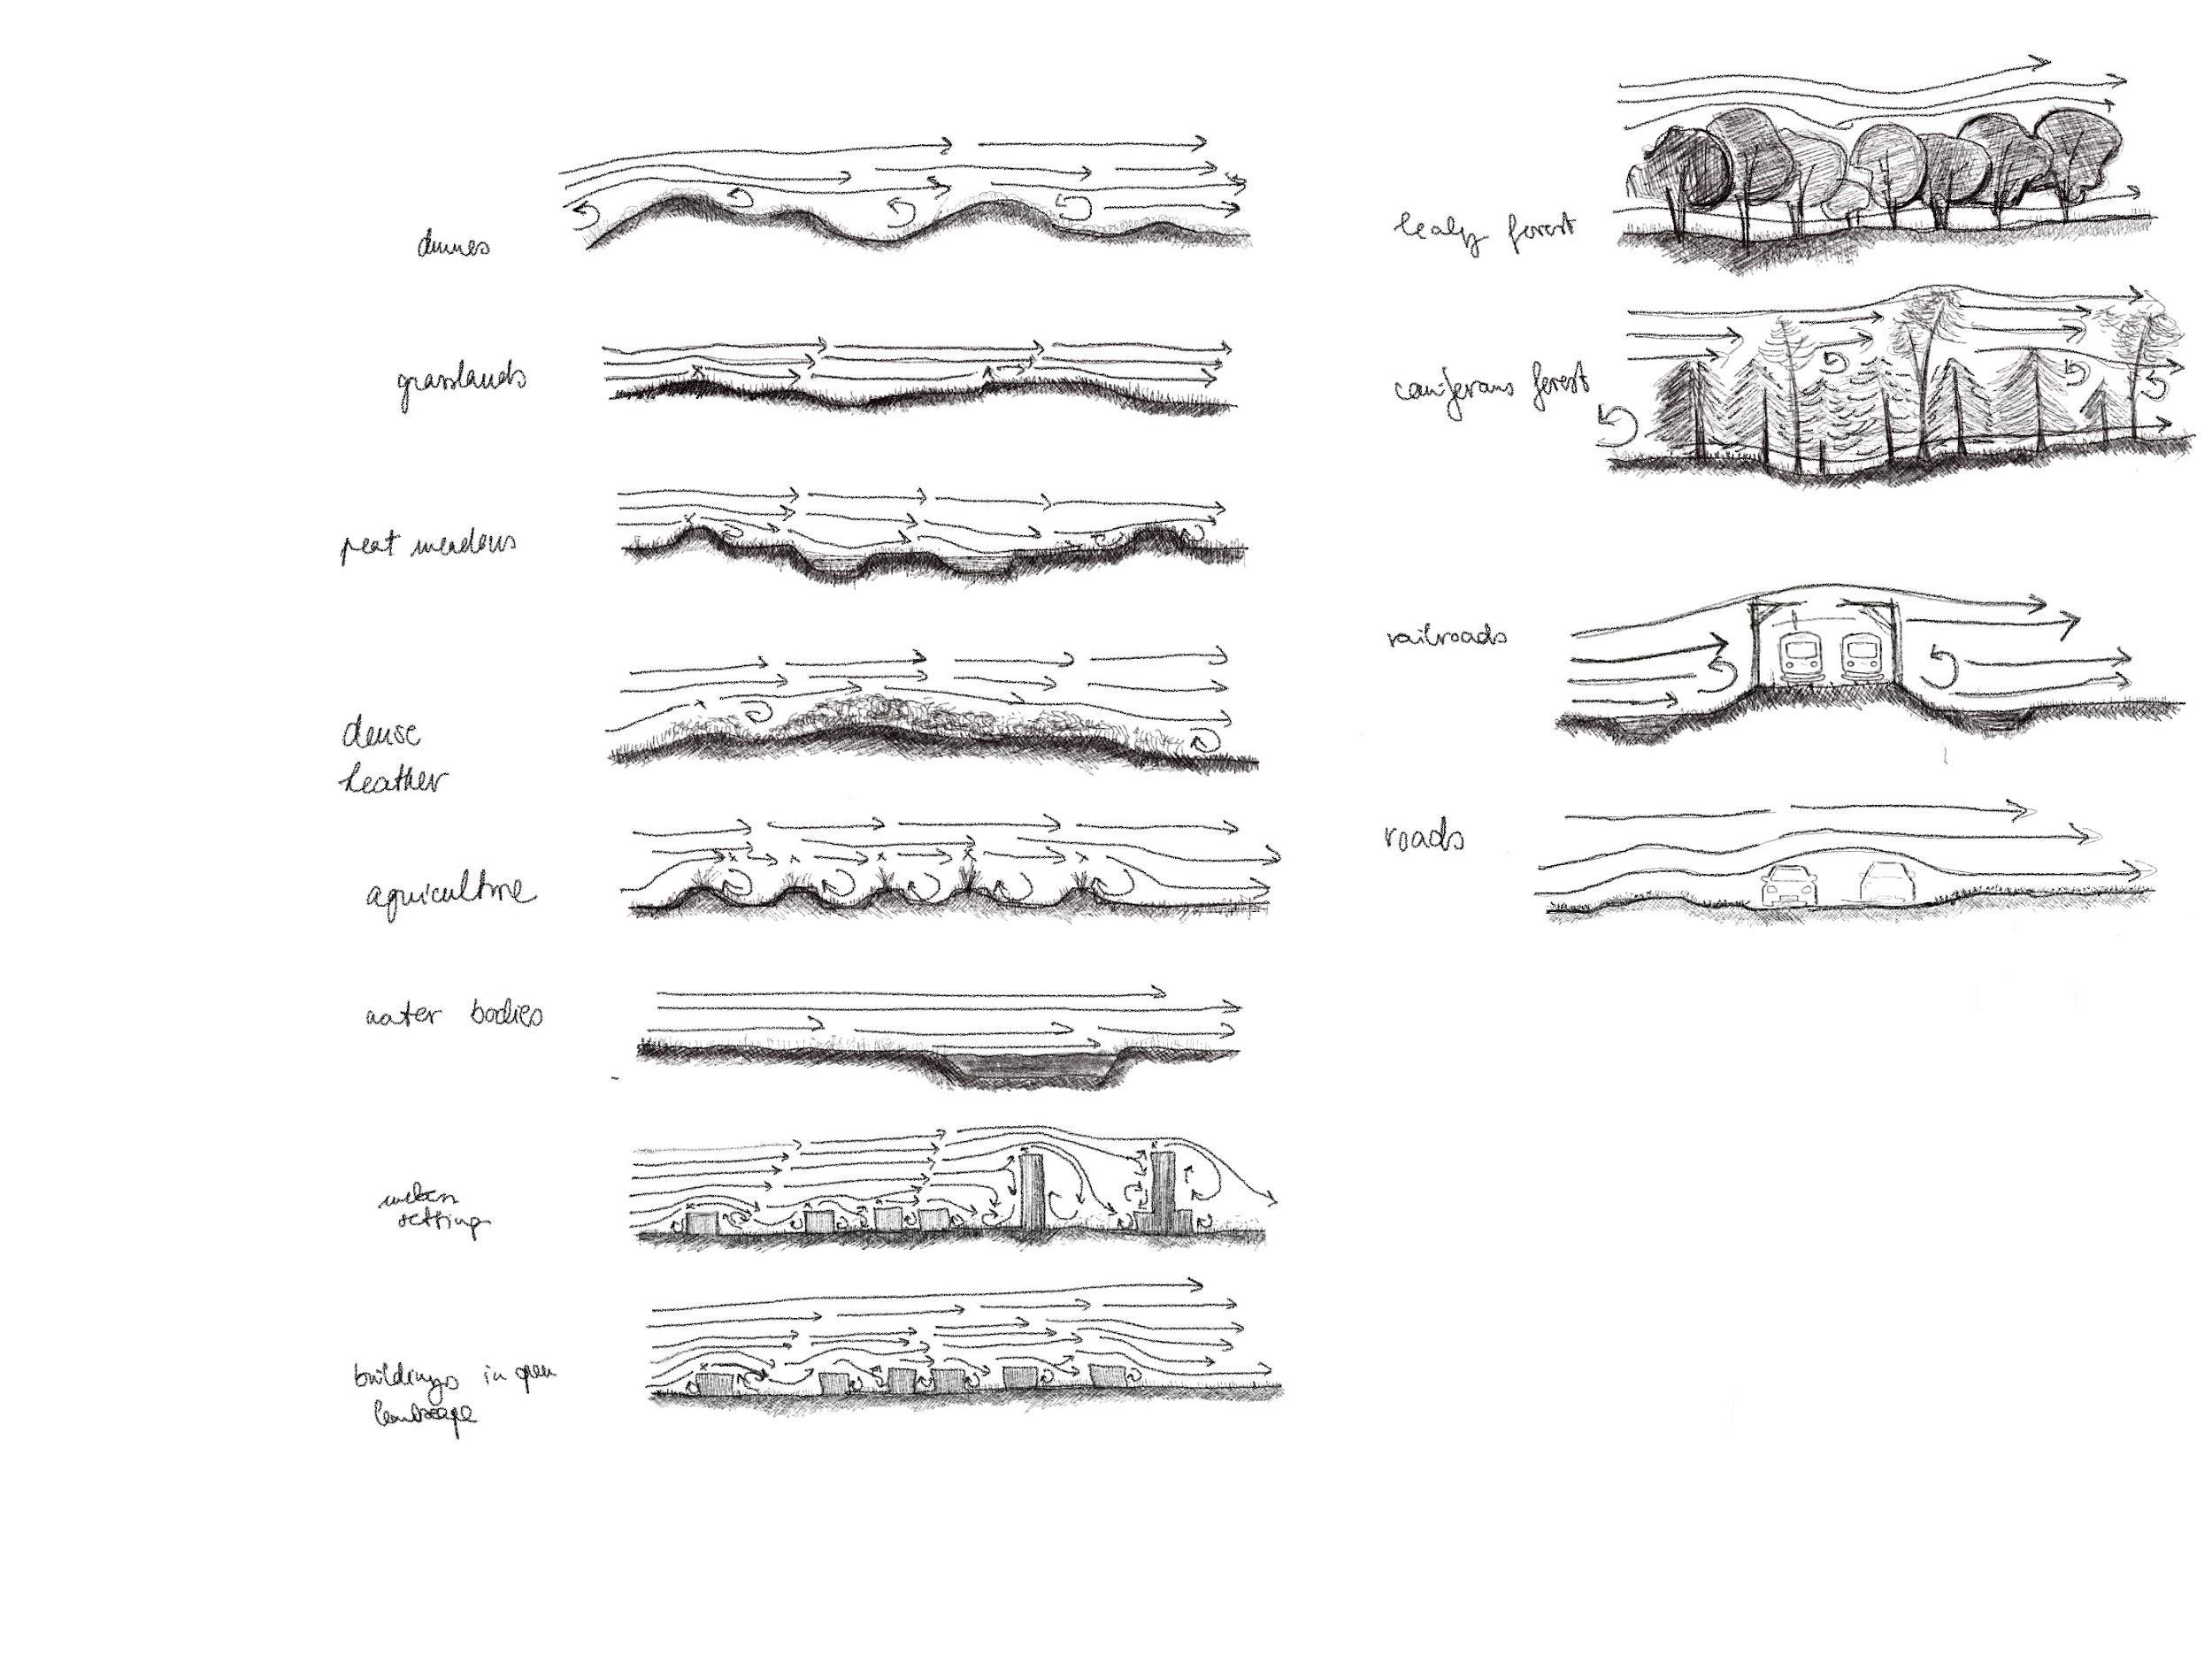
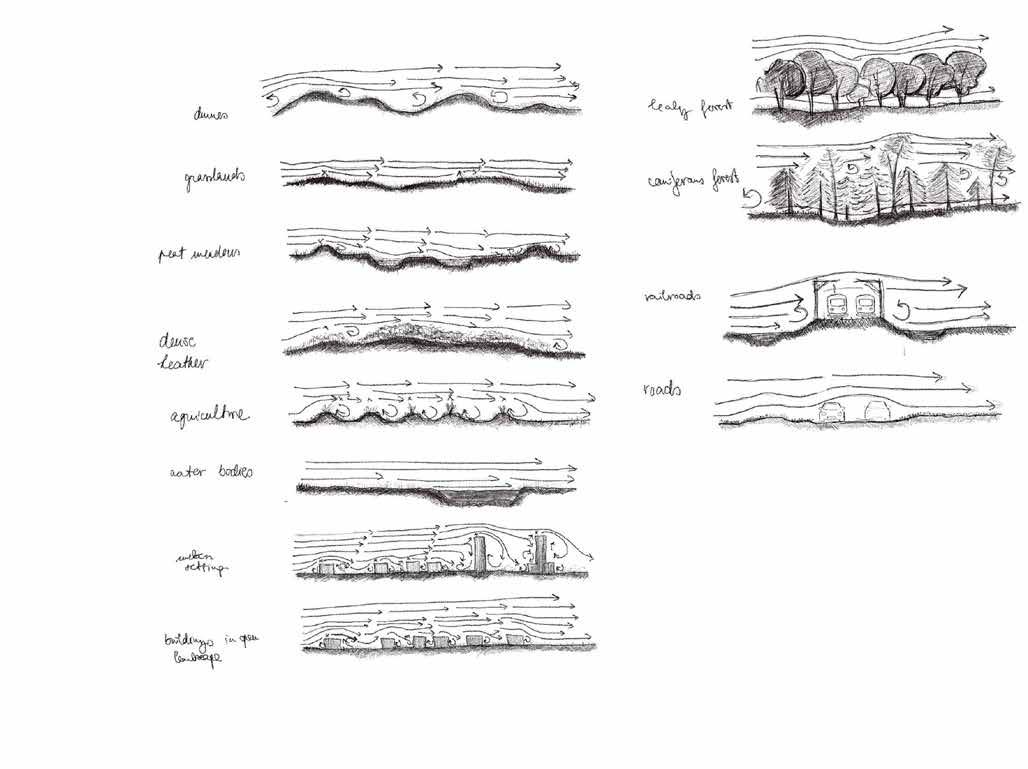
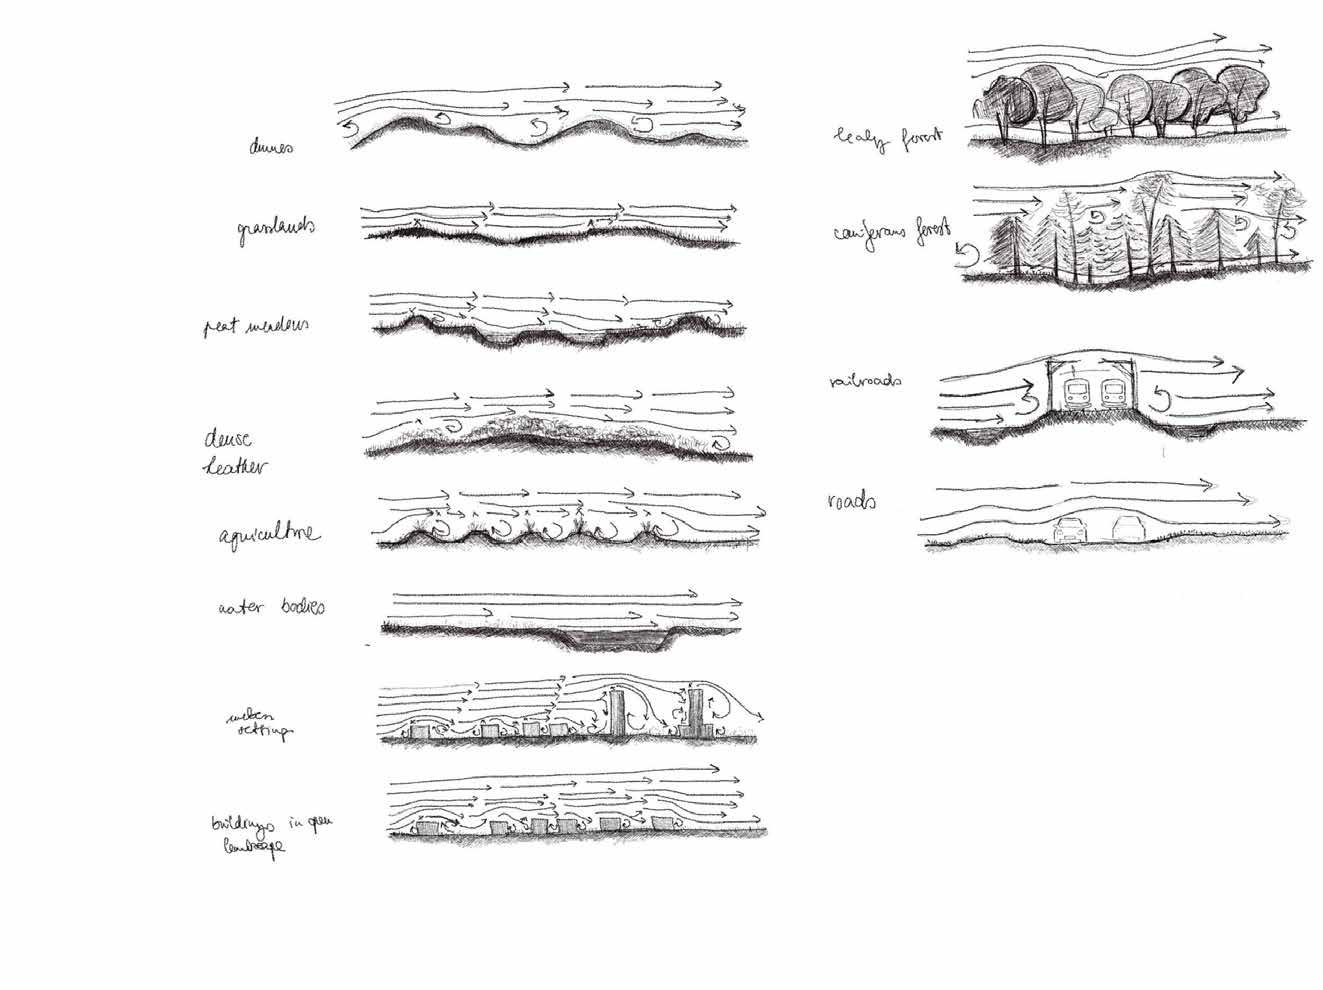
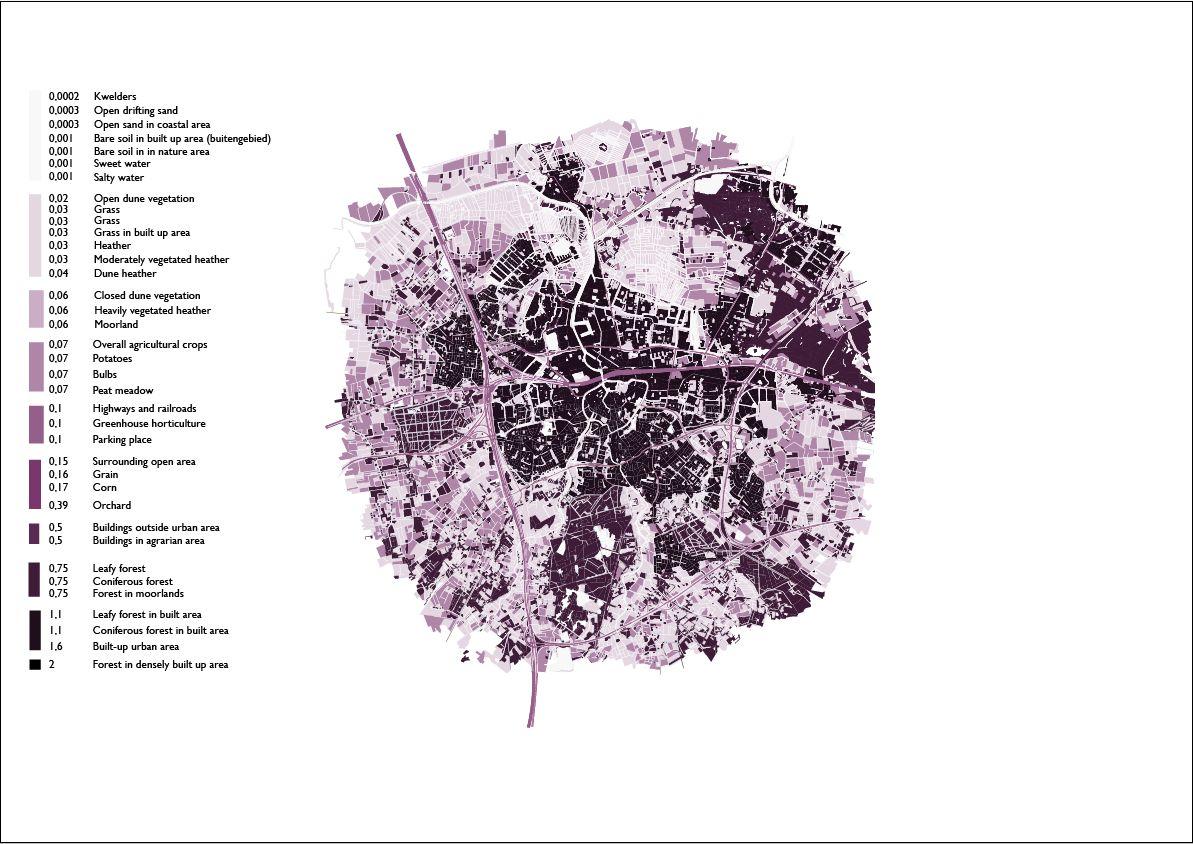
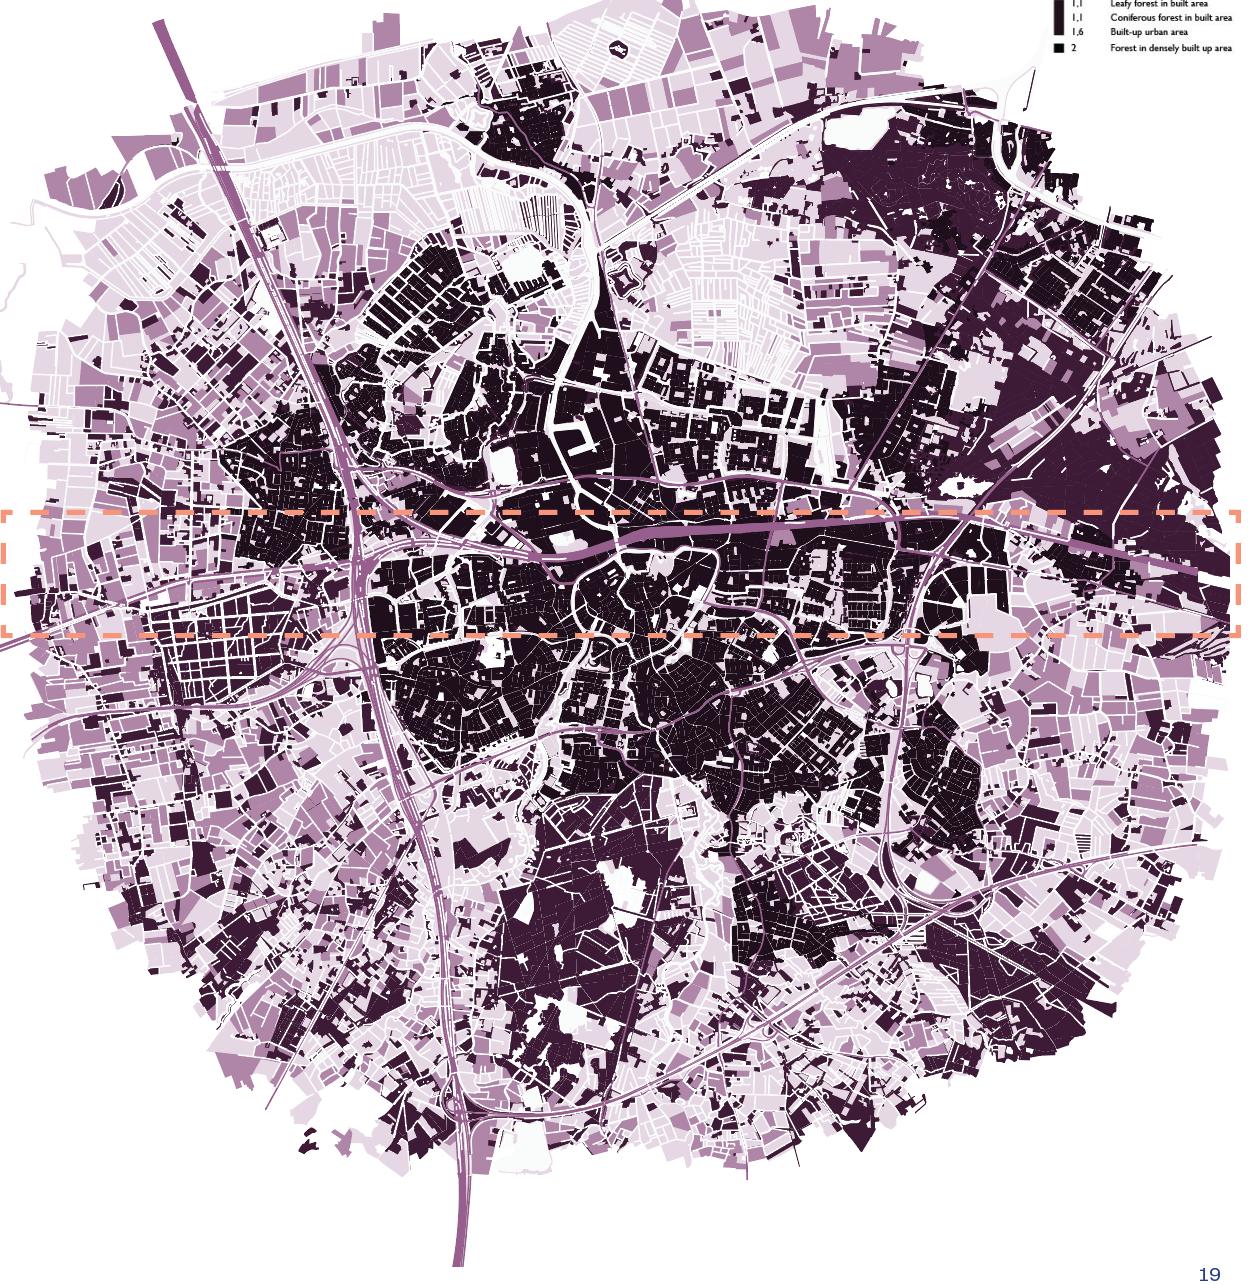
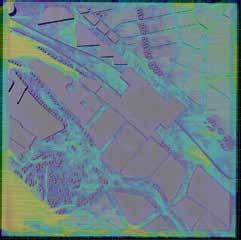
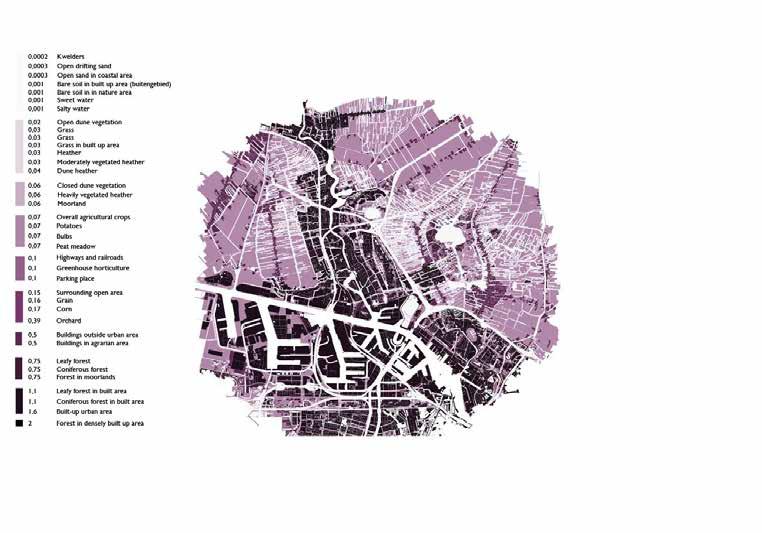
Roughness
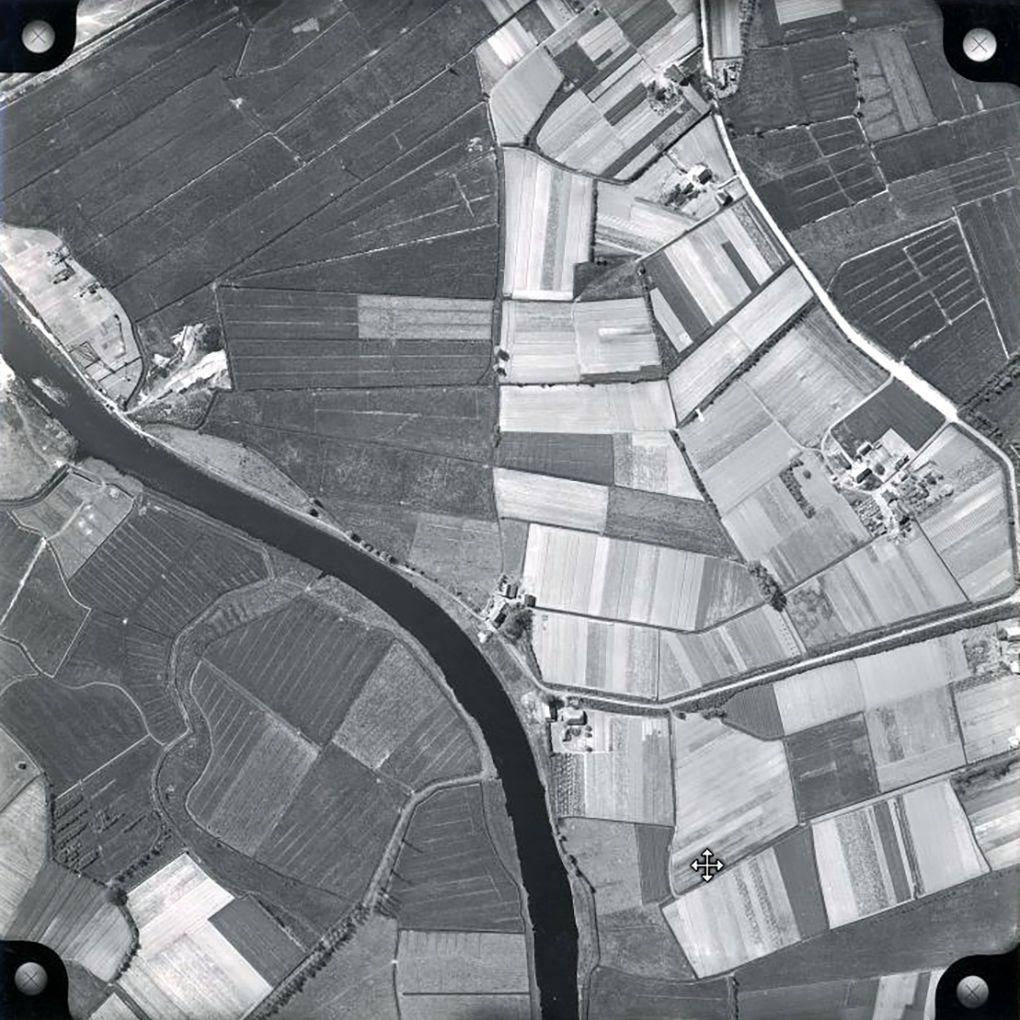
The composition of the roughness shows Breda's embeddedness in a mosaic of agricultural fields, grasslands and forests - towards the north more parcelated by ditches.
From West to East the railway line forms a major transportation corridor. Due to its width it has the opportunity to become the driver for the winds passing through the city. It's advantage also lies in a pollution free character (as opposed to the A16) which lies perpendicular to the wind direction.
A roughness map for wind is an essential tool in urban planning, meteorology, and wind engineering. It visualizes how the surface features of a landscape—like buildings, trees, and terrain—affect wind movement. These variations in roughness can either obstruct or channel air flows, influencing everything from cooling effects to air quality in a city. 13
By classifying land surfaces based on their roughness, we can better understand how different areas interact with the wind. Smooth surfaces like water or open fields allow winds to pass freely, which can help cool down hotter urban areas. On the other hand, dense urban areas and forests, with their higher roughness, slow wind speeds and create sheltered zones. This can be useful in regulating heat and providing more comfortable microclimates in certain parts of the city. Each surface type is assigned a roughness length, indicating the height and density of obstacles that impact wind flow. In Breda, for example, the mix of open areas like agricultural fields and grasslands
with more rugged areas such as forests and urban zones offers the potential to strategically manage wind flow. Open spaces allow winds to pass freely, helping cool down the city, while forests and built-up areas can slow the wind or create sheltered zones. 14
By carefully positioning green spaces and open areas within the urban fabric, planners can direct cooling winds into heat-prone areas, reduce wind speed where it’s less desirable (like along busy streets), and improve air quality overall. The railway line, running from west to east, could act as a natural wind corridor, channeling prevailing breezes through the city, helping to prevent the accumulation of heat and enhancing ventilation across Breda’s urban areas.
Academie van Bouwkunst Amsterdam 23 | 24 | Rachel Borovska
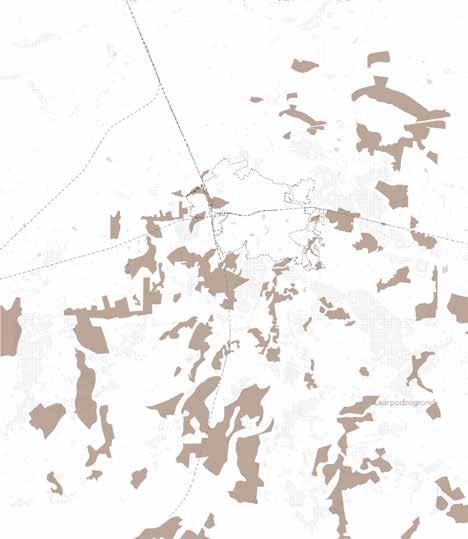
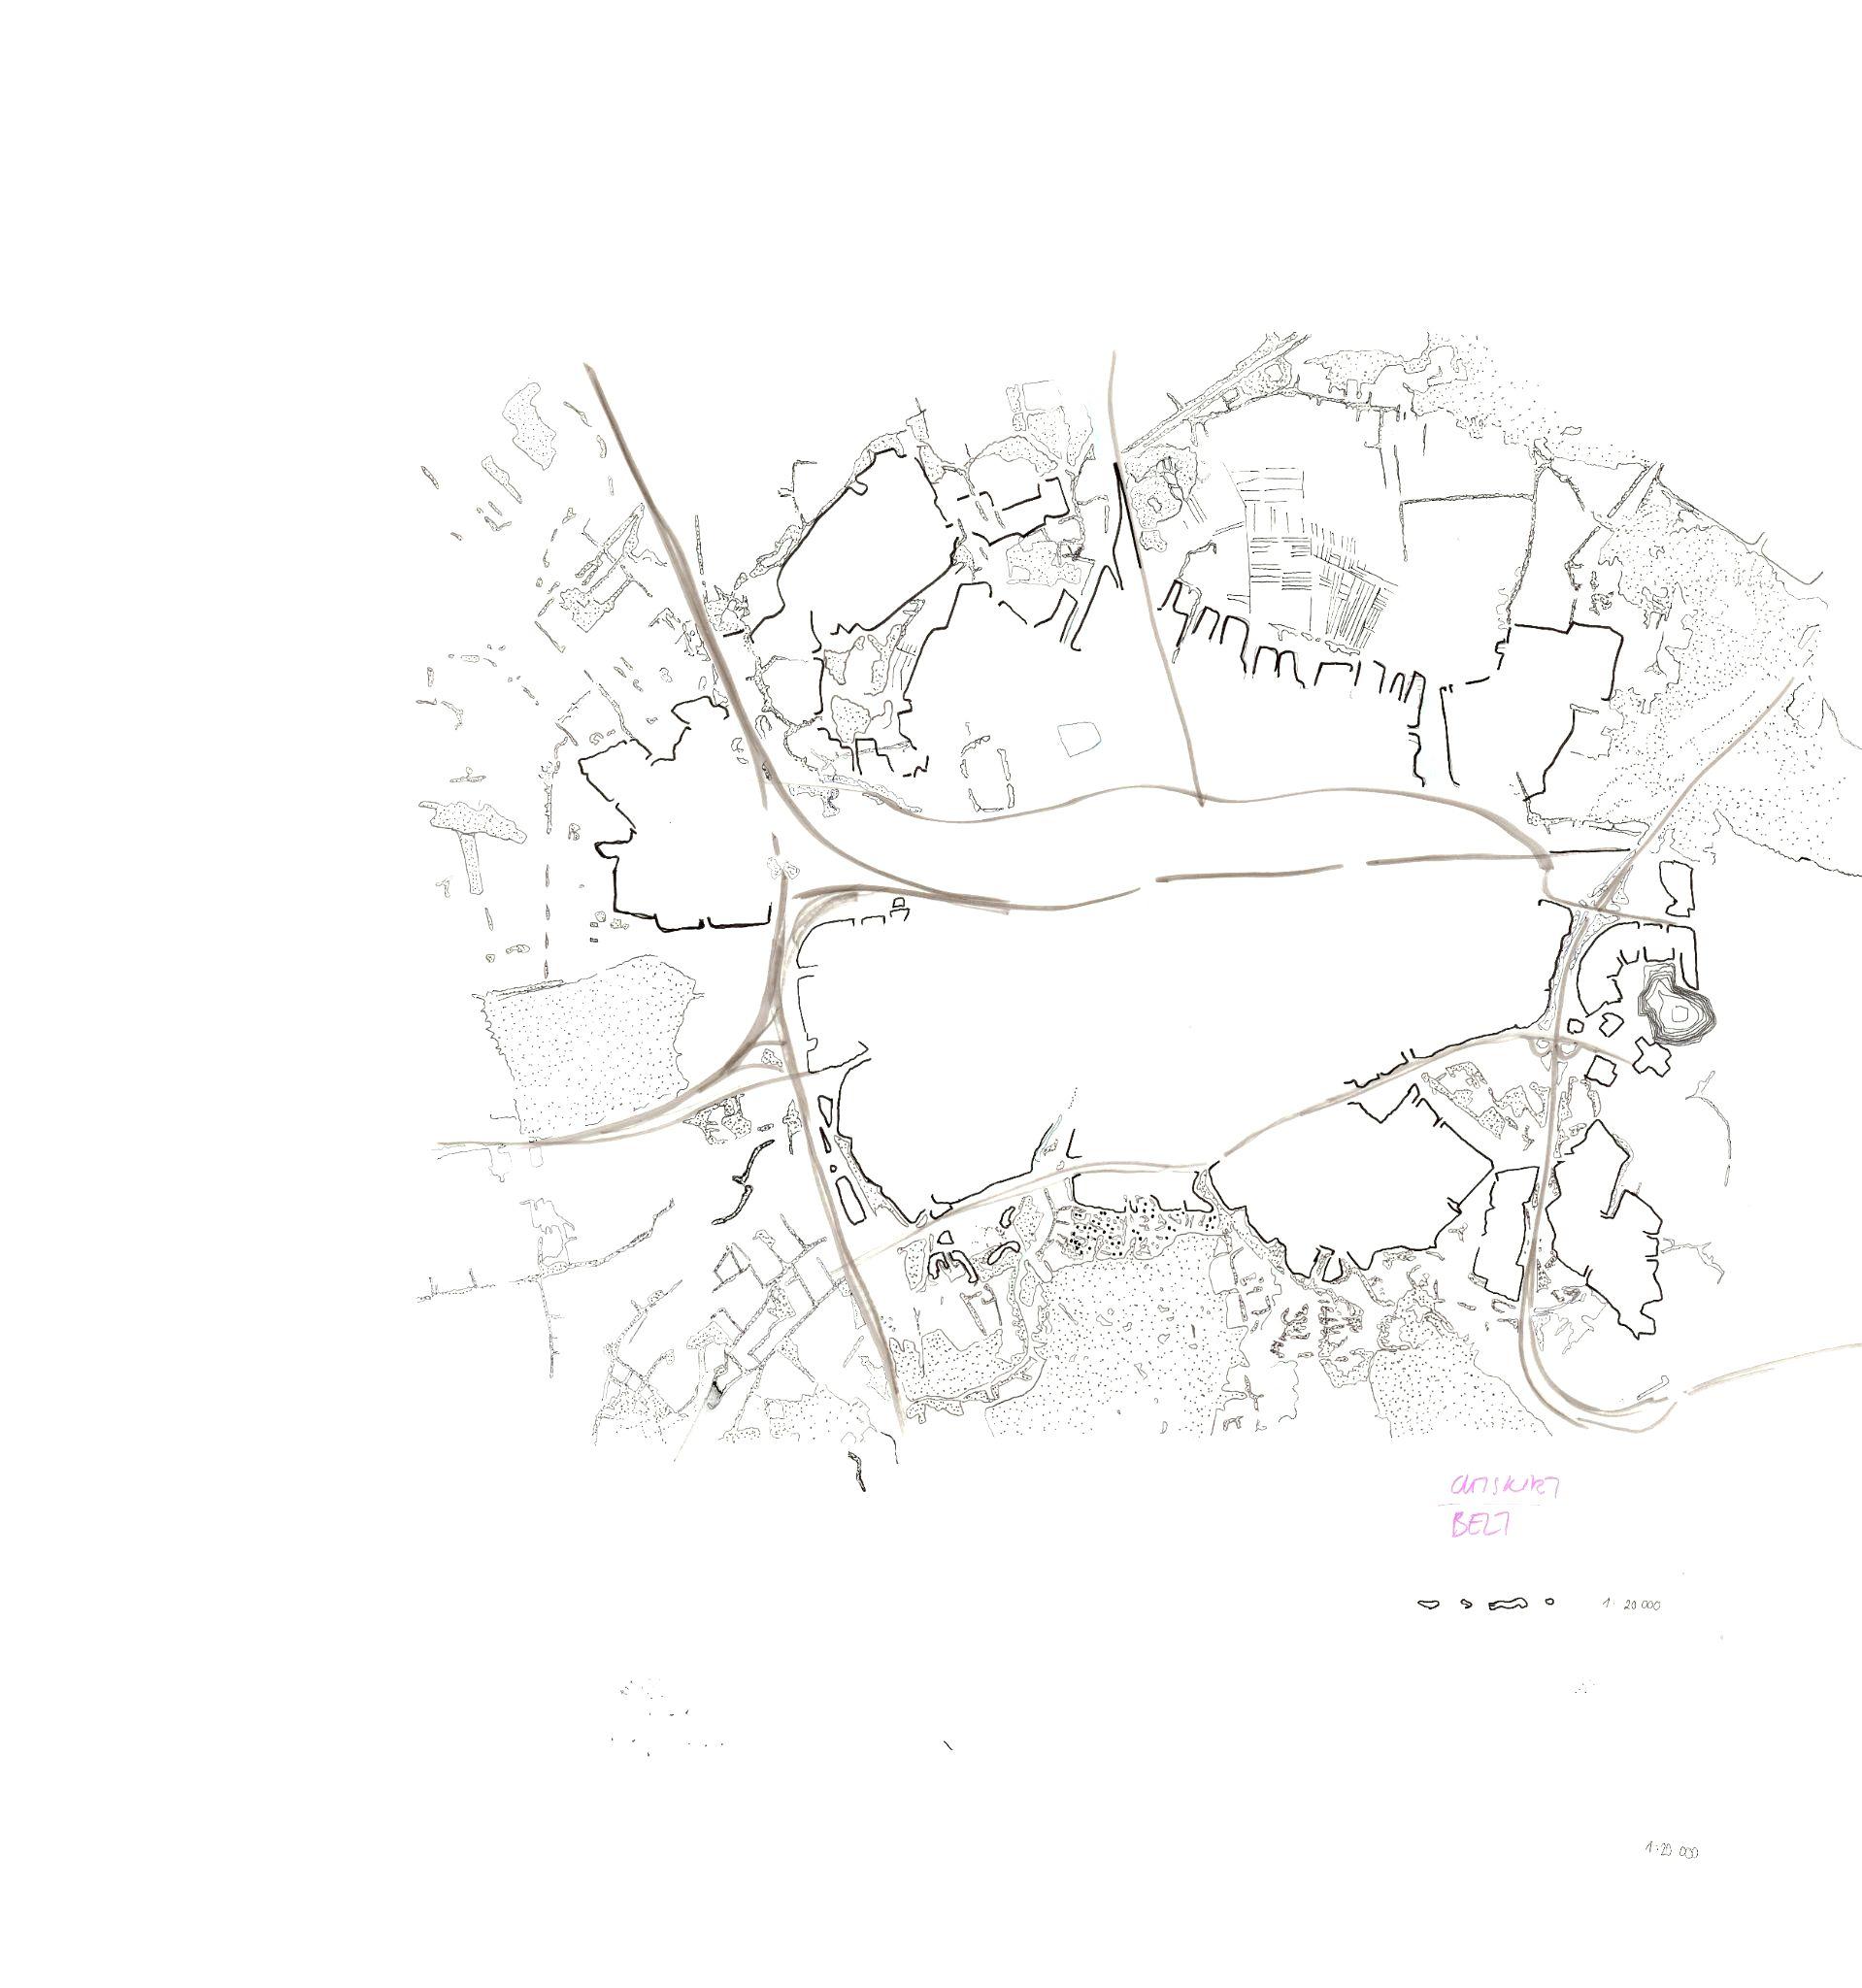
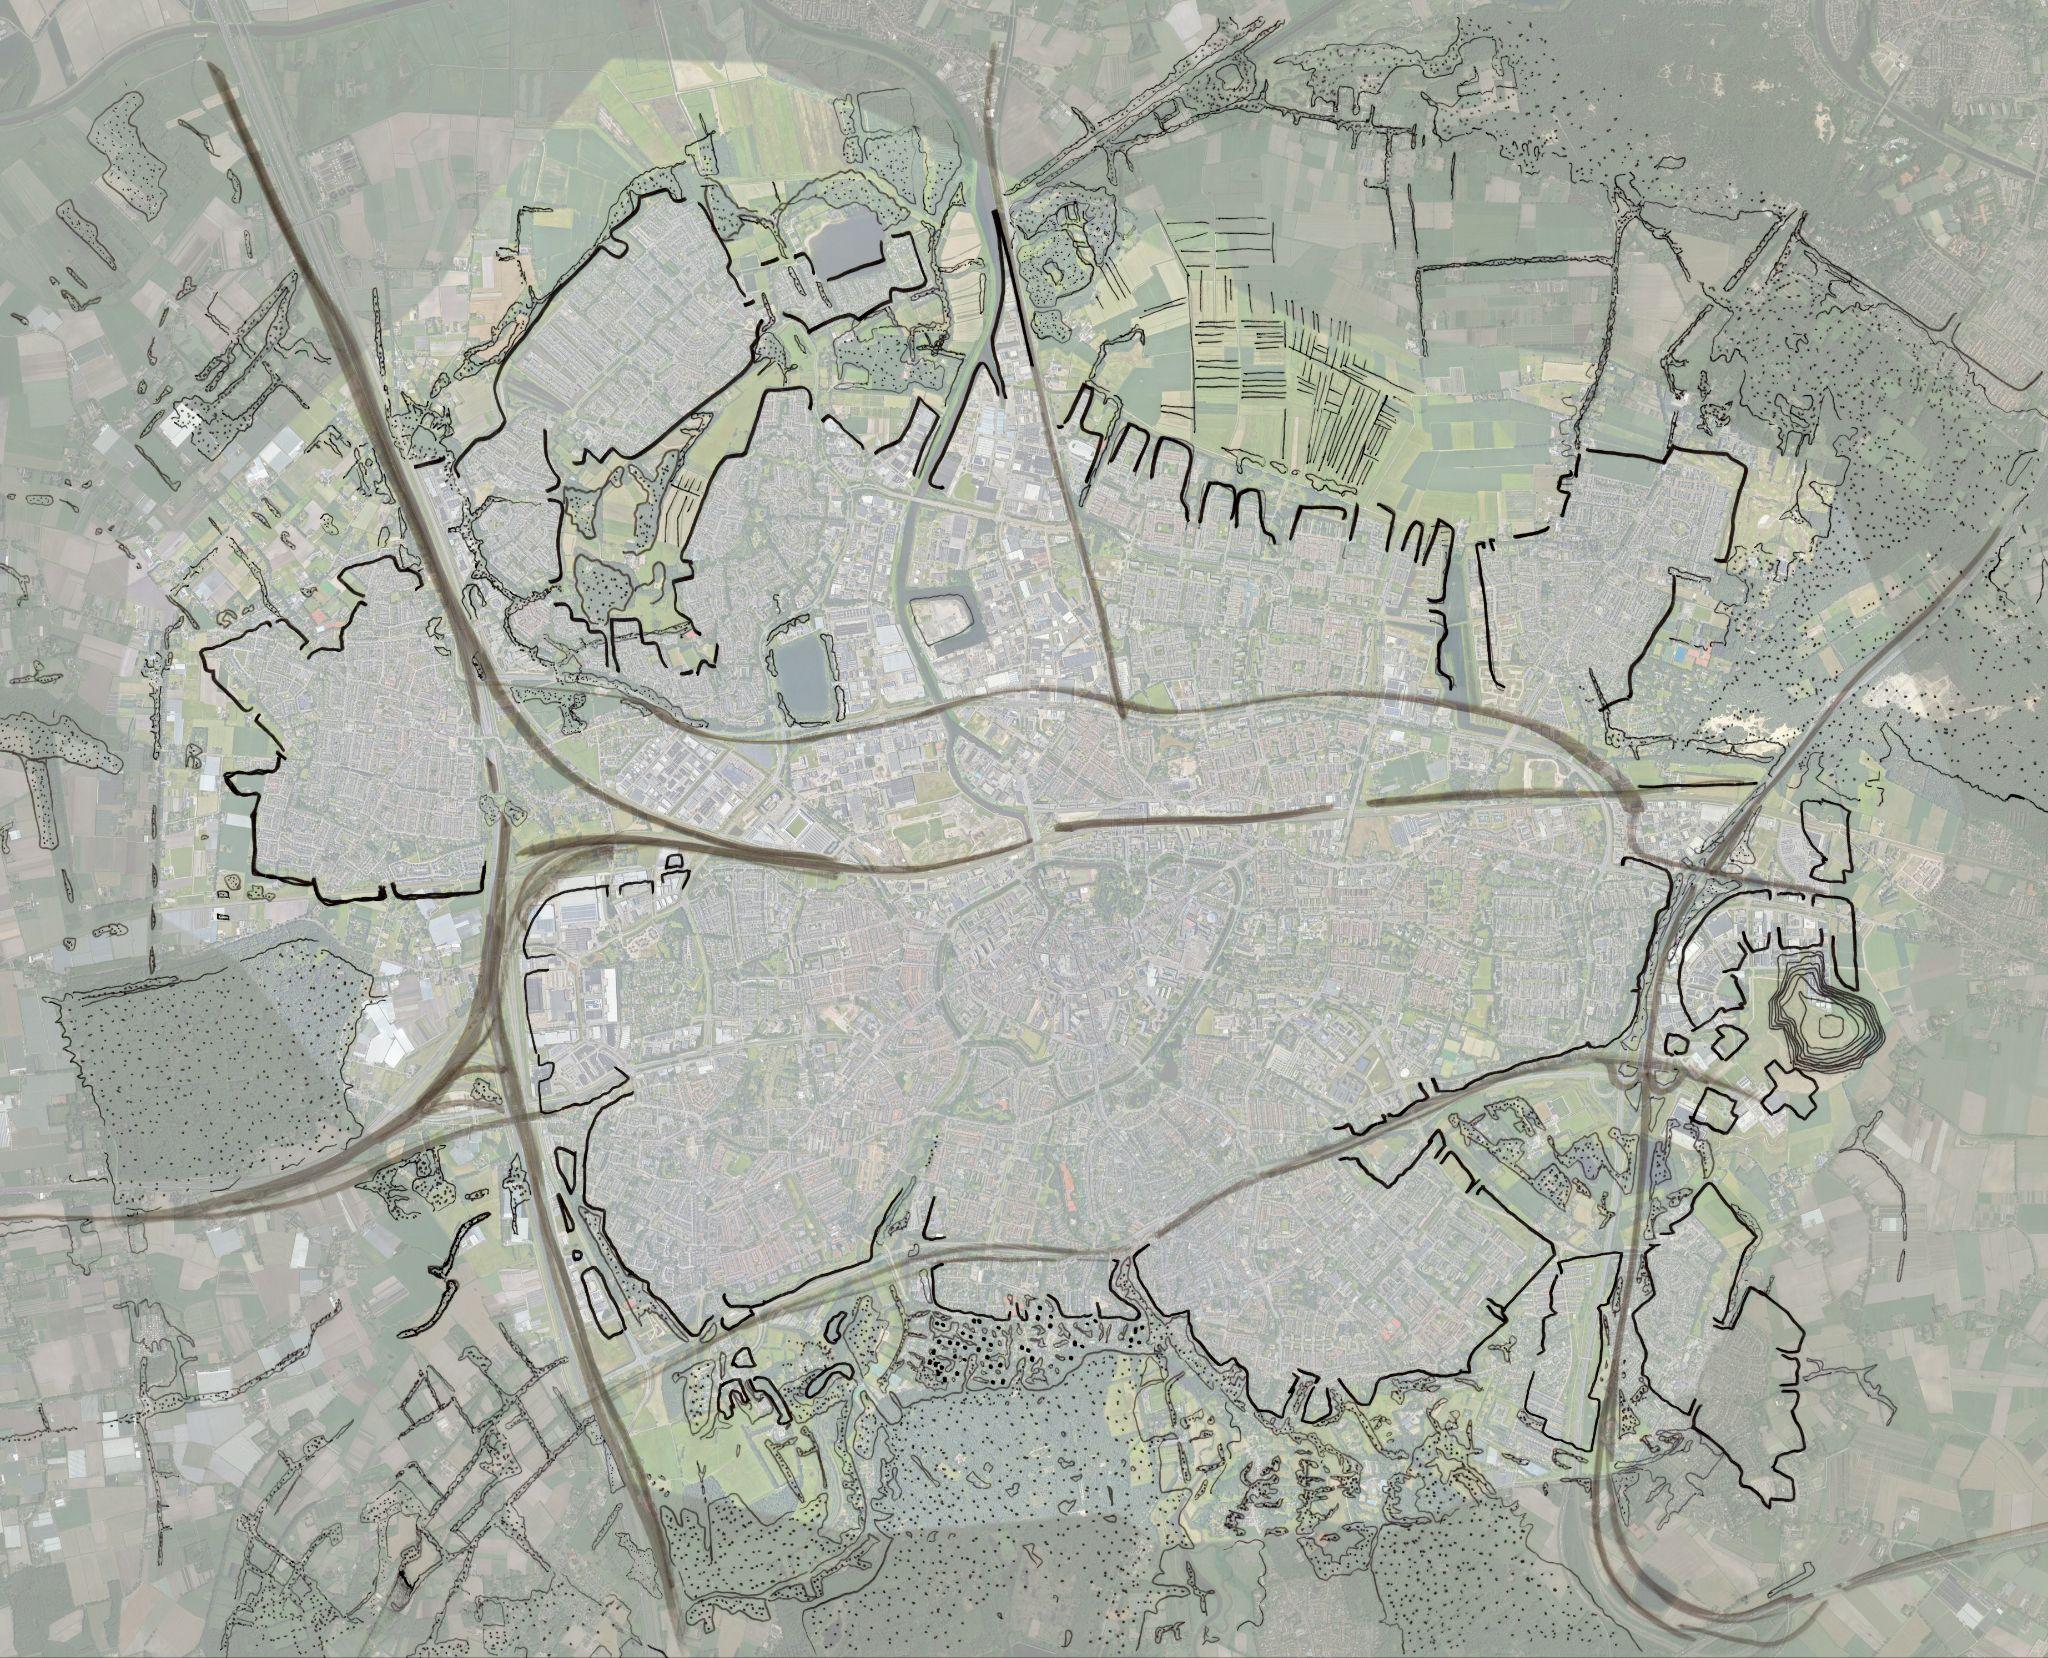
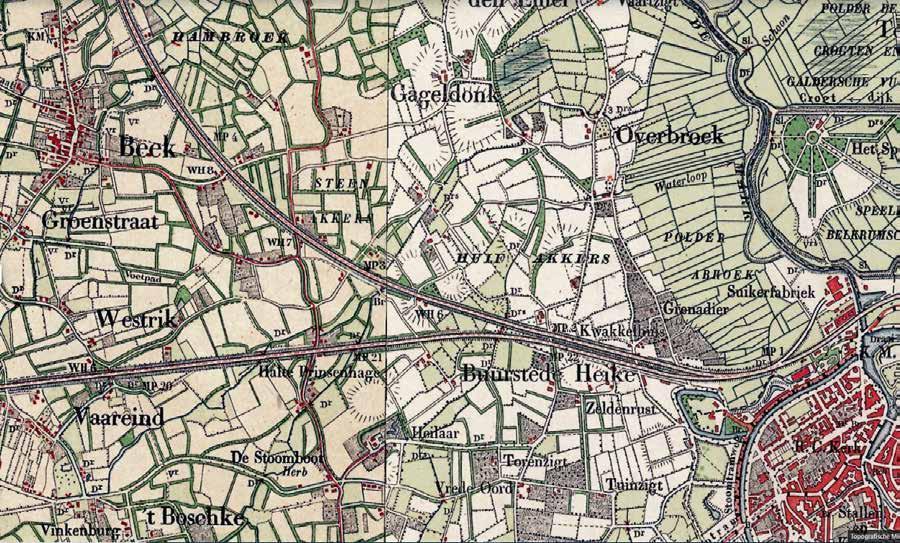
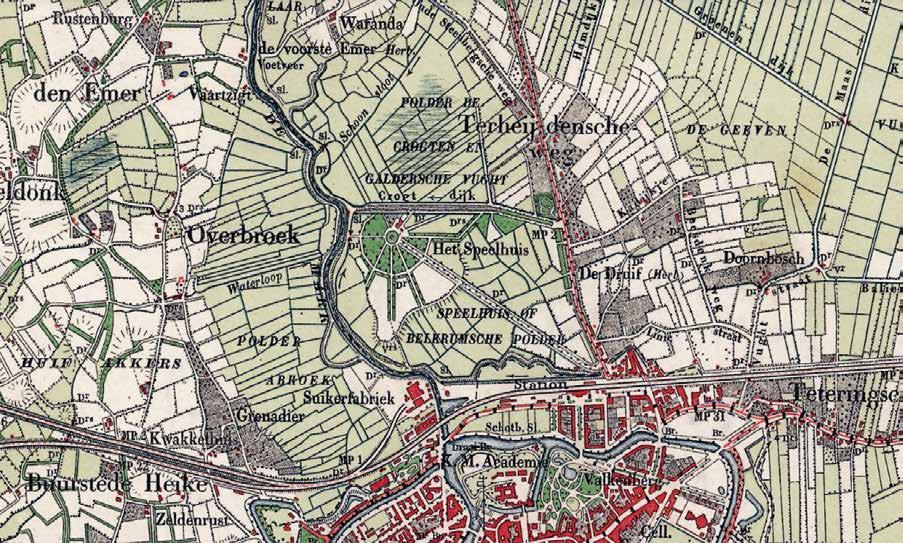
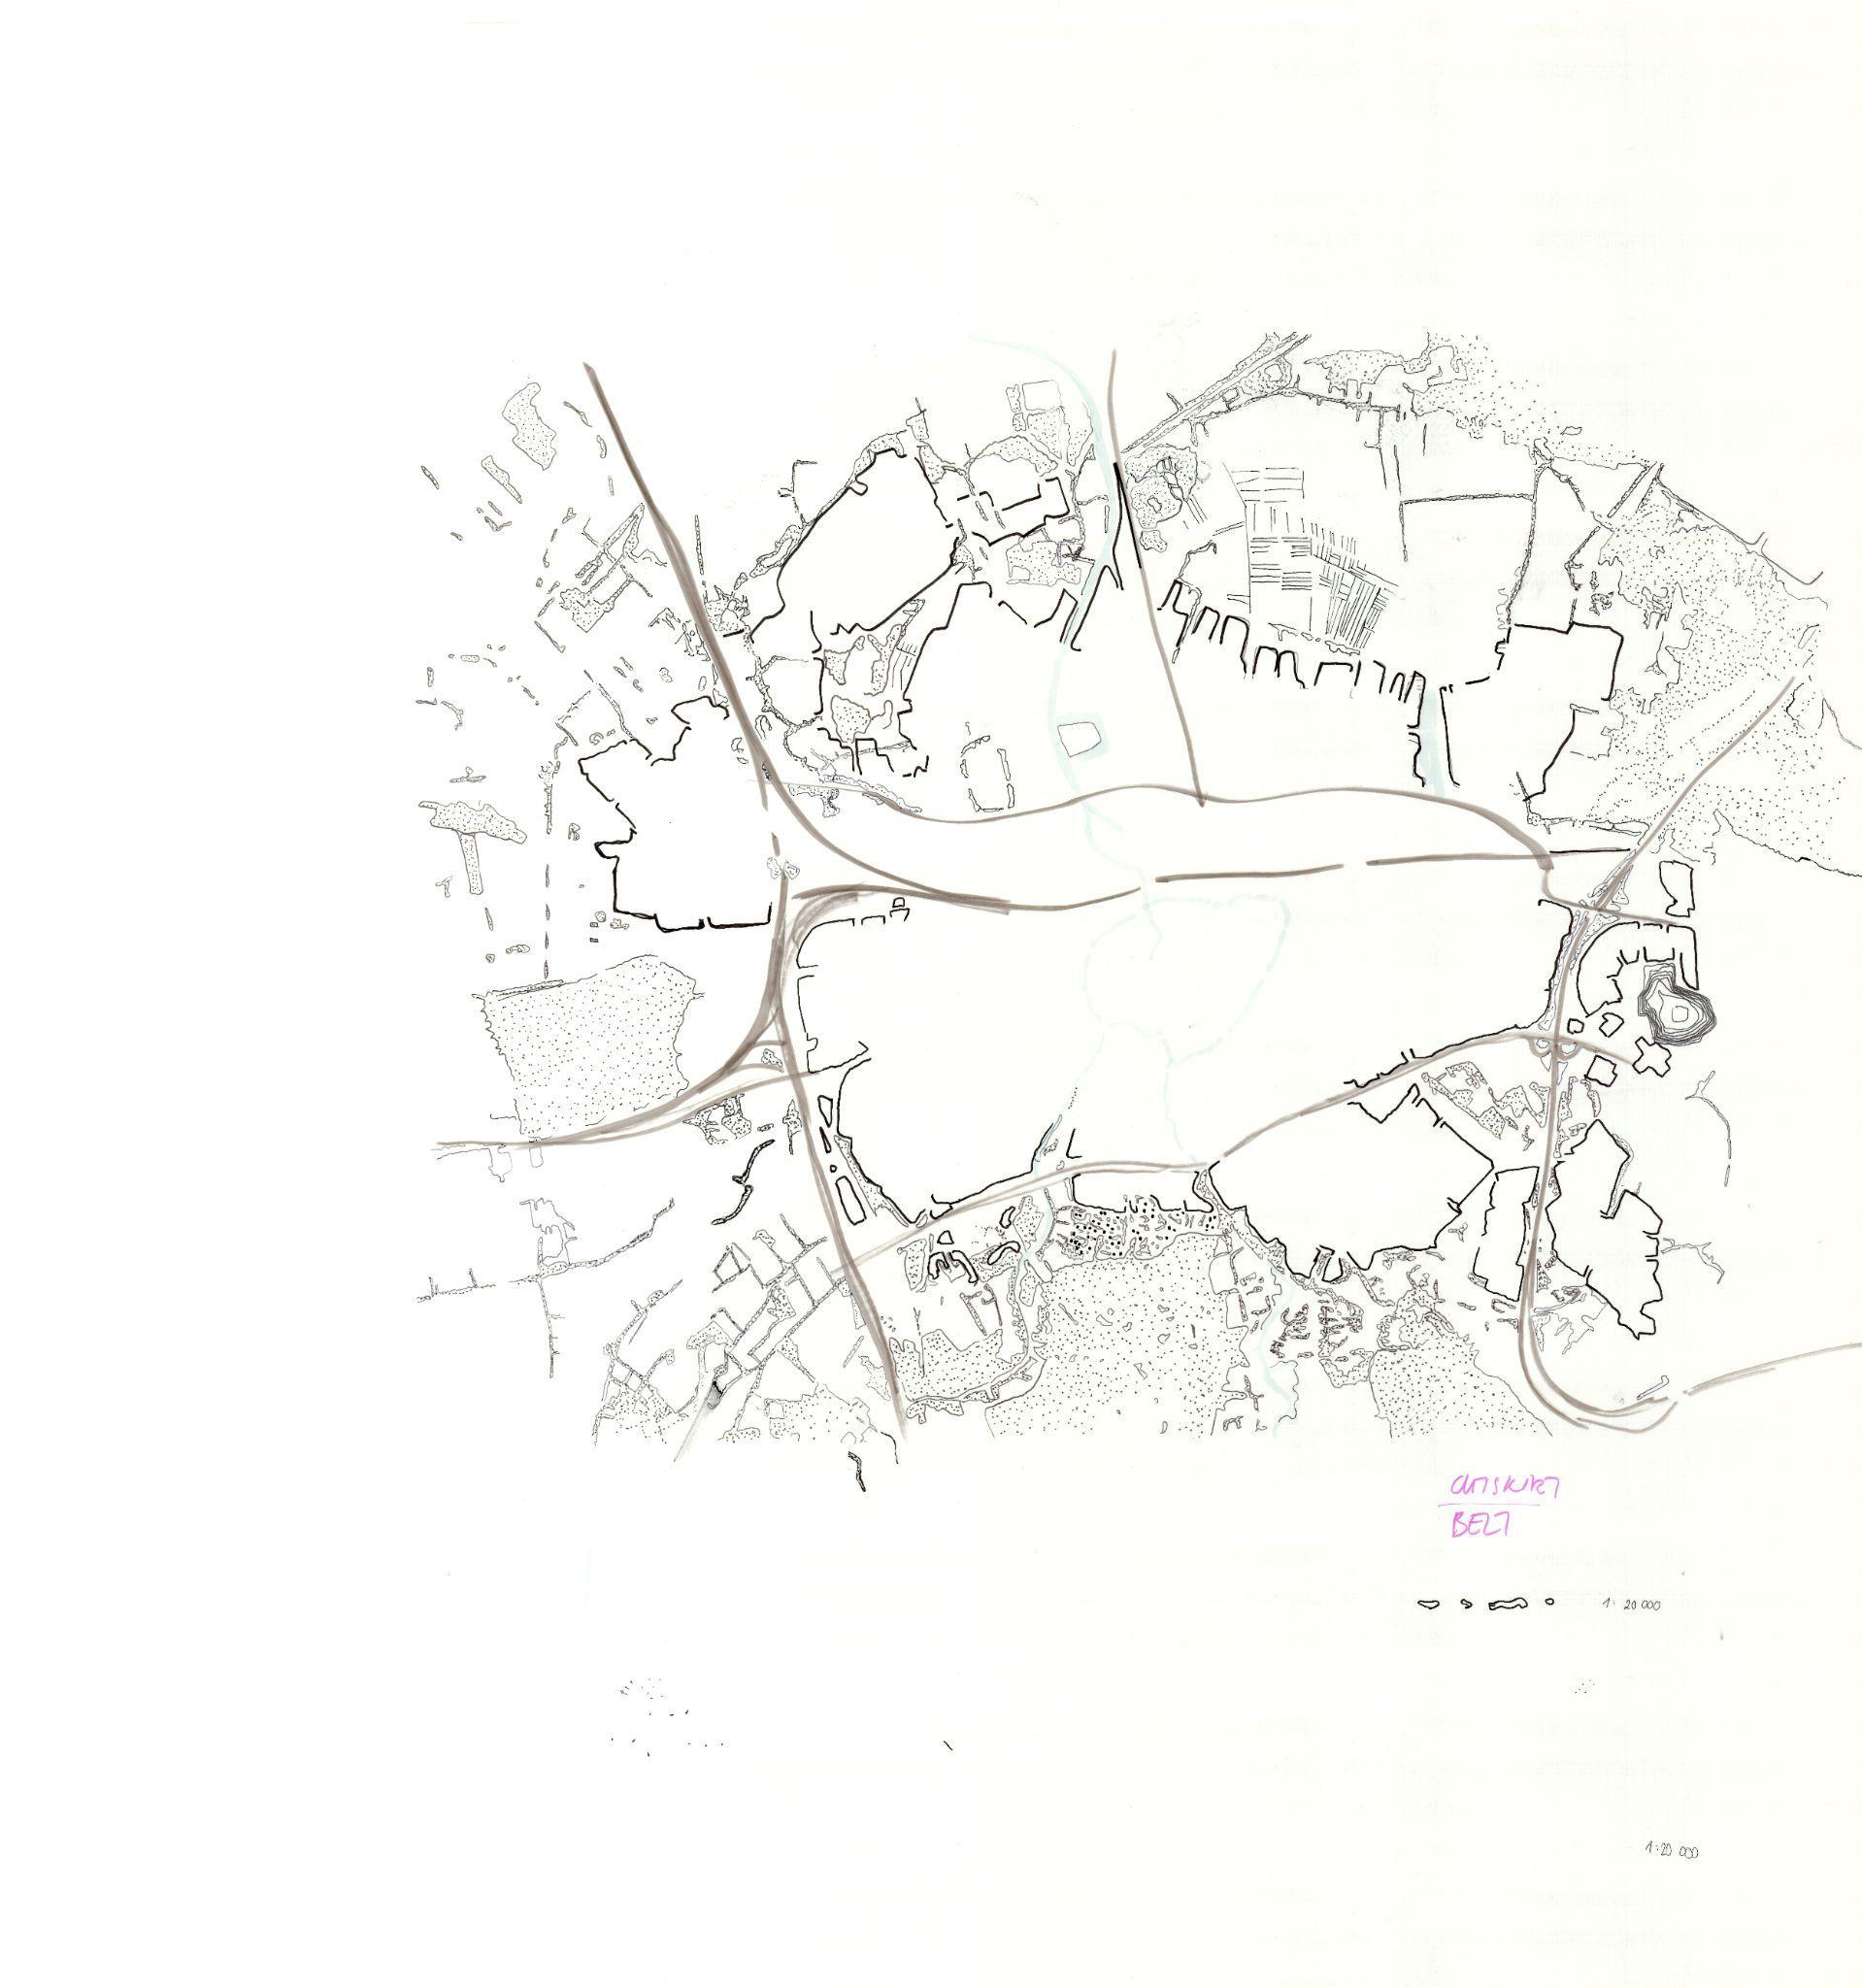
The skirt of Breda
The skirt of Breda is surrounded by a landscape rich in cultural-historical heritage, featuring elements like classical hedgerows that divide agricultural fields, dense patches of vegetation, reclaimed wetlands and polders, forests, wetland brook habitats, and reforested sandy heath landscapes. These historical landscape features also play a vital role in shaping the local wind patterns. Hedgerows, for example, act as natural windbreaks, reducing wind speed and creating sheltered microclimates for both agriculture and biodiversity. Forests and
landscape belonging to important landscape dividing agricultural fields, reclaimed wetlands habitats and sandy
wetlands can influence wind direction and airflow, often slowing down winds or redirecting them, while areas like sandy heath landscapes can allow for more open wind flows, helping to regulate temperature and enhance ventilation. Understanding how these historical landscapes interact with wind can offer valuable insights for urban planning, helping to preserve or enhance natural ventilation corridors and manage the urban heat island effect.
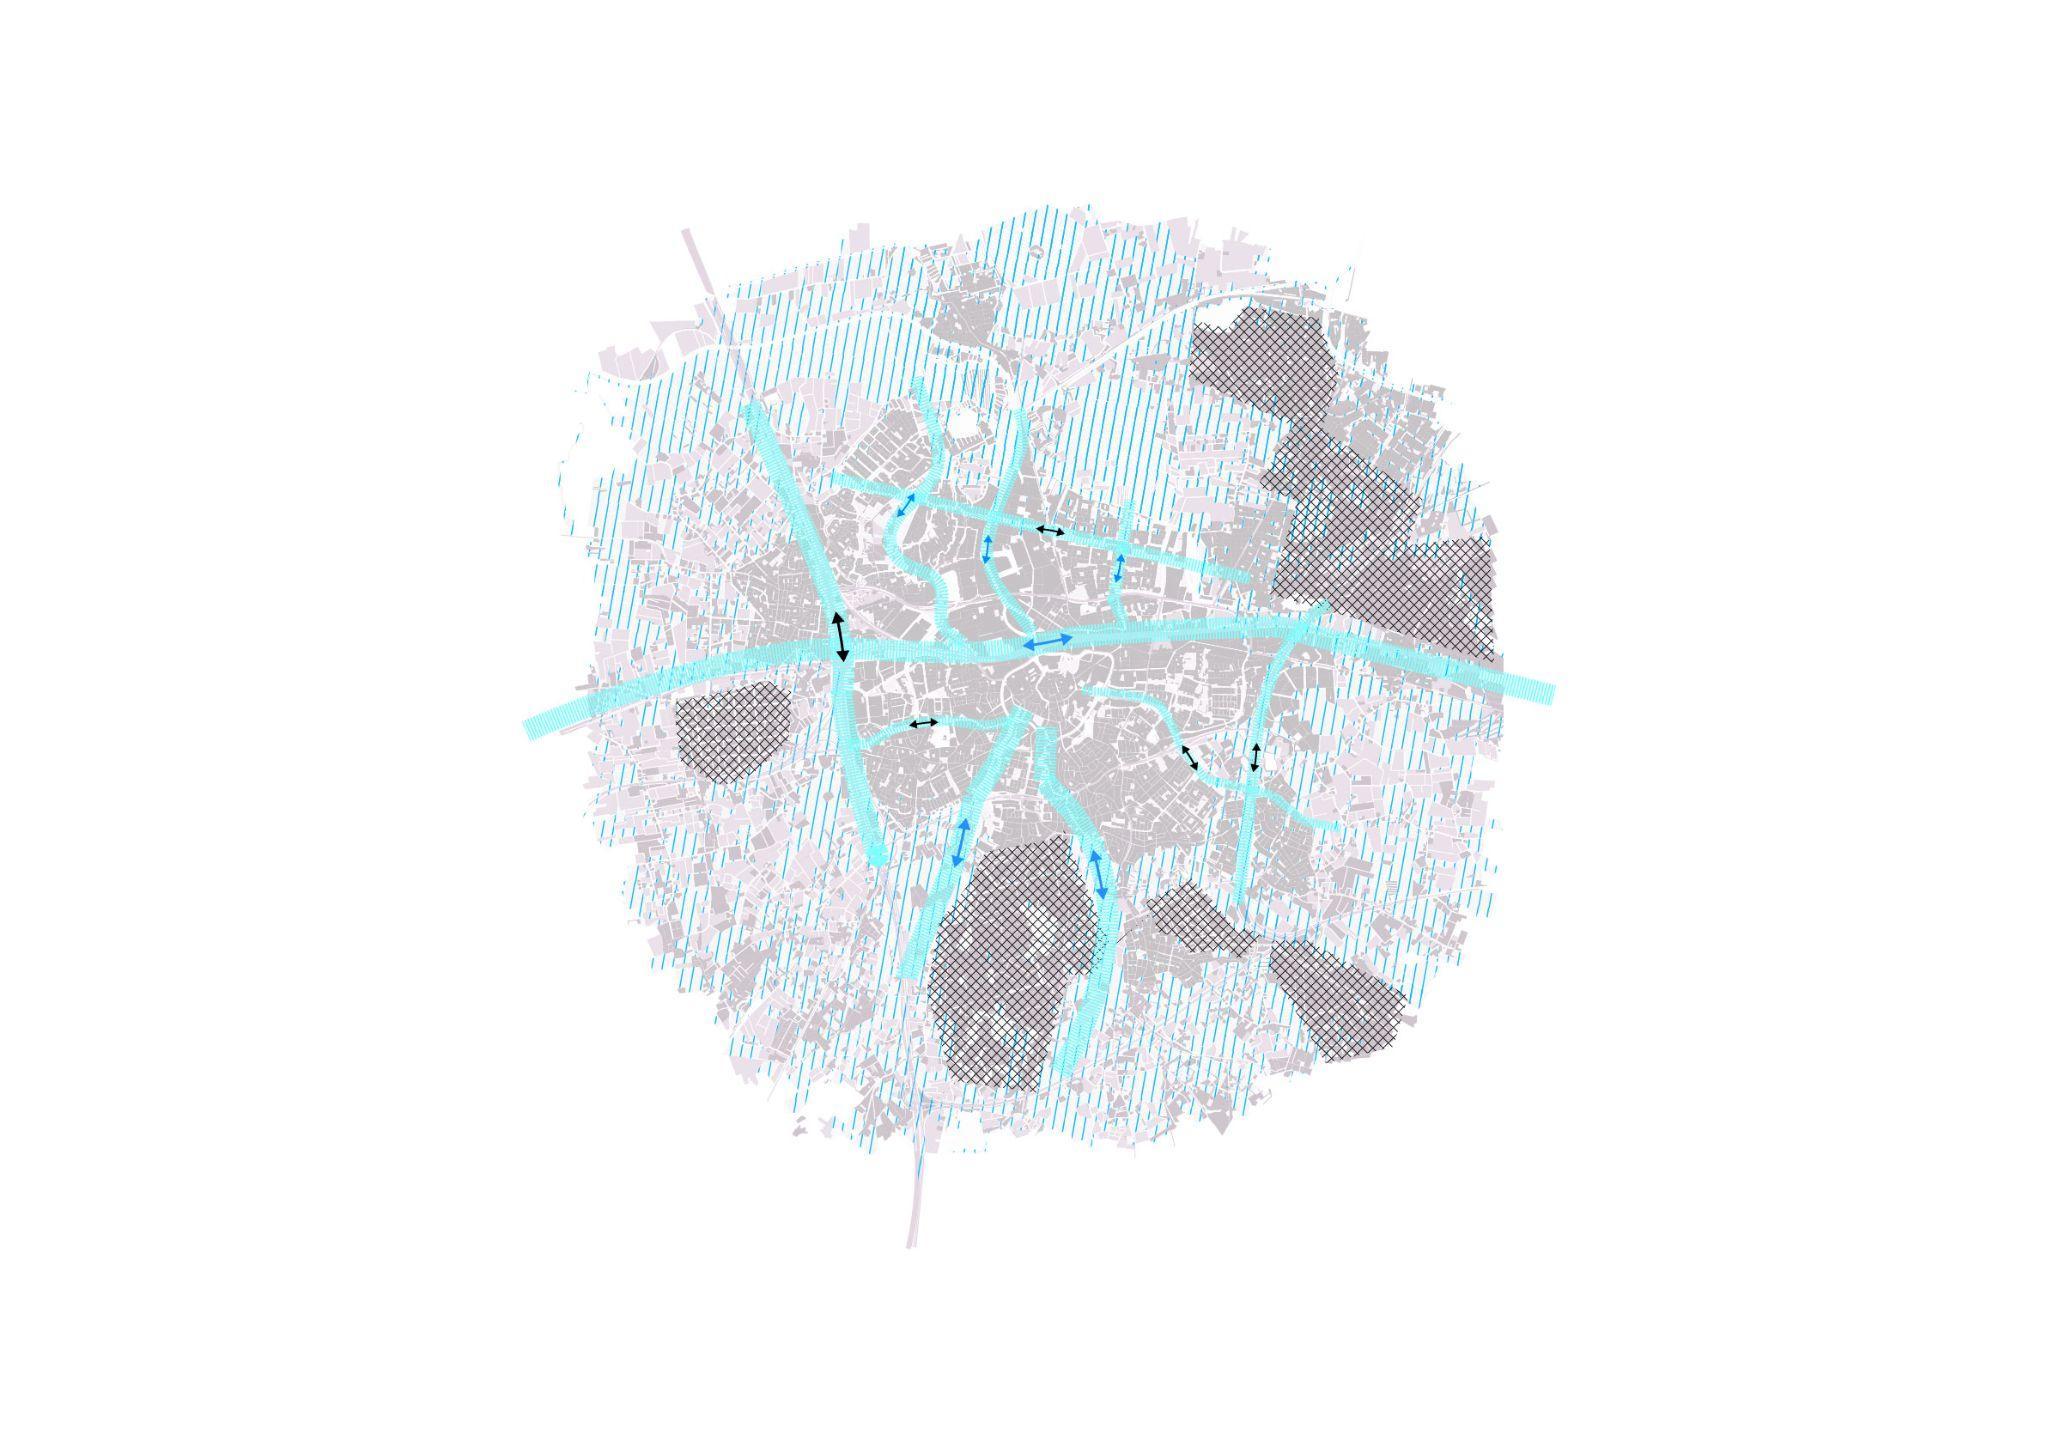
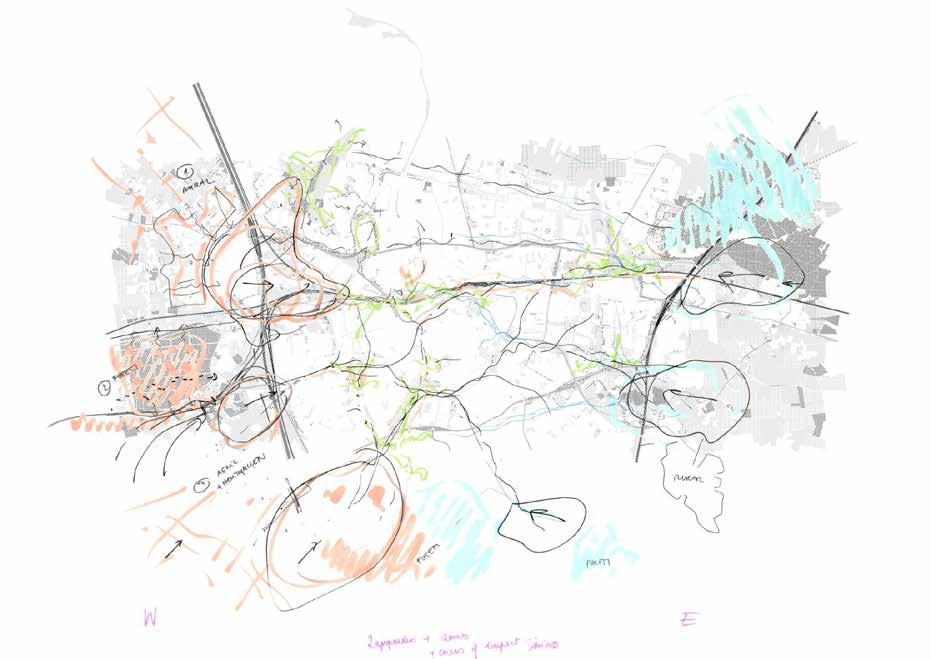
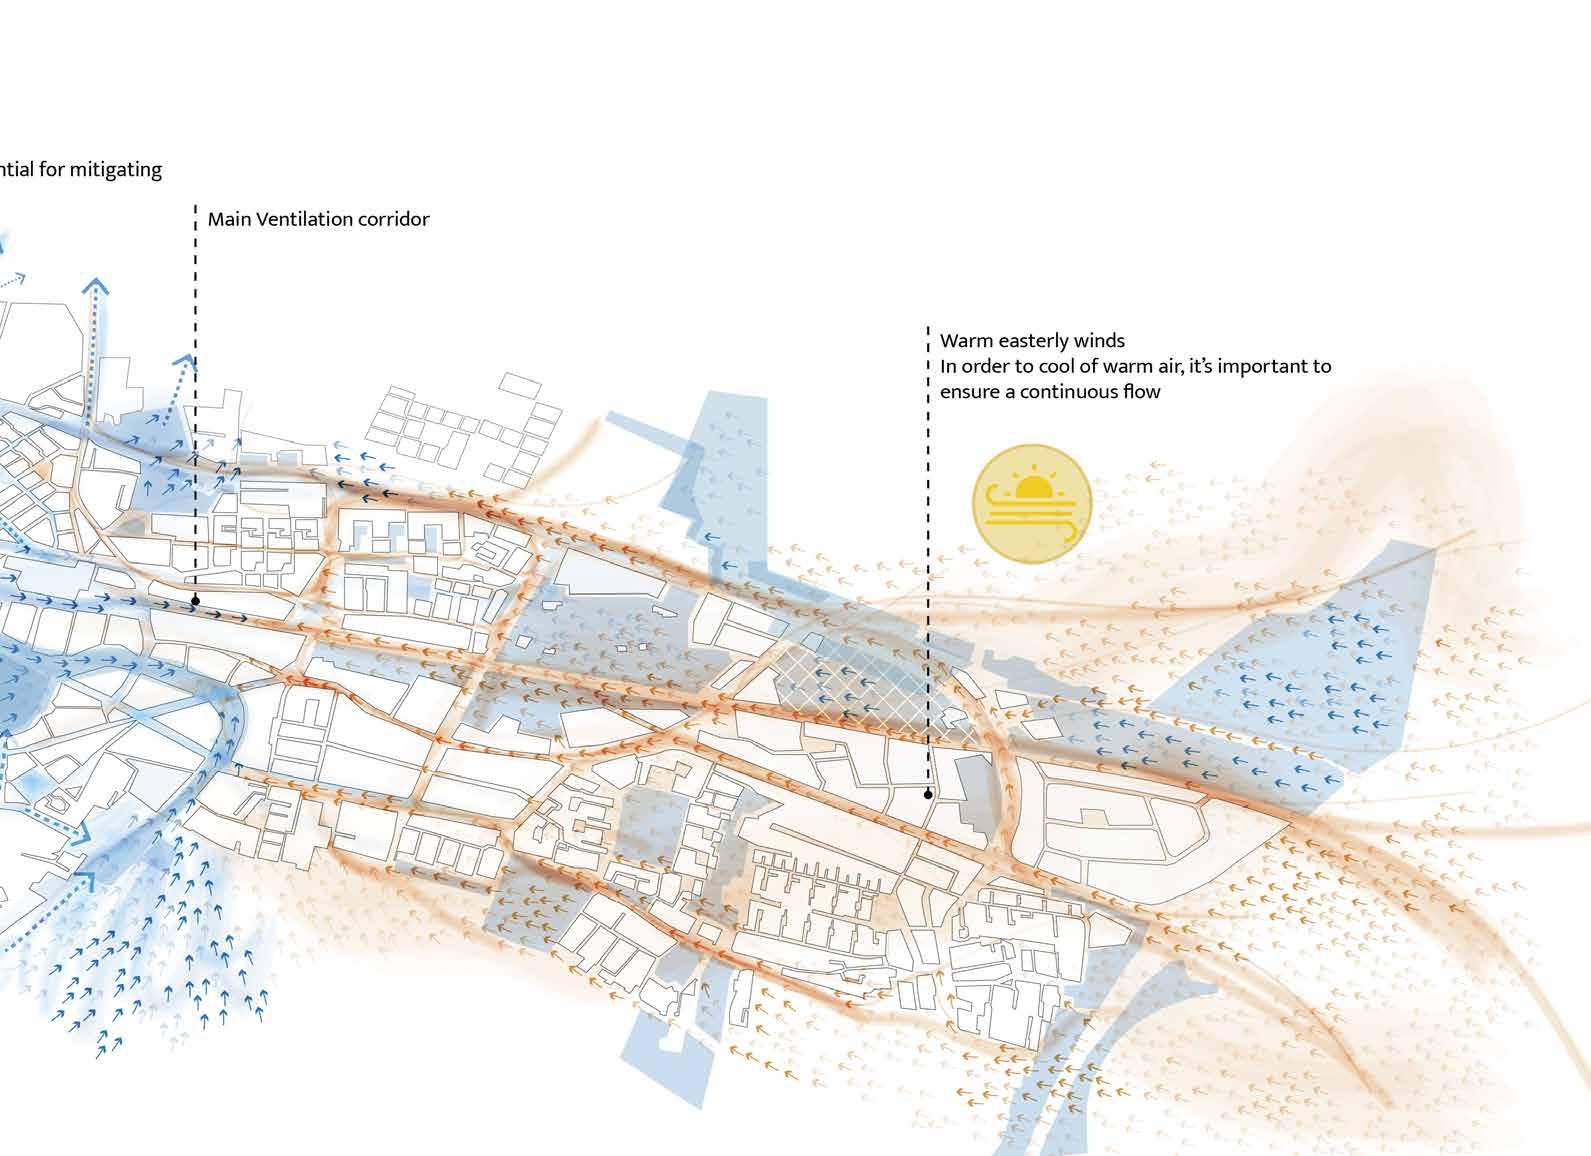
To design cities that are resilient to heat and climate change, it’s essential to consider ventilation corridors—natural or man-made pathways that allow air to flow freely through urban areas. These can be rivers, roads, railways, or even green spaces that help regulate temperature, improve air quality, and provide relief from urban heat islands. Identifying ventilation on a city scale means focusing on long, uninterrupted lines.
As cities grow and densify, preserving and integrating these ventilation corridors becomes increasingly essential for balancing urban development with the need for natural cooling.
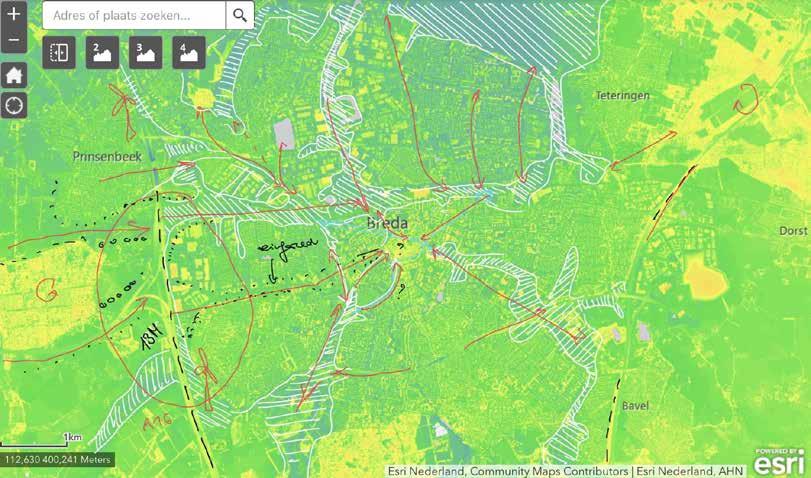
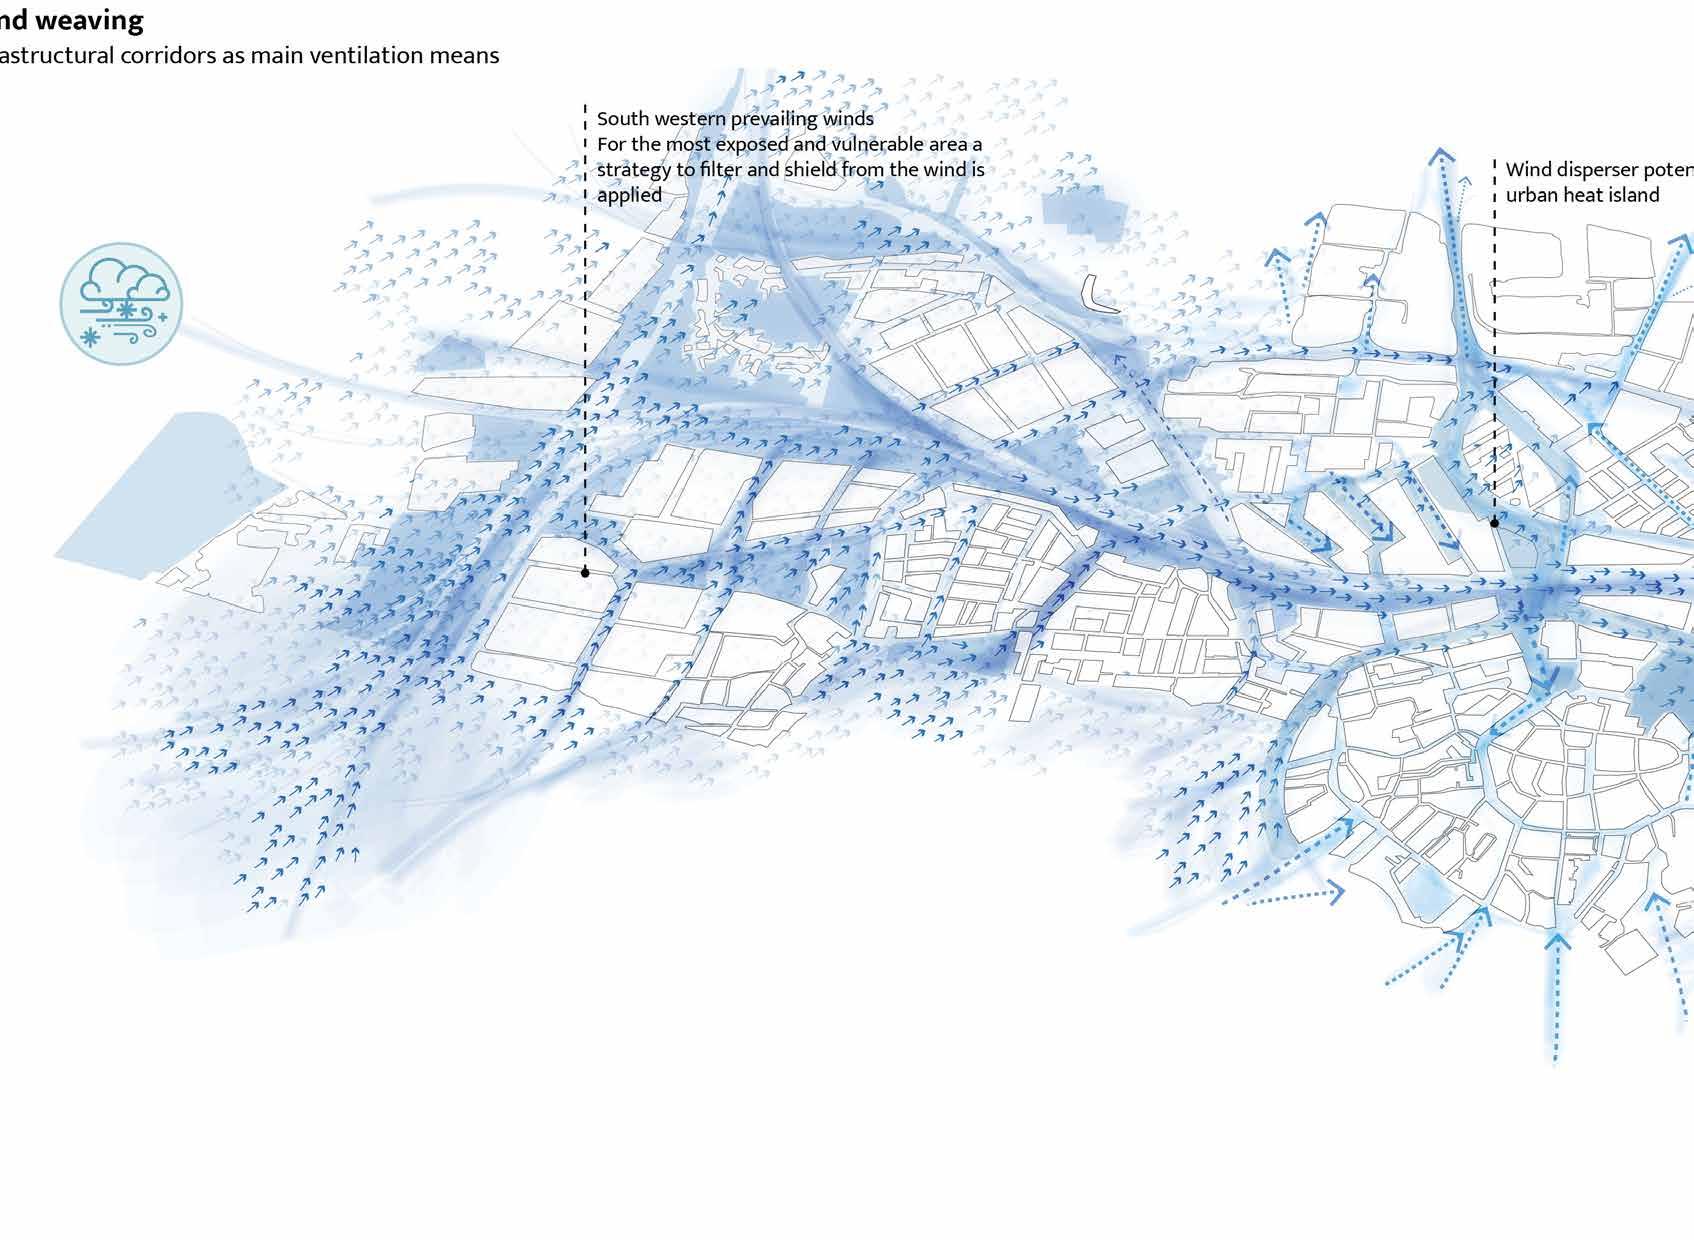
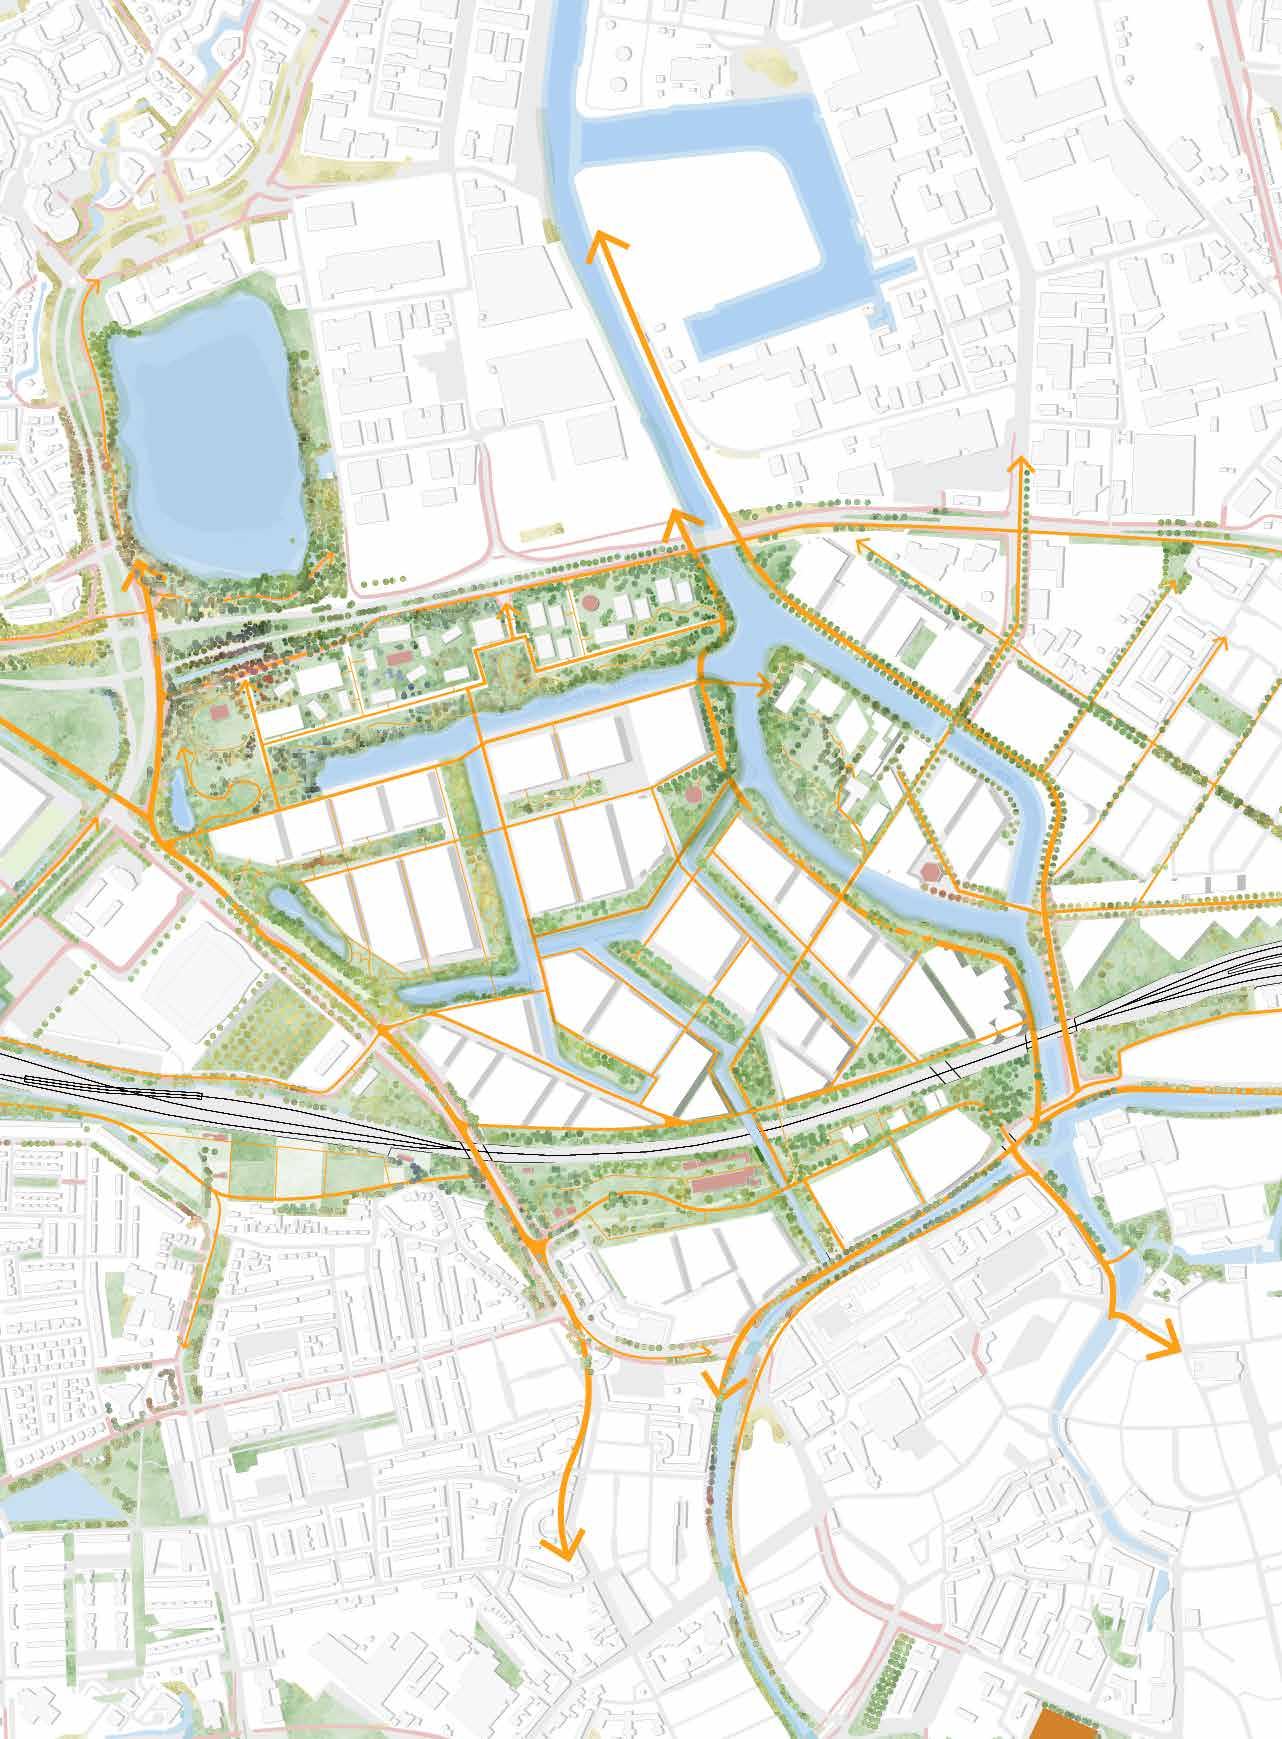
Large-scale interventions are often more effective in ventilating cities. In Breda, natural and infrastructural corridors can be leveraged to guide air movement through urban areas prone to overheating. Streams flowing through ‘hot zones’—such as the brooks leading into the city—along with major infrastructure like roads, railways, and underutilized industrial sites, offer opportunities to enhance urban ventilation.
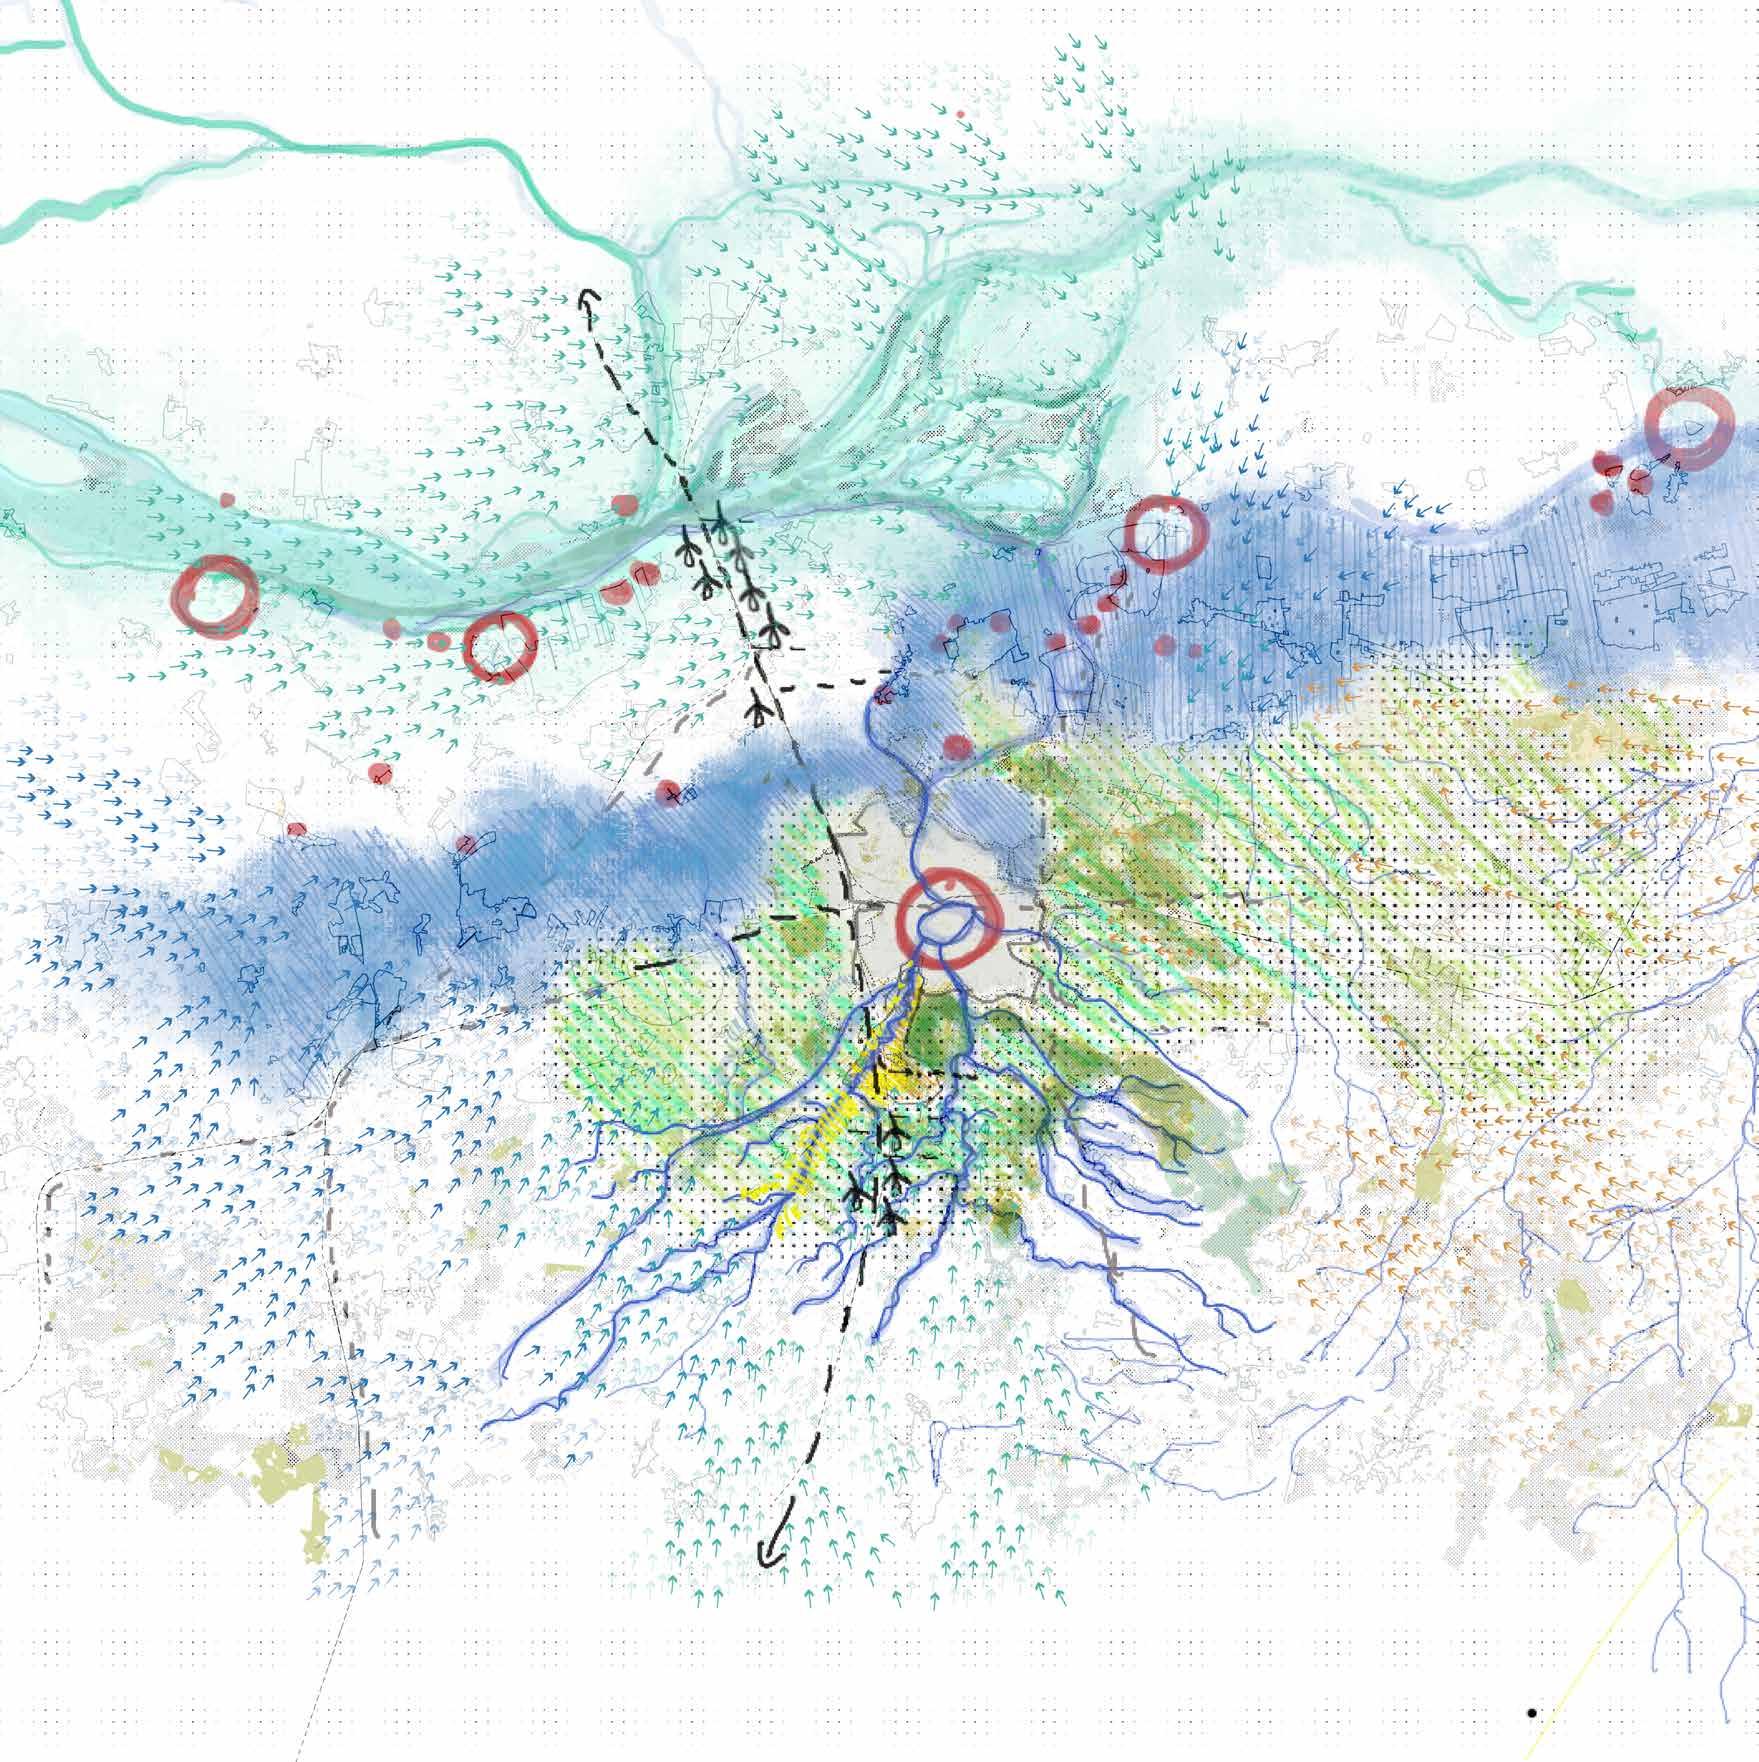
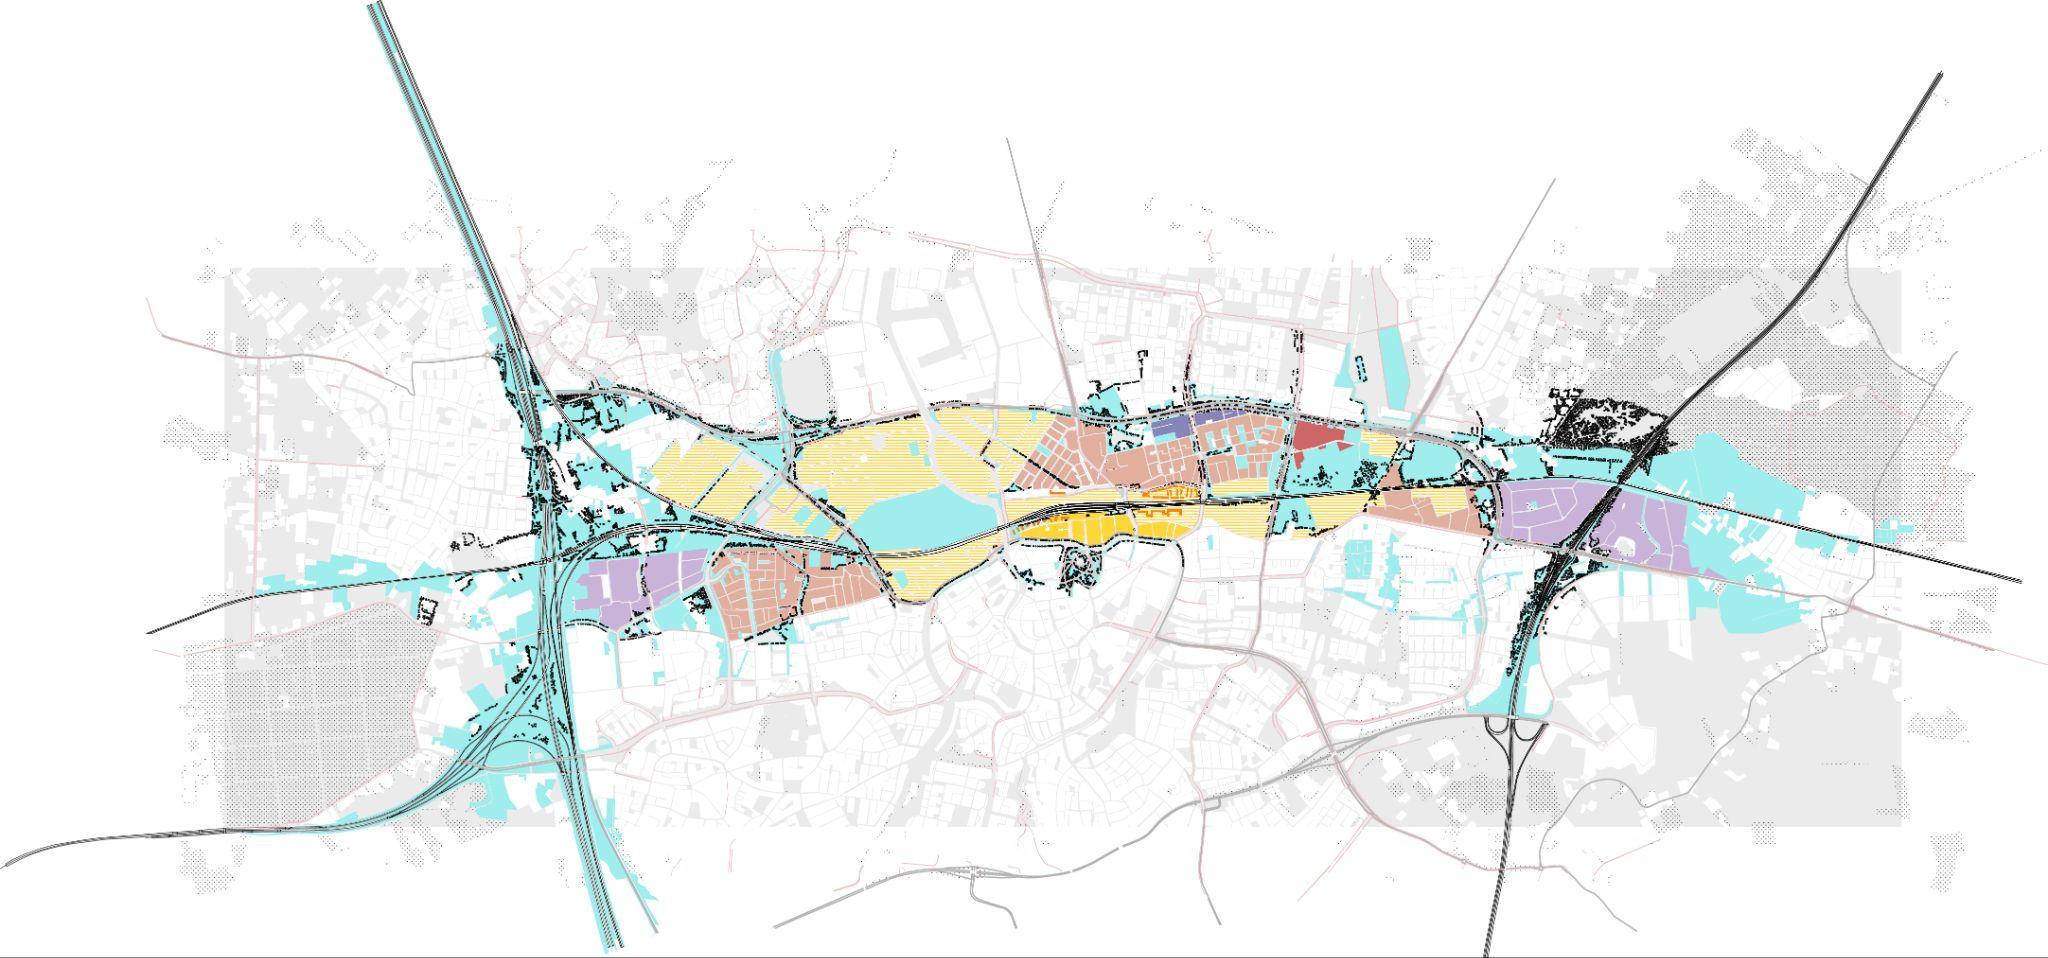
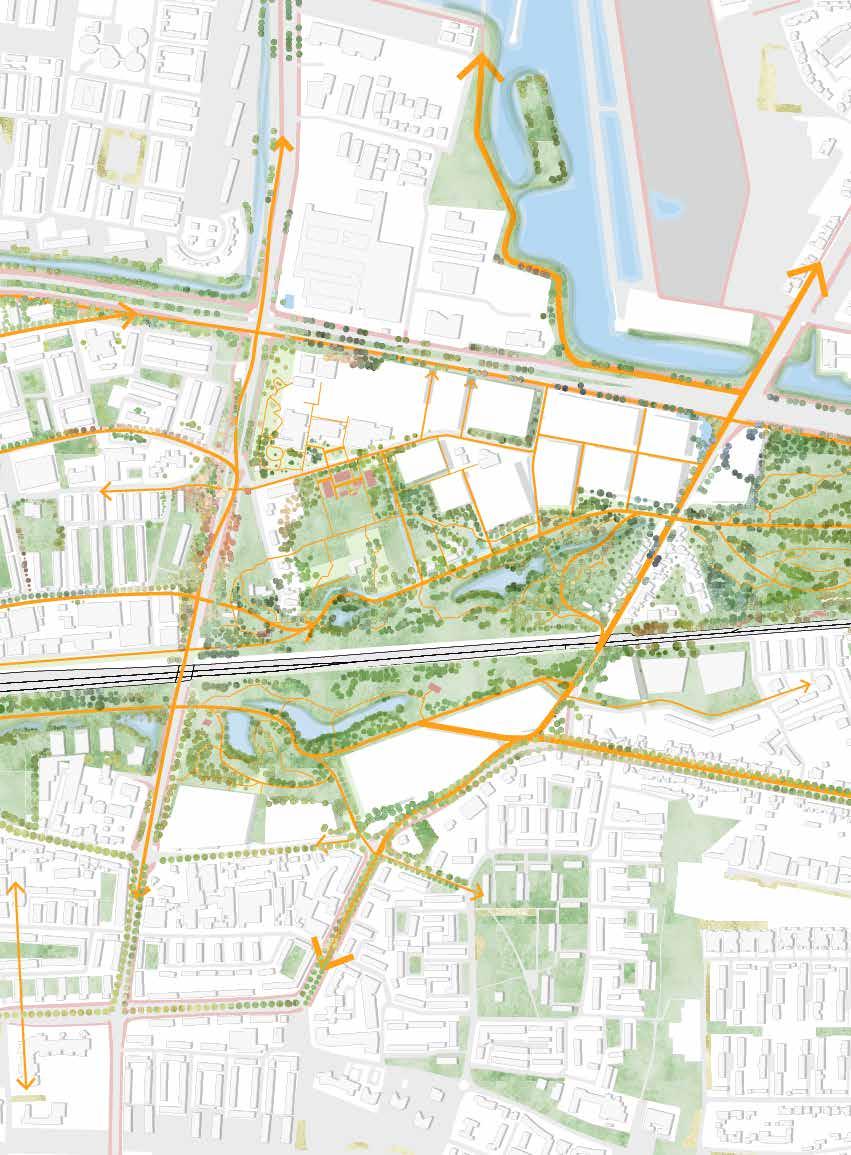
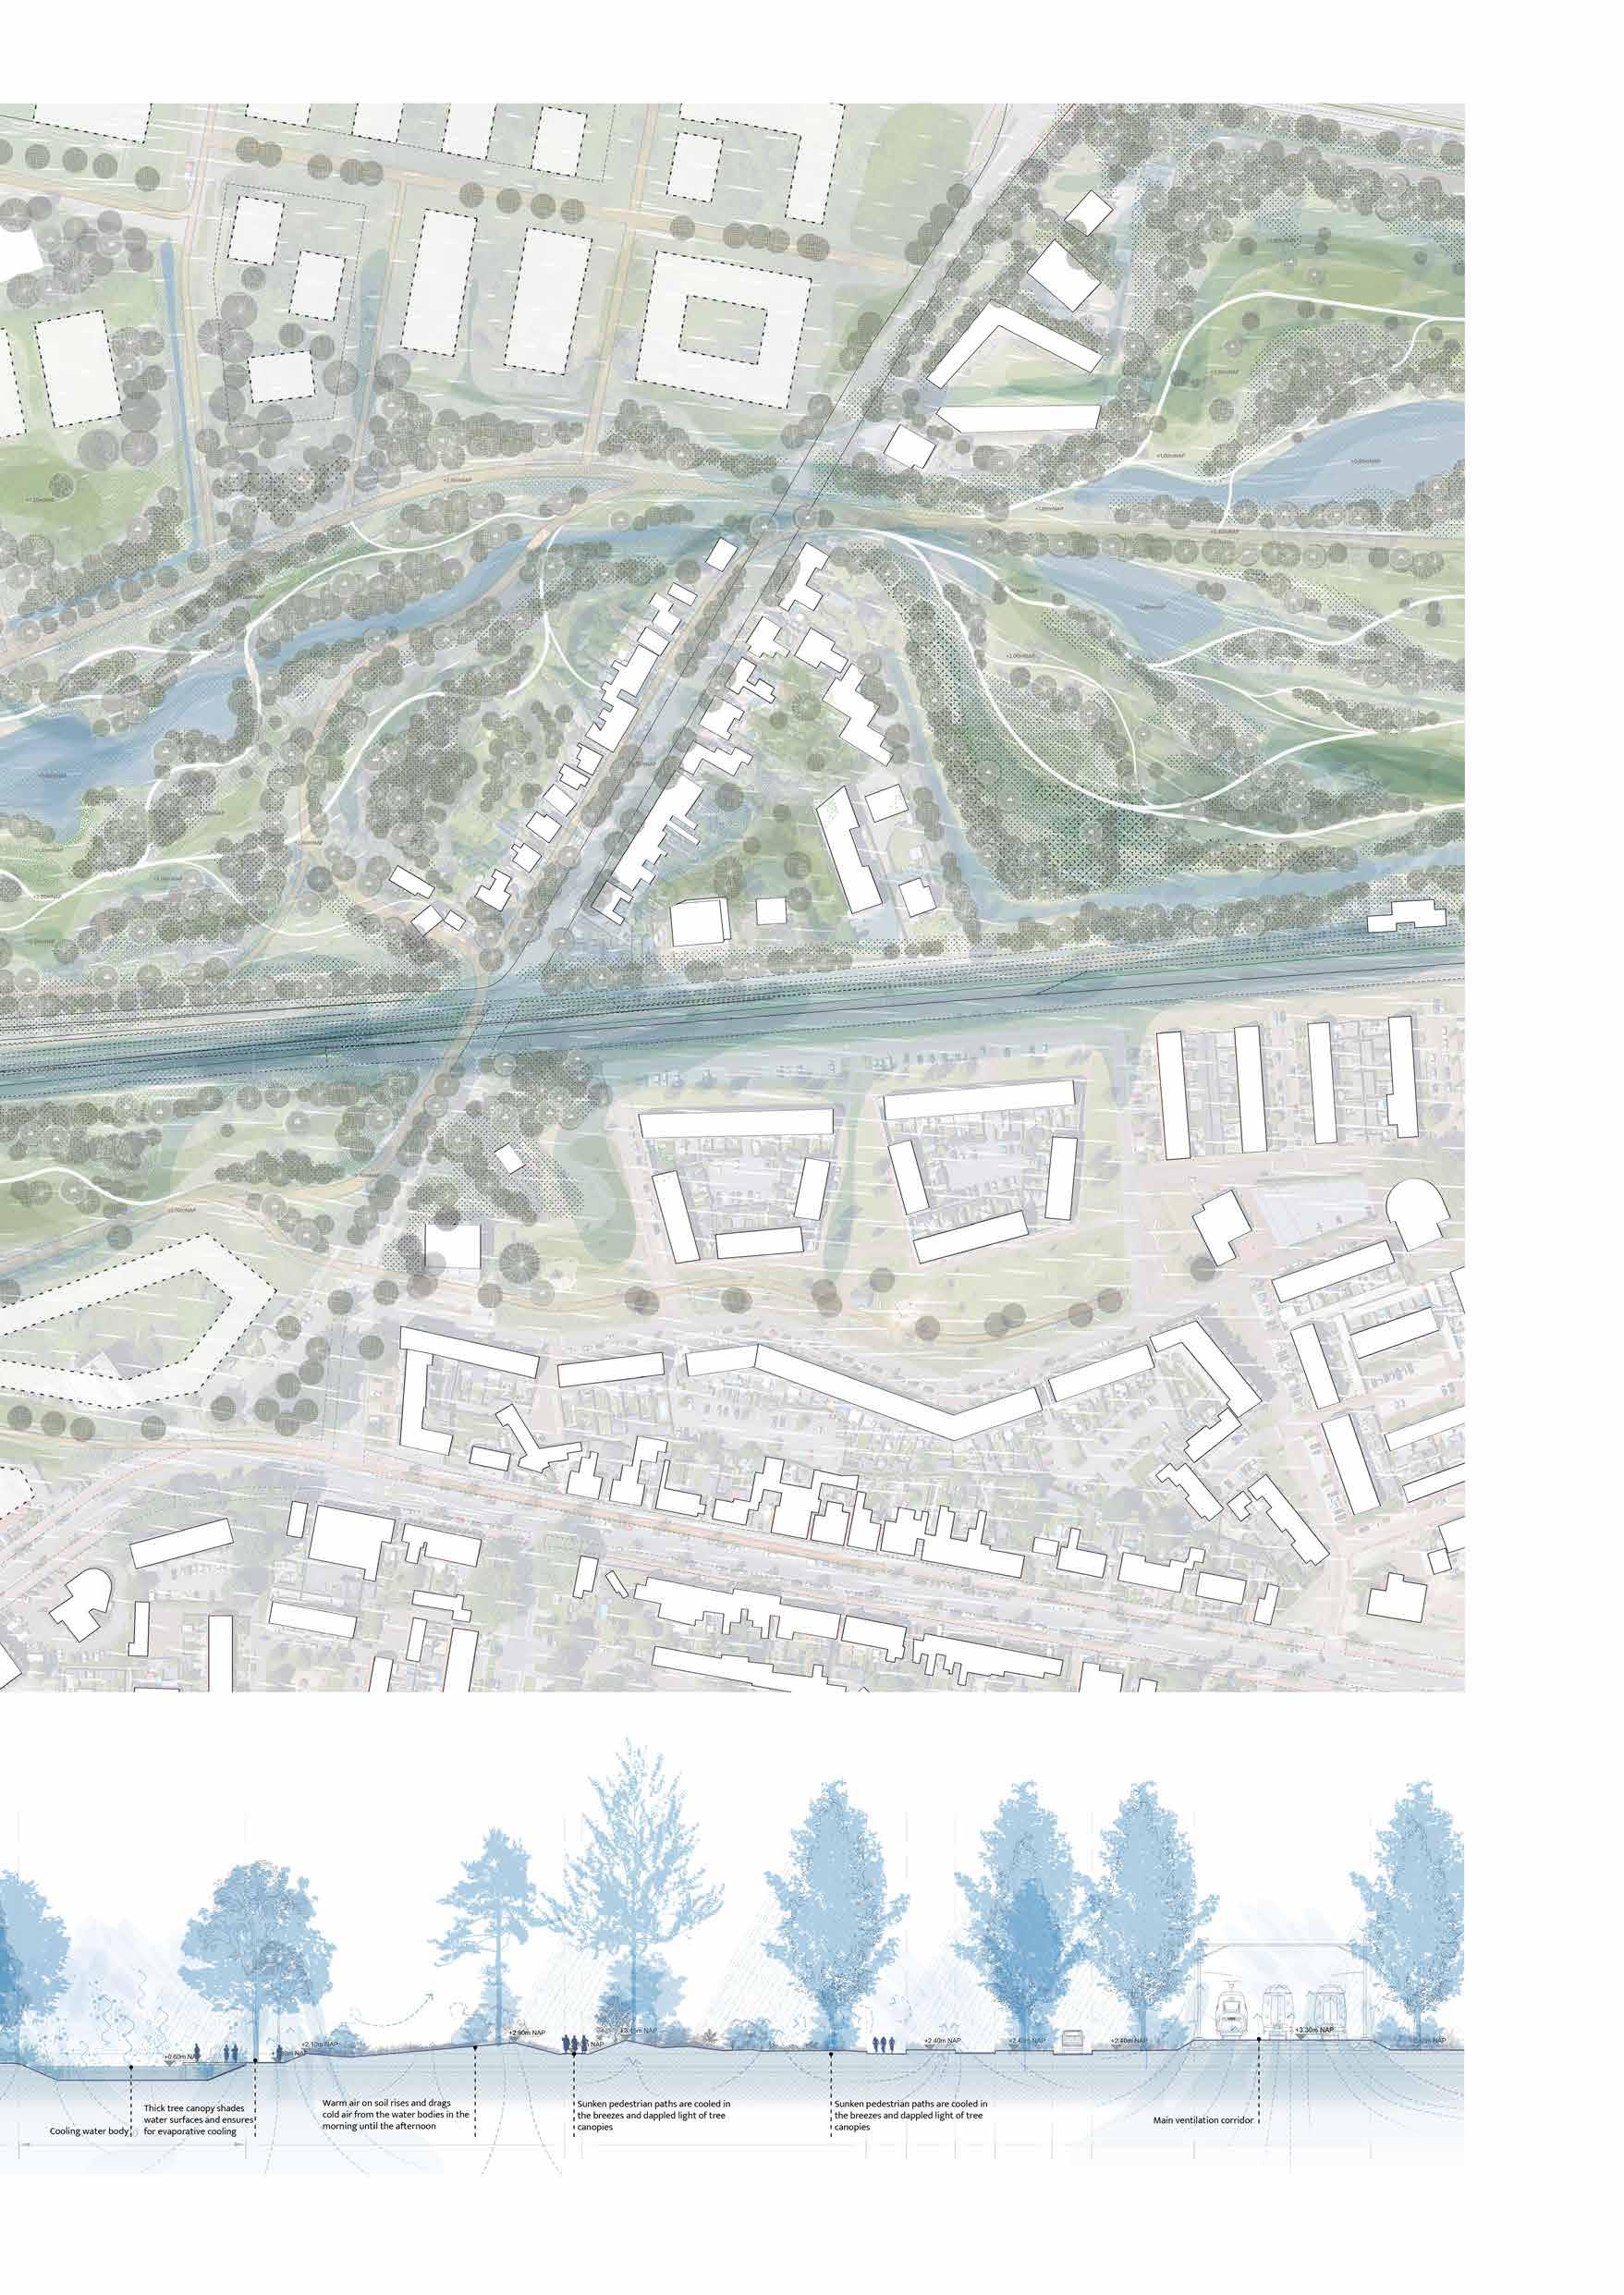
This project focuses on the east-west stream, a critical corridor that maximizes the temperature differences between cooler and warmer areas. Strategically positioned between contrasting landscapes, it crosses city peripheries, moves through the urban core, and reconnects peripheral woodlands to strengthen ecological networks. By linking urban parks and facilitating air circulation, it acts as a central ventilation pathway, dispersing heat and improving climatic resilience across Breda.
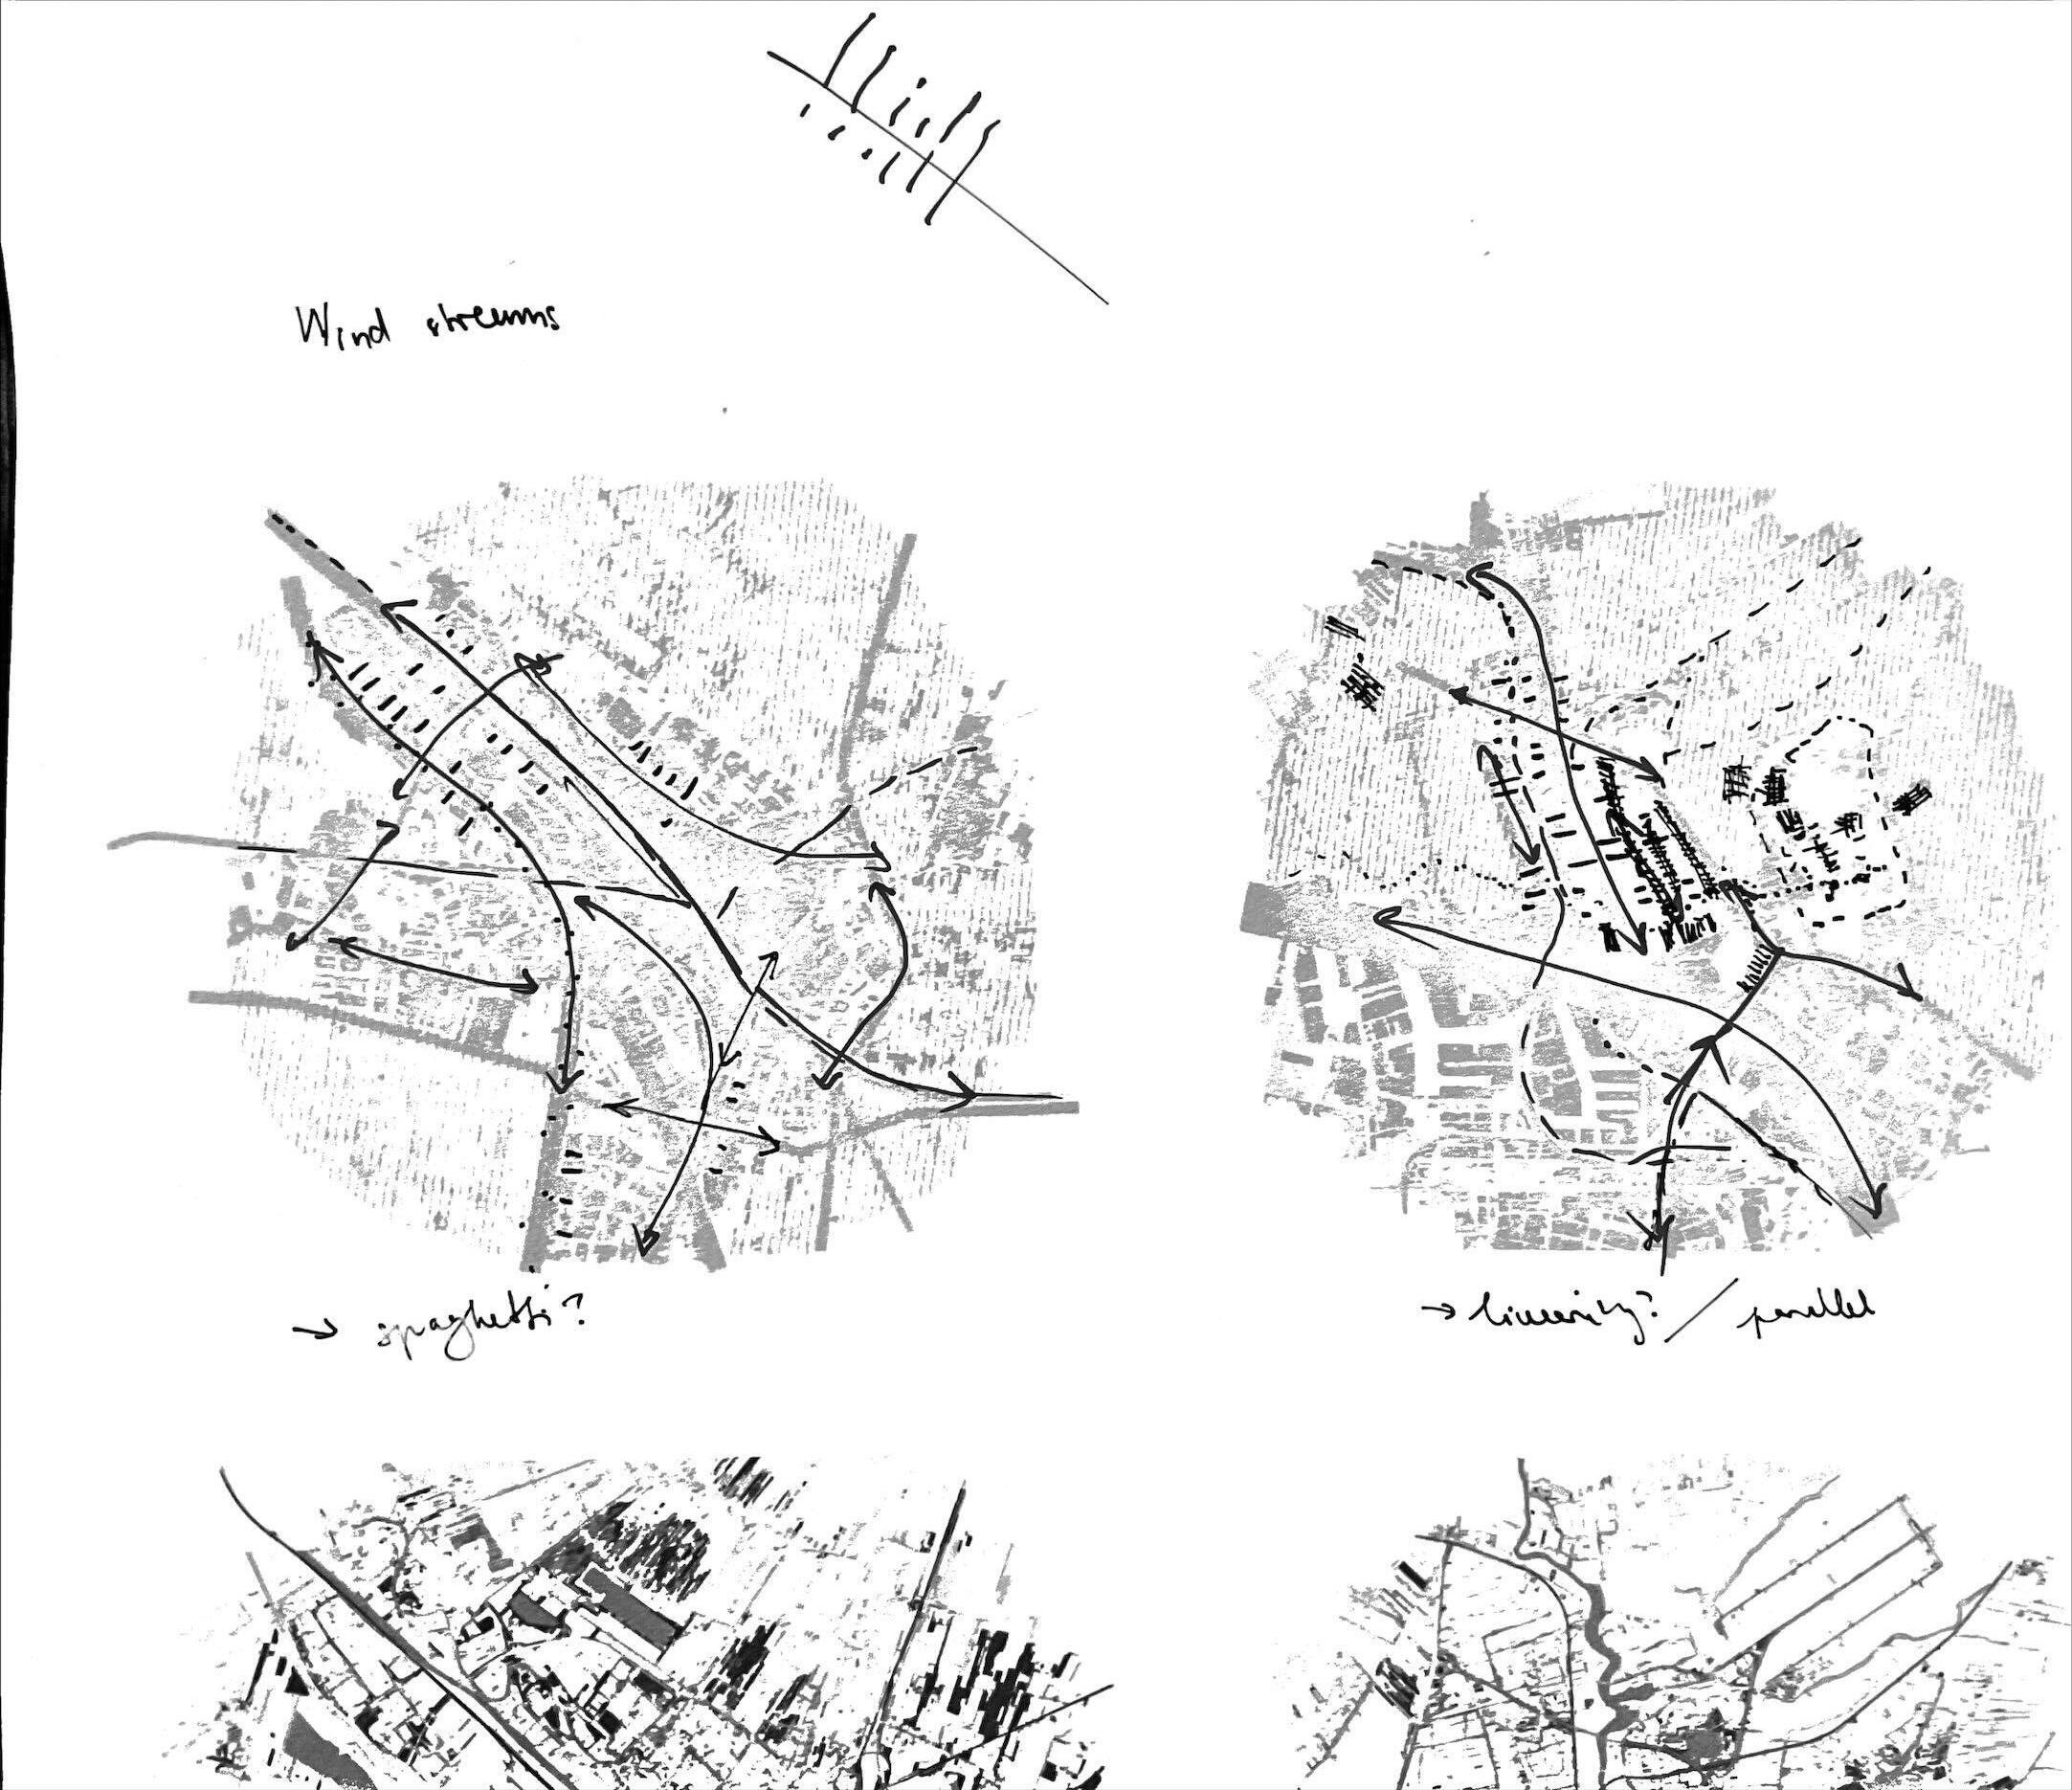
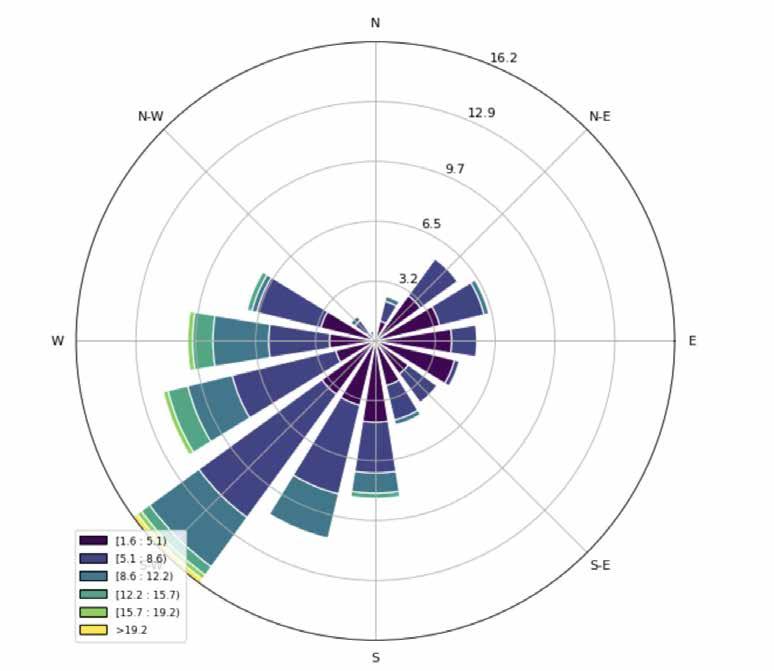
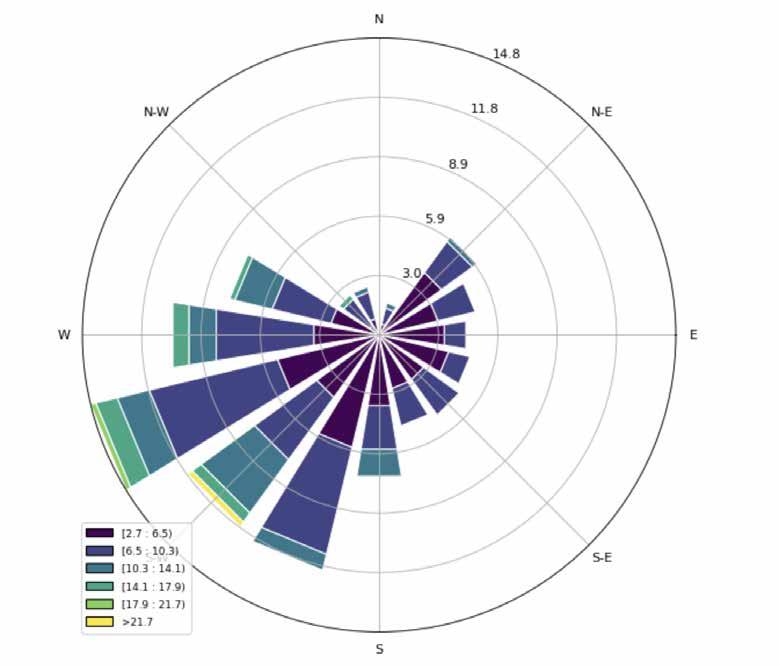
Wind streams
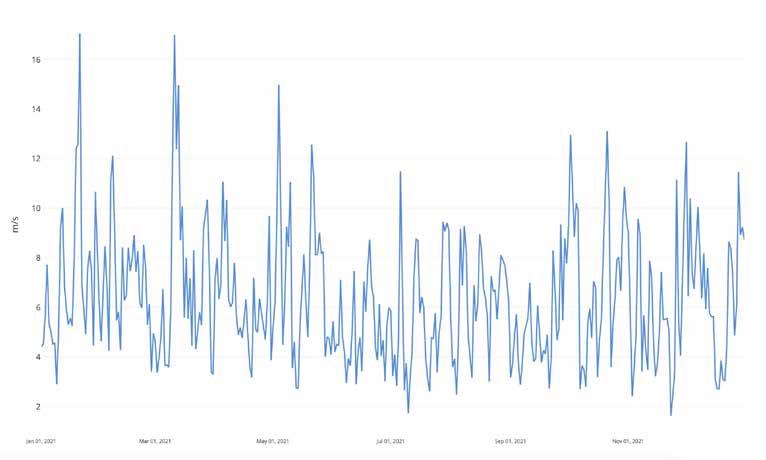
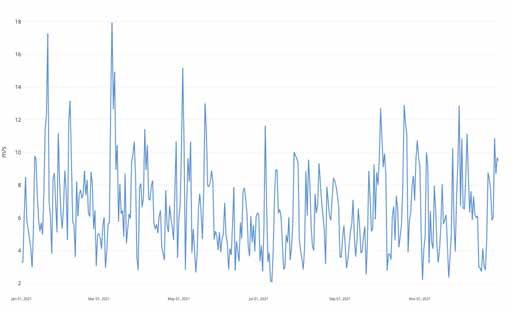
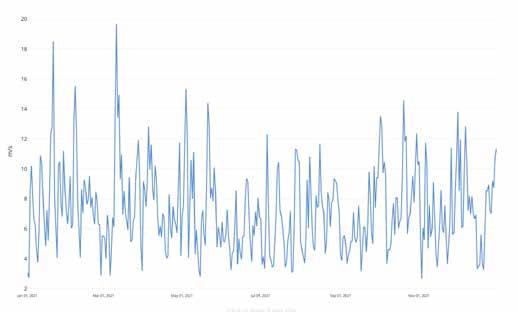
Average 5.1-8.6m/s
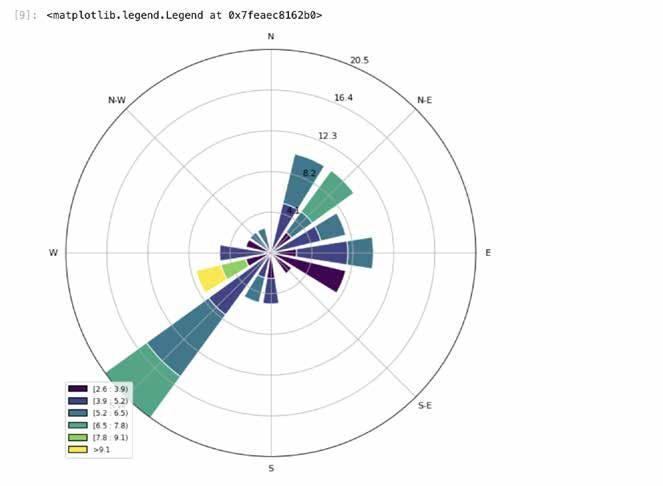
Prevailing annual wind direction above 10m, Breda, year 2022
Based measurements wind speed generally increase compared
There and February extreme
prevailing summer flowing
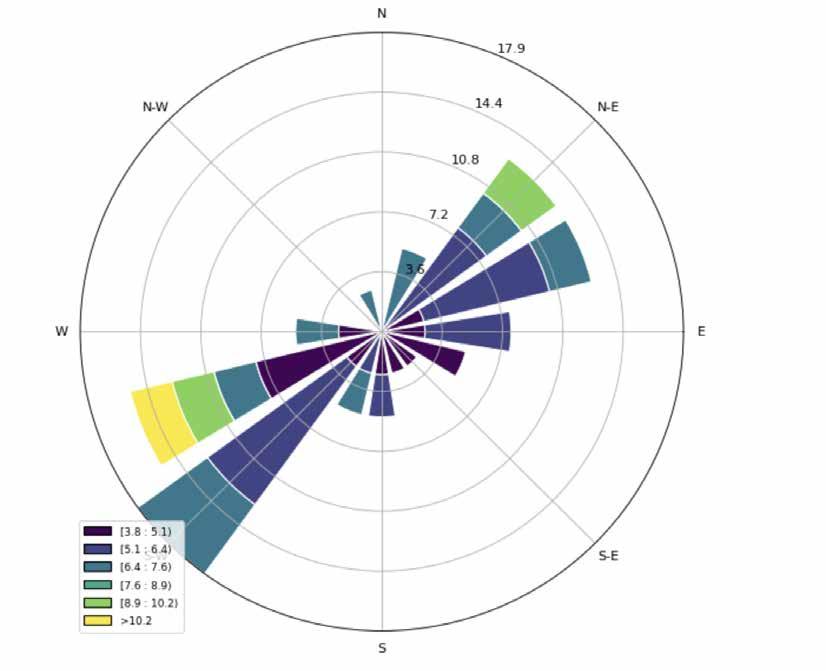
Prevailing wind during July-August 2022
Prevailing wind direction
Potential streams that could positively impact the ventilation of the city of Breda
The
Average
Academie van Bouwkunst Amsterdam 23 | 24 | Rachel Borovska
Natuurplas
Park Overbos
‘t Zoet
Krogten
Steenakker
Emmer Zuid
Belcrum
Doornbos Linie
Waterakkers
Tetteringsebossen
Intention
Block/Filter/Protect/Slow down
Dispersing
Block, filter, slow down
What tree species?
Direct/Accelerate/Cool off
Direct, accelerate, cool
Academie van Bouwkunst Amsterdam 23 | 24 | Rachel Borovska
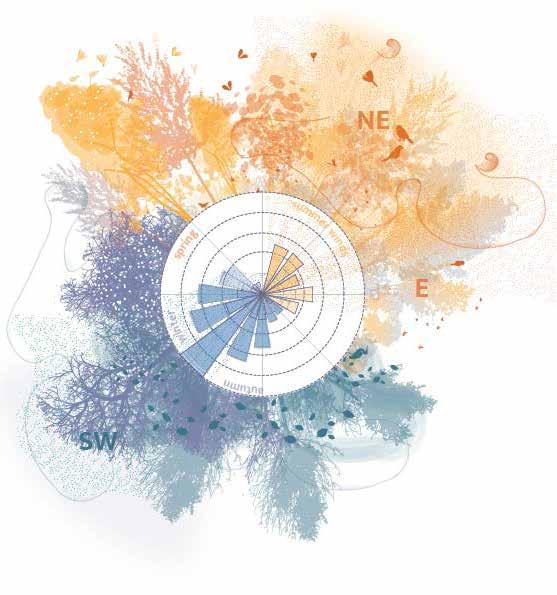
Seasonal approach
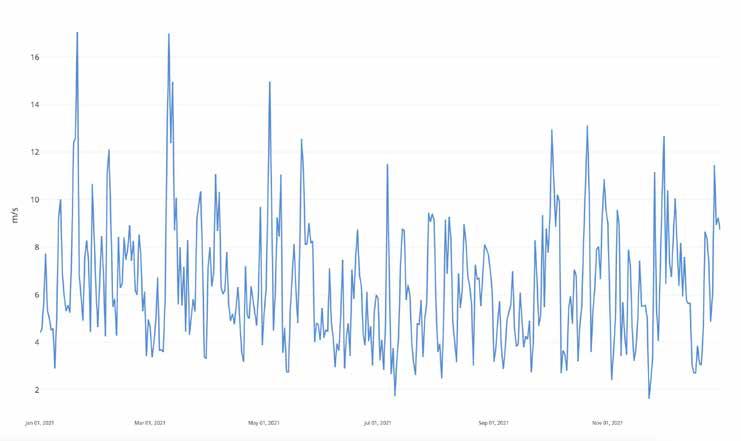
The average wind speed in Breda is 6.76 m/s, based on the analysis of annual wind speed measurements exceeding 10m. Like most Dutch cities, Breda experiences an increase in wind speed during the winter months, with notable spikes in December, January, and February, which can be categorized as instances of extreme wind speeds.
The prevailing wind direction is southwest, while during the summer months, a dominant warm wind comes from the northeast and east. This understanding of wind behavior is directly applied in the design process. By focusing on prevailing wind directions, cities with densifi cation plans can tailor their approach accordingly.
On the eastern side of the city, strategies should prioritize mitigating and cooling the warm air from the inland, addressing urban heat throughout the year.
Wind woven
Academie van Bouwkunst Amsterdam 23 | 24 | Rachel Borovska
Stream under transformation
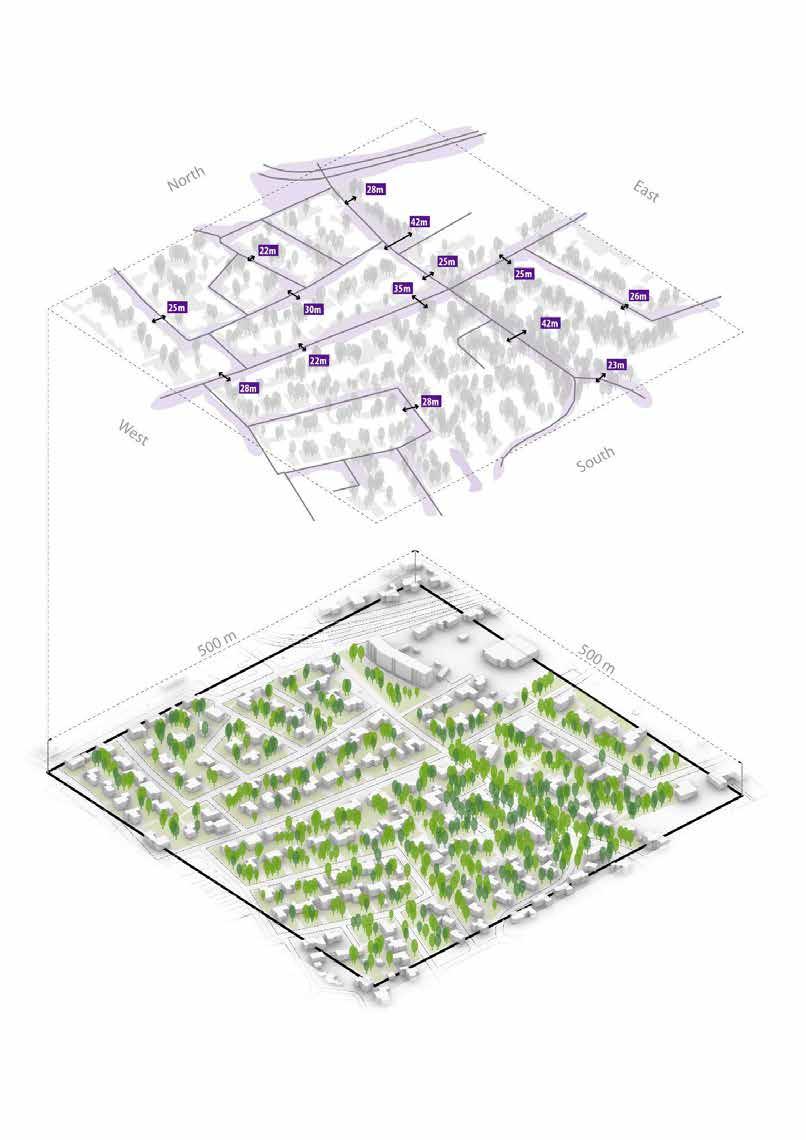
The railway zone in Breda is undergoing significant densification, Unlike many other cities that expand outward, Breda is concentrating
New developments Densities / Areas under transformation
Industrial
Academie van Bouwkunst Amsterdam 23 | 24 | Rachel Borovska
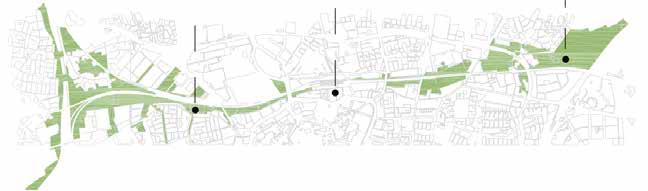
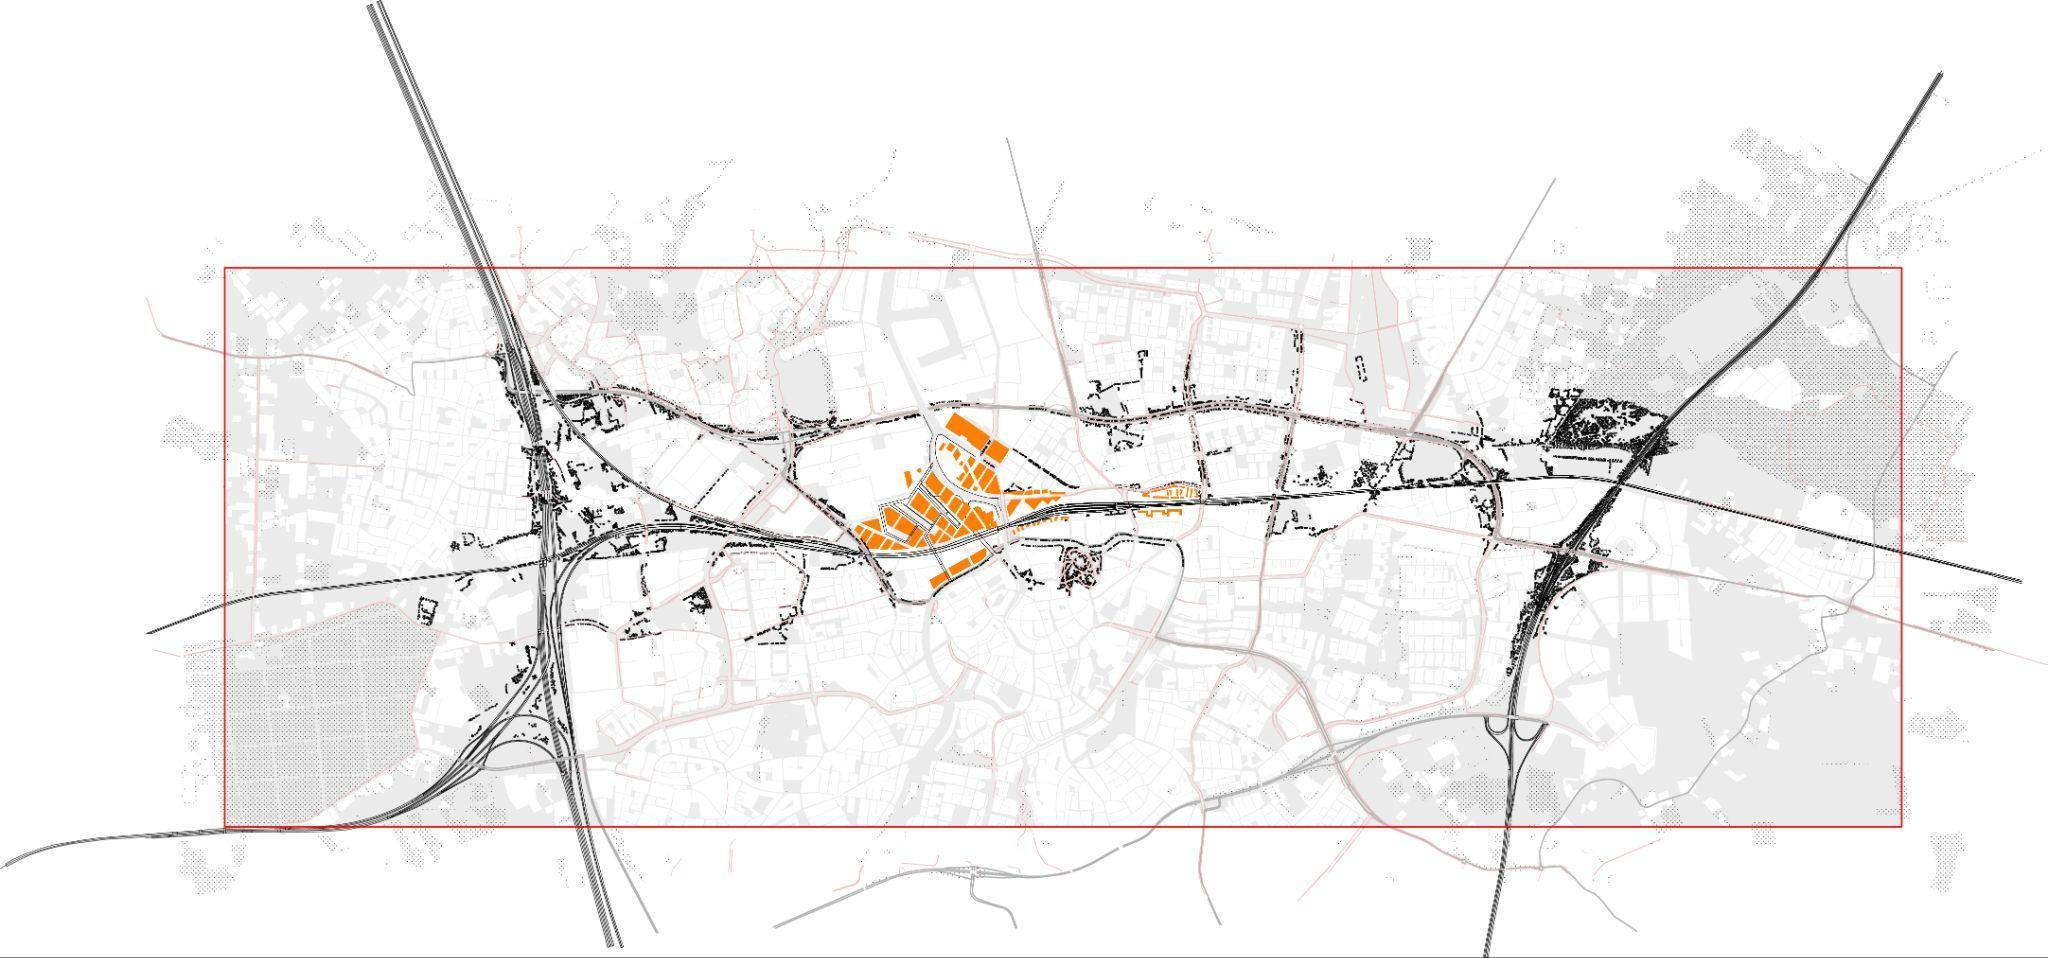
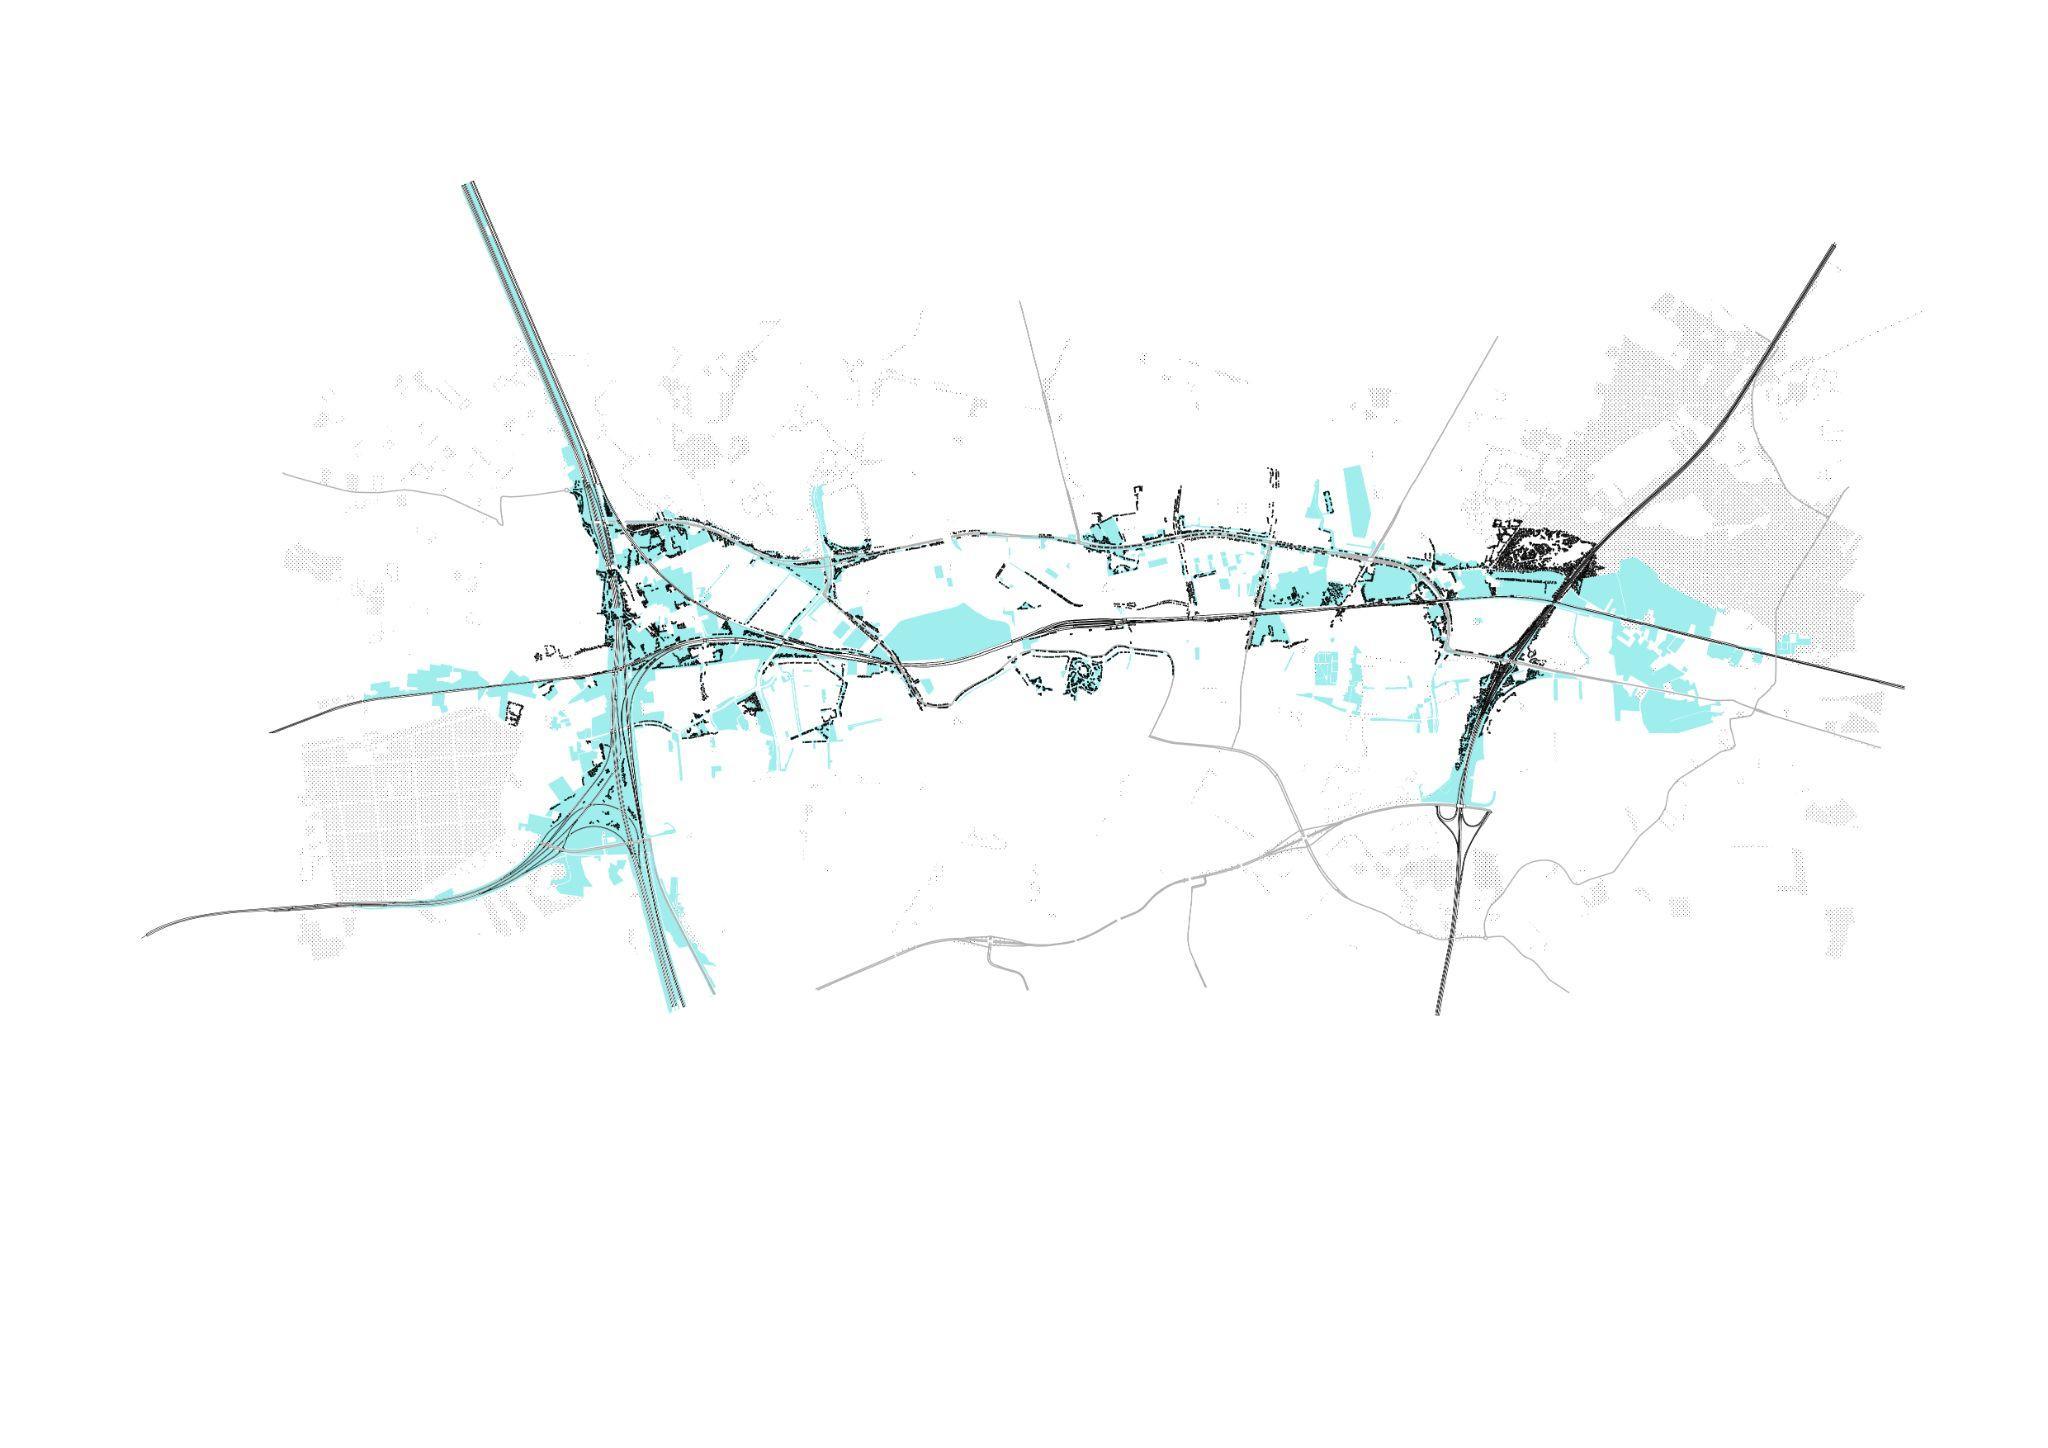
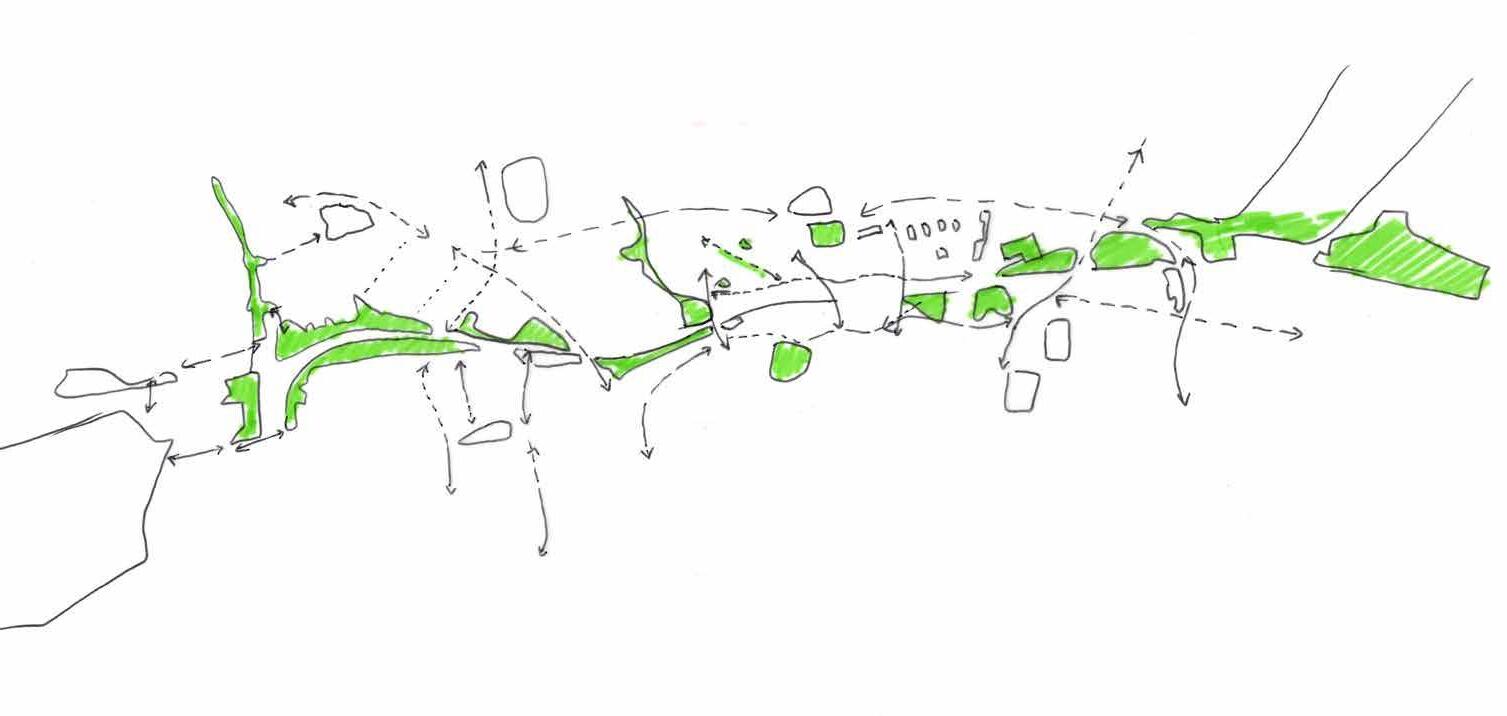
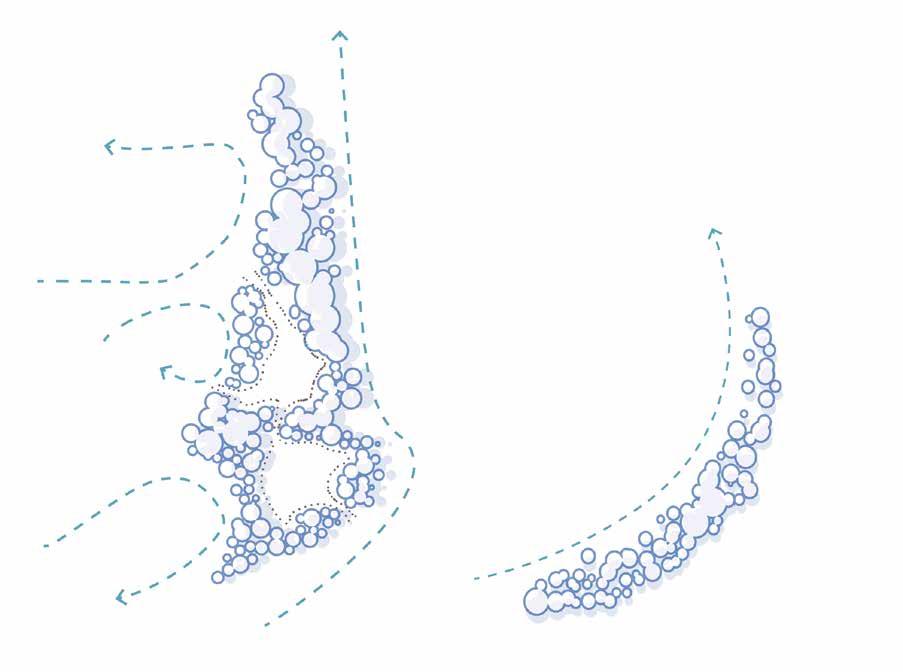
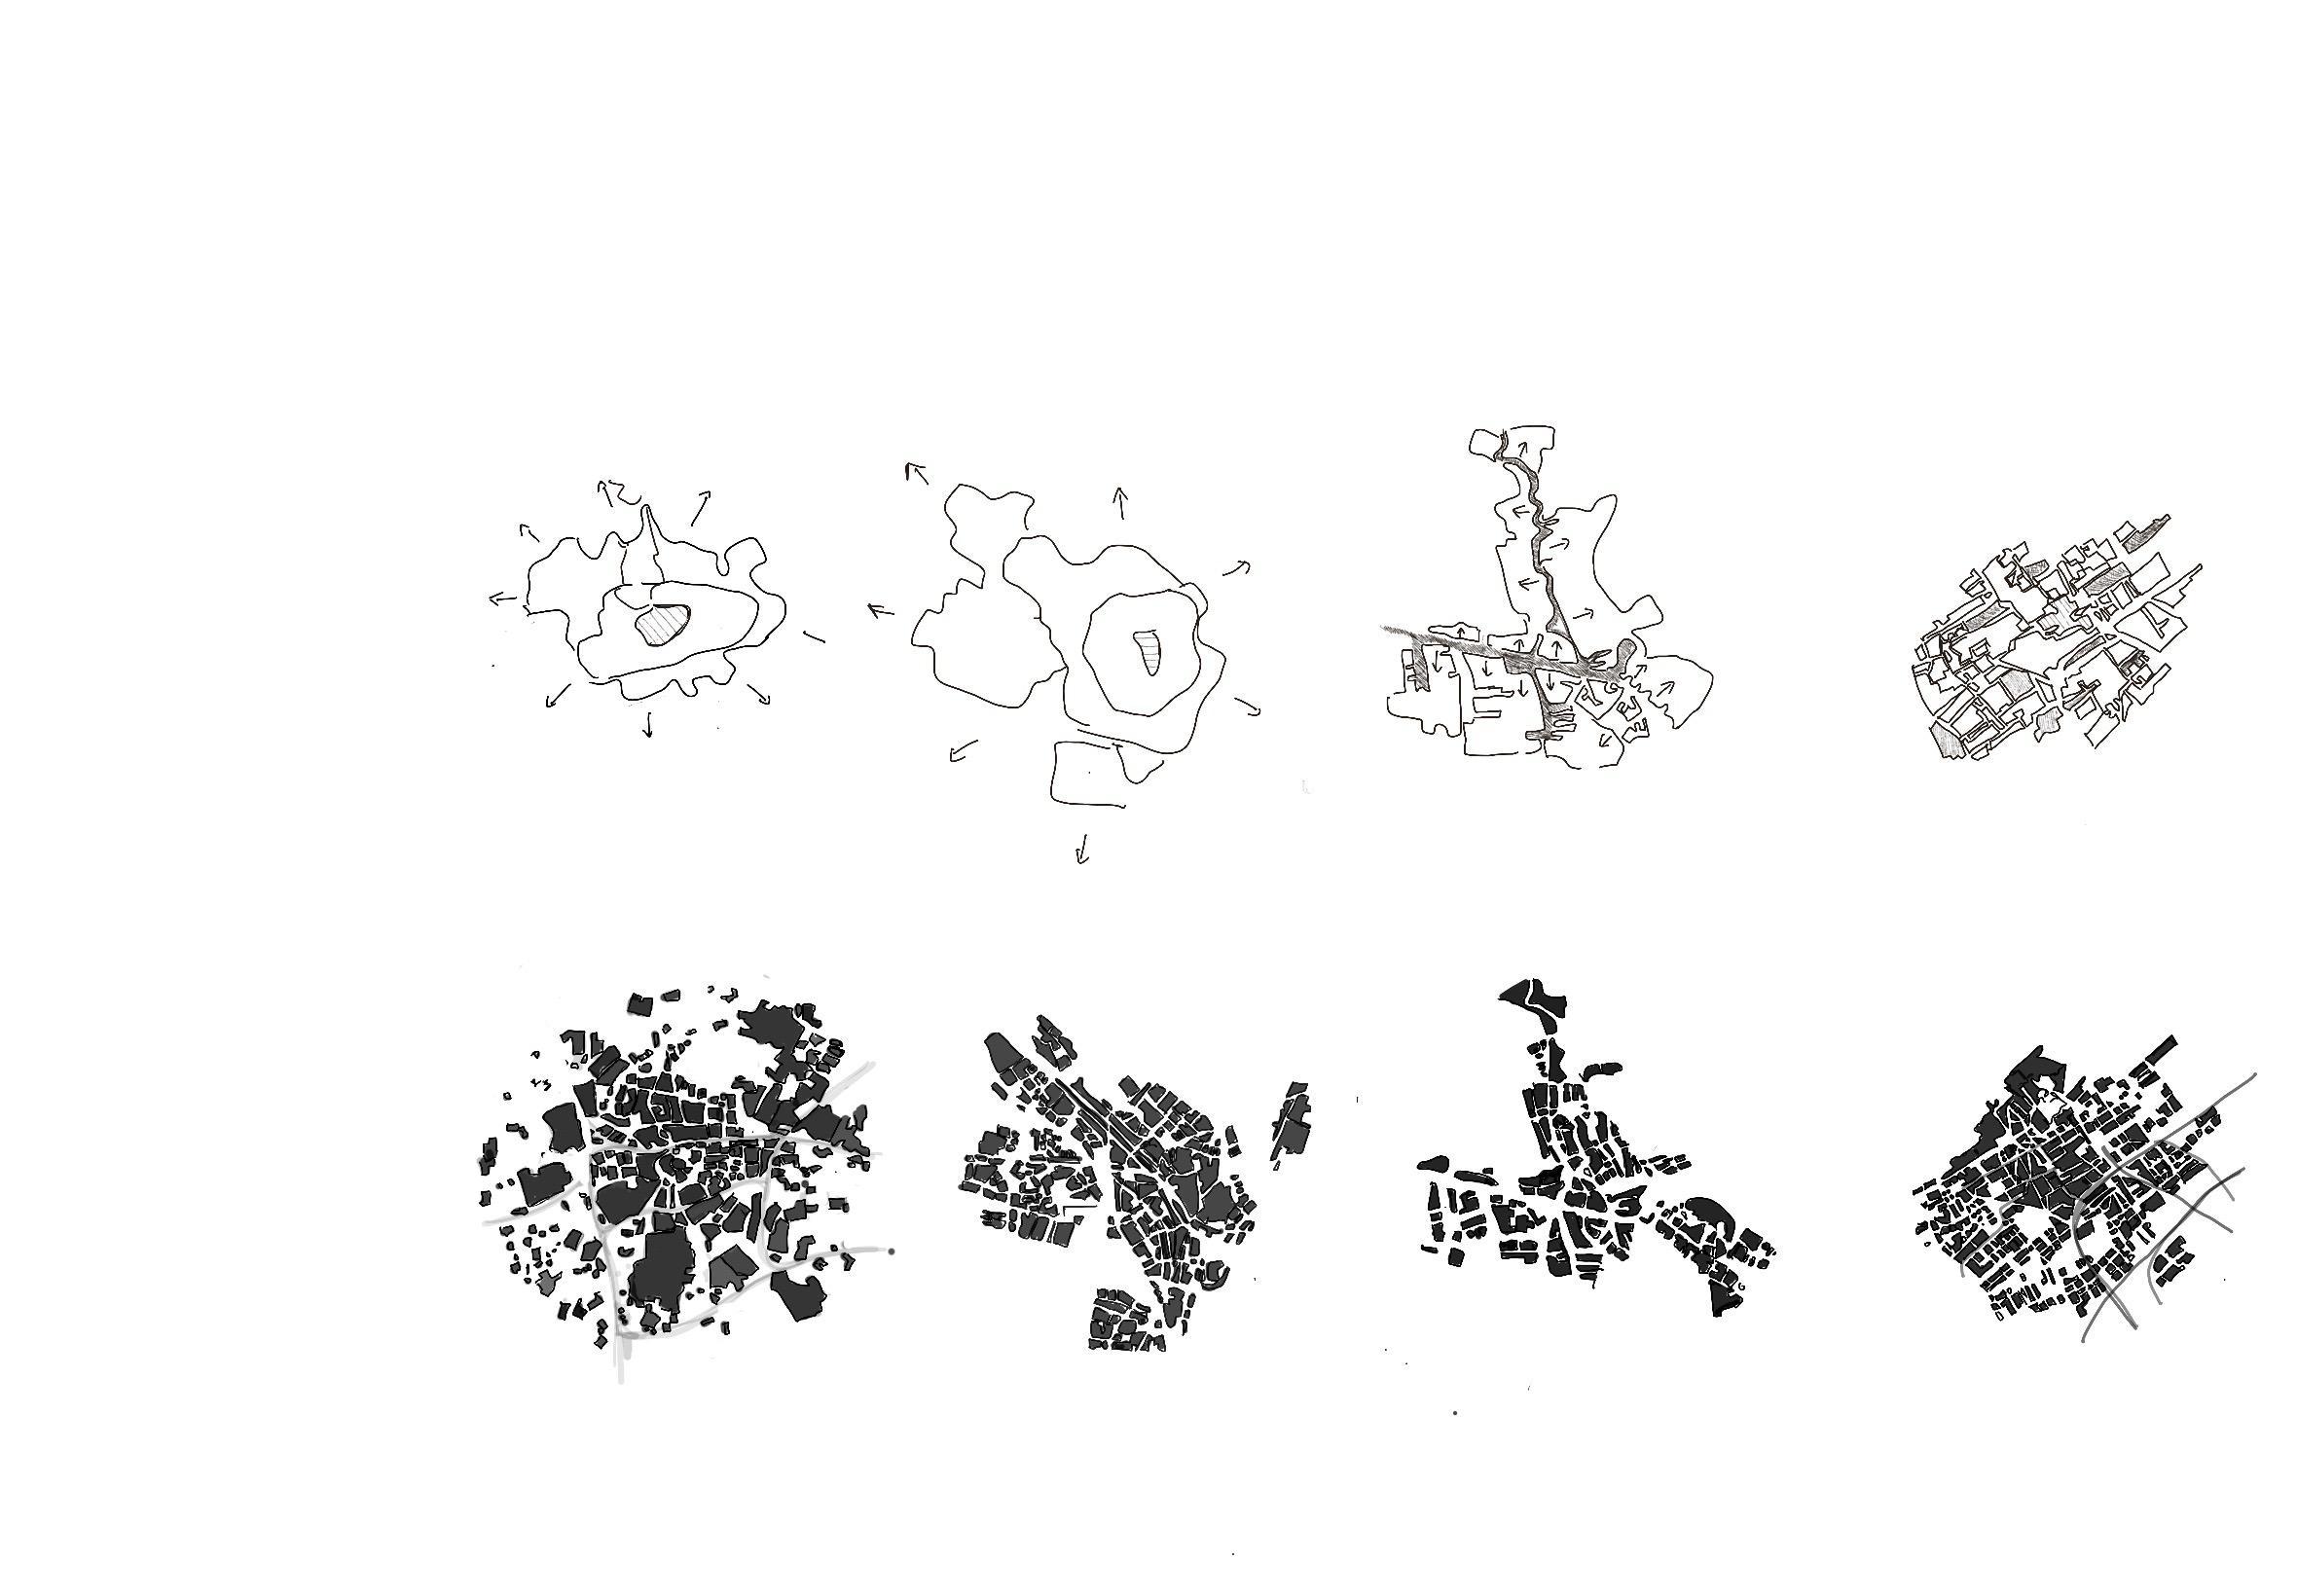
The Necklace Park concept focuses on reconnecting the city’s voids—those often overlooked, undesigned spaces and the strips of green wedged between infrastructure. These fragmented areas, while currently underutilized, hold significant potential for creating a continuous ecological network along the railway corridor.
By transforming these isolated voids into and interconnected framework, habitat connectivity is enhances along with a spatial framework for new developments within the city. These green corridors can be optimized to facilitate air exchange and create natural ventilation pathways.
From voids towards a necklace
Necklace park
Voids
Academie van Bouwkunst Amsterdam 23 | 24 | Rachel Borovska
“Wind
woven” Regeneration of Breda’s urban fabric through wind
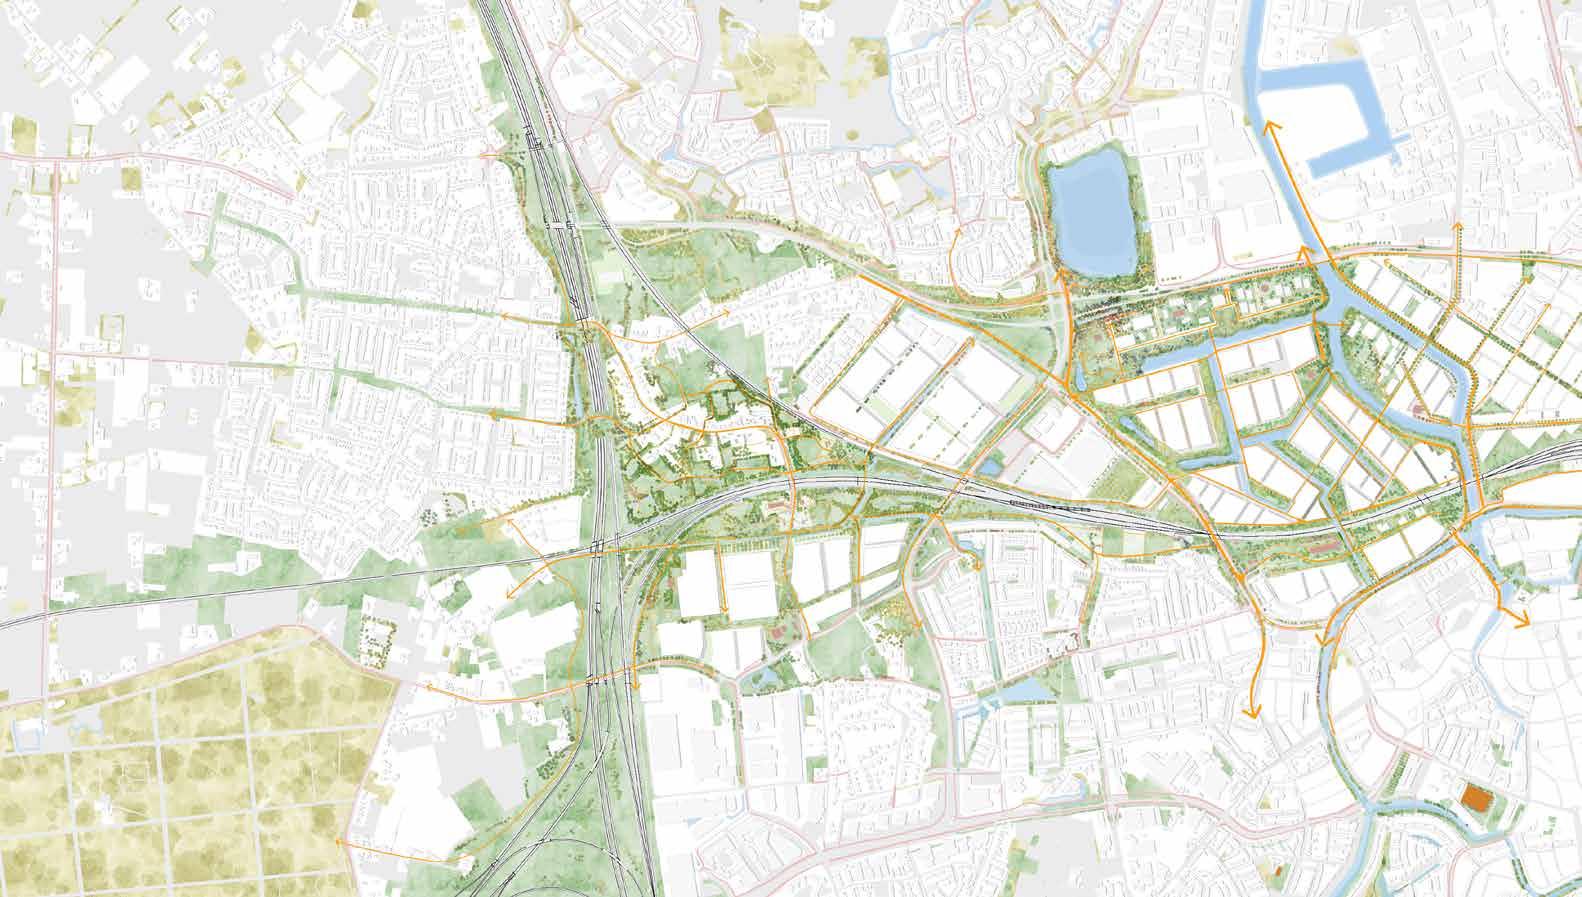
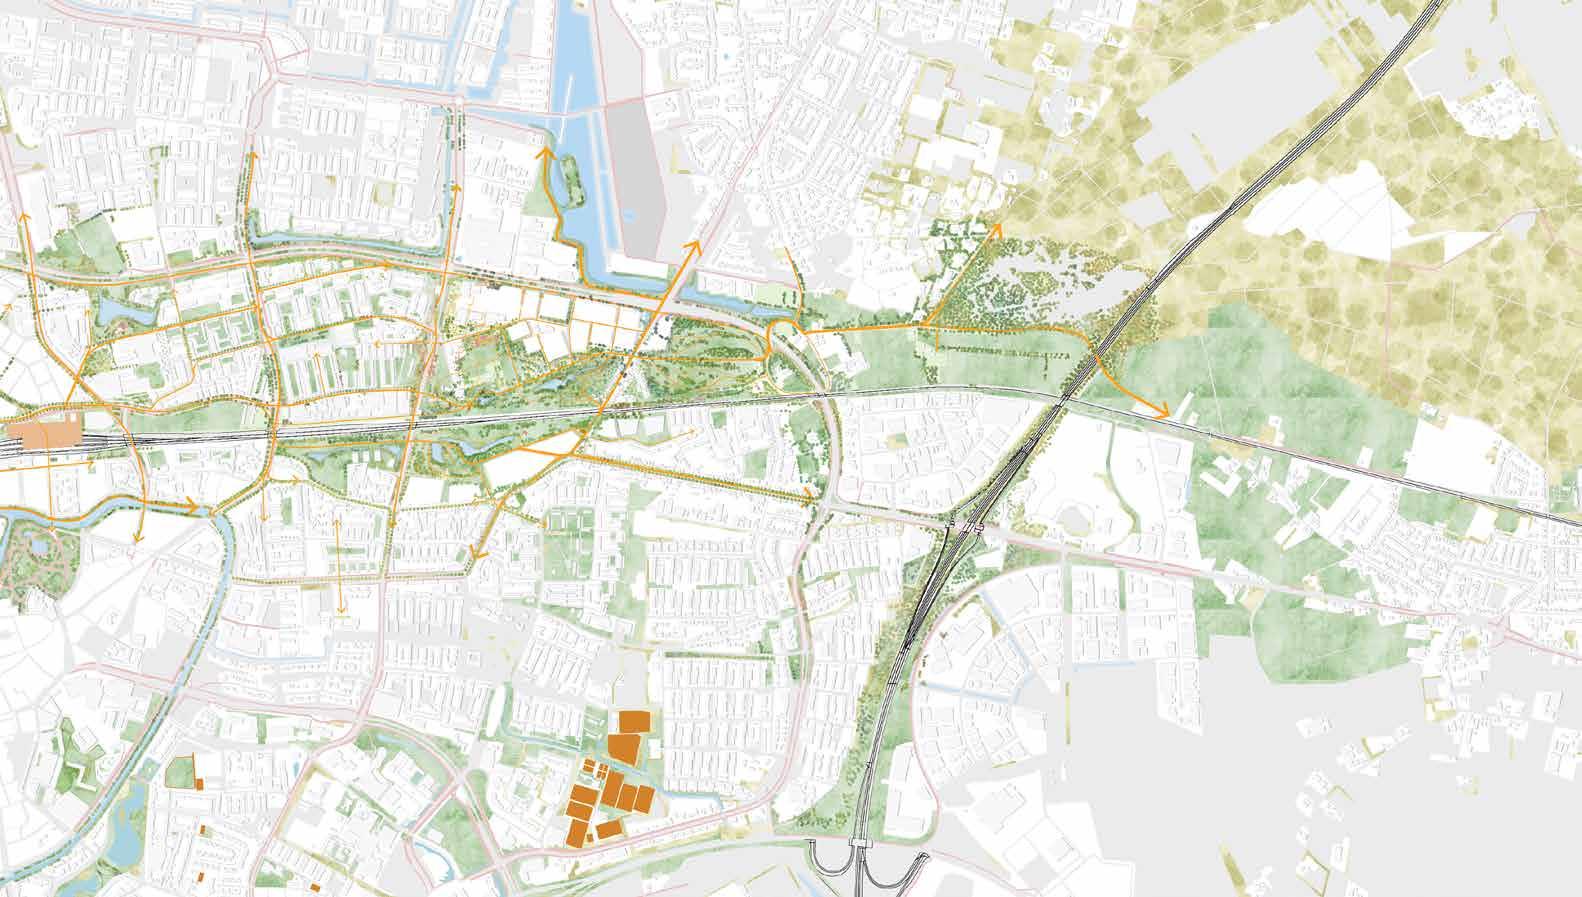
The Breda region along the west-to-east railway is currently undergoing significant urban transformation, with a primary goal of reconnecting the northern and southern parts of the city while revitalizing previously underused spaces. These areas, often viewed as voids or leftover plots, will be gradually transformed into vibrant zones of residential and commercial life, fully integrated into the city’s existing fabric.
The railway itself plays a central role in this vision. As it cuts through a variety of environments—city outskirts, open landscapes, dense urban centers, and industrial zones—it offers a unique opportunity to address some of the city’s most pressing challenges. By focusing on wind as a driving force in this development, the railway zone becomes not just a transportation corridor, but a critical tool in mitigating urban heat islands. This is achieved by channeling and distributing
cooler air, providing natural ventilation that helps reduce heat buildup, particularly in areas facing rapid densification. 15
Through harnessing the power of wind, this strategy turns the railway into more than just a connective element—it becomes an ecological link, weaving together a green-blue network that connects urban and natural landscapes. This approach goes beyond climate mitigation; it addresses the challenges of urban densification by creating more livable, breathable spaces. The result is an urban zone that is not only ecologically connected but also resilient, sustainable, and better equipped to handle future challenges.
Academie van Bouwkunst Amsterdam 23 | 24 | Rachel Borovska
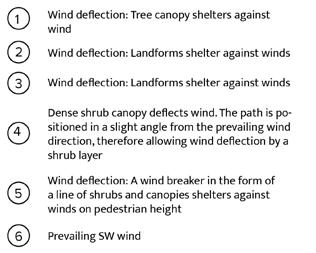
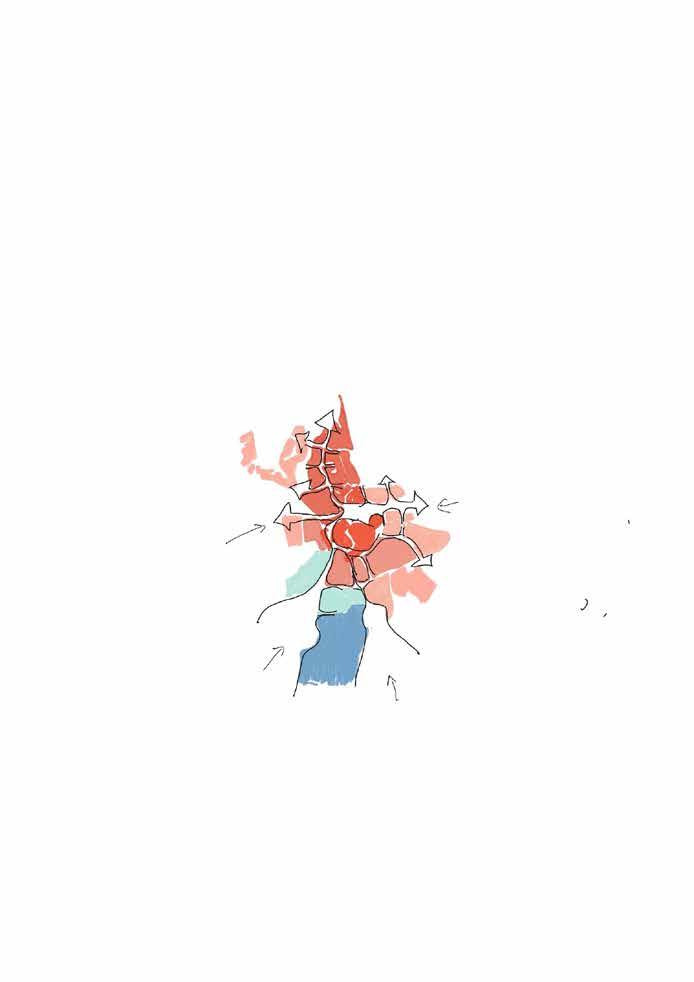
3 interventions
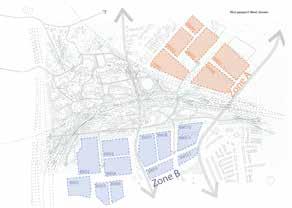
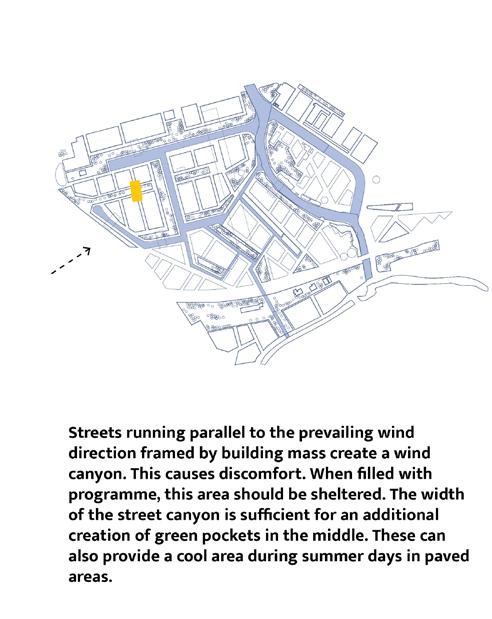
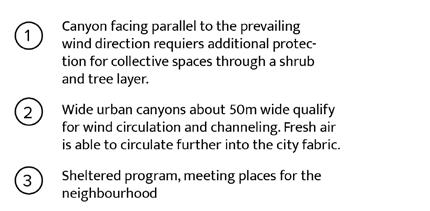
The railway track is divided into three areas based on their location within the city. The western area is most affected by strong winds and requires protection and filtering measures.
The center of the stream is an area undergoing transformation called ‘t Zoet. The potential of this area as a disperser was explored through its green-blue network and built area composition.
Filtering Dispersion
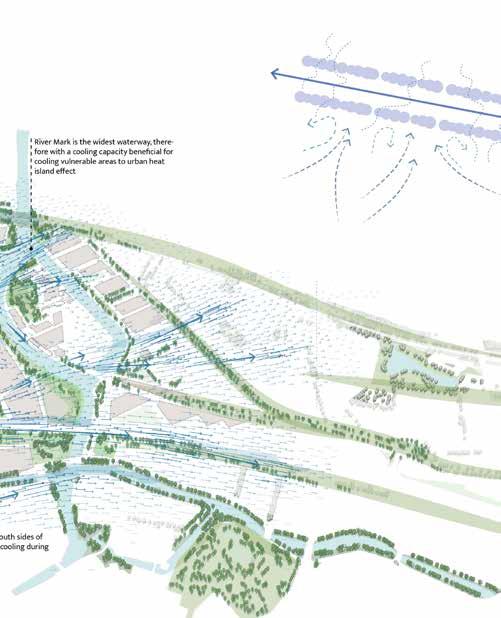
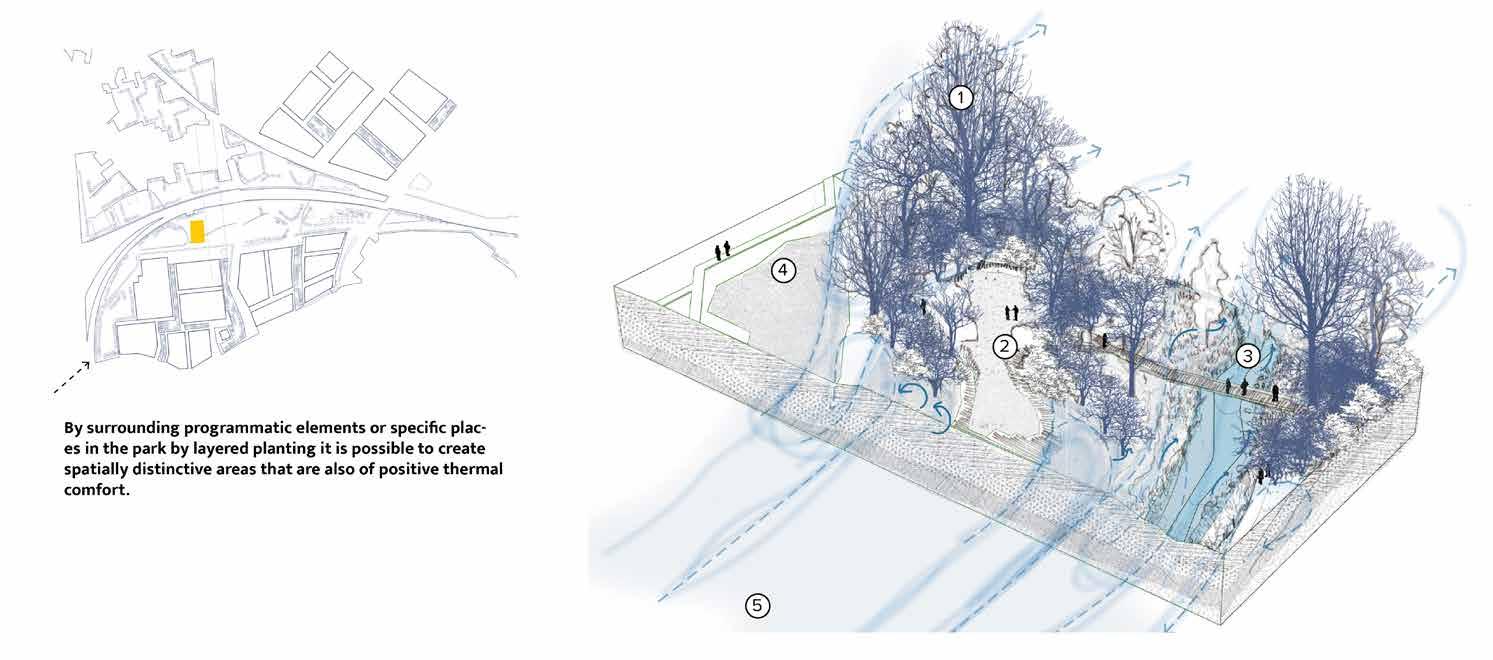
The east stream is essential for welcoming summer’s warm winds. It plays a crucial role in funneling and continuously channeling the winds, while also cooling them down through canopies and water surfaces.
Funneling
Academie van Bouwkunst Amsterdam 23 | 24 | Rachel Borovska
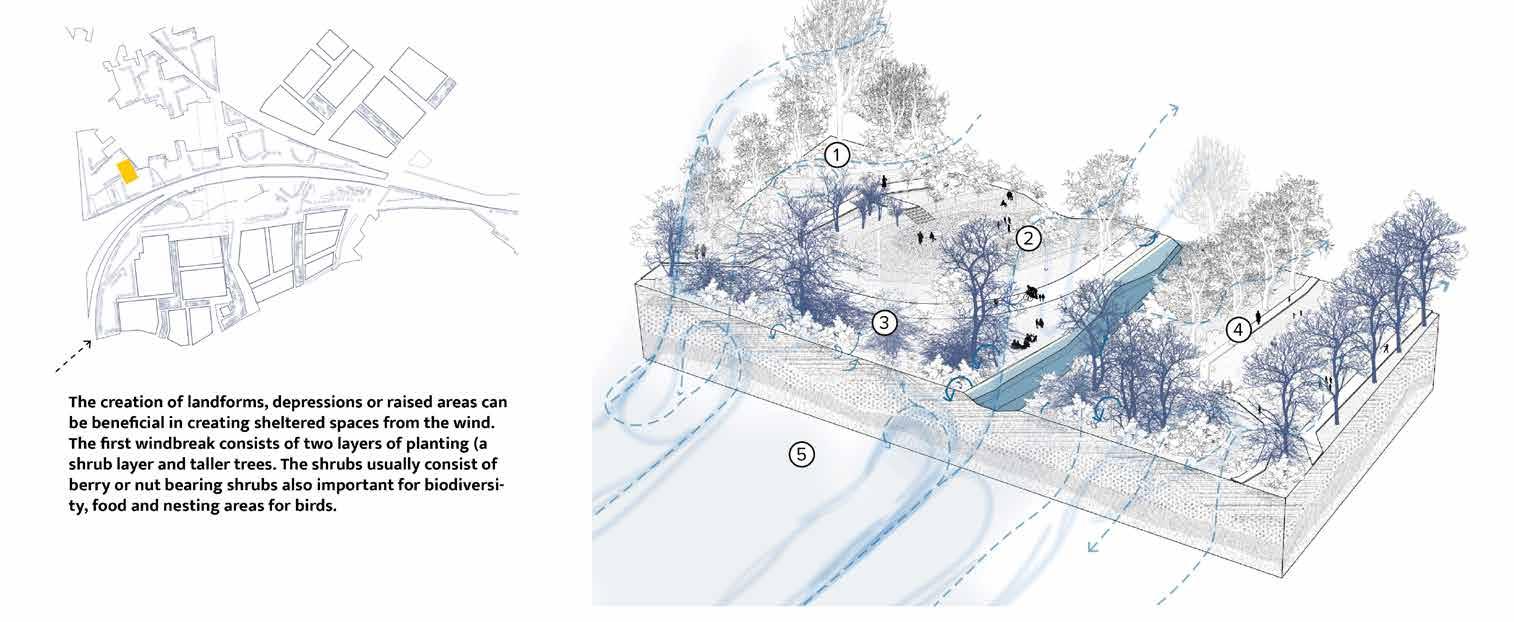
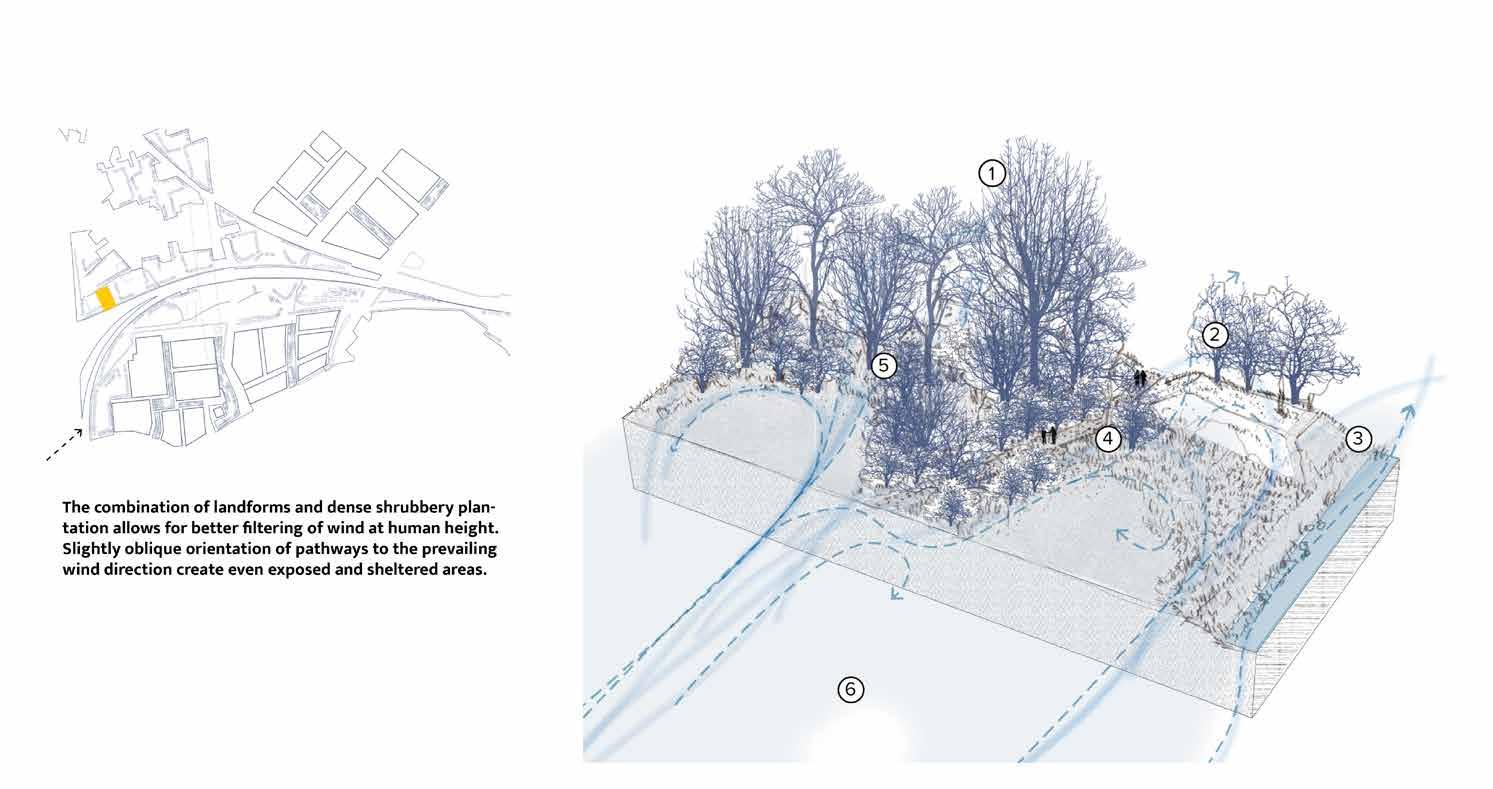
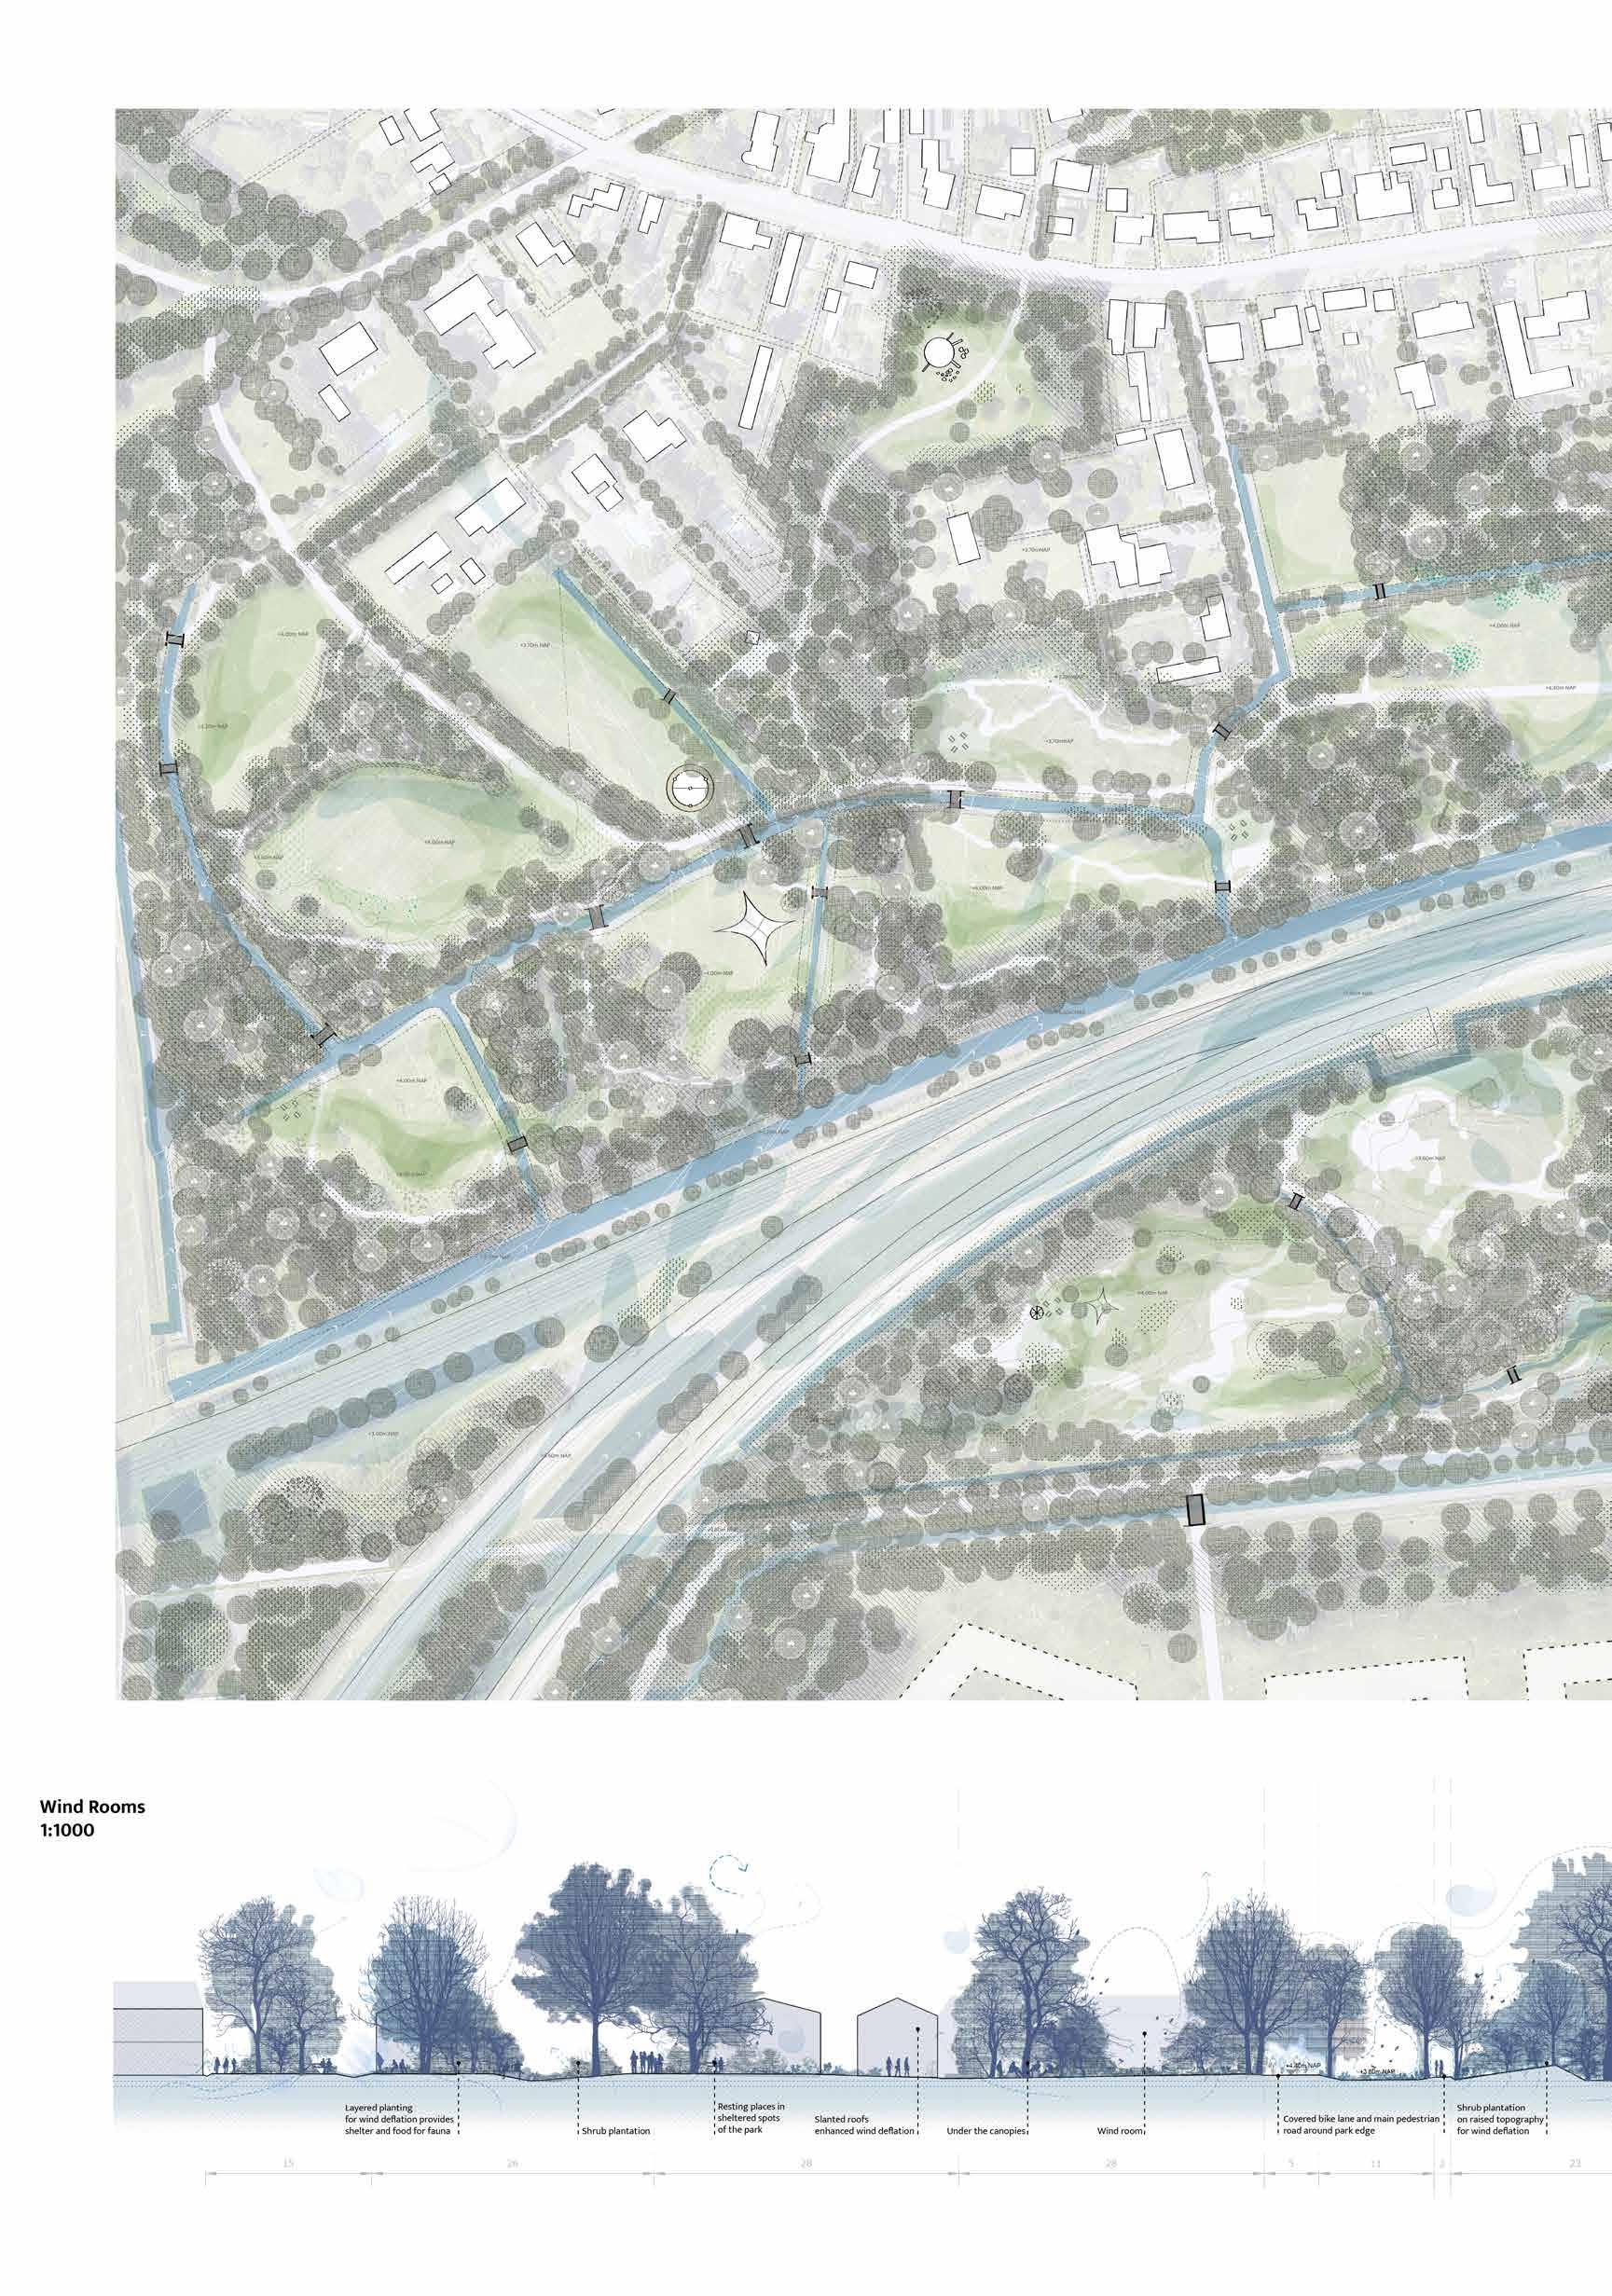
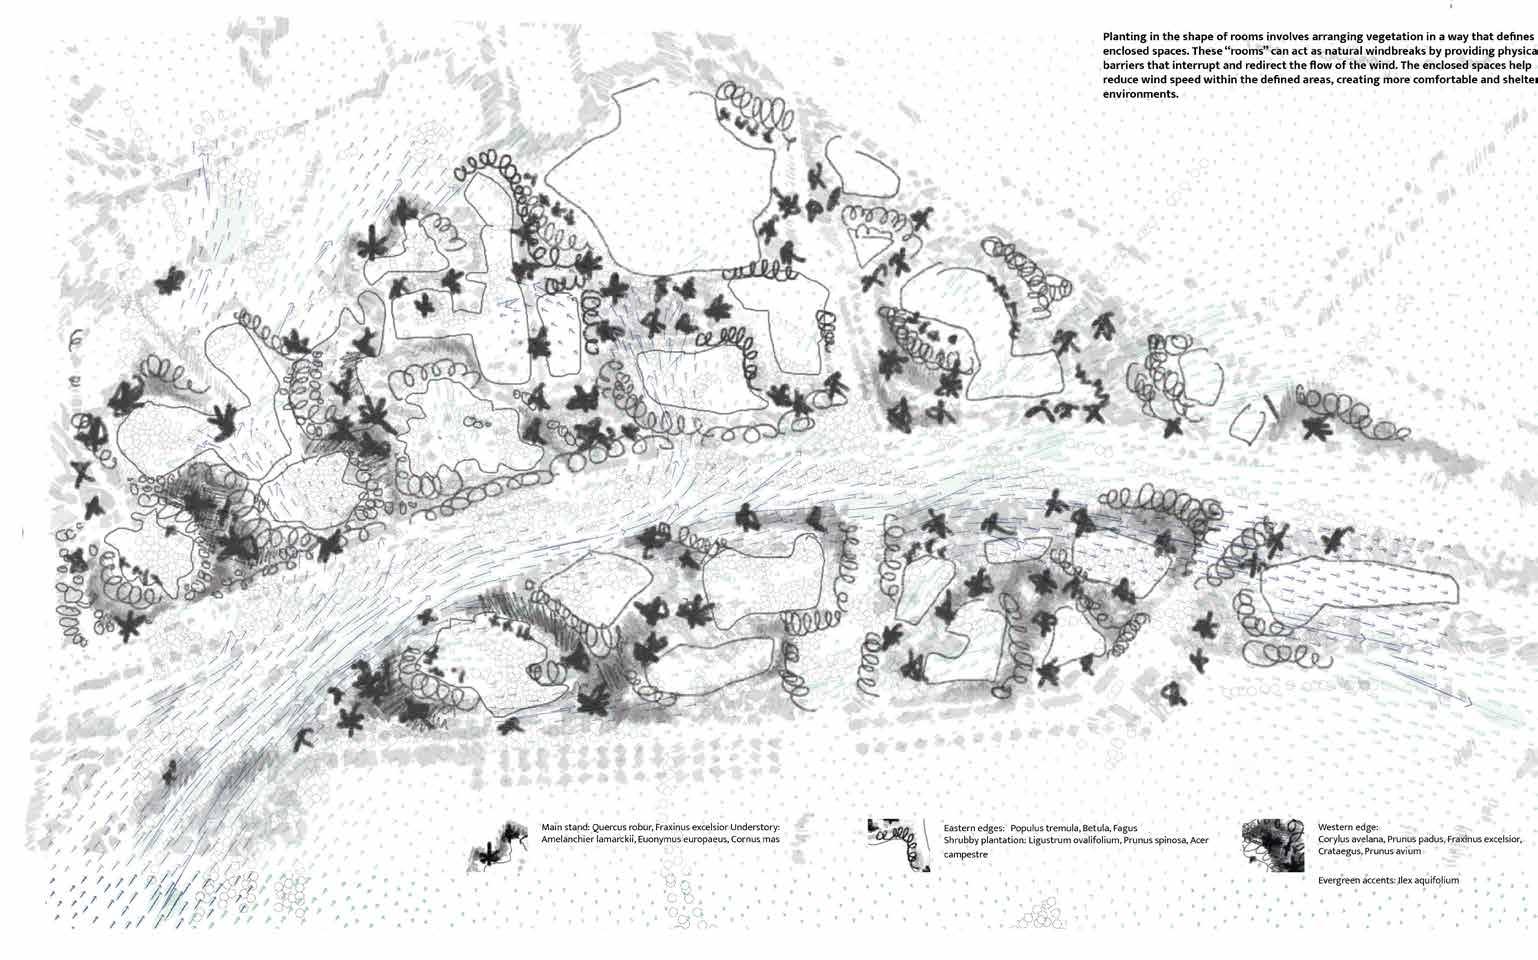
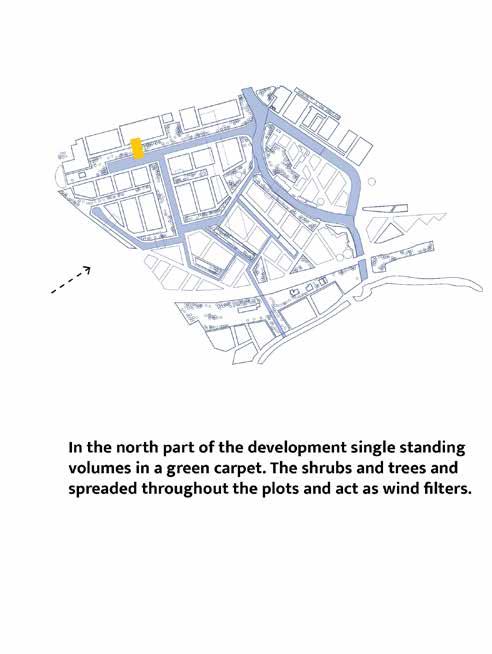
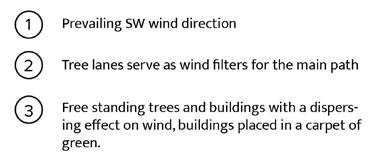
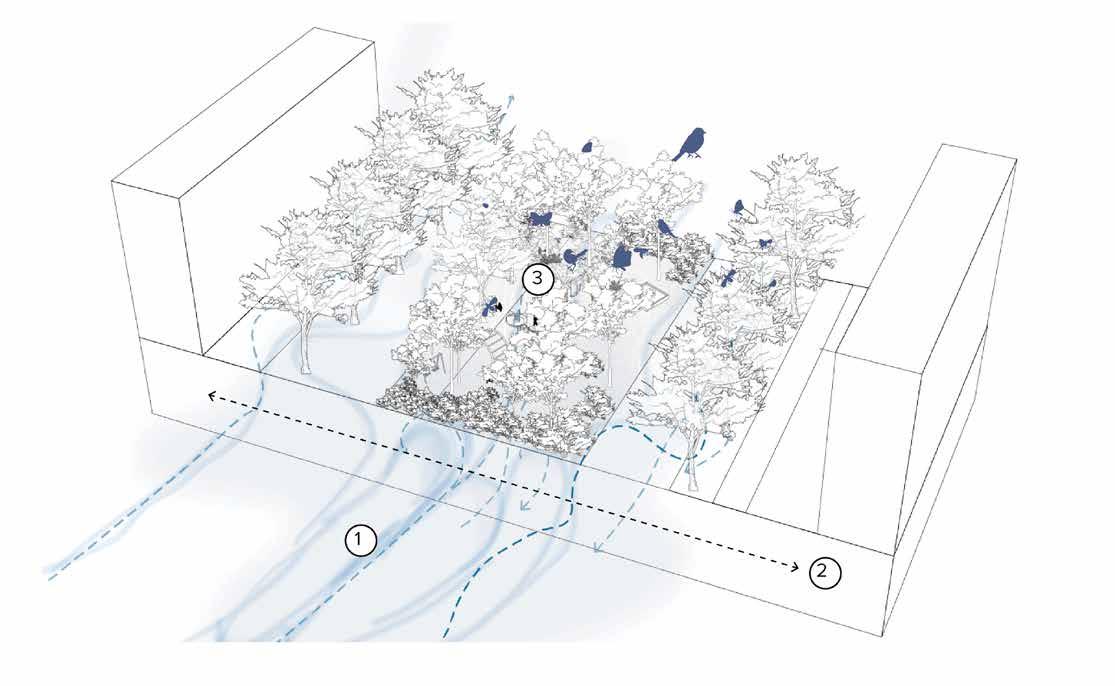
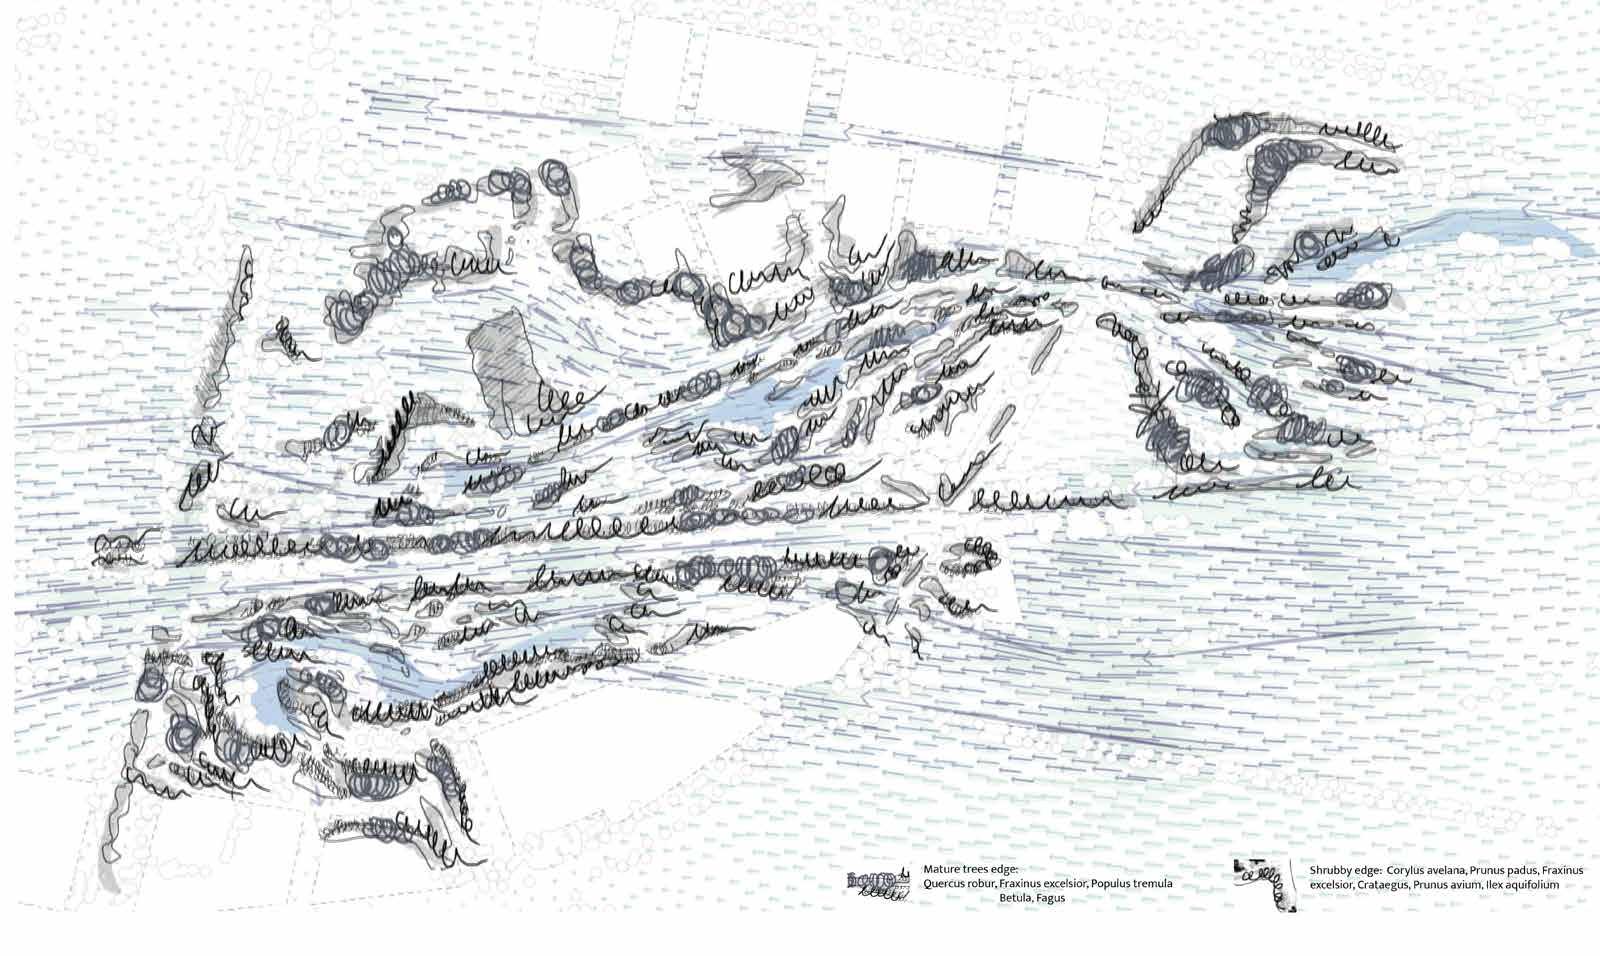
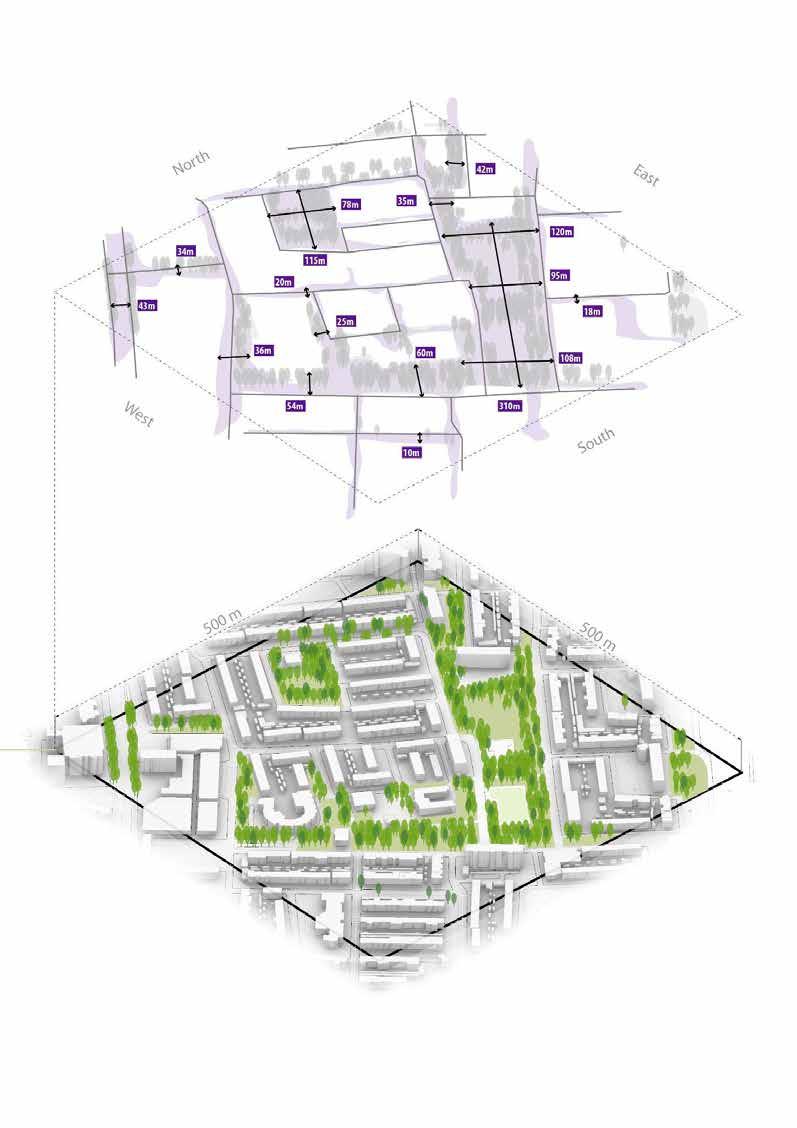
The West area of Breda’s wind stream is the most exposed to prevailing southwestern winds. Building upon the existing tree framework, houtwallen that were originally established as protective tree lines for the protection of fields and filtering wind streams, the plan further elaborates on the composition of outdoor rooms, carefully shaped by the placement of new trees. This approach not only reinforces the existing green structure but also enhances the creation of diverse sheltered spaces. The introduction of new trees complements the existing ones.
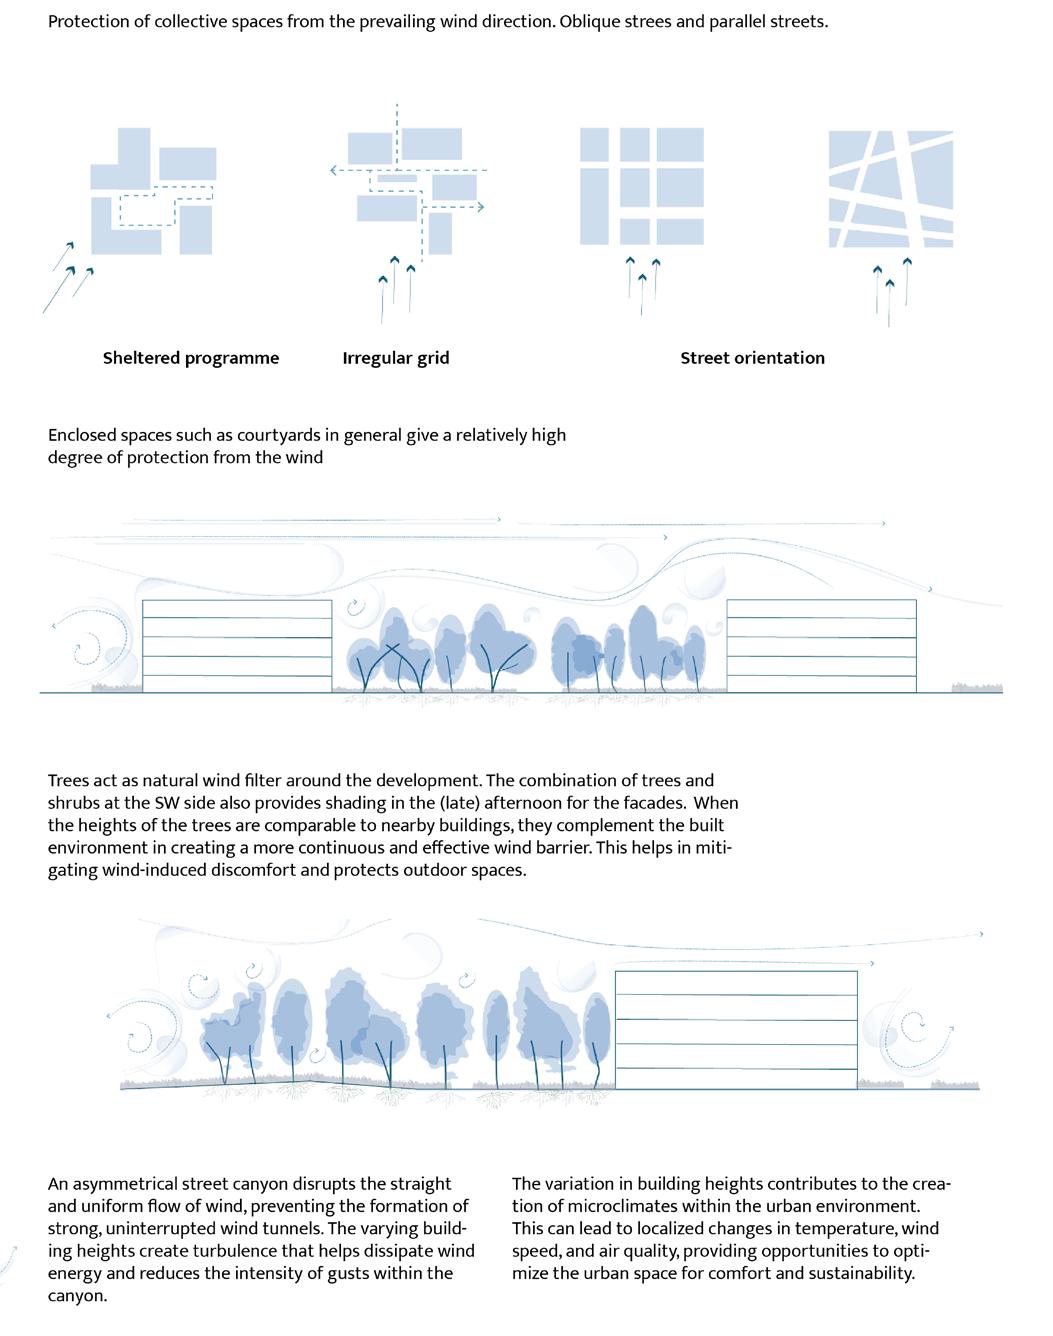
Topography is raised along the lines of the new tree structure. The design of these outdoor rooms serves a dual purpose. Firstly, it provides wind protection, ensuring that the urban space is shielded from strong gusts. This deliberate placement of trees and layered planting helps disperse wind energy and minimizes its impact on the surroundings, creating a more comfortable and inviting atmosphere for residents and visitors alike.
Secondly, the outdoor rooms offer sheltered spaces for wildlife. By carefully considering the needs of local fauna, the plan incorporates habitats within the green areas. These sheltered zones not only enhance biodiversity but also create a sustainable and balanced ecosystem within the urban environment.
The implementation of this proposal opens up opportunities for a variety of programs within the outdoor rooms. These programmable spaces can host recreational activities, and community events, or simply provide serene spots for relaxation. The versatile nature of the design allows for a seamless integration of human-centric and ecological elements, fostering a dynamic and inclusive urban environment.
Wind rooms West stream area
Academie van Bouwkunst Amsterdam 23 | 24 | Rachel Borovska
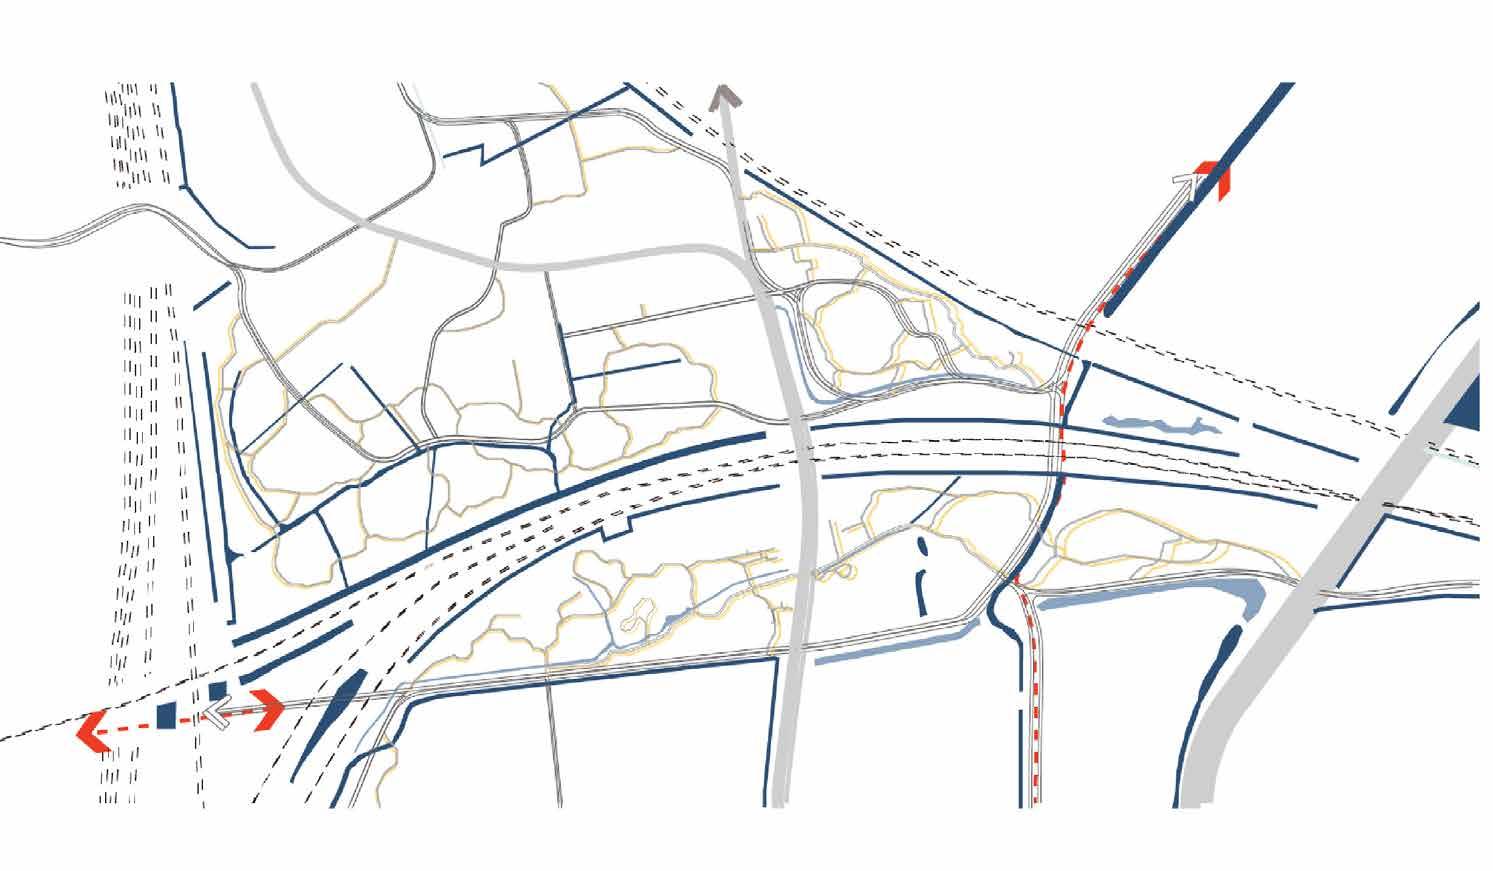
Current situation
In the western segment, the tree canopy is largely fragmented into disconnected patches, interrupted and constrained by infrastructural lines. As a result, wind streams flow unguided across the entire site.
Legenda: Existing trees Wind Stream
Complemented tree structure
The first design intervention involves complementing the existing tree canopy by introducing new trees arranged in room-shaped formations, enriching the landscape.
Legenda: Tree structure (New and Existing)
Strong (Main) Wind Stream
Dispersed Wind Stream
Academie van Bouwkunst Amsterdam 23
24
Rachel Borovska
Wind rooms
Planting in the shape of rooms involves arranging vegetation in a way that defines enclosed spaces. These “rooms” can act as natural windbreaks by providing physical barriers that interrupt and redirect the flow of the wind. The enclosed spaces help reduce wind speed within the defined areas, creating more comfortable and sheltered environments.
Legenda:
Legenda: vortex vortex
Legenda:
Legenda:
Academie van Bouwkunst Amsterdam 23 | 24 | Rachel Borovska
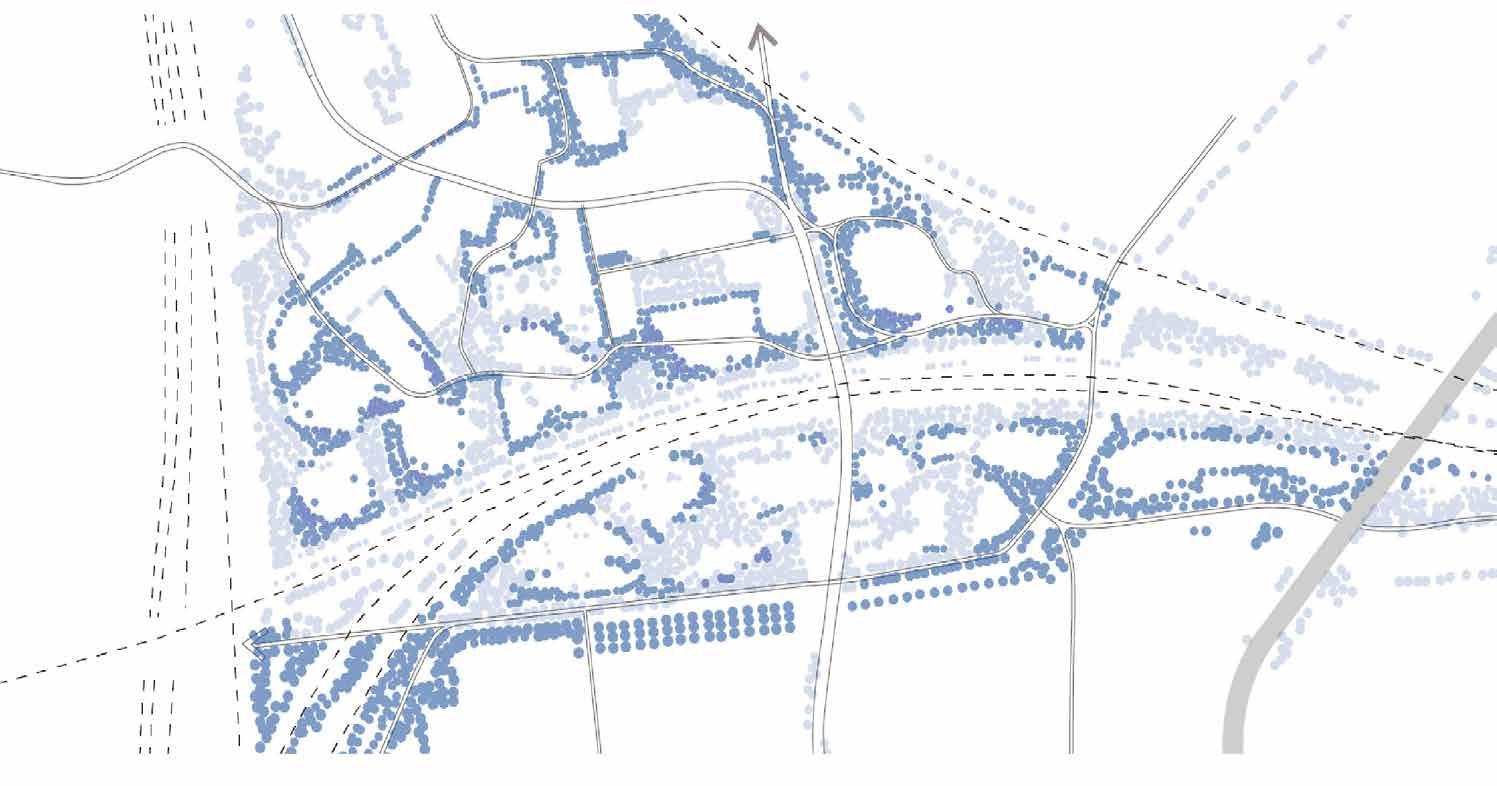
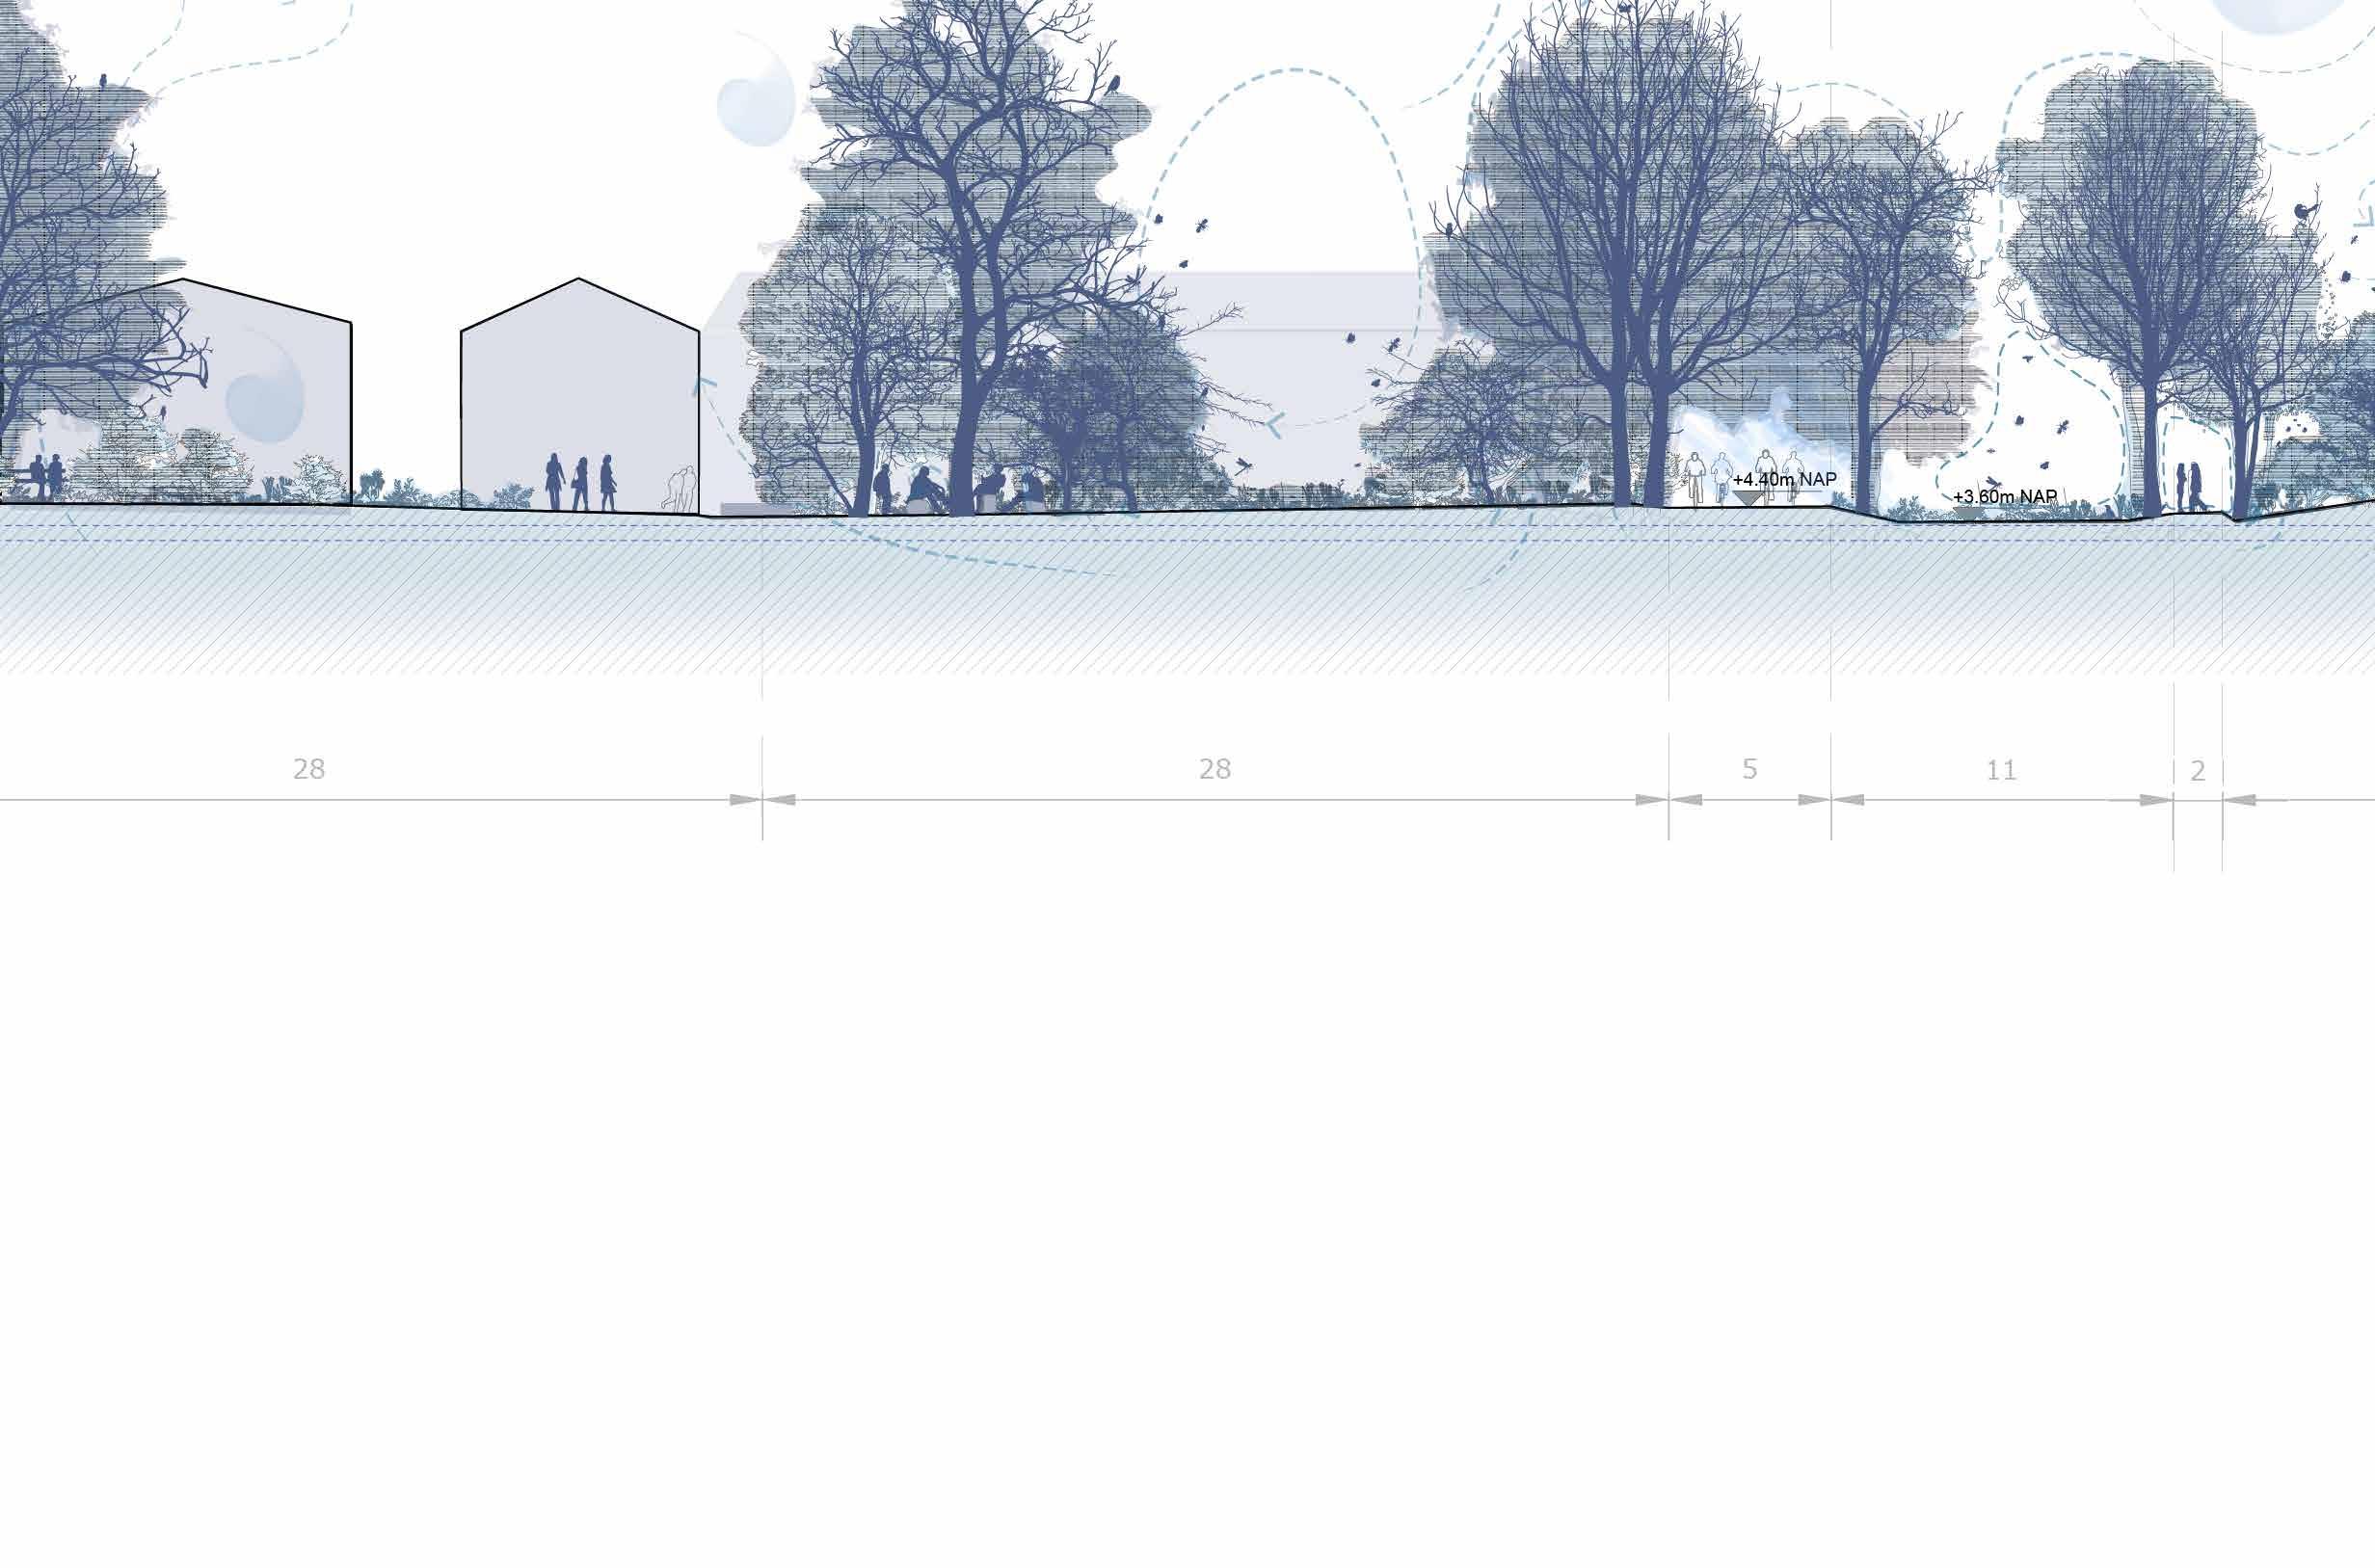
“Planting
the Edges”: Planting Plan Principle for Wind Protection
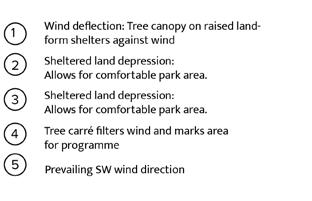
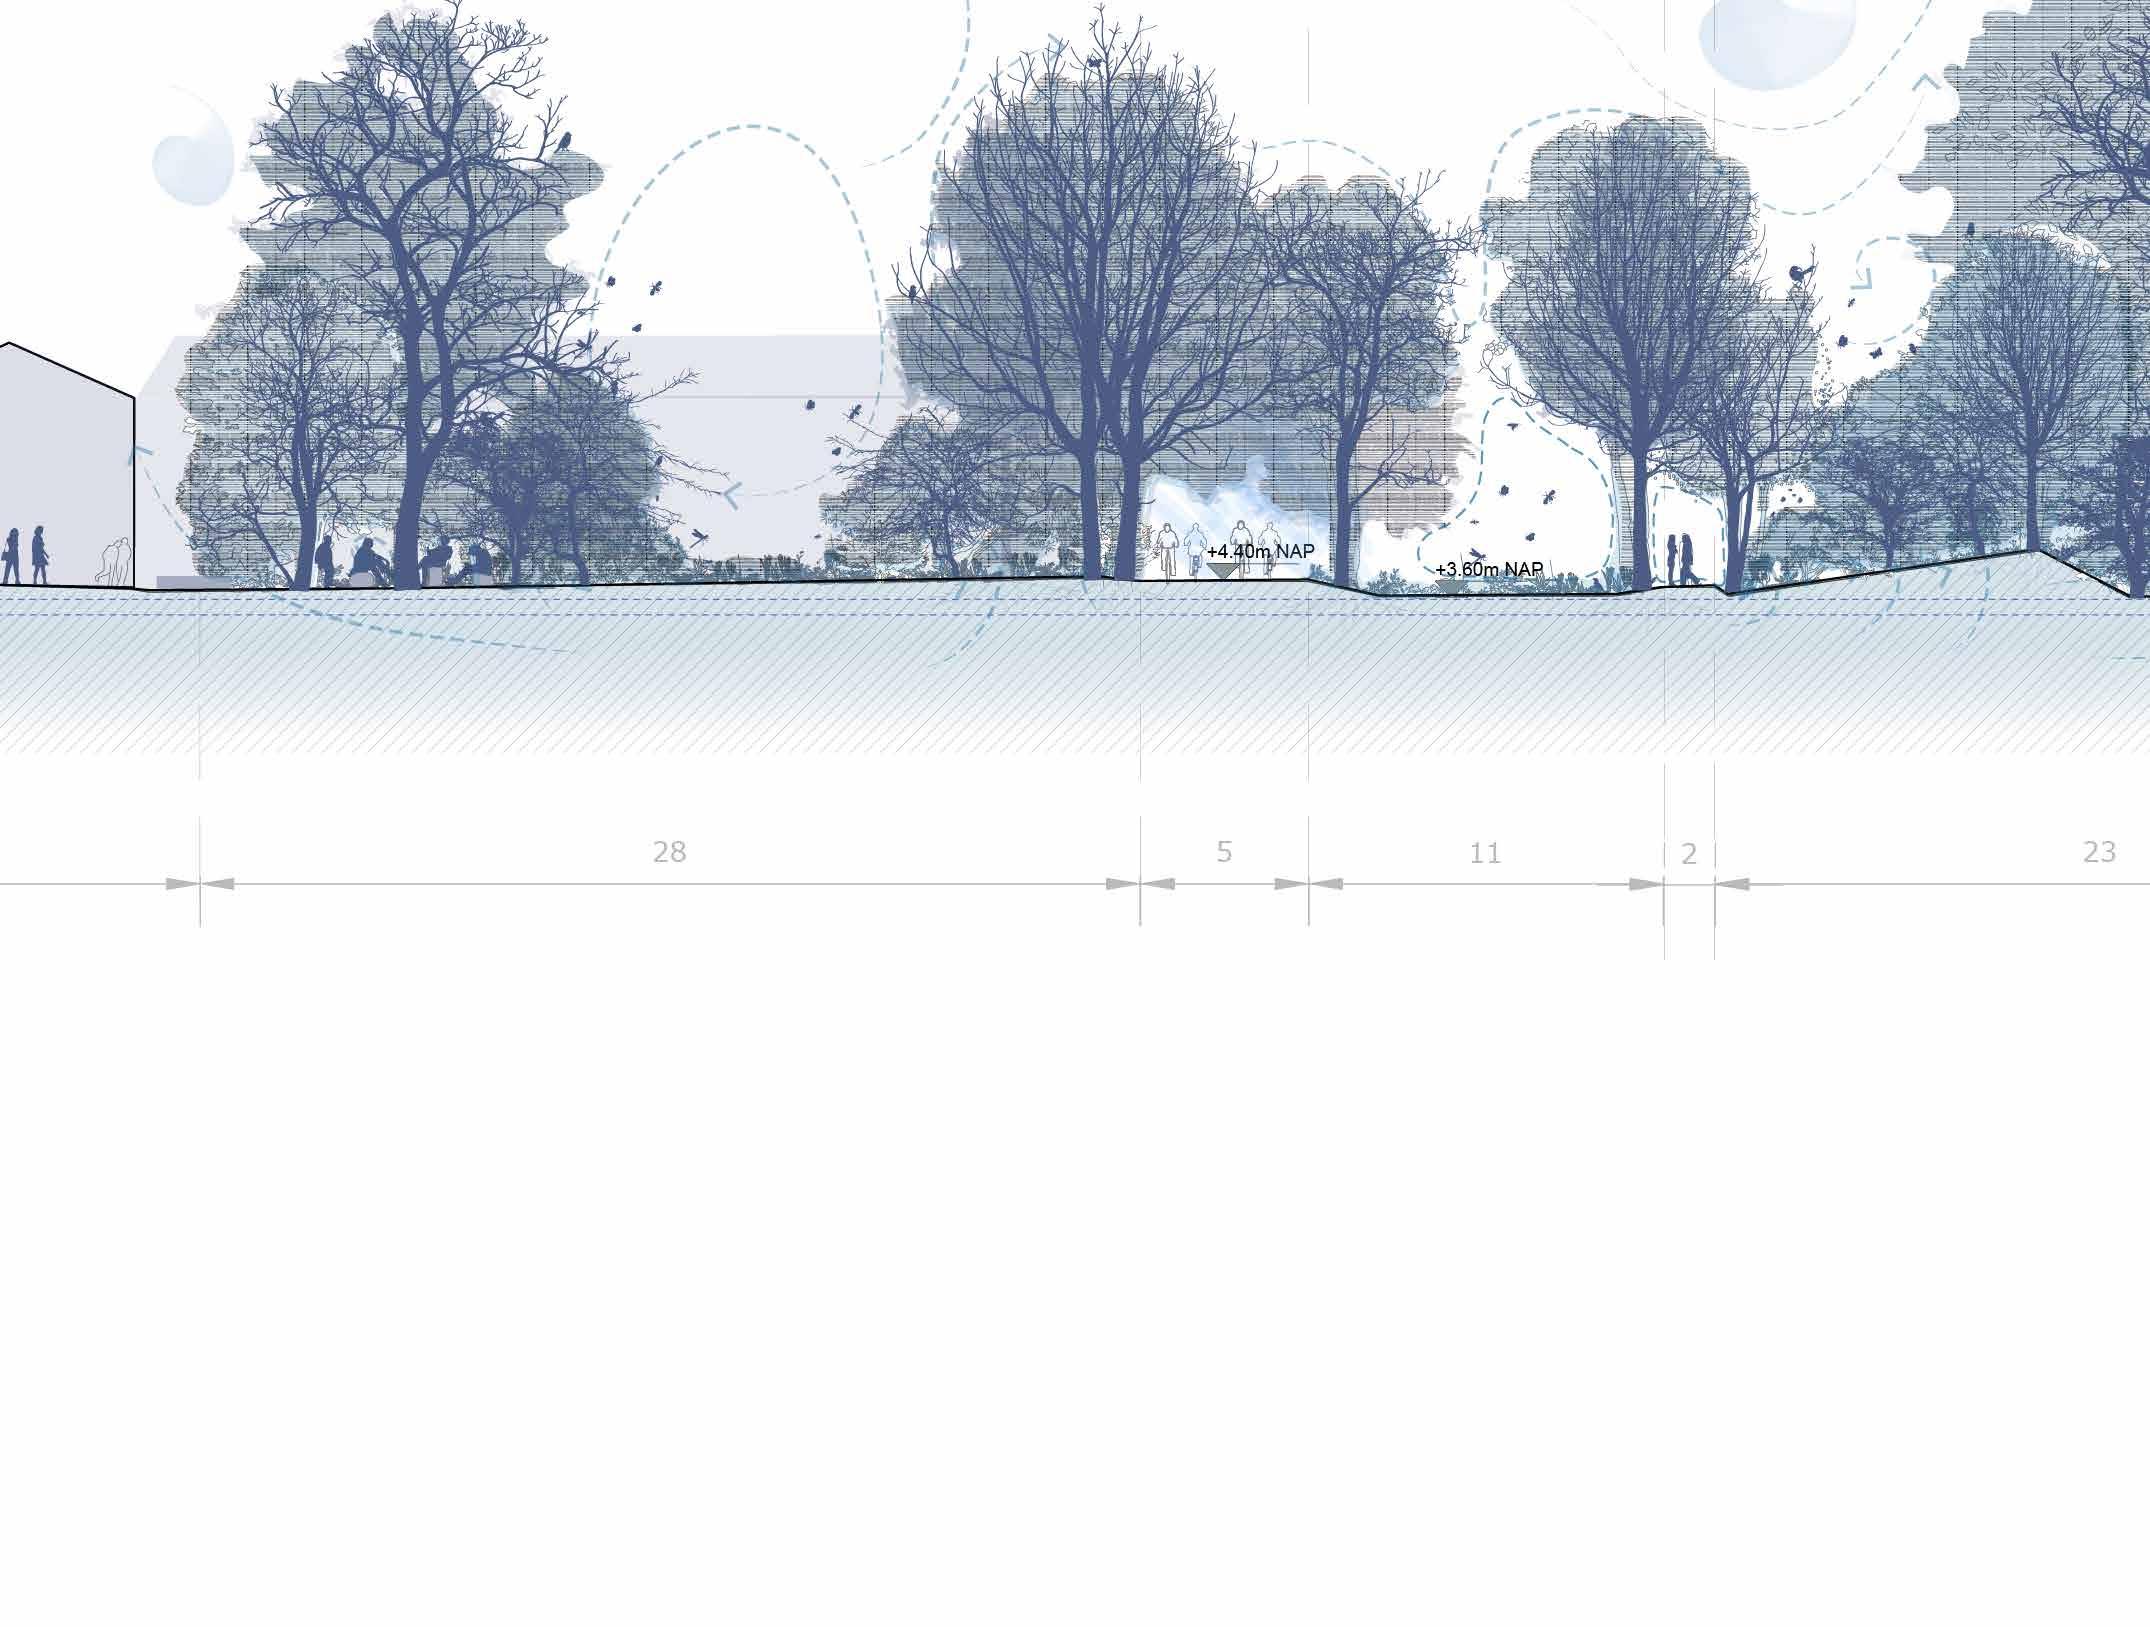
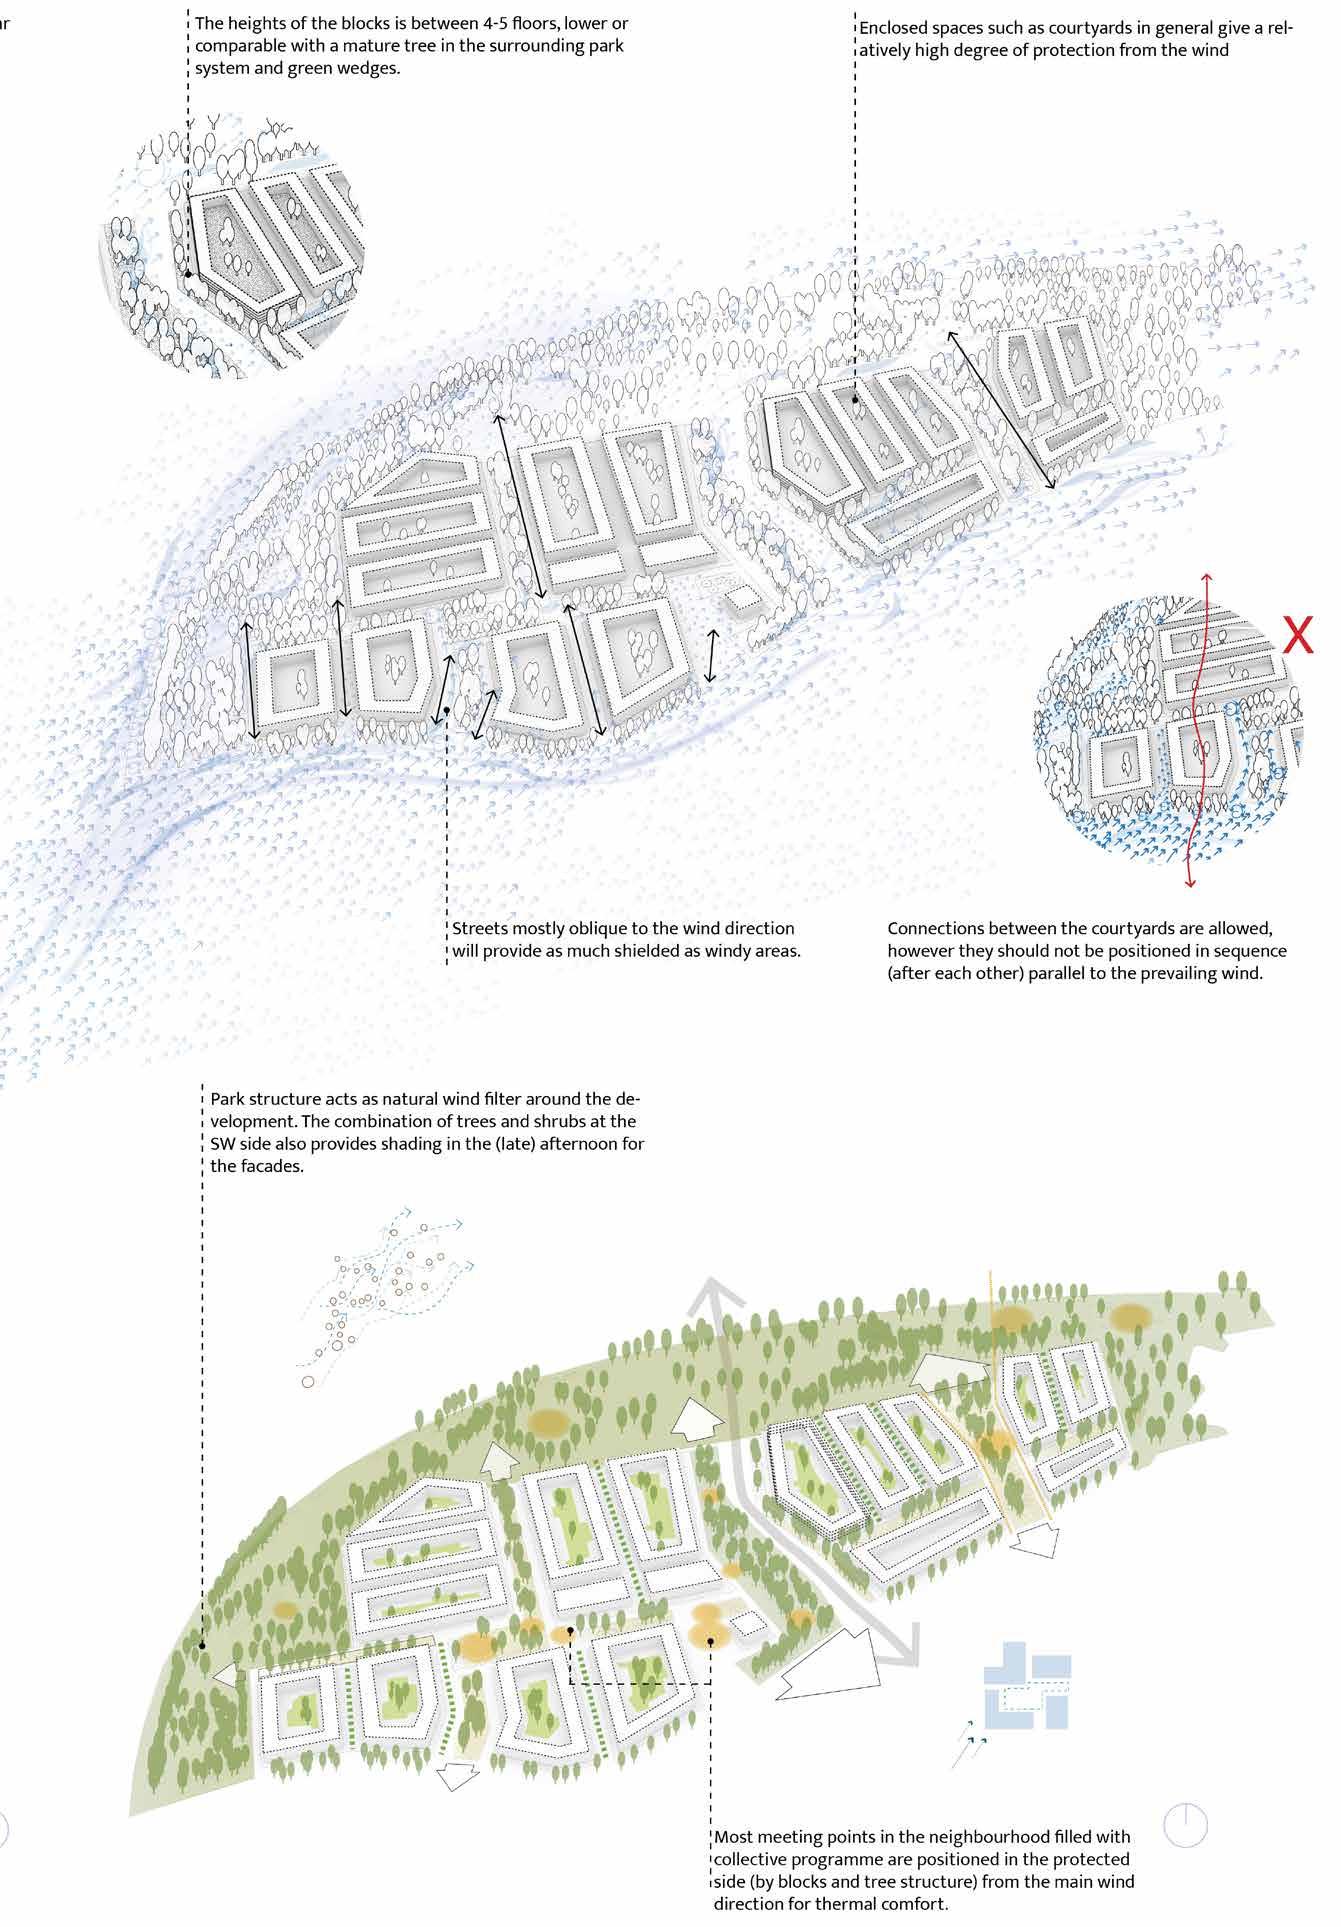
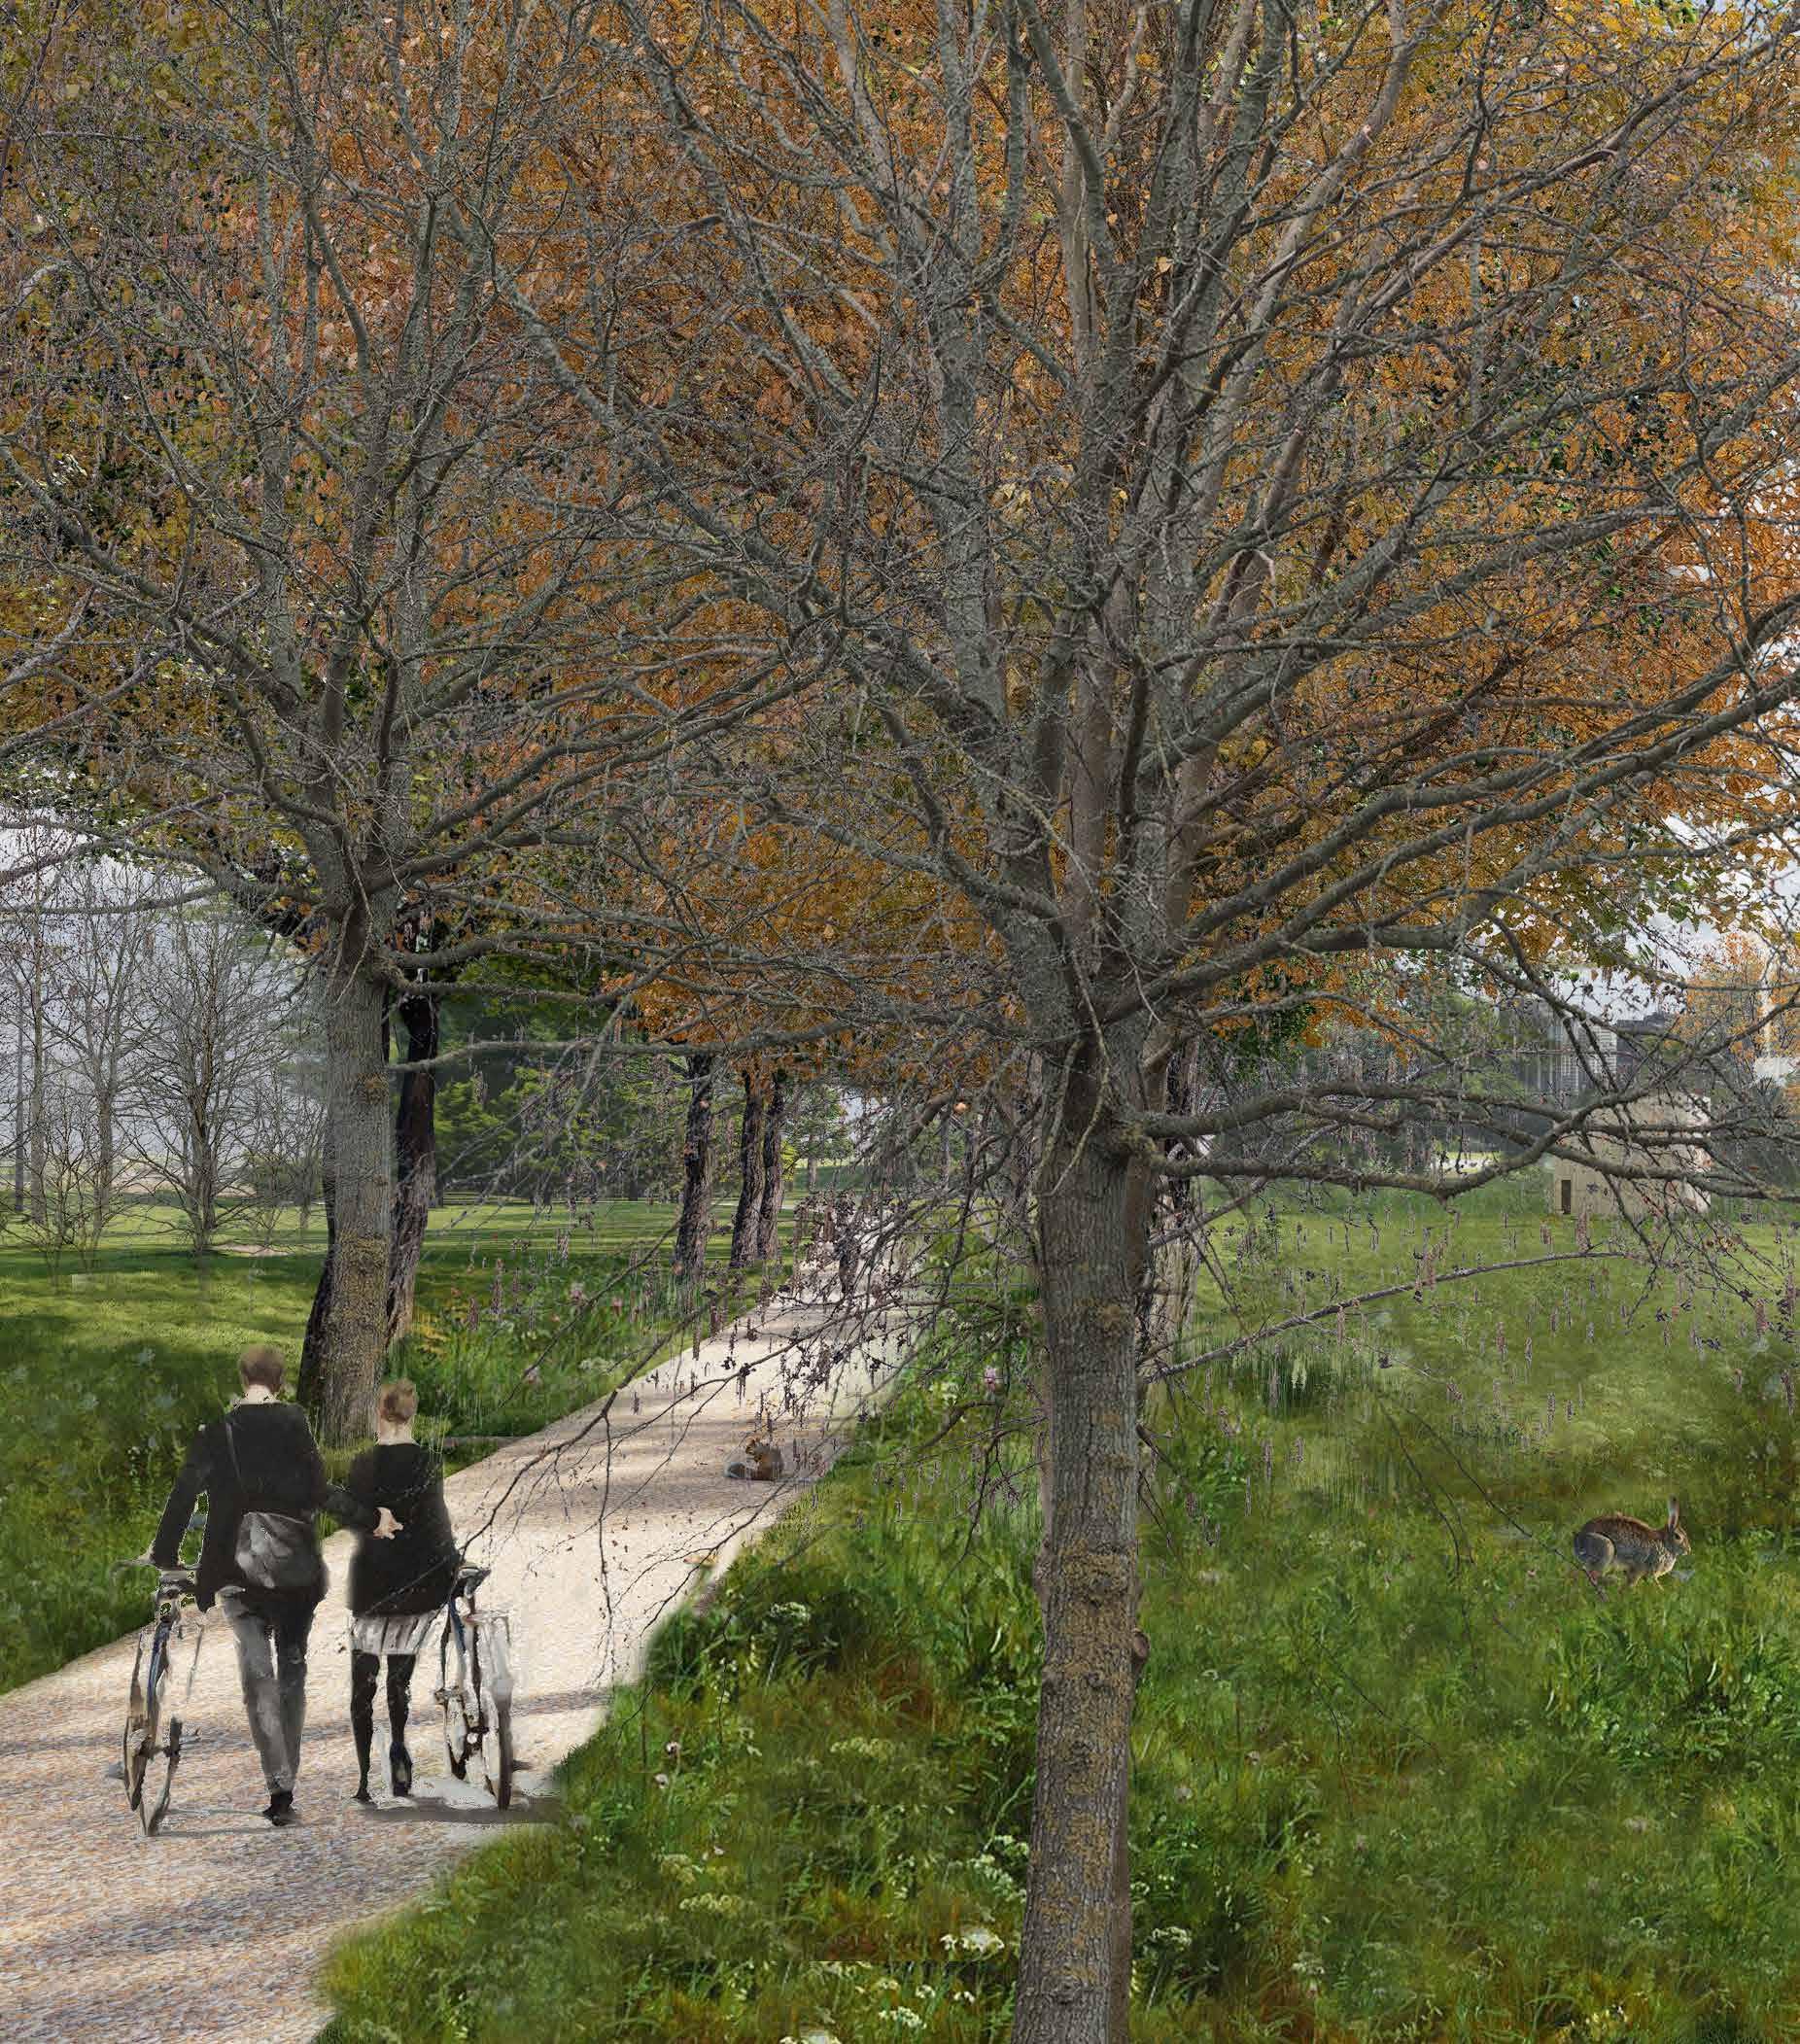
The pathway system invites exploration, guiding visitors through the tree-formed rooms. The wind rooms, generally twice the height of a mature tree, help reduce wind intensity between them. Pathways follow the tree lines and natural terrain, providing a sheltered experience. Long, continuous cycling routes traverse the park, reconnecting the city with its outskirts. Meanwhile, transversal connections integrate neighborhoods, creating ‘incisions’ through the railway corridor that reconnect the northern and southern parts of Breda.
Legenda
Recreational paths
Fast pathways/cyclist routes
Waterways
Extending on the existing tree structure allowed for the creation of landscape rooms.
Legenda
Existing Trees
New Trees
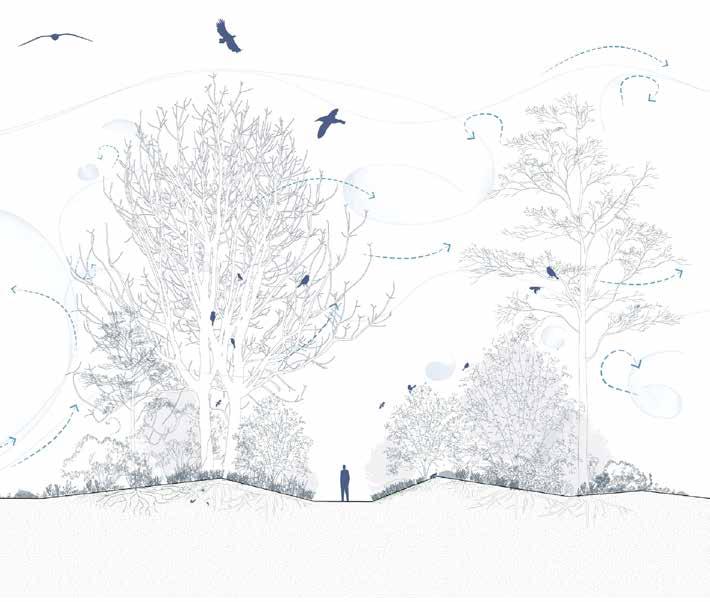
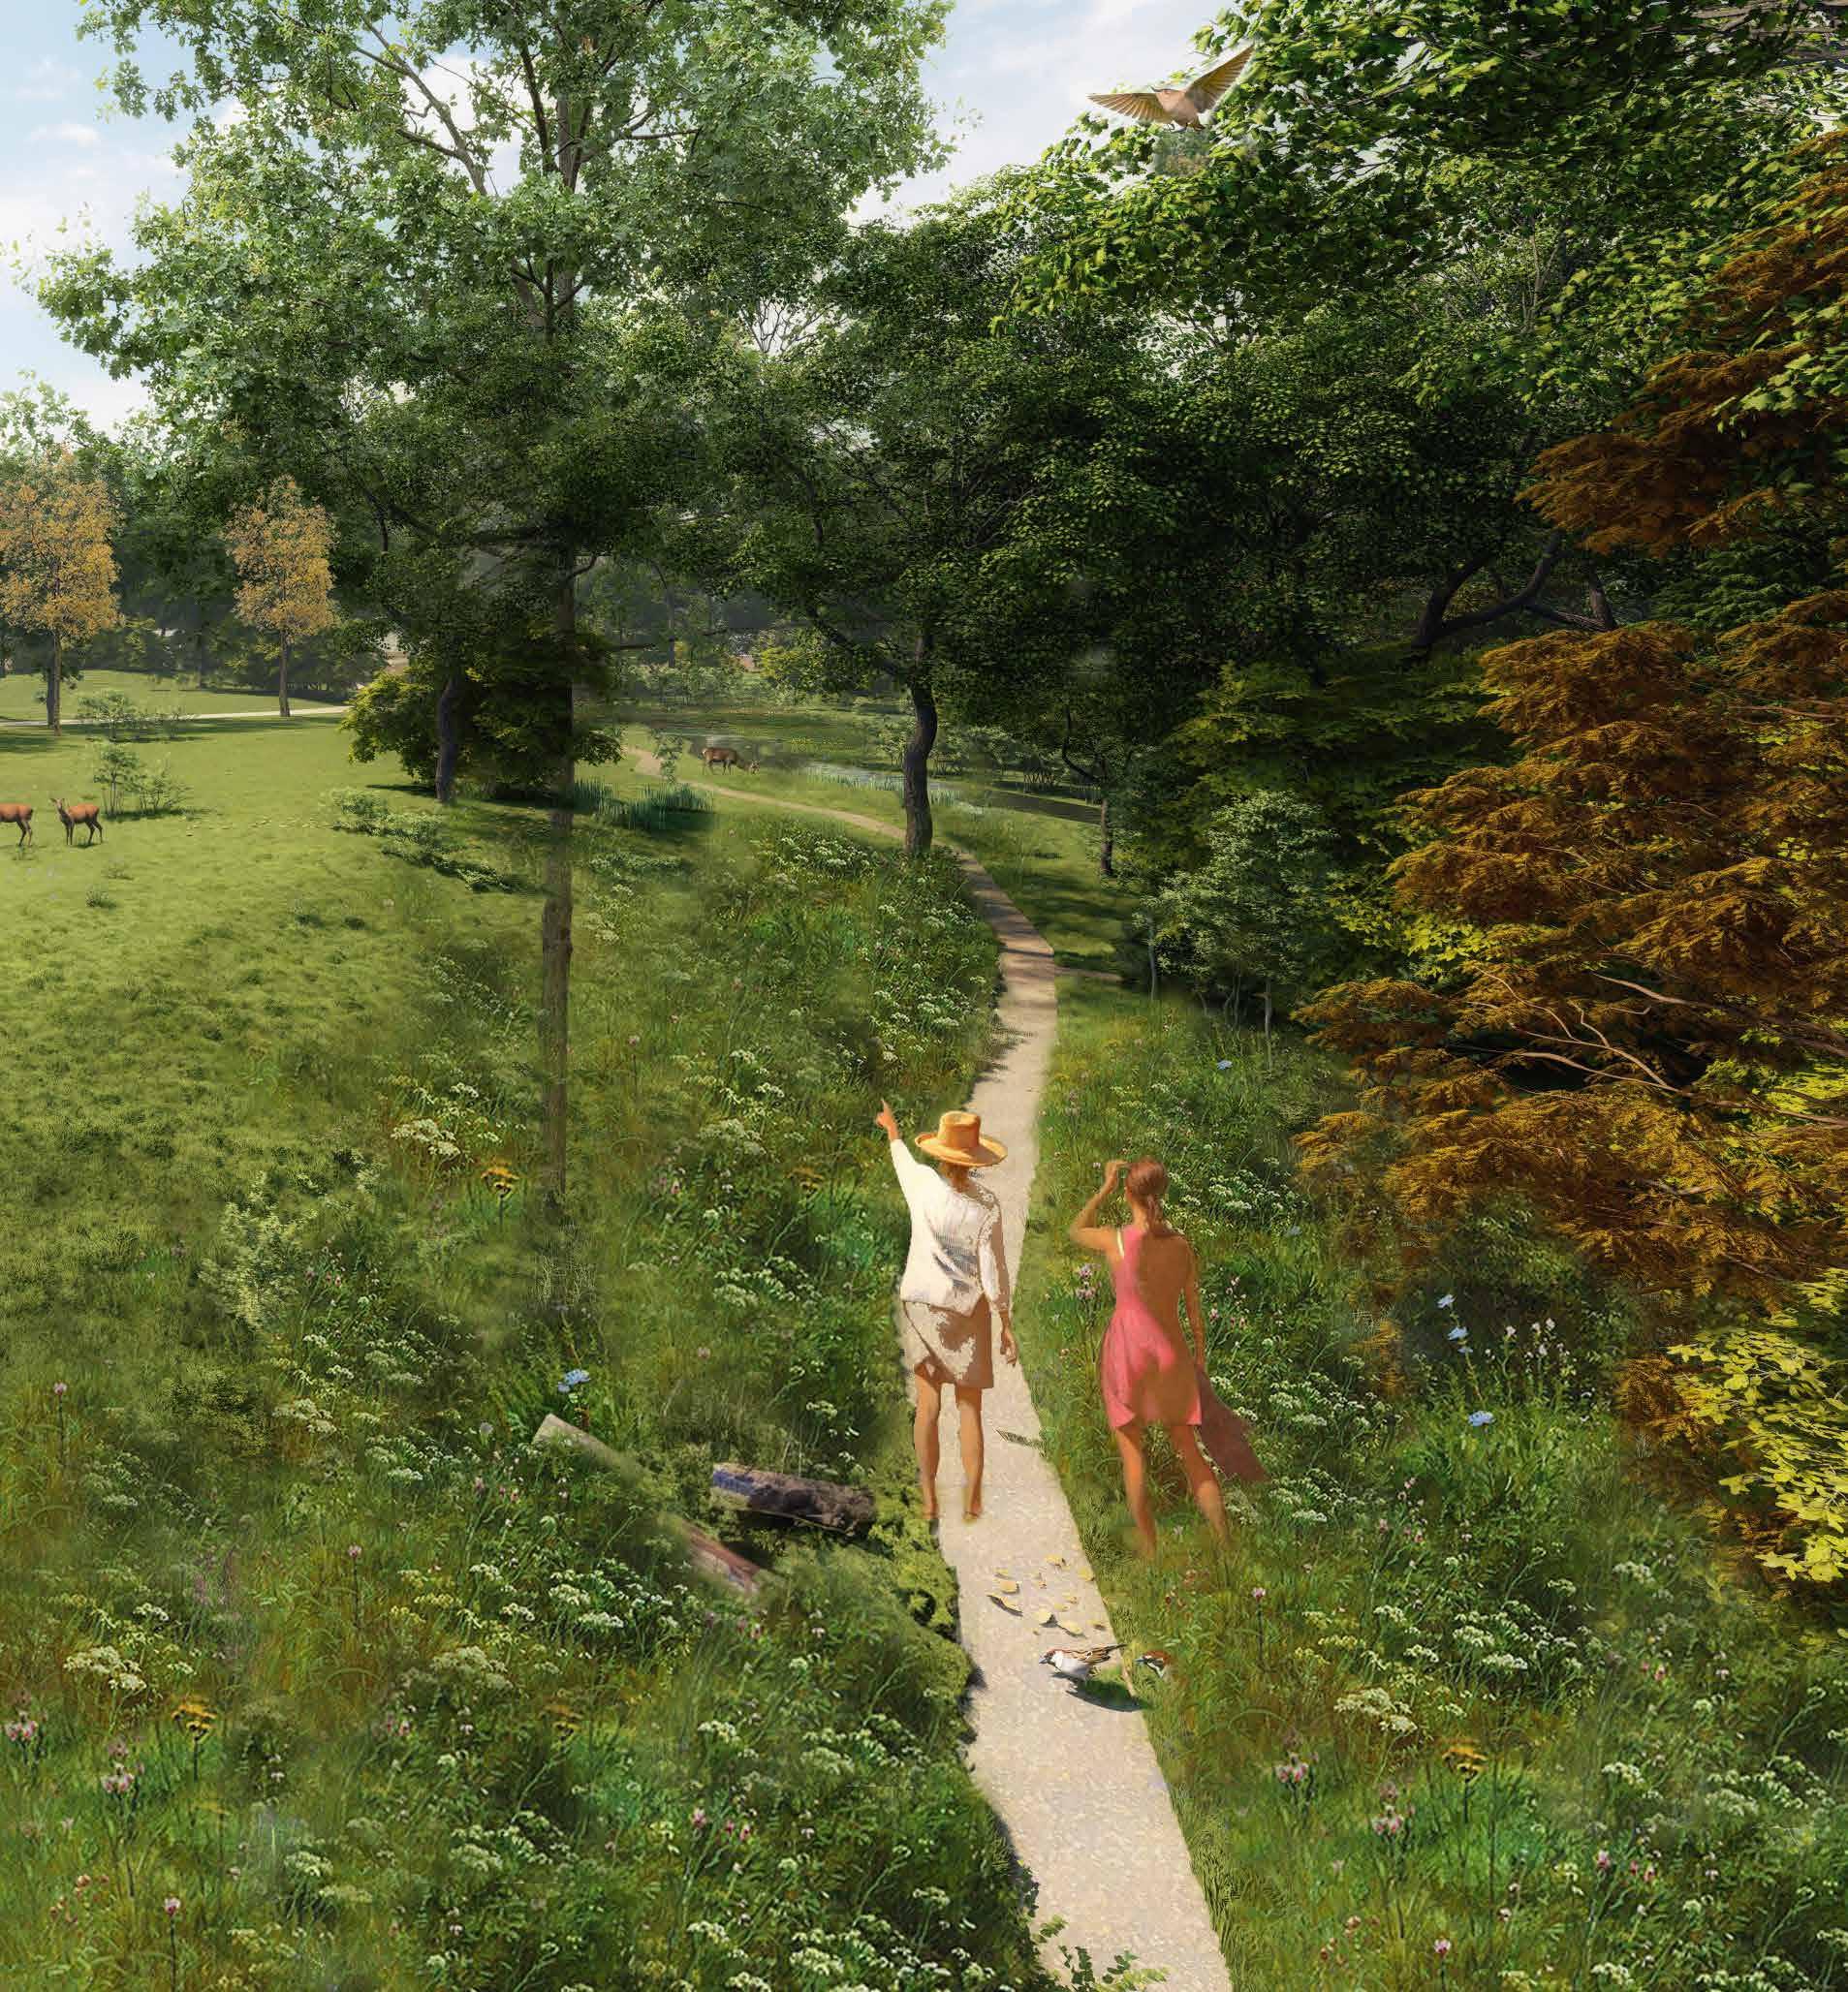
Wind rooms to retreat into
The wind rooms create various opportunities for both human activity. biodiversity and ecology. They provide shelter from the prevailing SW wind direction and a diversity of programme. Simultaneosly they serve as ecological sanctuaries - spaces where human intervention is minimized. Even in the smallest crevices, insects find shelter, taking shelter in the nooks of this dynamic environment.
Wind
Ecological restoration of Breda’s urban fabric through wind
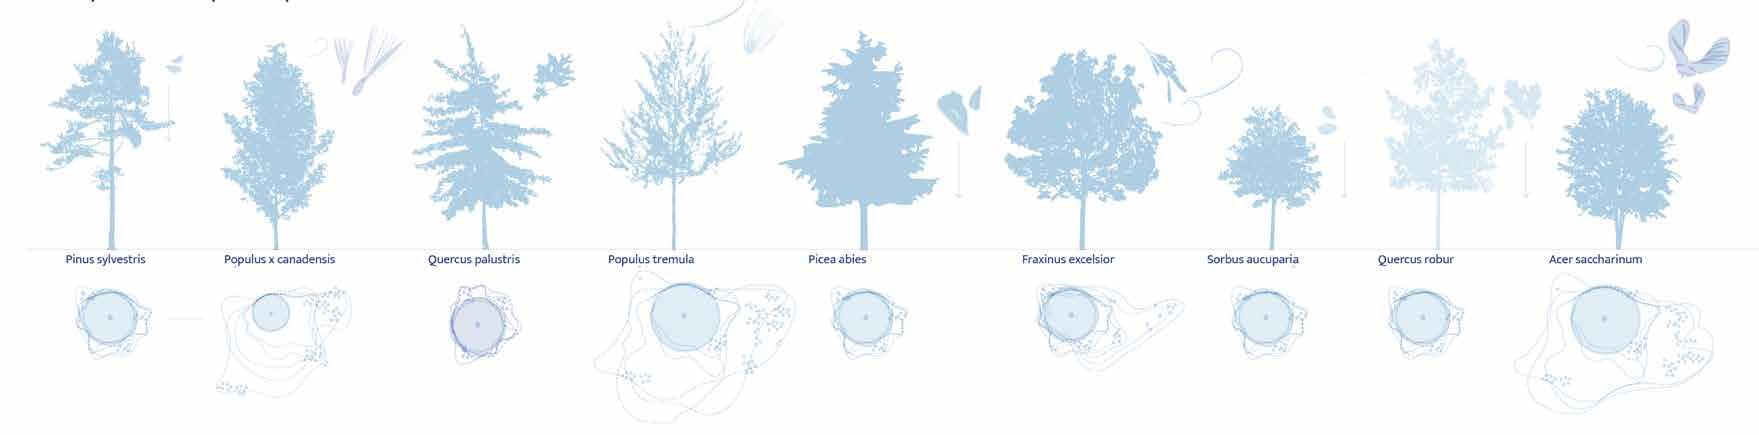
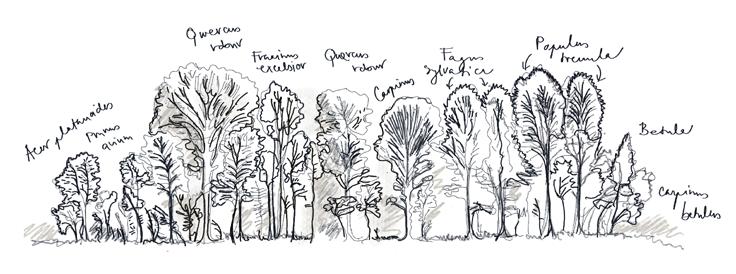
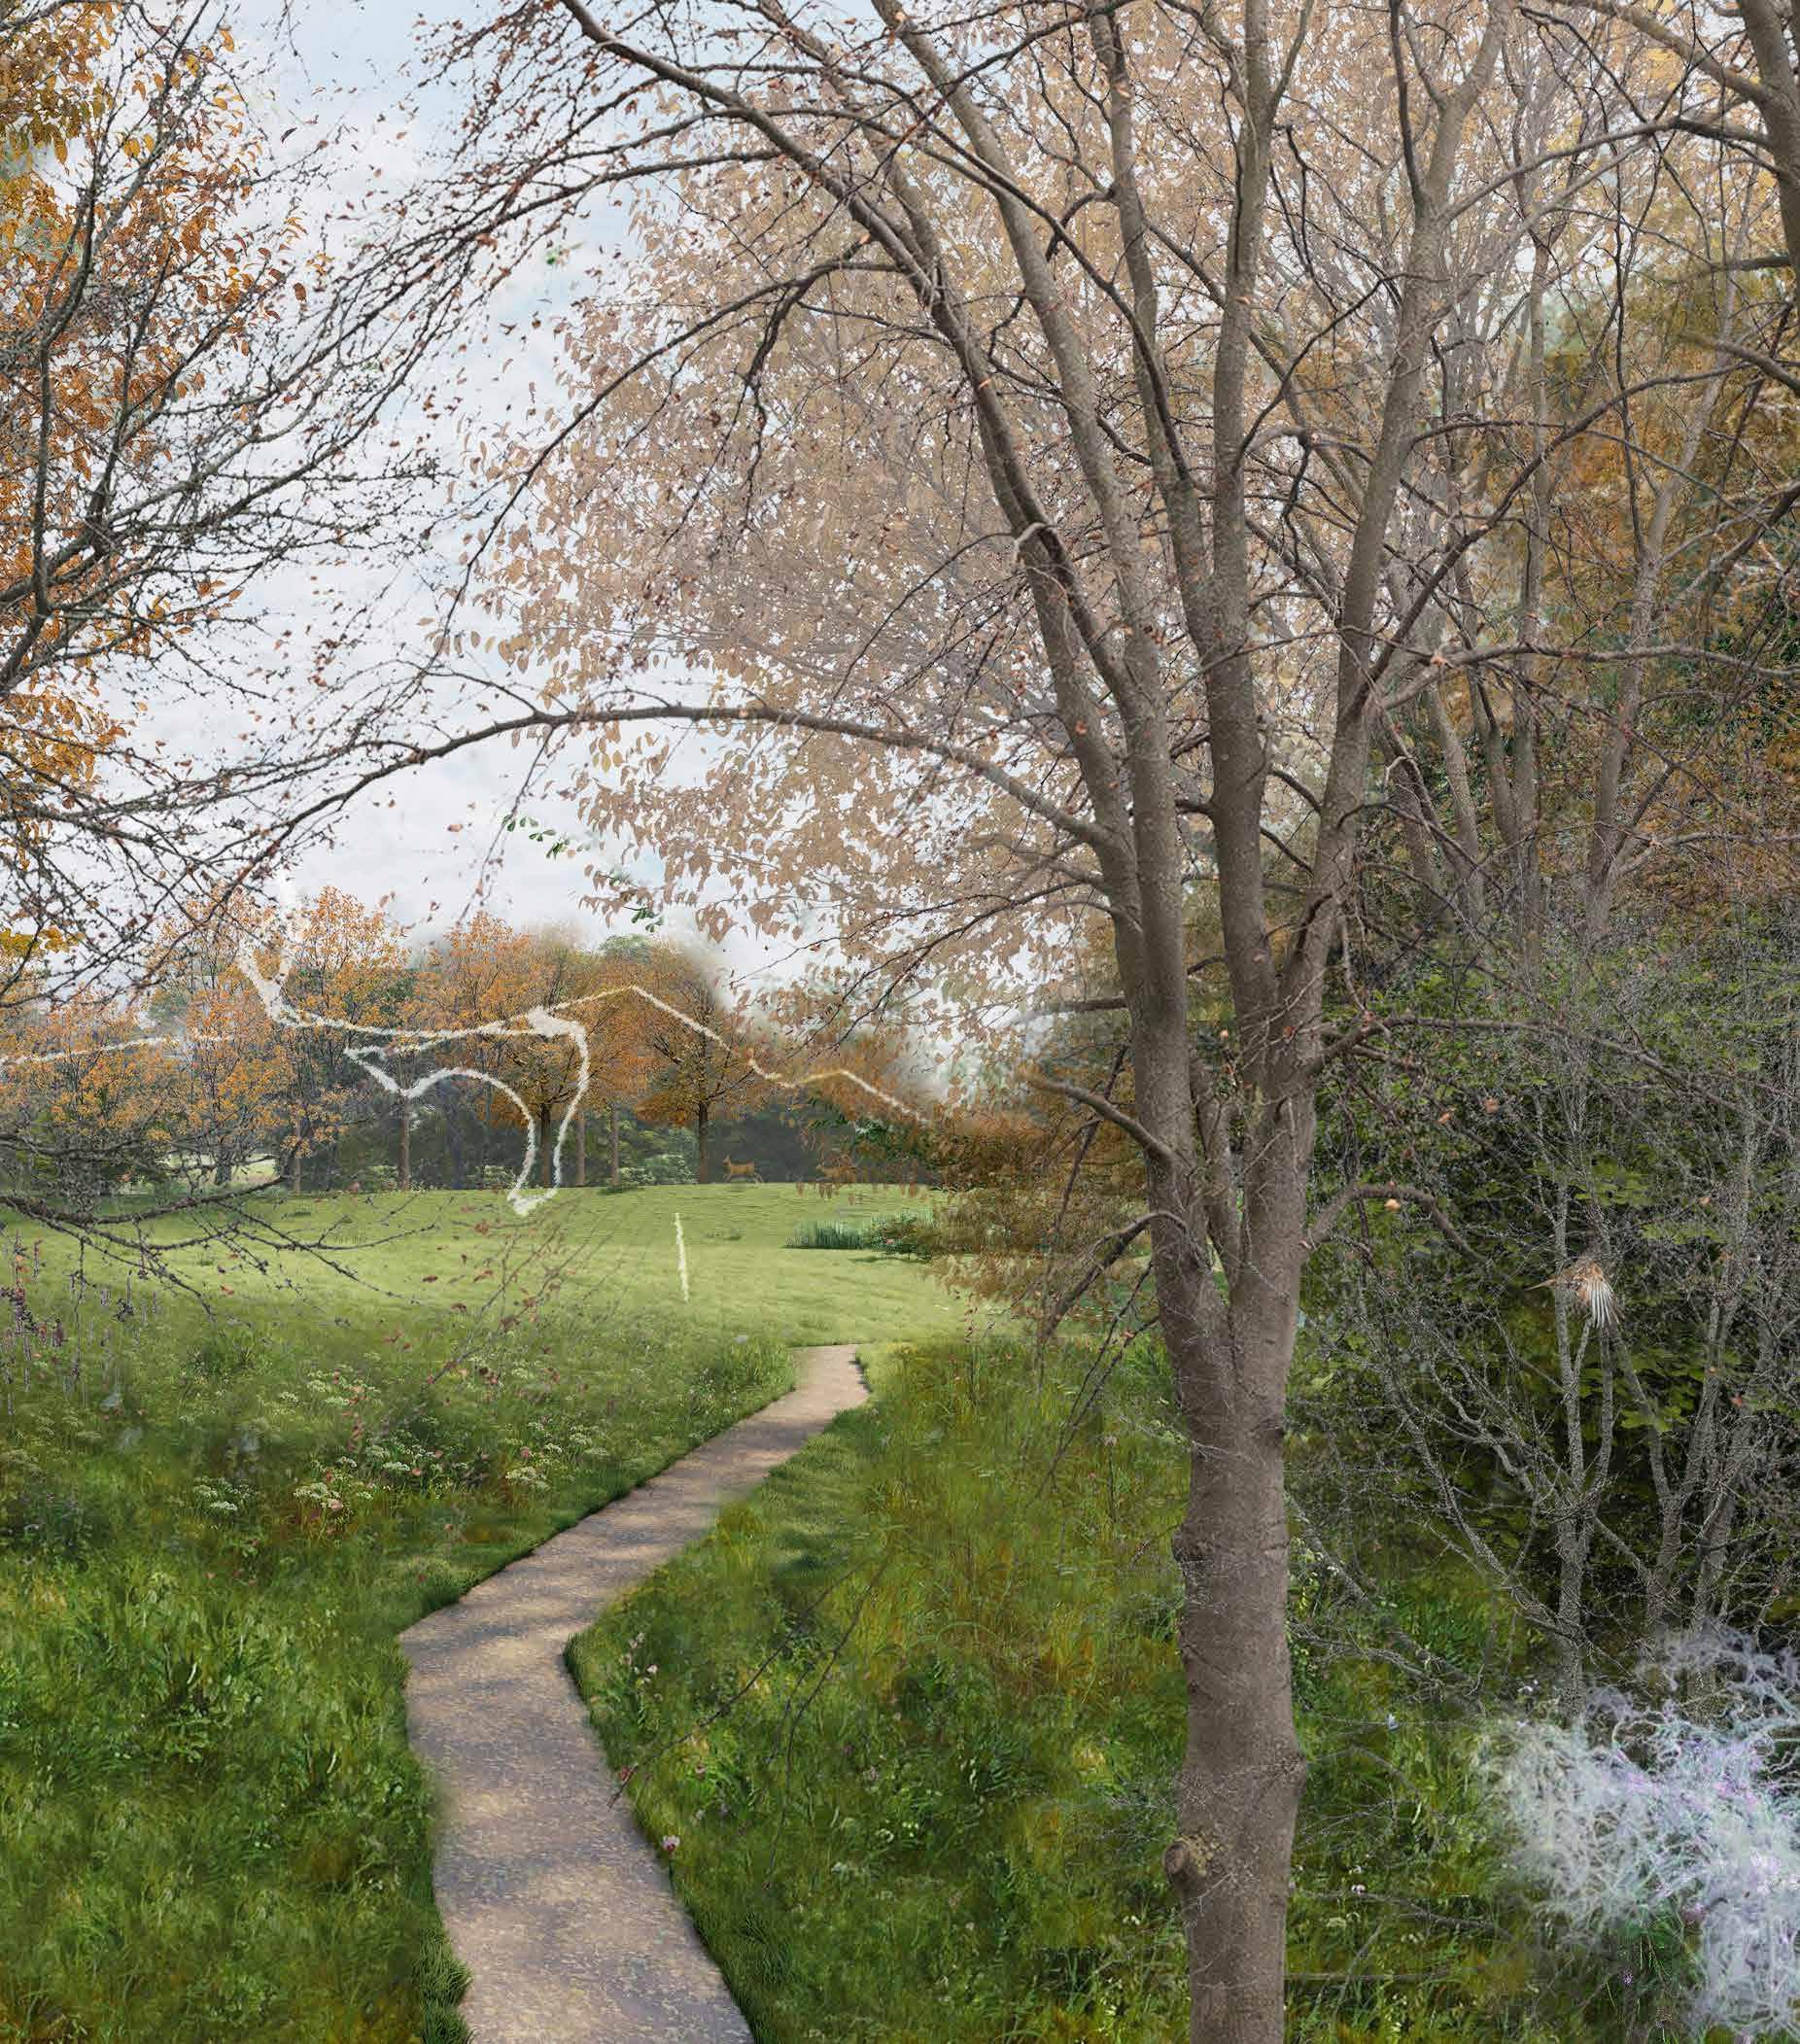
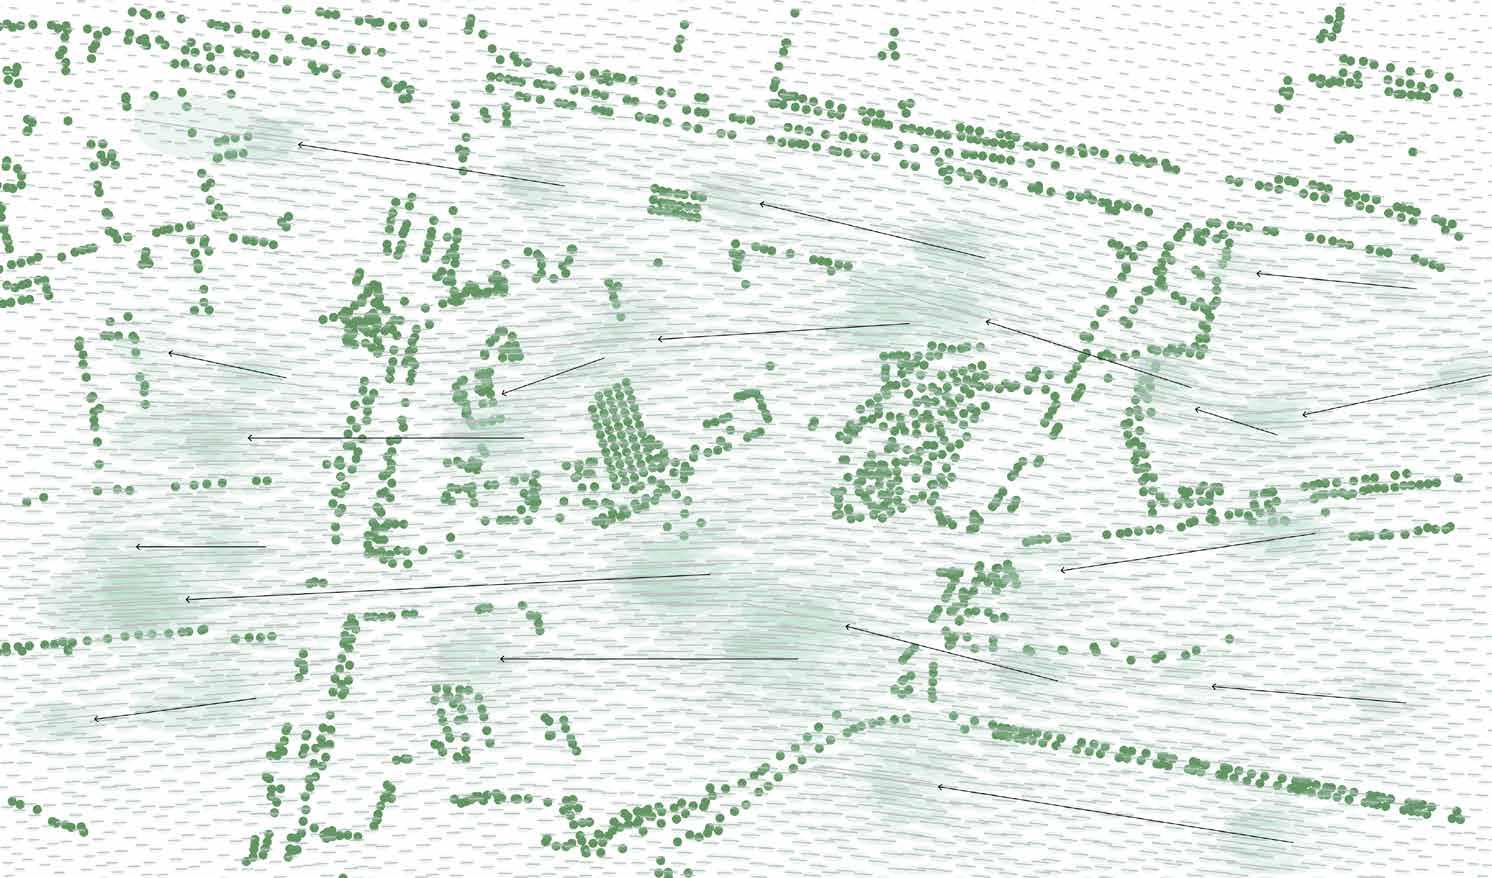
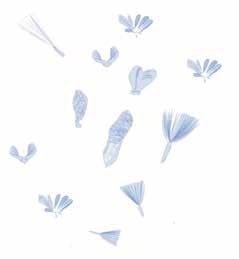
Seeds of various tree species can travel long distances by air, with their range largely determined by their weight. The lighter the seed, the farther it can be carried by the wind. Species such as Quercus robur (oak) produce heavy seeds that fall quickly to the ground, relying instead on animals for dispersal, as they serve as a key food source. In contrast, species like Populus (poplar) produce exceptionally light seeds that can travel great distances on the wind. 16
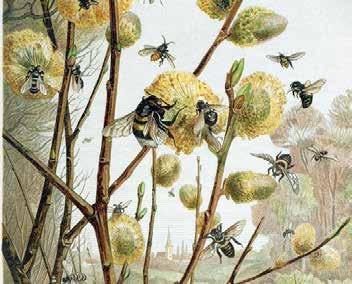
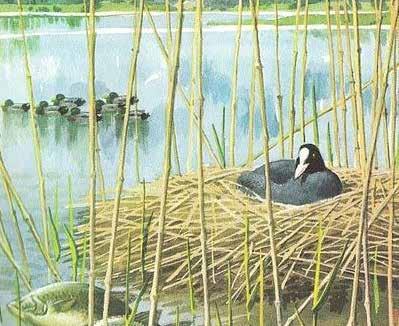
Besides human comfort, sheltering from wind is a common behaviour and aspect in landscapes for birds, amphibians and insects. Small polinators and insects such as bees and butterflies seek shelter behind rocks or behind leaves, crevices or behind tree barks. Some mammals hide in burrows, or birds in tree trunks or behind tall grasses.
Academie van Bouwkunst Amsterdam 23 | 24 | Rachel Borovska
Academie van Bouwkunst Amsterdam 23 | 24 | Rachel Borovska
“Planting
the Edges”:
Planting Plan Principle for Wind Protection
The wind rooms are composed of the native tree species found in the area. These “rooms” work with the wind, create natural windbreaks that help moderate the wind speed and direction. By placing certain trees and plants in strategic locations, the spaces formed can provide shelter from harsh winds and guide cooler air through the city, balancing temperature regulation.
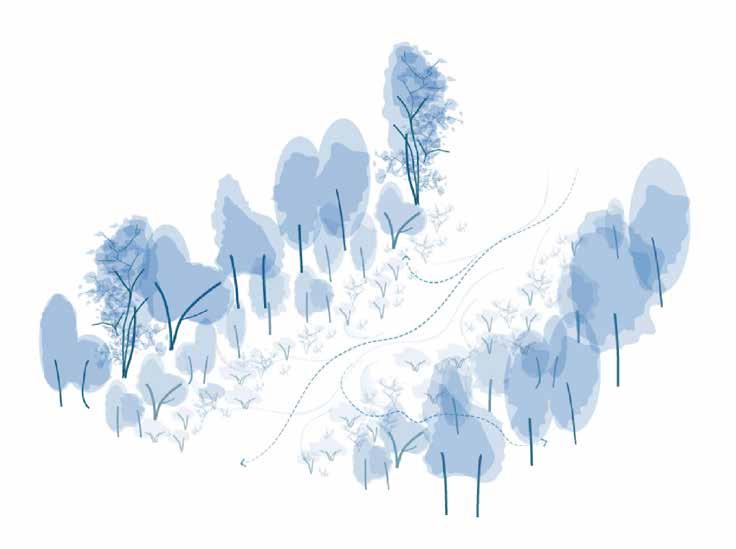
The placement of pioneer plants—species that thrive in open, sun-exposed areas—serves as the foundation, establishing a resilient environment where later-stage, shade-tolerant trees can follow. This succession allows for the space to evolve naturally, with each layer of planting complementing the next.
As the landscape evolves, the varied heights, densities, and types of vegetation will create wind-sheltered environments that protect both plant and animal life. Many of the native species, such as the alder (Alnus glutinosa), birch (Betula pendula) or willows, have seeds that spread through the wind, reinforcing the idea of an interconnected network. The wind continues to carry a whole microworld of seeds and spores.
Layered planting contributes to the creation of microclimates within the landscape. The different vegetation layers create sheltered zones with varied wind speeds, temperatures, and humidity levels. These mi-
croclimates provide more suitable conditions for plant growth, animal, bird and insect shelter as well as for outdoor activities and human comfort.
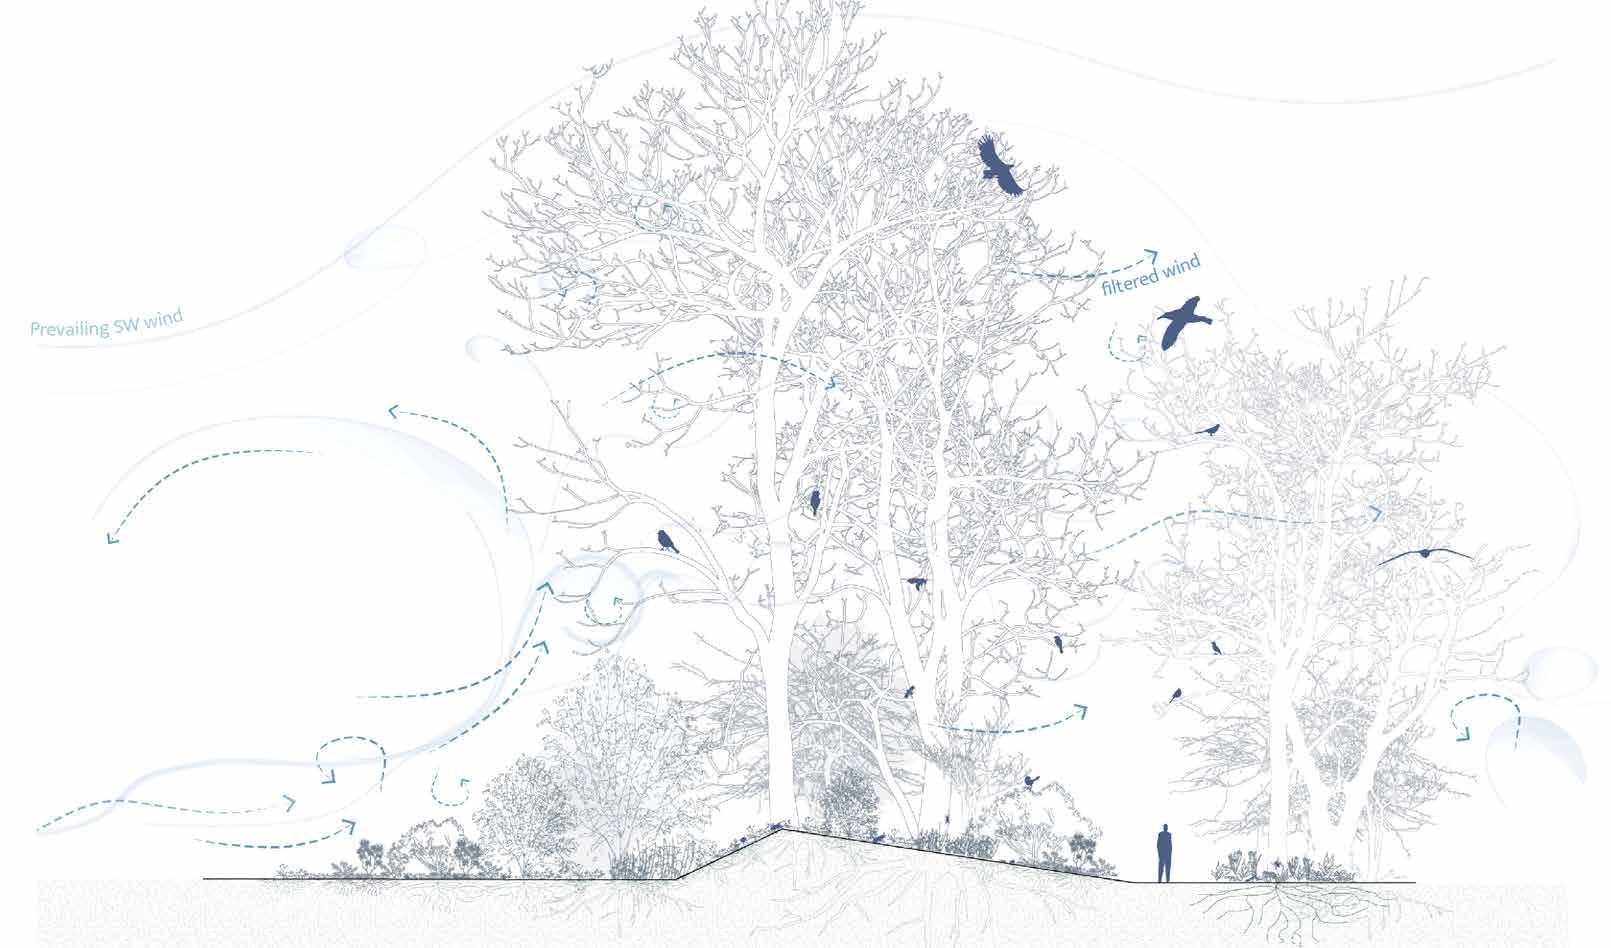
The taller layers, such as trees, are key in breaking up the wind, providing substantial shelter. Between them, shrubs and bushes act as an intermediate layer, further reducing wind speed and creating additional buffering zones. Their placement is critical in maintaining the overall wind sheltering effect, ensuring a gradual transition in wind strength throughout the landscape.
At ground level, perennials and grasses contribute to the layered system by intercepting and slowing down the wind near the surface. While these plants might not offer as much windbreak as their taller counterparts, they play a crucial role in diffusing the wind at ground level, enhancing the sheltered atmosphere.
Wind Woven | Ecological restoration of Breda’s urban fabric through wind
“Planting
the Edges”: Planting Plan Principle for Wind Protection
The diversity in plant heights adds roughness to the landscape, a concept known as “vegetative roughness.” This roughness disrupts the smooth flow of wind, leading to turbulence and a decrease in wind speed. Perennials and tall grasses contribute to this roughness, especially in the lower layers of the planting. The strongest winds occur during winter and autumn seasons. Tall trees serve as the primary layer in providing wind shelter. Planted strategically, these trees and their branches act as natural windbreaks, intercepting and deflecting the upper layers of wind. They help to create a barrier that absorbs and slows down the wind, preventing it from reaching ground level with full force.17
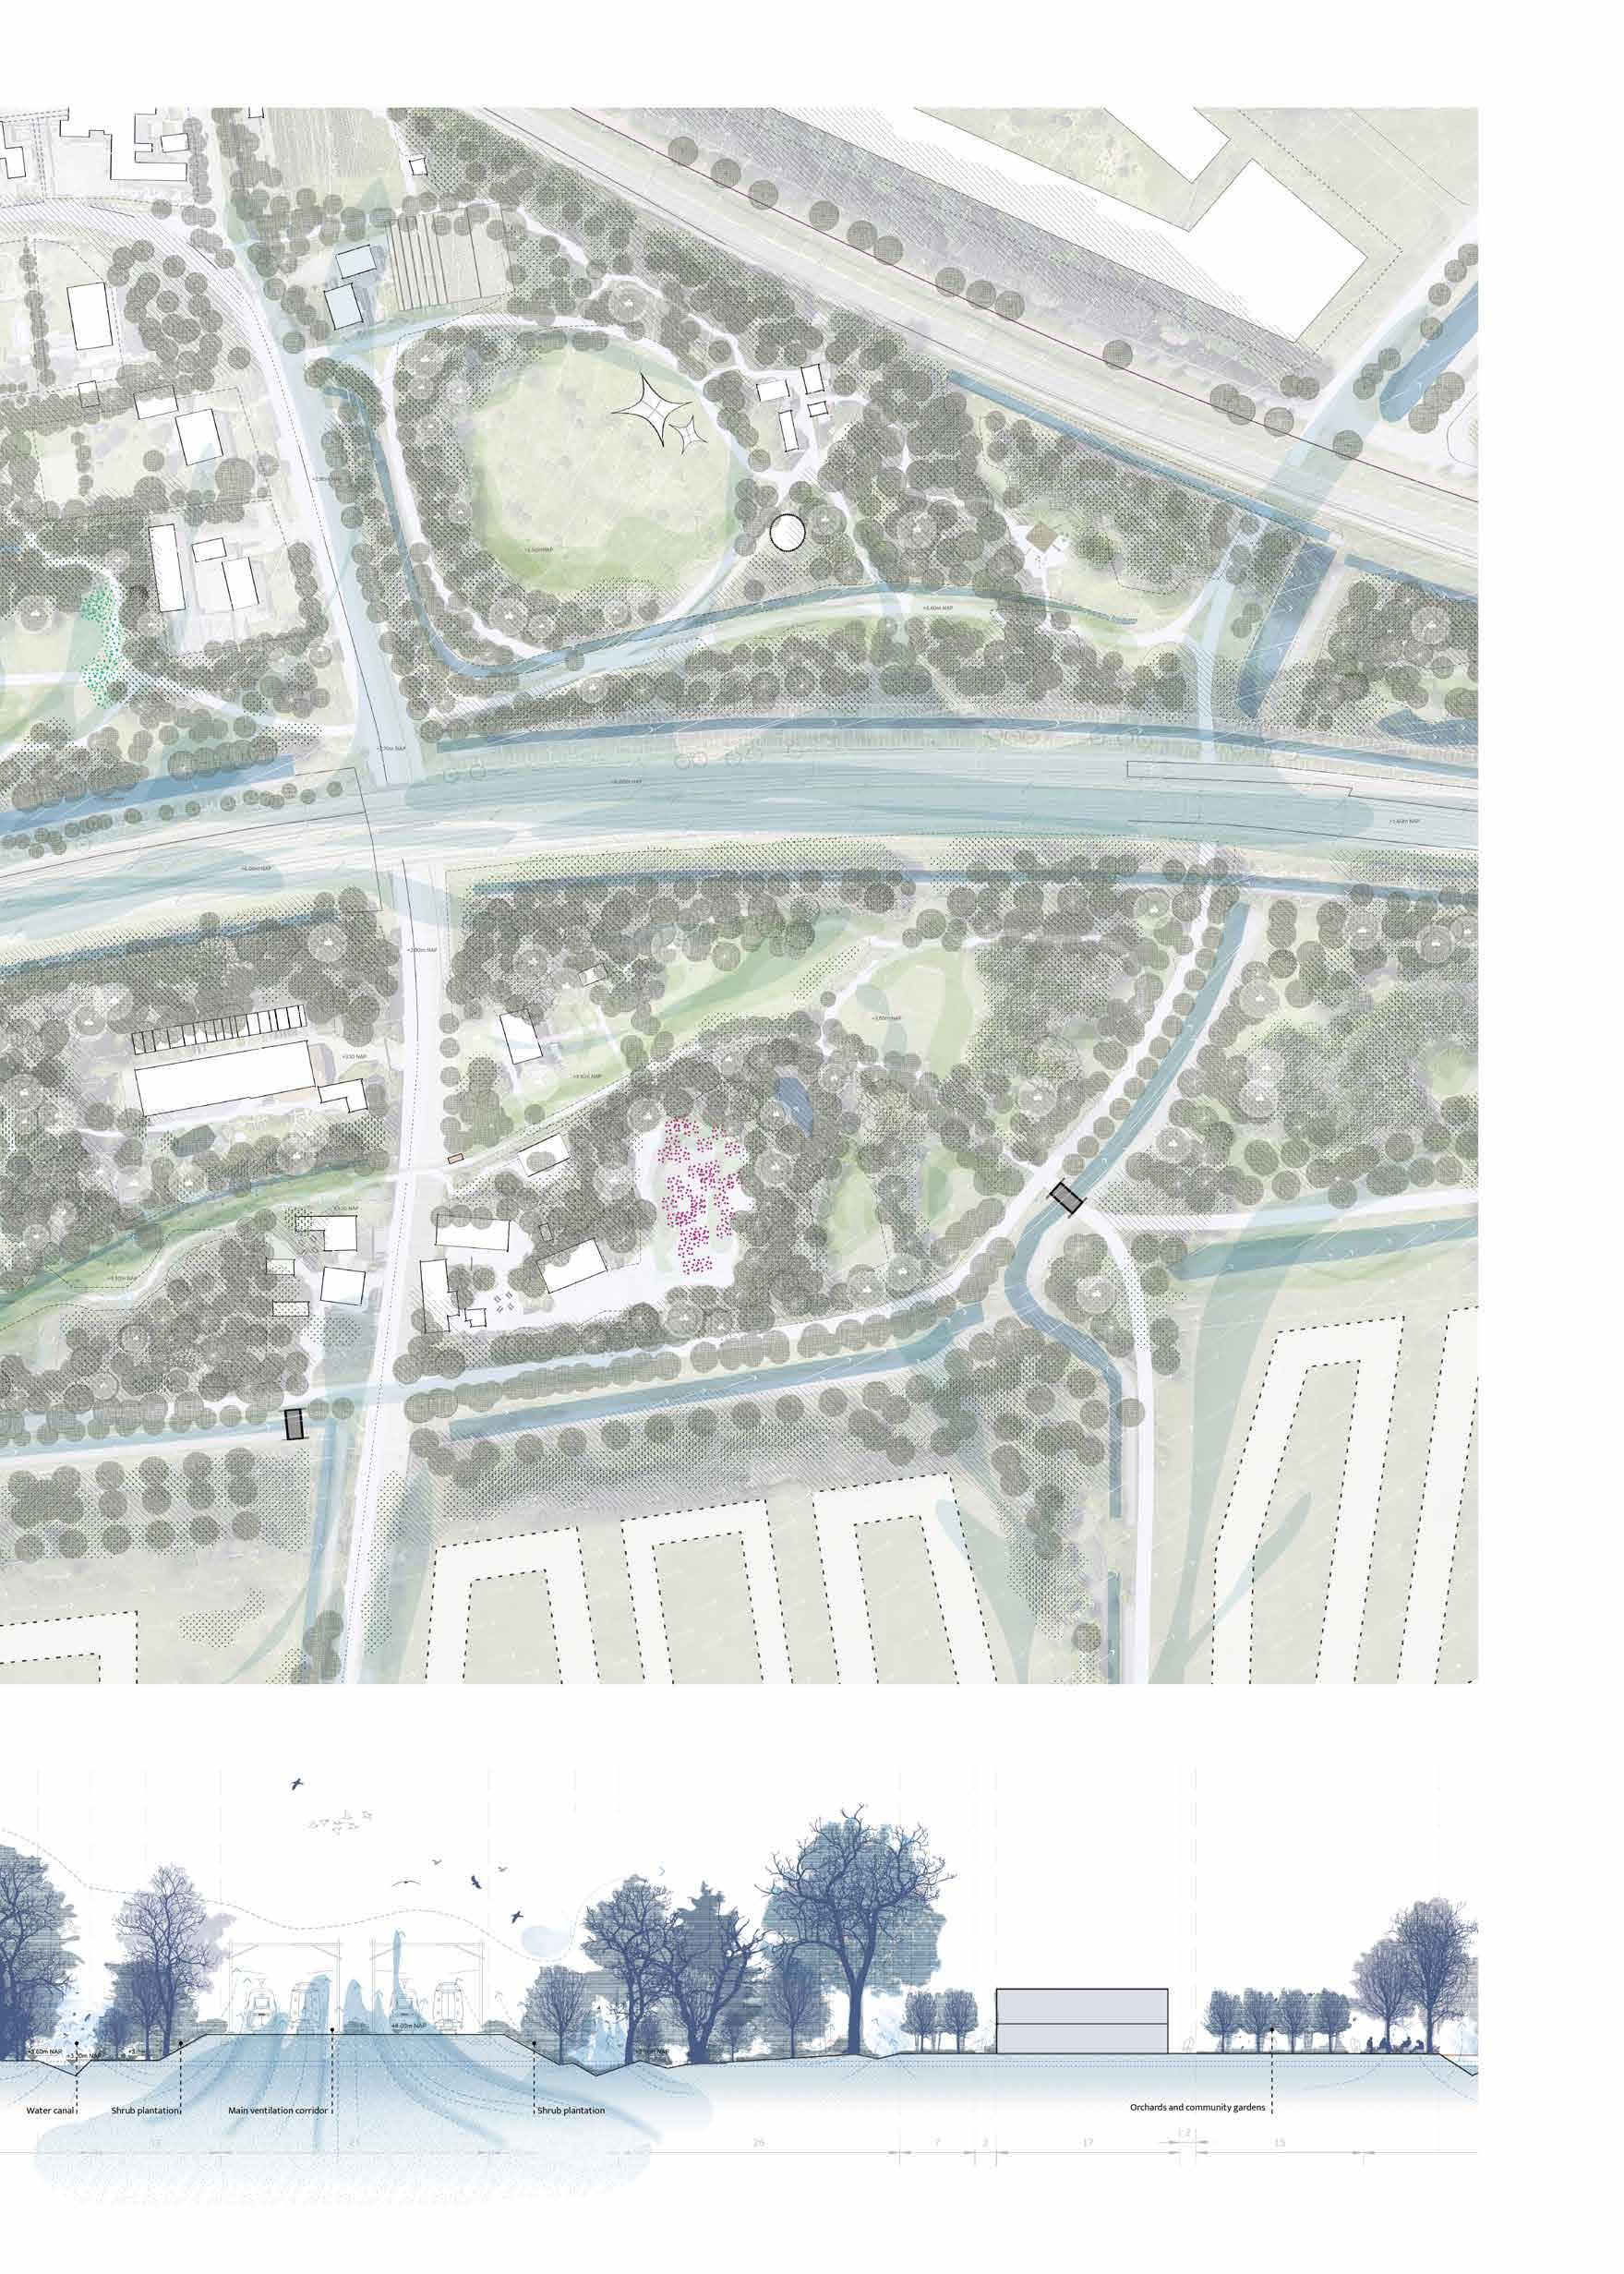
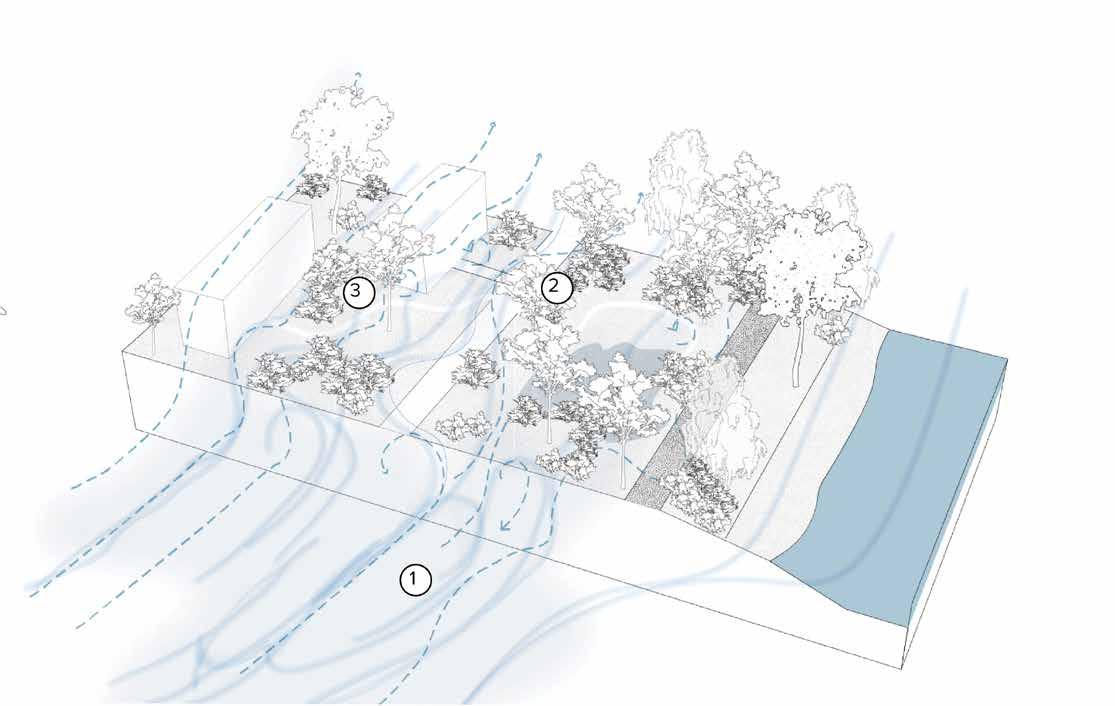
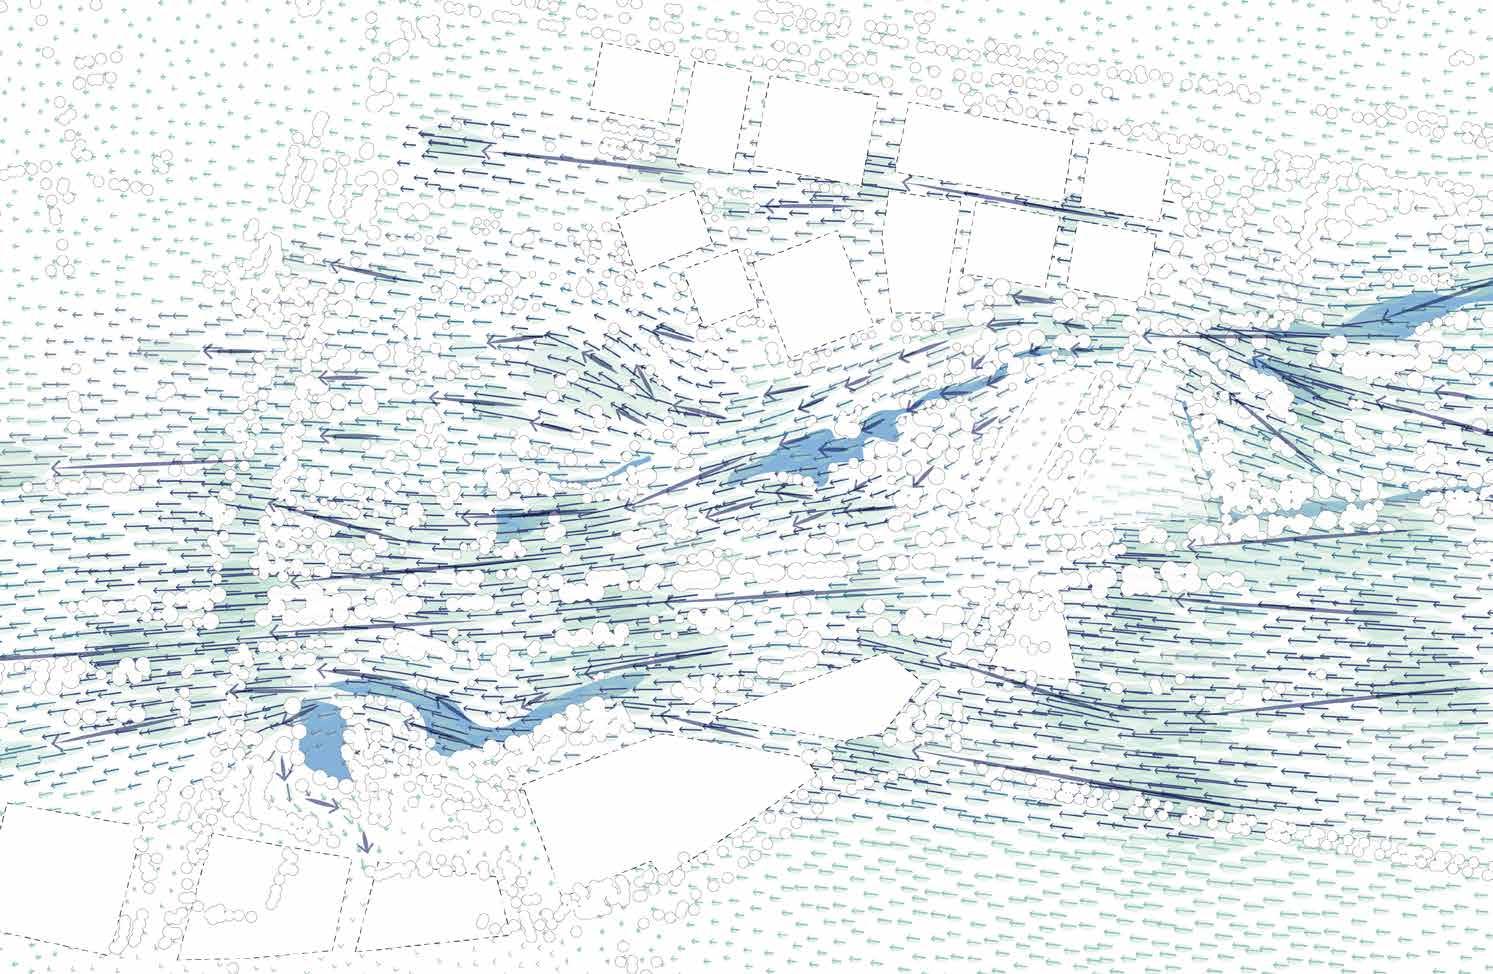
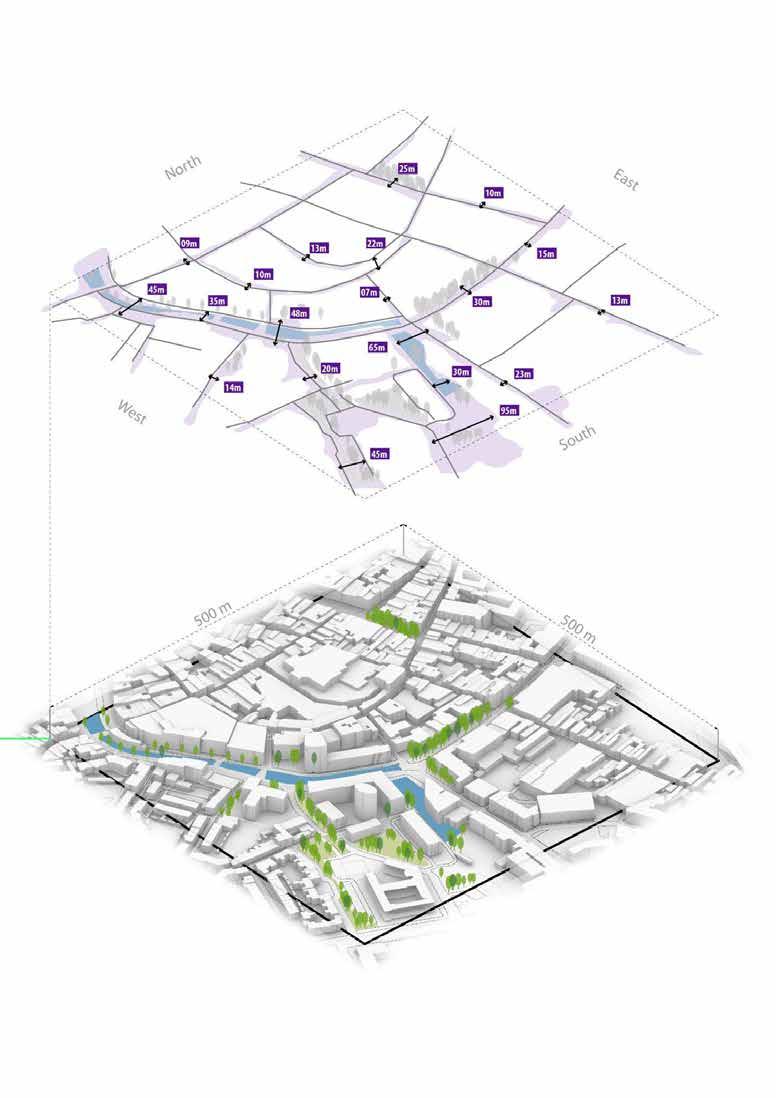
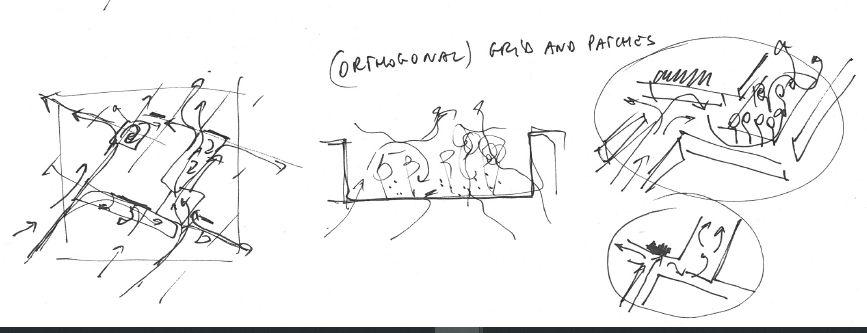
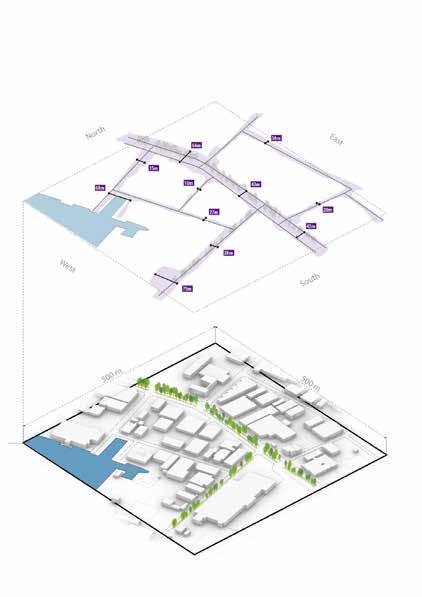
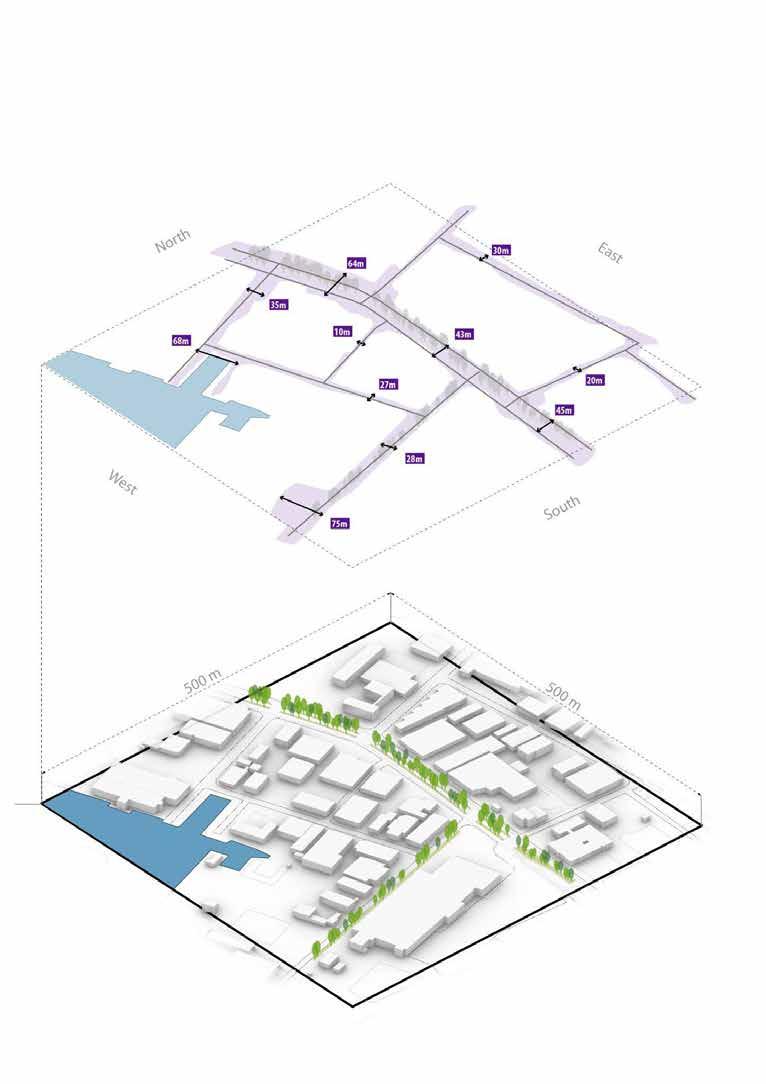
The center part of the wind stream along the railway strip in Breda was inspired by an upcoming proposal for the urban development of ‘t Zoet. Instead of working tabula rasa, the framework that comprises various urban axes, anchoring the area in the city by overcoming barriers and establishing connections with surrounding neighborhoods, the city center, and the station became the accelerator.
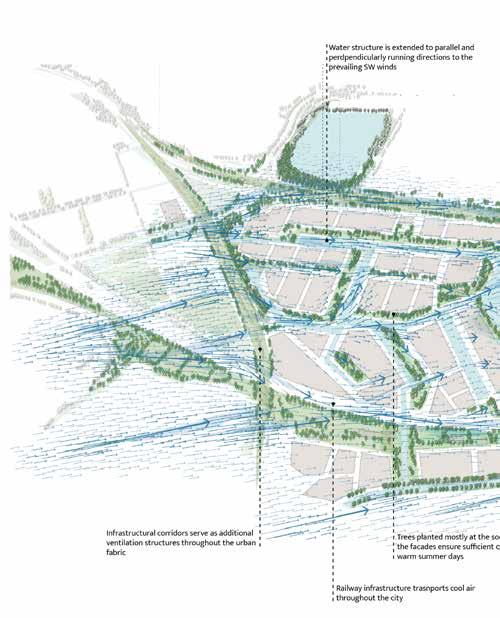
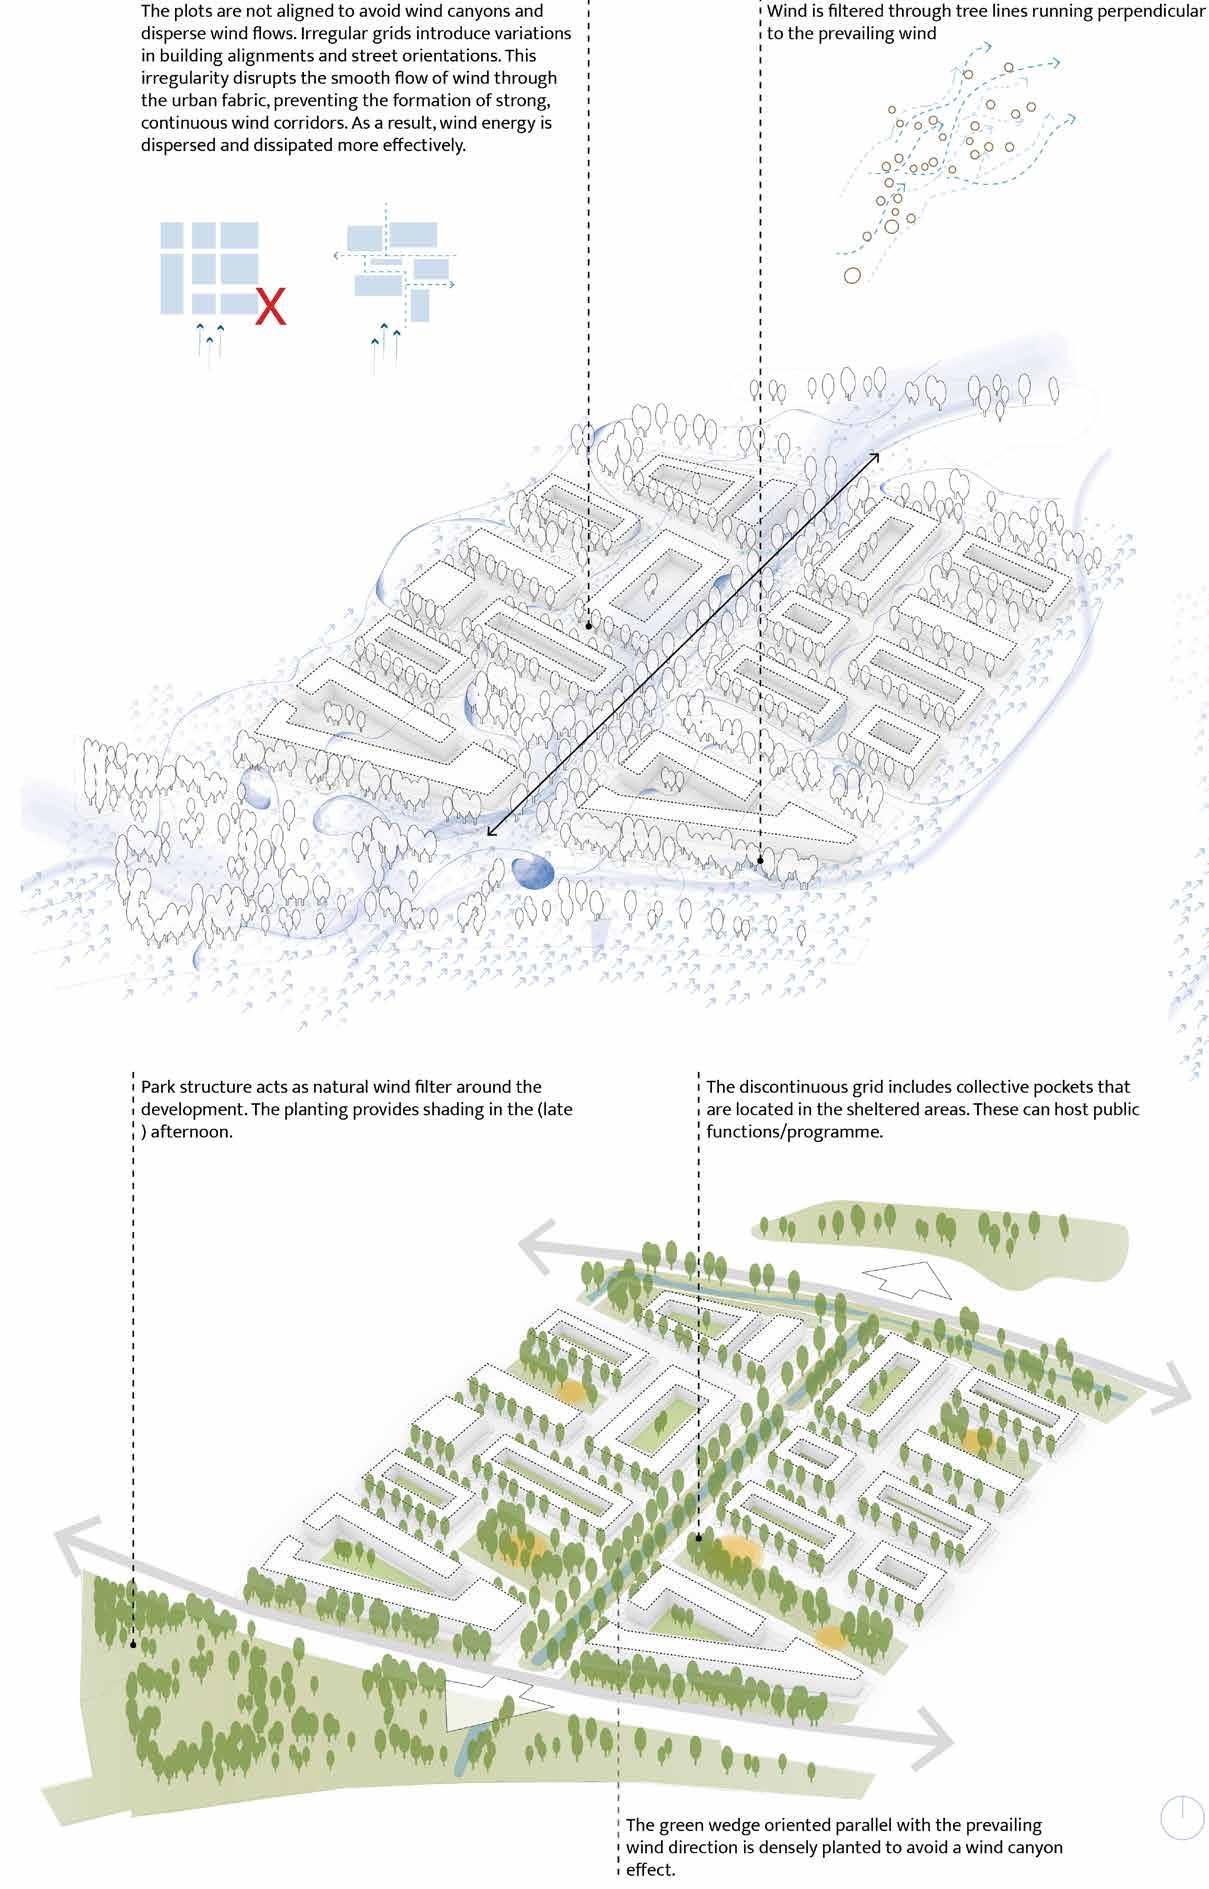
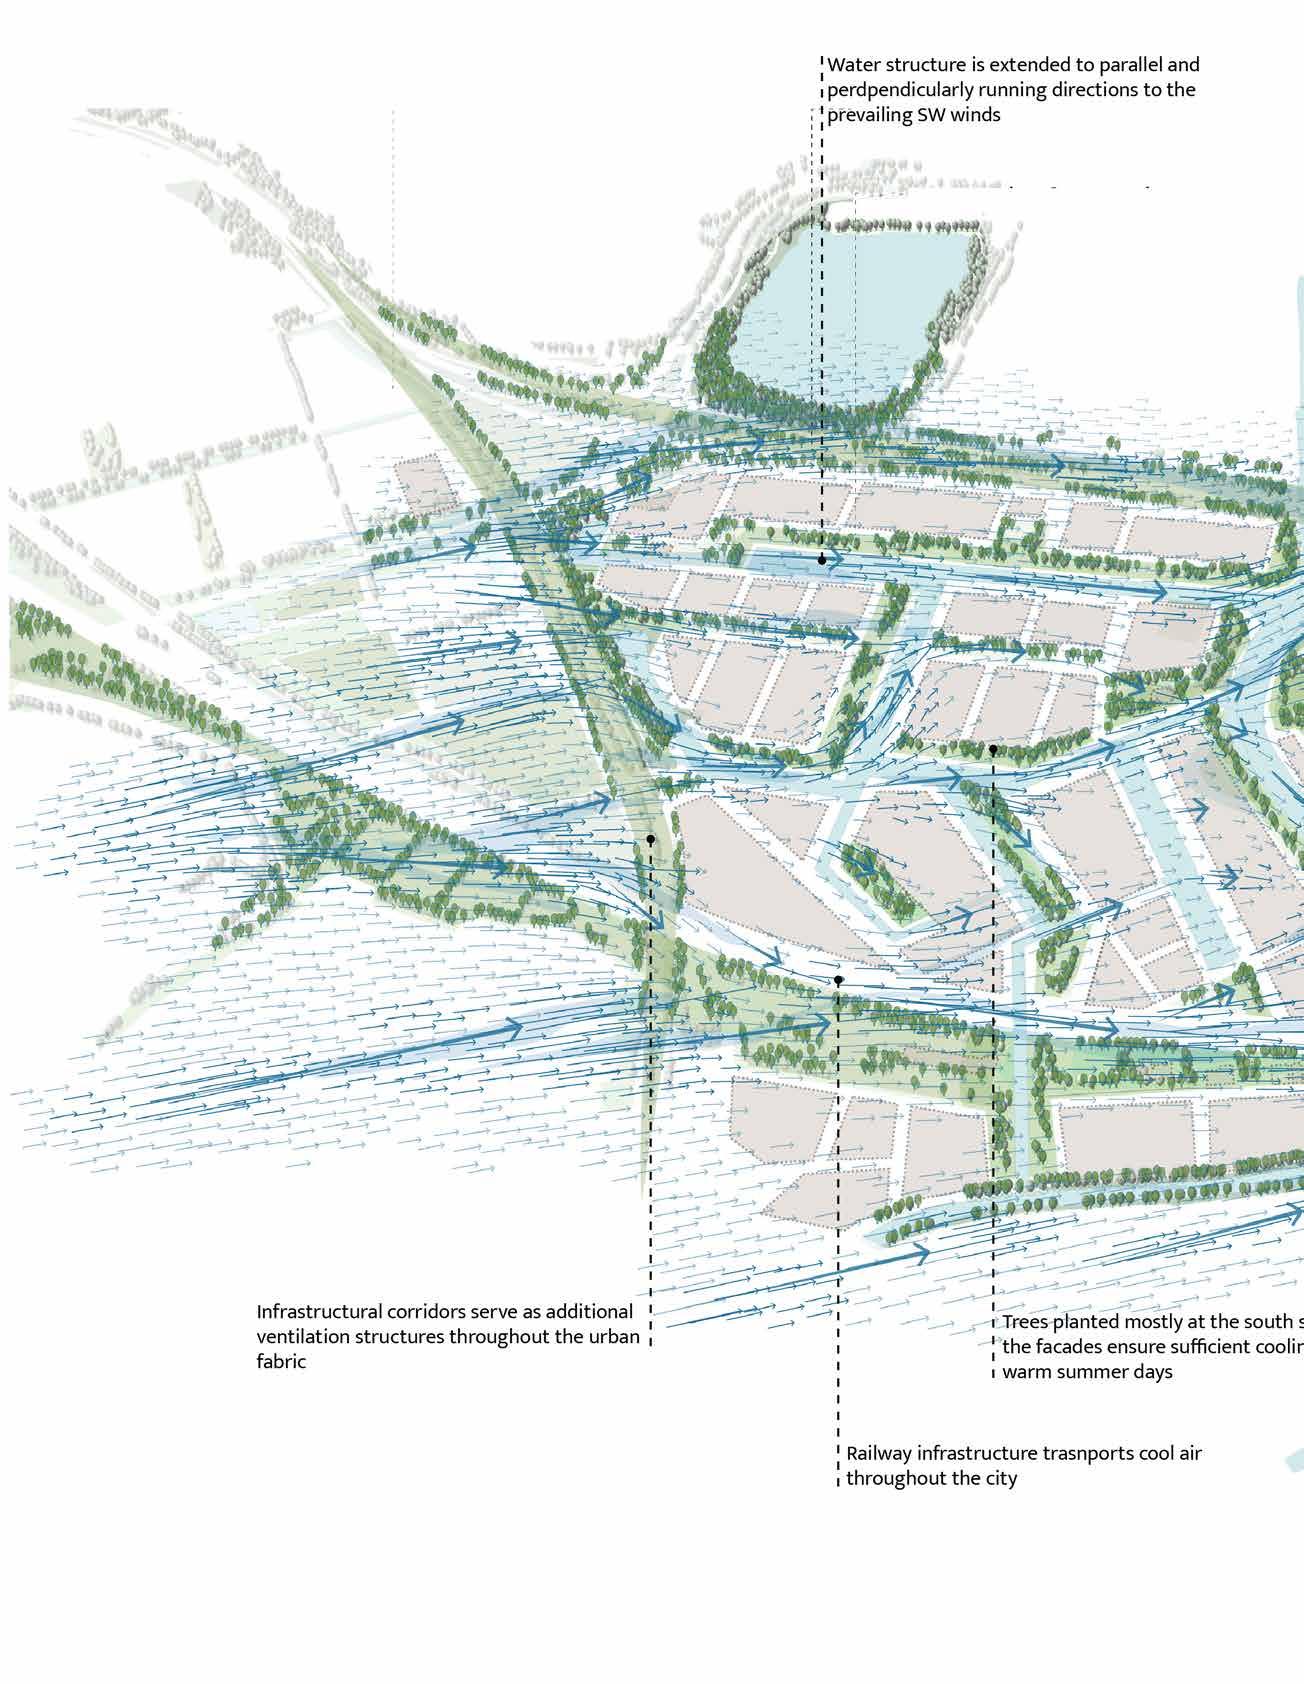
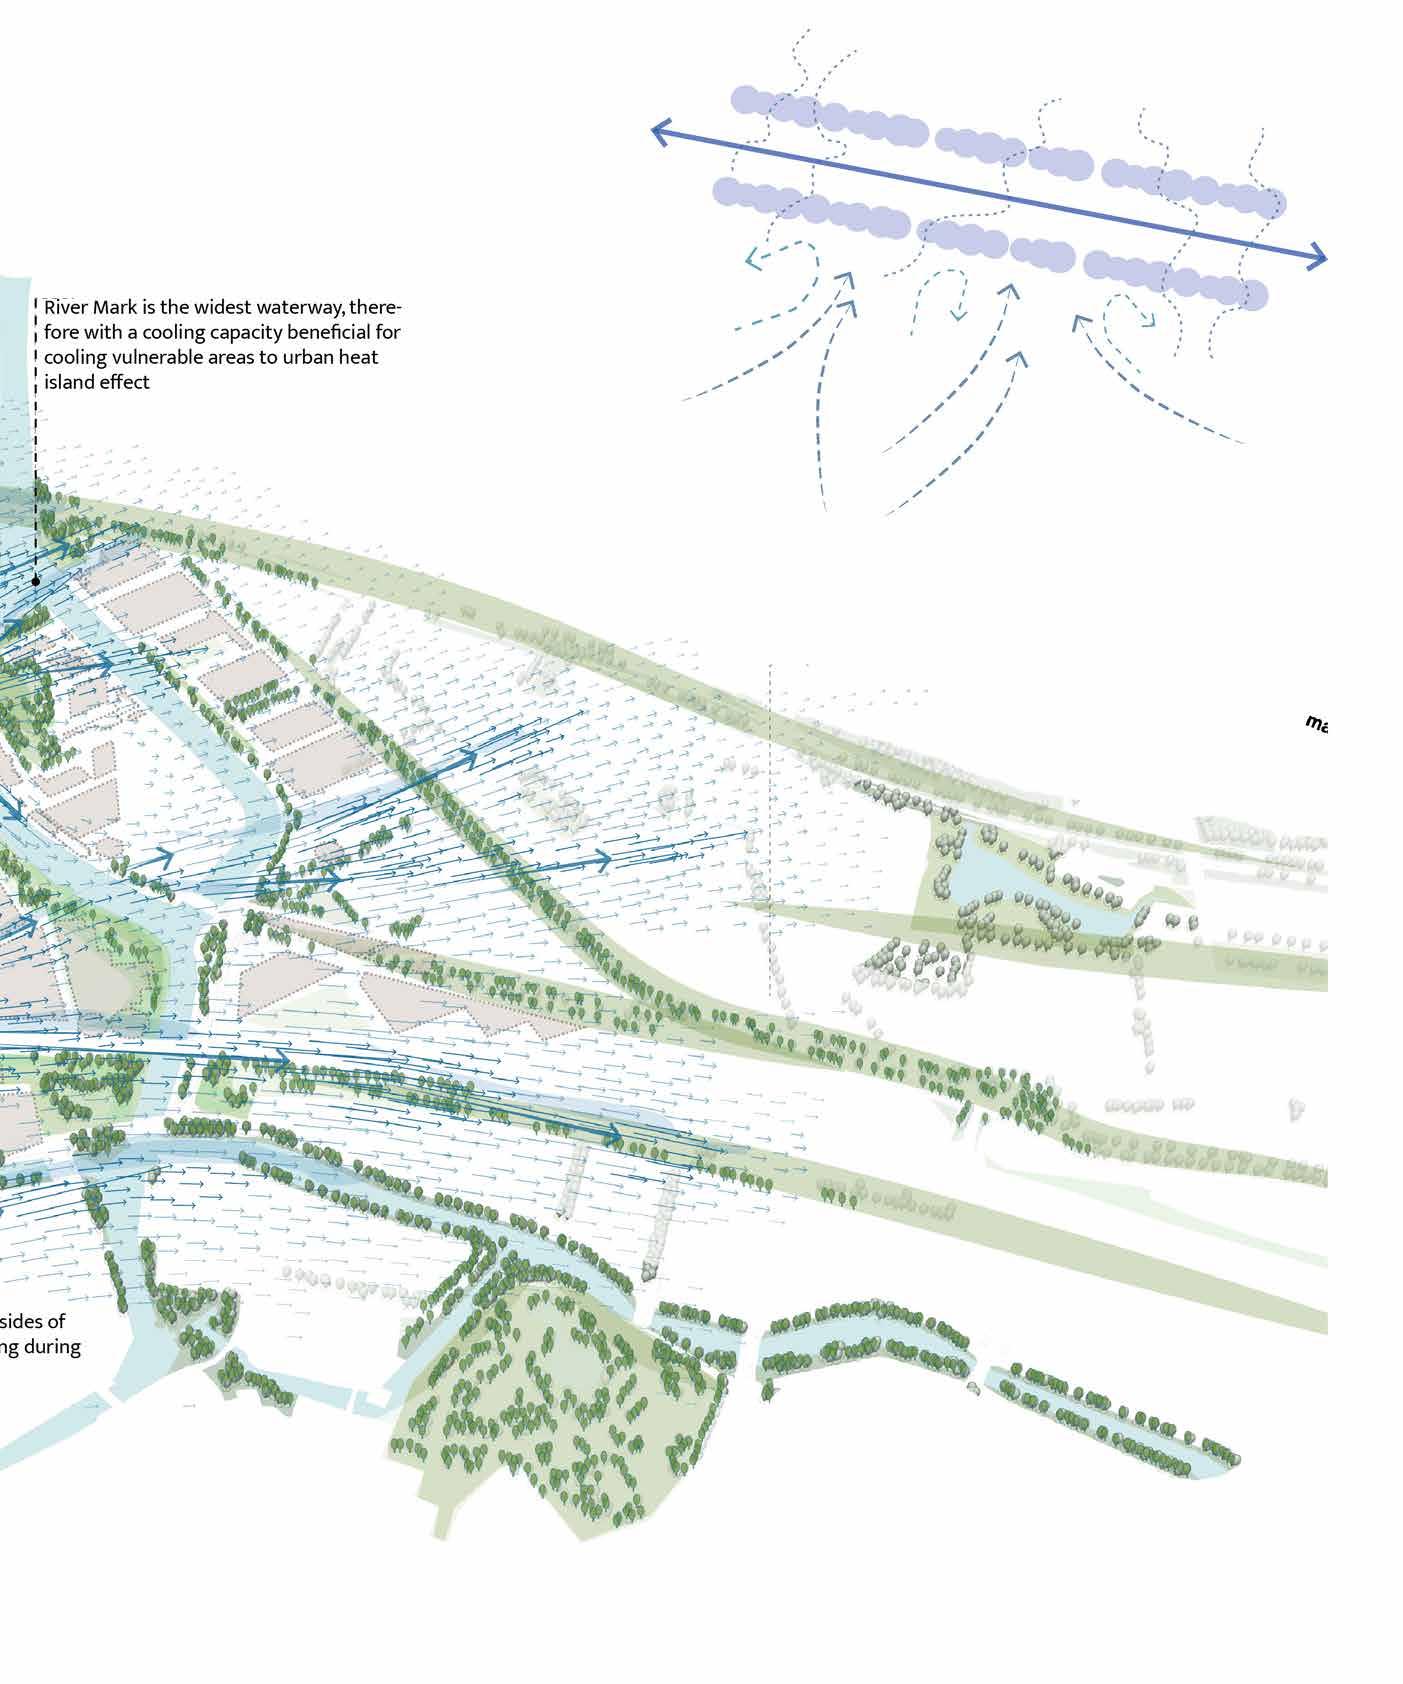
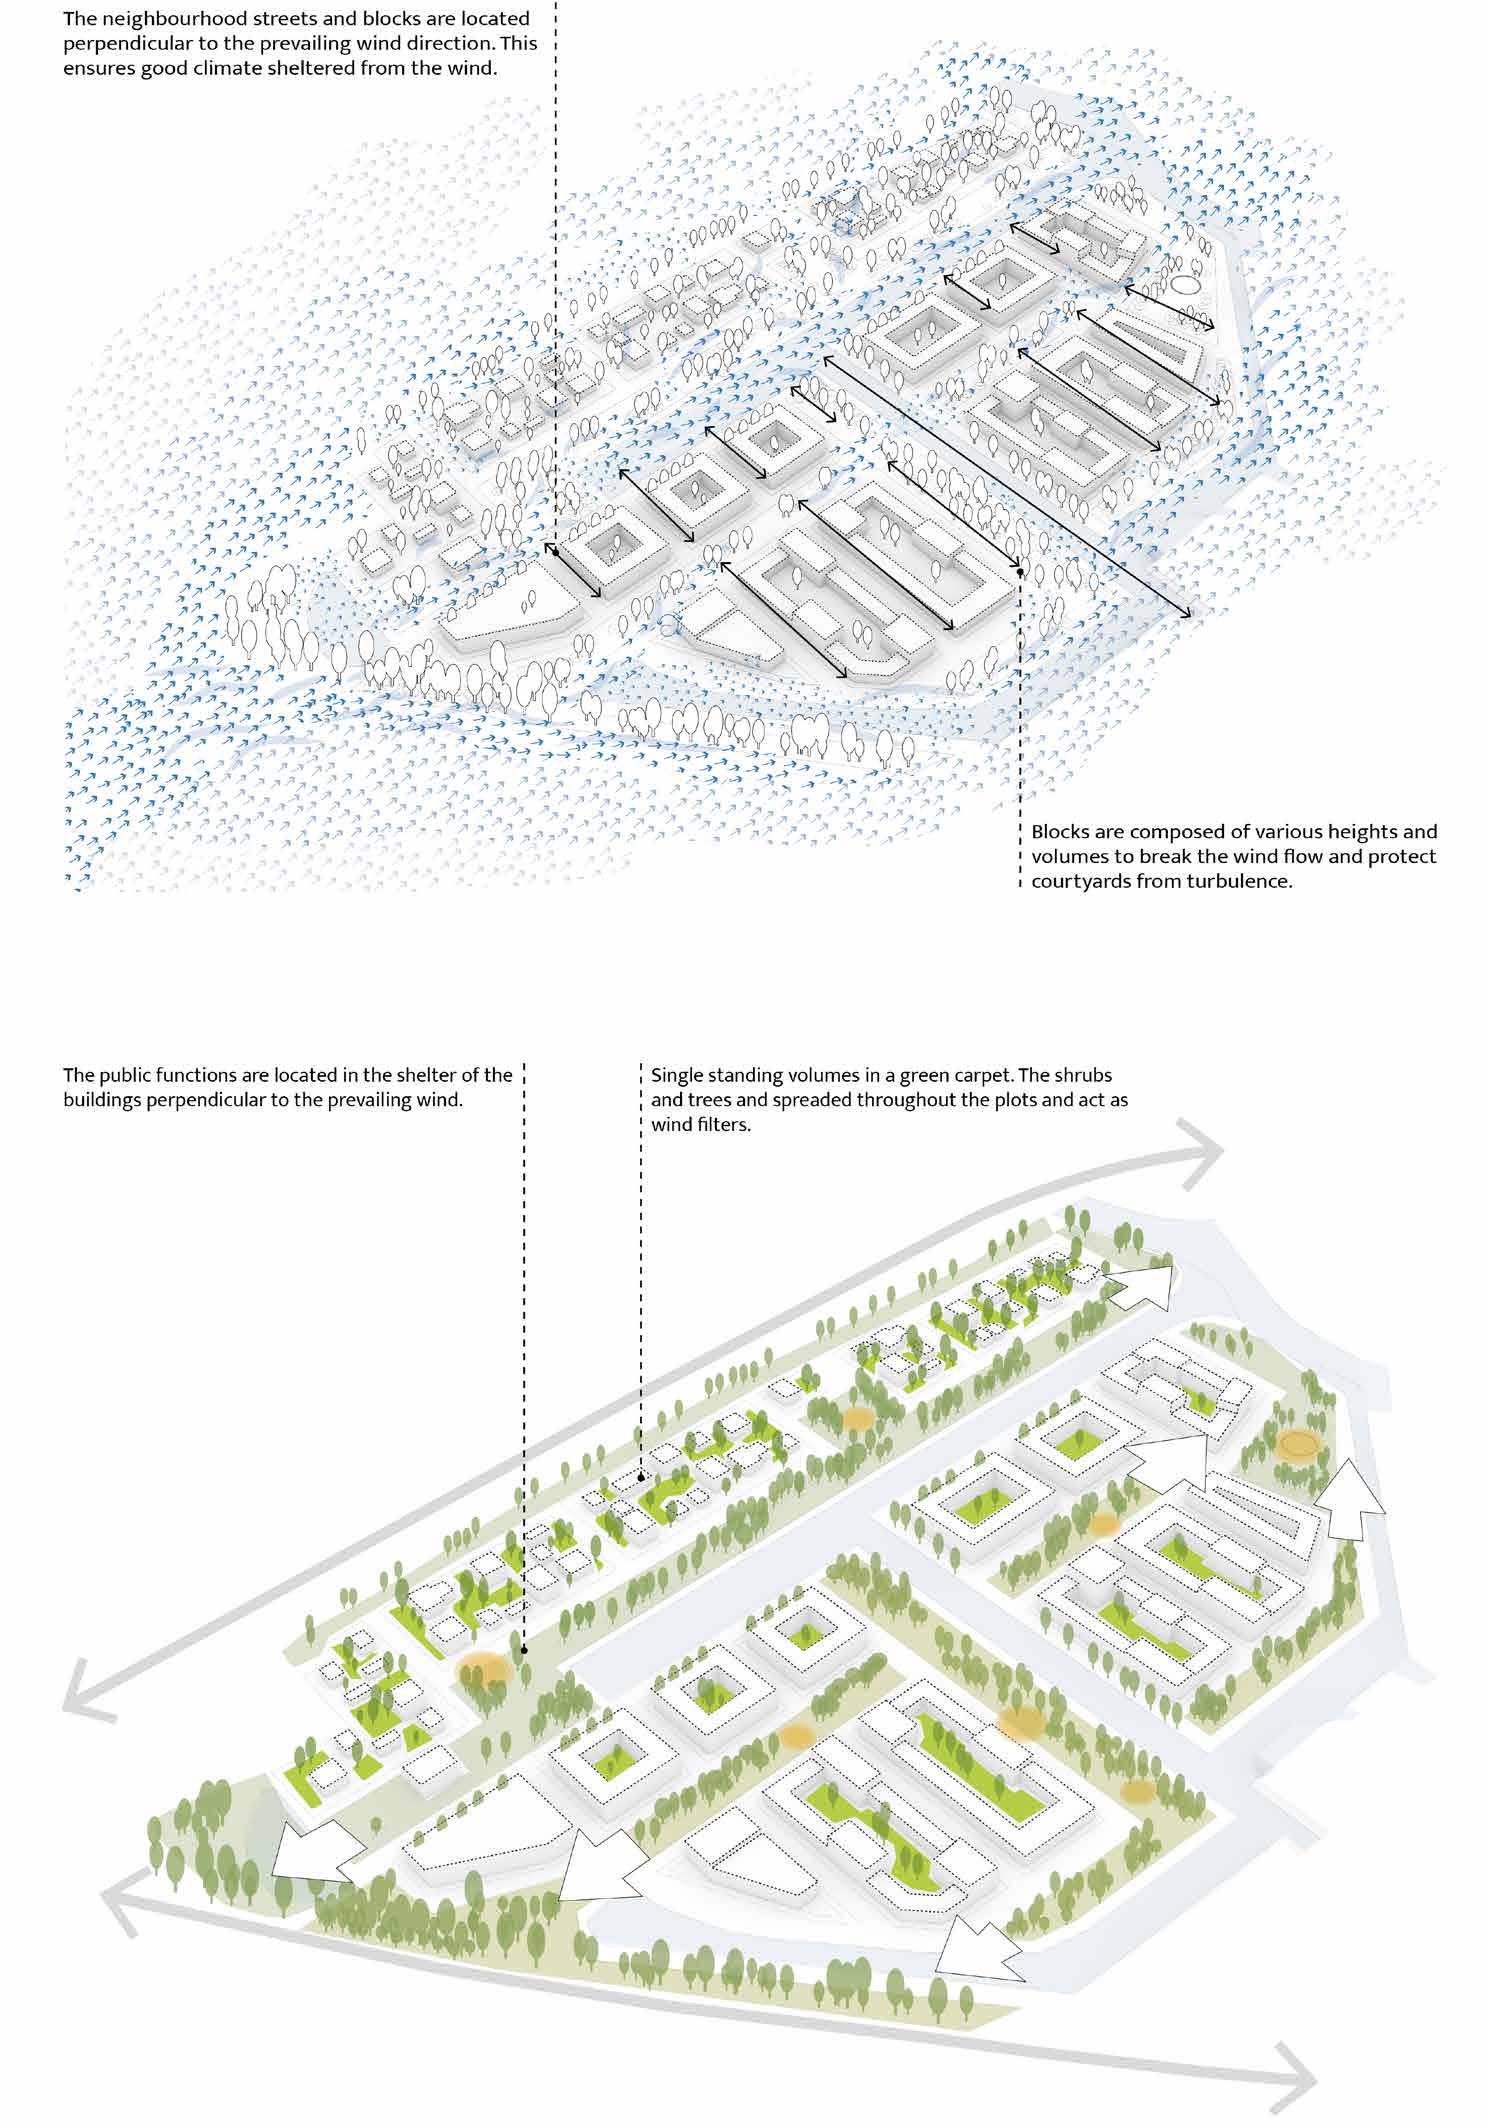
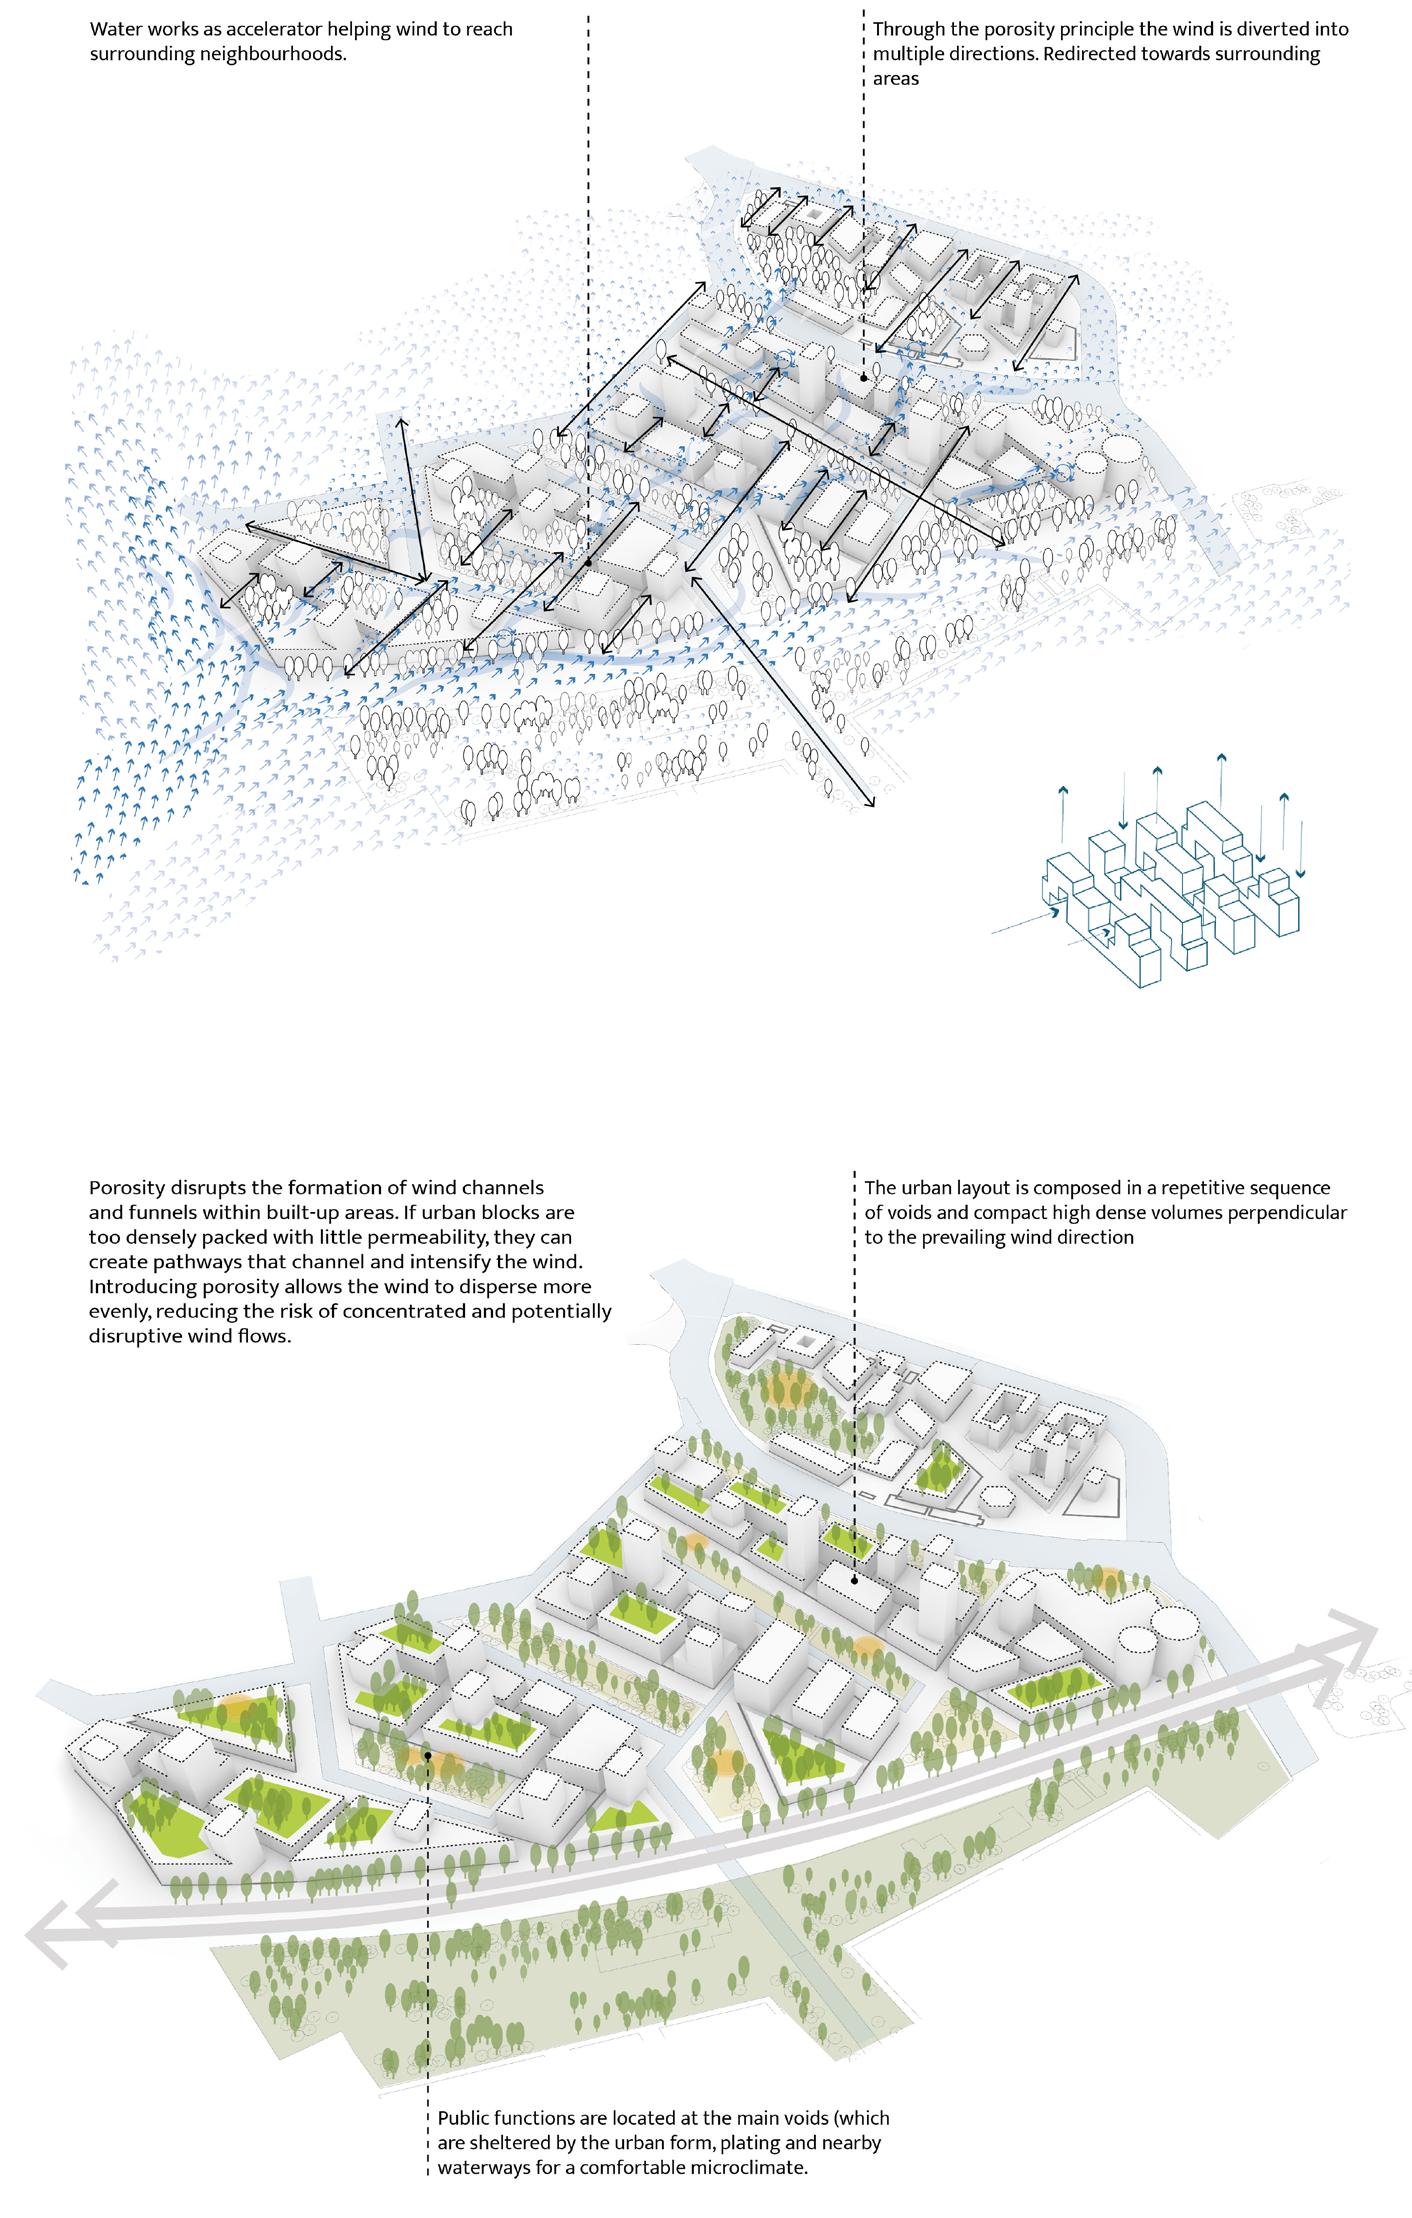
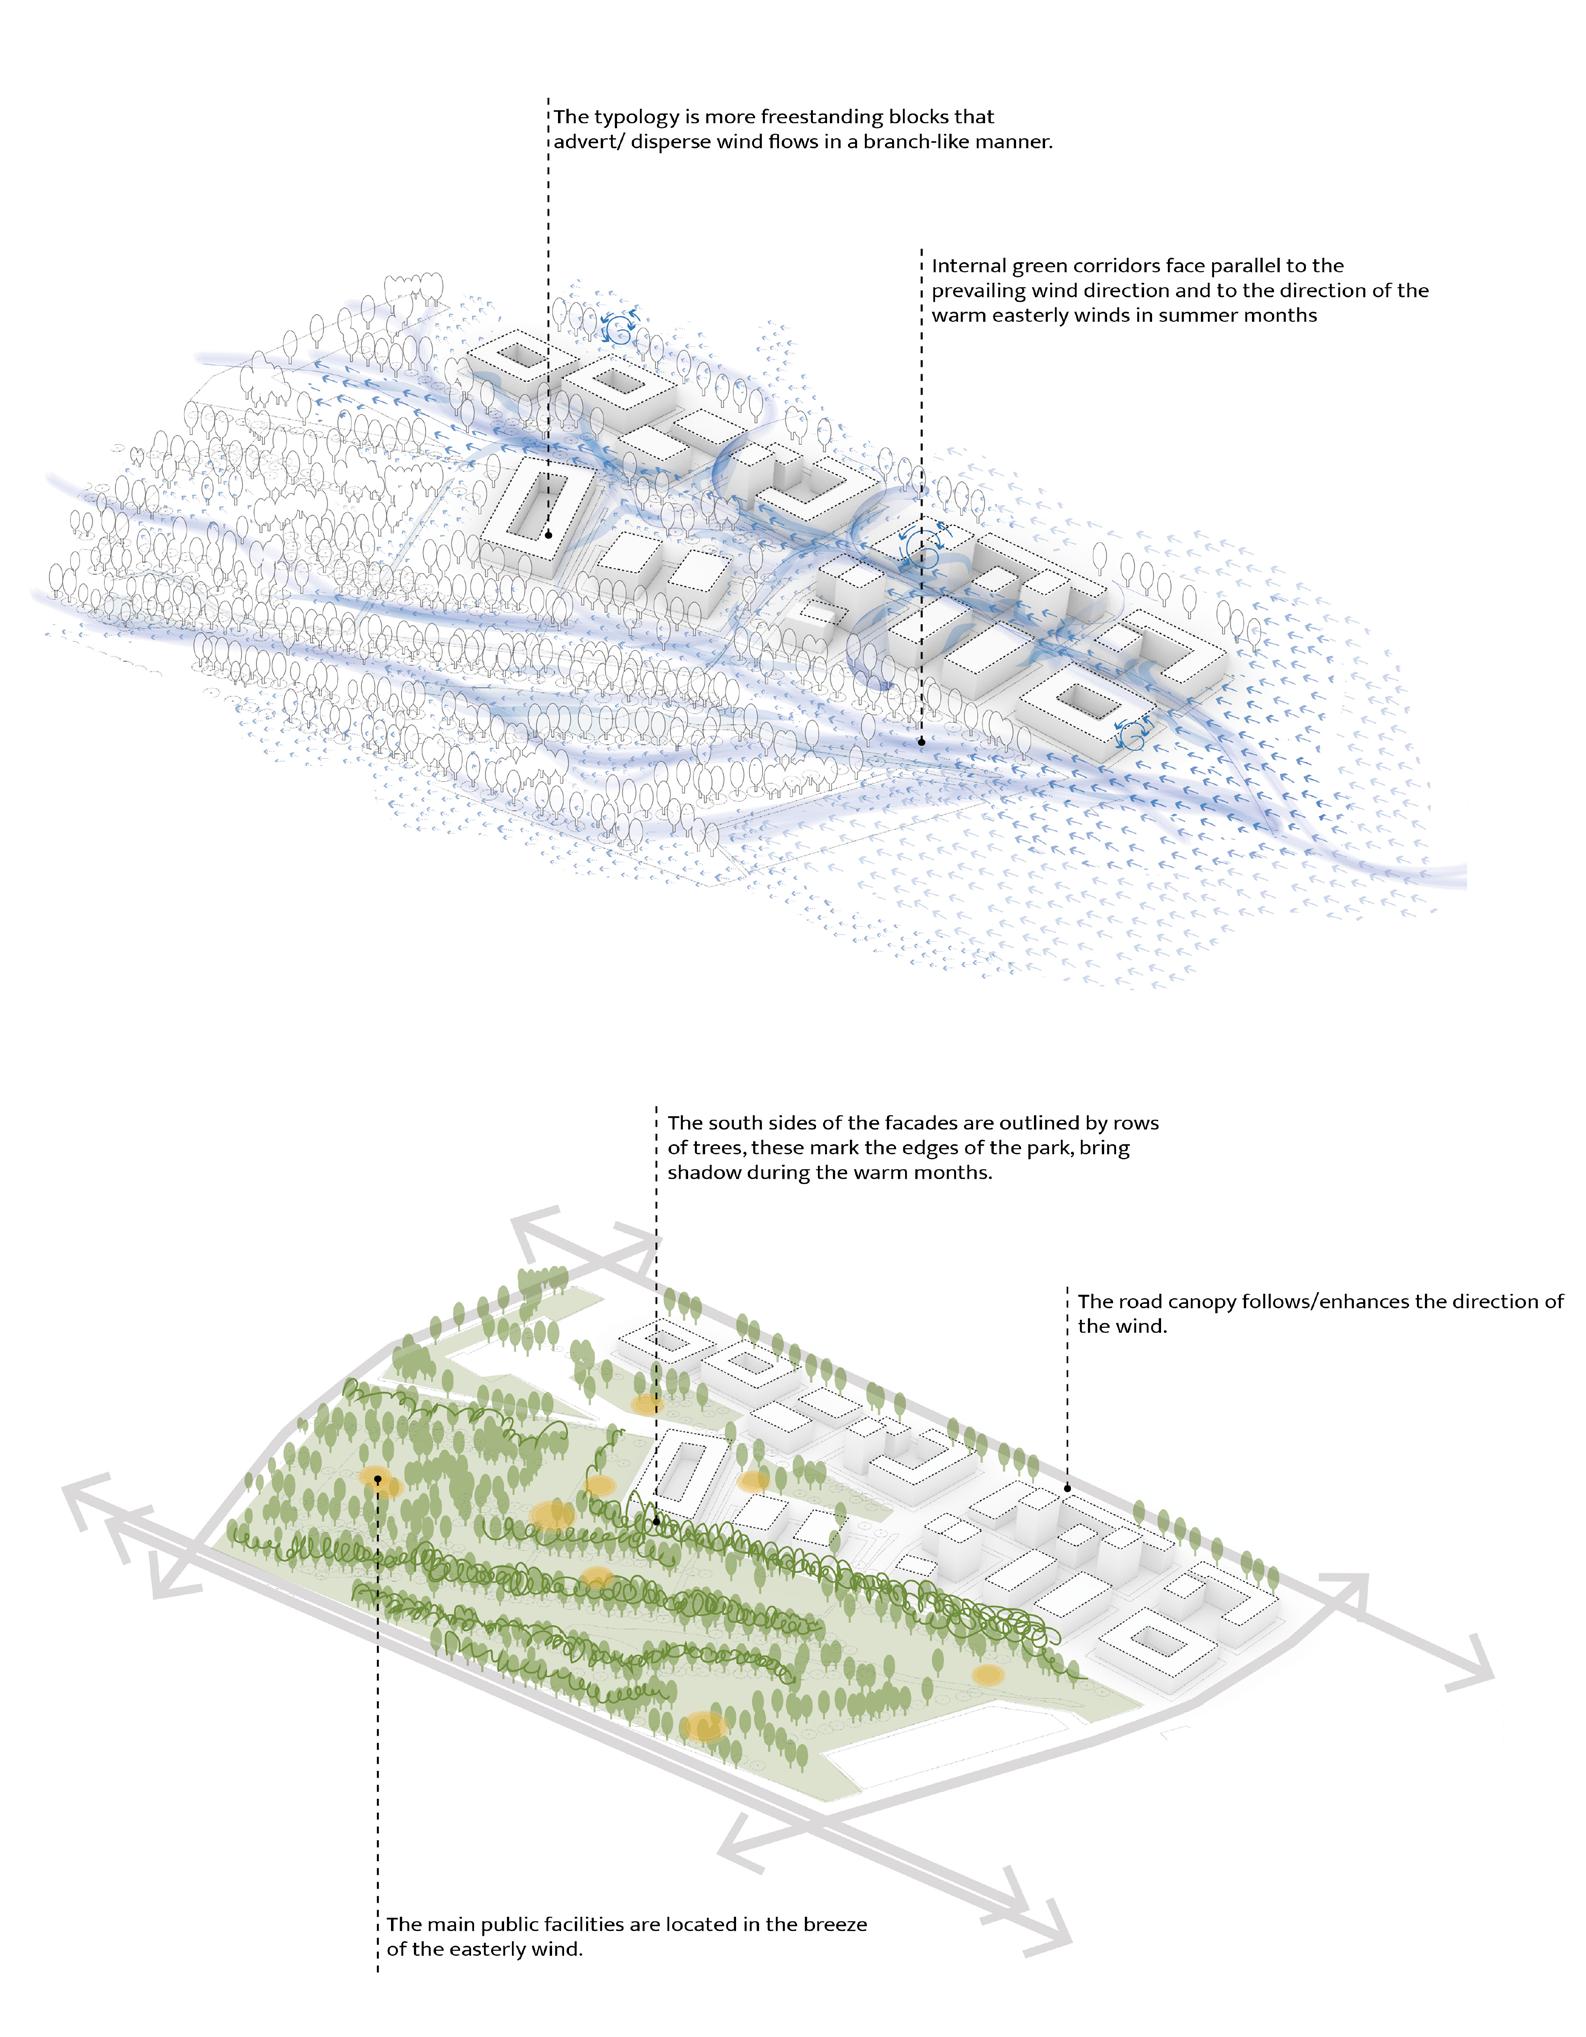
This area is a high-density development, varying in high contrast in typologies from the typologies in peripheries. The green-blue network previously oriented towards the center opened up an opportunity to tackle the core of the urban heat island. The green-blue grid is expanded to perpendicular directions too, creating a matrix of streets with waterways that can disperse wind to several directions, therefore cooling off not just the neighborhood itself but continuously running through the surrounding neighborhoods too.
In this case, the new development becomes a wind-dispersing machine providing constant cooling in the most vulnerable areas in the future. The water streets have an enhancing effect. Cool air is accelerated on the smooth surfaces of the channels while the shadows of tree canopies avoid overheating of water surfaces and worsening the urban heat effect.
Academie van Bouwkunst
Rachel Borovska
Legenda: Voids Streams
Academie van Bouwkunst Amsterdam 23 | 24 | Rachel Borovska
Academie van Bouwkunst Amsterdam 23 | 24 | Rachel Borovska
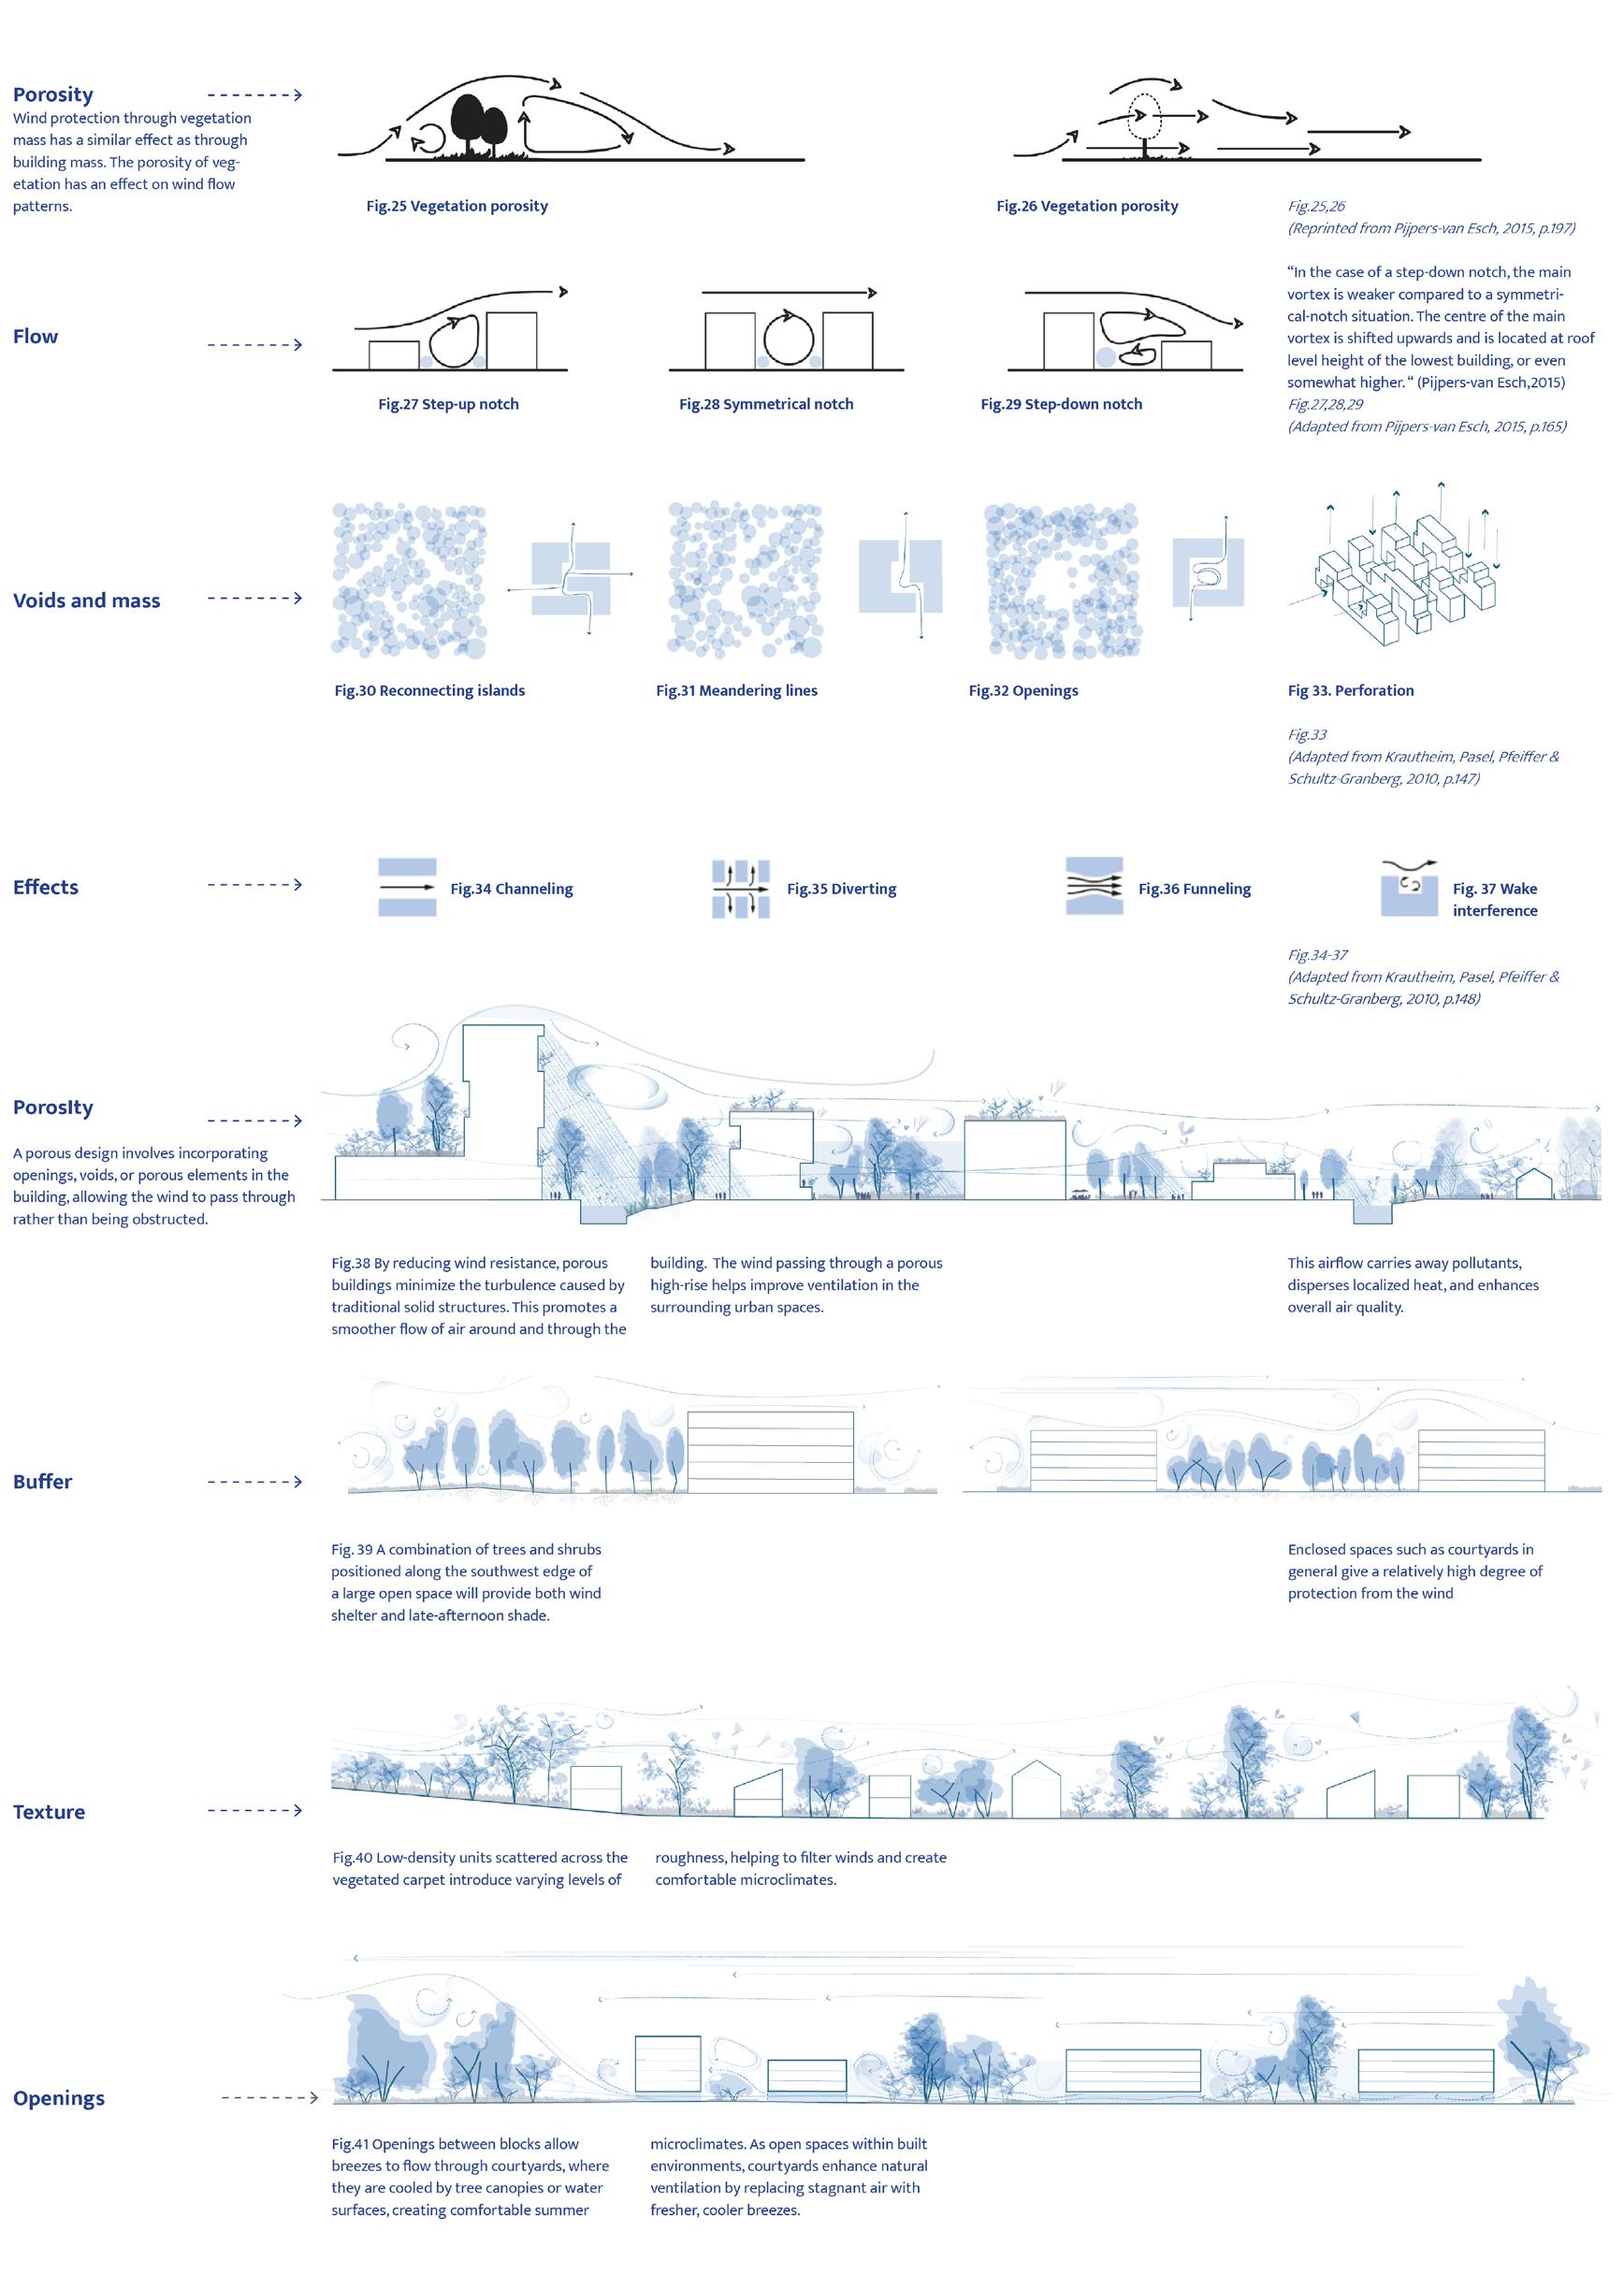
Urban Biotopes
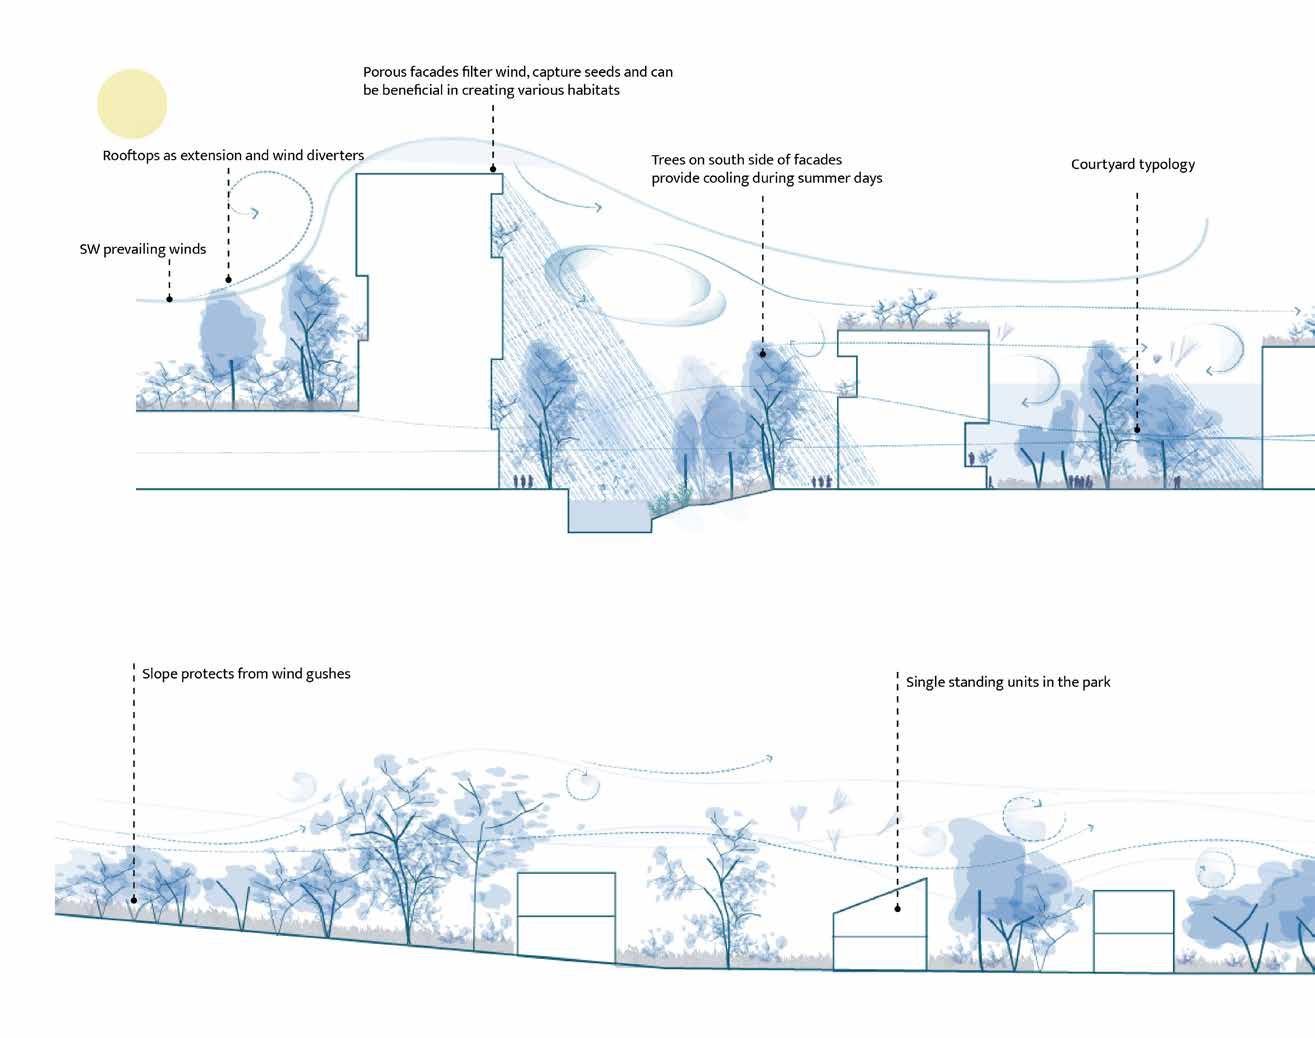
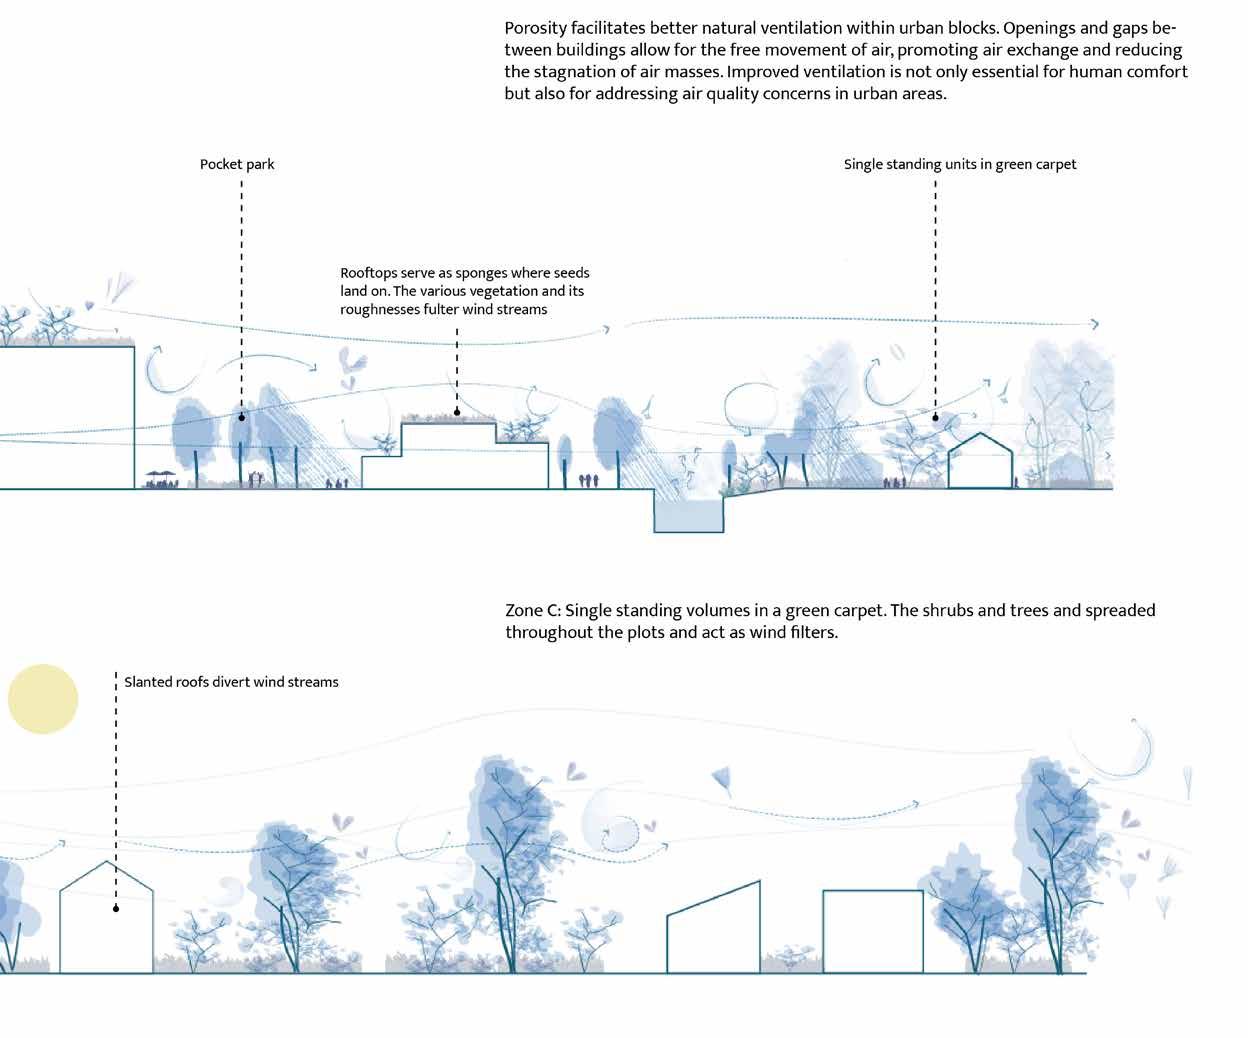
Porosity facilitates better natural ventilation within urban blocks. Openings and gaps between buildings allow for the free movement of air, promoting air exchange and reducing the stagnation of air masses. Improved ventilation is not only essential for human comfort but also for addressing air quality concerns in urban areas.
Varied permeability levels allow for the creation of sheltered areas, wind-protected zones, and comfortable outdoor spaces, enhancing the overall livability of the urban environment.
Academie van Bouwkunst Amsterdam 23 | 24 | Rachel Borovska
“Guiding
Wind Into the City”: Design Principles for Urban Wind Dispersal
“Guiding
Wind Into the City”: Design Principles for Urban Wind Dispersal
Academie van Bouwkunst Amsterdam 23 | 24 | Rachel Borovska
Urban Wind Dispersion
Legenda:
Urban Wind Dispersion
Legenda: vortex
Academie van Bouwkunst Amsterdam 23 | 24 | Rachel Borovska
Borovska
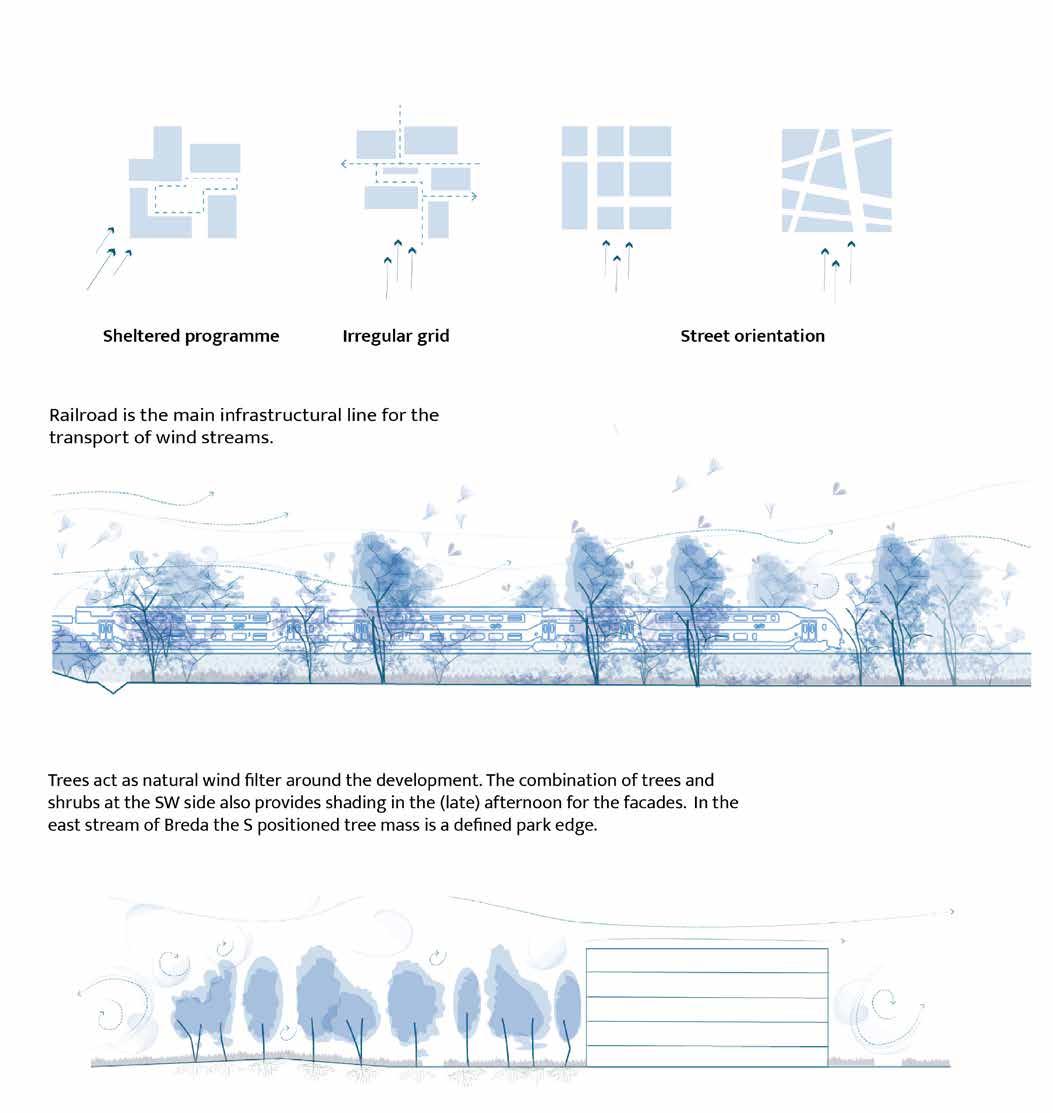
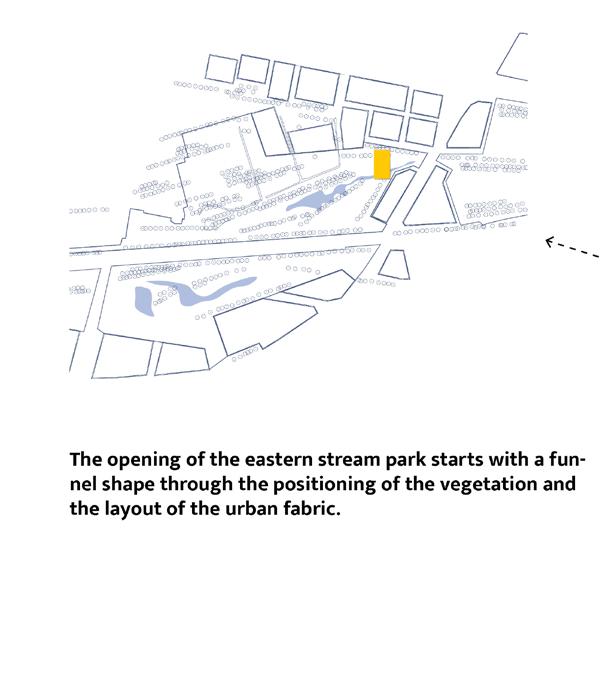
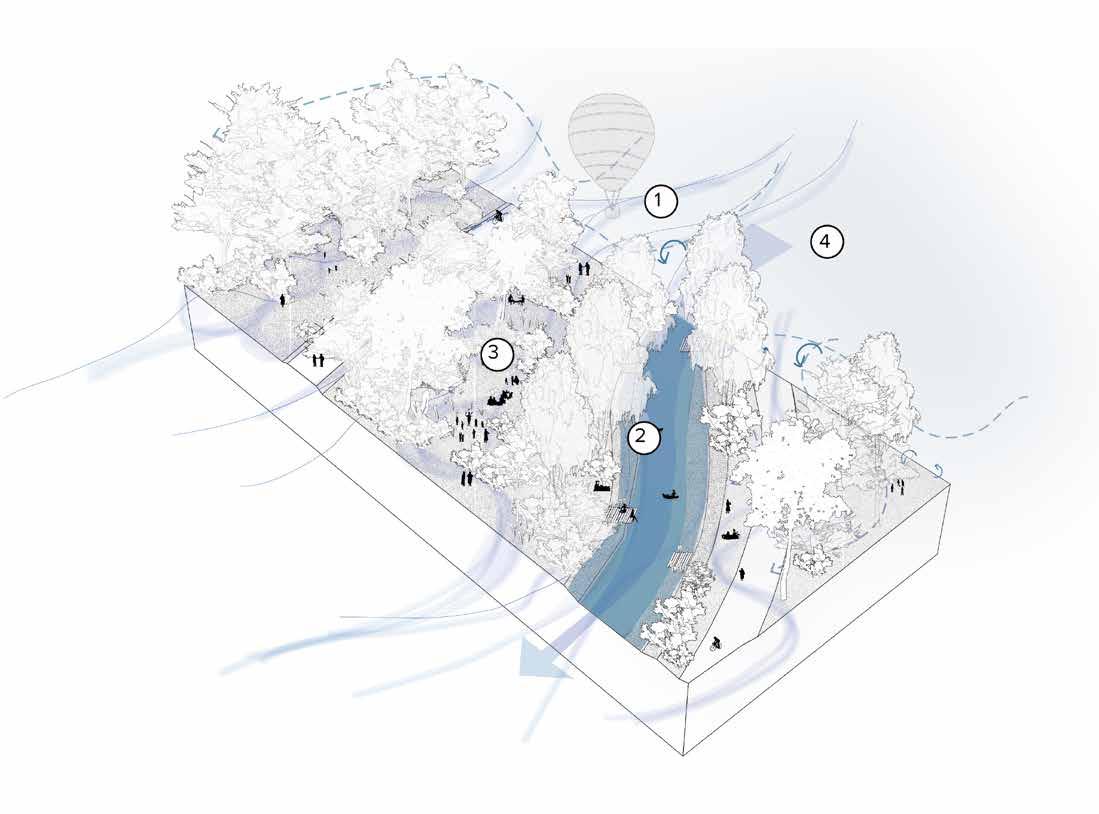
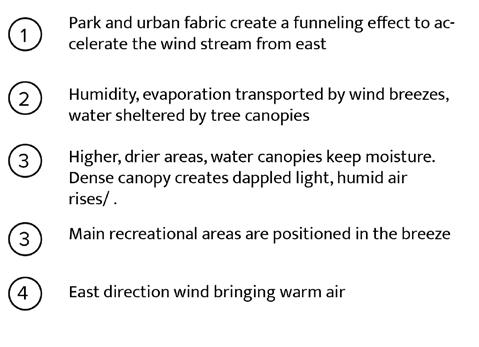
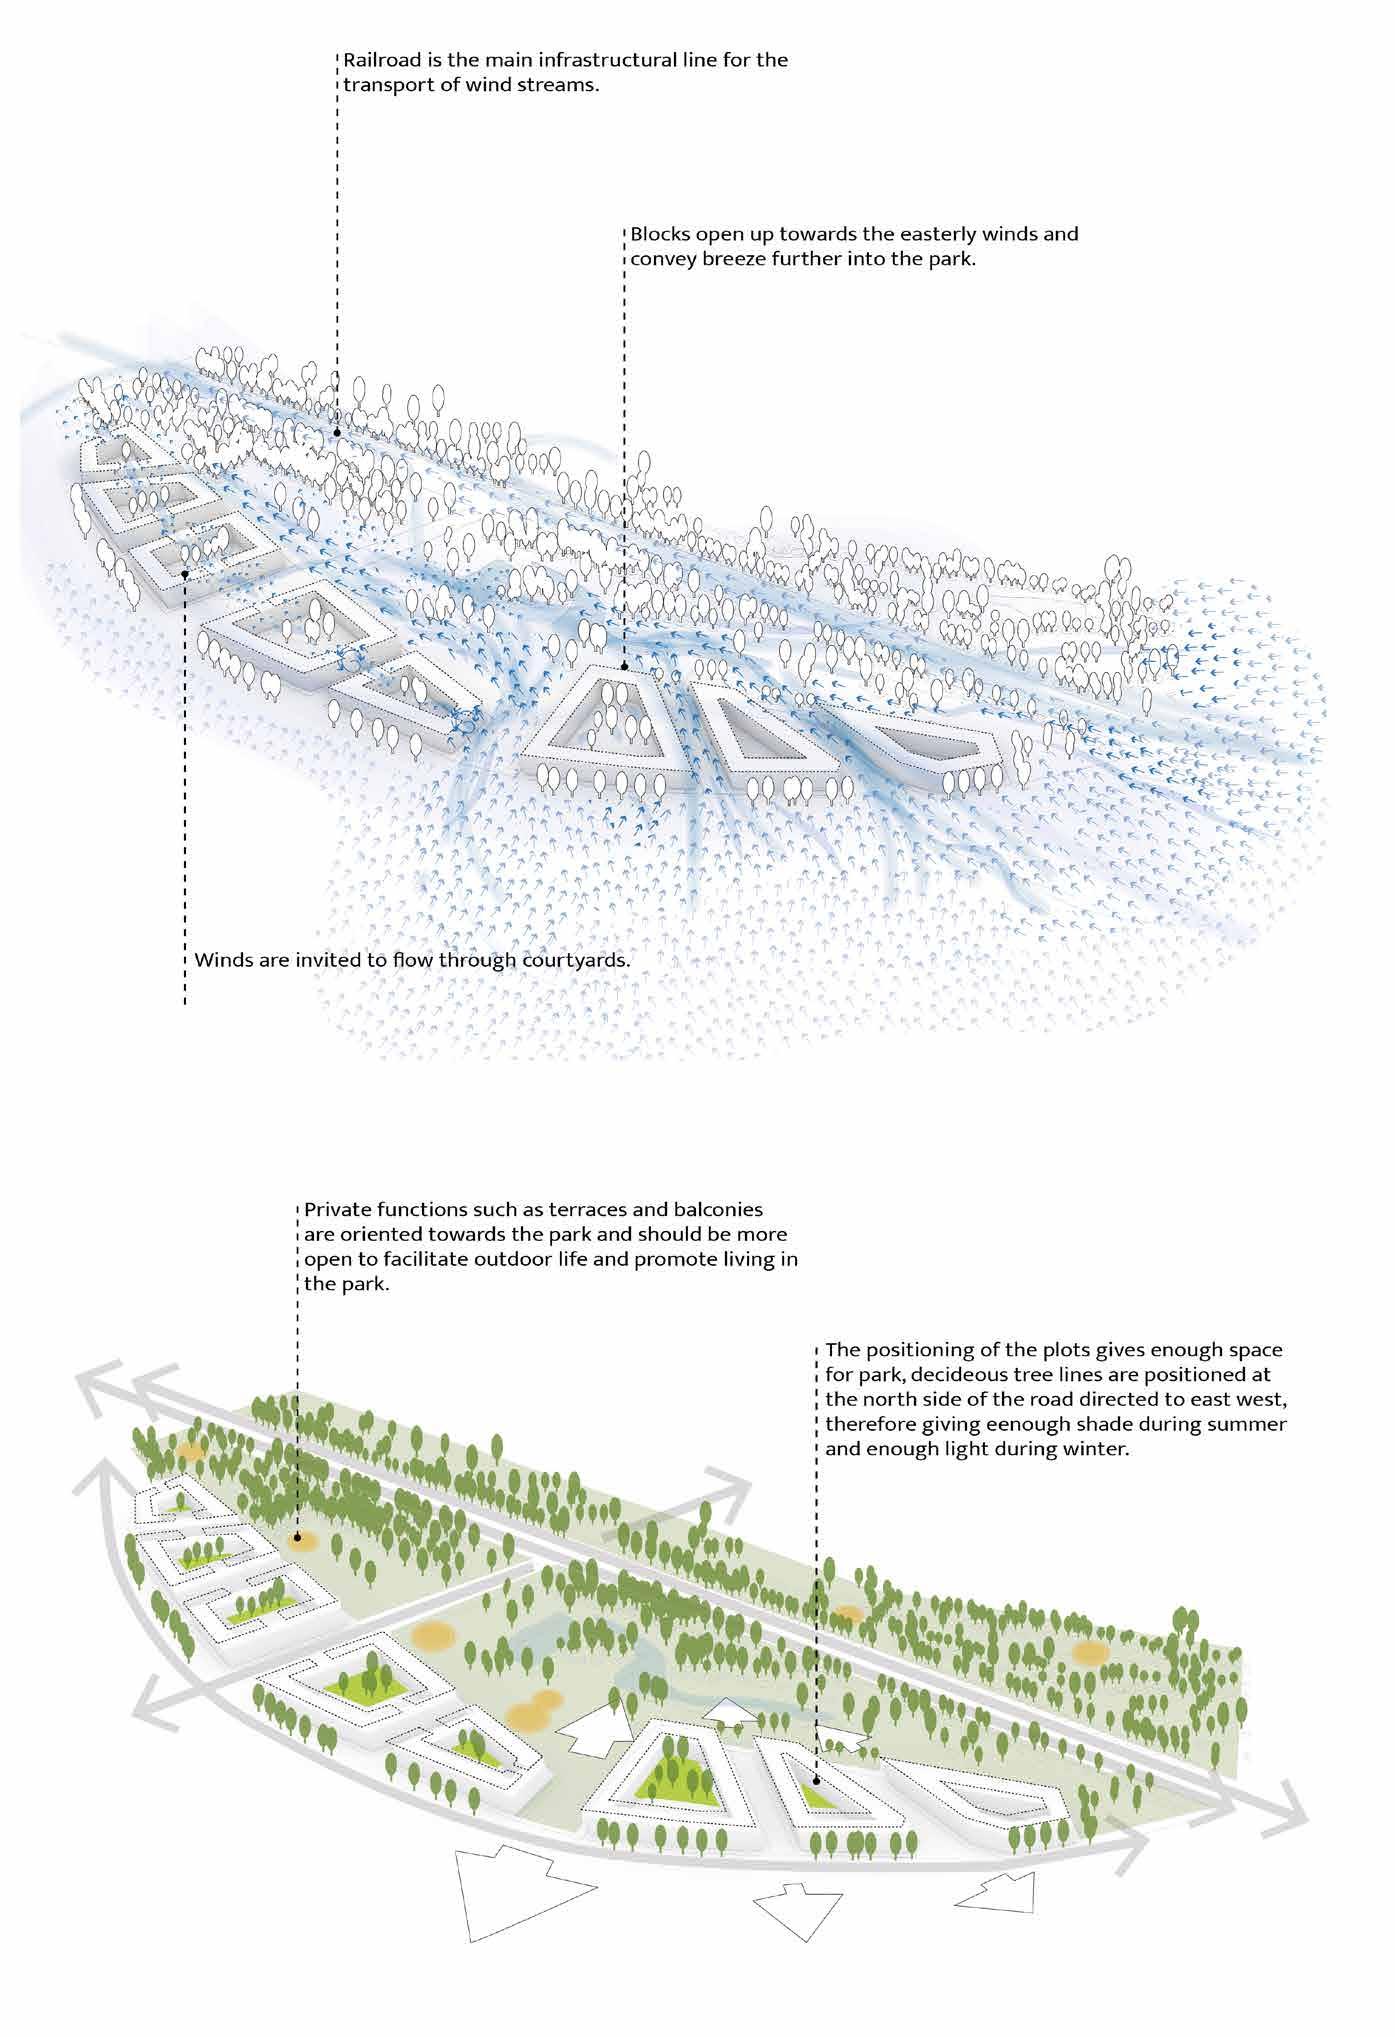
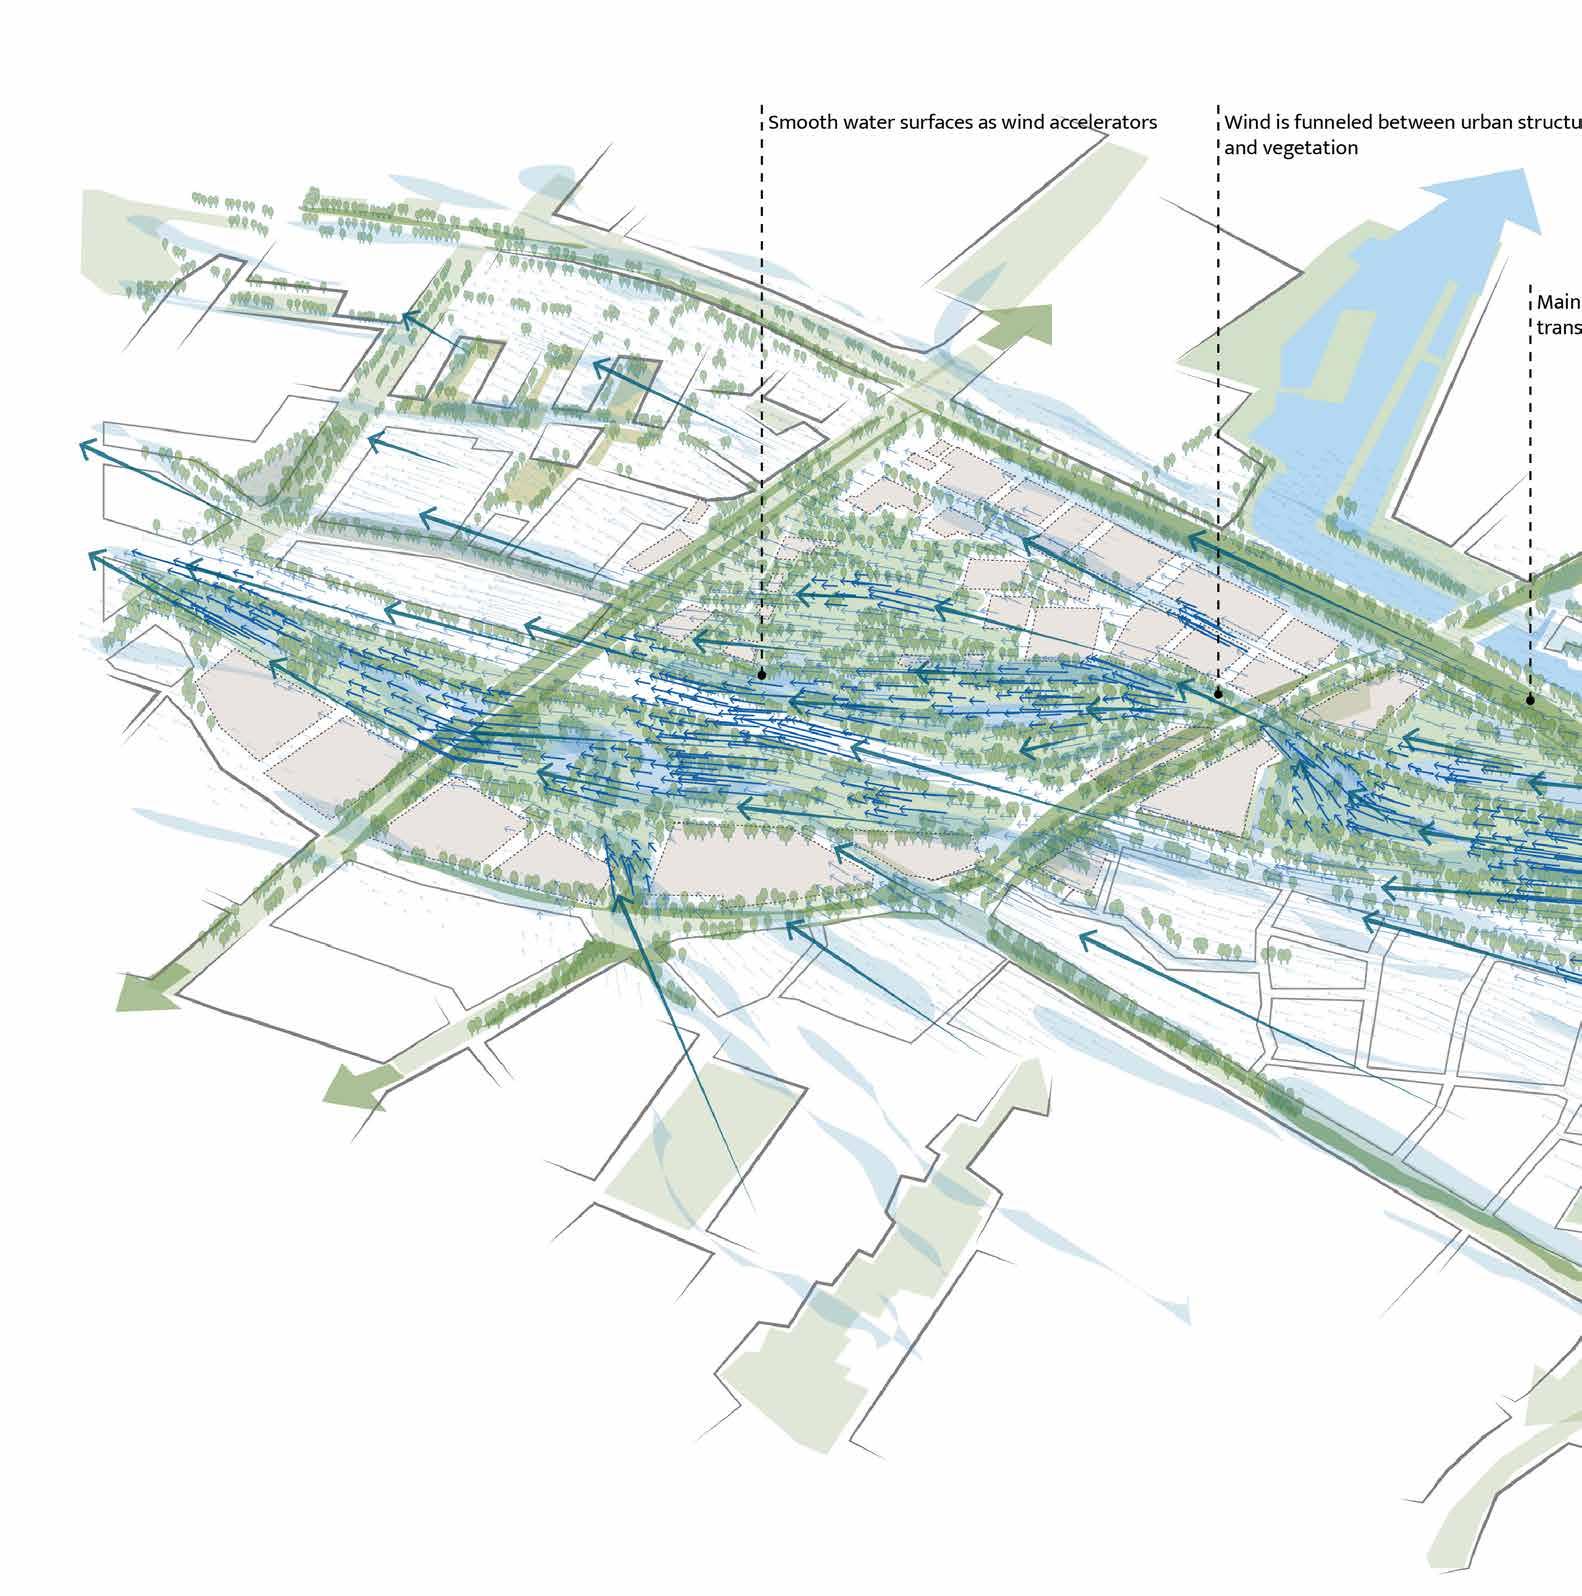
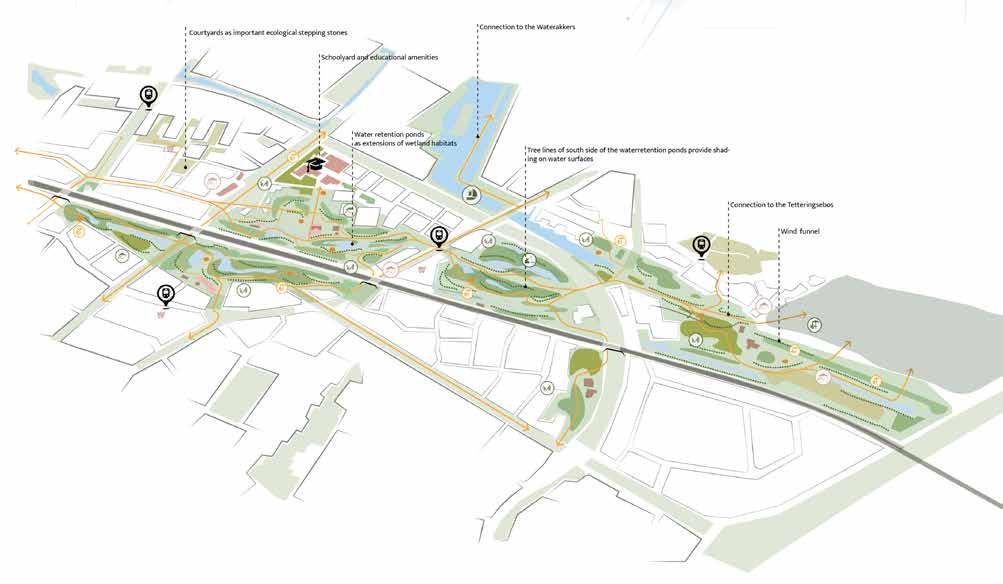
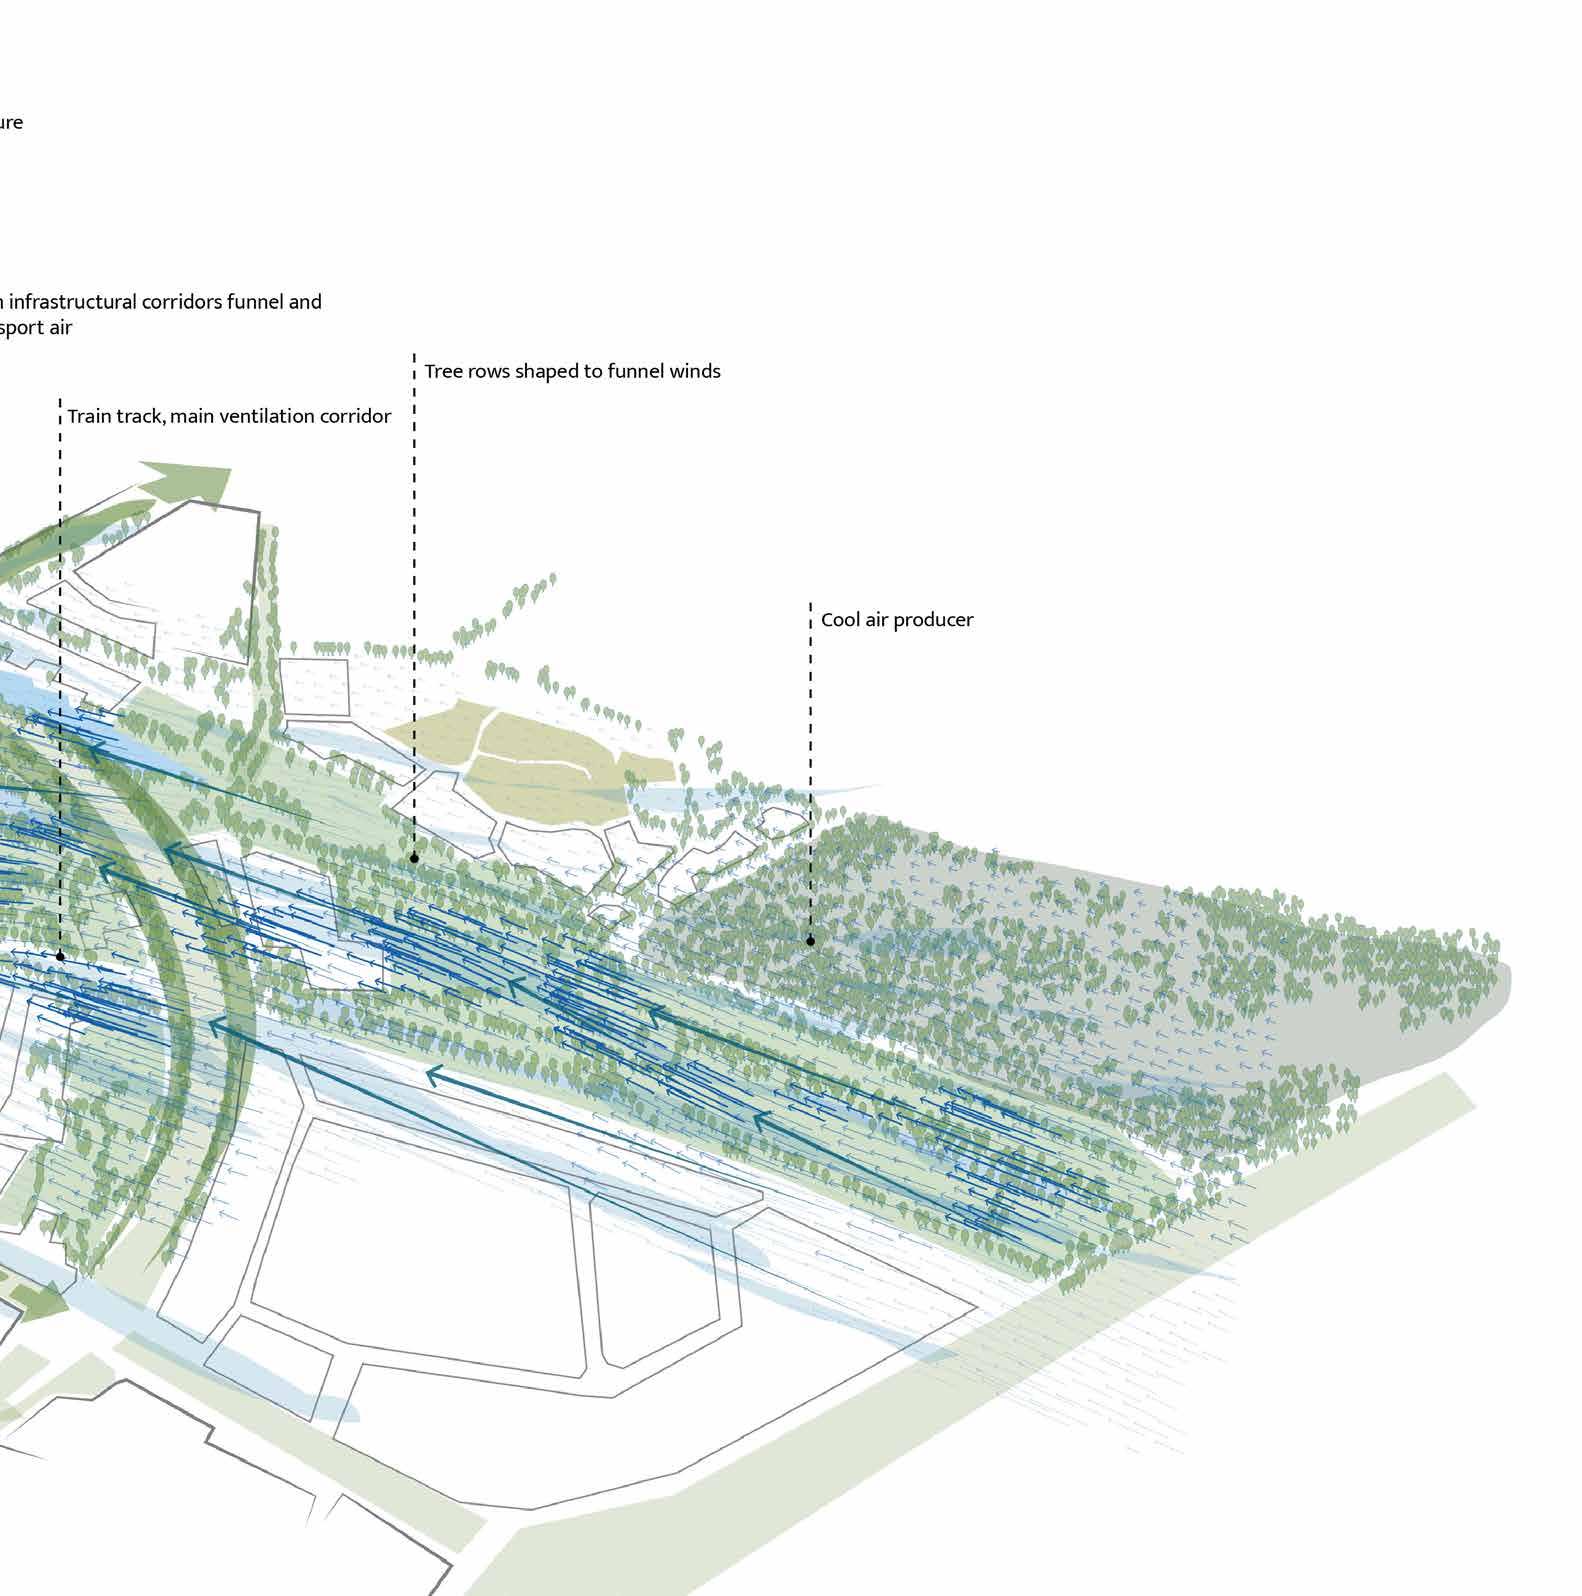
Wind funneling
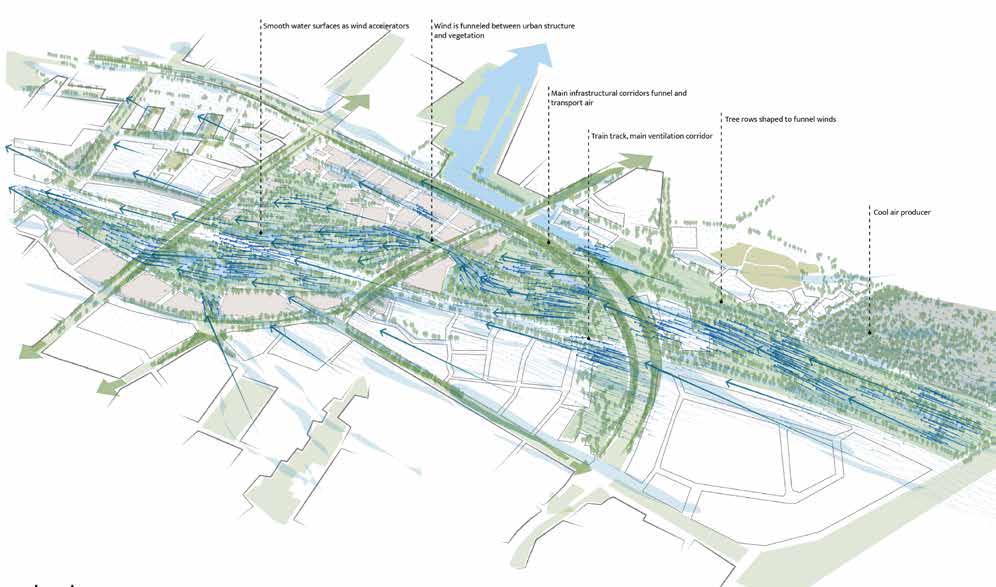
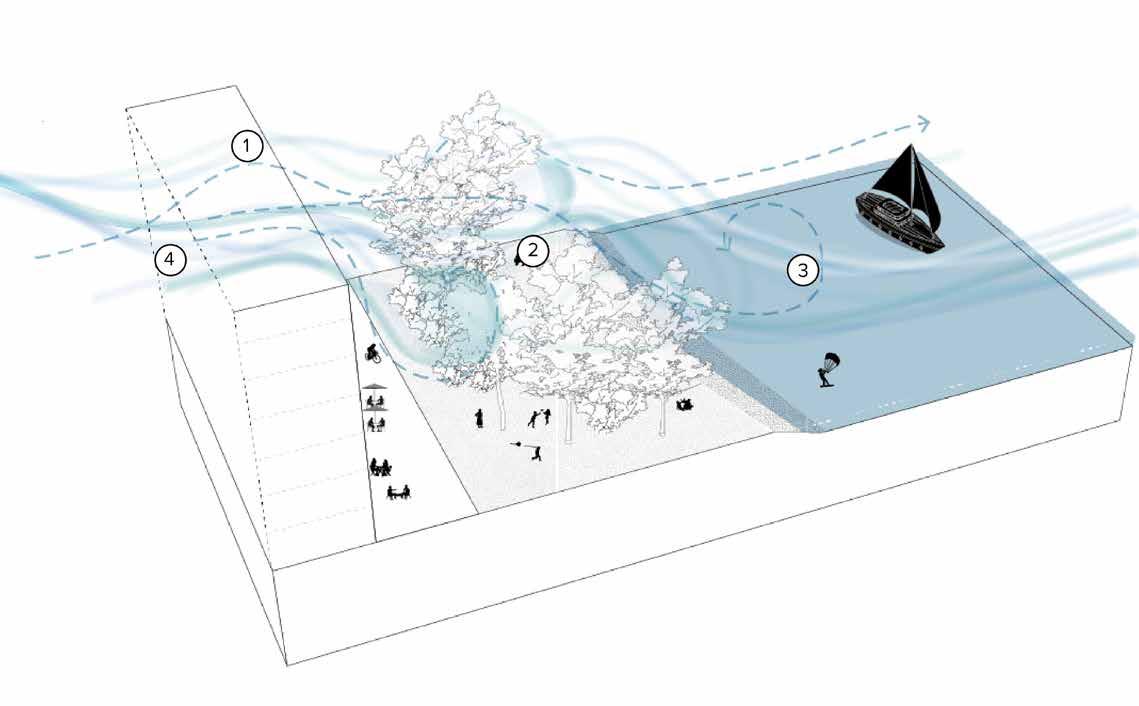
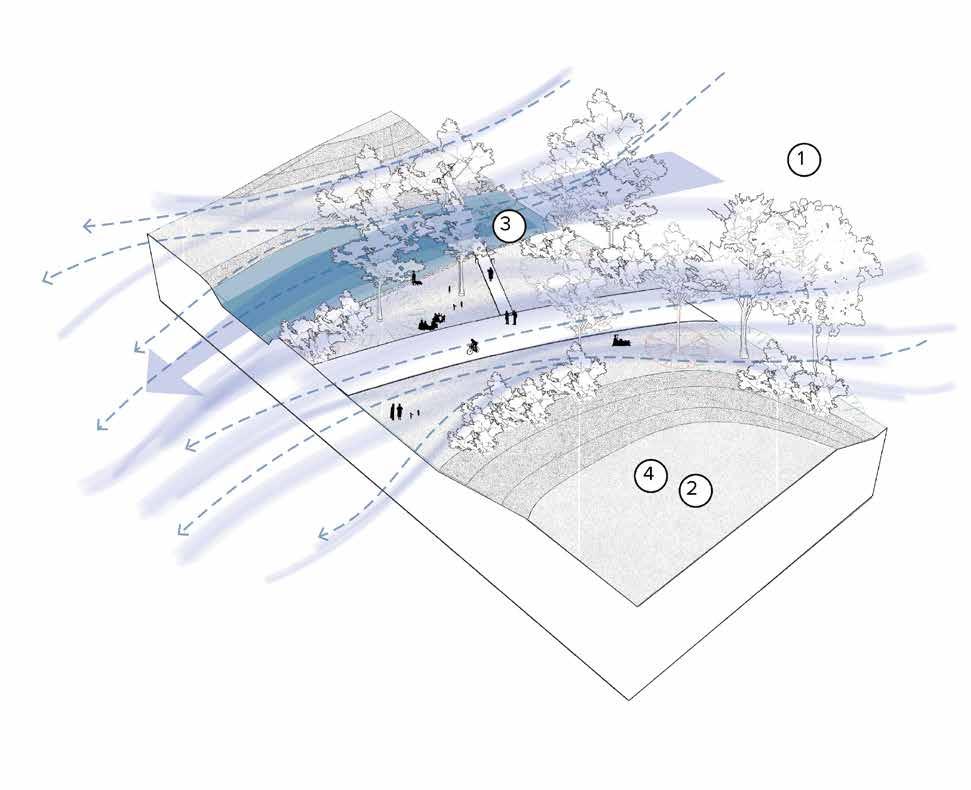
The development in the eastern part of Breda is focused on optimizing wind flow and ensuring a continuous, uninterrupted airflow. This emphasis is particularly necessary to address the impact of easterly summer winds, which bring warmer air into the city during the summer months. The overarching goal is to combat the urban heat island effect, with ventilation identified as a pivotal element alongside the planting of trees.
Efficient ventilation is crucial for transporting evaporation and effectively cooling warm air. Cities with inadequate ventilation can experience uncomfortable warmth during summer days. The integration of vegetation and carefully planned built structures plays a key role in guiding and enhancing winds within the urban environment.
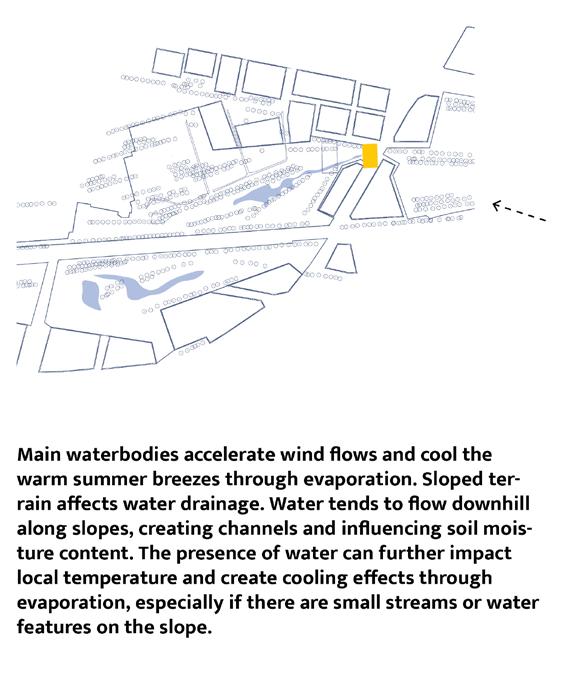
Water surfaces are recognized for their capacity to act as wind accelerators due to their smooth textures. Incorporating water features into the urban design is seen as a positive contribution to the overall ventilation system. However, it is emphasized that these water surfaces should be strategically shaded to prevent overheating.
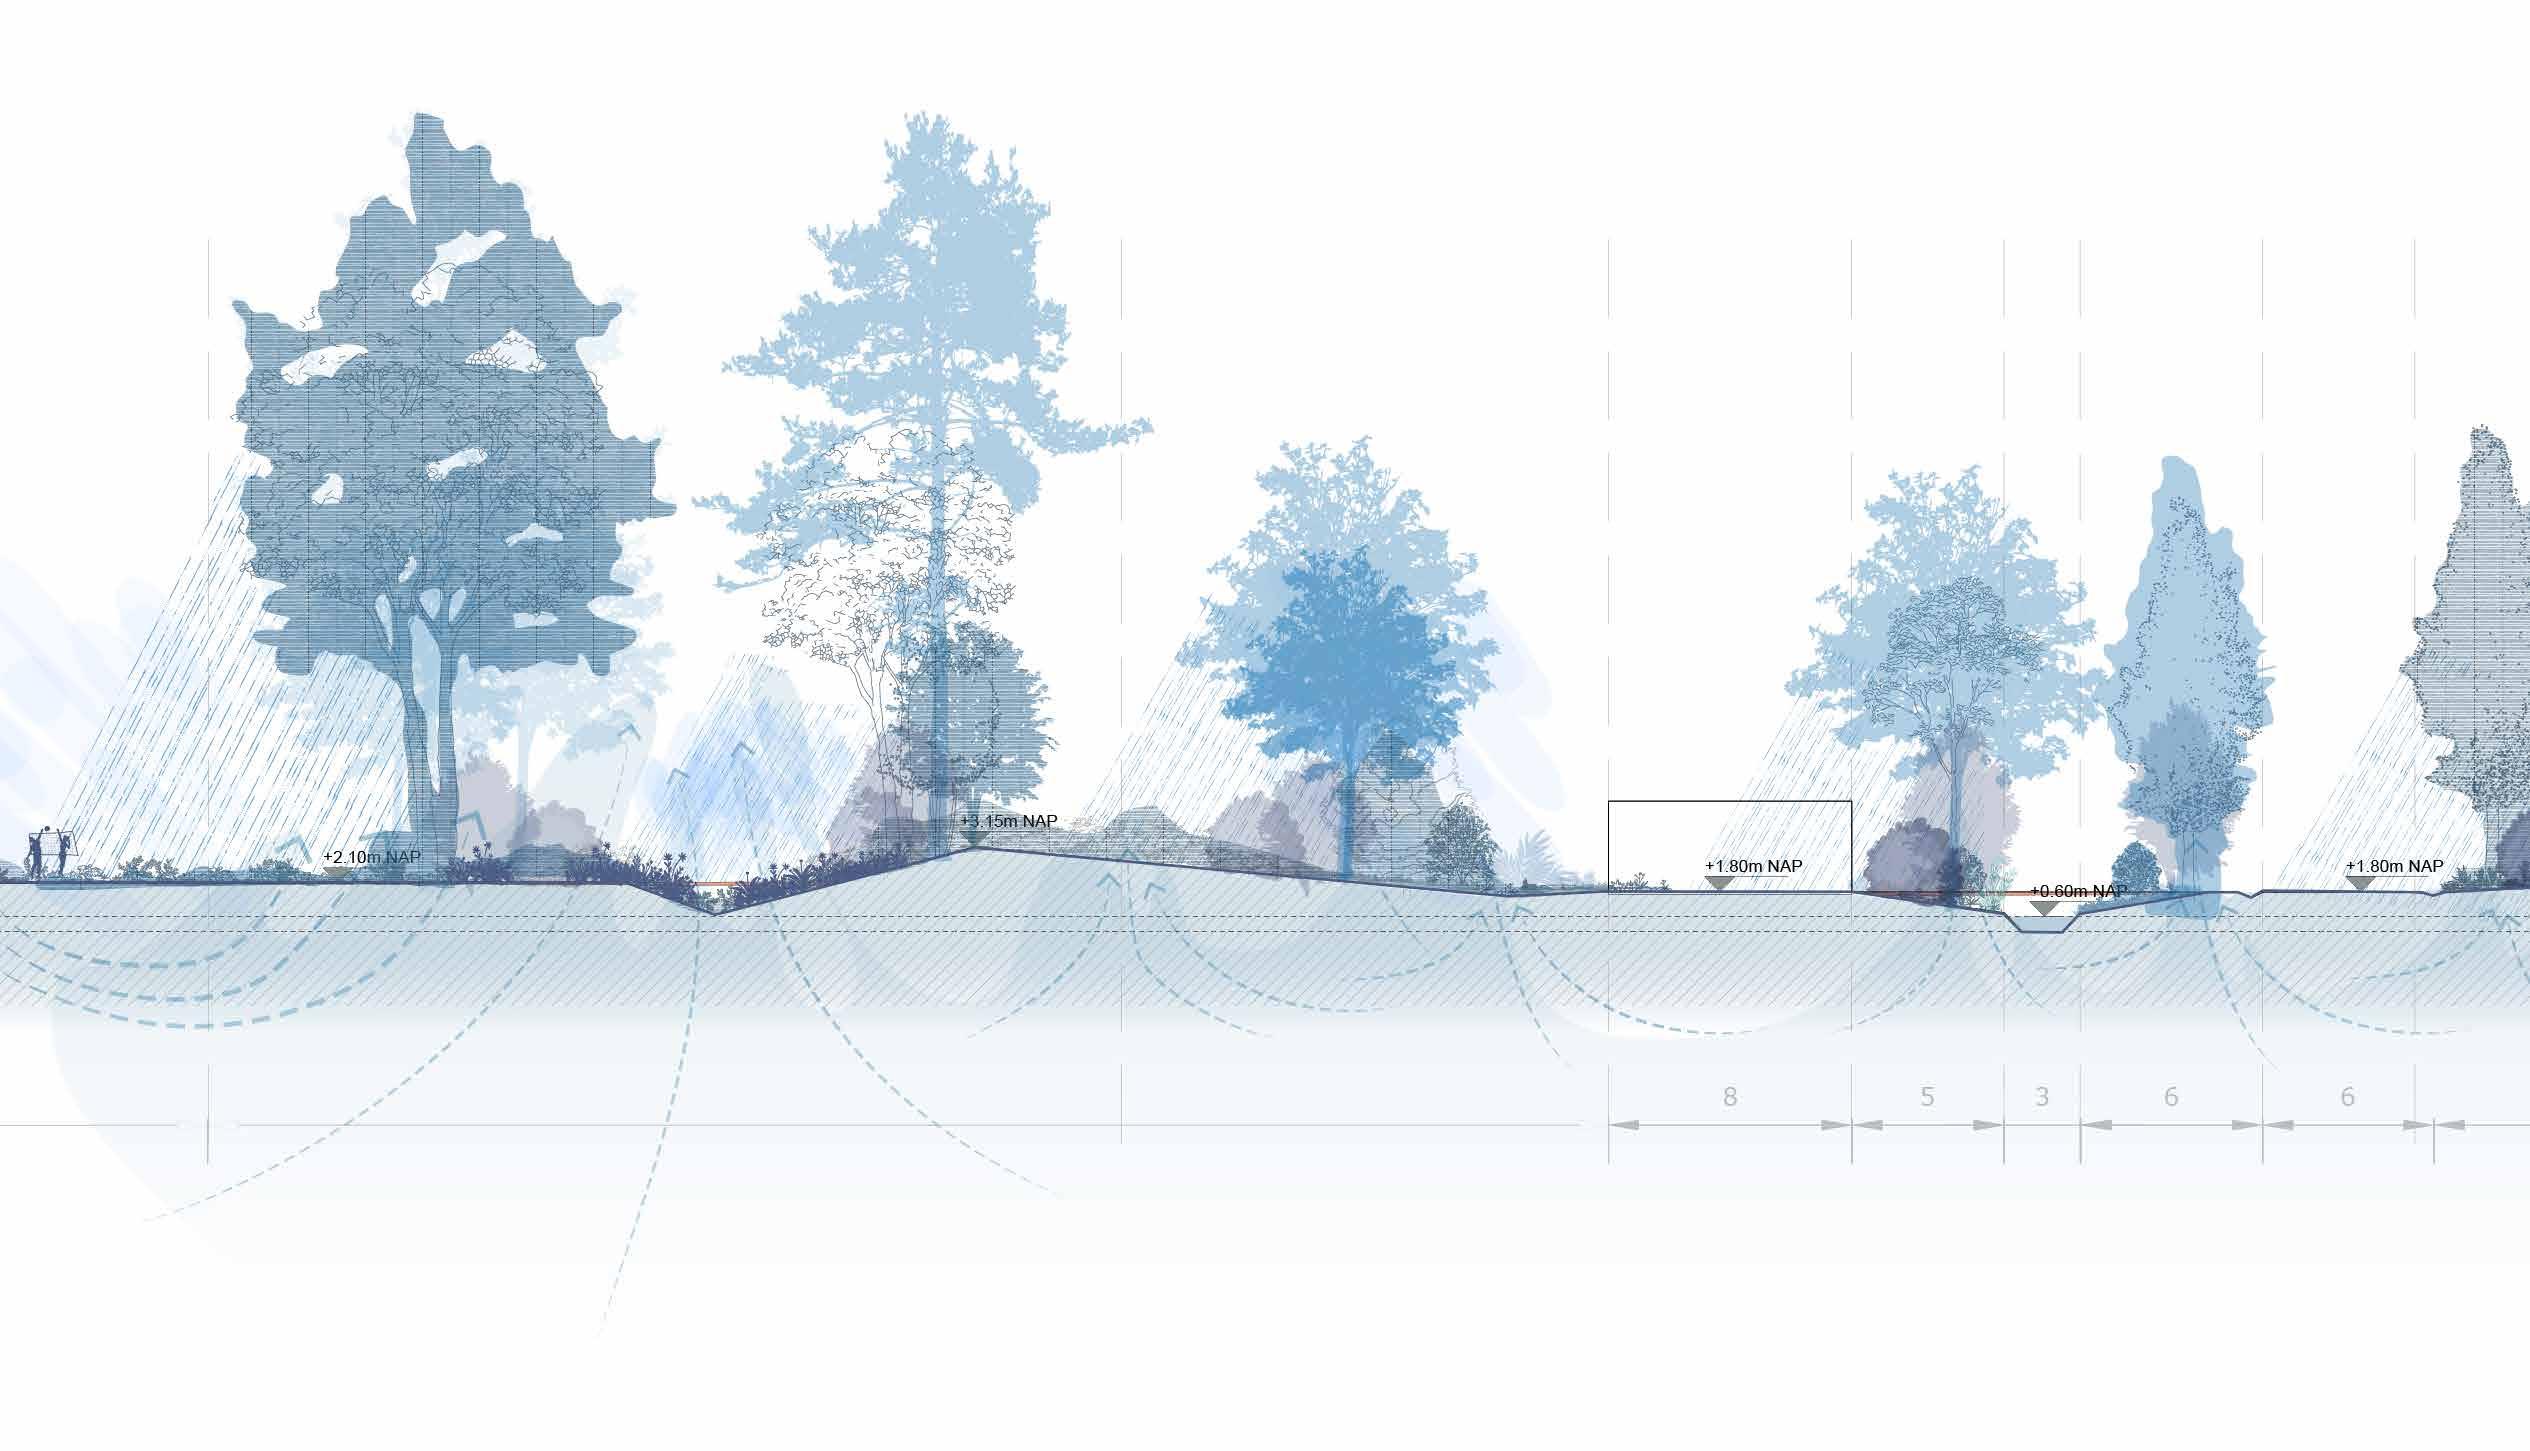
The shadows of trees canopies cool warm air down and create perfect microclimates in combination with cool breezes in the open landscape. Another important aspect is the use of topography.
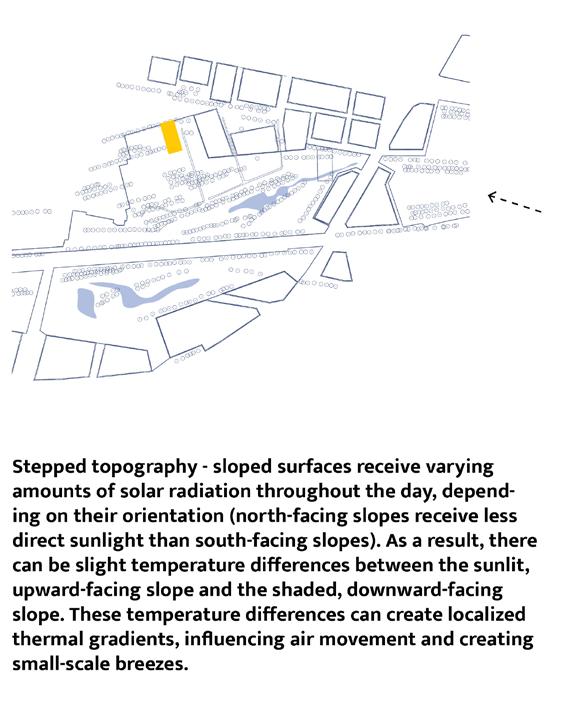
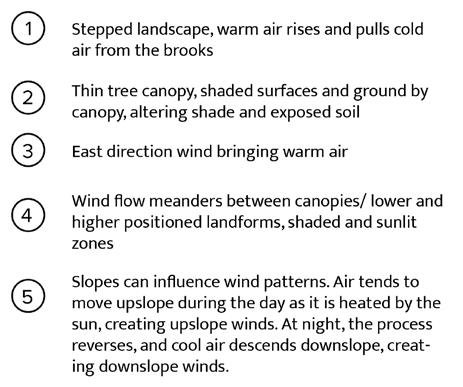
Microtopography influences sunlight exposure, with lower areas providing shade and cooler conditions, while higher spots receive more direct sunlight, affecting temperature differences within a small space. Air movement is affected, as valleys and depressions can guide airflow, facilitating the dispersion of warm air and the entry of cooler air, thereby improving ventilation. Certain microtopographic features, like small depressions or bodies of water, can collect and retain moisture, contributing to evaporation and a cooling effect in the surrounding area.
The variety of microtopographic features supports diverse vegetation patterns. Different types of vegetation provide shading, moisture retention, and transpiration, contributing to a cooler and more resilient microclimate.
van Bouwkunst
Borovska
Current situation
Complemented tree structure
Courtyards, as open spaces within built environments, facilitate the natural flow of air, promoting better ventilation and replacing stagnant air with fresher, cooler breezes. This contributes to a more comfortable and breathable urban atmosphere.
Openings between blocks allow for breezes to run through courtyards and hence be cooled by tree canopies or water surfaces. Moreover, courtyards play a crucial role in temperature regulation within urban blocks. By acting as open spaces that allow for the dissipation of heat, they prevent the buildup of hot air. This natural cooling effect becomes especially beneficial during warmer periods, contributing to more pleasant conditions within the urban environment.
Academie van Bouwkunst Amsterdam 23 | 24 | Rachel Borovska
Design Principles and Strategies for Urban Wind Channeling
Design Principles and Strategies for Urban Wind Channeling
Academie van Bouwkunst Amsterdam 23
24
Rachel Borovska
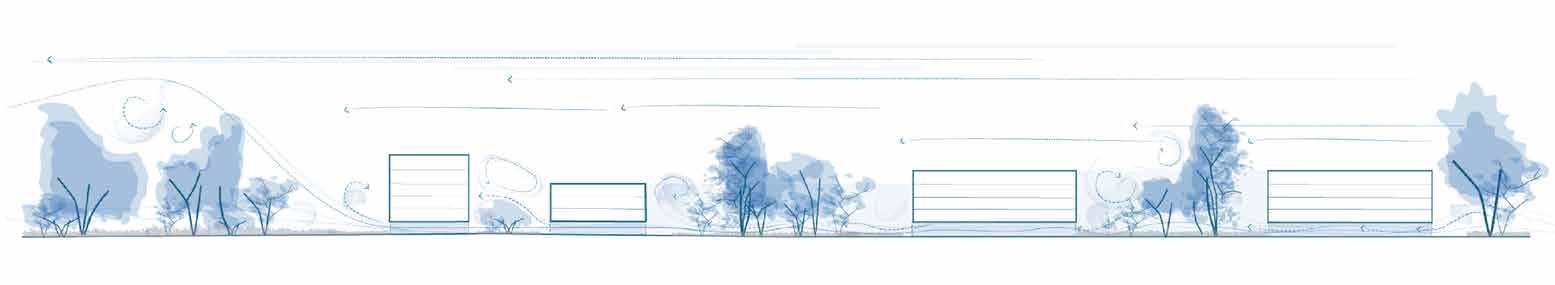
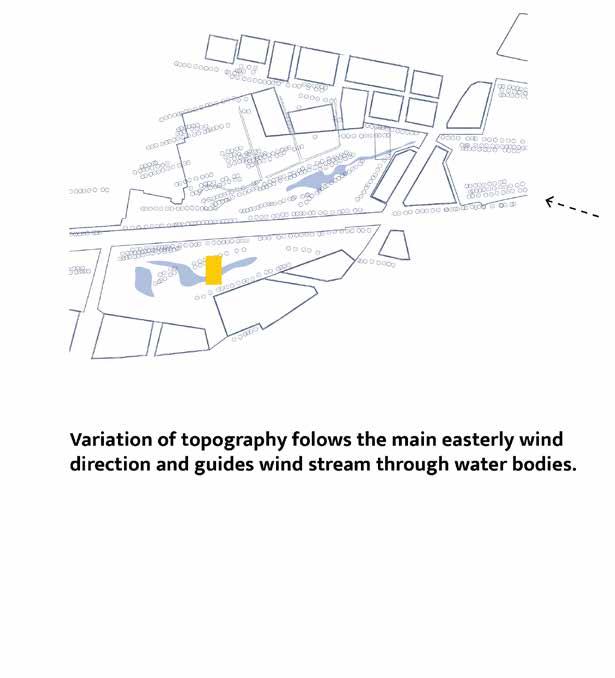
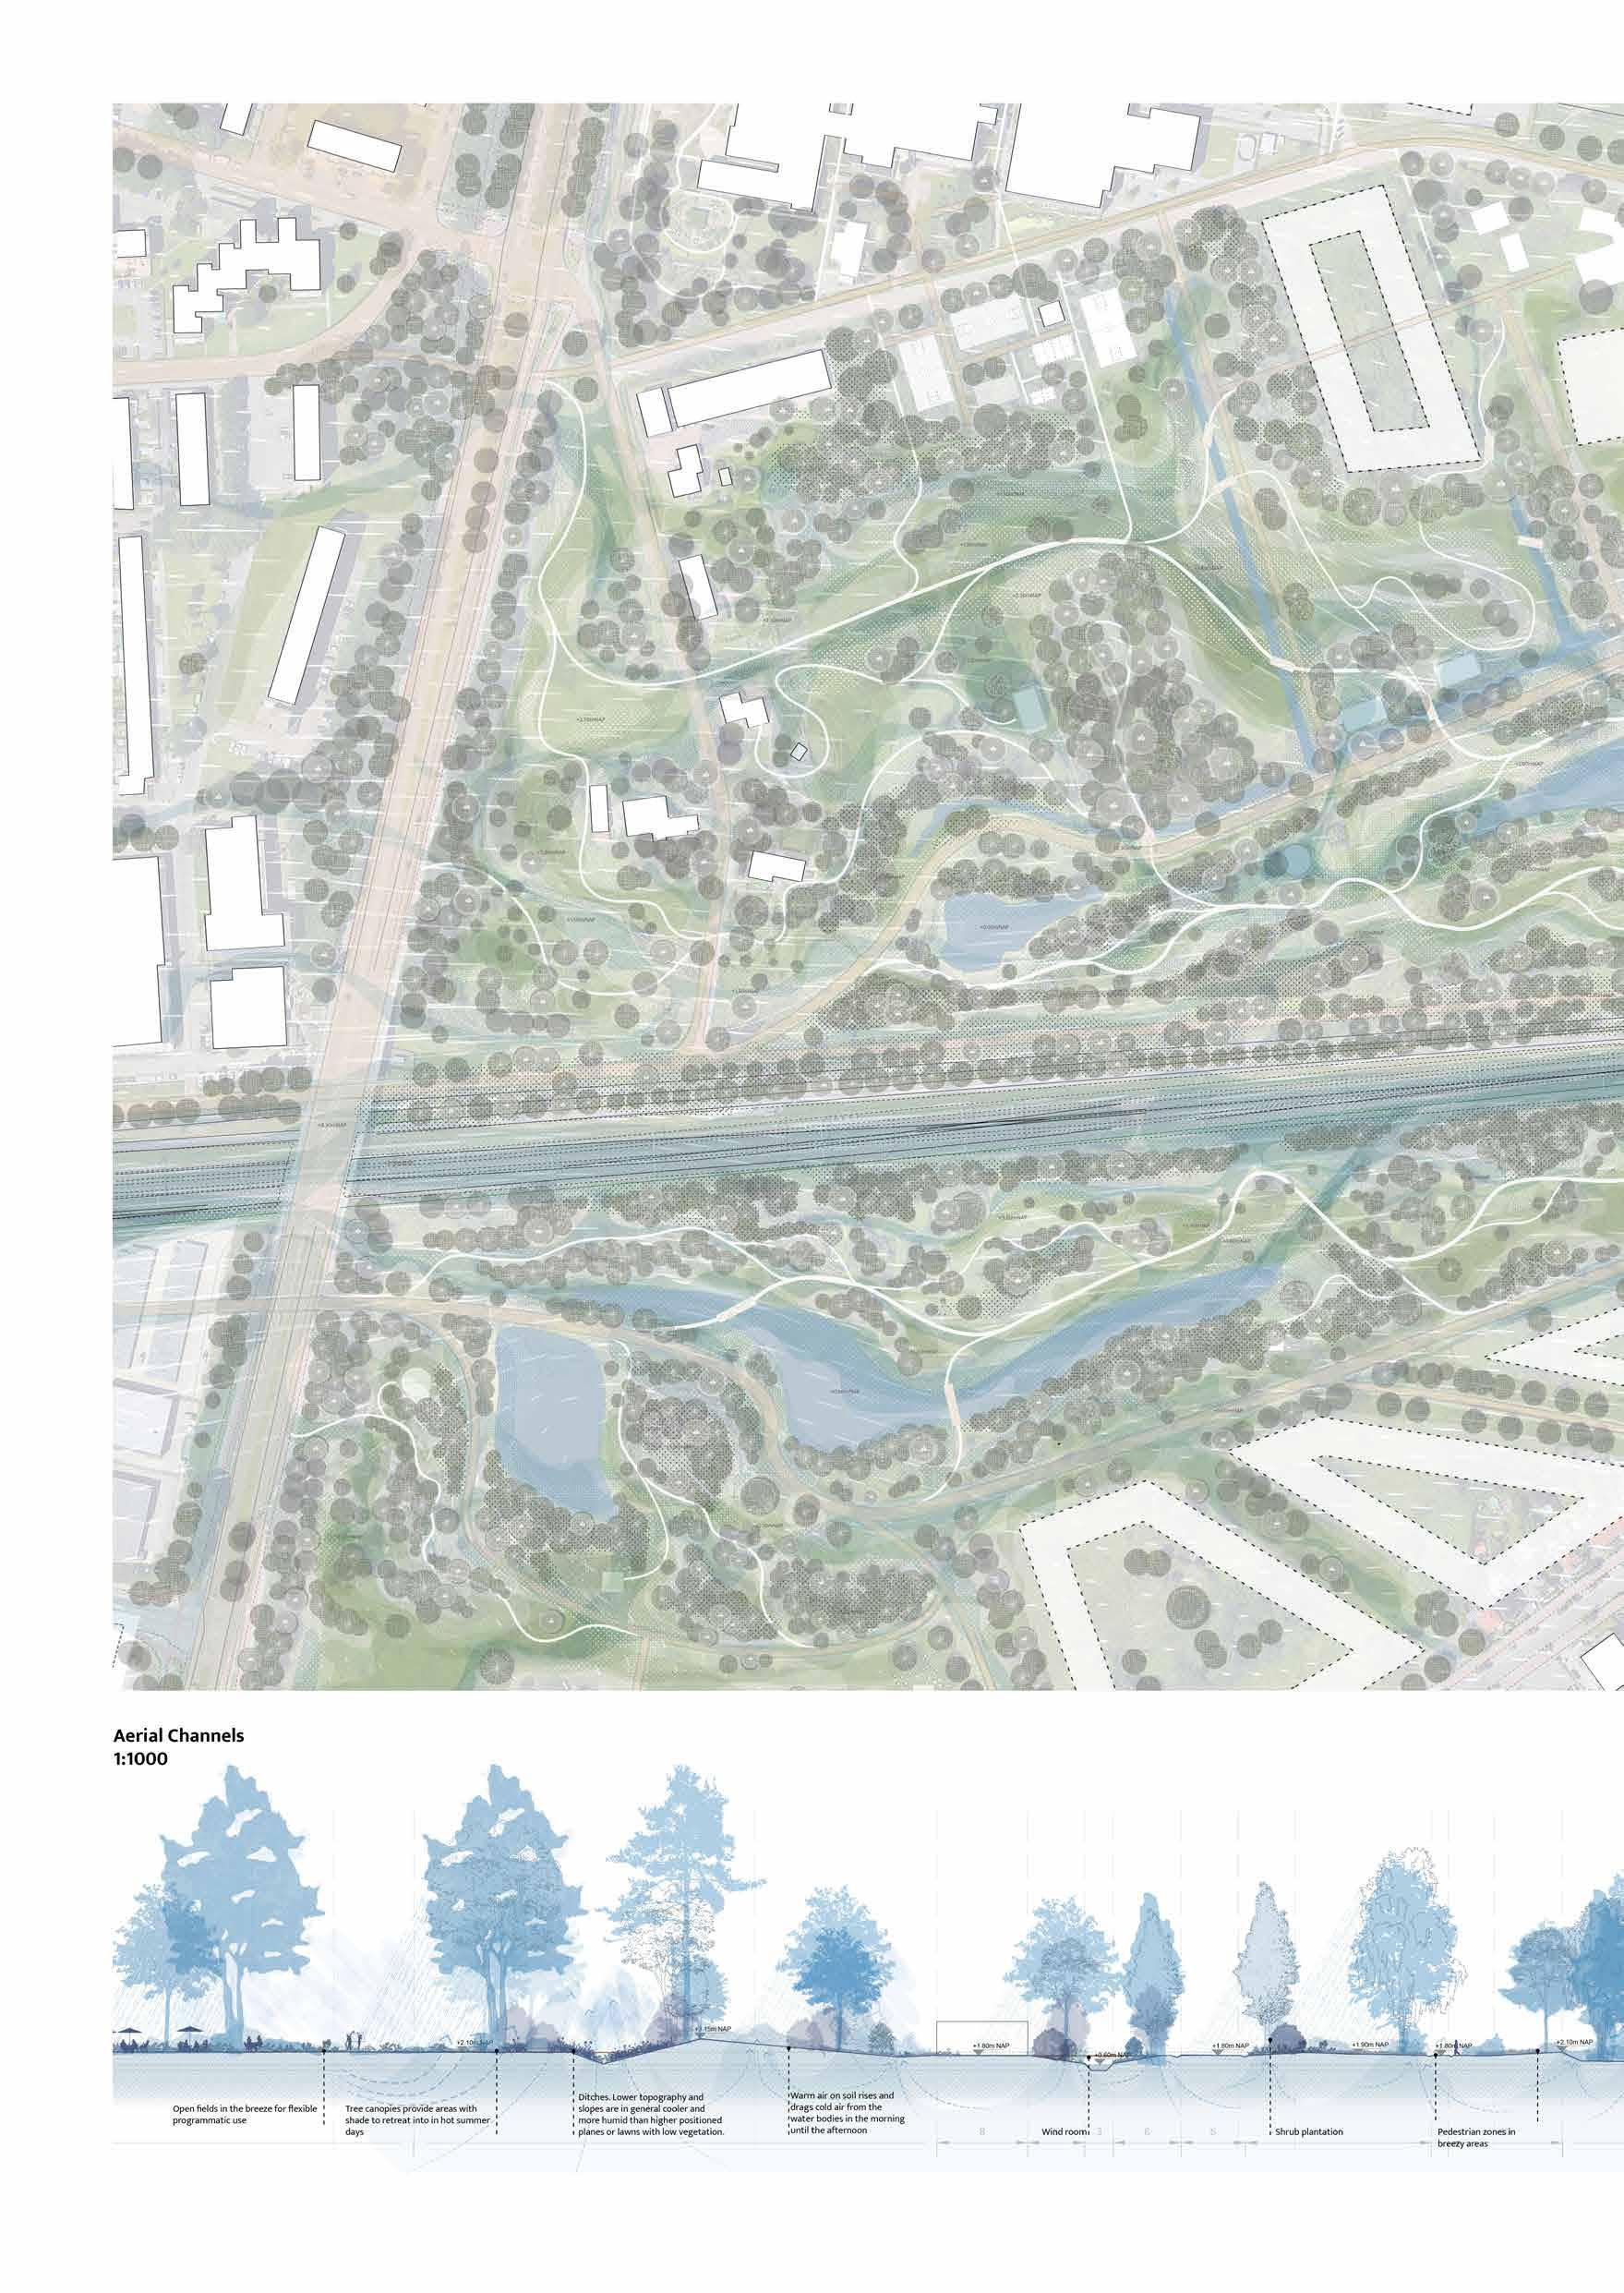
Composition of the ‘streams’
The variation in topography shapes areas where wind streams can continuously flow, enhancing natural ventilation. The cooling effect of water surtaces contributes to the formation of microclimates in the surrounding areas, as the cooler air over the water influences local temperatures. As wind passes over different surfaces, including shaded areas and water, it cools down and accelerates, carrying this evaporatively cooled air to surrounding areas.
Certain microtopographic features, like small depressions or bodies of water, can collect and retain moisture, contributing to evaporation and a cooling effect in the surrounding area. The variety of microtopographic features supports diverse vegetation patterns.
Legenda
Legenda: cold wind streams valley principle water
Legenda
Academie van Bouwkunst Amsterdam 23 | 24 | Rachel Borovska
“Planting the Edges”: Planting Plan Principle for Wind Protection
The planting composition is organized in streams of layered vegetation. on the sides with shrubs and taller trees in the back. These make sure the wind streams are funnel in a “valley” shaped planting scheme.
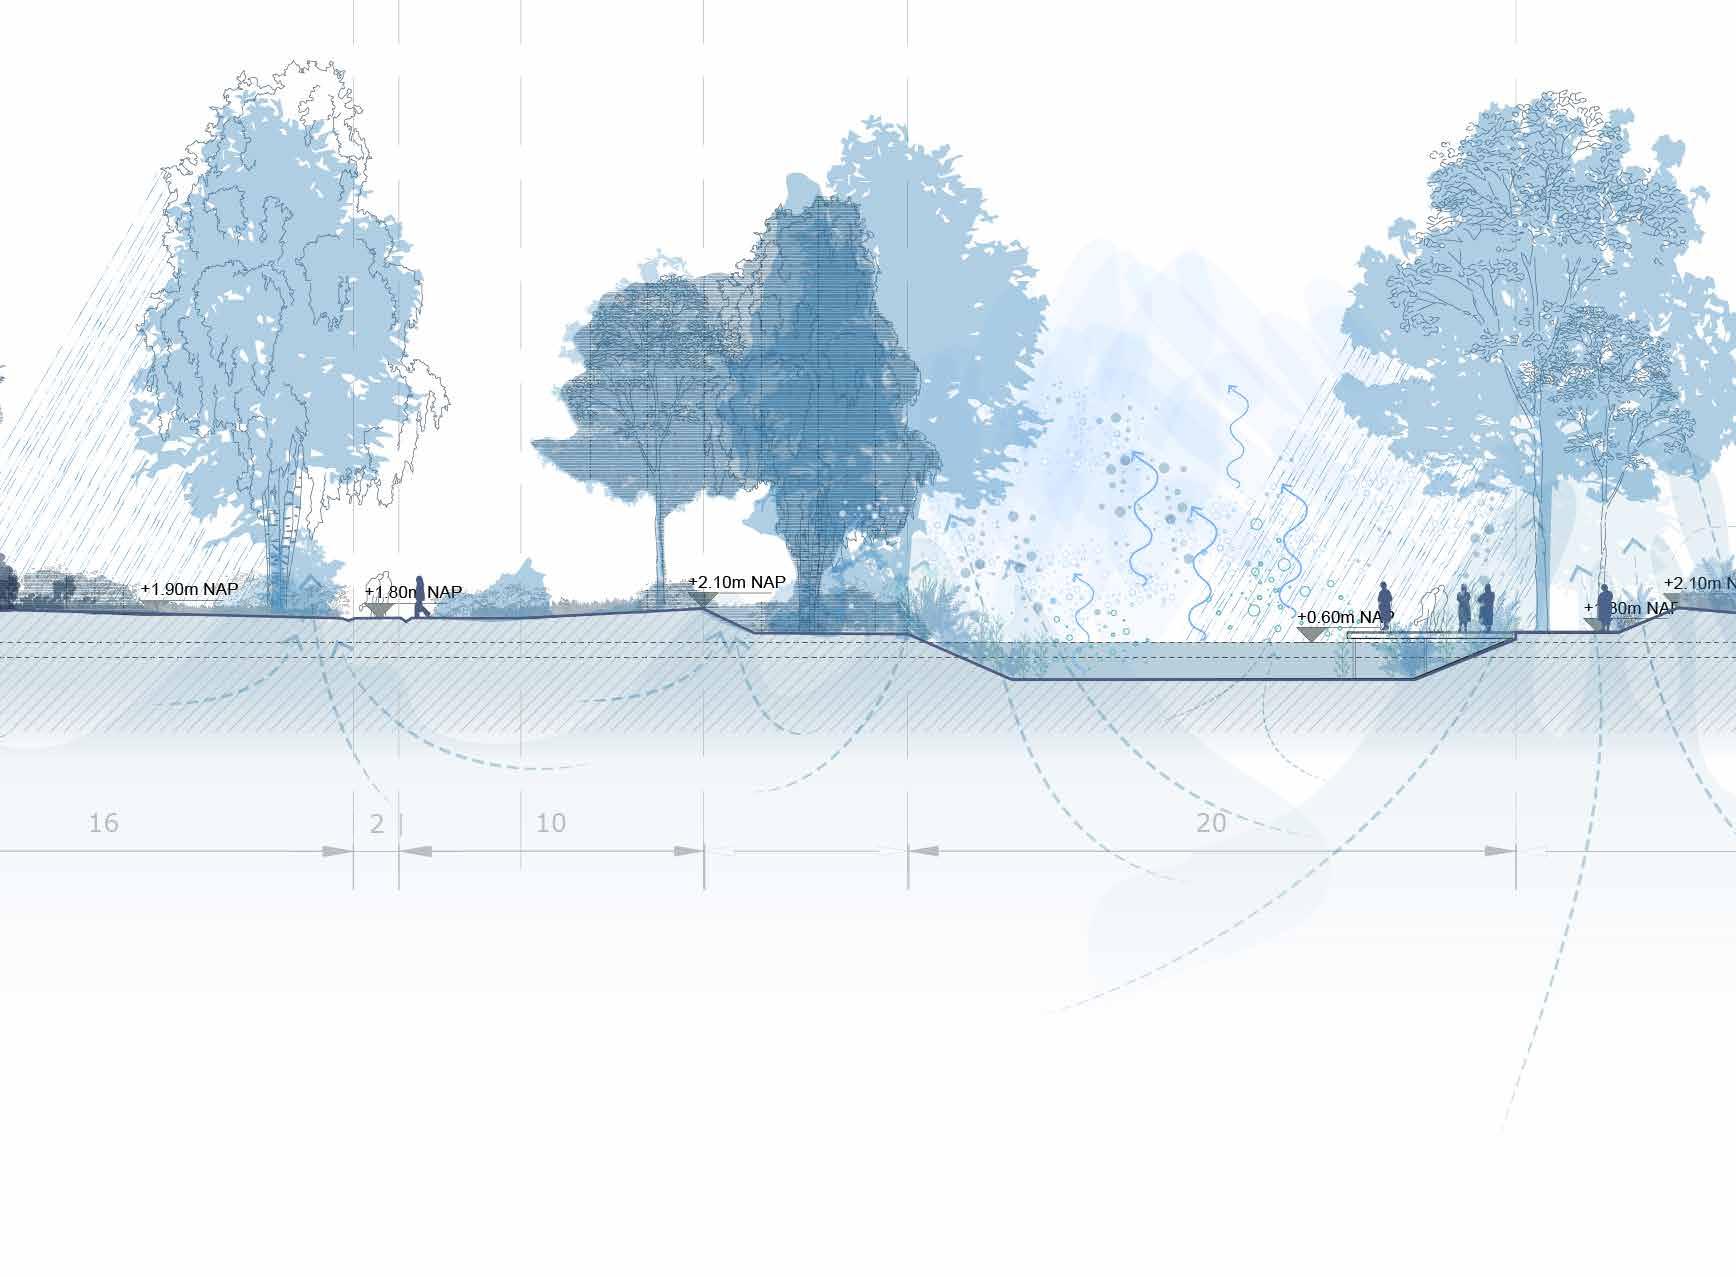
Breezes play a crucial role beyond human comfort on warm days and they are essential to the ecological balance. Floating on the wind, spiderwebs and seeds travel through the air. while butterflies, dragonflies, and certain species of ants rely on wind currents to migrate, especially during their reproductive stages. Pollen drifts to pollinate distant plants, and seeds disperse across the landscape.
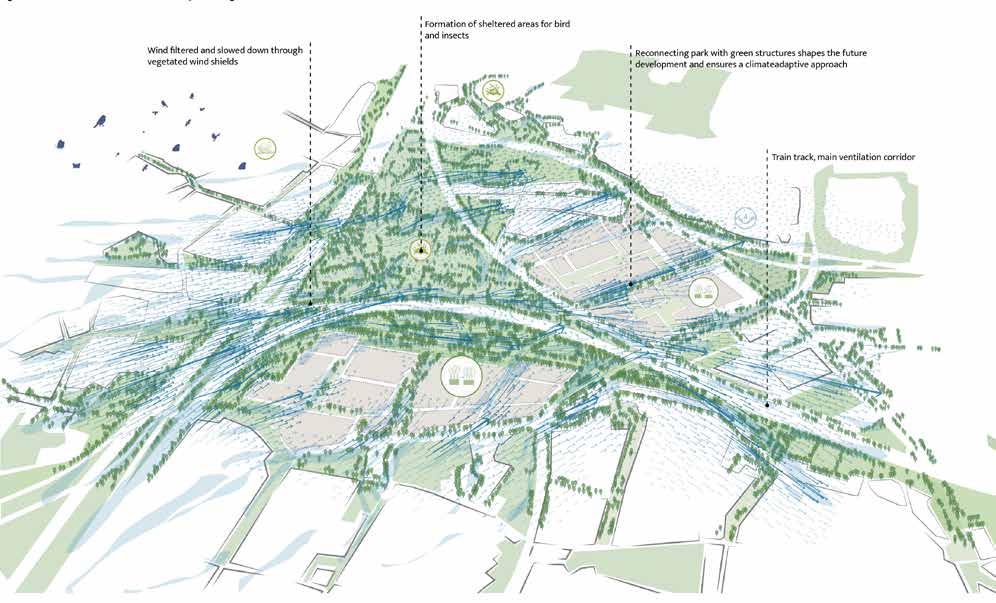
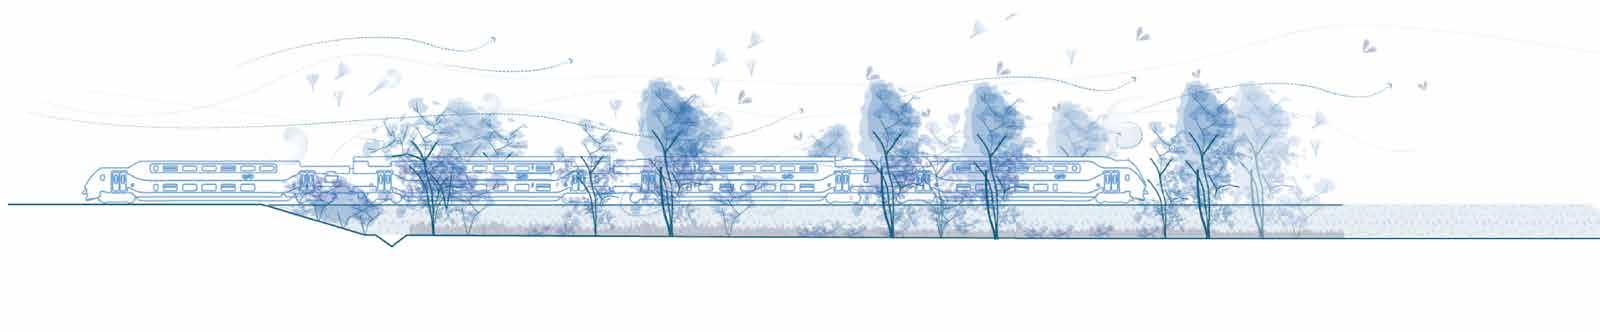
Railway corridors play a crucial role in urban ventilation, with their expansive linear profiles and open surfaces helping to shape the local climate. Beyond their climatic function, they also serve as vital ecological corridors, offering extensive migration routes for wildlife and creating airborne pathways for seed dispersal.18
Design Principles and Strategies for Urban Wind Channeling
Design Principles and Strategies for Urban Wind Channeling
Academie van Bouwkunst Amsterdam
24
Rachel Borovska
Design Principles and Strategies for Urban Wind Channeling
Academie van Bouwkunst Amsterdam 23 | 24 | Rachel Borovska
Academie van Bouwkunst Amsterdam 23 | 24 | Rachel Borovska
Conclusion
EXPLORING THE INVISIBLE
Our cities are constantly shaped by natural processes and unseen forces. Many of the things we do, build, create, and change in our urban environments have a significant impact on local climates.
Understanding elements such as wind, humidity, evaporation, and heat allows us to adapt and design more responsive urban spaces. Wind, for instance, plays a crucial role in regulating temperatures and dispersing heat in urban areas. Effective ventilation transports warm air away from surfaces while enhancing the cooling effects of evaporation from vegetation and water bodies.
Emphasizing wind flow in urban design can prevent heat buildup, create more pleasant microclimates, and reduce reliance on energy-intensive cooling systems. When reintroducing urban ventilation as a design principle, it should be considered as an equally important element alongside green and blue spaces. While current strategies often prioritize adding vegetation and water features, ventilation remains underutilized in urban planning.
WIND LIKE WATER
Guiding and designing for wind should be as integral to urban planning as working with water. Just as water features create cooling streams and enhance urban landscapes, wind has specific trajectories that can be studied and applied for urban benefits.
Understanding and integrating wind patterns into urban design can significantly enhance heat mitigation strategies. Like water, wind follows predictable paths influenced by the landscape and built structures and needs to be given space in our urban environments.
SCULPTING WITH THE WIND
By incorporating wind patterns into urban design, cities can enhance natural cooling, reduce the urban heat island effect, and improve overall air quality. This project highlights the importance of integrating wind considerations into urban planning as a complement to existing heat mitigation strategies.
Trees and buildings function simultaneously as barriers. Depending on their porosity and strategic placement, they can align with prevailing wind patterns, amplifying their cooling effects. Similarly, the positioning of water bodies and the sculpting of topography can optimize wind-driven evaporation, further enhancing urban cooling.
To create resilient and livable cities, it is essential to adopt a holistic approach that includes ventilation as a fundamental component. Wind influences the formation of microclimates—distinct areas with unique climatic conditions. By affecting temperature, moisture, and airflow, wind helps create diverse habitats that support various plant and animal species.
SEEDS AND SPIDERS IN THE AIR
Wind functions as an essential ecological stream, playing a crucial role in airborne ecology. As a natural transporter of seeds and pollen, wind aids in the reproduction and spread of various plant species. This process, known as anemochory for seeds and anemophily for pollen, is vital for maintaining plant biodiversity and ecosystem health. Beyond seeds and pollen, wind also disperses fungal spores, microorganisms, and small insects such as spiders—helping species migrate, maintain ecological balance, and support genetic diversity.
Humans are not the only ones seeking comfort on hot days. Fluctuating temperatures significantly impact various biotopes and can disrupt entire ecosystems. Changes in breeding patterns and behavior due to extreme temperatures can lead to population declines, habitat loss, and ecosystem degradation.
MISSING LINK IN URBAN PLANNING
Current densification strategies face complex challenges—balancing the urgent need for space and housing while simultaneously addressing biodiversity loss and mitigating urban heat islands. City visions integrate themes such as mobility, nature networks, and zoning into layered, intricate plans. However, winds and microclimatic conditions are often overlooked, despite their potential to justify the protection or introduction of green wedges and corridors into cities.Considering wind dynamics in urban planning can help shape urban forms in ways that enhance environmental resilience and livability. These principles can serve as valuable guidelines for expansion or densification at the city scale, demanding attention as climate-related concerns intensify.
As climate-related challenges become increasingly urgent, it is essential for landscape architects, architects, and urbanists to become more sensitive and attentive to the forces shaping our environments—especially those whose effects may not be immediately visible.
“By feeling, breathing, and touching architecture and its landscape, by opening our buildings more to the wind and sounds, a new topology of architecture could be born into something never before conceived of, in which landscape could regain a central role,”
Christophe
Girot in Dagenais 2021
The following pages of the appendix contain essential research materials and methods that were crucial for the completion of this graduation project.
23 | 24 | Rachel
Academie van Bouwkunst Amsterdam
Borovska
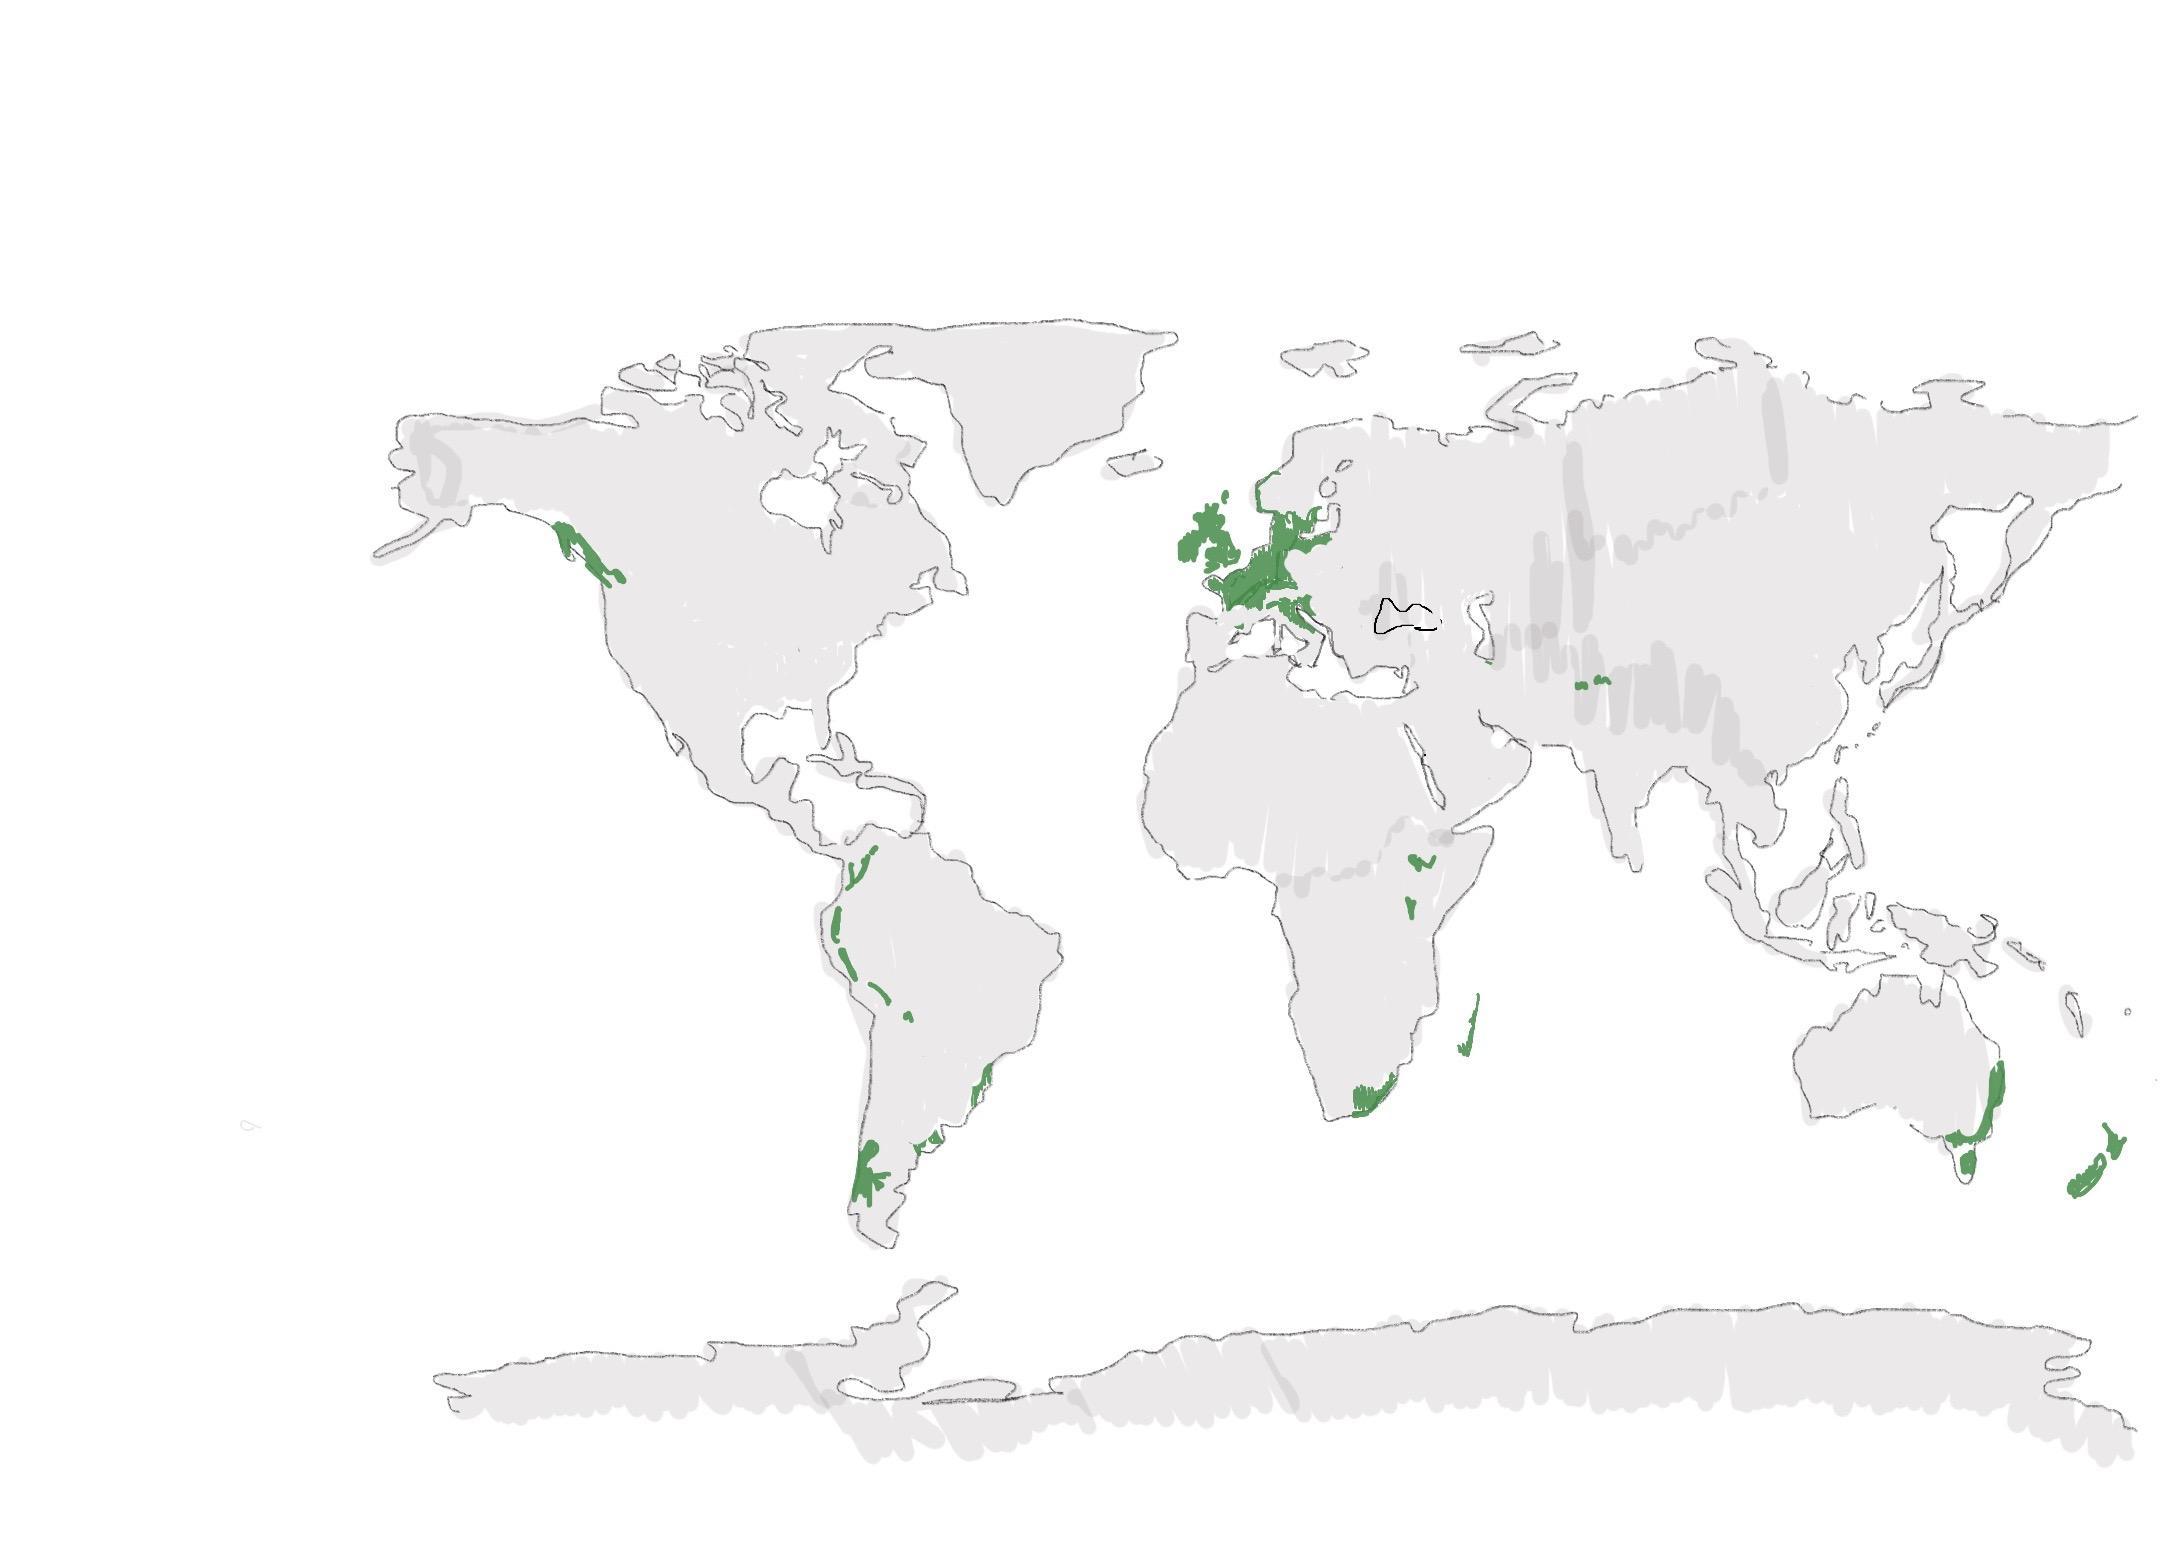
Koppen Climate Classification
The Köppen climate classification system is widely used to categorize the world’s climates based on average temperature and precipitation. The classification “Cfb” refers to a specific type of temperate climate, and it can be described as follows:
- C: Signifies a temperate or mesothermal climate with moderate temperatures and minimal seasonal variations. The coldest month has an average temperature between -3°C (26.6°F) and 18°C (64.4°F), while the warmest month averages above 10°C (50°F).
- f: Indicates a fully humid climate without a dry season, with precipitation evenly distributed throughout the year.
sub-type in Köppen classification
- b: Refers to a warm summer, where the warmest month has an average temperature below 22°C (71.6°F), but there are at least four months with average temperatures above 10°C (50°F).
In summary, a Cfb climate is characterized by mild temperatures, consistent precipitation, and warm but not excessively hot summers. This type of climate is typical of regions such as parts of Western Europe (including much of the United Kingdom, France, and Germany), parts of New Zealand, and the Pacific Northwest of the United States. 19
If natural and climatic phenomena—such as prevailing winds, temperature patterns, and seasonal variations—can be categorized worldwide, then urban planners can apply proven interventions across different cities with similar conditions. This can lead to more effective climate adaptation strategies while avoiding a trial-and-error approach in each city.
Fig.24 An indication on countries under the Cfb classification (Adapted from “Temperate Oceanic Climate (Cfb)” n.d.) 19“TemperateOceanicClimate(Cfb),”SKYbraryAviationSafety,accessed13March2025,https://skybrary.aero/articles/temperate-oceanic-climate-cfb-0.
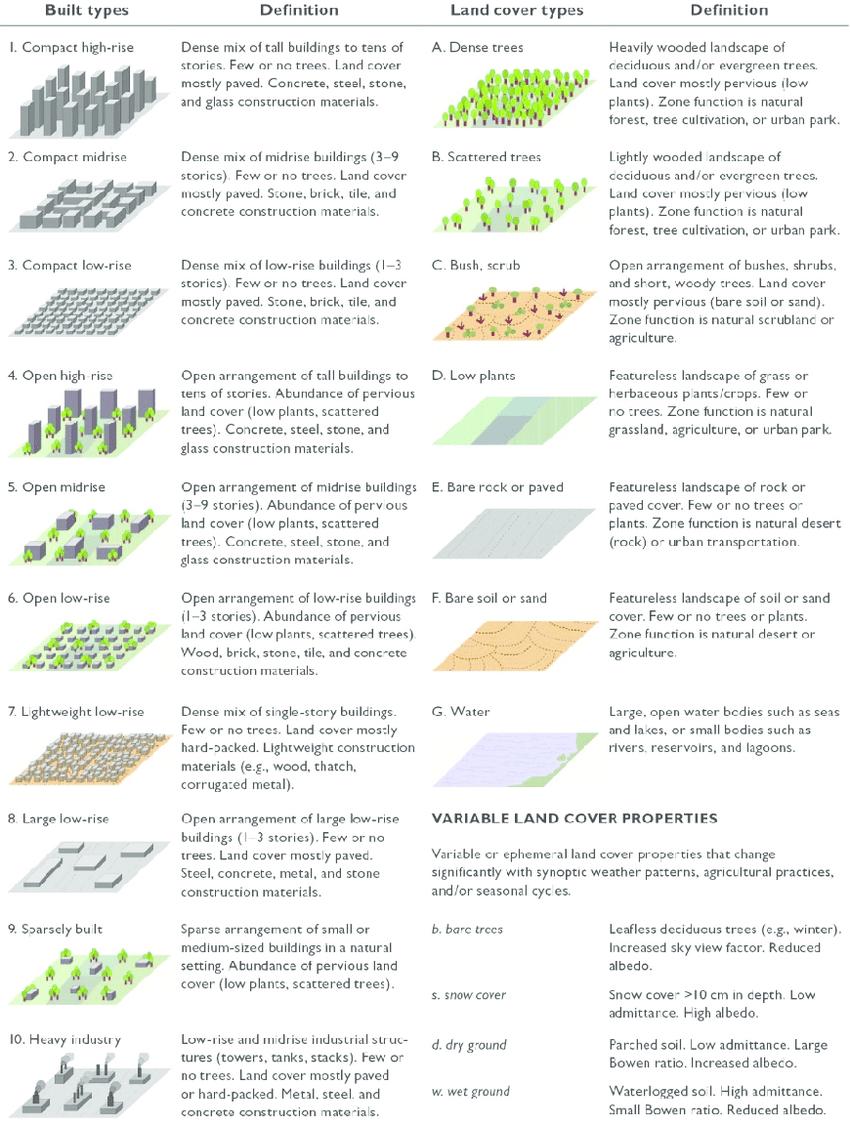
LCZ/ Legenda for Climatopes
Fig.25 (Reprinted from Bechtel, Alexander, Böhner, Ching, Conrad, Feddema, Mills, See & Stewart, 2015 fig1)
Academie van Bouwkunst Amsterdam 23 | 24 | Rachel Borovska
Appendix
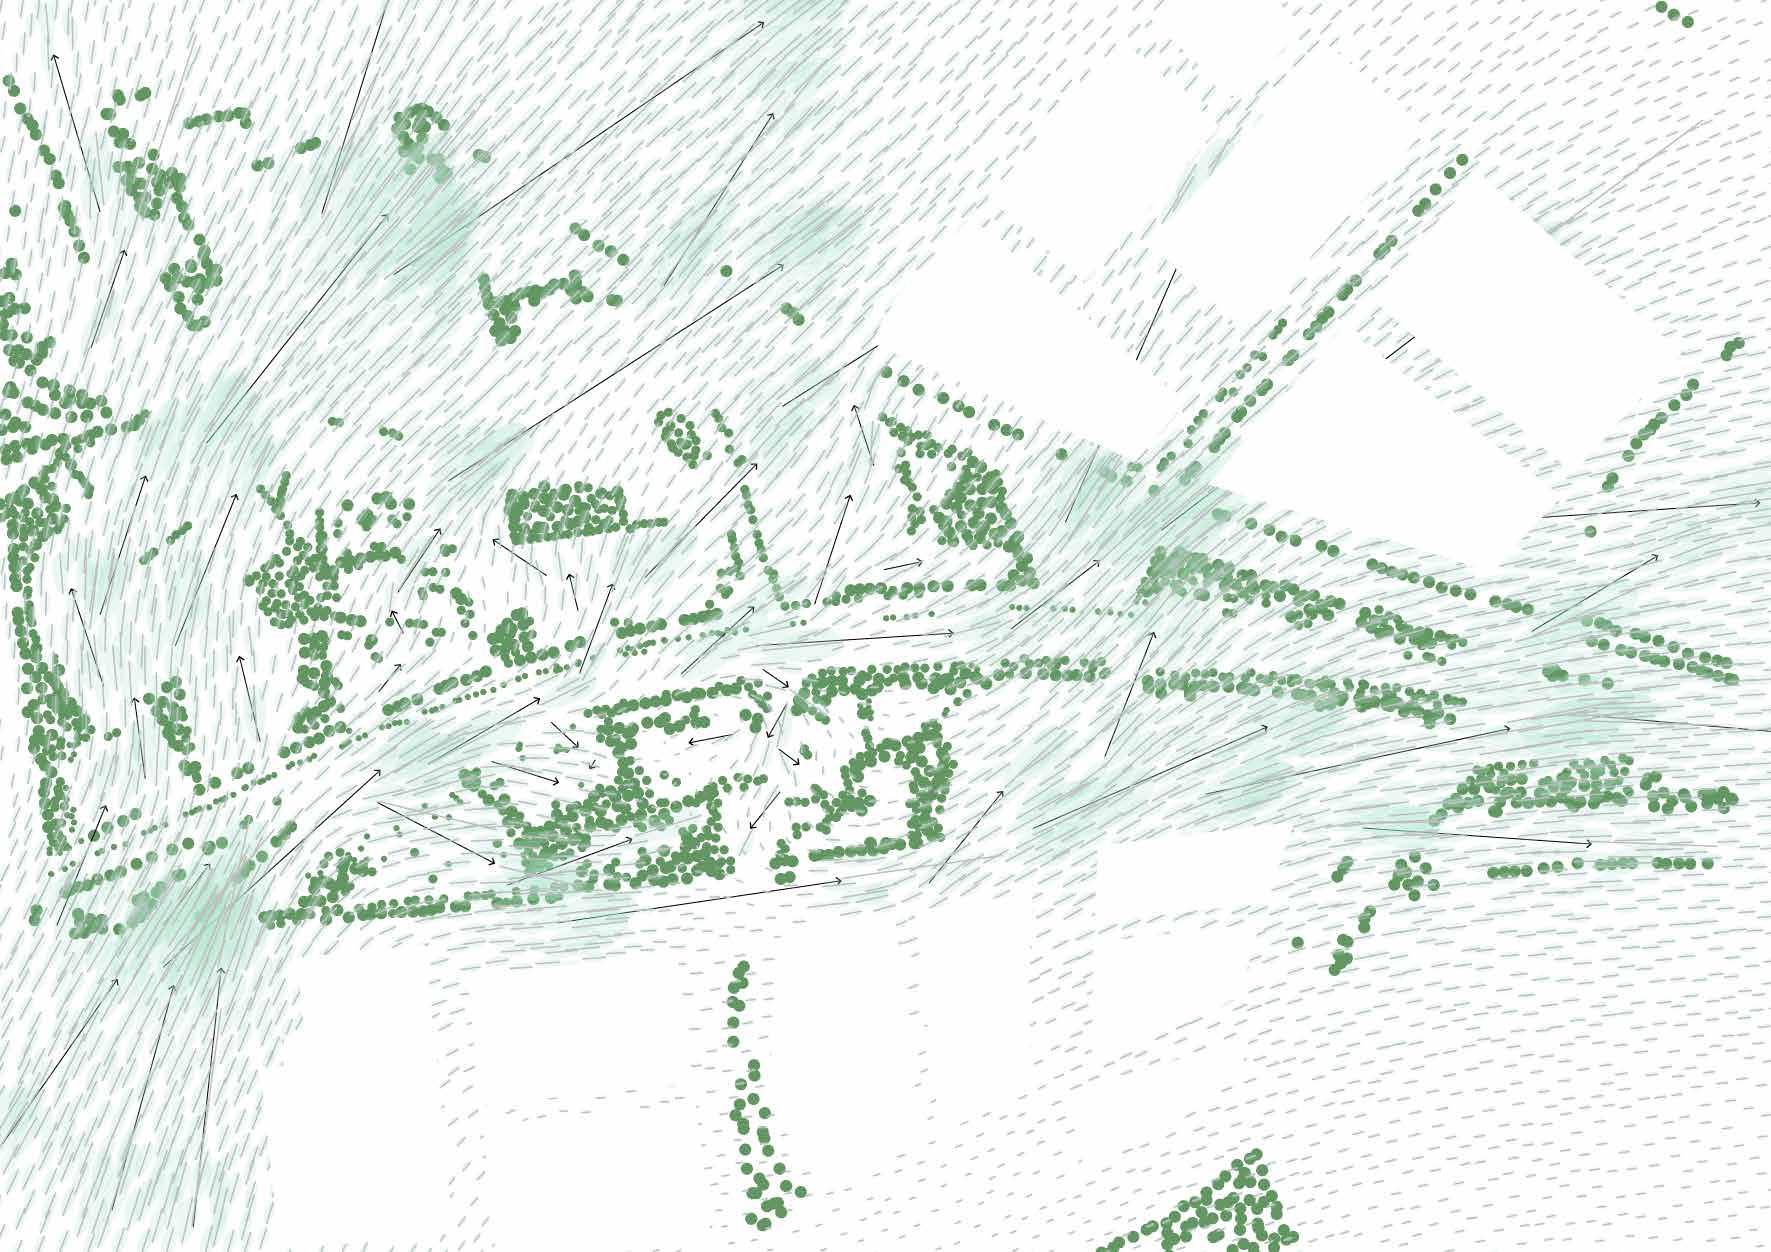
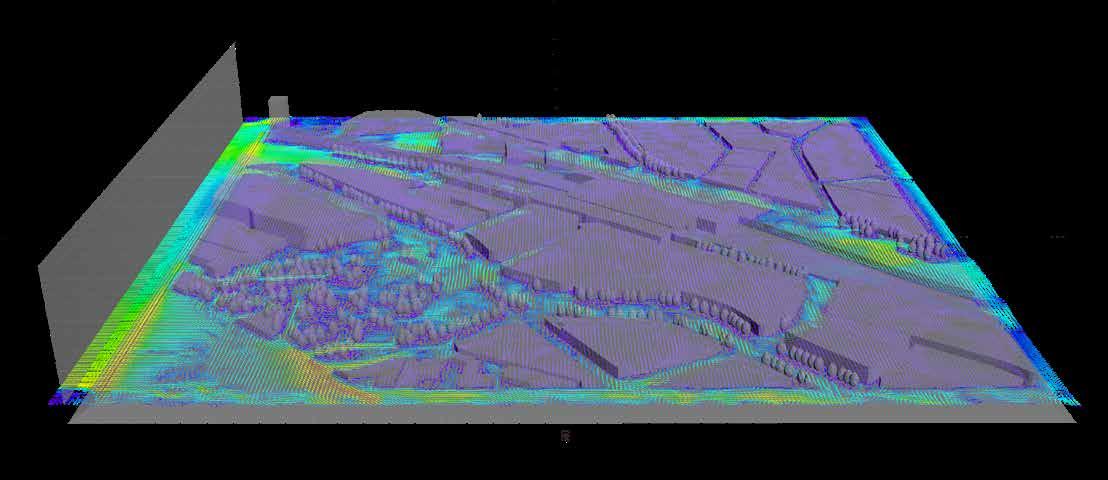
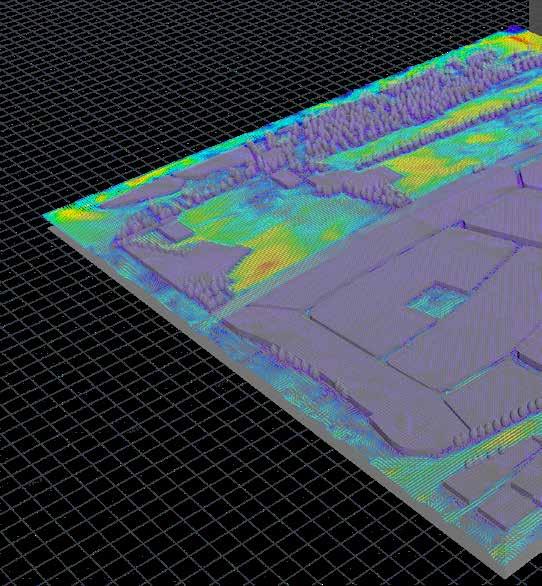
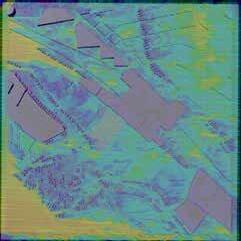
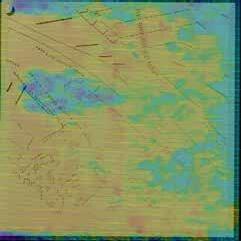
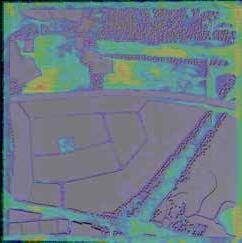
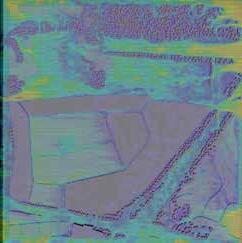
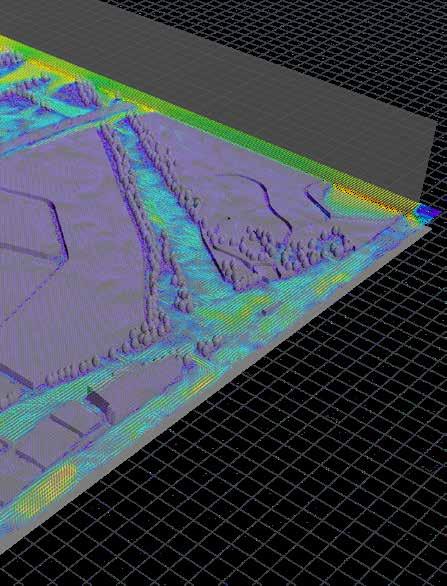
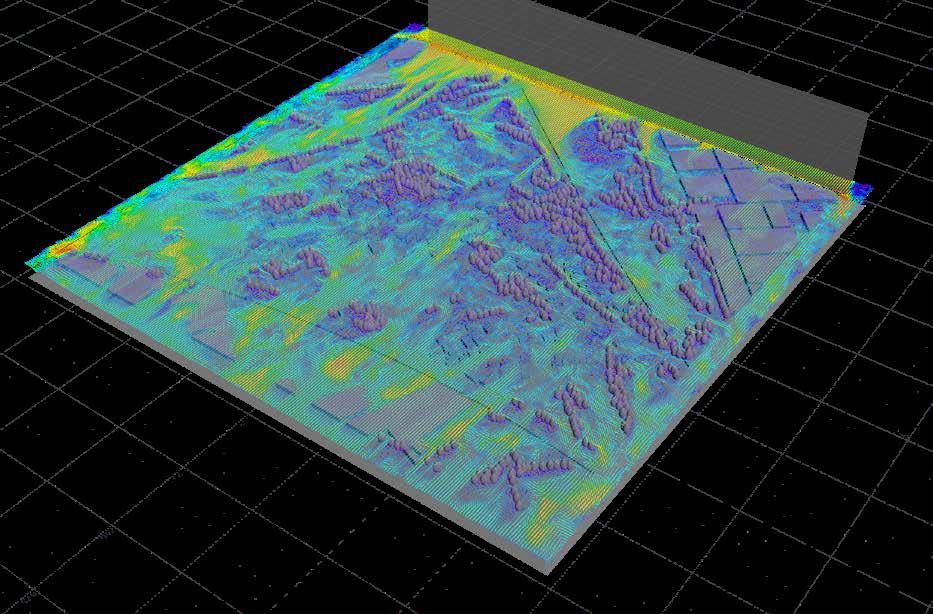
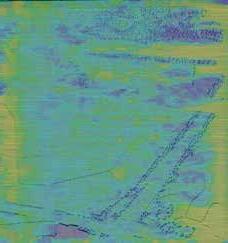
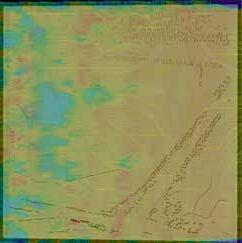
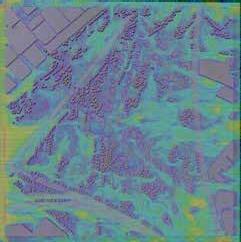
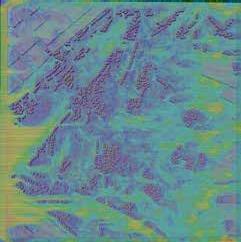
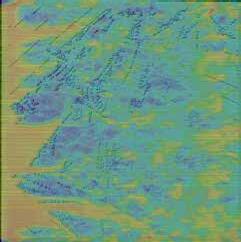
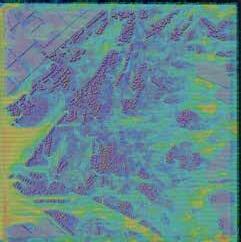
Research method 1: Simulation Houdini
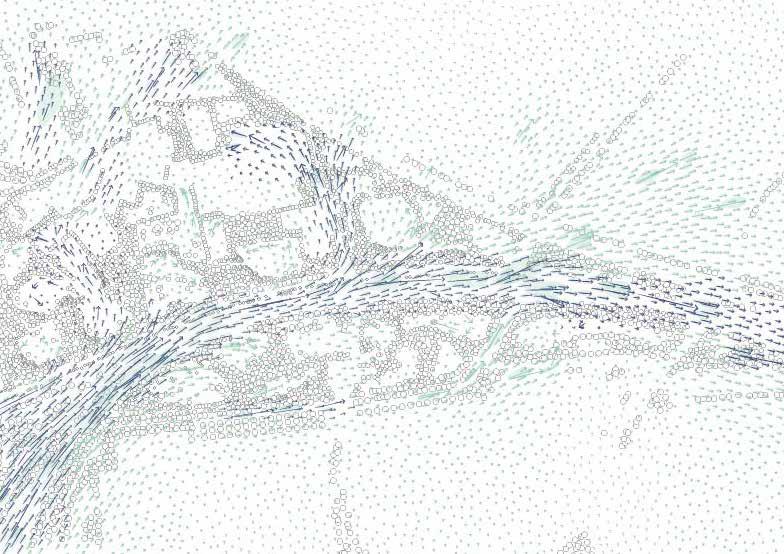
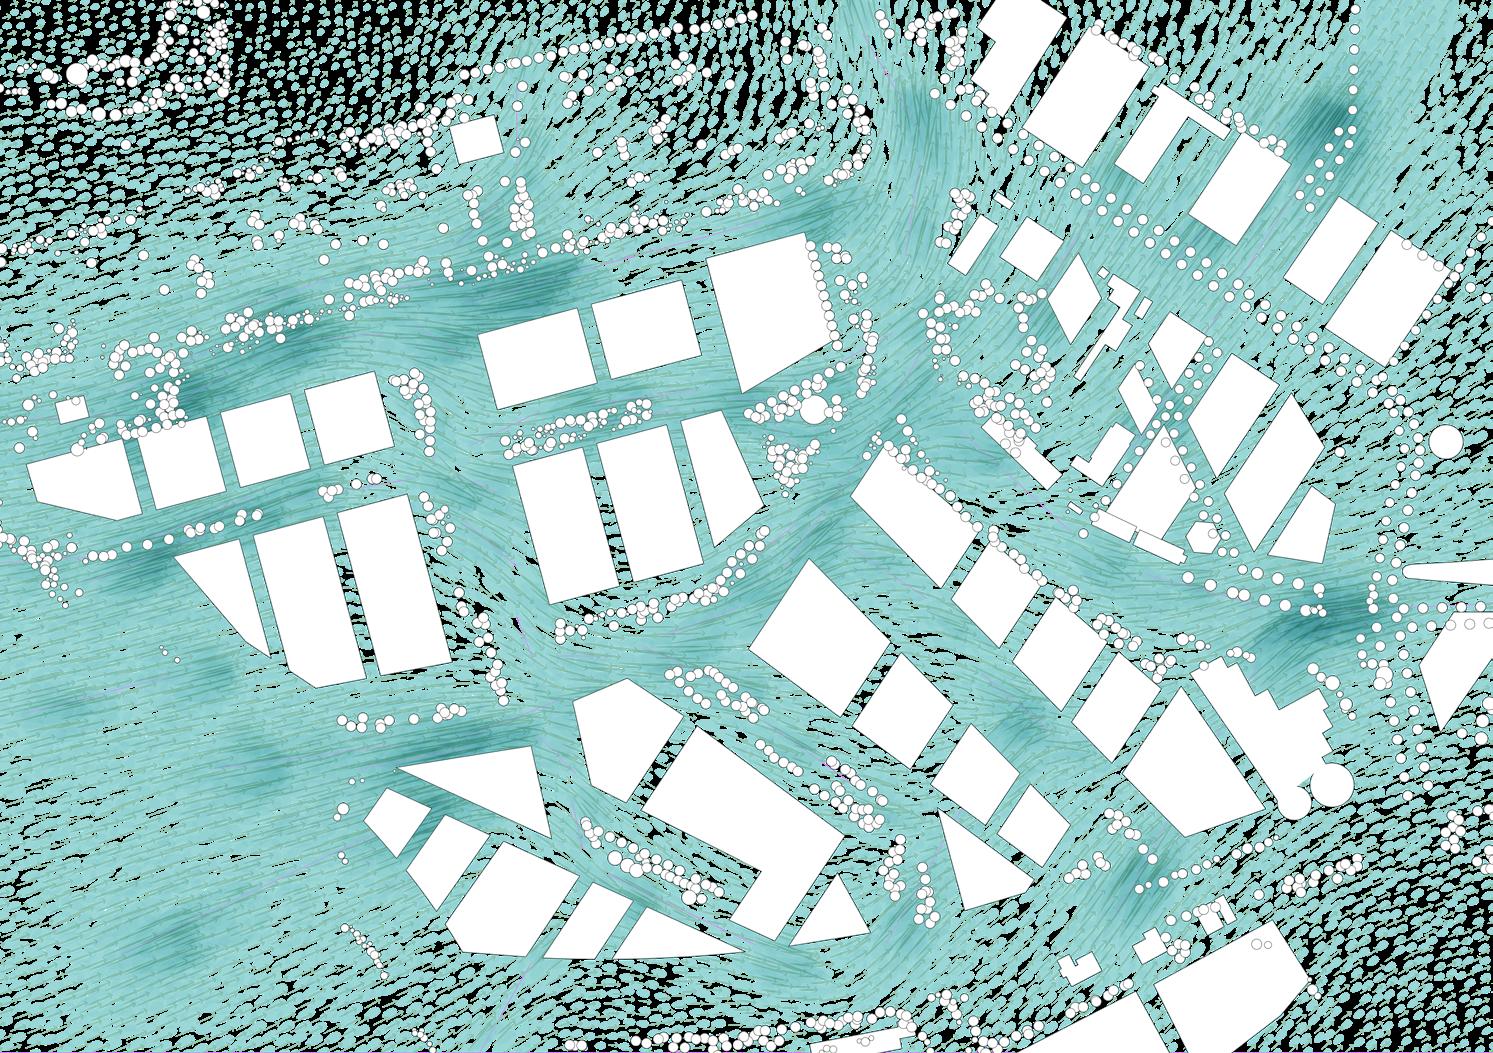
An important phase while researching wind patterns involved creating wind simulations. Although Houdini is not yet an established scientific program like Envi-Met, it has proven to be a useful tool for simulating and visualizing wind patterns at various heights. The heights specified include human height (1.75m), intermediate heights between obstacles (5-10m), and higher elevations (30m), which are crucial for measuring vortices and wind disturbances around high-rise buildings or tall tree canopies.
In the specific areas studied within Breda, there were no high-rise structures in the urban fabric. This allowed for focused analysis of wind behavior without the interference of tall buildings, providing clearer insights into how wind interacts with tree canopies. Using Houdini, it was possible to simulate and observe how wind moves through these spaces, aiding in the development of strategies to optimize urban ventilation and reduce potential wind-related issues.
Wind simulation (Houdini)
Station square
legenda
obstacle/mass
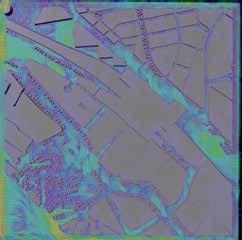
Wind simulation (Houdini) Area in east railway stream
legenda
obstacle/mass
By simulating wind patterns at human height, it’s possible to observe how wind affects pedestrians and ground-level activities. Simulations at 5-10 meters high provide insights into wind behavior between buildings and other mid-height structures, which is crucial for urban planning and ensuring comfortable living conditions.
Observation
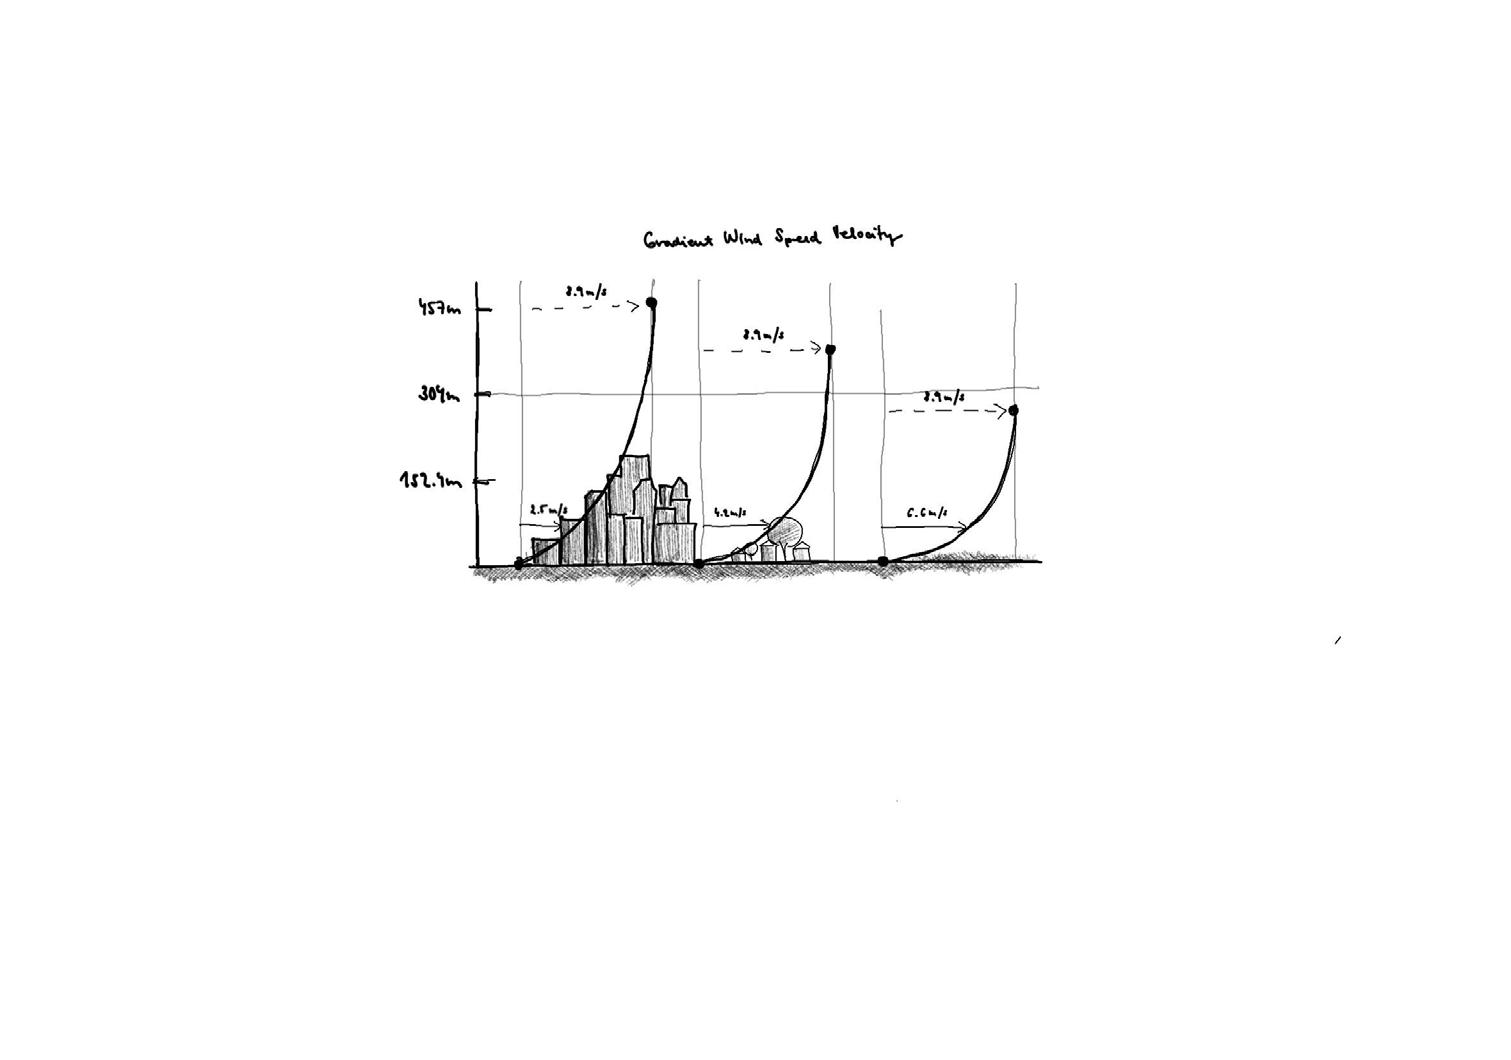
In general, wind speeds are slowed down by obstacles. Depending on the height of the obstacle, it usually takes about 2 times the height of the obstacle for the winds to pick up speed again. As a result, areas just behind an obstacle are usually the least windy and most protected spots.
Both trees and buildings work similarly. For more precise modeling it would be important to specify the porosity of various trees!
Wind simulation (Houdini)
West railway stream
legenda
obstacle/mass
strong wind velocity
medium wind velocity
low wind velocity
Academie van Bouwkunst
Rachel Borovska
Appendix
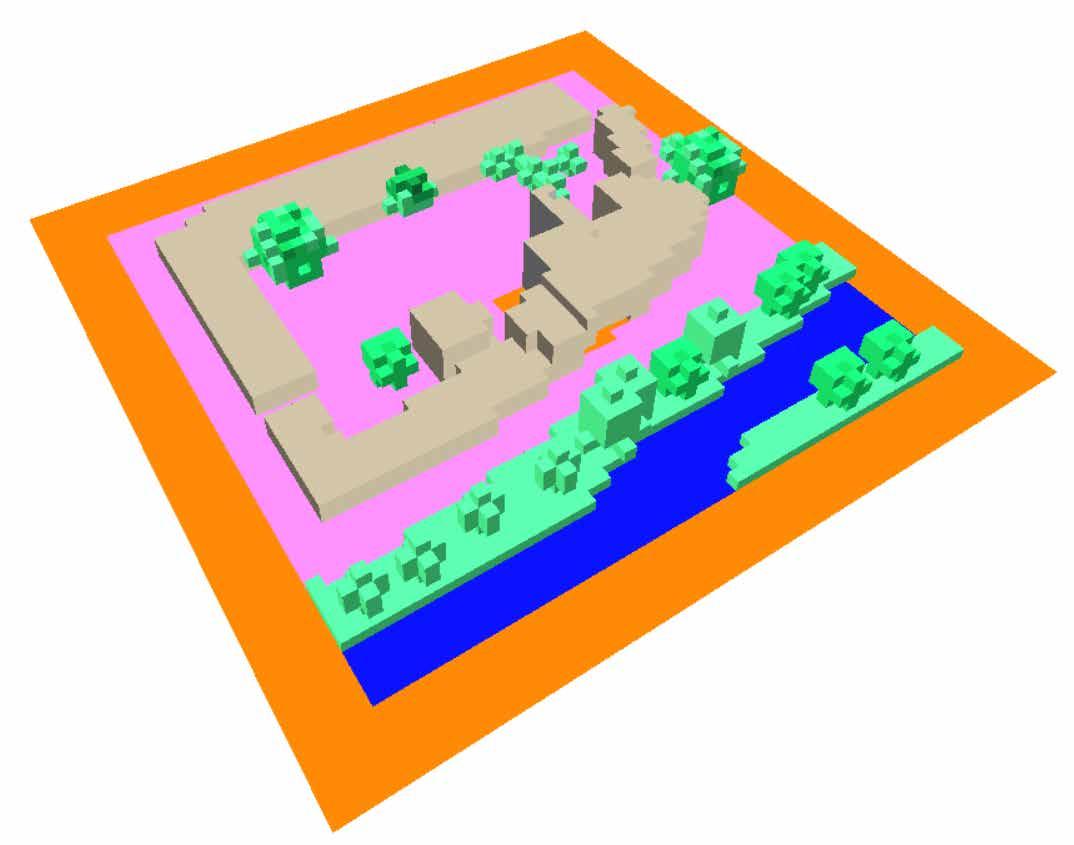
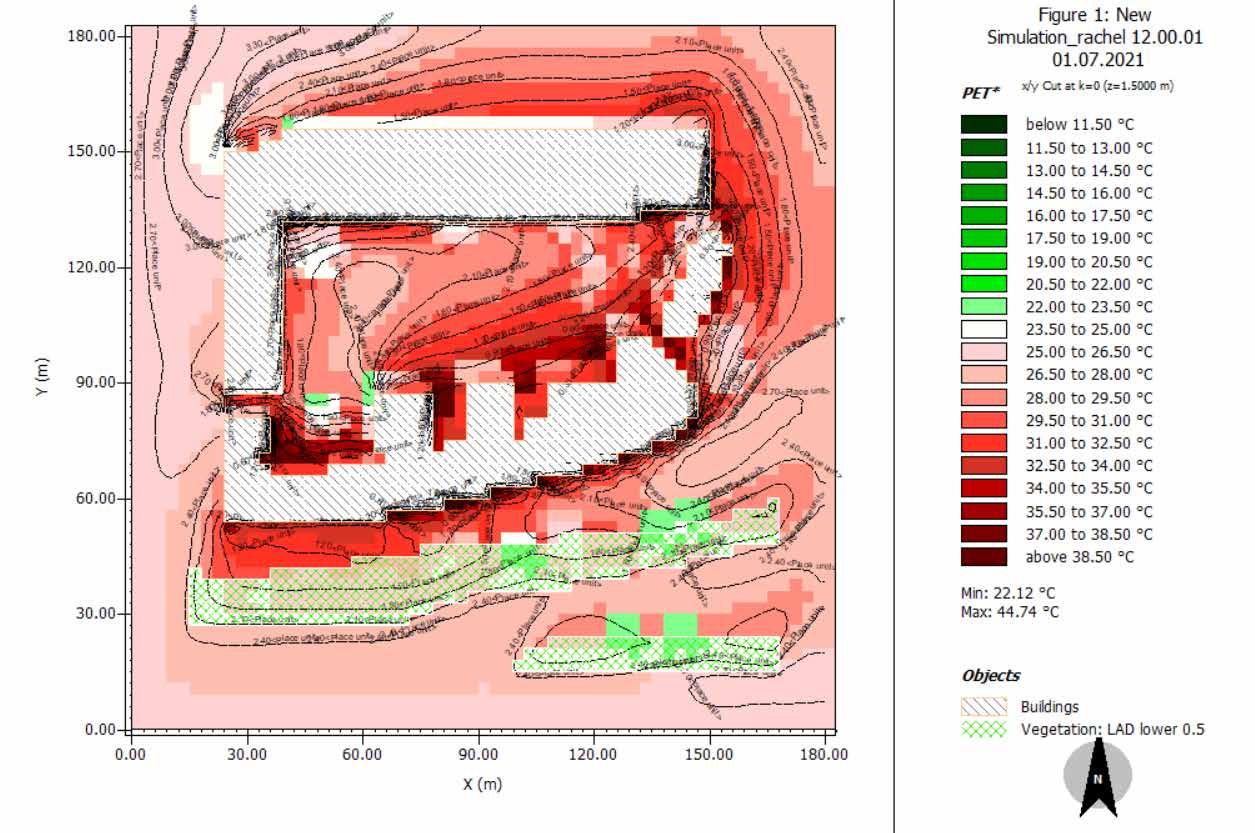
Research method 2: Simulation Envi-Met | Location 1
During the trajectory of the project, I utilized ENVI-met, a microclimate modeling software, to simulate and analyze the environmental impacts on a test site in Breda. This tool proved to be invaluable in helping me understand the intricate interactions between various elements of urban environments and their influence on local climates.
Through ENVI-Met it was possible to simultaneously consider factors such as buildings, vegetation, surface materials, and atmospheric conditions, providing insights into how these elements affect local temperature, humidity, wind patterns, and pollutant dispersion. It proved to be a uuseful tool to understand complex interactions between various urban elements and their impacts on local climate conditions.
3D model for simulation with applied materials such as soil, tree species, water surfaces, and building materials
Test location
Housing Block Vegetation
Disclaimer: The materialization might, in some places, differ from the actual conditions of the test location. The purpose of this model was to experiment with different material palettes and observe their thermodynamic performance.
Water surface Paving (Brick)
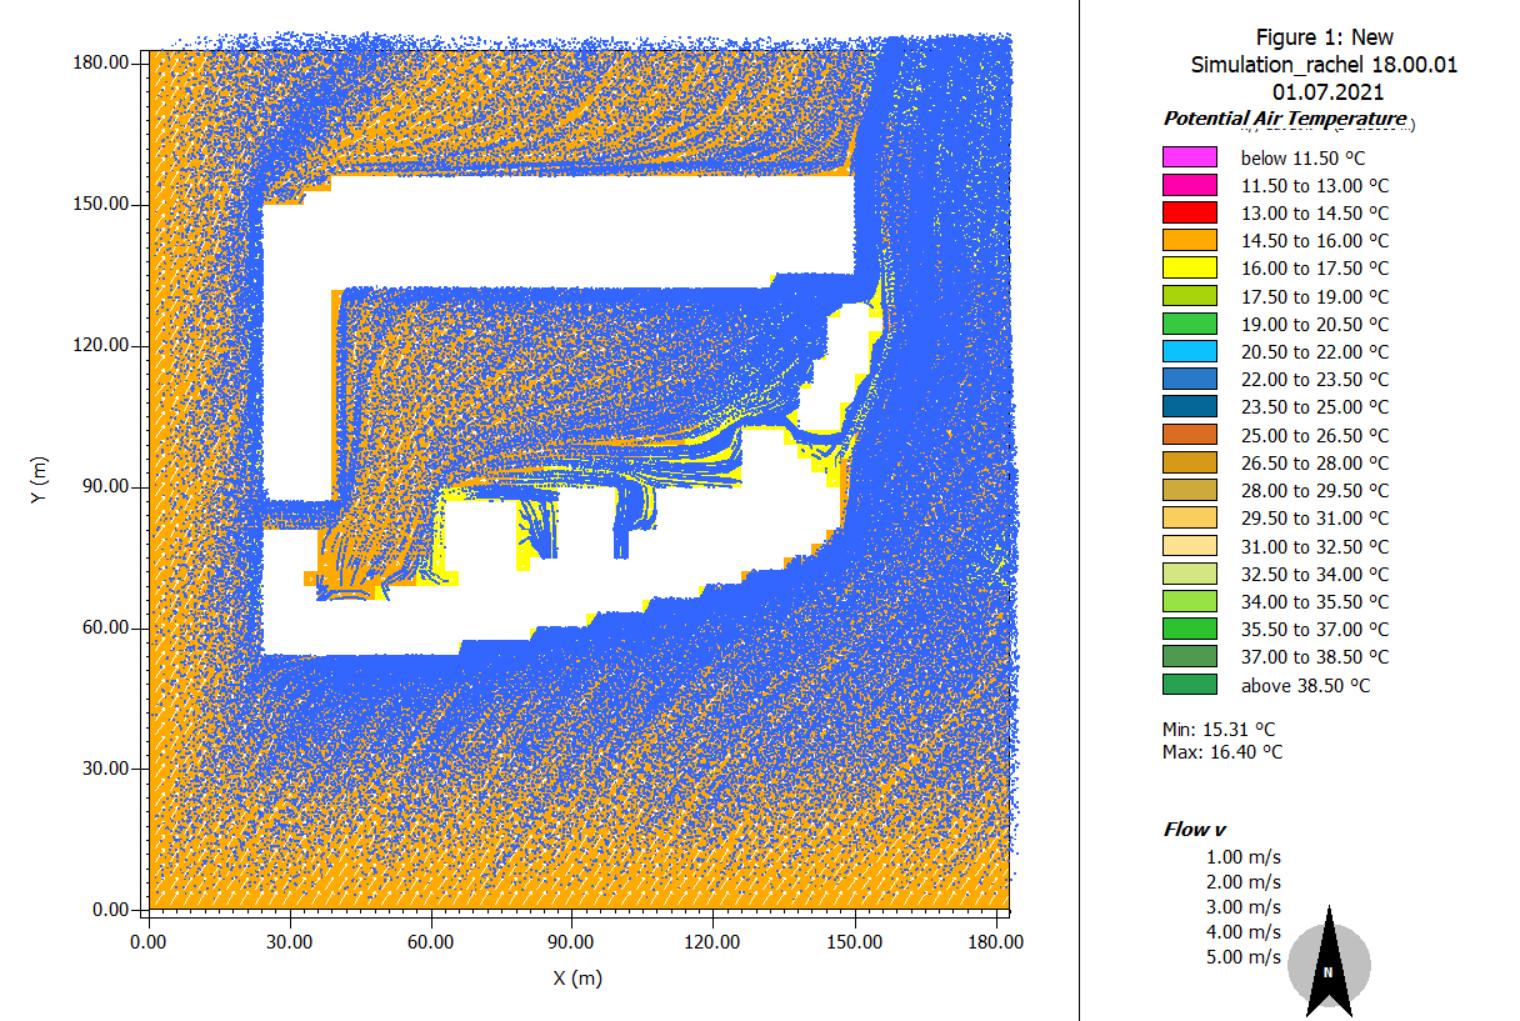
Potential air temperature
The PET, or Physiological Equivalent Temperature, is a thermal index used to indicate the temperature that a person would perceive in an indoor environment with no wind and a specific humidity level, assuming their heat balance were the same as in the actual outdoor environment. It is measured in degrees Celsius (°C) and provides an equivalent temperature that reflects human thermal sensation.20
Observation
The simulated scenario unfolds at noon, revealing that warmth tends to cluster around the building plinth and its surrounding paved areas. Along the waterfront, the presence of vegetation diminishes the temperature by nearly 9 degrees Celsius. Moreover, the solitary tree in the courtyard plays a remarkable role in alleviating heat, both at the facade and below it.
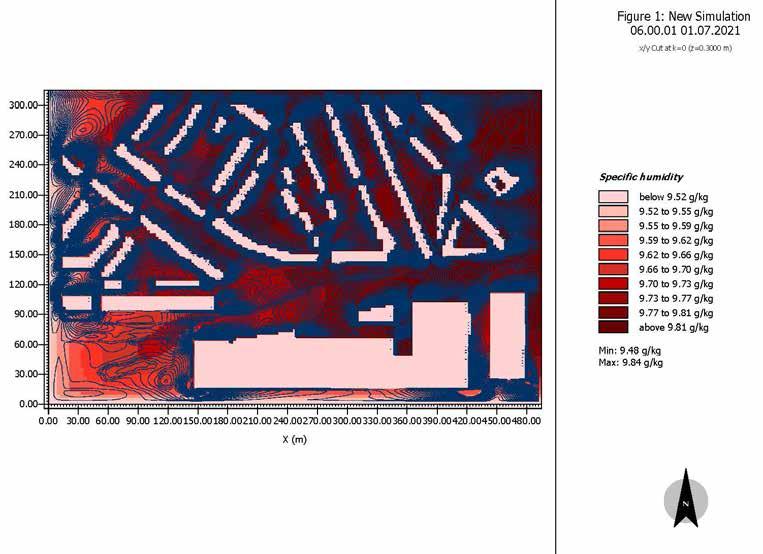
Research method 2: Simulation Envi-Met | Location 2
The second model was tested in a larger area of crops compared to the previous model. A crop measuring approximately 300x400m was used to study the variations in a larger urban setup, which included multiple housing blocks rather than focusing on just one block. This simulation mainly focused on windspeeds and humidity.
3D model for simulation with applied materials such as soil, tree species, water surfaces, and building materials
Disclaimer: The materialization might, in some places, differ from the actual conditions of the test location. The purpose of this model was to experiment with different material palettes and observe their thermodynamic performance.
Open soil Vegetation, Tree lanes Paving surface, Asphalt
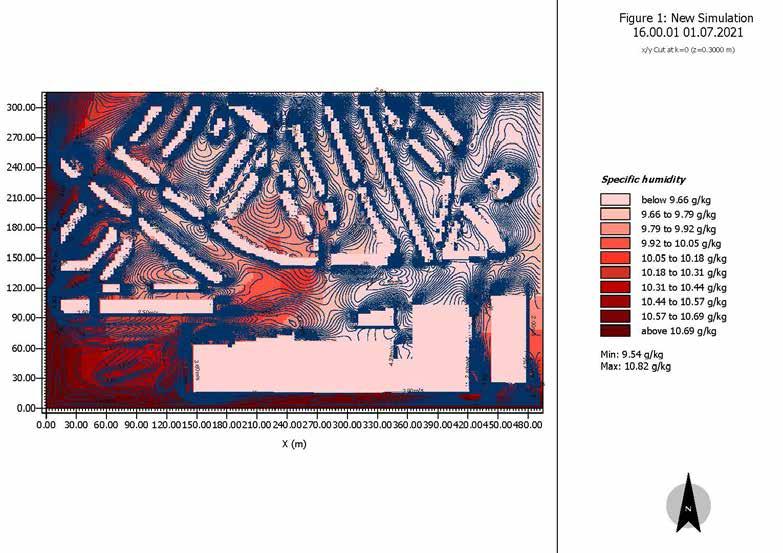
A humidity model is compared in two time slots: 6:00 am in the morning and 4:00 pm in the afternoon. It can be observed that the humidity is highest in the streets with three lanes in the morning.
The morning hours may experience lower wind speeds, leading to less dispersion of moisture and thus higher humidity levels. Temperatures
Humidity 06:00 morning
The second model was tested in a larger area of crops compared to the previous model. A crop measuring approximately 300x400m was used to study the variations in a larger urban setup, which included multiple housing blocks rather than focusing on just one block. This simulation mainly focused on windspeeds and humidity.
12.00
in general fluctuate between day and night, with the morning being cooler and causing moisture to condense, resulting in higher humidity levels. As a result, at 16:00, the air becomes very dry, except for the humid, vegetated areas in the shadow of buildings or open soil.
Humidity 16:00 afterrnoon
Academie van Bouwkunst
Research method 3: Educated guess Wind patterns per neighbourhood morphology & Climatope
City centre climatope
Appendix
Research method 3: Educated guess Wind patterns per neighbourhood morphology & Climatope
City centre - Breda centrum
Educated guesses were necessary steps during the analysis of the project since in many cases, complete climate datasets were not available for all areas. These allowed for the quick identification of po tential problem areas and the proposal of initial interventions, signifi cantly accelerating the decision-making process.
More importantly, these initial assumptions served as a foundation for testing hypotheses and recognizing patterns. Climate studies often build on established trends, such as the well-documented heat retention of paved surfaces and the cooling effects of tree canopies. By applying these known principles, educated guesses enabled faster insights without the need for extensive case-by-case studies, making the process both efficient and effective.
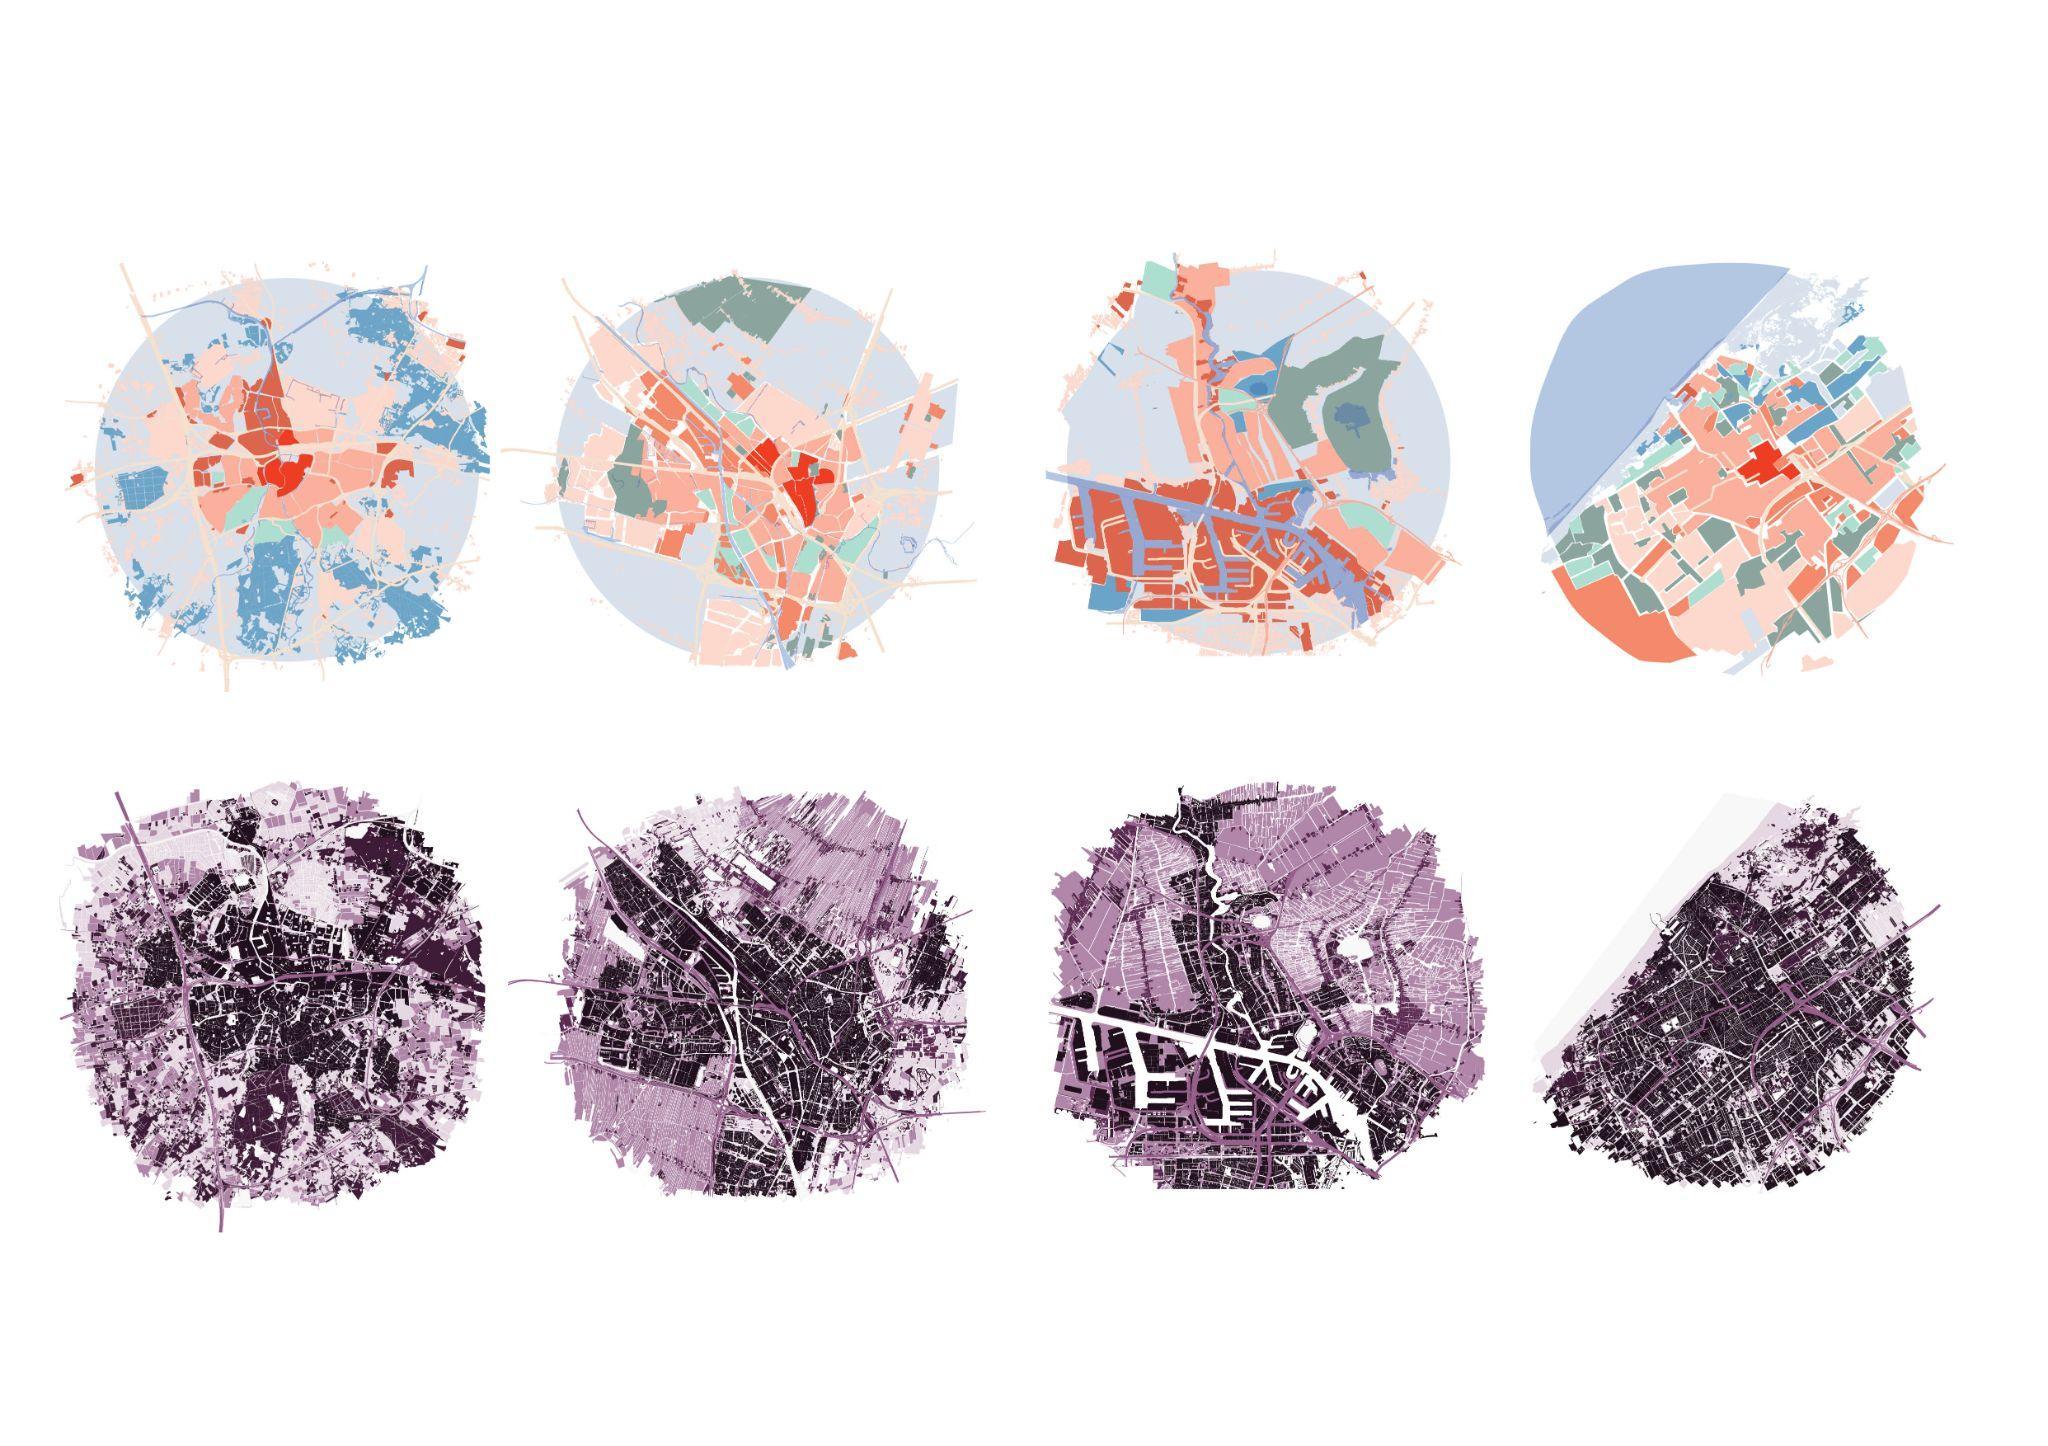
Research method 4: Comparative Analysis | Climatope
A comparative analysis guided the graduation project. The compar ison highlights the different challenges that each city faces based on their structure, urban design, layout, and location within the land scape. This means that each city needs a tailored approach and spe cific actions to address urban heat islands.
A comparative analysis of climatope maps was beneficial for several reasons:
1. Understanding Microclimatic Variations – By comparing different city districts or different cities, we can identify how variations in urban form, vegetation, and land use influence microclimates. This helps pinpoint which factors contribute most to overheating or cooling.
2.Informed Urban Planning – A comparative approach allows urban planners to see which strategies have been effective in different con texts. For instance, if one area successfully mitigates heat through
increased vegetation or specific building materials, those lessons
3.Tailored Climate Adaptation Strategies – Since each city has unique climatic challenges, comparing multiple climatope maps can reveal what solutions work best for different urban typologies. Cities with similar challenges can adapt tested strategies, while cities with con
4.Prioritizing Action – By comparing climatope classifications across different zones, cities can identify which areas are at the highest risk of urban heat stress and prioritize cooling interventions accordingly.
Breda
Landscape / Biotopes
Liesbos
Haagse Beemden
Research method 4: Comparative Analysis | Roughness
A roughness map is a type of map that shows the degree of rough ness or variation in land cover or terrain within a particular area. The map typically uses different colors or shades to represent areas of high and low roughness.
Different cities have different morphologies—some may have compact, high-density layouts, while others have more open, dispersed structures. Analyzing how roughness varies between these urban typologies can reveal insights into how built environments influence wind speeds and air circulation. Comparative analysis can help detect patterns in how roughness levels affect wind behavior. For instance,
cities with large parks or water bodies may show similar wind-cooling effects, while highly built-up areas may struggle with stagnation and heat island effects.
Climate & Geographic Context Matters
A city in a coastal region will have different roughness characteristics compared to an inland city with mountainous terrain. By comparing cities with similar climatic and topographic conditions, more relevant insights can be drawn about roughness effects and wind behavior.
Cities with well-documented roughness studies can serve as references for developing guidelines on zoning, building heights, and vegetation placement to optimize urban ventilation.
A mosaic of roughness
Dense city grid
Edges of gliding surface
Academie van Bouwkunst Amsterdam
24
Rachel Borovska
Appendix
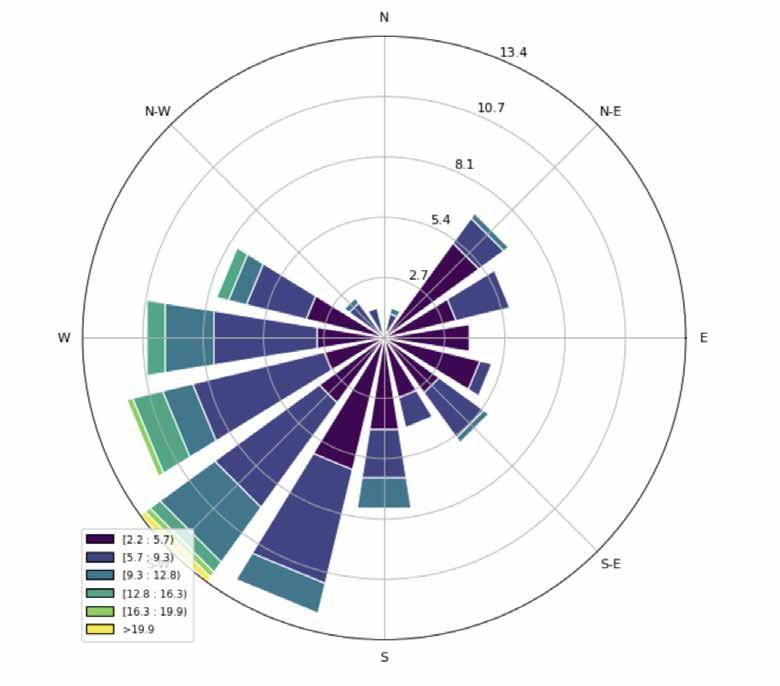
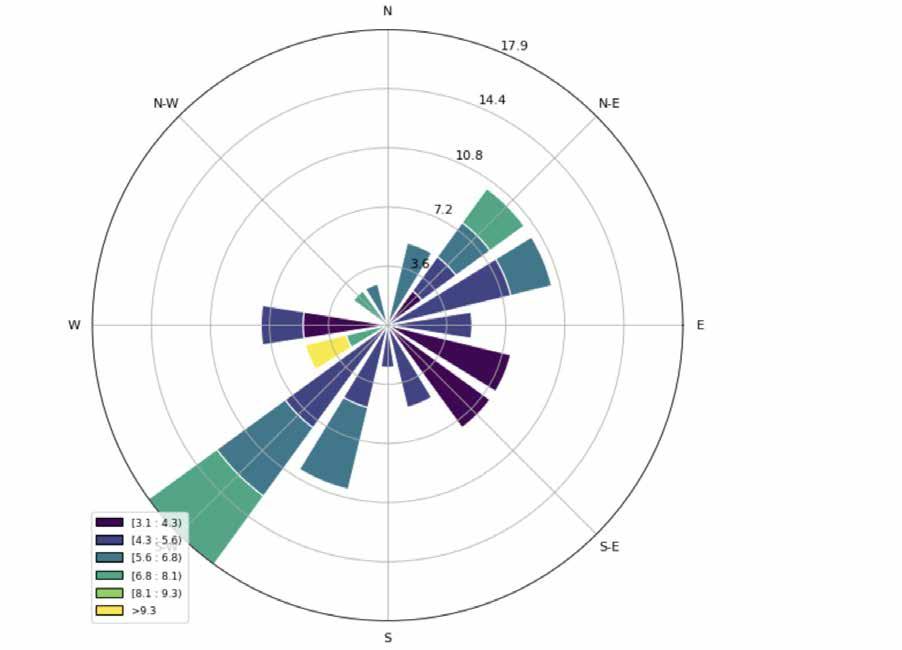
Research method 4: Comparative Analysis | Average yearly wind speed
Wind corridors are shaped by several factors that vary from city to city:
1. Urban Morphology: Compact, high-rise cities tend to create wind tunnels, while low-density cities may have more dispersed air movement.
2.Topography: Coastal cities may benefit from sea breezes, while mountainous or valley cities experience channeling effects.
3.Vegetation & Green Spaces: Parks and tree-lined streets can either facilitate or block airflow, depending on placement and density.
4.Infrastructure & Street Grids: Wide streets and open plazas can act as natural wind pathways, while irregular or enclosed street patterns may hinder airflow.
Possible wind streams
One of the key benefits of a comparative analysis of wind corridors across cities is that interventions vary based on urban form, climate, and existing conditions. This means that strategies can be tailored to each city’s specific needs, rather than applying a one-size-fits-all approach.
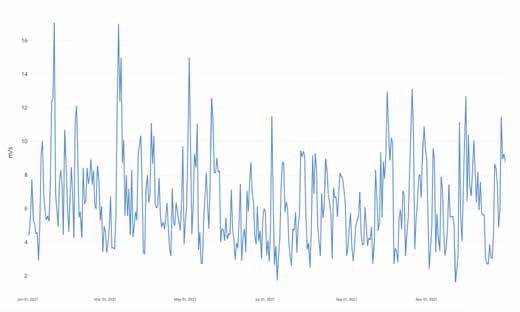
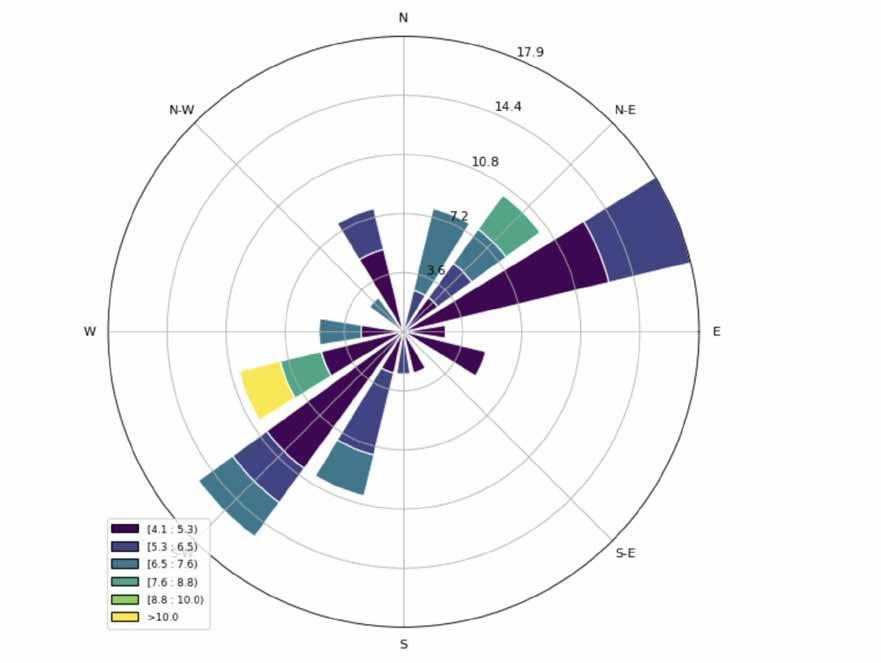
Measured wind speed at 10 m height
Average 6.9 m/s
• Cities can learn from each other, but solutions must be adapted to the local urban and climatic context.
• Interventions are not just about increasing airflow—they also consider comfort, livability, and seasonal effects.
• Historical and ongoing development patterns influence interventions—for instance, Breda has more freedom to shape wind corridors before densification, while Utrecht must work within an already compact core.
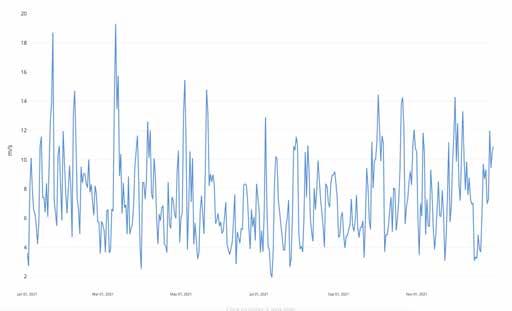
Measured wind speed at 10 m height
Average 7.59 m/s
The wind speed is higher in the winter months as compared to other seasons. Spikes in December, January, and February, which resemble instances of extreme wind speeds.
Academie van Bouwkunst Amsterdam 23 | 24 | Rachel Borovska
Appendix
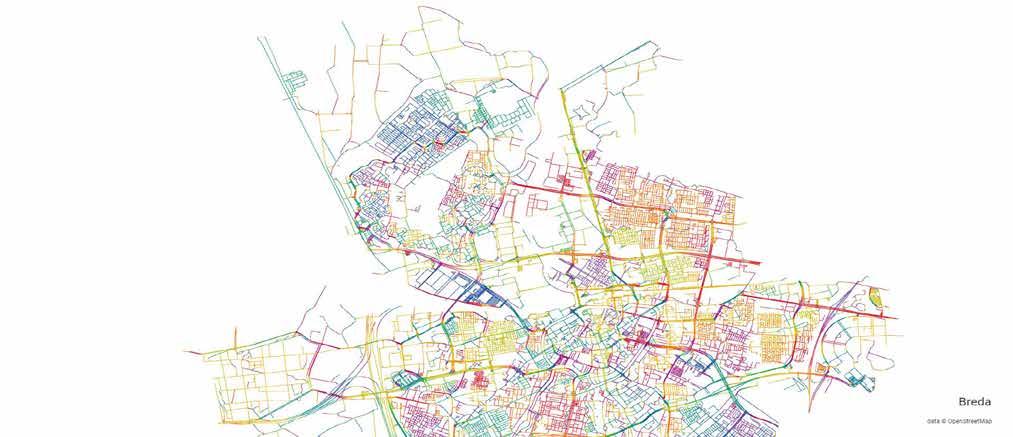
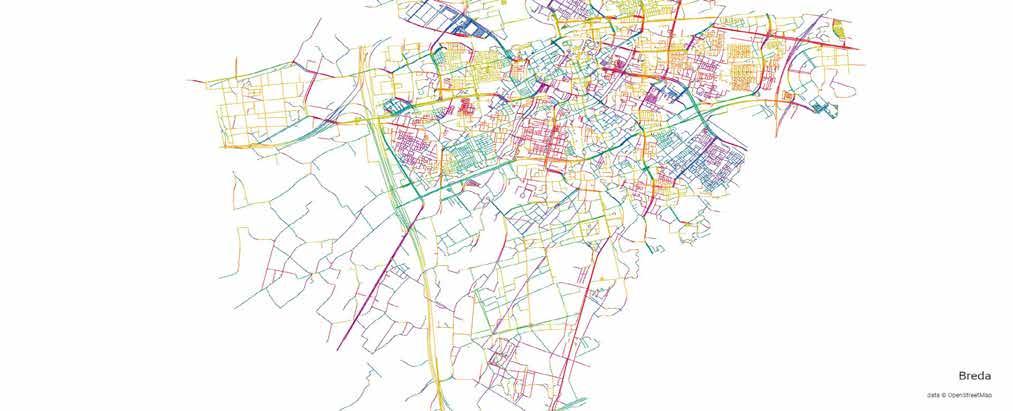
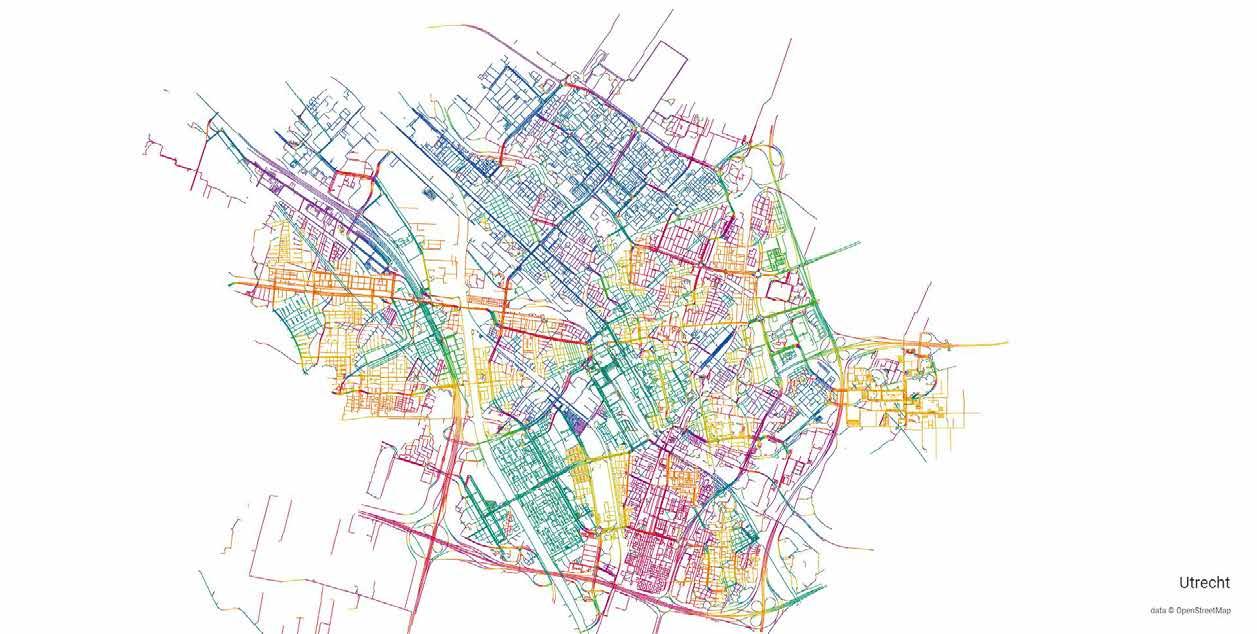
Research method 4: Comparative Analysis | Street orientation
Street orientation
The radial case
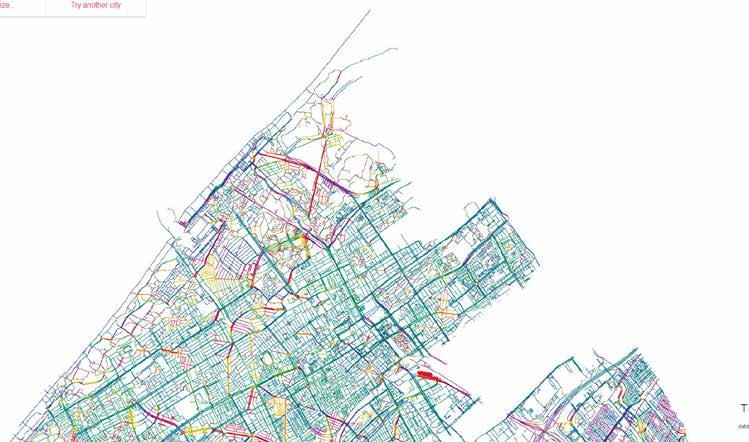
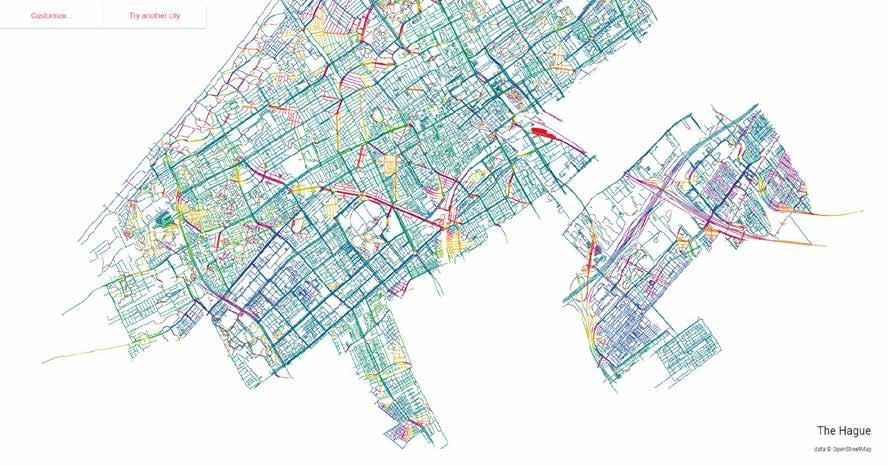
This study examines the entropy (or disordered-ness) of street bearings within the city’s street network, alongside typical street segment lengths, average circuity, node degree, and the proportion of four-way intersections and dead-ends. 21
If a city’s street grid is aligned with prevailing wind directions, it can naturally improve ventilation. A comparative analysis can show how different cities adjust their grid orientation and block lengths to support wind flow. A city may need different strategies for hot summers (cooling breezes) versus cold winters (sheltering from strong winds). If wind direction and street orientation align closely, airflow is likely to be more unobstructed, leading to better urban ventilation. 22
A mismatch between wind direction and street orientation (e.g., perpendicular streets to wind flow) can create turbulence and reduce ventilation efficiency.
Breda shows a disordedness of streets, a radial set up and street orientation, which could mean either enhanced or blocked airflow depending on built structures.
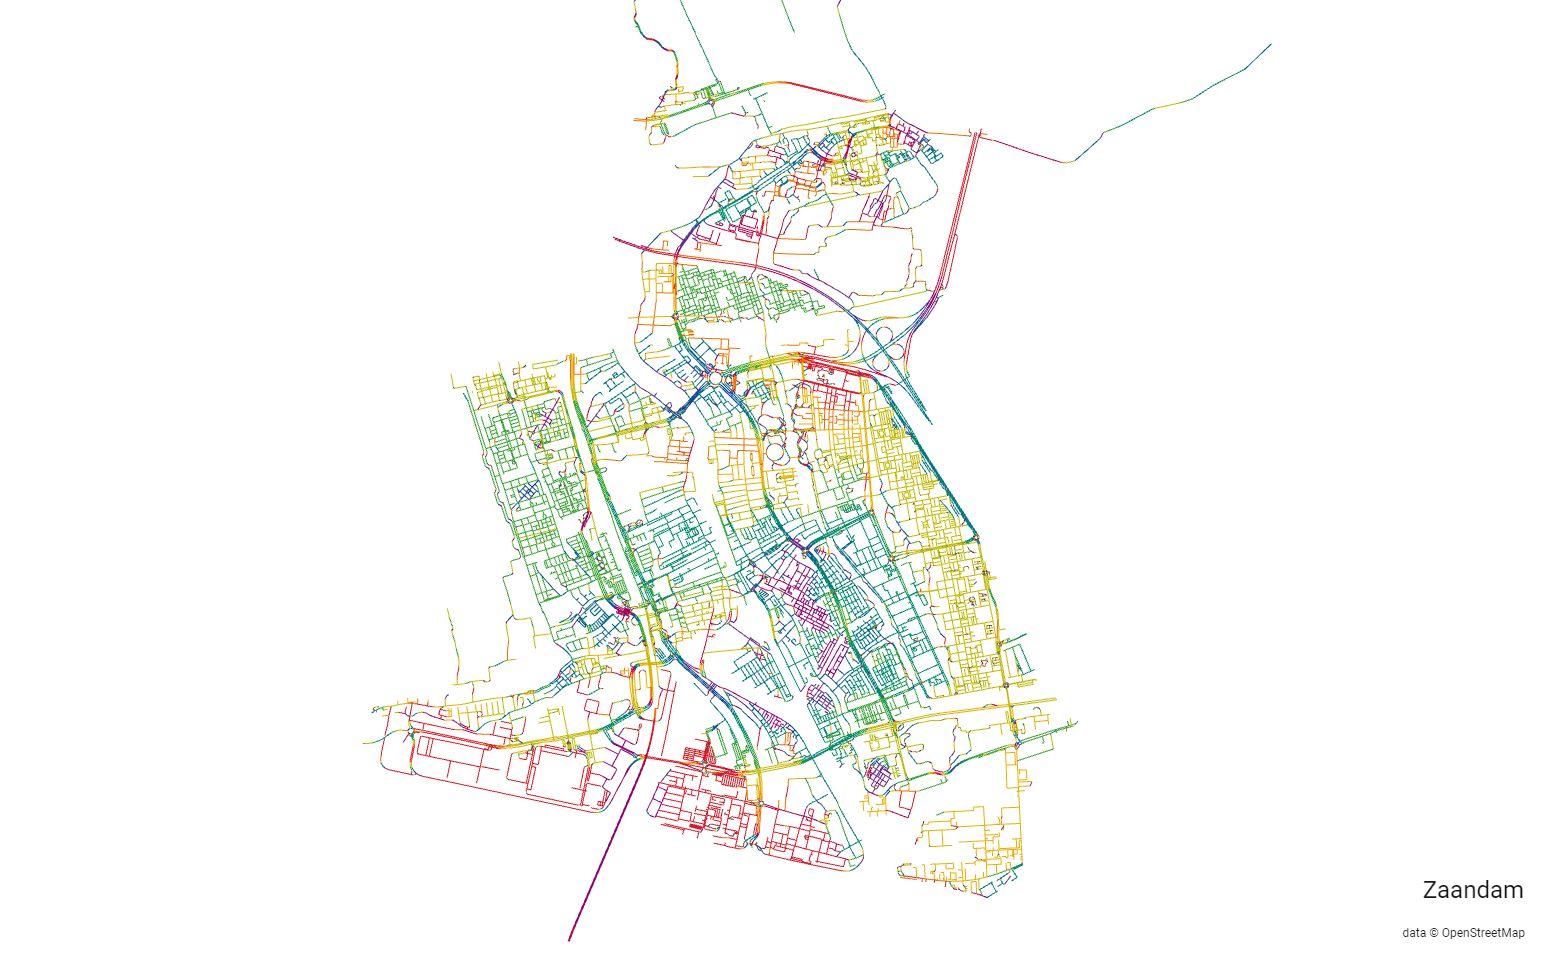
Zaandam’s orientation is relatively close to its wind direction, suggesting that some streets and waterways may naturally channel wind efficiently.
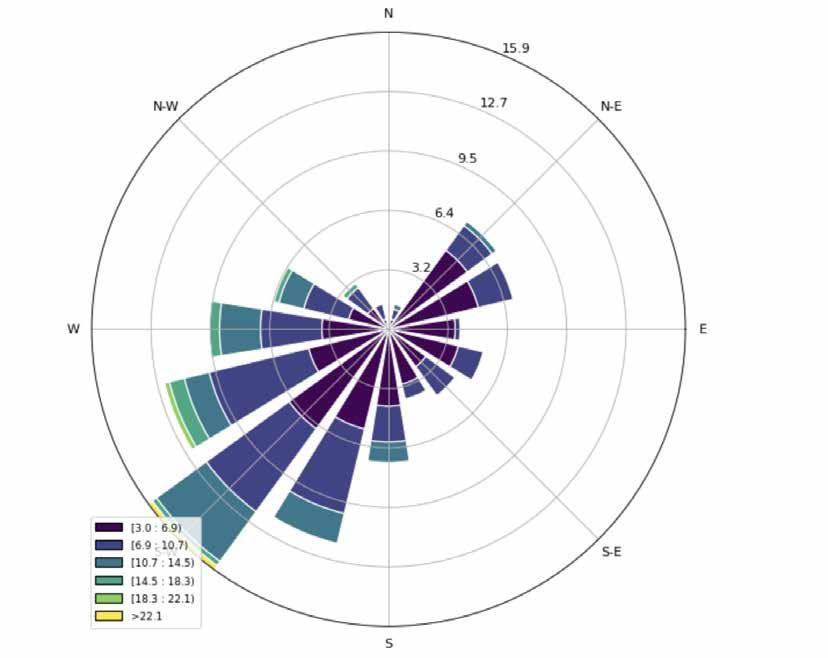
In order to be able to work with the wind directions, prevailing directions need to be determined. This has been achieved through a python coding from the data of NASA on the specific locations.
Two general studies have been made - an average yearly direction and a summer season during the span of the months of July and August 2022.
Prevailing wind during July-August 2022
In all study cases the prevailing SW wind direction is visible. The city with the average slowest wind is Breda, while Den Haag and Zaandam are leading in th ehighest averag wind speed.
Average 5.7-9.3 m/s
Prevailing annual wind direction above 10m, Utrecht, year 2022
Academie van Bouwkunst Amsterdam 23 | 24 | Rachel Borovska
“ArcGIS Web Application.” n.d. Gu-Geo.maps.arcgis.com. Accessed February 26, 2024. https://gu-geo.maps.arcgis.com/apps/webappviewer/index.html?id=fc5af2aed5244703857e4e602b478178.
“Beleid Voor Omgaan Met Klimaatverandering | Gemeente Utrecht - Omgevingsvisie.” n.d. Omgevingsvisie.utrecht.nl. Accessed February 26, 2024. https:// omgevingsvisie.utrecht.nl/thematisch-beleid/beleid-voor-omgaan-met-klimaatverandering/. Benedito, Silvia. 2019. Atmosphere Anatomies. On Design, Weather, and Sensation. Ennetbaden: Lars Müller Verlag.
Bechtel, Benjamin, Paul J. Alexander, Jürgen Böhner, Jason Ching, Olaf Conrad, Johannes Feddema, Gerald Mills, Linda See, and Iain Stewart. 2015. “Mapping Local Climate Zones for a Worldwide Database of the Form and Function of Cities” ISPRS International Journal of Geo-Information 4, no. 1: 199-219. https:// doi.org/10.3390/ijgi4010199
Brabant, Municipality of Breda and Province of North. 2022. “Breda’s New Sweet Promise.” ArcGIS StoryMaps. October 20, 2022. https://storymaps.arcgis. com/collections/ecc2718e77854edea2dfc98d02c973d5?item=1.
“Biodiversity impact and ecosystem services,” Government of the Netherlands, published November 11, 2022. https://www.government.nl/topics/nature-and-biodiversity/documents/reports/2021/08/05/biodiversi- ty-impact-and-ecosystem-service-dependencies.
Boeing, Geoff, Exploring Urban Form Through Openstreetmap Data: A Visual Introduction (August 25, 2020). In: Urban Experience and Design: Contemporary Perspectives on Improving the Public Realm (pp. 167-184), edited by J. Hollander and A. Sussman. Abingdon, England: Routledge. ISBN 9780367435554., Available at SSRN: https://ssrn.com/abstract=3680845 or http://dx.doi.org/10.2139/ssrn.3680845
Bridle, James. Ways of Being: Beyond Human Intelligence. London: Penguin UK, 2022.
Carver, Steve. “(Re)creating wilderness: rewilding and habitat restoration,” in The Routledge Companion to Landscape Studies. New York: Routledge, 2012. https://oxford.universitypressscholarship.com/view/10.1093/ oso/9780198844037.001.0001/oso-9780198844037-chapter-5.
Challe,Tiffany. “The Rights of Nature – Can an Ecosystem Bear Legal Rights?”, published April 22, 2021. https://news.climate.columbia.edu/2021/04/22/ rights-of-nature-lawsuits/.
Chirag, Deb and Ramachandraiah, Alur. “The Significance of Physiological Equivalent Temperature (PET) in Outdoor Thermal Comfort Studies.” International Journal of Engineering Science and Technology 2, no. 7 (2010): 2825–2828. https://www.researchgate.net/publication/50315274_The_significance_of_ Physiological_Equivalent_Temperature_PET_in_outdoor_thermal_comfort_studies.
Coutts, Andrew, and Nigel Tapper. n.d. “Trees for a Cool City: Guidelines for Optimised Tree Placement.” https://watersensitivecities.org.au/wp-content/uploads/2017/11/Trees-for-a-cool-city_Guidelines-for-optimised-tree-placement.pdf.
Cortesao, J. et al (2018) Creating prototypes for cooling urban water bodies. WUR, HVA Europan Brief.
Fabiano. 2017. Green Wedge Urbanism. Bloomsbury Publishing.
Fang, Junjie, Shuangshuang Zhang, Liuming Zhang, and Xiaoping Zhang. 2021. “Responses of Wetland Plants to Climate Warming: A Meta-Analysis of Experimental Warming Studies.” Frontiers in Plant Science 12: Article 860188. https://doi.org/10.3389/fpls.2021.860188.
Fiona J. Thomson et al., “Seed Dispersal Distance Is More Strongly Correlated With Plant Height Than With Seed Mass,” Journal of Ecology 99, no. 6 (July 5, 2011): 1299–1307, https://doi.org/10.1111/j.1365-2745.2011.01867.x.
“FIS-Broker.” n.d. Fbinter.stadt-Berlin.de. Accessed February 26, 2024. https://fbinter.stadt-berlin.de/fb/index.jsp?loginkey=showMap&mapId=k_fb_berlinbtk@senstadt.
Fromonot Françoise, Martin Basdevant, Imbert Dorothée, Gilles A. Tiberghien, and Patrick Faigenbaum. 2020. Transforming Landscapes : Michel Desvigne Paysagiste. Basel: Birkhäuser.
Furtak,Anthony Rick.“Henry David Thoreau,” Stanford Encyclopedia of Philosophy. published June 30, 2005, https://plato.stanford.edu/entries/thoreau/#NatuHumaExis.
Gemeente Breda. 2023. Toekomstperspectief. July 27, 2023. https://www.breda.nl/sites/default/files/2023-12/20230727%20toekomstperspectief%20 vastgesteld%20spread.pdf.
“Geo-Online.” n.d. Geoportal-Hamburg.de. Accessed February 26, 2024. https://geoportal-hamburg.de/geo-online/?Map/layerIds=12883.
Dagenais, Travis. 2021. “Silvia Benedito’s New Book Atmosphere Anatomies Explores Weather, Climate, and Atmosphere as Mediums of Design.” Harvard Graduate School of Design, February 23, 2021. https://www.gsd.harvard.edu/2021/02/silvia-beneditos-new-book-atmosphere-anatomies-explores-weather-climate-and-atmosphere-as-mediums-of-design/.
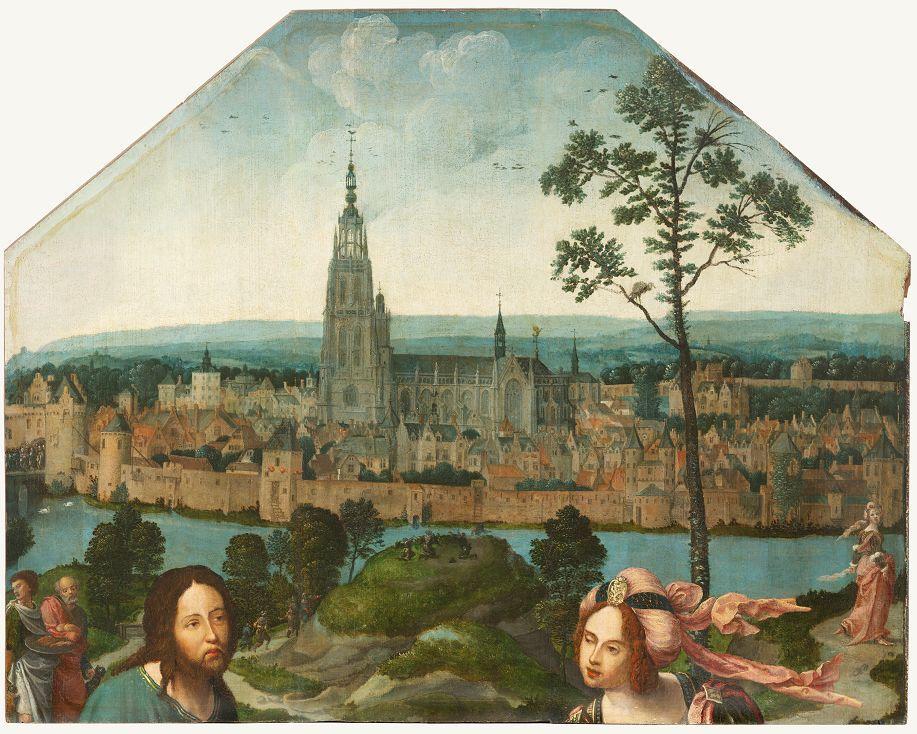
Historiek. 2013. “Oudste stadsgezicht Nederland gevonden: Breda rond 1518.” Historiek. Accessed March 13, 2025. https://historiek.net/oudste-stadsgezicht-nederland-gevonden-breda-rond-1518/36705/.
Jacobs, C., Klok, L., Bruse, M., Cortesão, J., Lenzholzer, S., & Kluck, J. (2020). Are urban water bodies really cooling? Urban Climate, 32(100607). https://doi. org/10.1016/j.uclim.2020.100607
Jackson, John Brinckerhoff. Landscapes: Selected Writings of J.B.Jackson, ed. Ervin H. Zube. Massachusetts: University of Massachusetts Press: 1970
Loenhart. Klaus 2017. Breathe. Investigations into our Atmospherically Entangled Furture. Basel: Birkhauser Verlag GmbH
Lenzholzer, Sanda. 2015. Weather in the City : How Design Shapes the Urban Climate. Rotterdam: Nai010 Publishers.
Lenzholzer, Sanda, Wiebke Klemm, and Carolina Vasilikou. 2018. “Qualitative Methods to Explore Thermo-Spatial Perception in Outdoor Urban Spaces.” Urban Climate 23 (March): 231–49. https://doi.org/10.1016/j.uclim.2016.10.003.
Liu, Rui, Hai Guo, Chao Wu, Ruiqiang Dong, and Baohong Wang. 2021. “Simulating Airflow Around Flexible Vegetative Windbreaks.” Journal of Geophysical Research: Atmospheres 126 (19): e2021JD034578. https://doi.org/10.1029/2021JD034578.
Klemm, Wiebeke. Clever and cool; Generating design guidelines for climate responsive urban green infrastructure.PhD thesis, Wageningen University, Wageningen, 2018.
Kluck, J., Cortesão, J., Lenzholzer, S., Klok, L., & Jacobs, C. M. J. (2017). Really cooling water bodies in cities. Realcool. Poster session presented at 3rd Euro-
Wind Woven | Ecological restoration of Breda’s urban fabric through wind
pean Climate Change Adaptation Conference 2017, Glasgow, United Kingdom. https://edepot.wur.nl/448646
Krogh, Marianne. Connectedness: Encyclopedia of the Anthropocene. ed. Marianne Krogh, Copenhagen: Strand- berg publishing, 2021.
Maiullari, Daniela, Marjolein Pijpers-van Esch, and Arjan Van Timmeren. 2021. “A Quantitative Morphological Method for Mapping Local Climate Types.” Urban Planning 6 (3): 240–57. https://doi.org/10.17645/up.v6i3.4223.
Krautheim, Marieke. 2014. City and Wind : Climate as an Architectural Instrument. Berlin: Dom Publishers.
NASA Prediction Of Worldwide Energy Resources (POWER). n.d. NASA POWER Data Access Viewer. Accessed 26 February 2024. https://power.larc.nasa.gov/ data-access-viewer/.
Nerdinger, Winfried, ed. 2012. City and Wind: Climate as an Architectural Instrument. Accessed March 13, 2025. Munich: DETAIL. https://issuu.com/detail-magazine/docs/310-0_city_wind.
Notitie Reikwijdte en detailniveau ’t Zoet Breda. Accessed March 13, 2025. https://www.crossmarkbreda.nl/sites/default/files/2024-07/Notitie Reikwijdte en Detailniveau t Zoet_0.pdf.
Provincie Noord-Brabant, Waterschap Brabantse Delta, and GrondRR, Klimaatatlas Breda, Klimaatatlas Breda, n.d.
Pujols, Jean-Pierre, and Caterina Penone. 2012. Railway Edges, Ecological Corridors: How to Conciliate Biodiversity and Economic Management of the Green Dependencies. Paris: SNCF INFRA & MNHN UMR7204 CERSP.
Reed, Chris, and Nina-Marie E Lister. 2014. Projective Ecologies. Cambridge: Harvard University Graduate School Of Design ; New York.
Reinout Rutte, Jaap Evert Abrahamse, Otto Diesfeldt, Technische Universiteit Delft. Faculteit Bouwkunde, Països Baixos. Rijksdienst Voor Het Cultureel Erfgoed, and Et Al. 2016. Atlas of the Dutch Urban Landscape : A Millenium of Spatial Development. Bussum: Thoth.
Roesler, Sascha. 2022. City, Climate, and Architecture. Birkhaüser.
Roesler, Sascha, Madlen Kobi, and Lorenzo Stieger. 2022. Coping with Urban Climates. Birkhäuser.
“Measuring Biodiversity.” 2021. Openresearch.amsterdam. August 31, 2021. https://openresearch.amsterdam/nl/page/72549/measuring-biodiversity.
“Overzicht van Alle Bomen van Nederland.” n.d. Boomregister.nl. https://boomregister.nl/overzichtskaart-van-de-bomen-in-nederland/.
Shrestha, Himalaya Bir. 2022. “Wind Energy Physics and Resource Assessment with Python.” Medium. January 25, 2022. https://towardsdatascience.com/ wind-energy-physics-and-resource-assessment-with-python-789a0273e697.
Santamouris, Mat. 2020. “Cooling the Cities – A Review of Reflective and Green Roof Mitigation Technologies to Fight Heat Island and Improve Comfort in Urban Environments.” Solar Energy 103: 682–703. https://doi.org/10.1016/j.solener.2012.07.003.
Schlitz Audubon Nature Center. 2019. “The Magic of Seed Dispersal.” Schlitz Audubon Nature Center, September 17, 2019. https://www.schlitzaudubon. org/2019/09/17/the-magic-of-seed-dispersal/.
Sprong, Jorinde, and Jelle W.F. Reumer. “Vegetation of Urban Wastelands in Rotterdam and the Effect of Human Disturbance.” Deinsea 12 (2008): 21–35. https://www.hetnatuurhistorisch.nl/fileadmin/user_upload/documents-nmr/Publicaties/Deinsea/Deinsea_12/04_DSA12Sprong.pdf. “Themastudie Hitte En Droogte.” 2019. Openresearch.amsterdam. July 31, 2019. https://openresearch.amsterdam/nl/page/47006/themastudie-hitte-en-droogte.
Szkordilisz, Flóra, and András Zöld. “Effect of Vegetation on Wind-Comfort.” Applied Mechanics and Materials 824 (2016): 811–818. https://doi. org/10.4028/www.scientific.net/AMM.824.811
Thomson, Fiona J., Angela T. Moles, Tony D. Auld, and Richard T. Kingsford. 2011. “Seed Dispersal Distance Is More Strongly Correlated with Plant Height than with Seed Mass.” Journal of Ecology 99 (6): 1299–1307. https://doi.org/10.1111/j.1365-2745.2011.01867.x.
Tikka, Pia M., Hannu Hogmander, and Pirkko S. Koski. 2001. “Road and Railway Verges Serve as Dispersal Corridors for Grassland Plants.” Landscape Ecology 16 (7): 659–666. https://doi.org/10.1023/A:1013170514785.
“Verslag: Project Koele Kades.” 2020. Openresearch.amsterdam. July 1, 2020. https://openresearch.amsterdam/nl/page/60922/verslag-project-koelekades.
Imagery:
Bechtel, Benjamin, Paul J. Alexander, Jürgen Böhner, Jason Ching, Olaf Conrad, Johannes Feddema, Gerald Mills, Linda See, and Iain Stewart. 2015. “Mapping Local Climate Zones for a Worldwide Database of the Form and Function of Cities” ISPRS International Journal of Geo-Information 4, no. 1: 199-219. https:// doi.org/10.3390/ijgi4010199
“Buttercup Ridge by Phil Greenwood Re at Norton Way Gallery.” Norton Way Gallery, July 25, 2024. https://nortonwaygallery.com/artwork/phil-greenwood/ buttercup-ridge/.
Brensing, Karsten. 2018. Brehm’s Animal Life. Berlin: Duden. ISBN 978-3411717828.
Krautheim, Mareike. 2014. City and Wind : Climate as an Architectural Instrument. Berlin: Dom Publishers. Marsh WM. 2010. Landscape Planning Environmental Applications.John Wiley & Sons, Inc.
Pijpers-van Esch, Marjolein. 2015, Designing the Urban Microclimate. Delft: Technische Universiteit Delft. Truchanowska, Bożena. 1964. Illustration in Colourful Calendar, by Jerzy Ficowski. Warsaw: Nasza Księgarnia.
Acknowledgements
I extend my sincere gratitude to my committee for the inspirational talks, insightful input and support.
Gert-Jan Wisse, Nikol Dietz, and René van der Velde
I also wish to express my heartfelt appreciation to both heads of the Landscape Department for their guidance and advice during my time at the academy.
Hanneke Kijne & Joost Emmerik
For keeping up with the production, fueling the days with endless conversations and especially for being the steady rock in the windy days, special thanks to
Emanuele Paladin
For simulations, opportunity to join courses and testing, for flexibility and inspiring input
Alejandro Fuentesarias
Daniella Maiullari
To the amazing colleagues, friends, at Boom Landscape where the project reached its final outcome and to everyone who has been part of this journey, I hope this piece of work inspired you as much as it inspired me.
Wind Woven | Ecological restoration of Breda’s urban fabric through wind
Landscape Architecture
Academie van Bouwkunst Amsterdam 23 | 24
Rachel Borovska
Mentor | Gert-Jan Wisse
Committee members | Nikol Dietz, René van der Velde
Final examination | Ziega van den Berk, Marit Janse