82 minute read
Facades: re-use and recycling


ANALYSIS: Facades
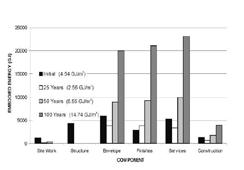
unlocking re-use potential in facades Play it again… and again… Unlocking the re-use potential of glass façade systems Rebecca Hartwell 1 , Dr. Mauro Overend 1 1 University of Cambridge, Department of Engineering, UK Abstract The ubiquitous insulated glazing unit (IGU) has been referred to as a monstrous hybrid consisting of a mixture of materials or assemblies of components from which it is not economically feasible t o salvage the raw materials after their current life. In recent decades there has been an increase in the use of glass within façade systems with little consideration for end-of-life (EoL) recovery. T echnical improvements focused on improving operational energy of glazed façades can have unintentional negative consequences on the ability to recover high-value material. This research aims to assess the opportunities of avoidable waste through a comparative life-cycle impact assessment (LCIA) bound to the EoL stage and evaluate the reclamation potential of glass and aluminium from an existing cu rtain-walling glazing unit in different recovery scenarios. A framework for the assessment of recovery potential of glass façade designs is proposed. Further, the technical challenges that prevent gla zing systems from exploiting their re-use potential, in terms of the separation of laminated glass and adhesive connections, have been reviewed to direct future experimental research on glass façades designed for disassembly and re-use. Design Implications on Embodied Energy The distribution of initial embodied energy for building elements differs with each building. Cole and Kernan conducted research on a threestorey office building found that the façade typically contributes around 25% of the total initial embodied energy as highlighted in figure 2. [3] The relative contribution to the initial embodied energy (EE) is likely to continue to rise in significance due to the broad design possibilities that are explored to minimise operational energy (OE). Figure 2: i.) EE contributions over a typical building service life [3] ii.) Building split into service lives of elements [4] The significance of the EE attributed to the façade is scaled up considerably when the whole building lifespan is taken into account. This is commonly referred to as recurring EE and highlighted in figure 4(i) over, 25-, 50-, 100-year building lifespan. The building envelope is significant in terms of recurring EE, in that, in relation to the structure, it typically requires more frequent maintenance and replacement of parts. Building "Shearing Layers" Services ~7-15 years Stuff ~ daily to monthly
Space Plan ~3 years
Skin ~20 years Structure ~ 30-300 years Site ~ eternal (i) (ii) Initial 25 Years 50 Years 100 Years Site Work Structure Envelope Finishes Services Construction COMPONENT EMBODIED ENERGY (GJ)
asianglass AG 20-1 www.asianglass.com48 A growth in function Glass façade systems have evolved to serve numerous functions and meet complex technical requirements. When it comes to design for disassembly, questions arise as to whether there is a system trade-off between meeting improvements in operational energy and the ability to recover glass and other materials for re-use at their end-of-life (EoL).
Early aesthetically-driven glass façade design consisted of a small material mix involving monolithic glass and mostly mechanical connections. During the 1970s-80s, glass envelopes became more performance-driven and began to incorporate high-performance double-glazing, glass coatings and adhesivelysealed units to improve air-tightness, acoustic and thermal insulation and sun-protection. The volume of glass in buildings has since grown; triple-glazing units (TGUs) and double-glazing units (DGUs) with coatings are now considered essential elements of low and zero energy buildings. TGUs and coated DGUs now make up 2% and 12%, respectively, of the existing glazing type distribution (EGD) in the EU. Such systems consist of more materials and more permanent connections via the use of adhesive sealants. [1], [2] Whilst single-glazing units (SGU) and early uncoated DGUs still account for 44% and 42% of the EU EGD, respectively, the field of building refurbishment to meet energy performance standards continues to grow which suggests that the large amount of glass in building stock in lower-performance systems will soon be considered unfit for functional purpose. Design implications The distribution of initial embodied energy for building elements differs with each building. Cole and Kernan conducted research on a three-storey office building found that the façade typically contributes around 25% of the total initial embodied energy as highlighted in figure 2. [3] The relative contribution to the initial embodied energy (EE) is likely to continue to rise in significance due to the broad design possibilities that are explored to minimise operational energy (OE).
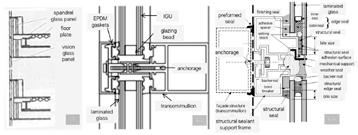
The significance of the EE attributed to the façade is scaled up considerably when the whole building lifespan is taken into account. This is commonly referred to as recurring EE and highlighted in figure 4(i) over, 25-, 50-, 100-year building lifespan. The building envelope is significant in terms of recurring EE, in that, in relation to the structure, it typically requires more frequent maintenance and replacement of parts. The failure rate of the IGU has been the subject of recent Figure 1: Cross-section of i.) SGU ii.) DGU iii.) Structural Sealant Glazing. Figure 2: i.) EE contributions over a typical building service life [3] ii.) Building split into service lives of elements [4] Rebecca Hartwell and Dr. Mauro Overend from the University of Cambridge, UK, discuss overcoming the traditional issues of being a hybrid product when it comes to their eventual re-use and recycle… 1 Introduction A Growth in Function Glass façade systems have evolved to serve numerous functions and meet complex technical requirements. When it comes to design for disassembly, questions arise as to whether there is a system trade-off between meeting improvements in operational energy and the ability to recover glass and other materials for re-use at their end-of-life (EoL). Early aesthetically-driven glass façade design consisted of a small material mix involving monolithic glass and mostly mechanical connections. During the 1970s-80s, glass envelopes became more performance-driven and began to incorporate high-performance double-glazing, glass coatings and adhesively-sealed units to improve air-tightness, acoustic and thermal insulation and sun-protection. The volume of glass in buildings has since grown; triple-glazing units (TGUs) and double-glazing units (DGUs) with coatings are now considered essential elements of low and zero energy buildings. TGUs and coated DGUs now make up 2% and 12%, respectively, of the existing glazing type distribution (EGD) in the EU. Such systems consist of more materials and more permanent connections via the use of adhesive sealants. [1], [2] Whilst single-glazing units (SGU) and early uncoated DGUs still account for 44% and 42% of the EU EGD, respectively, the field of building refurbishment to meet energy performance standards continues to grow which suggests that the large amount of glass in building stock in lower-performance systems will soon be considered unfit for functional purpose. Figure 1: Cross-section of i.) SGU ii.) DGU iii.) Structural Sealant Glazing The failure rate of the IGU has been the subject of recent study. [5], [6] The multi-component nature of the building envelope can create significant challenges in disassembly and the reclamation of glass and other materials from existing systems for re-use or recycling of component parts at EoL. [7], [8] End-of-life can ultimately be defined as the inability for the system to fulfil its design function or meet new requirements. Changing user requirements and new developments in the area of construction, may lead to façade EoL being reached prematurely ie. every 20 years or so. [4] For these reasons, façades pose a clear opportunity to concentrate recovery methods, even more so with the advance of new materials and processing techniques that have a high-value and require more energyintensive manufacture. Whole-Life Energy Problem Shift Existing policies in building construction heavily focus on improving the OE. Several researchers have studied how decisions made in the design stage of the building envelope such as DGUs with low emissivity coatings and TGUs, solar thermal collectors and building integrated solar photovoltaic panels affect the OE. [9]–[11] Consequently, other factors within the life-cycle of the façade such as EE and recovery potential are often overlooked. Chastas, et al. reviewed previous literature on 90 residential buildings to find the ratio of EE to OE energy. It reported an EE contribution of 6–20% in conventional buildings, 11–33% in passive buildings, 26–57% in low energy buildings, and 74–100% in net zero energy buildings. [12], [13] This shifting balance has highlighted how improvements in OE, has increased the relative significance of the EE; affected by the selection of locally-available construction materials and methods; manufacturing energy intensity; recyclability potential; recycled content; renewability potential; potential to reduce construction waste; life span and durability; and maintenance needs. As the energy required for operation decreases, scenarios with a higher potential for recycling and re-use can have a significant impact on the whole-life cycle. [14], [15]. However, with no internationally accepted, comprehensive and pragmatic method for assessing and comparing the recycling potential of façade materials in terms of the material choice and their embodied impact when looking at future scenarios for building refurbishment, there is little incentive for re-use. [16] [17] Unlocking the re-use potential of glass façade systems Rebecca Hartwell 1 , Dr. Mauro Overend 1 1 University of Cambridge, Department of Engineering, UK Abstract The ubiquitous insulated glazing unit (IGU) has been referred to as a monstrous hybrid consisting of a mixture of materials or assemblies of components from which it is not economically feasible t o salvage the raw materials after their current life. In recent decades there has been an increase in the use of glass within façade systems with little consideration for end-of-life (EoL) recovery. T echnical improvements focused on improving operational energy of glazed façades can have unintentional negative consequences on the ability to recover high-value material. This research aims to assess the opportunities of avoidable waste through a comparative life-cycle impact assessment (LCIA) bound to the EoL stage and evaluate the reclamation potential of glass and aluminium from an existing cu rtain-walling glazing unit in different recovery scenarios. A framework for the assessment of recovery potential of glass façade designs is proposed. Further, the technical challenges that prevent gla zing systems from exploiting their re-use potential, in terms of the separation of laminated glass and adhesive connections, have been reviewed to direct future experimental research on glass façades designed for disassembly and re-use. Introduction A Growth in Function Glass façade systems have evolved to serve numerous functions and meet complex technical requirements. When it comes to design for Design Implications on Embodied Energy The distribution of initial embodied energy for building elements differs with each building. Cole and Kernan conducted research on a threestorey office building found that the façade typically contributes around 25% of the total initial embodied energy as highlighted in figure 2. [3] The relative contribution to the initial embodied energy (EE) is likely to continue to rise in significance due to the broad design possibilities that are explored to minimise operational energy (OE). Figure 2: i.) EE contributions over a typical building service life [3] ii.) Building split into service lives of elements [4] The significance of the EE attributed to the façade is scaled up considerably when the whole building lifespan is taken into account. This is commonly referred to as recurring EE and highlighted in figure 4(i) over, 25-, 50-, 100-year building lifespan. The building envelope is significant in terms of recurring EE, in that, in relation to the structure, it typically requires more frequent maintenance and replacement of parts. The failure rate of the IGU has been the subject of recent study. [5], [6] The multi-component nature of the building envelope can create significant challenges in disassembly and the reclamation of glass and other materials from existing systems for re-use or recycling of component parts at EoL. [7], [8] Building "Shearing Layers" Services ~7-15 years Stuff ~ daily to monthly
Space Plan ~3 years
Skin ~20 years Structure ~ 30-300 years Site ~ eternal (i) (ii) Initial 25 Years 50 Years 100 Years Site Work Structure Envelope Finishes Services Construction COMPONENT EMBODIED ENERGY (GJ)
study. [5], [6] The multi-component nature of the building envelope can create significant challenges in disassembly and the reclamation of glass and other materials from existing systems for re-use or recycling of component parts at EoL. [7], [8]
End-of-life can ultimately be defined as the inability for the system to fulfil its design function or meet new requirements. Changing user requirements and new developments in the area of construction, may lead to façade EoL being reached prematurely ie. every 20 years or so. [4] For these reasons, façades pose a clear opportunity to concentrate recovery methods, even more so with the advance of new materials and processing techniques that have a high-value and require more energy-intensive manufacture.
Whole-life energy Existing policies in building construction heavily focus on improving the OE. Several researchers have studied how decisions made in the design stage of the building envelope such as DGUs with low emissivity coatings and TGUs, solar thermal collectors and building integrated solar photovoltaic panels affect the OE. [9]–[11] Consequently, other factors within the life-cycle of the façade such as EE and recovery potential are often overlooked. Chastas, et al. reviewed previous literature on 90 residential buildings to find the ratio of EE to OE energy. It reported an EE contribution of 6–20% in conventional buildings, 11–33% in passive buildings, 26–57% in low energy buildings, and 74–100% in net zero energy buildings. [12], [13] This shifting balance has highlighted how improvements in OE, has increased the relative significance of the EE; affected by the selection of locally-available construction materials and methods; manufacturing energy intensity; recyclability potential; recycled content; renewability potential; potential to reduce construction waste; life span and durability; and maintenance needs. As the energy required for operation decreases, scenarios with a higher potential for recycling and re-use can have a significant impact on the whole-life cycle. [14], [15]. However, with no internationally accepted, comprehensive and pragmatic method for assessing and comparing the recycling potential of façade materials in terms of the material choice and their embodied impact when looking at future scenarios for building refurbishment, there is little incentive for re-use. [16] [17]
Current processes Façades may be removed from a building as a result of full- or partial-demolition or refurbishment. The EU Landfill Directive introduced in 1999 does not present any specific glass measures. [18] Glass, as an inert material, is easy and relatively cheap to send to landfills, which does not favour the emergence of glass recycling. Based on the author’s discussions with demolition contractors in industry, it has been recognised that the most common deconstruction method involves a demolition excavator with grab/pincer attachment controlled by driver that is used to pry out metal frames. The mixed glass falls to ground and mixed with concrete and/or brick rubble as inert waste. An on-site separation of metals, woods, concrete (including glass) is undertaken with the metals sold on to a re-use or recycling facility (~£200/tonne) where they are usually melted down for recycling. The mixed glass inert waste is sold on for aggregate production at a much lower value (~£1/tonne) or to landfill where a landfill fee is required. The low market value, together with lack of properly organised glass collection mean that despite its re-use and recyclability potential, EoL building glass is almost never recycled into new glass products.
Independently, uncoated glass in particular is a very durable material and has high re-use potential. However, the addition of coatings, interlayers and special additives introduces difficulties in recycling. There is some uncertainty in the exact figures for flat glass collection and recycling rates for post-consumer glass. In 2007, it was found that 57% of the 5.1Mt of waste generated from the EU flat glass industry was recycled, including pre- and post-consumer glass. [19] Preconsumer glass recycling rates tend to be relatively high due to them being driven by internal efficiency improvements within glass manufacturing facilities. More research into glass collection is required to quantify post-consumer recovery rates.
ANALYSIS: Facades and has high re-use potential. However, the addition of coatings, interlayers and special additives introduces difficulties in recycling. There is some uncertainty in the exact figures for flat glass collection and recycling rates for post-consumer glass. In 2007, it was found that 57% of the 5.1Mt of waste generated from the EU flat glass industry was recycled, including pre- and post-consumer glass. [19] Pre-consumer glass recycling rates tend to be relatively high due to them being driven by internal efficiency improvements within glass manufacturing facilities. More research into glass collection is required to quantify postconsumer recovery rates.
Façade: circular economies The EU Environmental Action Programme to 2020 aims to move towards a fully circular economy (CE) in which industry move towards manufacture, use and recovery models that aims to minimise the depletion of the world’s natural resources and deal with problems of waste disposal in a way that materials are re-used or recycled in their best form to reduce their environmental impact by 2050. [20] Circular Economy for Glass Façades The EU Environmental Action Programme to 2020 aims to move towards a fully circular economy (CE) in which industry move towards manufacture, use and recovery models that aims to minimise the depletion of the world’s natural resources and deal with problems of waste disposal in a way that materials are re-used or recycled in their best form to reduce their environmental impact by 2050. [20] Transport Transport
Secondary material
Cradle
Raw Mineral Extraction
Material Production
Product Assembly and Transport v Transport of system to site v Construction installation process
Materials in Use
Façade Disposal
v Provide functional performance v Maintenance & repair
Transport
Transport
Product Use Construction Process
End-of-Life
Gate
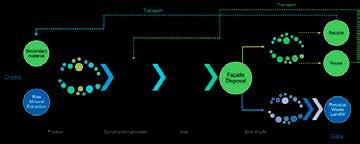
Figure 3: CE concept: transition through façade lifecycle in terms of energy use. Figure 3: CE concept: transition through façade lifecycle in terms of energy use
The re-use pathway mapped by the author in figure 3 is the process in which discarded components are recirculated and used for the same function without destruction. Recycling is the process in which discarded materials are reprocessed into raw materials for new products. The potential for re-using construction components in the construction sector has been acknowledged by several researchers. [21]–[23] Most studies have focused on the recycling or re-use of narrow groups of materials such as aggregate material and steel [24], [25] This study aims to identify the opportunities in the reclamation of flat glass from the building envelope.
Findings from an ongoing semi-structured interview conducted by the author with different stakeholders of the façade supply-chain provided a useful insight into the industry’s perceptions on façade re-use. The initial findings suggest that whilst there exists some willingness for re-use, existing demand for re-use of façade product is low, largely due to a lack of specification for re-use material; lack of compatibility between re-use material and new projects due to the bespoke nature of most systems; lack of adequate supply; fear of material failure; transportation and storage difficulties; and limited separability of composite constructions. Quantified environmental benefits, improved separability of components; and improved re-use supply-chain have been identified as common leverage points that could help address the existing challenges in glass façade re-use. The re-use pathway mapped by the author in figure 3 is the process in which discarded components are recirculated and used for the same function without destruction. Recycling is the process in which discarded materials are reprocessed into raw materials for new products. The potential for re-using construction components in the construction sector has been acknowledged by several researchers. [21]–[23] Most studies have focused on the recycling or re-use of narrow groups of materials such as aggregate material and steel [24], [25] This study aims to identify the opportunities in the reclamation of flat glass from the building envelope. Findings from an ongoing semi-structured interview conducted by the author with different stakeholders of the façade supply-chain provided a useful insight into the industry’s perceptions on façade re-use. The initial findings suggest that whilst there exists some willingness for re-use, existing demand for re-use of façade product is low, largely due to a lack of specification for re-use material; lack of compatibility between re-use material and new projects due to the bespoke nature of most systems;
Environmental Assessment Method
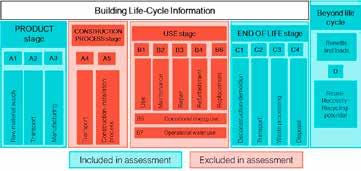
System Boundary The existing research forms a process-based life-cycle impact assessment (LCIA) methodology for comparative environmental impact estimation as prescribed by the International Standard Organisation (ISO) 14040 to demonstrate to what extent the implementation of design for disassembly and re-use at the endof-life (EoL) of glass curtain walling systems has on the environmental impact in terms of embodied energy from non-renewable resources (PENRE EE) and carbon emissions (GWP). [27] [28] LCIA relates the large number of input and output flows in terms of energy used throughout the product life-cycle, known as inventory values, to a smaller number of environmental impact themes.
The study is bound to the gate-to-grave and gate-to-cradle stage of the LCIA with a comparison of four different EoL scenarios based on existing design and potential recovery methods. The study considers the energy impacts associated with the primary energy associated with original input materials (including the energy required to extract, refine and transport fuels and the electricity used in the process), system interconnectivities, building deconstruction, material 2
ANALYSIS: Facades (LCIA) methodology for comparative environmental impact estimation as prescribed by the International Standard Organisation (ISO) 14040 to demonstrate to what extent the implementation of design for disassembly and re-use at the end-of-life (EoL) of glass curtain walling systems has on the environmental impact in terms of embodied energy from non-renewable resources (PENRE EE) and carbon emissions (GWP). [27] [28] LCIA relates the large number of input and output flows in terms of energy used throughout the product life-cycle, known as inventory values, to a smaller number of environmental impact themes.
End of life scenarios Four hypothetical scenarios, explained in table 1, were constructed to draw comparisons on the EoL route that performs best in terms of achieving maximum recovery potential. End-of-Life Scenarios Four hypothetical scenarios, explained in table 1, were constructed to draw comparisons on the EoL route that performs best in terms of achieving maximum recovery potential. Table 1: LCIA system boundary applied to four different scenarios for glass façade system at EoL to be compared
SCENARIO DEMOLITION PROCESS EOL ROUTE
METHOD
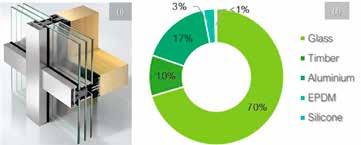
asianglass AG 20-1 www.asianglass.com50 dismantling, transportation from deconstruction site to disposal/recycling/ treatment/next use site and the recycling processes from each EoL scenario based on the original material input. The substitution approach focuses on the recycling capacities of a material. Recycling potential is the share of recycled material that could fulfil the function of primary material in the next material cycle. The scrap including treatment and recycling energy is considered as input and replaces primary resources (substitution). Functional Unit and System Characteristics A functional unit (FU) provides a functional basis for fair comparison of environmental impact across the different EOL scenarios and is the reference basis all gathered data refer to. The façade system selected for this study is that used in a new educational building based in Cambridge, UK. The functional unit for this study defined as the treatment of 1 unit of triple-glazed Aluminium/Timber unitised structural glazed curtain walling, 3650 mm x 4550 mm, highlighted in figure 6(i), at EoL.
The material mass figures shown in figure 6(ii) were obtained from the author’s calculations based on construction drawings and material densities. At present, the most common EoL scenario within industry is either; façade system demolition and landfill (scenario 1) or dismantle and component recycle (scenario 2). In the demolition scenario, it is assumed that materials are disposed of in landfill. Unlike the other EoL routes, no energy can be accredited in this case, as this scenario requires energy and does not deliver a surplus.
The existing environmental product declaration for the Timber-Aluminium façade system suggests a disposal scenario most similar to scenario 2. [31] Glass is considered to be downcycled in aggregate production, which requires minimal additional processing, whilst aluminium is recycled into new aluminium which requires melting down the material for reprocessing. Scenarios 3 and 4 refer to more idealised situations, whereby re-use options are made possible due to the development of new separation technologies for component re-use (scenario 3), and performance assurance and testing for system re-use (scenario 4). The selective dismantling of façade systems for component re-use (scenario 3) offers an alternative for the existing process of down-cycling glass material. In this way, flat glass sheets are recovered, to be directly re-used in the building glass industry. Table 2 shows the total % weight to each scenario of recovery. Inventory Data Data Source There are several databases available for input-data LCIA figures e.g. EcoInvent, ELCD. [32] For this study, inventory data was taken from the German database, Oekobaudat. Oekobaudat contains generic life cycle data sets that provide suitable averages of the environmental indicators for the building materials for life-cycle modules (A1-A3, B1-B6, C1-C4 and D). This includes the energy density coefficient, incineration coefficient, transport factor and demolition/disassembly/recycling coefficient. [33] The UK Inventory of Carbon and Energy (ICE) was used for aggregate material production data. [34] Both datasets are traceable, freely accessible and comply with ISO-14040 which allows for a comparison of all datasets to be made. [27] Figure 5: Methodology of data collection for calculating environmental impact in terms of embodied energy and carbon emissions. Table 1: LCIA system boundary applied to four different scenarios for glass façade system at EoL to be compared. Table 2: Material outputs by weight %– diversion/collection rates for each scenario Figure 6: i.) Timber curtain walling system under study [31] ii.) % mass (kg) of constituent material within FU. transportation from deconstruction site to disposal/recycling/treatment/next use site and the recycling processes from each EoL scenario based on the original material input. The substitution approach focuses on the recycling capacities of a material. Recycling potential is the share of recycled material that could fulfil the function of primary material in the next material cycle. The scrap including treatment and recycling energy is considered as input and replaces primary resources (substitution). Figure 5: Methodology of data collection for calculating environmental impact in terms of embodied energy and carbon emissions Functional Unit and System Characteristics A functional unit (FU) provides a functional basis for fair comparison of environmental impact across the different EOL scenarios and is the reference basis all gathered data refer to. The façade system selected for this study is that used in a new educational building based in Cambridge, UK. The functional unit for this study defined as the treatment of 1 unit of triple-glazed Aluminium/Timber unitised structural glazed curtain walling, 3650 mm x 4550 mm, highlighted in figure 6(i), at EoL. Figure 6: i.) Timber curtain walling system under study [31] ii.) % mass (kg) of constituent material within FU The material mass figures shown in figure 6(ii) were obtained from the author’s calculations based on construction drawings and material densities. End-of-Life Scenarios Four hypothetical scenarios, explained in table 1, were constructed to routes, no energy can be accredited in this case, as this scenario requires energy and does not deliver a surplus. The existing environmental product declaration for the TimberAluminium façade system suggests a disposal scenario most similar to scenario 2. [31] Glass is considered to be downcycled in aggregate production, which requires minimal additional processing, whilst aluminium is recycled into new aluminium which requires melting down the material for reprocessing. Scenarios 3 and 4 refer to more idealised situations, whereby re-use options are made possible due to the development of new separation technologies for component re-use (scenario 3), and performance assurance and testing for system re-use (scenario 4). The selective dismantling of façade systems for component re-use (scenario 3) offers an alternative for the existing process of down-cycling glass material. In this way, flat glass sheets are recovered, to be directly re-used in the building glass industry. Table 2 shows the total % weight to each scenario of recovery. Table 2: Material outputs by weight %– diversion/collection rates for each scenario TOTAL % RE-USE TOTAL % RECYCLE TOTAL % INCINERATION TOTAL % LANDFILL SCENARIO 1 - - - 100.0% SCENARIO 2 - 80.5% 11.9% 7.5% SCENARIO 3 89.2% 1.2% 2.6% 7.0% SCENARIO 4 97.0% - 2.6% 0.4% Inventory Data Data Source There are several databases available for input-data LCIA figures e.g. EcoInvent, ELCD. [32] For this study, inventory data was taken from the German database, Oekobaudat. Oekobaudat contains generic life cycle data sets that provide suitable averages of the environmental indicators for the building materials for life-cycle modules (A1-A3, B1-B6, C1-C4 and D). This includes the energy density coefficient, incineration coefficient, transport factor and demolition/disassembly/recycling coefficient. [33] The UK Inventory of Carbon and Energy (ICE) was used for aggregate material production data. [34] Both datasets are traceable, freely accessible and comply with ISO-14040 which allows for a comparison of all datasets to be made. [27] Service Life When considering re-use or recycle options, the reason for EoL is important in order to coordinate and incentivise the best recovery method. component analysis material and element analysis relationships between elements connection diagram sequence of disassembly operations forensic breakdown % recovery from each pathway: reuse/recycle/incineration/landfill % reclamation in terms of environmental impact (EE and GWP) service life
scenario variations for EoL comparison site comparison of use Inventory Data (A1-A3) Input Bill of Materials
Process Output
Argon-filled Cavity Argon-filled Cavity IGU Spacer Aluminium IGU Butyl Seal
Middle Pane Float Glass IGU Butyl Seal
IGU Spacer Aluminium TR2 Thermally Insulated Composite Panel 3 1 Hydraulic Crushing Mixed Rubble Landfill and/or incineration 2 Selective Dismantle Parts Recycle 90% Glass to road aggregate (10% to landfill) Aluminium to recycling 3 Selective Dismantle Disassemble/ separate components 90% Glass re-used in new system (10% to landfill) Aluminium components reused in new system 4 Selective Dismantle Remove system for re-use Direct re-use of façade unit in new building At present, the most common EoL scenario within industry is either; façade system demolition and landfill (scenario 1) or dismantle and component recycle (scenario 2). In the demolition scenario, it is assumed that materials are disposed of in landfill. Unlike the other EoL transportation from deconstruction site to disposal/recycling/treatment/next use site and the recycling processes from each EoL scenario based on the original material input. The substitution approach focuses on the recycling capacities of a material. Recycling potential is the share of recycled material that could fulfil the function of primary material in the next material cycle. The scrap including treatment and recycling energy is considered as input and replaces primary resources (substitution). Figure 5: Methodology of data collection for calculating environmental impact in terms of embodied energy and carbon emissions Functional Unit and System Characteristics A functional unit (FU) provides a functional basis for fair comparison of environmental impact across the different EOL scenarios and is the reference basis all gathered data refer to. The façade system selected for this study is that used in a new educational building based in Cambridge, UK. The functional unit for this study defined as the treatment of 1 unit of triple-glazed Aluminium/Timber unitised structural glazed curtain walling, 3650 mm x 4550 mm, highlighted in figure 6(i), at EoL. Figure 6: i.) Timber curtain walling system under study [31] ii.) % mass (kg) of constituent material within FU The material mass figures shown in figure 6(ii) were obtained from the author’s calculations based on construction drawings and material densities. routes, no energy can be accredited in this case, as this scenario requires energy and does not deliver a surplus. The existing environmental product declaration for the TimberAluminium façade system suggests a disposal scenario most similar to scenario 2. [31] Glass is considered to be downcycled in aggregate production, which requires minimal additional processing, whilst aluminium is recycled into new aluminium which requires melting down the material for reprocessing. Scenarios 3 and 4 refer to more idealised situations, whereby re-use options are made possible due to the development of new separation technologies for component re-use (scenario 3), and performance assurance and testing for system re-use (scenario 4). The selective dismantling of façade systems for component re-use (scenario 3) offers an alternative for the existing process of down-cycling glass material. In this way, flat glass sheets are recovered, to be directly re-used in the building glass industry. Table 2 shows the total % weight to each scenario of recovery. Table 2: Material outputs by weight %– diversion/collection rates for each scenario TOTAL % RE-USE TOTAL % RECYCLE TOTAL % INCINERATION TOTAL % LANDFILL SCENARIO 1 - - - 100.0% SCENARIO 2 - 80.5% 11.9% 7.5% SCENARIO 3 89.2% 1.2% 2.6% 7.0% SCENARIO 4 97.0% - 2.6% 0.4% Inventory Data Data Source There are several databases available for input-data LCIA figures e.g. EcoInvent, ELCD. [32] For this study, inventory data was taken from the German database, Oekobaudat. Oekobaudat contains generic life cycle data sets that provide suitable averages of the environmental indicators for the building materials for life-cycle modules (A1-A3, B1-B6, C1-C4 and D). This includes the energy density coefficient, incineration coefficient, transport factor and demolition/disassembly/recycling coefficient. [33] The UK Inventory of Carbon and Energy (ICE) was used for aggregate material production data. [34] Both datasets are traceable, freely accessible and comply with ISO-14040 which allows for a comparison of all datasets to be made. [27] Service Life When considering re-use or recycle options, the reason for EoL is important in order to coordinate and incentivise the best recovery method. component analysis material and element analysis relationships between elements connection diagram sequence of disassembly operations forensic breakdown % recovery from each pathway: reuse/recycle/incineration/landfill % reclamation in terms of environmental impact (EE and GWP) service life
scenario variations for EoL comparison site comparison of use Inventory Data (A1-A3) Input Bill of Materials
Process Output
IGU Butyl Seal IGU Butyl Seal transportation from deconstruction site to disposal/recycling/treatment/next use site and the recycling processes from each EoL scenario based on the original material input. The substitution approach focuses on the recycling capacities of a material. Recycling potential is the share of recycled material that could fulfil the function of primary material in the next material cycle. The scrap including treatment and recycling energy is considered as input and replaces primary resources (substitution). Figure 5: Methodology of data collection for calculating environmental impact in terms of embodied energy and carbon emissions Functional Unit and System Characteristics A functional unit (FU) provides a functional basis for fair comparison of environmental impact across the different EOL scenarios and is the reference basis all gathered data refer to. The façade system selected for this study is that used in a new educational building based in Cambridge, UK. The functional unit for this study defined as the treatment of 1 unit of triple-glazed Aluminium/Timber unitised structural glazed curtain walling, 3650 mm x 4550 mm, highlighted in figure 6(i), at EoL. Figure 6: i.) Timber curtain walling system under study [31] ii.) % mass (kg) of constituent material within FU The material mass figures shown in figure 6(ii) were obtained from the author’s calculations based on construction drawings and material densities. End-of-Life Scenarios routes, no energy can be accredited in this case, as this scenario requires energy and does not deliver a surplus. The existing environmental product declaration for the TimberAluminium façade system suggests a disposal scenario most similar to scenario 2. [31] Glass is considered to be downcycled in aggregate production, which requires minimal additional processing, whilst aluminium is recycled into new aluminium which requires melting down the material for reprocessing. Scenarios 3 and 4 refer to more idealised situations, whereby re-use options are made possible due to the development of new separation technologies for component re-use (scenario 3), and performance assurance and testing for system re-use (scenario 4). The selective dismantling of façade systems for component re-use (scenario 3) offers an alternative for the existing process of down-cycling glass material. In this way, flat glass sheets are recovered, to be directly re-used in the building glass industry. Table 2 shows the total % weight to each scenario of recovery. Table 2: Material outputs by weight %– diversion/collection rates for each scenario TOTAL % RE-USE TOTAL % RECYCLE TOTAL % INCINERATION TOTAL % LANDFILL SCENARIO 1 - - - 100.0% SCENARIO 2 - 80.5% 11.9% 7.5% SCENARIO 3 89.2% 1.2% 2.6% 7.0% SCENARIO 4 97.0% - 2.6% 0.4% Inventory Data Data Source There are several databases available for input-data LCIA figures e.g. EcoInvent, ELCD. [32] For this study, inventory data was taken from the German database, Oekobaudat. Oekobaudat contains generic life cycle data sets that provide suitable averages of the environmental indicators for the building materials for life-cycle modules (A1-A3, B1-B6, C1-C4 and D). This includes the energy density coefficient, incineration coefficient, transport factor and demolition/disassembly/recycling coefficient. [33] The UK Inventory of Carbon and Energy (ICE) was used for aggregate material production data. [34] Both datasets are traceable, freely accessible and comply with ISO-14040 which allows for a comparison of all datasets to be made. [27] Service Life When considering re-use or recycle options, the reason for EoL is important in order to coordinate and incentivise the best recovery method. component analysis material and element analysis relationships between elements connection diagram sequence of disassembly operations forensic breakdown % recovery from each pathway: reuse/recycle/incineration/landfill % reclamation in terms of environmental impact (EE and GWP) service life
scenario variations for EoL comparison site comparison of use Inventory Data (A1-A3) Input Bill of Materials
Process Output
Argon-filled Argon-filled IGU Spacer Aluminium IGU Butyl Seal
Middle Pane Float Glass IGU Butyl Seal
IGU Spacer Aluminium Thermally Insulated Figure 4: Areas of life-cycle in which this study will focus. Adapted from [29], [30] 2 Figure 4: Areas of life-cycle in which this study will focus. Adapted from [29], [30] The study is bound to the gate-to-grave and gate-to-cradle stage of the LCIA with a comparison of four different EoL scenarios based on existing design and potential recovery methods. The study considers the energy impacts associated with the primary energy associated with original input materials (including the energy required to extract, refine and transport fuels and the electricity used in the process), system interconnectivities, building deconstruction, material dismantling,
German database, Oekobaudat. Oekobaudat contains generic life cycle data sets that provide suitable averages of the environmental indicators for the building materials for life-cycle modules (A1-A3, B1-B6, C1-C4 and D). This includes the energy density coefficient, incineration coefficient, transport factor and demolition/disassembly/recycling coefficient. [33] The UK Inventory of Carbon and Energy (ICE) was used for aggregate material production data. [34] Both datasets are traceable, freely accessible and comply with ISO-14040 which allows for a comparison of all datasets to be made. [27] component/system and can be calculated using equation 1. ���� �����/������� = �������������������������� �� �������������������������������� �� ������������ �������������������������������������������� ������������ ���������������������������������� �������� �� �������� (1) Incineration refers to the process of heat recovery which can be converted into usable energy form e.g. electricity, heat or combined heat and power. E Incineration is the energy recovered through incineration of materials calculated using equation 2.
Service Life When considering re-use or recycle options, the reason for EoL is important in order to coordinate and incentivise the best recovery method. Service Life When considering re-use or recycle options, the reason for EoL is important in order to coordinate and incentivise the best recovery method. ���� ������������ = �������������������������� �� �������������������������������� �� ������������������������������������������������������������������������ ������������������������ (2) The total energy recovered from the system can be equated to the sum of the re-use/recycle and incineration energy calculated using equation 3.
Argon-filled Cavity Argon-filled Cavity IGU Spacer Aluminium IGU Butyl Seal
Middle Pane Float Glass IGU Butyl Seal
IGU Spacer Aluminium TR2 Thermally Insulated Composite Panel ∑ ���� �������������������������������� ���� ��������� = ∑ ���� �������������������������������������������������� ���� ��������� + ∑ ���� ���������������������������� �������������������� ���� ��������� (3) Where a particular material/component, i =1, 2, 3 etc.

Float Glass PVB
Inner Gaskets EPDM Outer Pane Laminated Glass
Float Glass PVB Transom Pressure Profile Aluminium Mullion Pressure Profile Aluminium Outer Gaskets EPDM
Transom Back Plate Aluminium Mullion Back Plate Aluminium TR2 Rainscreen Panel Aluminium TR1 Perforated Rainscreen Panel Aluminium Inner Pane Laminated Glass Transportation E Transport is the environmental impact caused as a result of the transport of materials, components and/or systems and can be calculated using equation 4. ���� ��������� = �������������������������������������������������������������������������������� ������������������������������������������ (4)
Screw FixingAdhesive Fixing Dry Connection Transom Cover Caps Aluminium Mullion Cover Caps Aluminium Mullions Timber Transoms Timber The total transportation impact is a sum of all of the transportation processes from gate-to-grave (scenario 1) or gate-to-cradle (scenarios
Curtain walling framework and panel materials rarely deteriorate when considered independently. However, the multi-component nature of glass façade systems, highlighted in figure 7, means that the service life and therefore re-use potential of one component, is dependent on the service life of their nearest permanently connected neighbour component. For system and component re-use scenarios, it is necessary to factor service life in the calculation for reclamation potential. Service life figures were established after consultation with façade manufacturers. The reclamation value for scenarios 3 and 4 at 15- and 30-years were taken as a percentage of the service life remaining. For example, laminated glass with a service life of 25 years is taken to have 40% of its initial value when recovered at 15 years. Figure 7: Connection diagram constructed for timber-aluminium glazed curtain walling system under study Figure 7: Connection diagram constructed for timber-aluminium glazed curtain walling system under study Curtain walling framework and panel materials rarely deteriorate when considered independently. However, the multi-component nature of glass façade systems, highlighted in figure 7, means that the service life and therefore re-use potential of one component, is dependent on the service life of their nearest permanently connected neighbour component. For system and component re-use scenarios, it is necessary to factor service life in the calculation for reclamation potential. Service life figures were established after consultation with façade 2,3 and 4) calculated using equation 5. ∑ ���� �������������������� ���������������� ���� ��������� = ∑ ���� �������������������� ���������������������������� ������������������������ ���� ���� ��������� + ∑ ���� �������������������� ���������������������������� ���������������������������� ���������������� ���� ��������� + ∑ ���� �������������������� ������������������������������������������������������������ ������������������������������������������������������ �������������� �������������������� ���� ��������� (5) Transport distances in this study have been made based on the nearest recycling/remanufacturing/incineration plants. End-of-Life E Endlife accounts for the environmental impact due to the processes involved in demolition, waste processing, and disassembly for re-use using equations 6-8.
Interpretation and Results Without Service Life Consideration The environmental impact profiles for the four different EoL routes in terms of PENRE EE and GWP are shown in figure 8, with the comparison being restricted to the EoL and next use phases. A negative environmental impact indicates that energy saving has incurred by implementing a specific EoL scenario. Without the consideration for any form of performance degradation, scenario 4 provides the most environmental savings of the 4 scenarios and can therefore be considered as exploiting the system re-use potential fully (FRP=100%). Component re-use is able to exploit the FRP to 81.44% in terms of PENRE EE and 83.53% in terms of GWP. Scenario 3 is only made possible by a process that separates laminated glass. By re-using façade components in new systems, energy is saved from material extraction and production, which yields higher benefits than the avoidance of landfill by material recycling.
Scenario 2 shows a net avoided impact with the majority of material avoiding landfill and finding recycling potential in a second use as aggregate material or feedstock for secondary aluminium components. In this instance, exploiting FRP by 29.78% in terms of PENRE EE and 34.42% in terms of GWP, much less than that of component re-use. Further, the impacts of EoL processes themselves are shown to have the largest impact in scenario 2. Scenarios 3 and 4 are less affected by EoL processes because component or system re-use would not require the melting down of secondary materials to produce new products which is one of the most energy-intensive components of the EoL processing. The environmental impact associated with any reconditioning or quality assurance has been taken as negligible. Although, relatively small in relation to material production, material transportation holds a more significant contribution in the component and system re-use scenarios due to the long travel distances associated with 4 ���� ���������� = ������������������������������������������������������������������������������������������������������������ (6) ���� ����������� = ������������������������������������������������������ ���������������������������������������������������������� (7) ���� ������� = �������������������������������������������������������������������������������������������������������� (8) The environmental impact of the EoL processes can be taken as the sum of the preceding equations shown in equation 9. ∑ ���� ���������������������������� ���� ��������� = ∑ ���� ���������������������������������������� ���� ��������� + ∑ ���� �������������������������������������������� ���� ��������� + ∑ ���� ���������������������������� ���� ��������� (9) Impact Assessment The inventory data is associated with a specific environmental impact by aggregating the total quantities of all energy from the EoL and reclaim processes calculated using equation 10. ∑ �������������������������������������������������������������������������������� ∑ ���� �������������������� ���������������� ���� ��������� + ∑ ���� ���������������������������� ���� ��������� − ���� ��������� ∑ ���� �������������������������������� ���� ��������� (10) In this study, the environmental impact in terms of Embodied Energy (EE), (MJ) and Embodied CO 2 (GWP), (kgCO 2 eq.) for each scenario is
ANALYSIS: Facades finding a suitable specialist disassembly/reconditioning plant, assuming that they are likely to be situated further afield than established landfill and/or recycling facilities. In the instance where no recycling is carried out (scenario 1), a deficit is environmental benefit is found. Without Service Life Consideration The environmental impact profiles for the four different EoL routes in terms of PENRE EE and GWP are shown in figure 8, with the comparison being restricted to the EoL and next use phases. A negative environmental impact indicates that energy saving has incurred by implementing a specific EoL scenario. Without the consideration for any form of performance degradation, scenario 4 provides the most environmental savings of the 4 scenarios and can therefore be considered as exploiting the system re-use potential fully (FRP=100%). Component re-use is able to exploit the FRP to 81.44% in terms of PENRE EE and 83.53% in terms of GWP. Scenario 3 is only made possible by a process that separates laminated glass. By re-using façade components in new systems, energy is saved from material extraction and production, which yields higher benefits than the avoidance of landfill by material recycling.
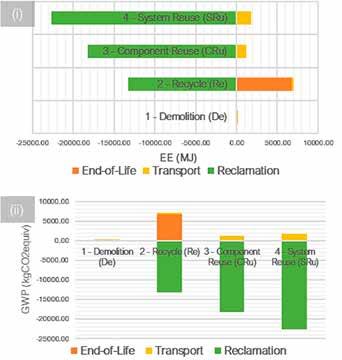
Figure 8: Comparison of Total End-of-Life Environmental Impact in terms of i.) EE (MJ) and ii.) GWP (kgCO2equiv) Figure 8: Comparison of Total End-of-Life Environmental Impact in terms of i.) EE (MJ) and ii.) GWP (kgCO2equiv )
With Service Life Interdependency Consideration It is likely that there will be some performance degradation over the façade service life. [5], [35] In this study they have been taken as a percentage of typical service life figures, proposed by industry, illustrated by the author in figure 9.
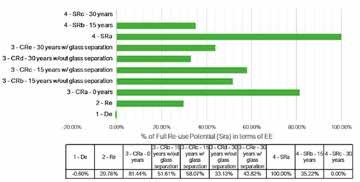
Component re-use and system re-use at a 15- and 30-year lifetime with and without a laminated glass separation process have been considered. Figure 10 highlights to what extent the scenarios achieve the full re-use potential of the system at different service lifetimes. When service life is considered the favourability of scenarios 3 and 4 over existing scenarios are less significant. Scenario 2 shows a net avoided impact with the majority of material avoiding landfill and finding recycling potential in a second use as aggregate material or feedstock for secondary aluminium components. In this instance, exploiting FRP by 29.78% in terms of PENRE EE and 34.42% in terms of GWP, much less than that of component re-use. Further, the impacts of EoL processes themselves are shown to have the largest impact in scenario 2. Scenarios 3 and 4 are less affected by EoL processes because component or system re-use would not require the melting down of secondary materials to produce new products which is one of the most energy-intensive components of the EoL processing. The environmental impact associated with any reconditioning or quality assurance has been taken as negligible. Although, relatively small in relation to material production, material transportation holds a more significant contribution in the component and system re-use scenarios due to the long travel distances associated with finding a suitable specialist disassembly/reconditioning plant, assuming that they are likely to be situated further afield than established landfill and/or recycling facilities. In the instance where no recycling is carried out (scenario 1), a deficit is environmental benefit is found. With Service Life Interdependency Consideration It is likely that there will be some performance degradation over the façade service life. [5], [35] In this study they have been taken as a percentage of typical service life figures, proposed by industry, illustrated by the author in figure 9.
ANALYSIS: Facades Figure 9: Component service life obtained from industry recommendations Component re-use and system re-use at a 15- and 30-year lifetime with and without a laminated glass separation process have been considered. Figure 10 highlights to what extent the scenarios achieve the full re-use potential of the system at different service lifetimes. When service life is considered the favourability of scenarios 3 and 4 over existing scenarios are less significant. Figure 9: Component service life obtained from industry recommendations Component re-use and system re-use at a 15- and 30-year lifetime with and without a laminated glass separation process have been considered. Figure 10 highlights to what extent the scenarios achieve the full re-use potential of the system at different service lifetimes. When service life is considered the favourability of scenarios 3 and 4 over existing scenarios are less significant.
glass can be difficult to separate when it reaches the EoL. The recovery of glass in automotive vehicles has been the subject of recent study. [39] The two existing methods of recovery have been illustrated by the author in figure 11. Laminated glass panels are comprised of one or more interlayers, sandwiched between two or more sheets of float, annealed, heatstrengthened or toughened glass. Laminated glass manufactured with a poly-vinyl butyral (PVB) interlayer (sandwiched between two flat glass sheets in more than 70% of laminated glass for architectural applications. [37] Lamination is completed in autoclave, whereby the interlayer bonds together with the glass panes at elevated temperature (110 – 140°C) and pressure (~0.8 MPa). [38] As a result, laminated glass can be difficult to separate when it reaches the EoL. The recovery of glass in automotive vehicles has been the subject of recent study. [39] The two existing methods of recovery have been illustrated by the author in figure 11. Laminated Glass Laminated glass panels are comprised of one or more interlayers, sandwiched between two or more sheets of float, annealed, heatstrengthened or toughened glass. Laminated glass manufactured with a poly-vinyl butyral (PVB) interlayer (sandwiched between two flat glass sheets in more than 70% of laminated glass for architectural applications. [37] Lamination is completed in autoclave, whereby the interlayer bonds together with the glass panes at elevated temperature (110 – 140°C) and pressure (~0.8 MPa). [38] As a result, laminated glass can be difficult to separate when it reaches the EoL. The recovery of glass in automotive vehicles has been the subject of recent study. [39] The two existing methods of recovery have been illustrated by the author in figure 11.
Disassembly for component re-use (CR) opens the opportunity to extend the service life of the system. By separating laminated glass panels for flat glass reuse, they could be re-laminated for use in new systems, leading to environmental savings of the total system (42.82%). Without some form of glass separation however, the savings from CR at 15-years would be limited to only a percentage of the laminated glass SL, and at 30-years, the performance of the laminated glass can no longer be assured so the remaining re-use potential is attributed purely to a percentage SL of the framework materials and the glass recycled as aggregate material (33.13%). This is closer to the savings from scenario 2, in which the constituent materials are recycled and re-processed into new components (29.78%)
The system re-use (SR) scenario is considerably affected by service lifetime, as the system lifetime is only as long as that of the least durable part which in this case is laminated glass. At a 15-year lifetime, the re-use potential drops from 100% at 0-years to 35.22%. At 30-years, the effects of the 25-year SL of laminated glass and 30-year SL of the IGU - due to loss in integrity of the seal around the perimeter of the system - mean that the system no longer holds re-use value as a whole system. This suggests that unless there is an appropriate non-labour-intensive method for providing performance assurance, component re-use with some form of glass separation yields the best potential for environmental savings when service life is considered. No current established method of flat glass separation currently exists. Technical Challenges in Component Re-use Little has been done to address the challenges of composite construction and permanent jointing methods in curtain walling and the IGU that may enable component re-use. Adhesive Connections Due to the desired permanent nature of the joint/seal, removal of such a connection is not considered. Whilst debonding procedures depend on the adhesive used (silicone, epoxy or acrylate), adhesives that can be de-bonded or released on command hold strong potential for simplified dismantlement and recycling. Banea et al. formed a review paper that concluded that although there exist numerous proposed methods for adhesive reversibility or de-bonding, currently, there is no generally accepted solution for the disassembly of structurally bonded joints in industry. [36] Figure 10: Comparison of EoL strategy re-use potential as a percentage (%) of FRP at 0-years (no performance degradation) with consideration for service life in each scenario. Figure 10: Comparison of EoL strategy re-use potential as a percentage (%) of FRP at 0- years (no performance degradation) with consideration for service life in each scenario Disassembly for component re-use (CR) opens the opportunity to extend the service life of the system. By separating laminated glass panels for flat glass re-use, they could be re-laminated for use in new systems, leading to environmental savings of the total system (42.82%). Without some form of glass separation however, the savings from CR at 15-years would be limited to only a percentage of the laminated glass SL, and at 30-years, the performance of the laminated glass can no longer be assured so the remaining re-use potential is attributed purely to a percentage SL of the framework materials and the glass recycled as aggregate material (33.13%). This is closer to the savings from scenario 2, in which the constituent materials are recycled and re-processed into new components (29.78%) The system re-use (SR) scenario is considerably affected by service lifetime, as the system lifetime is only as long as that of the least durable part which in this case is laminated glass. At a 15-year lifetime, the reuse potential drops from 100% at 0-years to 35.22%. At 30-years, the effects of the 25-year SL of laminated glass and 30-year SL of the IGU - due to loss in integrity of the seal around the perimeter of the system - mean that the system no longer holds re-use value as a whole system. This suggests that unless there is an appropriate non-labour-intensive method for providing performance assurance, component re-use with some form of glass separation yields the best potential for environmental savings when service life is considered. No current established method of flat glass separation currently exists.
5 Figure 10: Comparison of EoL strategy re-use potential as a percentage (%) of FRP at 0- years (no performance degradation) with consideration for service life in each scenario Disassembly for component re-use (CR) opens the opportunity to extend the service life of the system. By separating laminated glass panels for flat glass re-use, they could be re-laminated for use in new systems, leading to environmental savings of the total system (42.82%). Without some form of glass separation however, the savings from CR at 15-years would be limited to only a percentage of the laminated glass SL, and at 30-years, the performance of the laminated glass can no longer be assured so the remaining re-use potential is attributed purely to a percentage SL of the framework materials and the glass recycled as aggregate material (33.13%). This is closer to the savings from scenario 2, in which the constituent materials are recycled and re-processed into new components (29.78%) The system re-use (SR) scenario is considerably affected by service lifetime, as the system lifetime is only as long as that of the least durable part which in this case is laminated glass. At a 15-year lifetime, the reuse potential drops from 100% at 0-years to 35.22%. At 30-years, the effects of the 25-year SL of laminated glass and 30-year SL of the IGU - due to loss in integrity of the seal around the perimeter of the system - mean that the system no longer holds re-use value as a whole system. This suggests that unless there is an appropriate non-labour-intensive method for providing performance assurance, component re-use with some form of glass separation yields the best potential for environmental savings when service life is considered. No current established method of flat glass separation currently exists.
Laminated Glass Laminated glass panels are comprised of one or more interlayers, sandwiched between two or more sheets of float, annealed, heat-strengthened or toughened glass. Laminated glass manufactured with a poly-vinyl butyral (PVB) interlayer (sandwiched between two flat glass sheets in more than 70% of laminated glass for architectural applications. [37] Lamination is completed in autoclave, whereby the interlayer bonds together with the glass panes at elevated temperature (110 – 140°C) and pressure (~0.8 MPa). [38] As a result, laminated At time of writing, there are no fully-established delaminating technologies in the EU that allow for large glass panels to be effectively separated from PVB. The existing process involves destructively crushing the laminated glass panels as opposed to separating the layers whole so that the materials have to be downcycled into the manufacturing process rather than being re-used because the separated glass fragments do not have the purity content to achieve recycling into visual glass. [39] Further, any recycling of cullet still requires re-melting at high temperatures. For these reasons, it would be pertinent to devise effective separation methods for laminated glass to enable re-use to effectively increase the service life of glass and reduce the energy costs of new glazing applications. Conclusion The principal objective of this study was to understand the environmental opportunities for architectural glass façade re-use and propose the technical methods that might exploit such recovery strategies for later experimentation. Four different EoL scenarios were developed based on current and potential future separation technologies to allow comparisons in methods for design for disassembly to be recognised.
Effective consideration of the service life of the reclaimed components is essential when assessing the feasibility of re-use. For this study, remaining service life was taken as a percentage of the estimated service life proposed by industry. In reality, the reclamation value would not drop-off to zero at the end of the proposed service life from industry.
Implementing system re-use, in the instance of no performance degradation, can potentially increase environmental benefits in terms of EE by a factor of 3.4 times that of the existing recovery scenario commonly used in industry (scenario 2). However, in reality, there is some performance deterioration that takes place and when considering service life interdependencies, the significance in the savings made from system and component re-use are reduced. This is as a result of the multi-component nature of glass façade systems in which their system service life is determined by the service life of their nearest connected neighbour. As a result, with consideration for service life, system re-use shows decreasing is less favourable over longer lifetimes due to the lack of performance assurance of the internal components. This impact is likely to be more severe in more integrated systems such as those that include motorised components with a typical service life of <15 years.
Over a longer lifetime, >25 years, and without performance testing, it could be concluded that component re-use with appropriate separation methods could makes a beneficial recovery strategy, with environmental savings in terms of Figure 11: Automotive windshield EoL disposal route. 5 Figure 11: Automotive windshield EoL disposal route At time of writing, there are no fully-established delaminating technologies in the EU that allow for large glass panels to be effectively separated from PVB. The existing process involves destructively crushing the laminated glass panels as opposed to separating the layers whole so that the materials have to be down-cycled into the manufacturing process rather than being re-used because the separated glass fragments do not have the purity content to achieve recycling into visual glass. [39] Further, any recycling of cullet still requires re-melting at high temperatures. For these reasons, it would be pertinent to devise effective separation methods for laminated glass to enable re-use to effectively increase the service life of glass and reduce the energy costs of new glazing applications. Conclusion The principal objective of this study was to understand the environmental opportunities for architectural glass façade re-use and propose the technical methods that might exploit such recovery strategies for later experimentation. Four different EoL scenarios were developed based on Figure 11: Automotive windshield EoL disposal route At time of writing, there are no fully-established delaminating technologies in the EU that allow for large glass panels to be effectively separated from PVB. The existing process involves destructively crushing the laminated glass panels as opposed to separating the layers whole so that the materials have to be down-cycled into the manufacturing process rather than being re-used because the separated glass fragments do not have the purity content to achieve recycling into visual glass. [39] Further, any recycling of cullet still requires re-melting at high temperatures. For these reasons, it would be pertinent to devise effective separation methods for laminated glass to enable re-use to effectively increase the service life of glass and reduce the energy costs of new glazing applications. Conclusion The principal objective of this study was to understand the environmental opportunities for architectural glass façade re-use and propose the technical methods that might exploit such recovery strategies for later experimentation. Four different EoL scenarios were developed based on
EE by a factor of 1.95 times that of the recycling recovery scenario. From an energetic and environmental perspective, component and system re-use hold large potentials in primary energy and embodied carbon savings, with some form of separation process to recover constituent components, performance assurance that could extend the theoretical service life of components together with a functional glass collection and recovery supply-chain. Without such processes in places, the recycling scenario may hold the greatest environmental benefit for the treatment of glass curtain walling units at the EoL.
The existing trajectory of façade design evolution creates sufficient challenges in reclaiming glass from existing systems when the façade reaches its EoL. Future regulation may add to manufacturer responsibility that requests details of hosw new façade systems will be recovered. Rising levels of refurbishment are likely to continue to open up opportunities to recover glass from existing stock for re-use. Further, structural adhesives are increasingly replacing bolted connections and there may be new advances in the production of specialised glass in the decades to come. At present there is no established methodology to overcome the technical issues of curtain walling disassembly for maximum material recovery within existing buildings.
Future Research Outcomes It is necessary to extend the study of the relative environmental impact of different end-of-life routes to different types of façade system to highlight what early-stage design decisions would achieve the most significant savings on the whole-life-cycle and recoverability of constituent materials. There exists a lack of consensus among studies calculating and documenting service life data constituent materials and systems of a glazing unit. Different elements can respond differently to external influences allowing for each to have a different lifespan over which they degrade and/or eventually fail meaning that there are a large number of uncertainties involved in predicting the service life and therefore
salvage value of components. Research into the typical depreciation rates is necessary to help define the actual residual reclamation value at any point in time during the glazed façade life. Further, it would be useful to extend the LCIA to other indicators such as those that consider the scarcity of each resource and the avoidance of landfill. This would be made possible with access to a more complete eco-inventory database. An extended assessment should make considerations for the initial application of recycled content in designs and the use of renewable energy in material processing to ensure the benefits of re-use are not over-estimated.
The existing barriers and motivations to glass façade re-use as expressed by industry through a semi-structured interview will be published in a separate review paper. While there is a lack of clarity on the properties of materials and complexity of modules in the types of construction components used in the sector, there will be significant barriers to re-use. [21] Planned research by the authors in this area looks to address the technical challenges in re-using flat glass by experimentally investigating separation methods for separation of laminated glass and joints of aluminium and glass bonded by epoxy and silicone. The development of new debonding technologies and design methods can be fed back into the environmental assessment to promote the uptake of more sustainable designs.
By considering a multi-method approach to address the challenges of re-use in the glass façade supply-chain, it will establish the opportunities to recover high-value façade material from existing building stock. Further, it will provide key indicators for future design consideration to allow for initial design and future deconstruction to clearly relate to one another to deliver buildings that truly consider whole-life energy.
References A full list of reference is available on request.
Container Glass Tableware Beverage Processing Handling / Assembly
Bulk Materials

We are your partner for innovative and customized solutions in automation technology.
In focus
AGI: UPGRADES CONTINUE TO DRIVE BUSINESS
HSIL Ltd’s packaging product division, AGI Glaspac, (better known as AGI) was established in 1972. They manufacture high quality glass containers to meet stringent and demanding quality and standards for packaging needs of foods, pharmaceuticals, soft drinks, spirits, beer, wine and other industries. The company has positioned itself as one of the leading container glass manufacturers in the country. Currently, the company melts 1,600 tonne of glass per day. Take us through the history of AGI Glaspac, from its inception to the present day: AGI was established in the year 1972 with a capacity of 80 tonne/day (TPD). In 1981, HSIL Ltd acquired AGI and upgraded the furnace capacity to 180 TPD. In 1996, we achieved its first ISO 9000 certificate. In 2000, the first new furnace (F-2) was added, which increased the capacity to 450 TPD. In 2004, the second new furnace (F-3) was added to raise the capacity to 600 TPD. In 2009, a new greenfield plant was started at Bhongir with the third new furnace (F-4) of capacity 500 TPD, which raised the capacity to 1,100 TPD.
In 2011, the company exported its first consignment. In 2012, the fourth new furnace (F-5) was added, which increased the capacity from 1,100 TPD to 1,600 TPD with a colouring forehearth. It is also the largest container glass manufacturing facility at a single location in Asia. In 2016, electrostatic precipitators were installed to reduce SOX, NOX and CO2. In 2017, the company introduced TPM, LEAN and Six Sigma. In 2019, we invested in natural gas to curb carbon emissions. We also installed machinery like end-of-the-line packaging for robotic case packer, case palletiser, cullet washing system, automated dry optical sorting system etc. How is the glass packaging industry performing in India? What is the rate at which the company is growing? The glass industry in India is quite old and well established. It remained largely a cottage industry for a long time. In recent years, the industry has transformed from rudimentary mouth-blown and hand-working processes, to adopt modern processes and automation in a big way. However, Indian per capita consumption for glass packaging (1.8kg) is much lower compared to other nations. The following graph shows the comparative consumption in other countries
What about Per Capita consumption? The company currently meets approximately 20 per cent of the glass container demand in the country. It plans to increase its capacity by more than 50 per cent in the coming three years. We are present in all the important segments of the glass containers. We are working closely with customers to deliver value in the supply chain and to identify micro opportunities and cater to them. The company has invested in resources like R&D, machinebuilding, machinery and automation so that the best products can be delivered to our customers with the present infrastructure. In an interview between regional media Rajesh Khosla, president & CEO, AGI glaspac, talks about the company’s growth, prospects of glass replacing plastics, technology innovations and so on.
What are the prospects for the growth of the glass packaging sector in India? Despite the low per capita levels, the country’s glass container industry is buoyant, with downstream demand from local beverage, alcohol, food, pharmaceuticals and cosmetics industries. The industry is experiencing a surge in demand, due to the growing purchasing power, urbanisation, modern retail and increasing awareness about health and hygiene among consumers. The industry’s prospects are likely to improve even further in the future due to rising disposable income and India’s GDP rate in the short- and medium-term. The local economy, which remained mostly unaffected by the global financial crisis, has been a major aid for the glass container industry, allowing manufacturers to grow even during these uncertain times.
Tell us about your clients in the food and beverage industry. We deliver our products to segments like beer, chemicals, food, coffee, liquor, pharma, soft drinks, beverages, wine and water bottles. We also have our retail B2C segment, with a brand called “Greendrop Glassware,” where we sell our bottles in e-commerce sites like Amazon, Flipkart, Snapdeal etc.
Our clients from the food industry are The Global Green Company, Heritage, Reitzal Koeleman, Nestle, HUL and from beverages, Coca Cola, Parle Agro and PepsiCo.
Our clients in other segments include ABInBev, Bira91, UB Group, Avantor, Thermofisher, Dr Reddy, GSK, Pfizer and Diageo, amongst others.
What are the prospects of glass replacing plastics? We are gearing up to support India’s vision to replace plastic with green and environmentally friendly product glass. We have expanded our capacity to meet the rising demand. Since plastic is lighter in weight and easier to use, glass uses new technology to match the characteristics of plastics. NNPB can produce the best glass bottles, and the current trend is tempering, using appealing colours and other value additions. We are also tailoring our supply chain to cater to the market. One of the initiatives is our retail segments Greendrop Glassware, which deals with B2C and with e-commerce.
What are the challenges currently being faced by the glass industry in India? Glass packaging continues to face fierce competition from other forms of packaging in India. Competition from alternative materials is increasing. Some reasons why customers do not use glass are loadability,
Despite low per capita levels, the country’s glass container industry is buoyant breakages and unit cost. The industry needs to develop more lightweight bottles and improve the durability of its finished products to compete in the market.
In the past, the local container glass industry has concentrated its efforts on such objectives as traceability to restrict counterfeiting. Such an initiative would involve the use of permanent engravings on containers, showing the quarter and year of manufacture. This system could be helpful to protect consumers from any harmful practices employed by spurious product manufacturers.
What technology innovations are you adopting? We are trying to set new trends in the industry by leveraging technology to create innovative products that will help meet the already existing demand more efficiently.
Some of them include: • Adopting new tempering method for strengthening glass containers • Creating lightweight containers in different geometric shapes • Using newer technologies like single-stage forming to produce thinner but stronger glass containers • Developing a coating on the surface of the glass to avoid strength loss • Creating heat-resistant Pyrex glass • Creating internal embossing glass bottles
Finally, what are the main future plans you have at present? We have already invested in the upgradation of our plant. Our investments are in technology upgradation, inspection, packaging systems, warehousing and logistics. We are also looking at increasing our volumes by at least 50 per cent in the next three years.
Our customer base comprises a host of multinational and Indian companies in various business segments. The domestic market is our priority, and we have a clear policy that we would not like to export at the cost of domestic demand. The additional capacity is used for exports to regions like North America, Europe, Africa, Canada, as well as the APAC regions.


M ED I A SU PPO RT


2N D

SU PPO RTED B Y: ASO CI ACI Ó N D E D I STRI B U I D O RES D E VI D RI O Y CRI STAL
EXPO GUADALAJARA 27-29 JULY 2020 GUADALAJARA, JALISCO

Organized By: YT International Enterprise Inc.
Window on INDONESIA
Table 1
2015 23,527,720 2016 32,601,840 2017 23,495,884 2018 24,212,061 Total float glass exports (sq metres)
Table 1
2015 1,999,727 2016 2,910,108 2017 6,887,010 2018 7,953,859 Total float glass imports (sq metres)
Table 1

India 7,192,684 Thailand 4,304,995 Malaysia 2,602,504 Viet Nam 1,652,531 Rep. of Korea 1,257,534 Australia 995,626 Japan 1,094,588 Philippines 995,164 Leading float glass export destinations (sq metres)
Table 1
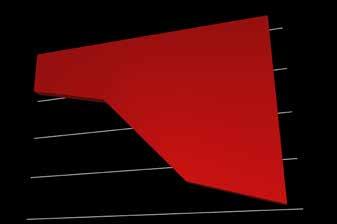
Malaysia 5,443,794 China 1,815,349 Thailand 267,477 Japan 208,342 India 153,147 Leading float glass import sources (sq metres)
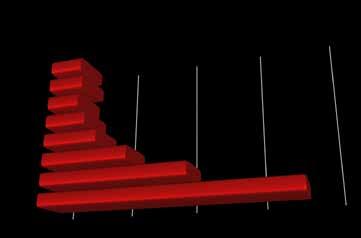
1
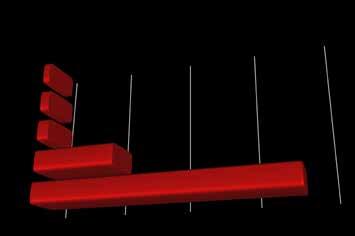
Table 1
2015 53,235,309 2016 44,669,689 2017 23,817,173 2018 56,977,567 Total container glass exports (Kg)
Table 1
2015 73,634,415 2016 117,717,040 2017 142,587,241 2018 124,138,434 Total container glass imports (Kg)
Table 1

Philippines 27,942,967 New Zealand 10,361,319 Australia 4,143,178 Papua New Guinea 4,051,272 Viet Nam 3,739,553 Malaysia 1,408,684 USA 1,248,870 Leading container glass export destinations (Kg)
1
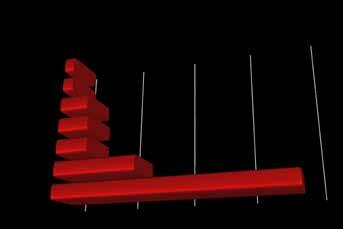
Table 1
2015 56,523,276 2016 102,042,375 2017 114,294,176 2018 87,915,894 Container glass imports from China (Kg)
1
China 87,915,894 Thailand 20,412,567 Malaysia 2,132,192 India 5,258,207 Rep. of Korea 1,244,210 France 1,085,610 Viet Nam 1,753,010 Leading container glass import sources (Kg)

1
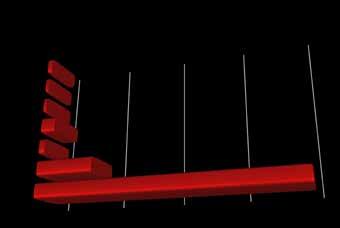
2015 2016 2017 2018
Table 1
Vietnam Thailand 71 6,020,294 2,522 6,677,508 7,546,052 12,215,689 1,753,010 20,412,567
1
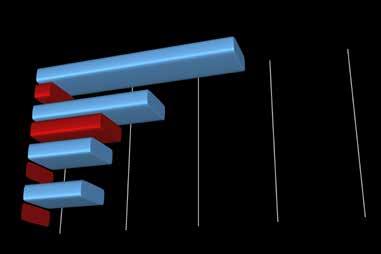
Refractory Zone
Noranada solves Union disputes
Jamaica
Noranda Bauxite has been facing a few obstacles in keeping a leg up in the local bauxite/alumina industry. However the public-private partnership (PPP) entity has now settled all wage disputes with three leading trade unions representing its approximately 800 workers.
Although the negotiations with the three unions — Bustamante Industrial Trade Union (BITU), Union of Technical, Administrative and Supervisory Personnel (UTASP and the University and Allied Workers Union (UAWU) — lasted approximately two years, the new agreements are expected to maintain a high level of production at Noranda installations and critically reduce the threat of work stoppages for another two years, at least.
The last of the three agreements was signed last week with the UAWU, which represents the production staff, and will continue through to April 30, 2023. The agreement with the BITU, which represents clerical and administrative employees, will be the earliest to end, as it concludes on December 31 this year. The agreement with UTASP, which represents the supervisors, will end on December 31, 2022.
Noranda Jamaica Bauxite Partners, formerly St Ann Bauxite Jamaica Limited and prior to that Kaiser Jamaica Bauxite Company, is a partnership between Noranda Bauxite Limited (NBL), a Jamaican limited liability company, and the Government of Jamaica. Noranda Bauxite Limited has a 49 per cent interest in the partnership and holds and operates the physical mining assets and operations. The Government of Jamaica owns the majority 51 per cent.
The negotiations led to an agreement with New Day which, according to Minister of Transport and Mining, Robert Montegue, was necessary to protect the interest of the Government and people of Jamaica, while considering the best options for all parties involved.
Noranda mines bauxite ore in St Ann, which is shipped to its plant at Gramercy, Louisiana, and refined into alumina (aluminum oxide). Noranda then converts the alumina into aluminum at its smelter in Missouri.
A concession from the Government permits Noranda Bauxite Limited to mine bauxite in Jamaica through 2030. However, there have been a few hiccups recently with anti-mining activists in the Cockpit Country insisting against any mining within that area.
However, with the labour issues now a part the long history of the bauxite company, which actually started in Jamaica as the once-giant American firm Kaiser Aluminum in 1967, Noranda can focus more on assuring Jamaicans of its corporate responsiveness, as well as making use of any possible growth fed by the insistent tariffs introduced by the Trump administration which should boost US demand for aluminum.
Noranda’s company Chairman and CEO David D’Addario suggested, after the negotiations with the local trade unions concluded last week, that a strong WRA elects new chairperson
World
Carol Jackson, Chairman and CEO of HarbisonWalker International (HWI), has been elected as the incoming president of the World Refractory Association (WRA). Jackson began her two-year term in January 2020, succeeding Stefan Borgas, CEO RHI Magnesita, who has led the organisation since January 2018.
“I’m honoured to lead WRA through its next chapter and continue building on the tremendous momentum our organisation has achieved under Stefan’s leadership,” said Jackson. “As the global voice of the refractory industry, it is imperative for us to unify and advance the common interests of this trade association, as we promote the value and criticality of refractory in manufacturing to all our stakeholders.”
Formed in 2014, WRA has grown from 12 to 22 members in the last two years and has itself become a member of the World Steel Association (WSA). Under Borgas’ leadership, the WRA established working groups (Digital Data Standards, HS Codes, International Standards, Environmental Standards, Online Repository of Technological Papers, Communications Committee) to address specific areas of interest to the global refractory industry and its stakeholders. It also hosted the industry’s first Innovation Conference in China in fall 2018.
Jackson said that the success in adding and engaging membership under Borgas’ leadership paves the way for WRA to focus on continued growth and further elevate member engagement. She also affirmed that priorities for the organisation would centre around technology and innovation, sustainability, safety, customer collaboration, and communication initiatives to help unlock the full relationship with them is necessary for the success of its Jamaican bauxite operations.
“When we acquired Noranda Bauxite and 50 years of mining rights in Jamaica, we committed to the Government that we would work to reach fair agreements and enhance the stability of our unionised workforce,” D’Addario said.
“These three union agreements demonstrate that we have fulfilled that promise, while helping to ensure that our employees remain among the most well-compensated in Jamaica,” he added.
The point was seconded by Delroy Dell, Noranda Bauxite’s general manager, who noted that the workforce was the backbone of Noranda’s operations in Jamaica.
“The negotiations were tough but fair, and we are proud to work cooperatively with these unions to strengthen our worker protections, and provide fair wages to all our employees,” Dell stated.
“I want to thank the union representatives, and our own executive team, for collaborating on these vital agreements,” he added.
Noranda Bauxite is the bauxite mining operation of New Day Aluminum Holdings, LLC, which also owns and operates Noranda Alumina, a smelter grade alumina refining operation in Gramercy, Louisiana. New Day also owns and operates Niche Chemical, which markets chemical-grade alumina in North America, along with specialty minerals businesses Niche Fused Alumina in La Bâthie, France and Niche Fused Magnesia in Hull, England.
value potential of the refractory industry.
“Through my role with WRA, I’m looking forward to applying the passion and intensity that is inherent in our HWI culture to help guide the interests of our global industry. HWI has been a refractory leader and innovator for more than 150 years, and we are intensely at work to evolve our company for the next 150 years. Our company goals and focus on innovation closely parallel the objectives of WRA,” said Jackson.
Borgas wishes Jackson every success in the task ahead: “The refractories industry is facing numerous hurdles. The will to innovate within the industry came just in time. But the next challenges are already waiting. The macroeconomic situation is difficult for our business and we also have a major responsibility in the fight against the climate crisis. Carol Jackson will represent the refractories industry with a courageous and strong voice. She will steer us through these stormy times with a safe hand.”
A wealth of exciting opportunities…
✷ ON-PAGE: full and half display advertising ✷ DIGITAL: full and half display advertising…and more! ✷ DUMMY COVERS: the ultimate, high impact creative… take ownership of the issue ✷ BELLY-WRAPS: high profile, hard-hitting message conveyance
AG19-6 ● ● ● ● ● ● ● ● ● ● ● ● ● ● ● ● ● ● ● ● ● ● ● ● ● ● ● ● ● ● ● ● ● ● ● ● ● ● ● ● ● ● ● ● ● ● ● ● ● ● ● ● ● ● ● ● ● ● ● ● ● ● ● ● ● ● ● ● ● ● ● ● ● ● ● ● ● ● ● ● ● ● ● ● ■ Vietnam: a country in focus ■ Asia: the business of recycling OF 2019 !! FINAL ISSUE
■ China: an auto glass investor ■ Asian ultrathin: movers and shakers SEE US AT: Architectural Glass Ukraine; Baku Glass 2019; FREE WITH THIS ISSUE - THE 2020 YEARPLANNER!
AG20-1 ● ● ● ● ● ● ● ● ● ● ● ● ● ● ● ● ● ● ● ● ● ● ● ● ● ● ● ● ● ● ● ● ● ● ● ● ● ● ● ● ● ● ● ● ● ● ● ● ● ● ● ● ● ● ● ● ● ● ● ● ● ● ● ● ● ● ● ● ● ● ● ● ● ● ● ● ● ● ●
■ Façade recycling and re-use ■ Turkey: a country in focus ■ Fenestraton trends: a window for today? ■ Make-up your mind: cosmetic packaging trends ■ Safety glass standards: matching requirements
EVENTS: Glassman Asia, PV Japan, Eurasia Glass, Door & Window China, Glass Middle East, Egypt
AG20-2 ● ● ● ● ● ● ● ● ● ● ● ● ● ● ● ● ● ● ● ● ● ● ● ● ● ● ● ● ● ● ● ● ● ● ● ● ● ● ● ● ● ● ● ● ● ● ● ● ● ● ● ● ● ● ● ● ● ● ● ● ● ● ● ● ● ● ● ● ● ● ● ● ● ● ● ● ● ● ●
■ Packaging: profiles and penetration ■ ASEAN float glass supply dynamics ■ Safety glass on the sub-continent ■ Bonding and binding: silicones in Japan ■ Southern China glass facades
EVENTS: China Glass, Mir Stekla
AG20-3 ● ● ● ● ● ● ● ● ● ● ● ● ● ● ● ● ● ● ● ● ● ● ● ● ● ● ● ● ● ● ● ● ● ● ● ● ● ● ● ● ● ● ● ● ● ● ● ● ● ● ● ● ● ● ● ● ● ● ● ● ● ● ● ● ● ● ● ● ● ● ● ● ● ● ● ● ● ● ●
■ Glass façade inspection ■ Keeping up appearances: container glass decoration ■ Bangladesh: a market in focus ■ Ultrathin glass: supply/demand dynamics ■ Solar futures: an ASEAN approach to BIPV
EVENTS: Intersolar Europe, Glassman Latin America, Glassbuild America, SNEC
AG20-4 ● ● ● ● ● ● ● ● ● ● ● ● ● ● ● ● ● ● ● ● ● ● ● ● ● ● ● ● ● ● ● ● ● ● ● ● ● ● ● ● ● ● ● ● ● ● ● ● ● ● ● ● ● ● ● ● ● ● ● ● ● ● ● ● ● ● ● ● ● ● ● ● ● ● ● ● ● ● ●
■ Automotive glass in the Middle East ■ Container glass: a new corporate landscape ■ Energy efficient glazing: a future hope? ■ Putting the fizz back: beverage packaging trends ■ PLUS: Adaptive facades using thin glass
EVENTS: Glasstec, World Soda Ash
AG20-5 ● ● ● ● ● ● ● ● ● ● ● ● ● ● ● ● ● ● ● ● ● ● ● ● ● ● ● ● ● ● ● ● ● ● ● ● ● ● ● ● ● ● ● ● ● ● ● ● ● ● ● ● ● ● ● ● ● ● ● ● ● ● ● ● ● ● ● ● ● ● ● ● ● ● ● ● ● ● ●
■ Container glass production costs ■ Indonesia: benders and shapers ■ Future glass for a modern Asia ■ Thin glass in façade construction ■ Chinese auto glass markets
EVENTS: ZAK Glasstech, Glasstech Asia
AG20-6 ● ● ● ● ● ● ● ● ● ● ● ● ● ● ● ● ● ● ● ● ● ● ● ● ● ● ● ● ● ● ● ● ● ● ● ● ● ● ● ● ● ● ● ● ● ● ● ● ● ● ● ● ● ● ● ● ● ● ● ● ● ● ● ● ● ● ● ● ● ● ● ● ● ● ● ● ● ● ● ■ Thailand: a glass industry in focus The AG Yearplan ner! FREE INSIDE
■ State of the Art: the perfect Asian container factory ■ Vacuum insulated glass: an outlook ■ Scale of the problem: thin glass upgrades ■ Float futures for China
EVENTS: Architectural Glass Ukraine, PV Japan '21
FREE INSIDE: YOUR 2021 YEAR PLANNER
Maximise your exposure, maximise your budget…
find out how by contacting: Paul Russell, Tel: +44 (0) 208 638 0619 Email: prussell@asianglass.com

India
RHI Magnesita serves industries as diverse as steel, cement, non-ferrous metals and glass. With a turnover of Euro 3.1 billion, 35 production sites and 14,000 employees, the refractory behemoth serves more than 10,000 customers globally. Its shares have a premium listing on the London Stock Exchange and are a constituent of the FTSE 250 index.
RHI Magnesita has been operating in India through its three subsidiaries – the BSE/NSE-listed Orient Refractories Ltd, RHI Clasil Pvt Ltd and RHI India Pvt Ltd. Together, they provide refractory products and refractory management services to many large and mini steel plants in India. The company is in the process of integrating its Indian subsidiaries to form one listed entity in India, which would emerge as the largest single refractory solutions platform in India offering the industry’s most comprehensive product portfolio. The merger scheme is currently under NCLT hearings and is expected to be completed before the end of the calendar year.
Moreover, as part of its 2022 strategy, the company is looking at inorganic growth in the Indian market with above-average level of investments. The refractory services provider has recently made a small acquisition of a metallurgical equipment manufacturing company in Mumbai. Further, it has inked an asset purchase agreement to acquire a plant and certain other assets of another Indian refractory maker in Cuttack, Odisha. RHI Magnesita India MD and CEO, Parmod Sagar, was in Kolkata recently and in conversation with Steel 360 dwelt at length on the company’s technological offerings, its business developments in India and the challenges it is likely to confront.
Growth forecast “RHI Magnesita plans to strengthen its footprint in India at a time when steel capacity enhancement and unprecedented rise in steel consumption have turned India into the rising star of the global steel industry. We have already acquired two companies in the country. One is a small Mumbai-based metals company that manufactures slide gate-handling mechanisms. So, there is a refractory and there is another machine that operates that refractory. This company is currently a 100% subsidiary of Orient Refractories Ltd,” Sagar informed. “This year,” he continued, “we have also concluded an asset purchase agreement with Manishri Refractories & Ceramics Pvt Ltd. This plant is in Cuttack. As part of the agreement we have acquired the land, building and equipment of the said company. As it is an asset deal, we haven’t acquired the company’s business. And we are planning to put up a magnesia carbon production facility at the plant. It will be the company’s first such production facility in India.” Dwelling on the refractory market in India and RHIM’s valued customers, Sagar said: “Almost all the integrated steel manufacturers are our customers like the JSPL Group and the Tata Group. Earlier, Bhushan Steel was a valued customer until it was acquired by the Tata Group.”
Technology leadership Responding to a query as to how competitive the Indian market is for RHIM, Sagar commented: “There are two distinct segments in the market. First is the high-end product segment that calls for the utilisation of high-end technology. We don’t have many competitors in this segment and we are the market leader in technology. However, in the commodities segment the competition is stiff. There are Chinese traders and a lot many small players competing for space. However, we are hopeful that the merger of our Indian subsidiaries would definitely be a big boost to our business. We will have a bigger product portfolio, be in a position to offer full line solutions to our customers and manage resources far more efficiently.” Speaking about RHIM’s focus on the South East Asian markets, Sagar observed: “We have a strong presence in the emerging South East Asian markets and would like to consolidate our position further. Many RHIM products from India are exported to other parts of the region.” Commenting on the company’s thrust on technology, Sagar
United States RHI moves on MORCO
RHI Magnesita, the leading global supplier of high-grade refractory products, systems and solutions, acquired Missouri Refractories Co, Inc. (MORCO). “With its more than 45 years of experience in fulfilling the needs of demanding, highly loyal and satisfied customers, MORCO perfectly fits into RHI Magnesita’s strategy to strengthen our position in the North American refractory market. The dedicated team in Pevely, MO, truly is an asset that will contribute to RHI Magnesita’s success in the whole region,” said Stefan Borgas, CEO RHI Magnesita.
The site is strategically located in the Midsouth of the United States, a region that is rapidly growing in importance for RHI Magnesita. It produces over 400 high-quality monolithic mixes, which serve a multitude of industries, including steel, cement, lime and glass. The employees also have the expertise to provide refractory material for the petrochemical industry. “As a global leader, we look forward to continuing MORCO’s success story and servicing all of the existing customers. In addition, we will open up new opportunities, grow the business and develop new markets for all of these high-quality products and applications,” added Borgas.
RHI Magnesita is the leading global supplier of high-grade refractory products, systems and solutions which are indispensable for industrial high-temperature processes exceeding 1,200°C in said: “We have a state-of-the-art manufacturing facility in Vishakhapatnam and a state-of-the-art R&D centre is coming up in Bhiwadi, an industrial township. RHIM has two global R&D centres in Leoben, Austria, and Contagem, Brazil. The third is coming up in Bhiwadi. It will take about one-anda-half years to be fully functional. The technology centre will streamline our R&D operations in India.” Highlighting the company’s mining operations that are spread across the globe, Sagar said: “There are not much refractory raw material reserves in India. There are some bauxite reserves and small reserves of magnesia which are basically low-grade, unsuitable for RHIM’s high-end products.”
“India and China are our two major markets due mainly to their strong steel fundamentals. Prices are softening in the US and Europe and end-demand remains weak. However, our look-east policy has not been adopted to offset that loss. We are looking at cementing our position in the growth hubs of the global steel industry. We know which are the global growth hubs of the steel industry and are focusing on those regions. In China, for example, the revival of the dolomite plant in Dalian will contribute in a big way to boosting our sales volumes,” he said.
RHI Magnesita’s main client base is the global steel industry. Sagar said: “Around 85% of our customers are from the steel industry. The rest are from nonferrous industries like cement, chemicals and glass. Now, we all know the importance of recycling in the steel industry and its impact on sustainability. As a leading global supplier of refractory materials we understand the importance of recycling and reusing materials. As an eco-friendly manufacturer, we focus on increasing the share of secondary raw materials in manufacturing.”
Expressing optimism about RHIM’S growth prospects in India, Sagar averred: “Initially, we are looking at growth of around 6% CAGR if steel fundamentals remain strong. With the government’s focus on increasing per capita consumption of steel in the country, we are hopeful of growing at a rate of around 7% per annum.”
a wide range of industries, including steel, cement, non-ferrous metals and glass. With a vertically integrated value chain, from raw materials to refractory products and full performance-based solutions, RHI Magnesita serves customers in nearly all countries around the world. The Company has a high level of geographic diversification with more than 14,000 employees in 35 main production sites and more than 70 sales offices around the world. RHI Magnesita intends to leverage its global leadership in terms of revenue, scale, product portfolio and diversified geographic presence to target strategically those countries and regions benefitting from more dynamic economic growth prospects.
Features include
AG20-2
Packaging: hopes and profiles
ASEAN float glass supply dynamics
Safety glass on the sub-continent
Is this your own copy? subscribe online at www.asianglass.com AG20-2
Is this your own copy? subscribe online at www.asianglass.com
AG20-2
Inside: Packaging options in the mix ASEAN float glass supply Sub-continent safety glass Southern China facades PLUS! news, views, analysis and much, much more! C H I N A G L A S S S H A N G H A I SEE US AT: MIR STEKLA, MOSCOW See us at AG Covers_CURRENT.indd 1 Inside: Packaging options in the mix ASEAN float glass supply Sub-continent safety glass Southern China facades PLUS! news, views, analysis and much, much more! C H I N A G L A S S S H A N G H A I SEE US AT: MIR STEKLA, MOSCOW See us at AG Covers_CURRENT.indd 1 10/02/2020 12:19 MIR STEKLA, MOSCOW See us at CHINA GLASS BEIJING See us at

CAN YOU AFFORD TO MISS OUT? CONTACT US TO SUBSCRIBE TODAY, OR USE THE FORM IN THIS ISSUE: T: + 44 (0) 208 123 0839 E: enquiries@asianglass.com www.asianglass.com
Et voilà !


Your inspection machine is now equipped with NEO Intelligence.
NEO intelligence inside Packed with innovations, NEO Intelligence propels your inspection machine into the 4.0 era. Your EVOLUTION machine is now intelligent and connected. Defect recognition, easy settings, hot end alerts and trend analysis are all new features from which your production can benefit.
All existing IRIS machines can be upgraded with NEO Intelligence. Contact us to upgrade your machine.
Meet Us in
A12 Platinum Sponsor Visit us at Booth No.
Egypt International Exhibition Centre February 27-29, 2020
CREATING LANDMARKS
OUR PRODUCTS
Clear Float Glass Automotive Quality Architectural Quality Silvering Quality Tinted Float Glass Sky Blue Euro Grey Euro Bronze Dark Bronze
Egyptian Grand Museum Sky Blue - Euro Grey - Clear