POPULAR ANNUAL FINANCIAL REPORT


For the Fisical year ended June 30, 2022
City of Suffolk, Virginia


For the Fisical year ended June 30, 2022
City of Suffolk, Virginia


The 2022 Popular Annual Financial Report (PAFR) is a report for our citizens. It provides you and other interested parties with an overview of the City’s financial results. This report is prepared to increase awareness throughout the community of the City’s financial operations; therefore, it is written in a user-friendly manner. The information is derived from the audited financial statements in the City’s 2022 Annual Comprehensive Financial Report (ACFR), our formal annual report.
To conform with generally accepted accounting principles (GAAP), the ACFR must include the City’s component units and the presentation of individual funds in much more detail, as well as full disclosure of all material events, financial and non-financial. The 2022 ACFR was audited by Cherry Bekaert LLP and has received an unmodified or “clean” audit opinion.
Unlike the ACFR, the PAFR is not an audited document and does not include details by fund nor does it include other disclosures required by GAAP. The PAFR is not required to present the same level of detail as the ACFR and, therefore, does not fully conform to GAAP.


This report, in a summarized version, highlights the overall financial condition and trends of the City. For more in-depth information, you may obtain a copy of the ACFR on the City’s website at www.suffolkva.us/ACFR-21-22, or by contacting the Finance Department at (757) 514-7500.
Last year, the City’s PAFR won the Government Finance Officers Association Award of Excellence.
The Government Finance Officers Association (GFOA) has been promoting the preparation of high quality popular annual financial reports since 1991. More than 140 governments participate in the program each year. The Popular Annual Financial Reporting Awards Program is specifically designed to encourage state and local governments to prepare and issue a high quality popular annual financial report. The PAFR can play an important role in making financial information accessible to ordinary citizens and other interested parties who may be challenged by more detailed traditional financial reports. Additional details can be found at the GFOA website: www.gfoa.org

On behalf of the Suffolk City Council, it is my pleasure to present the 2022 Popular Financial Report to our citizens. The past year has been another remarkable twelve months for the City of Suffolk. We continue to attract significant growth as families and businesses recognize that there are unlimited opportunities and a superior quality of life within our 430 square miles.
We are in an enviable position in that our greatest challenge is managing new growth within the City. We must remain focused on ensuring our growth is well planned, preserves the unique character of our city, and is designed to enhance the quality of life for all citizens.
The City’s Triple AAA Bond Rating was reaffirmed this year by all three rating agencies. Fitch, Moody’s Investors Service and S&P Global Ratings all recognized the city’s strong financial position. Our fiscally conservative approach to budgeting combined with strong management and an outstanding forecast for the future are key considerations in achieving this coveted designation. The Triple AAA rating allows us to borrow at the lowest rates in the market saving Suffolk’s taxpayers millions of dollars in debt service.
Economic uncertainty has been a top concern for many Americans in recent months. Despite the numerous challenges faced by cities nationwide, Suffolk has done exceptionally well. In a recent study by SmartAsset, 494 of the largest cities were analyzed Using metrics such as population growth, income, GDP, businesses, housing and changes in employment. I am pleased to report that the City of Suffolk was the only city in the Commonwealth of Virginia to be amongst the top 100 with a ranking of #76 in the nation. Our city experienced a 3.12% average yearly GDP growth, a 7.75% growth in population,
a 9.55% growth in the number of businesses and a 9.28% growth in housing units.
Maintaining this laudable trend will require a significant allocation of resources directed to public safety, infrastructure and education. It should be noted that 61% of local tax dollars were dedicated to public safety and education.
I am elated to report that Suffolk is quickly approaching its goal of enabling access to the internet for all Suffolk citizens. Broadband is an essential service that provides educational opportunities, access to healthcare services and promotes economic growth. The Virginia Telecommunication Initiative (VATI) grant provided significant funds to enable the installation of 2,000 miles of fiber and connect over 12,000 users. Reliable and affordable highspeed internet will now be available to many of our previously under-served residents.
The Route 58/Holland Road Corridor
Improvement project is approaching the halfway mark. This $77 million dollar investment is the largest road improvement project in the history of our city. It will provide substantial traffic mitigation and allow an easier commute for our citizens using this corridor. Completion is projected for December 2024.
We can tout the past, but it is incumbent upon us to prepare for the challenges that lie ahead.
Suffolk is thriving and opportunities are abound for all to enjoy and prosper. I am amazed at what has been accomplished during the past year. Every day we are building and planning for tomorrow.
The City of Suffolk is strong and well positioned for further success. Our vast land mass, business friendly climate, work force, proximity to the Port of Virginia, transportation network and high quality of life continue to support the statement, “It’s a good time to be in Suffolk!”
Mayor Michael D. “Mike” Duman


“Suffolk is thriving and opportunities are abound for all to enjoy and prosper. I am amazed at what has been accomplished during the past year. Every day we are building and planning for tomorrow.”
The City of Suffolk is governed by an at-large official Mayor and seven City Council members who are elected by borough. Appointed by the Council, the City employs a full-time City Manager, Albert Moor II, P.E., to oversee the daily operations of the city.


The Suffolk City Council has an established vision for the City which sets the course for Suffolk over the next 13 years.
A unique blend of agricultural and urban landscapes, Suffolk encompasses 400 square miles of land - making it the largest city in the state by land mass. As well, it’s scenic 30 square miles of water is home to the beautiful Great Dismal Swamp.
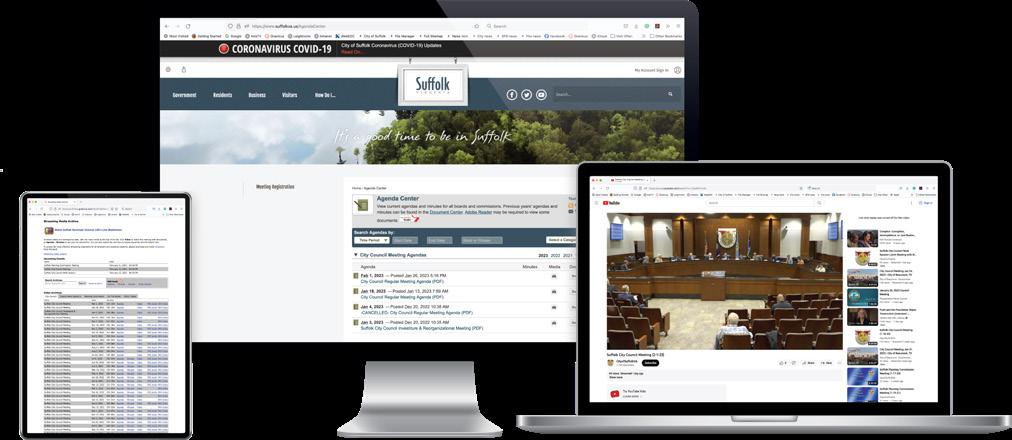
Visit www.suffolkva.us/AgendaCenter for meeting dates, agendas, and instructions for speaking at council meetings. Meetings are streamed at www.suffolkva.us/tv and on local charter spectrum cable channel 190. On demand meeting archives are available at www.suffolkva.us/ granicus
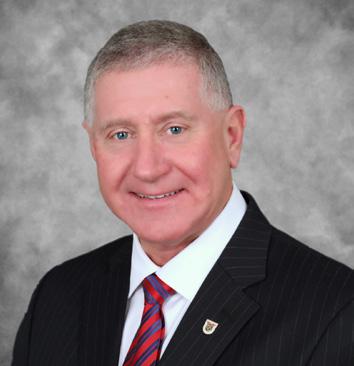
 Albert Moor II, P.E. City Manager
Michael D. Duman Mayor
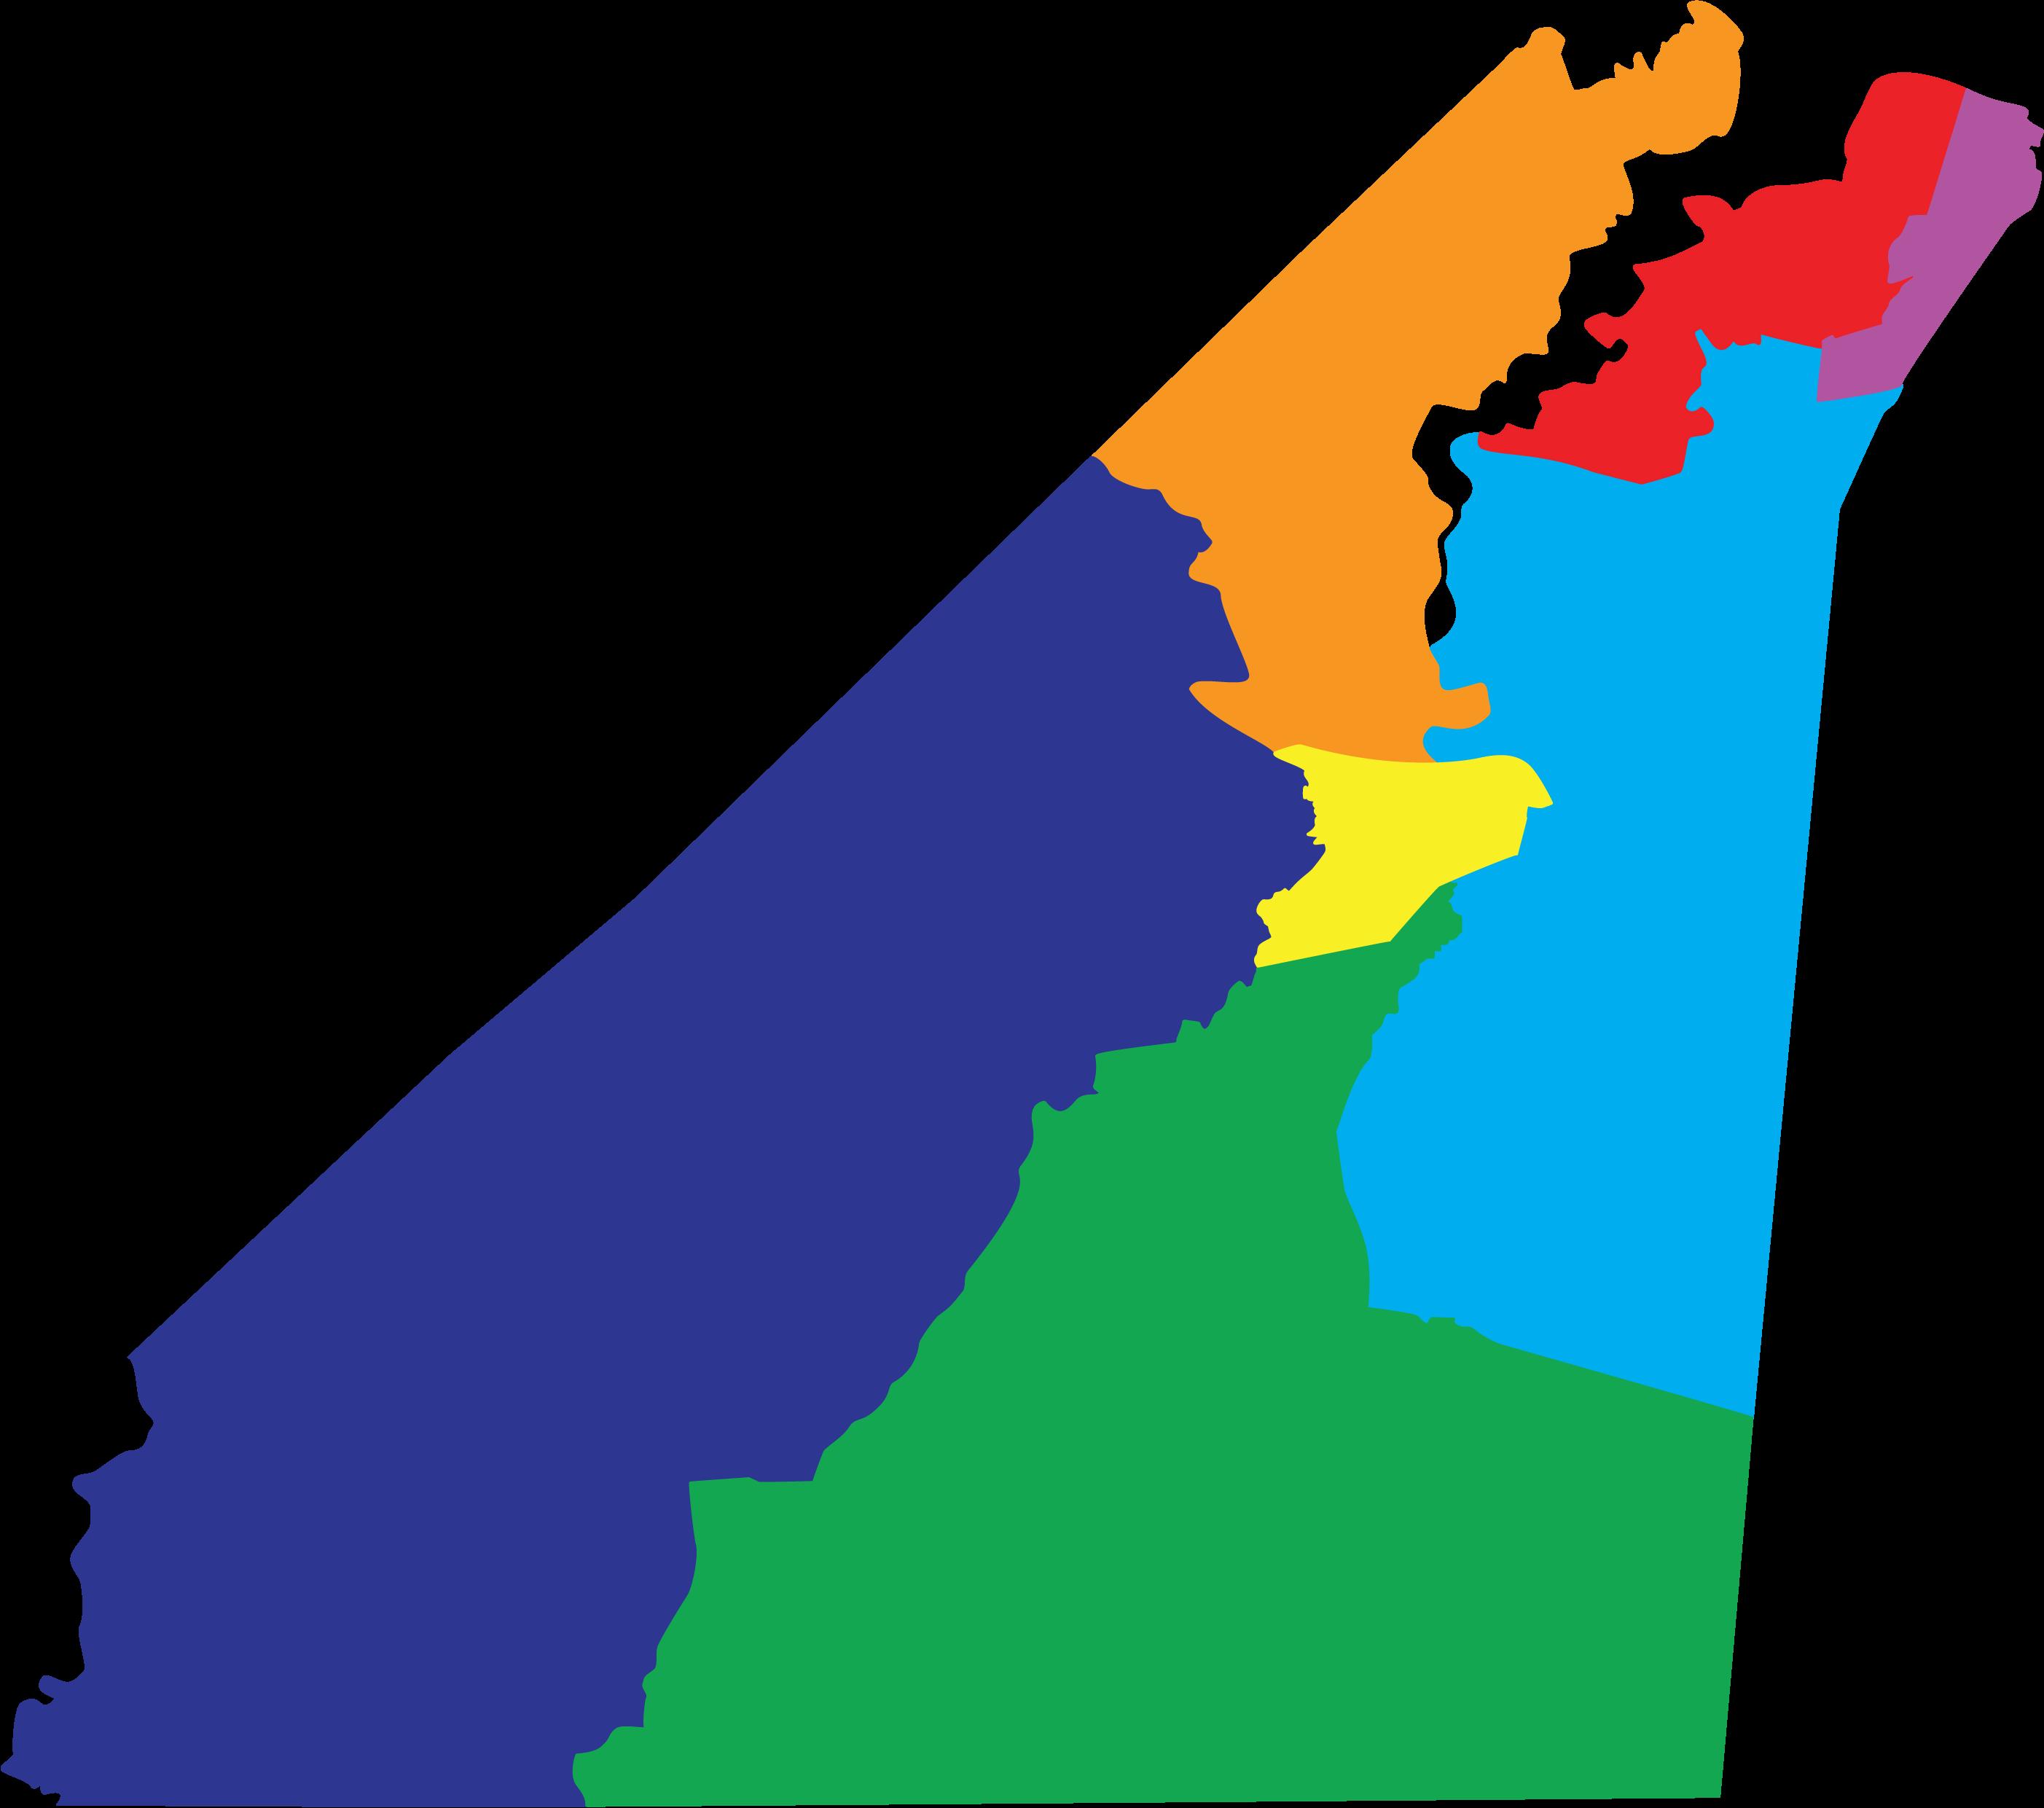




 Vice Mayor Lue R. Ward, Jr. Nansemond Borough
Leotis L. Williams Whaleyville Borough
Timothy J. Johnson Holy Neck Borough
John Rector Suffolk Borough
Roger W. Fawcett Sleepy Hole Borough
Suffolk became a city in 1910. In 1974, the City consolidated with the towns of Holland and Whaleyville, and the County of Nansemond to become present day Suffolk.
Throughout 430 square miles of rich land and pristine waterways, citizens and tourists treasure the beautiful trails, rivers and open spaces.
As a full service city, Suffolk provides a broad range of municipal services authorized by statute or charter. These services include education, public safety, highways and streets, parks and recreation, sanitation, health and social services, public improvements, planning and zoning, public utilities, storm water management and general administrative services.
The City employs 1,440 full-time equivalent city employees.
Suffolk is a vibrant and fiscally strong community leading the region in advancements in education, comprehensive transportation, public safety and diverse economic growth while continuing to preserve its rural heritage and enhancing its neighborhoods and urban centers.
Our comprehensive plan is a shared vision for the future of our community. It is meant to be aspirational and inspirational, while also being practical.
This plan is intended to guide and assist City staff, the public, development community, City Council, Planning Commission, and other officials in decisions related to development, redevelopment, growth, preservation, and the provision of public services through the year 2035. The elements of this plan establish policy statements to guide decisions about growth, housing availability, transportation, public facilities and services, and the preservation and enhancement of natural and cultural resources.
Population: 96,130
Median Home Income: $79,899
Median Home Cost: $313,700 $
Unemployment Rate:
Median Age:
4.4%
38

Major Principles and Values:
• Maintain an efficient transportation network with effective choices for mobility.
• Define and enhance the various unique character types and development patterns within the City.
• Promote a diverse housing stock, providing options in terms of type, location, and affordability.
• Protect the natural, cultural, and historical assets of the City.
• Maintain high-quality services and facilities as growth occurs.
• Preserve the agricultural heritage and character of the City.
• Keep jobs and schools near population centers.
To view the full 2035 Comprehensive Plan visit: www.suffolkva.us/2035cp
The information in this section reflects the data for calendar year 2021 .
Suffolk is the fastest growing city in Hampton Roads and is well positioned for continued growth and prosperity. With a diverse and skilled workforce, proximity to the Port of Virginia, available land for development, efficient transportation access, high quality of life, a regard for its historic past and a dynamic vision for the future, Suffolk continues to attract new business and investment opportunities, create jobs, and provide an invigorating economic climate for expansion. Noted nationally for job creation and as one of the most livable cities, Suffolk continues to capitalize on its assets in a topranked business-friendly state.
The economy of Suffolk continues to grow as evidenced by the following trends:


• Median home sales up 11.5% from last year.
• Median Household Income (MHI) grown 56% from 2000 to 2021.
• Median Household Income up 7% from FY 2021.
$14,410,000 TPMG ENT Sentara Healthcare Bayview Physicians & Bon Secours
Suffolk features many development and character types, from dense, walkable urban neighborhoods, to riverside communities, and rural villages. The plan emphasizes enhancing existing character and promoting quality new development.
Suffolk continues to see population growth with a 13.6% increase since the 2010 Census. This population trend is projected to continue over the foreseeable future. By 2040, we expect to see an increase in population by 30%.
The Suffolk Department of Planning and Community Development processed and approved site development plans that will result in $1.3 million square feet of additional industrial and manufacturing space within the City.
Strategic planning, key location, a highlytrained workforce and business-friendly environment once again catapulted Suffolk to the enviable position of one of the fastest growing cities in Virginia and a top pick for business development. The residential growth and change in Suffolk require the City to be proactive in planning for its future to ensure efficient and effective delivery of services and a high quality of life for its citizens. Through the proficient management of residential and commercial development, the City continues to offer families and businesses plenty of room to live, work and play.
Peanut Crossing, a new housing development in Downtown Suffolk, came online in 2021, offering upscale living options, creative workspaces, and flexible storage. The location of the Peanut Crossing development is particularly significant as it sits on the former home of the Golden Peanut Company, with roots in Suffolk dating back to 1898.

Department of Tourism added two new events in 2022.
• The Suffolk Farmer’s Spring Market

• Tea Tasting and Spring Plant Sale
Suffolk Health Department offers Family Planning Clinics and Healthy Family Programs. In 2022, the Health Department provided:
• Family Planning services to 94 clients and had 168 visits
• 400 immunizations
Parks & Recreation maintains 56 parks and 2,216 acres of Suffolk park area.

Upcoming Capital Projects:

• Construction of Fire Station 11
• Renovation/Expansion of Fire Station No. 4
• Construction of the Fire Department Apparatus and Storage Building
• Construction of Bennett’s Park Recreation Center
The City Council and City Management place a high priority on education in the City. Approximately $394.4 million in school projects are included in the Capital Improvements Plan over the next 10 year. Projects include school replacements and additions, HVAC improvements, and the second phase of the operations facility. Suffolk Public Schools has 2,300 full time employees, which includes 1,444 teachers, principles, and assistants.
The residential growth and change in Suffolk require the City to be proactive in planning for its future to ensure efficient and effective delivery of services and a high quality of life for its citizens.
The transportation network plays a key role in accommodating growth within Suffolk and providing connections throughout the region. The 2035 Comprehensive Plan addresses areas of limited connectivity within the City, as well as issues such as congestion, heavy freight traffic, emergency preparedness, and promoting mobility and alternate forms of transportation.

 BY THE N umbers
11 Elementary Schools
5 Middle Schools
3 High Schools
1 Alternative School
• Suffolk Animal Care Center increased its online presence, posting more pictures and information for stray animals.
• The Commonwealth’s Attorney Office promoted community outreach and awareness and crime prevention by attending and/or hosting 100 community events.
• The Library implemented Home Delivery and Books by Mail services to rural areas as well as those with mobility and transportation concerns.
Public Works
• Repaired or replaced 1,231 signs
• Paved approximately 50 center line miles of roadways
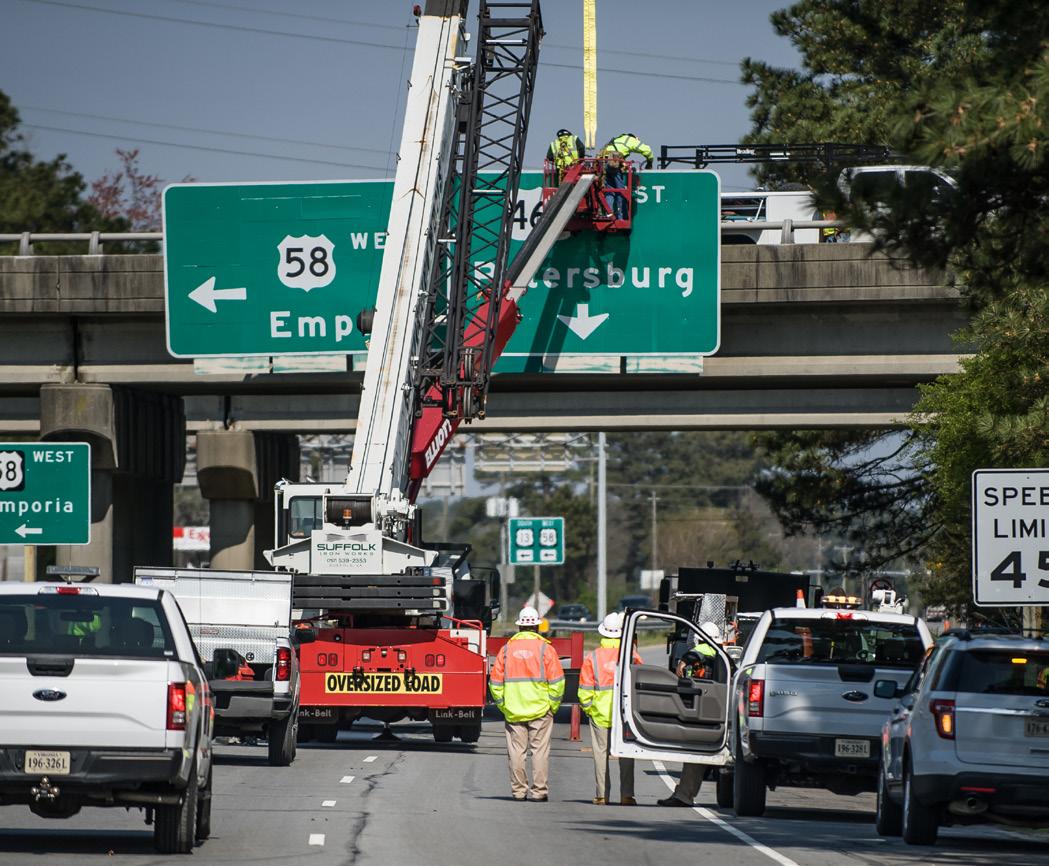

• Added 6 bus stops with shelters
• Collected 48,000 tons of residential waste
• Repaired 3,500 potholes
Public Safety
• Completed Crisis Intervention training or Mental Health First Aid with 100% of its officers and communications operators
• Received CALEA Accreditation – the gold standard in public safety

• Hosted National Night Out 2022, a community event that consistently ranks in the Top 5 in the nation
• Began a Fire Academy recruit school
• L aunched a Hearing Impaired Smoke Detection Program for the hearing impaired community
• Answered approximately 369 fire calls
541 Full Time Police & Fire Positions
14 Engine Companies
3 Police Stations
9 Fire & Rescue Stations
3 Ladder Companies
8 ALS Medic Units
The Statement of Net Position presents information on all City assets and deferred outflows of resources and liabilities and deferred inflows of resources, with the difference reported as net position. This data is inclusive of all the activities of the City but does not include City component units. Net position is one way to measure the City’s financial health, or financial position.
Suffolk’s fiscal year (FY) runs July 1 to June 30. The City’s statement of activities for fiscal years ending June 30,2022 are shown in the chart below.
NET POSITION (IN MILLIONS)
* FY2021 Net position restated relating to the implementation of GASB 87
The City of Suffolk’s overall net position increased $68.7 million from the prior fiscal year. The three components of net position are:
The most significant portion of net position ($454.8 million) is invested in capital assets to provide a variety of public goods and services to citizens. For that reason, these assets are not available for future spending. Suffolk’s investment in capital assets are reported net of related debt. Net Investment funds are 69% of the net position.

This portion of net position ($31.1 million) is restricted, representing funds that are limited to construction activities, payment of debt, or specific programs by law. Restricted funds are 5% of the net position.
The remaining portions of net position ($169.8 million) is unrestricted, representing resources that are available for services. Unrestricted funds are 26% of the net position.
Aaa/AAA Municipal Bond Rating From Moody’s, Standard & Poor, And Fitch Rating Agency
Certificate in Achievement for Excellence in Financial Reporting
For the 37th consecutive year
GFOA Award for Outstanding Achievement in Popular Annual Financial Reporting
For the 6th consecutive year
Distinguished Budget Presentation Award
For the 12th consecutive year

The City has financial policies that are vital for maintaining consistency and focus. One of the financial policies continually reviewed is that of fund balance levels. The ratio of unassigned General Fund balance as a percentage of budgeted governmental funds expenditures (net of the general fund contribution to the Schools, transfers to other governmental funds, and Capital Projects fund expenditures), plus the budgeted expenditures in the School Operating and Food Service Funds, indicates the ability of the City to cope with unexpected financial challenges or emergencies. The policy also states that any surplus amounts over 20% will be put into a budget stabilization fund until it reaches 2.5% based on the same ratio and the remaining will go to a capital reserve fund. The City has set the unassigned fund balance percentage at 20%. At June 30, 2022, the fund balance ratio exceeded the target. The City was also able to establish the budget stabilization fund at 2.5%

Local tax revenues are the second largest source of funding for governmental fund revenues. For the prior three years the City collected:
The City had a 5% increase in sales tax revenue from 2021 to 2022.
The following chart indicates the growth in the General Property Taxes revenue over the past ten years. The increase in the real estate and personal property taxes over time is due to increase in assessed value of the real and personal property as well as tax increases in FY’s 2012, 2016, 2017, and 2019. There was no tax increase in FY2022. These tax increases were added to fund increases in education as well as public safety.
The total estimated taxable value of all property in Suffolk for the 2022 tax year is $13.2 billion, an increase of $3.3 billion since 2013.
New commercial and residential construction added $13.0 billion in taxable value.
City property tax remains constant for the fourth consecutive year at $1.11/$100 valuation and is the third lowest in the region

The focus of the City’s Governmental funds is to provide information on near-term inflows, outflows, and balances of spendable resources.
Governmental funds for the City on June 30, 2022 is $239 million 39.3% of this amount is available for spending at the City’s discretion.
The City expended $68.6 million towards public safety efforts. This represents 25.7% of governmental expenses.

Education continues to be one of the City’s highest priorities and commitments representing $65.4 million This represents 23.0% of governmental expenses.


The general fund is the chief operating fund of the City. As of June 30, 2022 the fund balance of the general fund was $135.5 million
$93.9 million represents the unassigned fund balance. The General Fund has increased from 2021. This increase is attributable to better than anticipated collections of real estate and other local taxes, such as sales tax and business license tax. The increases in tax revenues provided additional funding for education and public safety.


Once the City collects taxes and other revenues, the monies must be spent efficiently to provide services to the citizens and businesses of the City.
Annually, the City Manager submits a budget for City Council’s adoption. The proposed budget must not include expenditures that exceed anticipated revenue. The budget process is approached with a focus on maintaining core services critical to residents, while simultaneously identifying sustainable savings that strengthen the City’s ability to deliver services more efficiently and effectively.
Suffolk City Council adopted a balanced budget of $698.0 million, an increase of 7.3% over the previous year. The General Fund budget totals $237.8 million, a 5.6% increase from FY21.

Capital Assets represent a significant portion of the City’s financial position and represent a long-term asset used in delivering services and providing for resident needs.
The City’s capital assets for its governmental and business-type activities as of June 30, 2022, totaled $1,039.7 Million, net of accumulated depreciation.

• School facility major repairs and maintenance
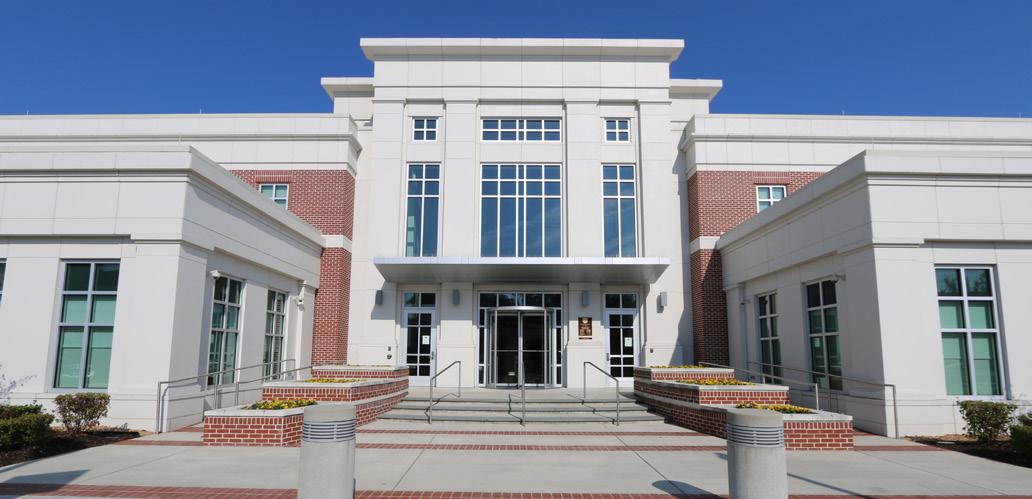
• Shoulders Hill Intersection Improvements
• New Central Library
• New Fire Station
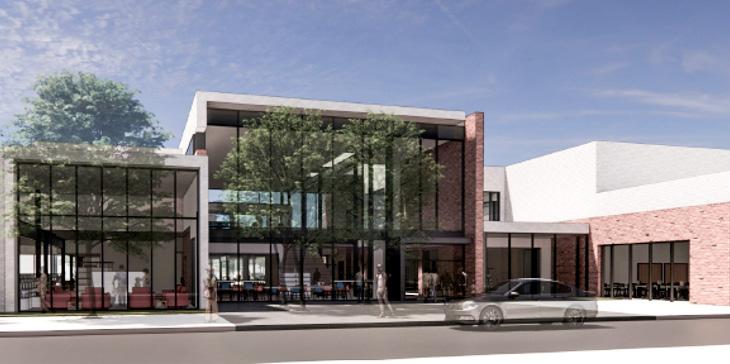

Long term debt represents borrowings used to finance the construction and purchase of capital assets used by the City. These are comprised of items for governmental and business-type activities. At the end of FY22, the City has a total outstanding debt of $710.0 Million, including general government, school construction, and utility fund debt.
The Commonwealth of Virginia limits the amount of general obligation debt outstanding to 10% of the locality’s assessed value of real property, which is $1.14 billion for 2022. The City Charter further limits this general obligation limit to 7% of the City’s assessed value of real property of $800.4 million. Of the debt shown above, only $441.5 million is general obligation debt that is applicable to the legal debt limits. The City has met both of the legal debt limits.
Suffolk City Council and City Staff are committed to obtaining the Governor of Virginia’s goal of universal broadband coverage by 2024, focusing on the large portions of rural, out-lying areas that have little to no viable internet access.


The 3.1 mile widening project will provide for construction of an additional travel lane both east bound and west bound from Route 58/13/32 bypass to approximately .7 miles west of Manning Bridge Road. The project will include turn lanes, curb and gutter, raised median, enhanced storm water features and a multi-use path and sidewalk to accommodate pedestrians and cyclists.
This system enables the City to provide its citizens with critical information quickly in a variety of situations, such as severe weather, unexpected major road closures, missing persons and evacuations of buildings or neighborhoods.
Assessed Value: The dollar value assigned to a home or other piece of real estate for property tax purposes.
Capital Assets: These include all land, buildings, equipment, and other elements of the City’s infrastructure having a cost of more than $5,000 and having been funded by the Capital Budget.
Debt Service Funds: Funds to finance and account for the annual payment of principal and interest on bonds.
Deferred Inflow of Resources: An acquisition of net assets by the City that is applicable in a future reporting period.
Deferred Outflow of Resources: A consumption of net assets by the City that is applicable to a future reporting period.
General Fund: The main operating fund of the City, which is used to finance the City’s operations. General Fund Revenues: Revenues which the City raises through taxation and other means. General Revenues are available to be used for any authorized program or function.
General Fund Expenditures: The primary fund from which the City pays ongoing expenses.
General Obligation Debt: Debt secured by the full faith and credit of the local government issuing the debt. The City pledges its tax revenues unconditionally to pay the interest and principal on the debt as it matures.
Governmental Fund: Governmental funds is money, assets, or property of a local government, including any branch, subdivision, department, agency, or other component of any such government.
Operating Budget: A plan for the acquisition and allocation of resources to accomplish specific purposes. The term may be used to describe special purpose fiscal plans or parts of a fiscal plan, such as “the budget of the Police Department or Capital Budget” or may relate to a fiscal plan for an entire jurisdiction, such as “the budget of the City of Suffolk.”
Trend: A general direction in which something is developing or changing.

Do you like this report? What other information would you like to see contained in this report?
Please let us know by contacting the Finance Department by emailing FinanceEmail@suffolkva.us, or calling 757-514-7500, or by stopping by the Department of Finance located in City Hall at 442 West Washington Street, Suffolk, Virginia 23434.
Please visit the City’s website at www.suffolkva.us for additional information including the City’s Annual Comprehensive Financial Report.

