10 minute read
A technical note on dogleg severity
by Dag Billger, Owner & Business Manager and Duncan McLeod, Owner & Product Manager at Inertial Sensing
In recent years, we have received an increasing number of questions concerning how dogleg severity (DLS) is defined, why it does not look smooth in plots, and if it can be used as a survey quality assurance parameter. We have also noted that the oil and gas industry is considering for some applications an alternative to the minimum curvature method for calculating borehole coordinates from survey angles. This alternative method is based on splines. Here we give a review of the standard minimum curvature method for calculating borehole coordinates and DLS, introduce the spline method and consider if DLS can be used as a good quality measure.
Advertisement
Minimum curvature method
The minimum curvature method has been accepted as a standard method for borehole trajectory representation since the mid-80s. It was introduced by C.M. Mason and H.L. Taylor1, however W.A. Zaremba is reported to have derived the method independently2. It is today the de facto industry standard method for calculating borehole coordinates from survey angles, regardless of the type of survey tool. This article mainly follows the notation of Sawaryn and Thorogood3 .
It should be noted that there are other borehole coordinate interpolation methods, such as the tangential method, the balanced tangential method, the average angle method, and the radius of curvature method. Some of the older ones are easier to implement with respect to manual computation, but after the introduction of modern microprocessors minimum curvature has become the dominant method.
The minimum curvature method assumes that the path of a borehole between two consecutive survey stations can be approximated by a circular arc segment (see Figure 1).
The arc segment has radius R and its course length is denoted S12, which corresponds to the survey station interval. The inclinations and azimuths at the start and end of the arc segment are denoted I1, I2 and A1, A2, respectively. These are all known from depth readings and survey station angles.
The parameters in Figure 1 are: • t1 and t2 survey station tangent vectors • β subtended arc segment angle • Δr position change vector • R radius of curvature
Figure 1 - The borehole path between two consecutive survey stations is approximated by a circular arc • n12 normal unit vector to arc segment plane • b1 and b2 bi-normal unit vectors
With knowledge of the station interval S12, as well as the inclination and azimuth at the start and end of the arc segment, it is possible to compute the change in coordinates from one station to the next. According to Sawaryn and Thorogood, it can be shown that the coordinate difference is given by the formula:
In the formula above, the tangent vectors at survey Stations 1 and 2 and the subtended angle β are all derived from the station inclination and azimuth angles. With knowledge of the start coordinates at the collar of the hole, the minimum curvature method represents the borehole path as a series of piecewise continuous circular arc segments. Each station coordinate is computed from the previous until the end-of-hole station is reached.
Dogleg severity
DLS is a measure of the curvature of a borehole. It is usually measured in units of degrees per 30 m or 100 ft. It originates from directional drilling in the petroleum industry, and it has seen increasing use in mining, as directional drilling has become more common. DLS is not an independently measured data value. It is calculated from the surveyed inclinations, azimuths, and station intervals. The DLS is a byproduct of minimum curvature interpolation, and the formula is given as:
where the subtended angle β is in degrees. It can be shown that the DLS between two stations is given by the equation:
Thus, the DLS depends not only on the station to station change in azimuth, but also on the change in inclination and the actual inclination at the start and end of the current arc segment. There is also a division by the station interval which means that the DLS for a given survey will depend on the chosen resolution, how dense or coarse survey intervals are being used.
The arc segments, which are used to approximate the borehole path are only piecewise continuous, since the circular arc used between each station has a different radius. This means that the DLS values estimated by minimum curvature do not represent a continuous function of station depth. So, a typical plot of DLS as a function of depth is usually very ‘choppy’ and not smooth, even though we know that most boreholes have a smooth variation.
It is interesting to note that DLS is not defined at a station, but between stations. Strictly speaking, it has no value at a station! But by convention, the value from either the left or right arc of the station is used.

Spline curve method
To overcome these issues with the minimum curvature method, M. Abughaban et. al.4 introduced an interpolation method where the tangent vector is continuously differentiable to obtain a more accurate estimate of borehole curvature. This was motivated in the petroleum industry for so-called micro-dogleg surveys. Here it is required to accurately identify very small variations in the curvature of the drill string over short distances, which could be enough to fracture it.
Micro-dogleg surveys are conducted with a high-resolution survey of the drill string with a typical station interval being 0.5 m (1.64 ft). To maintain reasonable survey time, these surveys are done using a wireline with a depth encoder and running a fast continuous gyro survey.
The method uses spline curve interpolation which guarantees the requirements on the continuous differentiability of the tangent vector. This produces a continuous estimate of the DLS and so, a more accurate measure of borehole curvature. These added conditions have the effect that the calculated position and curvature values of a station will depend on the neighboring stations. This contrasts with minimum curvature where any given survey station only depends on the previous station.
The spline curve method is based on representing the tangent vector as a third-degree vector polynomial over each survey interval. Borehole coordinates are found by integrating the tangent along the borehole path. The curvature is computed by differentiating the tangent vector along the borehole path and computing the length of the resulting derivative:
The use of spline curve interpolation involves some matrix algebra which, although straightforward to apply, requires numerical implementation and this is not presented here.
It should be noted that spline curve interpolation is currently not an accepted standard method and is mainly used in special applications. It is however interesting to investigate both as a novelty and for reasons of comparison.

Figure 3 - Station-to-station distance error for minimum curvature versus spline curves
Coordinate comparison
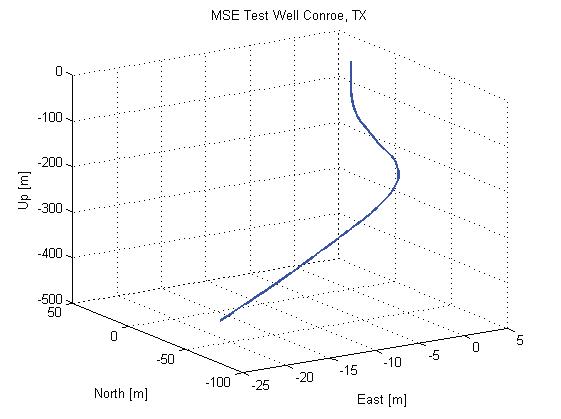
The new spline curve method was implemented as part of Inertial Sensing’s internal development platform and compared to the minimum curvature method for different types of surveys. For this article, one survey was chosen as an example from continuous TwinGyro surveys of a test well in Texas, US5 with a depth of 1400 ft (426.72 m). This hole was drilled specifically for gyro tests and begins at a vertical angle, but soon rises sharply to reach an inclination of 20° (see Figure 2).
The reference data is available with 2 ft (0.61 m) station intervals from high-density continuous surveys. The minimum curvature and spline methods were applied to the survey data using different station-

intervals. The end of hole coordinate differences between the two methods were computed (Figure 3).
Both minimum curvature and spline interpolation give coordinate values which are in very good agreement and differ only at the sub-millimeter level. The errors will increase when using data over coarser survey intervals.
DLS comparison
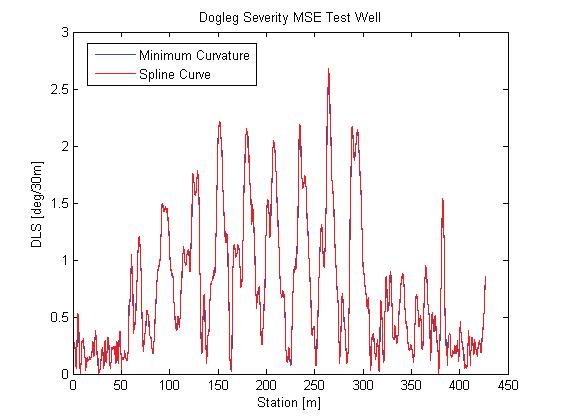
The dogleg severity was computed for the same reference survey used in the previous section. Plotting these using high-density station intervals of 2 ft (0.61 m) shows good agreement (Figure 4).
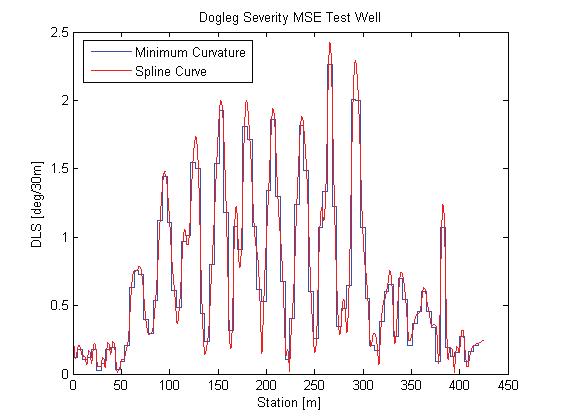
As a second example, the same data was studied using a coarser subset of station intervals of 16 ft (4.88 m) (Figure 5).
The minimum curvature is a choppy stepwise function between stations. The spline method provides a continuous measure of the curvature but naturally tends to appear to under- and overshoot the corresponding minimum curvature values especially for coarser survey intervals.
Important to note is that the choice of survey interval has a clear impact on the overall DLS values, with the exact values changing noticeably as the station interval changes.
DLS as a quality flag
When considering the use of DLS as a quality parameter, one needs to understand that a suitable flag needs to represent an invariant threshold which can be used in a repeatable way. It should be clear that DLS is not suitable as a threshold for survey azimuth errors because a DLS threshold would have to vary with inclination, which is far from ideal in practice. Since it also depends on the inclination change and the survey station interval, then a given threshold would not apply to differently run surveys of the same hole. DLS cannot provide a general quality threshold which can be reliably used for all types of coring borehole profiles.
However, DLS is still a good visual indicator to identify stations with potential azimuth errors when conducting quality checks of survey data. Yet, it is not suitable as an accurate and reliable measure to be used as a survey quality warning flag for an automated quality control system. In other words, it can give a rough guide of potential problems, but care is needed to avoid discarding good data.

Figure - 4 Dogleg severity of MSE Test Well Conroe, Texas. Station interval 2 ft (0.61 m). Figure 5 - Dogleg severity of MSE Test Well Conroe, Texas. Station interval 16 ft (4.88 m).
Conclusion
Fundamentally, both methods find the DLS by numerical differentiation, which by its nature will always give rise to estimation errors when applying either method to survey data. Ultimately, neither is a perfect model of how a drill string bends.
The two methods show good agreement on position accuracy. But it is our view that the minimum curvature method is to be preferred as it provides an analytical description which is easier to analyze mathematically. This is important when doing an analysis of error models and tool performance.
The minimum curvature has the issues in that the curvature is only approximated in piecewise steps and does not define the DLS at a station.
The spline curve method avoids this, but it might misrepresent the data points between the survey stations. The sharper peaks between stations may unknowingly give rise to inaccuracies. But at the stations, the spline method DLS values are usually accurate.
In most cases, it is likely better to use minimum curvature to calculate the DLS since this gives errors that are confined to each segment, not depending on any additional neighboring points. Some specialized situations may still call for the use of the spline method.
This, along with other recent developments, has shown that high-resolution continuous surveys really are necessary for getting the best results in terms of DLS and position information of any borehole. C
References & resources
1 ‘A Systematic Approach to Well Surveying Calculations’, C.M. Mason and
H.L. Taylor, SPE84246, SPEJ, June 1971. 2 ‘Directional Survey by the Circular-Arc Method’, W.A. Zaremba, SPEJ,
February 1973. 3 ‘A compendium of directional calculations based on the minimum curvature method’, S.J. Sawaryn and J.L. Thorogood, SPE Drilling &
Completion, March 2005. 4 ‘Advanced Trajectory Computational Model Improves Calculated Borehole
Positioning, Tortuosity and Rugosity’, M. Abughaban et. al, SPE-178796-
MS, 2016. 5 ‘A comparison between discrete and continuous borehole deviation gyro surveys using the TwinGyro’, D. Billger and D. McLeod, AIMMGM XXXIII
International Mining Convention in Acapulco, Mexico, October 2019.
For more information
Visit: www.inertialsensing.com


