www.digitalsurf.com
NEW MOUNTAINS® 9.3
WHAT’S COMING?
Exploring the power of Mountains 10®
Accelerating surface analysis automation... and much more
APPLICATION
APPLICATION
Multi-perspective characterization of tool performance
Force spectroscopy:
Strengthening polylactic acid polymers by calcification
SURFACE METROLOGY Q&A
FEATURE SPOTLIGHT
What are the differences between ISO 4287 and ISO 21920?
Welcome to the fascinating world of fiber analysis
SURFACE METROLOGY
CASE STUDY IN BRIEF
Determining surface quality of cap layers in superconductors
Q&A
What cut-off value should I use?
PRODUCT NEWS
NEWS & SOCIAL
The Control 2023 tradeshow will see the introduction of a brand new version of Mountains® surface analysis software, the go-to tool for anyone working with surface topography.
Events highlights
What’s hot online
Wiley and Digital Surf collaborate to accelerate surface analysis workflow
From aspheric optics analysis to CAD compare on shells, Mountains® version 10 is packed with powerful tools that make surface analysis faster, more accurate and more user-friendly than ever before.
… Turn to page 2 …
Did you know there is a whole catalogue of free webinars waiting just for you on our website?

Head on over to our Webinar Library & become a Mountains® software expert in no time!
Check it out: www.digitalsurf.com/learning/webinars/
Watch a WEBINAR SURF ACE Surface imaging, analysis & metrology news from Digital Surf
Join us!
MOUNTAINS®
COMING IN
10: ASPHERICS, CAD COMPARE ON SHELLS, LIGHT MICROSCOPY AND MORE ISSUE IN THIS
NEWSLETTER // DIGITAL SURF // SPRING 2023 Newsletter SPRING 2023
MOUNTAINS® SOFTWARE: EXPLORING THE POWER OF 10
As the surface metrology & microscopy industries continue to evolve, Digital Surf remains dedicated to building the best and most up-to-date surface imaging and analysis software. At Control Messe 2023 taking place in Stuttgart, Germany May 9-12, the team will be proudly introducing all the new features and improvements included in Mountains® 10.
LENS ANALYSIS: TOOLS FOR ANALYZING ASPHERIC OPTICS
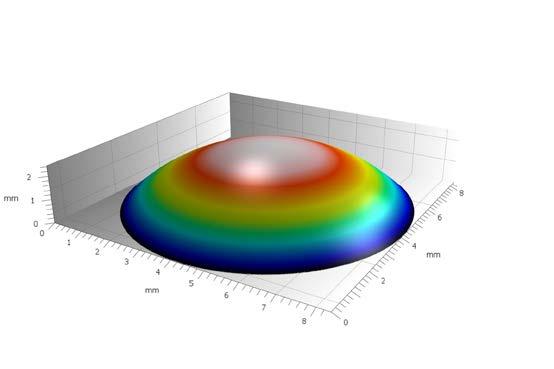
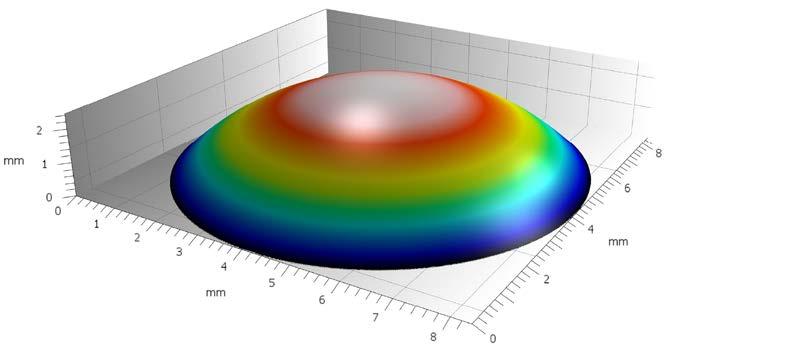
Above. Analyze aspheric optics with the new Lens Analysis module. generated meshes (as is often the case in additive manufacturing).
Analyzing aspheric optical surfaces and profiles is necessary for applications in many industries including imaging systems, sensors and lasers.
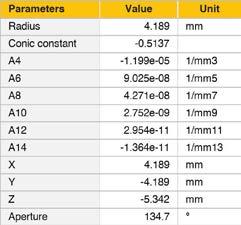
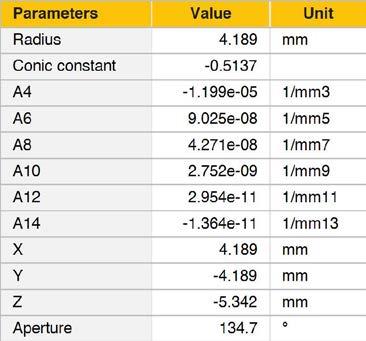
With the new Mountains® Lens Analysis module in version 10, users can now access tools for studying these extraordinarily complex surfaces. Setting reference geometry and adjusting radius, conic contrast and polynomial coefficients is easy thanks to a dedicated dialog in the version 10 interface.
Users can visualize aspheric surfaces as well as residual surfaces (showing the disparity between measured data and reference) in 2D and 3D.
CAD COMPARE ON SHELL STUDIABLES
Following the introduction of features for Shells (freeform data) in version 8 and tools for surface metrology on Shells in version 9, version 10 sees a further development that will be of great interest for users working with this type of measurement. It is now possible to compare measured Shell data (Actual) with CAD models (Nominal) or
Users can pre-align models automatically or manually, which is useful in the case of partial measurements, before fine-tuning the fit.
The next step is to calculate and show deviations using user-defined color palettes then generate result Shell and deviations in order to carry out further analysis (surface texture analysis etc.) with all the usual Mountains® tools.
AUTOMATION FEATURES, EVEN MORE ACCESSIBLE
Automation of your analysis process is key in today’s environment: in Mountains® 10, the interface for automation has been improved in more ways than one.
The new Automation tab now groups together all the Mountains® productivity functions such as:
▶ Templates: as you work, Mountains® creates an analysis Document which can, in turn, be applied as a Template on a similar dataset or on large batches of measured data.
▶ Minidocs: create your own analysis recipes with a desired sequence of Operators and Studies and use them as a macro.
SURFACE NEWSLETTER // SPRING 2023 2 WHAT’S COMING?
▶ Customization (save and reapply personalized Study settings, display etc. in order to work more quickly).
Mountains® can aid users to automate processes by allowing them to re-inject results. In version 10, the Result picker feature has been made more widely available throughout the software making it possible to re-use calculated results to drive other workflows. Examples of this include:
▶ Define profile position when using the Extract profile operator.
▶ In Parameters tables: centralize a cut-off value applied to several Parameters tables or Filters.
Mountains® 10 can now also automatically detect structures positioned at a certain place in Template mode.
The new version also sees even better integration with data acquisition & machine operating software. In particular, the SDK has been further developed: you can now insert Operators or Studies directly from your application and manage add-ons more easily.
MOUNTAINSIMAGE®, LIGHTING UP YOUR IMAGE ANALYSIS
The Mountains® range extends once more with new version 10. Users of light microscopes now have access to MountainsImage®, a dedicated package for this type of equipment. Three product levels are available.
A complete toolkit for pre-processing and analyzing images obtained is on offer, including
READ MORE & UPDATE
enhancement, measurement, luminance histograms, color inversion and conversion to monochrome. Particle Analysis and Fiber Analysis tools are also available on this type of analyzed data. Besides this, two major new features are part of the product offering:
▶ Show images (or surfaces) beneath contour profile, when analyzing horizontal object contour.
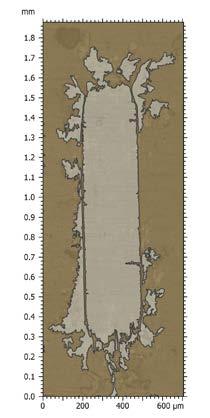
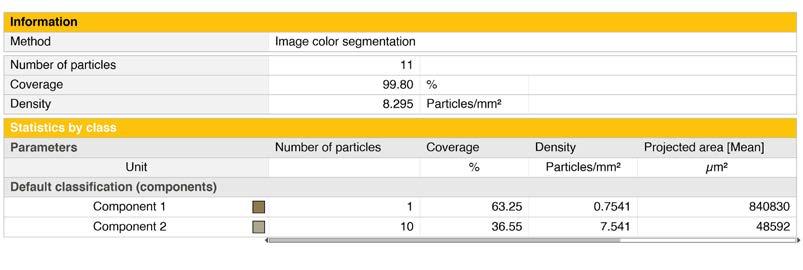
▶ Color segmentation (via Particle Analysis) which allows users to isolate zones based on color (for example to detect & visualize component coverage in wear applications).
NEW FEATURES FOR ALL USERS
Many other new features await Mountains® software users with the dawn of this new version.
▶ The extremely popular Extract profile tool has been augmented and redesigned.
▶ Fiber Analysis is now available for topography analysis (on profilometry and SPM data).
▶ Users can now Remove outliers from point cloud datasets.
▶ Many tools have been extended for use on series of profiles and surfaces
▶ Peak Fitting is now available on series of spectra or hyperspectral images.
▶ Parameter maps can be generated on hyperspectral images or force volume data.
▶ FIB-SEM data: quicker loading and processing of image stacks as cubes and management of transparency.
Check www.digitalsurf.com for full details of the v10 release (available end of May 2023). Access to the new version is included for users with an active Mountains® Software Maintenance Plan. To find out more about your Maintenance options, please contact sales@digitalsurf.com
SURFACE NEWSLETTER // SPRING 2023 3 WHAT’S COMING?
Above. Color segmentation, new in MountainsImage®, allows wear quantification on image data alone. Example taken from a study on the effects of fretting.
MULTI-PERSPECTIVE CHARACTERIZATION OF TOOL PERFORMANCE

One of the critical applications of optical metrology in tooling is the dimensional characterization of cutting tools to ensure they perform optimally and have a long service life. Roughness measurements can also be used to predict how removed material will exit the tool in the aim of preventing clot formation or overheating. In addition, optical metrology can provide local measurements to help identify issues such as chipping or coating peeling, which indicate if a tool needs to be replaced or repaired. In the following study, all these characterizations, which come in very different orders of magnitude, were managed using one, unique set-up: Sensofar S neox Five Axis and SensoMap software.
The S neox Five Axis system features a rotational module, which allows for the complete measurement of sample shape. This is particularly useful in the tooling industry, where precise measurements of cutting tool geometries are critical to achieving optimal performance.
The system offers three technologies: Confocal, Interferometry and Active Illumination Focus Variation (AiFV), allowing measurement of roughness, cutting edge, shape of tools and micro-tools. In this particular case, AiFV is the preferred choice due to its fast measurement speeds and superior ability to measure slopes.
After acquiring the necessary data, we analyzed the mesh data comprehensively. This is where SensoMap software proves extremely useful, particularly its Shell Module, which allows users to extract dimensional and roughness information by navigating from mesh to topographical data and then to profile data.
DIMENSIONAL ANALYSIS
Several measurements were performed using parametric profiles generated from shell data to comprehensively understand the end mill geometry.

Firstly, cross sections were extracted perpendicular to the cutting axis of the end mill at multiple locations along the flute length to determine whether the tool maintained consistent external diameter. Additionally, we calculated the concentricity between the inner and outer circles to check for any tool run-out.
Another measurement allowed us to examine the pitch of the helix. To achieve this, we fitted the tool to a cylinder and unrolled it. Next, we extracted a profile perpendicular to the helix angle and measured pitch distance. By using advanced measurement techniques and software, such as those employed in this analysis, manufacturers can optimize their processes, reduce costs, and improve product quality, ultimately contributing to better business and customer outcomes.
SURFACE NEWSLETTER // SPRING 2023 4 APPLICATION
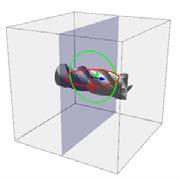
3D visualization of the cutting tool with extracted cross section to determine consistent diameter and concentricity.
ROUGHNESS ANALYSIS

A profile was extracted from the previously unrolled cylinder and roughness parameters according to ISO 4278 were calculated.
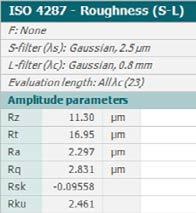
We were thus able to ensure a clean surface finish on edges rather than a rough one, which can negatively impact the quality and performance of the tool.
PEELING ASSESSMENT
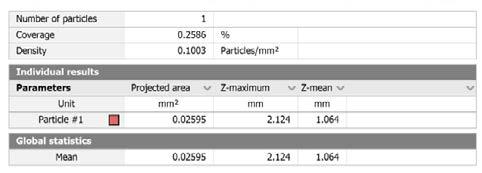
One of the most important features of cutting tools is their coating, which significantly impacts their durability and ability to withstand high-stress processes. The SensoMap Shell Module was used to evaluate peeling through extraction of topographies from the mesh. Then, using the Particle Analysis tool, we were able to focus on the areas where peeling occurred and determine the extent


AUTHOR
of damage. This allowed us to understand peeling area dimensions thus aiding investigation into whether it was limited to the coating or if some material was missing due to chipping.
By identifying the extent of coating peeling and chipping, appropriate action can be taken to ensure that the tool remains in optimal condition and performs to its fullest potential.
CONCLUSION
The combination of SensoMap software and the S neox Five Axis made it possible to characterize end mill dimensions, roughness and peeling defects. With this innovative technology, manufacturers can achieve unprecedented levels of precision and accuracy, making it possible to produce high-quality products that meet the demands of today’s market.
Natalia Bermejo Gijón-Bonales, Product Specialist at Sensofar Metrology
INSTRUMENTS & SOFTWARE USED
Senosofar S neox Five Axis system & SensoMap software powered by Mountains®

LEARN MORE
www.sensofar.com/metrology/industry-research/sneox-fiveaxis/

SURFACE NEWSLETTER // SPRING 2023 5 APPLICATION
Above. “Unrolled” cylinder (left) and pitch distance measurements (right). Below left. Roughness calculations. Far right. Evaluation of peeling using Particle Analysis.
WHAT ARE THE DIFFERENCES BETWEEN ISO 4287 AND ISO 21920?
Until recently, profile parameters were defined in three international standards: ISO 4287 (main parameters), ISO 13565 (Rk parameters) and ISO 12085 (R&W motif parameters). 25 years after their implementation, it was time to modernize, correct and extend these standards. This was the aim of ISO 21920, a standard in three parts published in Dec 2021.
François Blateyron, senior surface metrology expert at Digital Surf and member of ISO Technical Committee 213, describes the main changes.

ARE THE FORMER STANDARDS STILL VALID?
The new ISO 21920 standard officially replaces ISO 1302, ISO 4287, ISO 4288, ISO 13565-2 and -3 which were withdrawn at the end of 2021. However, existing specifications made on technical drawings published before the new standards are still valid and bound to the former standards. Specifications made on new drawings may refer to either the new standard or the former standards. This is possible by adopting the new “root symbol” defined in ISO 21920-1, meaning that parameters are defined in ISO 21920-2 and decision rules are described in ISO 21920-3, or keep the existing symbol defined in ISO 1302, which means that parameters are defined in ISO 4287 or ISO 13565, and decision rules are described in ISO 4288.
However, their definition in the new standard is slightly different so it may create different results.
Reason 1: different
operation workflow
The first important change concerns the order of some operations. In ISO 4287, the primary profile is obtained after a nominal form removal followed by a lambda S filter. In ISO 21920-2, these operations are reversed, in order to be aligned with standard practice for surfaces. In the end, the disparity in results will be small, but for some profiles, especially those that contain form, the parameters may show significant differences. Procedures will have to take this into account when verifying specifications based on ISO 21920.
Reason 2: definition on the evaluation length instead of the
sampling length
Although the former standards can still be used, they are no longer official international standards and are considered as obsolete with respect to current industry practices. It is expected that the switch to the new standard will take several years, but ISO 21920 will become the dominant standard.
ARE THE PARAMETER VALUES THE SAME?
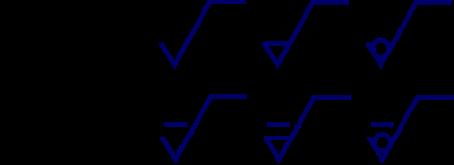
Most ISO 4287 parameters are still included in ISO 21920-2. Designers and metrologists will still be able to specify tolerances on Ra or Rz or Rsk.
The second major change concerns the definition of parameters that are no longer averaged over sampling lengths. In ISO 4287, parameters were estimated on each sampling length (5 by default) and the final value was indeed the average of these estimators. The aim of this procedure was to stabilize results when measured by workshop profilometers, in production. Now, this precaution is no longer needed and only one value is calculated over the evaluation length. The only exception is for parameters related to peaks and pits (Rp, Rv, Rz) that are still calculated on section lengths to avoid unstable results.
Be prepared to cope with parameter differences
When compared on the same profiles, the two standards show satisfactory correlations on most parameters, but some parameters are more sensitive to the changes and will give different results on the same profiles. It will be necessary, for industrial users, to evaluate the impact on their workpieces and potentially update the tolerance
SURFACE NEWSLETTER // SPRING 2023 6
SURFACE METROLOGY Q&A
Above. A new root symbol is introduced by the new standard.
Left. Modified workflow with inversion of the S-Filter and F-Operation.
limits on their technical drawings. However, this should not discourage users to adopt the new standard.
WELCOME TO THE FUTURE
Despite potential parameter differences, the new standard is better suited to modern product specifications. Besides the differences on existing parameters, the new standard also introduces new parameters that are highly adapted to modern engineered surfaces.
Left. Parameters are now defined on the evaluation length and no longer averaged.

Left. Differences depend on the parameter and on the profile: Rq values are virtually unaffected whereas differences in Rsk can be more significant.

It is the responsibility of designers and metrologists to update their knowledge and understanding of the new standard.
Surface texture specifications cannot be limited to Ra and ISO 21920 offers a wide range of parameters adapted to the surfaces of the 21st century.
MountainsMap® 9.3 software, as well as partner packages based on it, includes the ISO 21920 standard as well as the former ones.
ADDITIONAL RESOURCES
▶ A deeper look at ISO 21920, in our Surface Metrology Guide: guide.digitalsurf.com/en/guide-iso-21920-parameters.html

SURFACE NEWSLETTER // SPRING 2023 7 SURFACE METROLOGY Q&A
DETERMINING SURFACE QUALITY OF CAP LAYERS IN SUPERCONDUCTORS


In the last decades the need for clean energy has become an important issue due to global warming. Superconductor materials are one of the many potential solutions thanks to their ability to conduct electricity with zero energy loss. A team from the Institut de Ciència de Materials de Barcelona (ICMABCSIC), Spain, has been working on the characterization of such materials to improve their performance.
THE IMPORTANCE OF FLAT AREA FRACTION
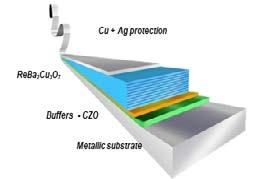
REBa2Cu3O7 (RE – rare earth, Y) coated conductors have a multilayer architecture (figure 1) composed of a metallic substrate, several buffer layers, the REBCO layer and Cu and Ag protective layers.
Zr-doped CeO2 (CZO) ultrathin layers (20-25 nm) are often used as cap layers for REBa2Cu3O7-x superconducting tapes, due to the low mismatch between their crystalline cell parameters. Therefore, surface characterization of the CZO layers is an important step before the deposition and growth of REBCO layers.
“We found that one of the key parameters that determine the surface quality of the buffer layers beyond roughness (Sq) is the flat area fraction” explains Professor Teresa Puig, Head of the Superconducting Materials and Large-Scale Nanostructures Department at ICMAB.
“We were able to develop a methodology for determining the flat area fraction from topography measurements of the buffer layer surface.”
METHODOLOGY
A morphological study of the CZO layer surface was performed using an Agilent 5100 atomic force microscope with AppNano silicon tips. Images were processed with MountainsSPIP® software. Besides roughness quantification, the software allows the calculation of the flat area fraction of the surface.

First, a threshold height value is defined, above which the surface is not considered flat. Usually, a three-unit cell of the structure is taken into consideration. In the case of the fluorite CZO, this is equivalent to ~1.5 nm. With this threshold value, a binary mask is applied to the whole AFM image. The result is a two-color image, where the flat area is represented in blue.
CZO cap layers were grown on Yttria Stabilized Zirconia (YSZ) single crystals by metal organic decomposition (MOD). Figure 2 shows the surface characterization of CZO layers suitable for REBCO deposition (low Sq and high flat area fraction). Figure 3 shows an example of CZO surfaces unsuitable for the deposition of REBCO layers (Sq > 2 nm and flat area fraction < 50 %).
CONCLUSION
“With the help of MountainsSPIP® software we developed a method to determine the flat area fraction by designing a binary topography image map, from where to calculate accurately this parameter” concludes Teresa. “A thorough analysis of many film samples enabled us to assert that flat area fraction values above 50% result in YBCO textured films and that the higher these values are, the better.”


AUTHORS
T. Piug, C. Pop, M. Coll, X. Obradors and M. Simon, Institut de Ciència de Materials de Barcelona.
8 8 CASE STUDY IN BRIEF SURFACE NEWSLETTER // SPRING 2023
Figure 1. Architecture of a REBCO-coated conductor.
Top row. CZO layers suitable for REBCO deposition: rootmean-square roughness (left), flatness fraction (right). Bottom row. CZO layers unsuitable for REBCO deposition: root-meansquare roughness (left), flatness fraction (right)
WILEY AND DIGITAL SURF COLLABORATE TO ACCELERATE SURFACE ANALYSIS WORKFLOW

HOBOKEN, N.J. & BESANCON, FRANCE, MAR 16, 2023 — Wiley, one of the world’s largest publishers and a global leader in scientific research and career-connected education, today announced a new software integration between Digital Surf’s Mountains® software for spectroscopic imaging and surface analysis and Wiley’s KnowItAll software for spectral analysis and data management.
Users of Mountains® will now have the option to send extracted spectra from spectroscopic images (Raman and IR: FTIR, ATR, NIR) directly to Wiley’s KnowItAll software to analyze components, taking advantage of its powerful search, prediction and mixture analysis algorithms and vast spectroscopic data collections.

“Confidently analyzing spectra extracted from spectroscopic images is easier now that users of Mountains® can effortlessly transfer spectra into KnowItAll for full spectrum search and mixture analysis. We can’t wait to see the outcomes of these efforts appear in the published results in microscopy and surface analysis. We hope that this leads to an acceleration, broadening and overall improvement of characterization across life sciences and physical sciences” said Graeme Whitley, Director, New Business Development at Wiley.
“We’re thrilled to be able to bring the power and wealth of KnowItAll’s spectral database to users of our Mountains® solutions for spectroscopy analysis” said Renata Lewandowska, Product Manager for Spectral Applications at Digital Surf. “The connection between the two platforms is another step towards our goal of providing a 360° dedicated solution for processing & combining images and other data from spectroscopic techniques.”
Wiley Science Solutions is home to the world’s largest spectroscopy collection, providing researchers with integrated software solutions and superior spectral and chemical data collections with the aim to improve the quality of analysis and identification, reduce errors, and increase productivity in the laboratory.

SURFACE NEWSLETTER // SPRING 2023 9
99 PRODUCT NEWS
MORE Visit www.wiley.com or www.digitalsurf.com
LEARN
Above. An extracted spectrum can now be sent from Mountains® software directly to KnowItAll for identification.
A BUSY START TO THE YEAR FOR THE DIGITAL SURF TEAM
NANOTECH
The International Nanotechnology Conference and Exhibition (Nanotech) was held early February in Tokyo, Japan. Damien and Arnaud were present on the EU-Japan Centre booth to provide visitors with live demos of Mountains® 9 software.

PITTCON
Our team of experts then flew across the Atlantic to Philadelphia, PA, for our 1st participation at Pittcon Conference. Taking place from March 18-22, Pittcon showcased the latest advances in laboratory instrumentation & equipment. This was a great international platform for Arnaud, Cyrille and Renata to get some inspiration for future projects and meet some of our valued partners.
DPG
Late March, Anne and Nicolas were thrilled to be presenting MountainsSPIP® key features at the DPG Spring Meeting of the Condensed Matter Section (SKM). This meeting was held this year at the Technical University Dresden (DE) and was the opportunity to have fruitful discussions and share ideas with the SPM community.

FORUM DES SONDES LOCALES
Our team then traveled to our neighboring region of Alsace to meet SPM users at the “Forum des Microscopies à Sonde Locale”. The event was held in Obernai (FR) from April 3-7. Mathieu & Nicolas welcomed the visitors to our booth and were pleased to discuss their applications.
MOUNTAINS® WEBINARS

The season was also busy online on our webinar platform.
We were excited to broadcast the first in a new webinar series on profilometry data analysis presented by François Blateyron, senior surface metrology expert and VP, Research & Metrology at Digital Surf. This first issue - broadcasted on April 4 - was dedicated to Profile analysis and met with great success. Stay tuned for new episodes in the coming months.
On another topic, a short webinar dedicated to a case study using MountainsSPIP® for Force Curve Analysis was hosted by Mathieu (in French, broadcast April 13).
These 2 webinars as well as all our previous ones are accessible for free and available on demand here: bit.ly/DS-webinars
SURFACE NEWSLETTER // SPRING 2023 1010 EVENTS HIGHLIGHTS
Above. Cyrille and Arnaud on the booth at Pittcon.
Above. Anne at the DPG meeting in Dresden..
WHAT’S HOT ONLINE
Have you visited our YouTube channel ?
POPULAR ON LINKEDIN
Mathieu & Nicolas journeyed to Alsace to meet up with the rest of the SPM French community during the Spring meeting of “Forum des Microscopies à Sonde Locale”: bit.ly/3nLRObr

SPOTTED ON FACEBOOK
Our mini-series continues! Use the hashtag #SurfaceIntelligence to get a look at some of Mountains® software key features in video form: bit.ly/3GrBJ0N

We have lots of quick helpful videos, like tutorials on Mountains® software basic and advanced features.


Check them out: bit.ly/2U2I2za
Surface Newsletter
Know a friend or colleague who would be interested in receiving the Surface Newsletter?
Let us know : contact@digitalsurf.com
The newsletter is available for download on our website www.digitalsurf.com
SURFACE NEWSLETTER // SPRING 2023 11 111111
SOCIAL
Useful LINKS
HQ, R&D Center
16 rue Lavoisier
25000 Besançon - France
Tel: +33 38150 4800
contact@digitalsurf.com
www.digitalsurf.com
TRY MOUNTAINS® SOFTWARE
Take Mountains® for a test drive
Visit www.digitalsurf.com/free-trial
CONTACT US FOR AN UPDATE
Contact sales@digitalsurf.com for information about updating from previous versions to the latest Mountains® version

WATCH A MOUNTAINS® TUTORIAL
Get the most out of Mountains® software by watching one of our video tutorials www.digitalsurf.com/tutorials
LEARN SURFACE METROLOGY
Dive into our free online surface metrology guide and learn about characterizing surface texture in 2D and 3D www.digitalsurf.com/guide
CATCH UP WITH US
Control
May 9-12, 2023 | Stuttgart, Germany www.control-messe.de/en/
Surface Newsletter, April 2023
Editor : Christophe Mignot
Content editor : Clare Jamet
Contributors : Laure Aubry, François Blateyron, Eugenia Capitaine, Natalia Bermejo Gijón-Bonales.
Copyright © 1996-2023 Digital Surf, all rights reserved
DAYS TRIAL 30 TRY IT FOR FREE


