


Craig Allan, chairperson of OpenStreetMap Foundation, talks about helping run the world’s biggest community mapping project, working with artificial intelligence, and why after two decades there are still unmapped places.
Entering the peak year of the current Solar Cycle, GNSS users are already experiencing negative effects. The good news is that there are planning resources, and many of today’s advanced rovers can ride out all but the roughest solar storms.
Whether a parcel map is created for an engineering project, land development, valuation, tax assessment, land administration and management, for a subdivision, city, county, or whole country, the tools to create and manage them have dramatically improved.
A detailed look at the federal liaison program between MAPPS and the U.S. Geological Survey.
Winter makes surveying more difficult, but the
don’t let
little snow and ice stop them.
Publisher Shawn Dewees shawn.dewees@xyht.com
Editor-in-Chief Jeff Thoreson jeff.thoreson@xyht.com
Director of Sales and Business Development Chuck Boteler chuck.boteler@xyht.com
Creative Director Ian Sager ian.sager@xyht.com
Accounting and Classifieds Angie Duman angie.duman@xyht.com
Circulation subscriptions@xyht.com Phone: 301-662-8171
Editor, Located Jeff Salmon jeff.salmon@xyht.com
Editor, Field Notes Eric Gladhill eric.gladhill@xyht.com
Contributing Writers Marc Delgado Bernie Doud Eric B. Gladhill Jeff Lucas Gavin Schrock Michael Shillenn


Compiled by Jeff Salmon

A SUBSTANTIAL PART OF SWITZERLAND'S WATER RESOURCES EXIST in its complex karst aquifers, a critical natural system that continues to pique the interest of researchers. At the Neuchâtel Centre for Hydrogeology and Geothermics (CHYN), a team of scientists led by Professor Phillipe Renard and accompanied by climate scientist Dr. Tanguy Racine launched an initiative seeking an in-depth understanding of these resources.
The objective was to study the physics of water flows within caves or underground karst conduits using state-of-the-art technology—specifically 3D laser scanning with the Leica BLK2GO and a customized lighting unit from Méandre Technologie—to bridge the gap in understanding aquifers that traditional measurement and modeling methods couldn't cover.
According to the United States Geological Survey, karst areas are “characterized by distinctive landforms (like springs, caves, sinkholes) and a unique hydrogeology that results in aquifers that are highly productive but extremely vulnerable to contamination.” For the karst aquifers studied
SPATIAL COMPUTING IS REVOLUTIONIZING HOW BUSINESSES INTEGRATE digital and physical realms in real-time. The technology is utilized in augmented reality (AR), virtual reality (VR), and mixed reality (MR) applications to improve communication, collaboration, and productivity. Against this backdrop, companies across sectors, including some tech giants, are posting jobs related to spatial computing, reveals GlobalData, a leading data and analytics company.
Sherla Sriprada, business fundamentals analyst at GlobalData, says:
by CHYN, the project involved detailed mapping of the karst caves’ internal surfaces to understand water flow and contamination, among other factors.
Navigating the journey through kilometers of karst conduits required cutting-edge mobile scanning technology. BLK2GO was chosen as the tool to support the endeavor, offering a valuable solution for this task that required an efficient way to capture the complex geometry accurately. With the BLK2GO, researchers could map large areas quickly and with greater mobility than traditional scanning.
The work by Racine and his team shows a future where technology serves as the medium reaching underground water networks that were either hard to reach or difficult to measure and monitor. These scientists are now learning precisely how these aquifers, conduits, and caves work, which helps researchers and public works officials monitor and create more sustainable uses of water resources.
—Source: Leica Geosystems/Christopher Dollard.
“Companies are actively seeking talent to support the integration of spatial computing with artificial intelligence (AI) and machine learning (ML), indicating a robust job market for professionals in this field. Interest in the technology is also evident from discussions by companies in filing documents wherein their business strategies around spatial computing seem to revolve around making investments to drive innovation, developing new technologies, and collaboration with tech giants. And, interestingly, now we see tech giants alongside companies from other sectors as well posting jobs related to spatial computing.”

AUSTRIA, PANAMA, AND THAILAND ARE THE LATEST COUNTRIES TO SIGN the Artemis Accords. The NASA-led initiative aims for the responsible exploration of space for all humanity, bringing into the modern space age several of the original principles of space law that have been enforced since the Outer Space Treaty was approved in 1967.
The 51 signatory nations of the Artemis Accords, including the United States, will work to ensure that all space activities are aimed for peaceful purposes and conducted in a transparent manner to avoid conflicts. Last year, 18 countries signed the multilateral agreement.
“NASA is opening space to more nations and more people for the benefit of all,” said NASA administrator Bill Nelson. “Together we are building long-term and peaceful deep space exploration for the Artemis Generation.”
The Accords also bring to light current space issues, such as sharing of scientific data and interoperability, as well as long-term sustainability that focuses on managing space debris. To date, there are already 6,300 tons of debris in near-earth orbit, a problem that will continue to rise as more civil and private satellites are launched into space.
Several orbiting satellites have been hit by space debris in recent years, including Europe’s Sentinel 1a in 2014 and Lithuania’s MP42 in 2023. Just last year, a home in Florida was struck by a 1.6-pound (0.7 kg) piece of space debris, causing the owners to seek compensation from the U.S. space agency.
“Artemis Accords signatories shall commit to a safe, timely, and efficient disposal of spacecraft at the end of their missions,” according to NASA.
—Marc Delgado, marc.delgado@xyht.com

SWIFT NAVIGATION'S SKYLARK PRECISE POSITIONING SERVICE transforms accuracy, reliability, and safety in everything from robotic equipment to autonomous vehicles. Powering more than 10 million vehicles and devices, Skylark provides centimeter-level positioning accuracy using advanced atmospheric modeling to correct GNSS signal errors, improving precision by up to 100 times.
Whether the application is precision agriculture, GIS, UAVs, robotics,
mobile devices, rail, fleet/logistics, or automotive, Swift Navigation’s Skylark Precise Positioning Service makes it easier than ever to bring cloud-based GNSS corrections for accurate, reliable and cost-effective location services to your application. With flexible solutions designed for mass market global deployments, Swift's precise positioning technology unlocks digital innovation across industries.
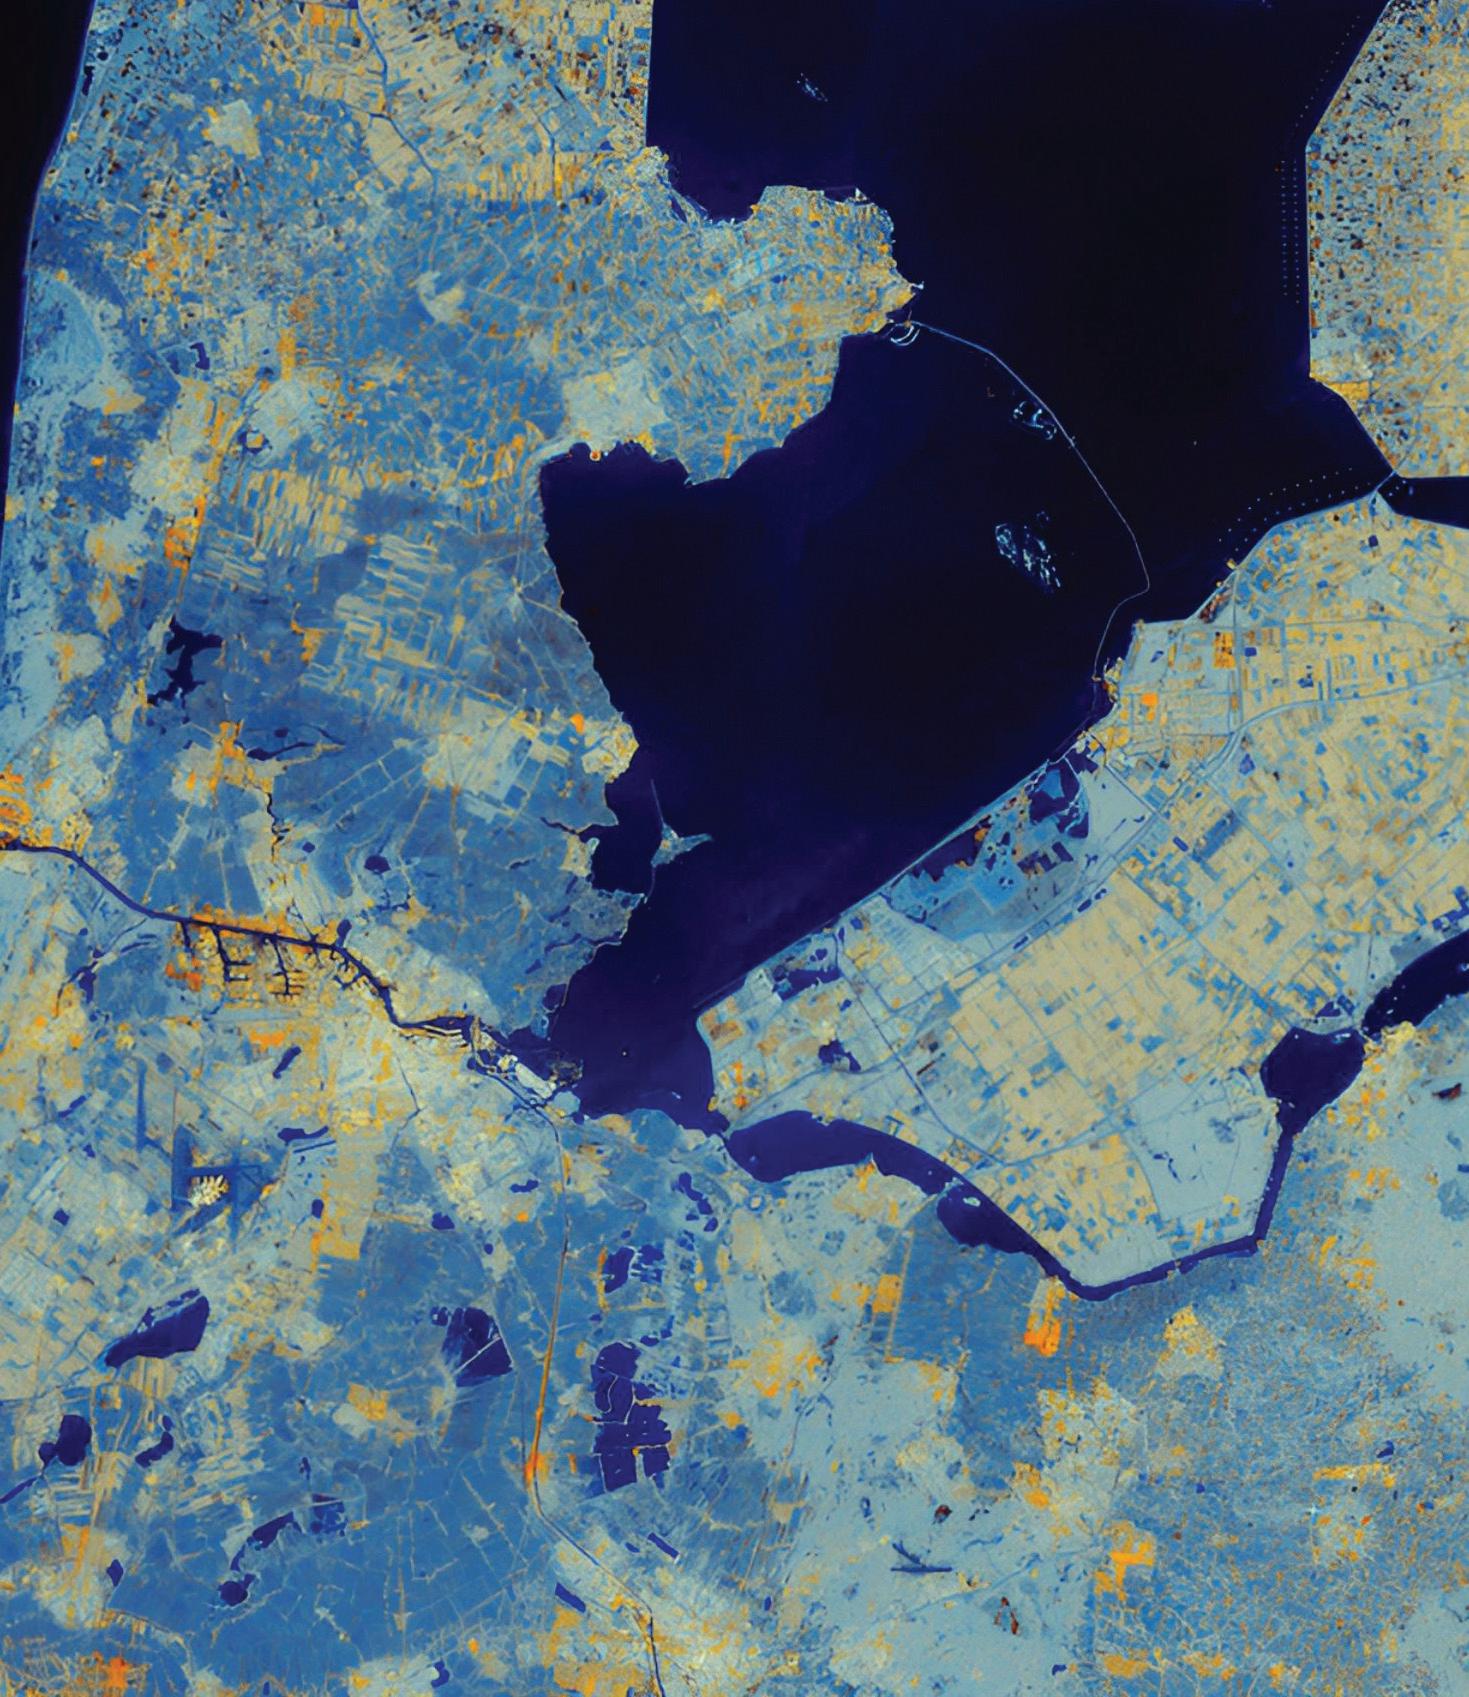
RADAR IMAGING TECHNOLOGY HAS A NEW CHAMPION, and it is now orbiting in space. Sentinel-1C, launched in early December, is the latest working satellite from the European Space Agency (ESA) that is equipped with a highly advanced synthetic aperture radar (SAR) instrument.
Compared to optical-based imaging satellites, the Sentinel-1C transmits radar signals to capture high-resolution Earth imagery day and night, under all weather conditions. With such capability, radar imagery can support disaster response, provide better land and ocean maps, as well as allow the monitoring of built assets like roads and bridges at high detail. Sentinel-1C
is part of Copernicus, Europe’s Earth observation program, which has been launching the family of Sentinel satellites since 2014.
Just 56 hours after its launch, the Sentinel1C had already delivered its initial SAR images, including the city of Brussels in Belgium and parts of the Netherlands, all with exceptional levels of detail and data quality.
“These images highlight Sentinel-1C’s remarkable capabilities,” said Simonetta Cheli, ESA’s director of earth observation Programs. “The data already demonstrate how this mission will enhance Copernicus services for the benefit of Europe and beyond.”
—Marc Delgado, marc.delgado@xyht.com
CARLSON SURVEY 2025 OEM IS DESIGNED TO COMPLEMENT land surveying operations and provides a variety of survey features to process data from surface modeling to Least Squares Network Adjustment. Users work seamlessly between the office and the field by utilizing
Geo Week
February 10-12
Denver, CO
Los Angeles Geospatial Summit
February 24-26
Los Angeles, CA
Esri Developer & Technology Summit
March 11–14
Palm Springs, CA
Amsterdam Drone Week
April 8-10
Amsterdam, Netherlands
Xponential/AUVSI
May 19-22
Houston, TX
CGA Conference: Geography of Digital Twins
May 22-24
Cambridge, MA
GEO Business
June 4-5
London, UK
Hexagon LIVE
June 16-19
Las Vegas, NV
Esri User Conference
July 14-18
San Diego, CA
Commercial UAV Expo
September 2-4
Las Vegas, NV
company-wide design styles for ease of use and efficiency. Carlson Survey works on IntelliCAD (built-in), AutoCAD OEM (built-in) and AutoCAD (sold separately), and is compatible with 64-bit Windows 7, 8, 8.1, 10, 11 (Vista and 32-bit are not supported).


TRIMBLE IS UNVEILING A FREE VERSION OF TRIMBLE PROJECTSIGHT, featuring AI and advanced tools that were previously inaccessible to many in the construction industry. This initiative underscores Trimble's strategy to empower contractors of all sizes with connected data and workflows. ProjectSight provides a centralized, real-time solution for managing and sharing project information, including documents and drawings. Contractors use the application to collaborate within their teams and with other contractors, architects,
GEOSPATIAL AS WE KNOW IT NOW WOULD NOT EXIST WITHOUT the pioneering efforts of the Open Geospatial Consortium (OGC). Founded in 1994, the international organization develops and maintains international standards for geospatial content that covers GIS data processing and data sharing, location-based services, and sensors that drive seamless data exchange.
During its 30th anniversary event held in Washington, D.C., in December, the OGC honored its co-founder David Schell with a Lifetime Achievement Award for spearheading interoperability in geospatial data systems. Thanks
engineers, and project owners to gain efficiency and minimize risk.
Trimble ProjectSight empowers contractors to connect construction teams by capturing, organizing, and sharing critical project data, such as drawings, requests for information (RFIs), submittals, and photos. Jon Fingland, vice president and general manager for Trimble construction software solutions, said, “A no-cost version of ProjectSight removes barriers to entry and presents a simple way to experience the project management benefits."
to Schell’s work, we can now access, analyze, and exchange geospatial data from multiple sources efficiently and seamlessly.
OGC’s first open standard, the Simple Features Access (SFS), was approved in 1999 and it standardized how points, lines, and polygons are stored in a geospatial database. Now, OGC standards comprise an entire gamut of familiar acronyms such as KML, WFS, WMS, GML, XML that help run the geospatial industry. Happy birthday, OGC.
—Marc Delgado, marc.delgado@xyht.com

PICTERRA, A PROVIDER OF GEOAI SOLUTIONS, HAS LAUNCHED a new all-in-one product for plot monitoring, reporting, and verification, to enable companies involved in the supply chain of soft commodities and forestry to meet compliance and sustainability goals.
Picterra Tracer is designed to simplify and enhance the process of creating, validating, analyzing, and monitoring land plots and boundaries. By utilizing satellite, drone, and aerial imagery, along with global and regional open-source layers and a visually intuitive geographic interface, Picterra Tracer enables precise and reliable plot analysis.

Developed with flexibility and efficiency in mind, it enables producers,
operators, and traders involved in the supply chain of soft commodities and forestry to comply with critical environmental regulations and sustainability reporting, such as the European Union Deforestation Regulation (EUDR).

VISITORS CAN ONCE AGAIN ENTER ONE OF PARIS’S ICONIC MONUMENTS, thanks to restoration work supported by digital twin technology. The Notre Dame Cathedral, destroyed by fire in April 2019, was officially reopened in December after five years of repair works that respected medieval craftsmanship and building traditions.
To achieve this feat, restorers relied on the latest
3D scanning technologies, rendering a completely virtual copy that was as faithful as the original cathedral.
Using Notre Dame’s digital twin allowed experts and craftsmen to locate every debris of the church and then to virtually manipulate each piece in 3D space, effectively pinpointing their original position before the fire.

Aside from aiding its reconstruction, the digital twin was also used to improve the interior acoustics of the cathedral by simulating how sound travels as it bounces on the stained-glass windows, stone walls, and pillars.
The digital twin of the Notre Dame Cathedral will now be used for managing the building as well as to support future restoration works.
—Marc Delgado, marc.delgado@xyht.com

KOMPASS BMS OFFERS A WIDE RANGE OF REAL-TIME DATA and powerful analytics tools to provide geospatial businesses a way to see how every part of the business is working and find the best decisions to push forward. Features include:
• Efficient Crew and Equipment Scheduling: Optimize resource allocation and prevent conflicts with advanced scheduling capabilities.
• Comprehensive Project Management: Maintain control over budgets, milestones, and timesheets with real-time access, ensuring projects stay on track.
• Integrated Financial Processes: Simplify invoicing, expense tracking, and payment management within a single platform, reducing administrative burdens.
• Employee and Qualification Tracking: Monitor team certifications and qualifications, ensuring the right expertise is applied to each project.
THE STONEX S999, EQUIPPED WITH 1408 MULTI-CONSTELLATION channels, promises precise and reliable positioning by supporting all GNSS signals, including GPS, GLONASS, Galileo, QZSS, IRNSS, and BeiDou. It features an integrated 4G modem and a 1-Watt UHF radio operating in the 410-470 MHz and 902.4-928 MHz frequency ranges, ensuring constant connectivity and an extended working range.
The advanced IMU technology enables tilted measurements of up to 60 degrees with rapid initialization, enhancing field productivity by as much as 40 percent. The S999 receiver is also equipped with two cameras: one for stakeout and one for photogrammetric applications, expanding the system’s usage possibilities.


Craig Allan, chairperson of OpenStreetMap Foundation, talks about helping run the world’s biggest community mapping project, working with artificial intelligence, and why after two decades there are still unmapped places
By Marc M. Delgado, PhD
Taking care of a 20-year-old can be quite a chore. But not for Craig Allan, the current chair of the OpenStreetMap Foundation’s board of directors. Together with six other board members, his job is to make sure that OpenStreetMap (OSM), the world’s largest crowdsourced geospatial project, continues to deliver on its promise to make mapping data accessible to everyone. In fact, he finds that being part of the OSM Foundation exciting.
“I am a fan of building good processes that help an organization deliver much more with a lot less effort,” says Allan, who is now on his third year with the OSM board. “OpenStreetMap could do so much more, and I want to take it there.”
Started in 2004 in London by Steve Coast to make free maps while riding his bike on Regent Park, OpenStreetMap is now all grown up. The mapping platform celebrated its 20th anniversary with mapathons hosted by various local OSM chapters from Australia to Japan.
a good deal of popular support possibly because a lot of the early meetings were in pubs,” he says.
Between tinkering with maps and toasting pints of beer, the OpenStreetMap project grew rapidly, reaching about 1,000 registered users by Christmas of 2005. A few months later in August of the following year, a group of early OSM contributors came together and formed the OpenStreetMap Foundation. Since then, the foundation has
sands of mappers to gather geospatial data and save them in the foundation’s servers.
“The OSM then gives the data away for free to anyone who wants to use it,” he says. “I know it’s a strange business model, but it works really well.”
OpenStreetMap had its 20th anniversary last year. Tell us how you celebrated it?
We celebrated with birthday party events, with cakes and candles, where mappers came together to celebrate. There were more than 60 birthday events globally. Most of those were mapathons–a gathering of OSM enthusiasts for the purpose of mapping.

become the legal custodian of all OSM data and infrastructure.
OSM currently counts around 60,000 map requests per second from around the world, with users coming from various websites such as Meta, MapBox, Esri, and Tomtom, to ride hailing companies like Uber and Lyft. There is also a huge OSM community from humanitarian organizations and agencies under the United Nations.
“The OSM Project began as a response to the rigid copyright restrictions on the use of UK’s Ordnance Survey map series,” says Allan. This egalitarian approach of making maps more accessible was unheard of before that time, and it may have helped the public to easily warm up to the mapping project. Plus, there was a strong camaraderie among the first OSM contributors, recalls Allan. “The mapping application gained
Allan is in his 14th year as an OSM mapper. He has also worked as a professional urban and regional planner “with side gigs on anti-apartheid politics and a little software development,” he adds. The South African local still remembers his first OSM contribution which was fixing a map error near his childhood home in Durban.
“I love to map unmapped spaces, especially in Africa,” he says. “That’s because I know that being on the map greatly increases a rural village’s chances of receiving government and NGO services, which then leads to a big improvement in their quality of life.”
Allan is also a supporter of free open data and software, a passion that he carries with him at the OSM Foundation. Everyday the foundation encourages tens of thou-
How are the OSM Foundation and OpenStreetMap related to each other?
OpenStreetMap is a big bundle of different things. We talk of the “OpenStreetMap Project” to describe the global movement of people who contribute data or use our data. The “OpenStreetMap Foundation” is part of that movement. The foundation is the governing body that supports but does not control the movement. If anything, the movement controls the foundation through lots of community review and feedback on everything that we do as a board.
The foundation supports the OpenStreetMap project in a number of ways. The core role is to host and develop the hardware, software, and infrastructure for the delivery of OpenStreetMap. Without those computers, we are nothing.
The foundation has a board which is composed of seven members. And then there are eight working groups with about 84 members. Roughly 90 people
are involved, but everybody is a volunteer. We only have one employee who keeps the IT systems running, plus three contractors who do administrative and software development.
And how does the OSM Foundation fund its activities?
To pay for the whole intricate workstream I just described, we have to do a lot of fundraising. Our fundraising efforts result in gifts in cash and kind that amount to a little over $1 million dollars every year.
We are a non-profit organization, and we get a lot of free stuff. Like the hugely valuable Content Delivery Network (CDN) is provided by the company Fastly. The load on the CDN servers varies by time of day, peaking currently at around 60,000 requests per second. That’s six gigabytes per second of traffic.

We also get free use of global satellite photos provided by Microsoft, Esri, and MapBox, which is a big donation. Then there are local aerial and satellite photography supplied for free by many government and private sources.
For our financial donors, the largest sums come from Tomtom, the Dutch navigation supplier, Microsoft, and Esri. We also get financial support from Meta. Some of the other big contributors are Mapbox, Grab, Komoot, and Gojek. Individual donors contribute a large amount as well. We don’t sell anything, and we don’t advertise on our sites.
Who are the main OpenStreetMap data contributors right now?
There are no stand-out contributors. The mapping activity is truly crowd-sourced, and it is the contributions of many individuals working separately that build the OSM database.
There are some organized mapping activities by companies like Apple, by the United Nations, by the Humanitarian OpenStreetMap Team, YouthMappers and many other groups. However, organized mapping doesn’t stand out above the contributions of individual contributors.
There are also some extraordinary individual contributors. One that comes to mind is the user “andygol” who has made almost 6 million changes to the map. However, mapping is not a competition. We deliberately don’t make mapping competitive by publishing scores because there is a real risk of attracting people who will add nonsense data to cheat their way to the highest score.
And who are its main consumers?
Our consumers are anybody who sees a map on the web or uses route planning. OSM data is used in multiple phone apps, Apple maps, Microsoft’s Bing maps, in many car navigation systems, in weather websites, on Wikipedia, as well as ride-hailing services and delivery services. If you have a pizza delivered, there is a reasonable chance that OSM data was used to plan and execute that delivery.
What then are the main challenges in making sure that the OpenStreetMap platform runs smoothly on such a large scale?
There are only two challenges really. Making sure the data comes in and making sure the data goes out. That is the role of the OSM Foundation Board–to make sure that those two things keep on happening.
Making sure that the data comes in is a matter of first providing a good culture of contributing data, and, secondly, providing the tools that make it possible to contribute. The culture and tools part can be unpacked some other time because it is very complex work. What is important to mention now is that much of that work is done by separate unrelated organizations which voluntarily organize mappers and by software developers who build mapping tools like JOSM and Rapid Editor.
The foundation does a lot of supporting work in-house, providing the Wiki to guide mappers and providing some community chat channels for mappers to talk about mapping. We have what we call the “Local Chapters and Commu-
nities Working Group” which organizes mappers around the world.
The other challenge of making sure that the data goes out is our organizational mission. Our business is to deliver free geospatial data. This type of work is much more technical. We run a lot of servers to gather and process incoming data, to store it and to process outgoing data. There is a suite of enabling software that makes all that possible.
What technological changes are being implemented to make sure that the OpenStreetMap platform remains accessible to everyone who needs it?
We delegate software management to our “Engineering Working Group” and hardware and networking to the “Operations Working Group.” They are very cautious about changing software without good reason. The major change currently underway, in fact at trial stage, is delivering map tiles as vector data.

the local language. For example, I battle with reading the OSM map in Arabic speaking areas. We’re going to fix that and have multi-language maps.
And while we’re talking of accessibility, providing maps for people with different levels of vision is a big challenge. With vector tiles we can rapidly develop maps better suited to color-blind mappers. Researchers in the Netherlands are now working on developing printable tactile mapping for blind or low vision users. We’re monitoring that work because we would like everyone to have access to free maps.
With generative artificial intelligence technology becoming more widespread, what are OSM Foundation’s plans to make sure that community volunteer mapping is future-ready?
Our data is already widely used for training AI models that interpret aerial photography. One end-user AI product that is now being used for volunteer mapping is Rapid Editor developed by Meta. Rapid Editor is based on the popular iD editor. Rapid Editor supports human supervised AI feature recognition, which greatly speeds up the map tracing and tagging work. However, we do not currently allow unsupervised editing by AI.
Which sector do you think is OpenStreetMap making a big impact and why?
tional Committee of the Red Cross, and Doctors Without Borders. The most public impact therefore of OSM is in humanitarian efforts, particularly the work of Humanitarian OpenStreetMap where their members work to rapidly map disaster areas and high-risk zones where catastrophes are likely to happen.
The public sector also uses our data, mostly in GIS-based mapping. This is far less high profile, but it is very widespread.
In your opinion, how has OpenStreetMap evolved in the last two decades?
Our users don’t contribute actual maps. They add detail to one existing map which still has a lot of gaps. Slowly the gaps are being filled, and the quality and detail of the data is also being improved. Our evolution is slow, but over two decades we see that the OSM map is filling up.
In Zurich, for example, every road, building, bicycle parking rack, and street tree is mapped. But in the Democratic Republic of the Congo, whole towns are still blank and full of unmapped spaces. We need more resources to speed up mapping in areas where people don’t have access to computers or even the Internet.
This change will allow reduction in data size per tile on the network, and it will support far more flexible styling of tiles.
Practically it means that map data will arrive in the user’s browser faster and there will be many more ways the map can look. But one immediate advantage of better styling is to have maps available in a range of languages, which makes it much more accessible for many users. At the moment OSM uses only
The big impact is in the commercial sector, as OSM underlies many commercial applications. For example, OSM is available as a free base layer in Esri’s products, so all Esri users are one click away from using OSM data. And most do take advantage of it. At the same time, four of the top five ride-hailing companies including Uber, Lyft, Ola, and Gojek all use OSM. Our fundraising efforts are mainly focused on persuading more commercial users to contribute to OSM.
It is not possible to do more than scratch the surface of who uses our data, but the very prominent users of OSM are the United Nations, the Interna -
The big change in recent times is an increase in the need for corrections and updates. We know that no map is ever fully up to date. Some areas were mapped in OSM many years ago, and that data is now inaccurate. We need our users in well-mapped areas to revisit their mapping and to update road alignments, commercial uses, hours of opening, and so on.
So, I invite you to get involved. Go to the OSM website (osm.org), find your neighborhood and hit the edit button. Something there will be wrong, missing, or out-dated. Change the map, click save and you’ve joined the movement. ■
Marc Delgado, PhD, is a GIS specialist who crisscrosses continents teaching GIS in Asia, Europe, South America, and Africa.
Entering the peak year of the current Solar Cycle, GNSS users are already experiencing negative effects. The good news is that there are planning resources, and many of today’s advanced rovers can ride out all but the roughest solar storms.

By Gavin Schrock

We are experiencing the peak of Solar Cycle 25 (the 25th since solar cycles were first recorded). The rocky times are expected to extend through 2025 and into early 2026. While this solar cycle peak may not be worse than previous ones, there have already been some significant periods of intense geomagnetic activity. You have likely already seen posts and news items about Aurora Borealis activity viewable in places that normally do not see it (a sure sign of rough solar periods).
You can find much of the background in xyHt’s online article, “Preparing for the Effects of Solar Cycle 25 on GNSS Applications.” In the months since that article was published, we’ve conferred with RTN operators and GNSS developers (who have monitoring arrays). An analysis of data feedback from several solar storms has helped us develop some recommendations for how to prepare for and minimize the effects of solar events.
The May 10, 2024, Gannon geomagnetic storm, was the most significant since the Halloween storms in 2003. In terms of high-precision GNSS, here are a few things we learned from the analysis of the May storm and two other storms:
• Not all GNSS rovers were affected in the same way. Some saw only slower fixes; others experienced no fixes and/or terrible residuals.

gled, or were not useable, though most of this may be due to being limited to single or dual constellations.
• Rover quality matters. Low-tier and DIY rovers (and boards in some drones), that otherwise might perform adequately for many types of work, did not fare well. For the same reason such units often struggle under canopy or in the vicinity of multipath hazards, solar storms (albeit infrequent) hit them hard.
• Post-processing does not help. If the base (and rover) data for a period was affected by the solar storm, then no amount of post-processing will fix it.
There are, of course, certain exceptions. Scintillation is happening all the time, even during the Solar Minimum. It is typified by intense, local, and often brief periods of elevated space weather conditions. During solar storms, the effects of scintillation can be exacerbated. So, even top-performing rovers that were otherwise riding out the storm just fine, may have experienced brief periods of intense effects. And some users also experienced cellular connectivity and radio issues.

• Multi-constellation (three or more) GNSS, implemented at both the base (or RTN) and rover, rode out the storms far better than single-dual constellation gear. The former, especially newer gear with the solar activity measures manufacturers have recently added, typically continued to operate just fine. Users may have experienced slightly slower fixes, but residuals were mostly acceptable.
• Older rovers strug -
You probably see frequent, seemingly daily, news bits about “the biggest solar storm ever.” Or you may have subscribed to an email list for solar warnings. The problem is that the sometimes-confusing terminology and various index conventions these sources present do not provide a GNSS rover user with a scale they can relate to exactly what to expect in the field.
While there is an index developed specifically for GNSS,

Be prepared: In short, learn how to find and interpret solar activity prediction resources and warnings…. perhaps it
is
a good time to upgrade your gear.
the I-95 ionospheric index, and it is not a predictive resource, it can still be very useful for users to better correlate with the scales presented by the predictive resources. More on I-95 later.
The other challenge of space weather resources and predictions is that these are expressed mostly in terms of global levels, and may or may not reflect what is happening, or could happen in your specific vicinity. For instance, how does a global G2 storm warning equate to a Kp index level for North America?
Fortunately, for different regions of the world, prediction resources are
more locally focused. In North America for instance, the National Oceanic and Atmospheric Administration (NOAA) provides a three-day predictive tool that is expressed in the Kp scale. Check this index daily at www.swpc.noaa.gov. Don’t send your crew out to survey on the other side of the state on what is predicted to be a 7+ Kp day (without their total station as a backup).
You might see a G-level solar storm warning, and/or Kp index prediction, but keep in mind, that those are often issued on a global level; effects could be very different in the geomagnetic equatorial region and the far north of North America, etc.


While it is difficult to predict just how much certain level events will affect your specific rover under your local conditions, there are several types of indexes noted in space weather notifications that can help you develop your own “rules-o-thumb” for various scenarios.
Here is where the I95 index could be very handy. I95 is calculated by many local, state, or regional real-time networks (RTN) using data from their own fixed stations. I-95 is often expressed in units of expected (if uncorrected) error (centimeters) and/or color-coded levels.
During rough solar days, users can begin to develop rules of thumb for their gear, by looking at observed Kp levels and locally observed I-95 levels, as in Figure 1. Then you can correlate these with what your gear experienced at different levels. This can make forecast scales more useful in planning your fieldwork.
The article, “Preparing for the Effects of Solar Cycle 25 on GNSS Applications” on xyHt.com includes details about what GNSS
some cases, a firmware update (for newer gear) activates it. But for older gear, there is no option for this.
Drone work can especially be challenging and frustrating during bad solar days. Many (even some of the most popular) drones have small, light, and relatively inexpensive GNSS boards. There are typically very popular, low-cost GNSS (and GNSS+IMU) boards developed for the nascent autonomy market, and quite


rover manufacturers have done, since the last solar peak, to help mitigate the effects of solar storms. In some cases, the features were only practical on newer, multi-constellation rovers (with a lot of processing power). In
appealing to mass-market drone manufacturers. Some firms have even taken the same boards and made rovers out of them (some via DIY kits). This is all great under optimal conditions, but perhaps it is
not wise to try to use these during bad solar days.
In the first 10 months of 2024, we had recorded a dozen bad solar days. Fortunately, half of these fell on weekends (pure luck). The prospects of a no-go day about once a month might not impact the operations of some uses, but it can be a serious proposition for others.
And please, don’t fall into the “vibe-ospheric” trap. Yes, we are at the peak of a solar cycle, and it casts bad vibes over field operations, but you should not blame everything on it. You might be having comms issues, settings issues, multipath, or another issue you should troubleshoot. Instead, some users blame it all on the sun.
Planning ahead for field operations is not new. After all, you can’t do star shots or sun shots on cloudy days. NASA can launch a rocket to the moon, but not on a rainy day. Plan ahead. ■
Gavin Schrock is a professional land surveyor who writes on surveying, mapping, GIS, data management, reality capture, satellite navigation, and emerging technologies.


Surveyors are keenly aware of how much sweat (and tears) can go into the surveying of an individual parcel and for finding, collecting, and evaluating the evidence and records to determine the boundary. Now imagine doing this on a grand scale: for a development, city, county, or even an entire country.
Parcel maps, from a few parcels to hundreds, thousands, or even millions, are subject to the same fundamentals as for an individual parcel: fidelity to the physical evidence on the ground, to the records, to case law, and relationship to adjoining parcels. It’s not just about creating geometry. The key is how well geometry represents the evidence and records.
Recreating that geometry with ink and paper, the standard until the 1980s, required the addition of text and notes to provide the link between evidence and records. But you are working within the bounds of a physical medium. In the electronic age these texts and notes are stored as attributes in a database and tied to original source documents. With such geometry and attributes, digital maps and scale maps can be created for publication if required.
Parcel maps can serve a wide spectrum of uses. It might be for tax assessment, where the precision and accuracy may not need to be as stringent as a recorded survey. A parcel map created for inclusion in a set of engineering plans would need to be survey quality, for example, to ensure that constructed elements fall within the subject parcels, easements, and rights-of-way.
A certain class of parcel map, known as a cadastre (or cadaster) may serve as the legal instrument of tenure, title, and/or ownership. There are entire countries where a national cadastre is the official registry of titles. In such cases, Cadastre’s will be held to the same stringent expectations, and workflows as for mapped boundary surveys—plus a few more:
High-count electronic parcel maps representing tens of thousands of parcels are not new. However, the state of digital resources, tools, processing power, and data systems were nowhere near as powerful and sophisticated as they are today.

Whether
a parcel map is created for an engineering project, land development, valuation, tax assessment, land administration and management, for a subdivision, city, county, or whole country, the tools to create and manage them have dramatically improved.
BY GAVIN SCHROCK

• Physical evidence in the field, where each may apply in the hierarchy of evidence. While this can vary from state or country, such hierarchies can include natural and human-made monuments, evidence of occupation, calls to natural features, etc.
• System of Record. Those officially recorded chains of title, deeds, other records of tenure, and other instruments of conveyance supporting parcel lineage.
• The use of coordinate geometry input tools (COGO) to faithfully “embed” the defining geometry in the electronic medium and tools employed. In addition, there is a need to be able to perform statistical analyses and adjustments (where appropriate) on these geometries.
• Database archiving. While not always required, the ability to access and view a snapshot in time of stored parcel information is becoming increasingly important. This is especially true for cadastres.
• Multi-purpose cadastre. For example, for the parcel map to accommodate other uses, like assessment, public safety, land administration, and management.
COGO tools in CAD, civil, and surveying software, due to the inherent data structure for linework elements and adjustment tools, have always been up to the task of parcel creation—but not nec -
essarily at scale, and often with limited capabilities for incorporating records and databases.
While GIS is more data-centric than the precise geometry of CAD, it is far better suited for creating and managing maps with many parcels. Cadastres, especially at a national level, are almost without exception created and managed in GIS. Legacy GIS did not have more than rudimentary COGO tools and presented low-fidelity geometry (i.g., segmented curves) primarily for display purposes. High-fidelity geometries were often created in CAD and imported into GIS. That is still an option, but now this is only one of many options.
GIS parcel maps covering large areas have been around for decades. However, early adopters often needed to do a lot of customization within the base GIS environment. In a way, these pioneers may have become hobbled by their own forward-thinking. Because of such deep-rooted customization, many legacy parcel theme managers felt that migra -
tion to new and improved environments was sometimes viewed as too costly and time-consuming. This has changed with advanced out-of-the box functionality.
The tools to create and manage a high-fidelity, precise, and data/record-rich parcel map or cadastre have improved by orders of magnitude. I was among those whose experiences dealing with the sometimes cumbersome, dual-environment reality of legacy parcel mapping have left some scars.
But this has all changed. If today’s tools existed back in the day, there would be many more, high-fidelity parcel maps out there, powering effective management and decision-making, saving time, effort, money, and a lot of frayed nerves.
The example that most comes to mind is Esri’s Parcel Fabric, available in ArcGIS Pro. Fabric is a good term for parcel maps and cadastres as metaphor for the interwoven structure (and data) of land parcels. Not an endorsement, but this is among the top solutions I have found yet to undertake such mapping.
An excellent paper on advances in parcel mapping is “Maintaining Cadas -

tral Measurement Data in the Parcel Fabric” (found on www.fig.net). The paper was authored by Tim Hodson, principal product engineer at Esri and

presented at the FIG (International Federation of Surveying) Working Week in 2020 in Amsterdam Netherlands. From the paper summary:
“The next generation parcel fabric technology allows cadastral organizations to store parcel-based measurement information as well as its metadata. Organizations that serve as the authoritative source for multi-purpose land parcel information systems require specific metrics on the captured data.”
Such a fabric is not just geometry, but also database driven, and has been a long-desired meld of environments. This not only solves legacy workflow issues but makes the end products, such as web maps, apps, and web services, much more useful.
Cadastral, parcel, and boundary geometries hold much more value if the relationship to the defining records is preserved.
“The data model for the Parcel Fabric starts with the database table we call the “records feature class” said Hodson. “It is basically a table that represents each individual land record. For example, if you have a new subdivision, you create a record in the records feature class. It represents that recorded plat or subdivision document as a sin -
gle feature. But then, there is a one-tomany relationship from that record to every parcel in the plat that is created via COGO, etc.”
A parcel can have multiple associated record documents. Say that in Hodson’s example, several of the plat parcels are subject to rights-of-way or easements, initially or later; those record documents can be represented and attached to the parcel. The list of scenarios can go on and on. “We are basically managing the parcel fabric as a system of records,” said Hodson.
A key feature of Parcel Fabric is its ability to track historical parcel lineage using link charts. These show a flowchart of the changes between parent and child parcels, that are tracked through edit workflows like a parcel split or a merge of parcels.
“The records are a driver in many ways,” said Linda M. Foster, PLS, GISP, MGIS director, land records/cadastre solutions at Esri. “Using records, we can also define parcel lineage. That could be chain-of-title in a cadastre. We can model what’s happening over time in our land records or our land system.” Foster also mused about how great it would have been to have such capabilities back when the original
Public Lands Survey System (PLSS) of the U.S. was created.
You can add multiple parcel types, defined for your needs.
“Let’s say you have a PLSS section quarter section you’ve resolved,” said Hodson. “You can create separate parcel types for those, for easements, rightof-way, tax parcels, and lots. You can define these when you are setting up your model and add them as needed.”
While in the U.S. there may never be a national or state-level cadastre as the instrument of title registration and ownership, there are maps for tax assessment in nearly every county, city, or state (depending on respective property taxation scenarios). These might range from analog to digital, in CAD or GIS.
“Sometimes they’d take a blueline map, hang it up, take a photo or scan it, and build a tax parcel theme from it,” said Foster. “Now, in addition to those options, you can create the parcels with COGO to get it as precise as you need.”
Expedience and immediate needs drove the creation of many legacy parcel maps (e.g., 9-1-1 modernization in the early 2000s), and often that required compromise. However, even if a low-precision map can serve a great many valid needs, plus or minus one meter, for example, can result in no small amount of consternation for landowners, not to mention heart palpitations in surveyors.
New tools certainly modernize parcel mapping, but also high-resolution aerial (and drone) images, and more highly productive field surveying tools (in the right hands), add to a mix that results in (or, at a minimum, demands) better parcel bases.
In Part 2 will explore how the tools have been made surveyor-friendly, and who’s implementing ambitious parcel mapping programs. ■
Gavin Schrock is a professional land surveyor who writes on surveying, mapping, GIS, data management, reality capture, satellite navigation, and emerging technologies.
BY MICHAEL SHILLENN AND BERNIE DOUD
This is the fourth in a series of articles highlighting the MAPPS Federal Agency Liaison Program and its open dialogue with federal agencies to enhance opportunities for MAPPS members and support federal agencies in sustaining and growing their programs, ultimately benefiting all Americans.
MAPPS members have a strong interest in U.S. Geological Survey (USGS) programs, contracts, and ongoing collaboration. The enduring private-public partnership between MAPPS and USGS’s National Geospatial Program (NGP) has been a cornerstone in advancing geospatial initiatives critical to the nation’s infrastructure and environmental management.
Decades of dedicated partnership have significantly contributed to the success of key USGS initiatives such as the 3D Elevation Program (3DEP), the 3D Hydrography Program (3DHP), and the Earth Mapping Resources Initiative (EarthMRI).
MAPPS Liaison Program: The MAPPS Liaison Program serves our member firms by fostering meaningful dialogue between the private sector and government agencies. Benefits of the liaison program for MAPPS members and federal agencies are many and include advocating for sound geospatial public policy, aligning business strategies with upcoming opportunities, participating in actionable educational programs,
developing relationships with agencies and peers, and promoting small and large business engagement.
About USGS: Within USGS the National Geospatial Program (NGP) provides National topographic information to advance science, support government, enlighten citizens, and enable decision making. With help from the private sector, NGP provides foundational digital geospatial data representing the topography, natural landscape, and manmade environment of the United States making the NGP the optimal choice for MAPPS-USGS engagement focused on supporting numerous key initiatives and programs.
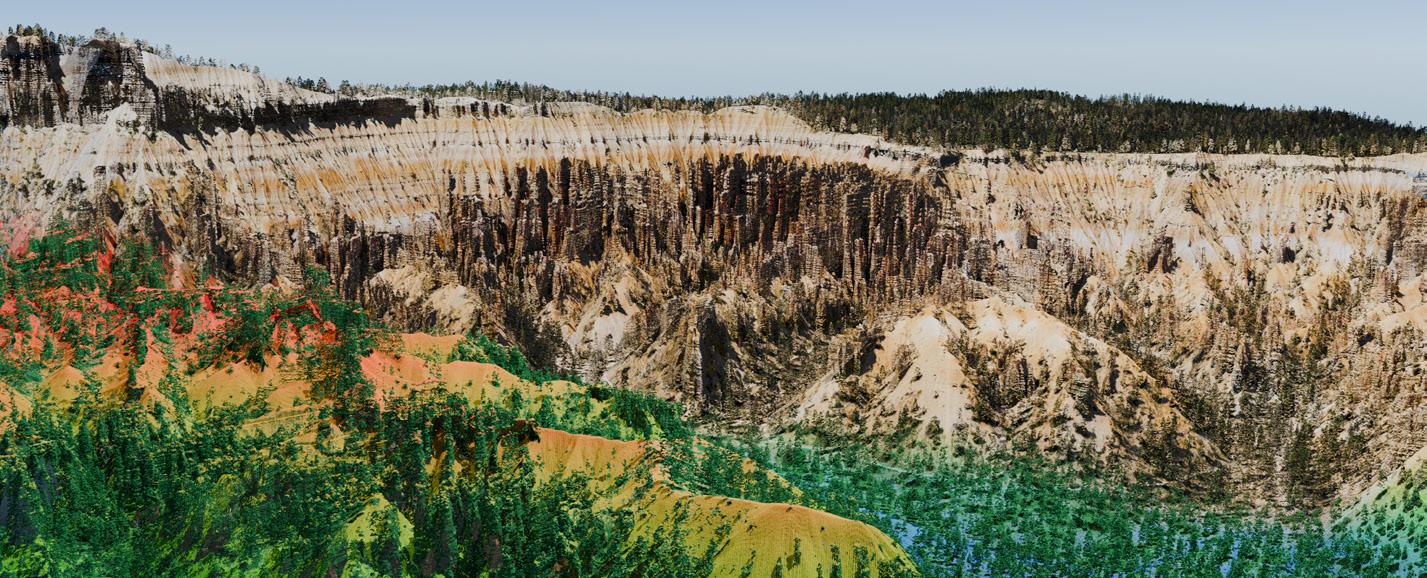
3D National Topography Model (3DNTM): 3DEP and 3DHP programs are components of the 3D National Topography Model (3DNTM), a comprehensive USGS initiative designed to create a high-resolution, three-dimensional representation of the Nation’s topography. The 3DNTM integrates elevation and hydrography data to support a wide range of scientific and practical applications, enhancing our understanding and management of the nation’s natural
and built environments.
Strengthening 3DEP: 3DEP systematically responds to growing needs for high-quality topographic data and 3D representations of the nation’s natural and constructed features. 3DEP data are essential for a wide range of applications, including flood risk management, infrastructure development, natural resource conservation, and disaster response.
Since 3DEP’s first full year of production in 2016, MAPPS and its member firms have worked closely with USGS to foster strong partnerships by actively educating potential collaborators and advocating for their involvement. This collaborative approach has expanded the user community, ensuring continued funding, participation, and the sustainable evolution of the 3DEP program.
The partnership between MAPPS and USGS has also been pivotal in driving the adoption of advanced technologies and methodologies for elevation data collection, significantly enhancing operational efficiencies. Looking ahead, this partnership aims to further expand the program’s reach, integrate even more innovative technologies, and ensure comprehensive, high-resolution, current elevation data coverage across the nation.
Advancing 3DHP: The 3D Hydrography Program (3DHP) is another critical initiative that benefits from the MAPPSUSGS partnership. 3DHP aims to develop a comprehensive, high-resolution 3D hydrography dataset that supports water resource management, environmental protection, and infrastructure planning. The collaboration has focused on integrating cutting-edge technologies and best practices in hydrography, resulting in more accurate and detailed water data.
MAPPS’ member firm expertise in data acquisition and processing has been vital in the transition to an operational status starting in 2024. As with 3DEP, MAPPS has been instrumental in advocating for 3DHP, securing funding, and fostering partnerships with other federal agencies and stakeholders.

Enhancing EarthMRI: Launched in 2019, the Earth Mapping Resources
Initiative (EarthMRI) is designed to improve the understanding of America’s mineral resources through advanced mapping and data collection with help from the private sector. This initiative supports the nation’s economic and national security by identifying critical mineral resources and informing sustainable development practices. MAPPS liaisons have closely collaborated with USGS to promote the initiative, facilitate partnerships, and ensure the program receives the necessary support and resources.
Engagement: MAPPS engagement with USGS occurs in numerous venues and formats. USGS representatives consistently attend and present at the MAPPS winter and summer conferences, briefing our membership on the latest programmatic and contract status. USGS and MAPPS have collaborated to develop extended workshops to seek membership input on the 3D Nation Elevation Requirements and Benefits Study and the 3DNTM initiative and component programs, 3DEP and 3DHP.
Lastly, the MAPPS Federal Programs Conference is held each spring in Washington, D.C., for our membership to receive direct briefings from agencies. Members also take the opportunity at that time to advocate for geospatial programs with elected officials on Capitol Hill as part of MAPPS business.
Contracting Opportunities: The USGS Geospatial Products and Services Contracts (GPSC) is a comprehensive suite of contracts utilized by federal, state, and municipal governments, as well as non-profits, Tribes, and private entities, to meet their geospatial data needs in partnership with USGS. Now in its fourth iteration, GPSC represents USGS’s long-standing commitment to collaborating with the private sector to provide foundational data for 3DEP and 3DHP as well as a wide range of services and capabilities to meet other diverse geospatial data requirements.
Awarded through qualification-based architect-engineer (A&E) contracting, GPSC comprises a pool of 10 large and small businesses, all of which are MAPPS members. These firms also partner with numerous other MAPPS members through subcontracting arrangements. MAPPS liaisons are crucial in monitoring the use of GPSC, communicating overall contracting status, small business utilization, current and future requirements, and contract renewal.
Conclusion: The successful working relationship between MAPPS and USGS exemplifies the power of public-private collaboration in advancing geospatial programs that are vital to the nation’s well-being. Through the efforts of the MAPPS federal liaisons and the collective expertise of MAPPS members, programs like 3DEP, 3DHP, and EarthMRI have achieved significant milestones. This partnership continues to drive innovation, improve data quality, and support the diverse needs of stakeholders across the country.
As these programs evolve, the MAPPS-USGS collaboration will remain a cornerstone of geospatial excellence, ensuring that the United States remains at the forefront of geospatial science and technology. ■

Michael Shillenn, CP of NV5 Inc. is a MAPPS director and the senior MAPPS co-liaison to USGS. Bernie Doud, CP, GISP of Aero-Graphics is also a MAPPS co-liaison to USGS.


For some, surveying goes on through the snow and ice of the season
BY ERIC B. GLADHILL

It’s the time of year when the northern part of the U.S. is getting tired of the snow accumulations, this year especially if you’re in the Great Lakes area. Most of the areas north of the Mason Dixon Line have been trudging through snow for much of this La Niña winter.
For surveyors, snow and cold can be a real impairment to field work. To some, who choose to bundle up and work through some snow squalls, it may not be as
detrimental as rain for completing the field work, but it can still cause a lot of problems.
In my early years of working on the survey crew in Pennsylvania and the mountains of western Maryland, it seemed that most projects were shut down through the Christmas holidays and the month of January. In many cases, construction projects shut down all excavating and trenching as soon as the frost penetrated the first few inches of soil. When this happened and the snow was deep, many of the field crew members were laid off for a few weeks.
That seemed to have changed in later years, but there were many winters early on when I collected unemployment benefits. Even as late as 1991 I was put on furlough due to continued snow cover. It was quite a challenge for me and my family, as we had moved into our new house the previous October. I started to question my career choice because I wasn’t sure how I would pay my mortgage. With some help from family and my friends at church, we made it, even though I had to find a new employer that was an hour drive from my house.
When the weather is frigid and the wind is blowing, working in the field can be difficult, but when the snow piles up to a depth of one foot or more, there’s not much surveying that can be done in the field. When a boundary survey needs to be completed, it’s best to wait for the snow to melt before going in the field. Some corners can be found by digging through the snow, but there is other boundary evidence, such as edges of roadways, that will be covered.
Topographic surveys are almost impossible to perform when snow covers the ground. A survey technician may be able to get spot elevation shots in the grass by poking the rod through the snow, but how does one know if the point of resistance is the ground, or a frozen crust under the powdery snow on the top. Likewise, it may be easy to get shots on a plowed parking lot or roadway, but finding the edges of the pavement may be a laborious task that makes the work impractical.

When I worked for an engineering firm that did a lot of work for the Pennsylvania Department of Transportation, I was sent to Johnstown, Pennsylvania, in January to do a topographic survey for the replacement of the John Street Bridge. We did not have GPS at that time–in fact it was mostly used for large control survey–but instead, we were to start our survey from control points established by the PennDOT crews.
The first point we endeavored to find was in the sidewalk at an intersection. The snowplows had pushed the roadway clear and had piled snow about four feet deep at the location of the control point. I decided to look for some other points first. We searched and found a few other points but then determined that we needed that first point to either occupy or use as a backsight. We spent the next few hours chipping and digging that frozen snowbank to recover that point.
I worked with an older surveyor at one time who was one of those “never-say-die” kind of guys. When the snow piled up to a depth of more than two feet one winter, he decided the boundary survey that needed to be done in the mountains couldn’t wait, so he strapped on his snowshoes and trekked out through the woods in search of boundary monuments.
I think it is fair to say that the snow can be challenging for surveyors, and it seems to go without saying that the work will be slowed to an inefficient rate. I guess that’s why we seem to have most of the surveyors’ conferences this time of year.
I wonder how many surveyors can soldier on and continue their work throughout the winter weather. ■
Eric B. Gladhill, PLS, is the director of Surveying Services for KERAMIDA, Inc. His book, Finding My Boundaries (Interesting People I’ve Met While Surveying) is available on Amazon, Barnes & Noble, and Kobo.


Education
College of the Canyons Land Surveying
26455 Rockwell Canyon Road
Santa Clarita, CA 91355 (661) 362-5096
Email: Regina.Blasberg@canyons.edu
Website: www.canyons.edu/SURV Associate of Science Degree Courses offered ONLINE (Video Conferencing)
New Mexico State University
Geomatics Department
1060 Frenger Mall – Room 130 Las Cruces, NM 88003
Phone: (575) 646-6748
Email: kwurm@nmsu.edu or elaksher@nmsu.edu
Website: https://et.nmsu.edu/ Fully online program and +2 option. BS Degree
Seiler Instrument Geospatial Offices in IL, IN, KS, KY, MI, MO, NE, WI 877-330-6303
Email: servicedept@seilerinst.com Website: www.seilergeo.com

Associate/Full Professor Positions in Engineering Technology and Survey Engineering
The Department of Engineering Technology and Survey Engineering (ETSE) at New Mexico State University (NMSU) is searching for outstanding applicants to fill a tenure-track faculty position at the Associate or Full Professor rank (Position number: 198029). The position starts in August 2025 (Fall 2025 semester). Preference for the tenure-track faculty position will be placed on applicants with a PhD in surveying, geomatics, geodetic science, geospatial, geoinformatics or related disciplines. Professional surveying licensure is required.
Contact Angie Duman to place your listing here! angie.duman@xyht.com
Troy University
Surveying and Geomatics Sciences Program
Geospatial Informatics Department 344 Wallace Hall Troy, AL 36082
Phone: (334) 808-6727
Fax: (334) 670-3796
Email: geospatial@troy.edu
Website: www.troy.edu/geospatial BS Degree, ABET-ASAC accredited www.instagram.com/troygeospatial www.tiktok.com/@troy_geospatial
University of Maine
Surveying Engineering Technology Program 5711 Broadman Hall, Room 119 Orono, ME 04469-5711 (207) 581-2340
Email: um.set@maine.edu
Website: http://www.umaine.edu/set/svt/ Bachelor Degree. abet-taac
The NMSU Geomatics Program proudly offers a B.S. degree in Geomatics and emphasizes excellence in undergraduate teaching. With small class sizes of 10 to 20 students, our program fosters a supportive and interactive learning environment where students and faculty thrive. Our current faculty are deeply committed to advancing the field of geomatics through innovative teaching. Faculty members have the opportunity to pursue research that aligns with their interests and contributes to the program's growth and impact.
This position involves a primary focus on teaching, comprising 85%-90% of the workload, with faculty typically teaching 9-12 credit hours per semester. The remaining 10%-15% of the workload is dedicated to service responsibilities. The position is for a 9-month appointment that will include a competitive salary. There will be opportunities to teach in the summer.
Academic rank and salary will be commensurate with the candidate’s prior experience and qualifications. All offers of employment are contingent upon verification of the individual’s eligibility for employment in the US and upon the successful completion of applicable background reviews.
Applications must be received by February 28, 2025, for full consideration. Review of applications will continue until the positions have been filled. Applicants should submit the following documents: (1) cover letter, (2) curriculum vitae, (3) teaching interests and philosophy statement (2 pages max.), (4) the names and contact information for three professional references.
Applications are to be submitted electronically via https://careers.nmsu.edu/jobs/search. The position number is 198029 (Req #501722).
By Jeffery N. Lucas, JD, PLS, Esq.
The surveying profession has always been a measure-centric profession. What I mean by that is surveyors love their measurements, and that is where the primary focus of surveying practice has been concentrated from the very beginning. We have always been the expert measurers in the room. We can analyze our measurements, run closures, make adjustments, and check those measurements. In other words, we can do the math, and we love doing it.
The only thing that comes close to the satisfaction our measurements give us are the tools we use to make those measurements and the computer programs for manipulating the data. We trust our measurements because we can prove they are good and accurate measurements. This is how we have traditionally determined that our survey is accurate, by a closure ratio within acceptable tolerances as articulated in our technical standards, which were written for technicians by technicians.
All of this is fine for a measure-centric profession. The only problem is, we are no longer the only ones who can measure expertly. Anyone with the right tools and the training can also become an expert measurer. We are seeing this play out in real time with unlicensed individuals encroaching on our measurement turf. The reality is, it is no longer acceptable to just be an expert measuring technician, unless you like being a technician racing to the bottom with the other technicians.
Not too long ago we discussed a few (certainly not all) of the “hallmarks of professionalism,” as derived from the DNA of the clergy, the doctors, and the
lawyers—the traditional big three professions. Those hallmarks are what create separation between the big three and other so-called professions: e.g., a calling as opposed to a vocation; opinion-based services, they all sell the same thing; special relationship with the client, a trust; and one that I inadvertently omitted was they all take an oath when entering the profession. Where we, the land surveying profession, intersect the big three is at opinion-based services.
But, you say, measurements aren’t opinions they are facts—and you would be correct. Society no longer needs the land surveyor for expert measurements, anybody can make expert measurements and everybody’s making them. What society needs from the land surveyor is the same thing they need from their priest, their doctor, and their attorney—a well-reasoned opinion that only the professional can give.
Licensed land surveyors are the only people on the face of the Earth who can give an opinion on the one question society has for the land surveyor—where are my property lines located? Oh, you say, only a judge can do that. Now, you would be incorrect. A judge needs a lawsuit to make a property boundary determination, the land surveyor doesn’t. The unlicensed expert measurers out there can’t make that determination either, at least not yet.
Now, here’s the rub. Too many surveyors do not know or do not believe that their calling is rendering well-reasoned opinions on the location of property lines on the ground. They are stuck in a measure-centric mindset
where an accurate survey is a survey with a good closure ratio. That is only true if the focus of a property survey is on the measurements to the exclusion of correct results.
The real focus of a survey is an accurate determination of the location of the property boundaries that have already become established on the ground. In other words, correct results.
Measurements are merely evidence— and not even the best evidence—for achieving correct results, e.g., an accurate survey. The land surveying profession needs to wake up, for even what little we still have left in the way of professional practice will also be taken away.
Next time around we will talk about formulating a well-reasoned opinion and figure out how you can check that opinion. And no, it is not with a closure. Retracement surveying is an evidentiary exercise, not a measurement task.
The purpose of this column is to encourage your questions on legal issues that affect the surveying profession. You are invited to send your questions to the Editor of xyHt. ■
Jeff Lucas is an attorney and land surveyor in private practice in Birmingham, AL. Jeff is an author, columnist, lecturer, seminar presenter, and continuing education provider. He writes a monthly newsletter, The Lucas Letter, dealing with legal issues and the practice of surveying. More information about Jeff and his continuing education courses can be found at www.lucasandcompany.com


