APRIL 2024 SURVEYING AND MAPPING, ELEVATED SURVEYING GPS GNSS MAPPING 26 A Balancing Act: Digital Levels INSIDE Virtual Highways in Europe 16 Geodetic Datum Changes are Near 20


mining
When the Mega Cavern under Kentucky’s largest city needed to be surveyed, the
turned to surveying company Qk4, Inc., for an ALTA/NSPS Land Title Survey to define its underground limits.

Datum Changes
The National Geodetic Survey has been working to replace NAD 83 and NAVD 88 for quite some time now. As the new datum is getting near, here’s what surveyors need to know.

Virtual Highways
Urban mobility in Europe gets a much-needed boost as cities develop digital twins for their road networks.
Following the Kompass
Surveyors like to be in the field making money, but the business aspect of surveying has always taken too much time. An up-andcoming company is rectifying that.
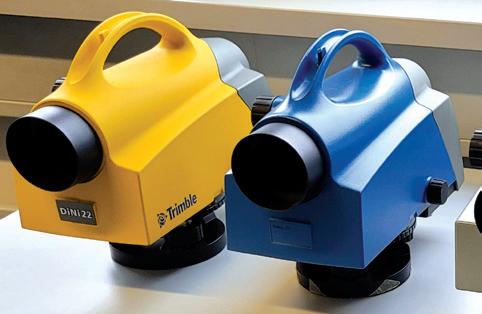
Digital Levels
For nearly three decades, the foundational technology and design of precision levels for surveying has not changed much. It hasn’t had to. When something is done right, sometimes it’s best to just go with it. 24
xyHt 3 APRIL 2024 xyHt [ISSN 2373-7018 (print), ISSN 2373-7735 (online), CPC CPM No. 41437548] is free upon request to qualified subscribers in the United States. The Canadian subscription rate is US $20/year. The International subscription rate is US $40/ year. Periodicals postage paid at Frederick, MD and additional post offices. xyHt is published 10 months a year by xyHt LLC, 6 N. East Street, Frederick, MD 21701. POSTMASTER: Send changes of address to: xyHt Subscriptions, 6 N. East Street, Frederick, MD 21701. Send Canadian changes of address to: Box 697 STN A, Windsor, ON N9A 6N4, Canada. For advertising, editorial, or other information, write to xyHt LLC, Inc. or call 301-662-8171. CONTENTS APRIL 2024 FEATURES 12
Under Louisville
5 LOCATED 6 Looking Forward By Jeff Thoreson MORE 2024 SURVEYING AND MAPPING, ELEVATED SURVEYING GPS GNSS MAPPING 26 ABalancingAct:DigitalLevels INSIDEVirtualHighwaysinEurope 16 GeodeticDatumChangesareNear 20
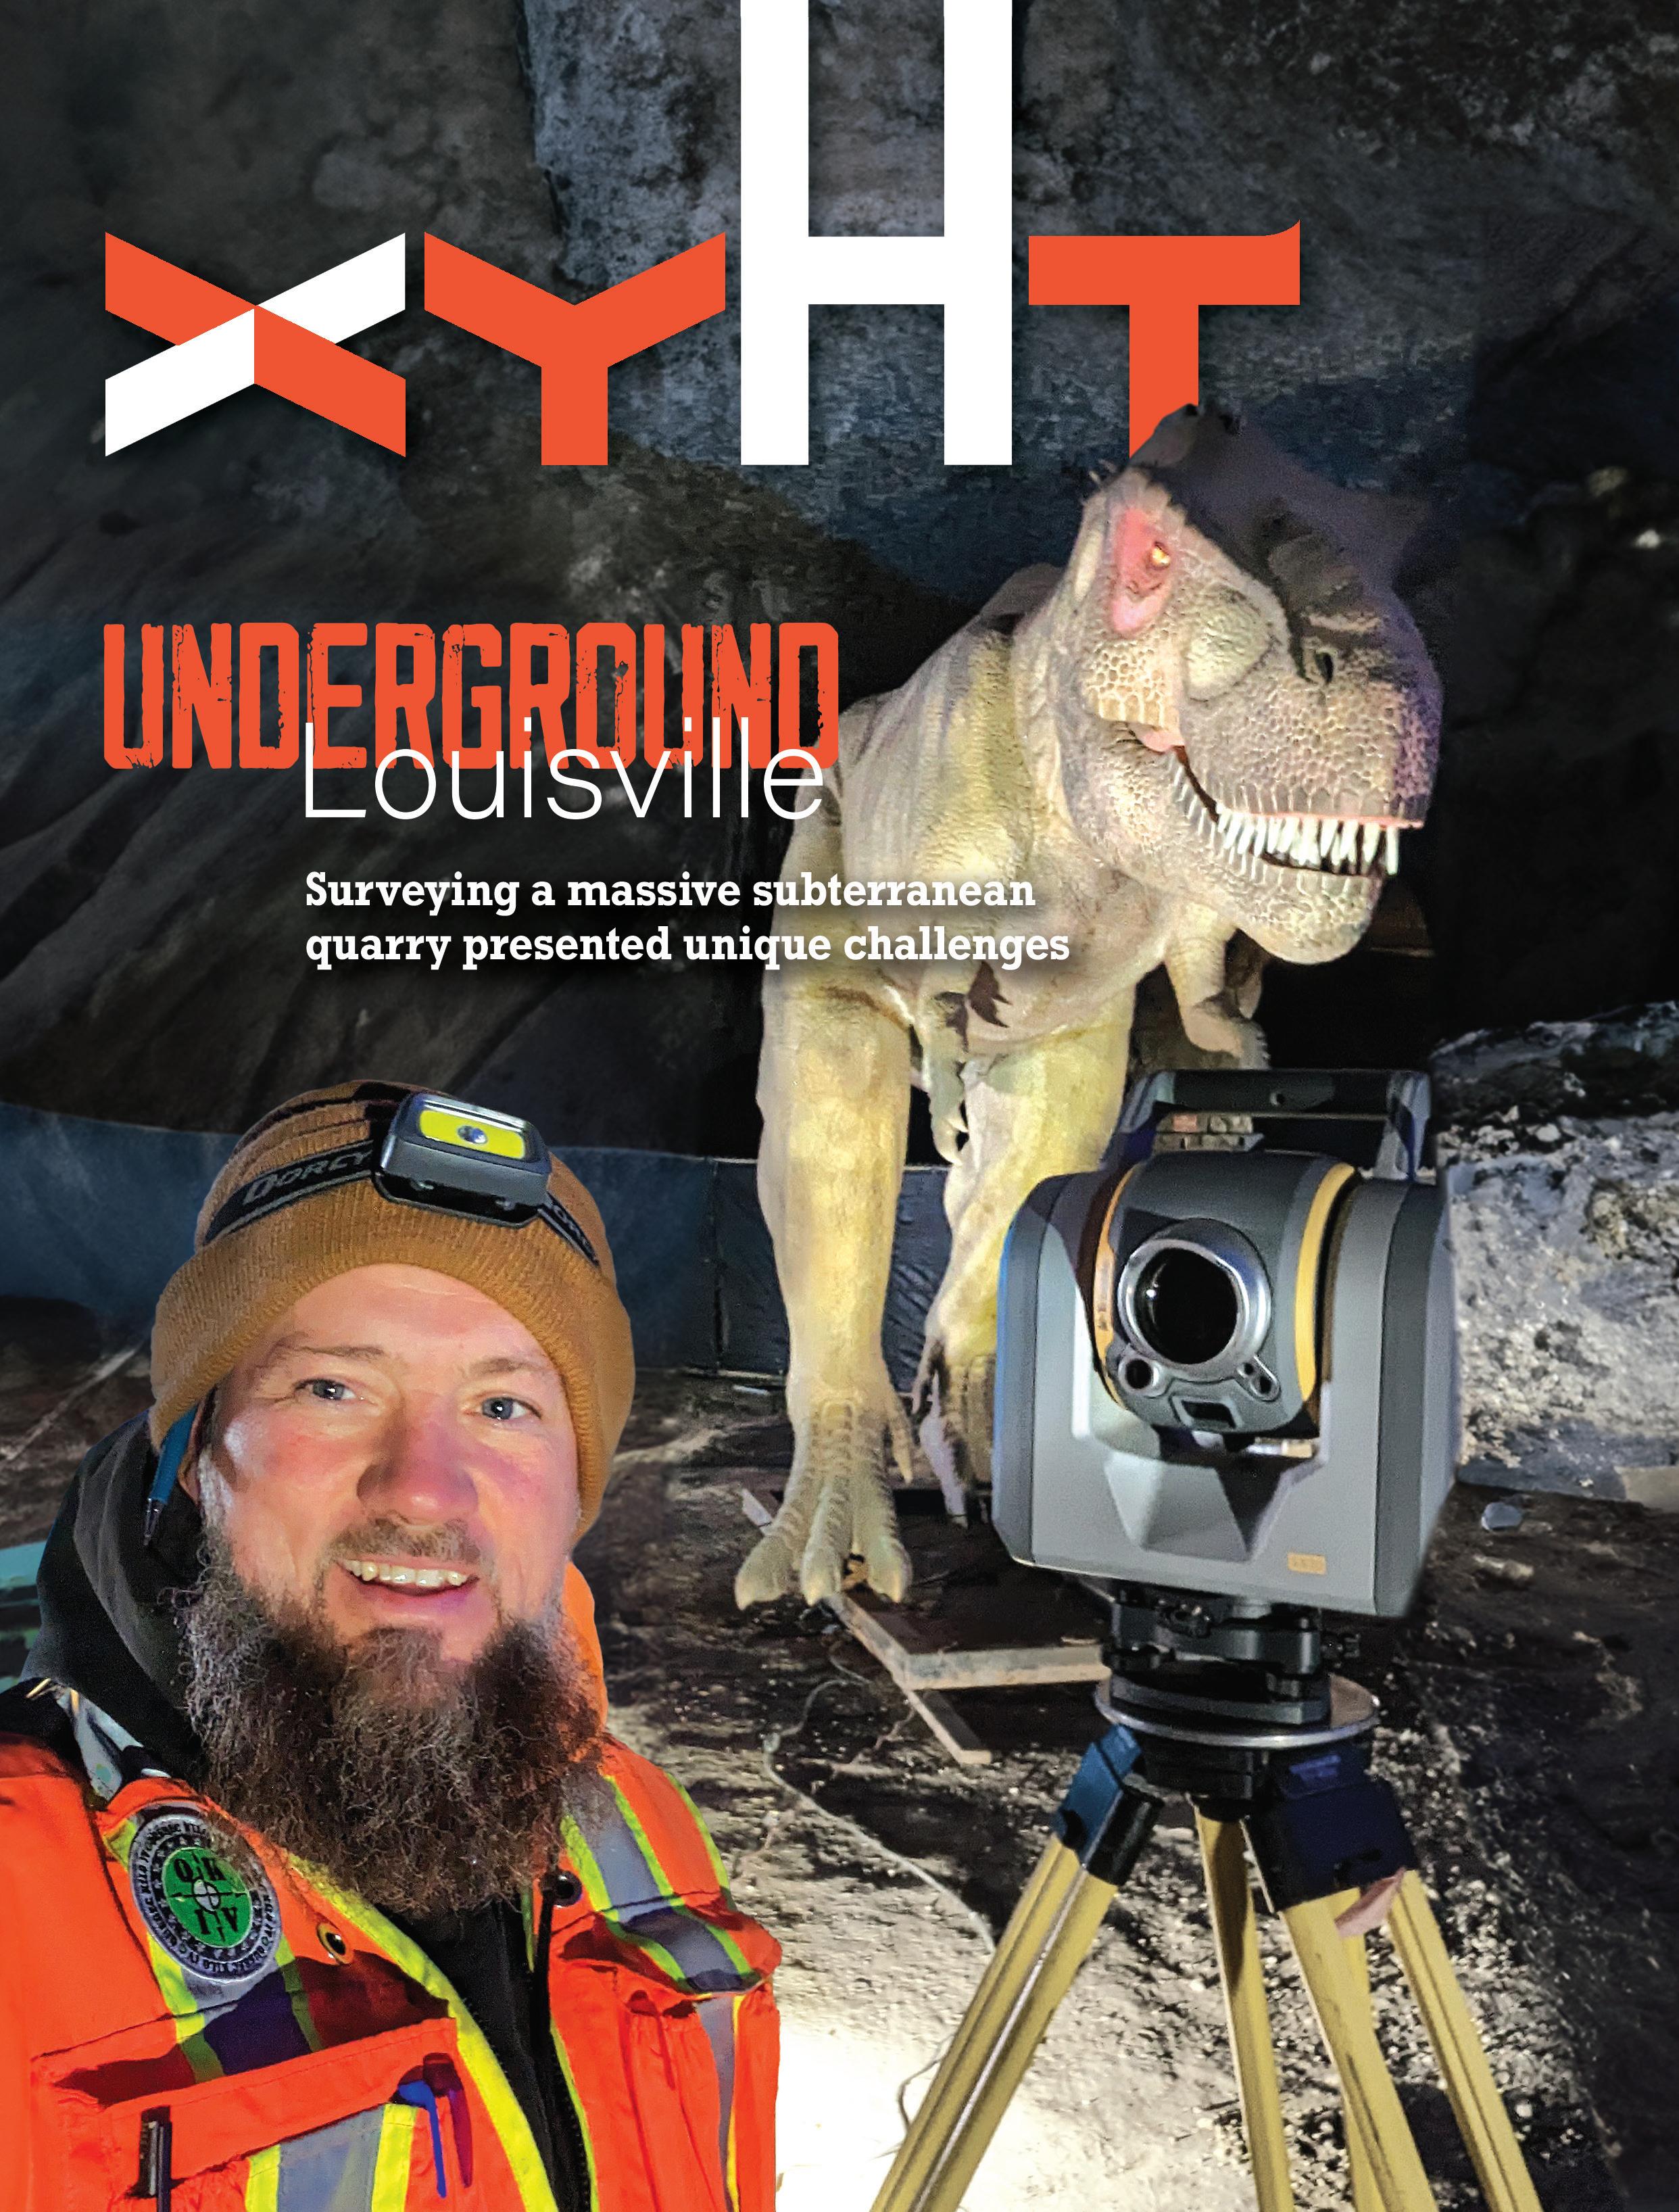
THE COVER:
owners
ON
Beneath the city of Louisville, Kentucky, a mammoth cavern hollowed out by years of
rock is now used for displays, zip lining, climate-controlled storage, and other things. Surveying it presented unique challenges.
20 PREDICTING THE THREAT OF WILDFIRES MAPPING THE LONDON TUBE APPS FOR MAPPING NEW PRODUCTS/NEW SOLUTIONS
26 16

Looking Forward
By Jeff Thoreson
Underground Surveying
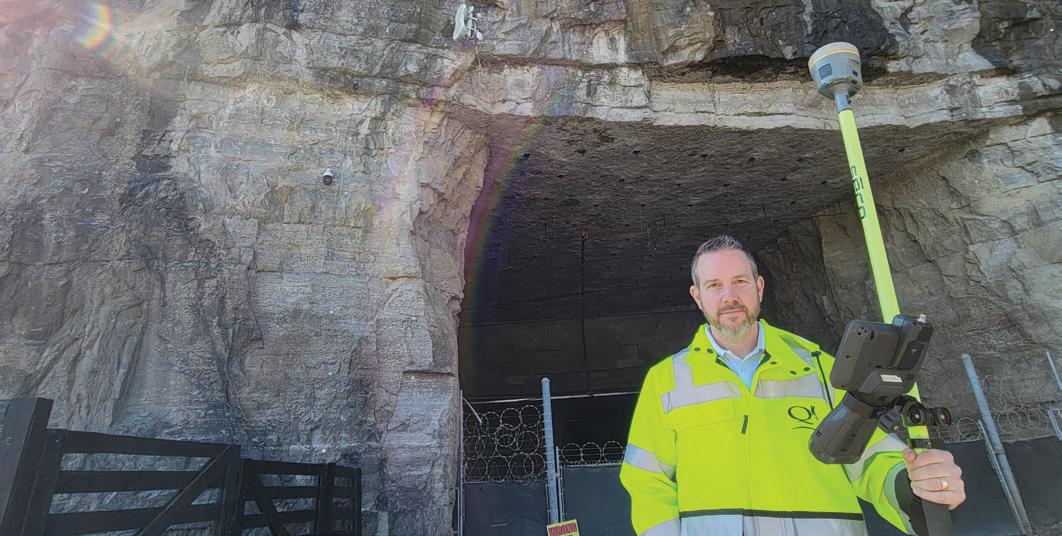
I HAVE NEVER BEEN TO LOUISVILLE, KENTUCKY, BUT EVEN IF I HAD I’m sure all of my business or exploration there would have been above ground. But beneath parts of the city of more than 600,000 is the Louisville Mega Cavern, an underground space of 100 acres created by years of mining rock.
The cavern is so big it has more square footage than the 94-story One World Trade Center. The space is so massive you can take a two-hour ziplining adventure into parts of the cavern most people never see. You can ride a tram that takes you on a geologic adventure to explore some of the 17 miles of underground corridors. A small portion of the mega cavern contains a display of 80 life-sized mechanical dinosaurs. During the holidays, the Lights Under Louisville show is a drive-through light show of more than 40 displays with more than 900 lit characters and more than 6.5 million points of light.
So, imagine having to survey this massive area and account not only for horizontal boundaries, but vertical boundaries and every rock column left by more than 40 years of mining stone to keep the cavern from collapsing. That task fell to Qk4, Inc. Ben Shinabery, vice president for land survey at Qk4, led a team that took 10 months and more than 700 man hours to complete the survey.
Shinabery writes about the unique challenges that such a large survey presented, especially since most of the work needed to be done underground. It’s an interesting story starting on page 12.
Also in this issue, xyHt contributor Marc Delgado takes a look at some innovative geospatial applications that are being used to create digital twins of European city roadways to solve the problem of traffic congestion in major metropolitan areas (p. 16). In another story, Juan Plaza looks at the new National Geodetic Survey’s forthcoming datum changes (p. 20).
I hope you enjoy the issue.
April 2024 Volume 11 Number 3
Publisher Shawn Dewees shawn.dewees@xyht.com
Editor-in-Chief Jeff Thoreson jeff.thoreson@xyht.com
Director of Sales and Business Development Chuck Boteler chuck.boteler@xyht.com
Creative Director Ian Sager ian.sager@xyht.com
Accounting and
Classifieds Angie Duman angie.duman@xyht.com
Circulation subscriptions@xyht.com
Phone: 301-662-8171
Editor, Located Jeff Salmon jeff.salmon@xyht.com
Editor, Field Notes Eric Gladhill eric.gladhill@xyht.com
Contributing Writers Jonathan Barnes Marc Delgado Jodie Hartnell Juan Plaza Ben Shinabery
Copyright © 2024 xyHt magazine. Printed in U.S.A. No material may be reproduced in whole or in part without written permission from the publisher. The publisher assumes no responsibility for unsolicited material, the accuracy of information supplied by manufacturers, or opinions expressed by contributors.




xyHt 5 APRIL 2024
Partners and Affiliates THE IMAGING & GEOSPATIAL INFORMATION SOCIETY JT – JT
Ben Shinabery led the team that surveyed the Louisville Mega Cavern
Located Located Located
Mapping Your World | UAV/UAS | Space | New Products
Compiled by Jeff Salmon

AI, 5G, and Geospatial Tech Team Up to Predict Wildfire Threat
THE DESTRUCTIVE THREAT OF WILDFIRE IS A GLOBAL CONCERN. In 2022 Germany recorded 2,397 wildfires with a size of more than 3,058 hectares (7,556 acres) of destroyed forests.
To address this threat, an ongoing research project—initiated by Landkreis Goerlitz (a county in the state of Saxonia) and the Ministry for Digital Matters and Mobility (BMDV)—Germany in cooperation with GGS, a German geospatial services firm, focuses on monitoring an overall forest area of 170 square kilometers (66 square miles) in Northeast Germany.
The goal was to determine the viability of using geospatial tools, including aerial surveys with both fixed-wing and UAV platforms enabled with AI and 5G, to create three vital tools:
Forest health assessment: The RGB, NIR, CIR (colored infrared), NDVI (normalized difference vegetation index), and Red Edge (vegetation in NIR) orthophotos are used by forest experts to detect high-risk areas for wildfires, areas suffering from drought or diseases—such as the bark beetle—or to evaluate soil health status.
Emergency maps: The RGB orthophotos are used as part of the emergency navigation system for firefighters in combination with other information e.g., the ease of access of paths, lakes for accessing water, information on infrastructure, as well as areas that are inaccessible for a variety of reasons.
3D simulation: The 3D data from the oblique cameras is used to generate a perfect 3D model of the area and is being processed with Skyline’s Photomesh software. Skylines Terra Explorer Software performs analytics in the surface model, e.g. visual line of sight of the observation towers and optimized UAV flights to detect fire nests.
To enable these tools, three technologies were employed:
Aerial camera configuration: The camera setup for the survey was based on GGS’s OIS-Technology with an addition of NIR and thermal cameras.

The Phase One iXM-RS 150 with a 90 mm lens for Nadir imaging was selected. Two additional Phase One Achromatic iXM-100 cameras with NIR filter (band 700-850 nm and 750-850 nm) and two 70 mm lenses were added.
For generating a 3D surface Model, four Phase One iXM-100 oblique cameras each equipped with an 80 mm lens were also integrated into the camera pod. Alongside the Nadir cameras, two further thermal cameras capture the entire footprint with lower resolution to indicate the influence of micro-climate changes on the forest health.
Observation towers: Three observation towers are available within the target. Upgrading the towers is the next step. An innovative camera array capturing RGB, NIR, AC, and Thermal data—which are mounted on a gimbal—will be installed on two towers. The gimbal is scanning the area at 270 degrees while the cameras are taking images with a 60% sidelap. Captured data will be streamed via 5G to a server (central crisis management server) and analyzed using AI algorithms to detect wildfires.
UAV deployment: Smaller areas can be monitored with UAVs equipped with RGB, NIR, and Red Edge cameras. To provide a long flight time, these UAVs only carry small format compact cameras. After an alarm is received, a single UAV will be deployed. In certain situations, a UAV swarm may be sent out to observe for additional fire nests.
The research project is ongoing, yet it looks like the team has developed a powerful tool kit for assessing forest health and thus predicting where wildfires may be likely, as well as providing imagery data to detect, monitor, and mitigate ongoing wildfires. See the Phase One website for the full case study.
xyHt 6 APRIL 2024
Send your Located items to located@xyht.com
Lidar Uncovers Massive Ancient City in Amazon: British Mapping App Wins Top Prize

NOT ALL MAPPING APPS ARE USEFUL, EVEN IF THEY SEEM TO HAVE ALL THE BELLS AND WHISTLES. But for outdoor enthusiasts and trekkers, the OS Maps app from Ordnance Survey is clearly second to none. The app created by the national mapping agency for Great Britain won big at The Great Outdoors Magazine (TGO) Awards after being voted “Walkers' App of the Year” by readers of the monthly mag. The TGO Awards honors individuals, locations, and institutions that help make alfresco activities, from walking in the countryside to trekking high up in the mountains, safer and more enjoyable. Enjoyed by 4.1
Another Chatbot Says It Can Create Maps
million paying users, it is the seventh consecutive win for the OS Maps app. The Ordnance Survey’s mapping database contains more than half a billion geographic features and is updated regularly, up to 20,000 times a day. “We’re incredibly proud to win this award for the seventh year in a row,” said Nick Giles OBE, managing director for Leisure at Ordnance Survey. “We never rest on our laurels though. We are about to unveil a series of improvements to the OS Maps app to make it even better for 2024.”
— Marc Delgado, marc.delgado@xyht.com
LAST YEAR’S BARD IS NO MORE AND HAS BEEN REPLACED BY GEMINI, the latest generative artificial intelligence chatbot developed by Google. According to the company, the new chatbot can help its users to write and make summaries from Gmail or Google Drive, generate images on the fly, and help you make travel plans by connecting directly to Google Maps and Google Flights.
For example, you can talk to Gemini and ask for a travel destination, and it will tap into Google Maps to create a map of your possible itinerary in a jiffy. With its new features, it surely appears smarter than the original Google Assistant released in 2016, but it may be too soon to tell. Remember Bard’s infamous mistake during its first public product demo 12 months ago? We hope that Gemini will not be prone to come up with factual errors, especially when maps for navigation are involved. No one wants to get lost.
Trimble Introduces MX90 Mobile Mapping System
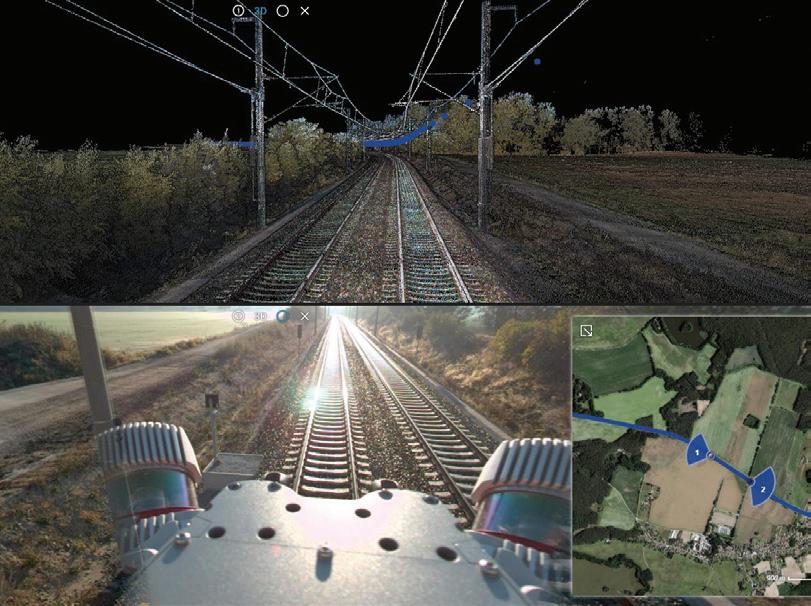
WITH STATE-OF-THE-ART TRIMBLE GNSS AND INERTIAL TECHNOLOGY, when combined with Trimble field and office software, the Trimble MX90 provides a complete field-to-finish mobile mapping solution that enables powerful workflows for data capture, processing, and analysis. The vehicle- or train-mounted MX90 rapidly captures highly-detailed laser scans and imagery— both panoramic and multi-angle.
High-resolution immersive imagery, high-density colorized point clouds with accurate color projections, and scene inspection capabilities enable new workflows, such as automatic crack detection. In urban environments or along rail tracks, users can zoom in and easily see small details on street signs, railway signals, and other asset or as-built features. In open areas and large cities, users can capture more detail on distant objects, such as electrical or fiber poles.
xyHt 7 APRIL 2024
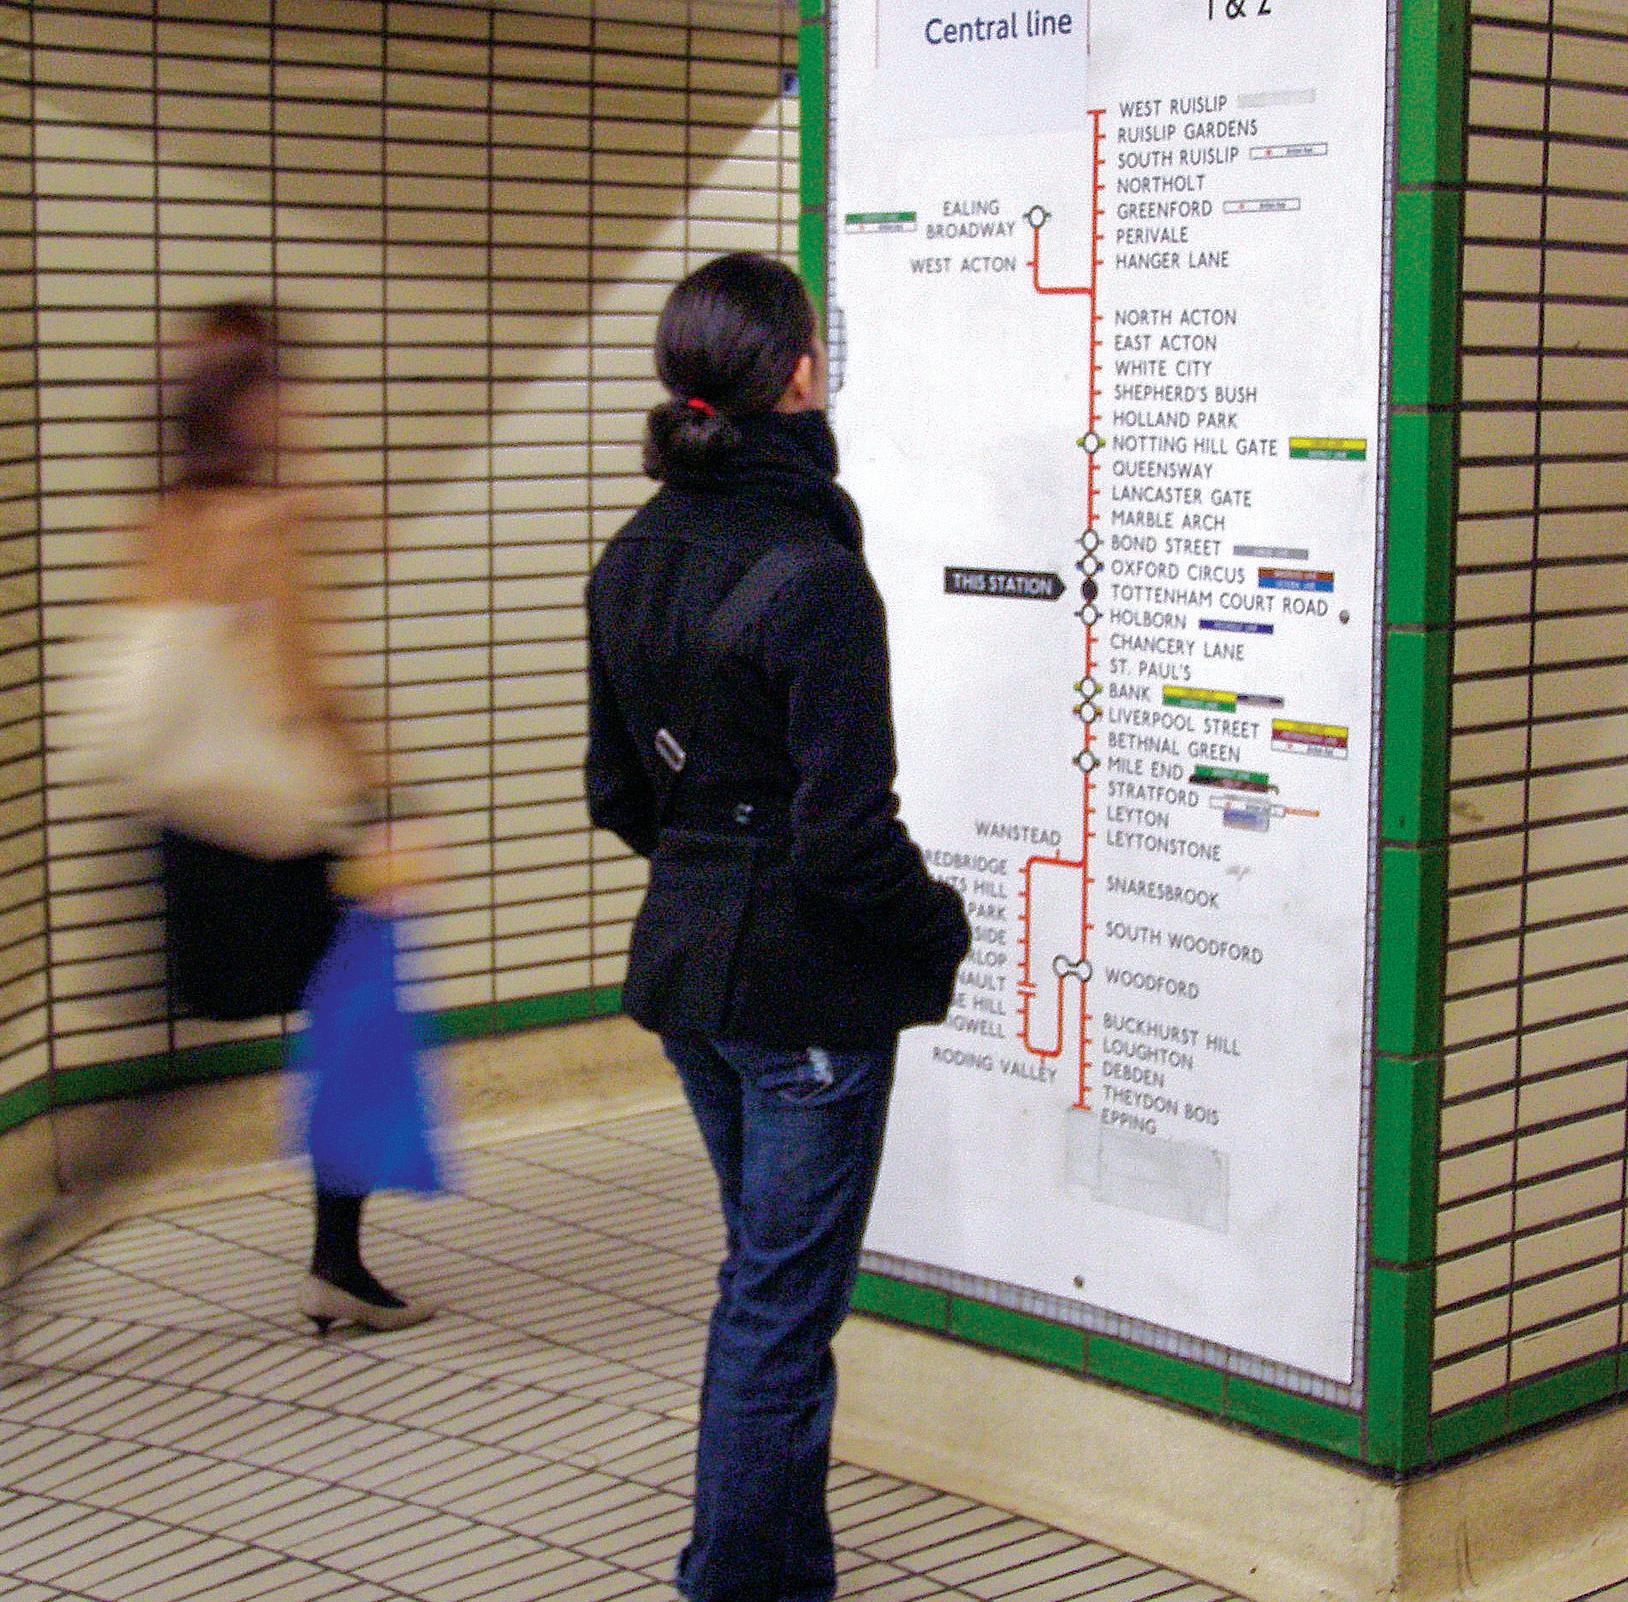
London Tube Map Makeover
THE LONDON TUBE, THE WORLD'S FIRST METRO TRANSPORT SYSTEM, is redesigning its map to make it easier for its five million daily passengers to find their way around its 11 lines. The original map was designed in 1931 by Henry Beck and has since undergone various iterations as the metro area grew larger.
Now spanning over 402 kilometers with 272 stations, the current map appears “loaded” according to some locals. Designed in 2007, the map is dominated by orange-colored lines and blue dots. But by autumn this year, a new map will be issued showing six distinct line colors and will be named after people or events that have left a mark in London's history and cultural diversity.
“Giving each of the overground lines distinct colors and identities will make it simpler and easier for passengers to get around,” said London mayor Sadiq Khan. “As a mapmaker myself and an avid urban explorer, I have boxes that are chock-full of maps of bus lines, trains, and subways (or metro) that I collect for their practicality (Boston), beauty (Madrid), complexity (Paris), or simply for posterity. My old London Tube map will surely be a cherished memento.”
— Marc Delgado, marc.delgado@xyht.com
EVENTS
Xponential
April 22-25
San Diego, CA
Geospatial World Forum
May 13-16
Rotterdam, Netherlands
FIG Working Week
May 19-24
Accra, Ghana
Esri User Conference
July 15-19
San Diego, CA

Commercial UAV Expo
September 3-5
Las Vegas, NV
Intergeo
September 24-26
Stuttgart, Germany

Trimble Dimensions
November 11-13
Las Vegas, NV
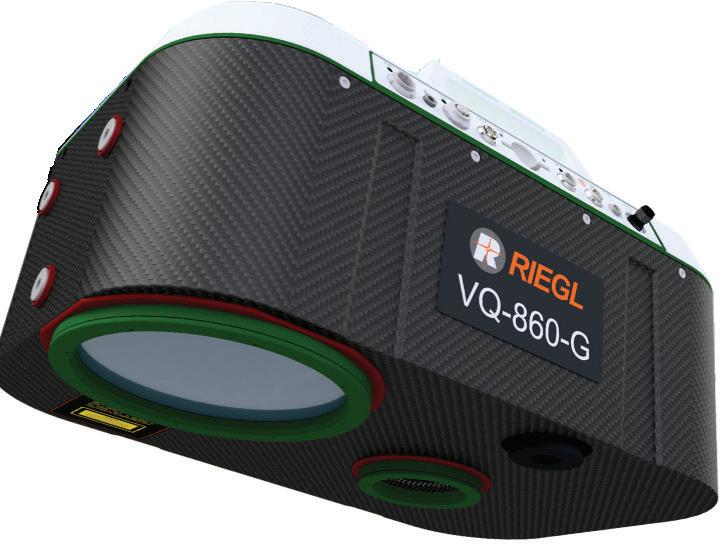
New RIEGL Laser Scanning Solutions for Bathymetric Data Acquisition
RIEGL’S TOPO-BATHYMETRIC AIRBORNE PRODUCT PORTFOLIO HAS BEEN FURTHER EXPANDED to address the growing needs of the U.S. Geological Survey’s 3D Hydrography Program, NOAA’s National Bathymetric Source, as well as the U.S. Army Corps of Engineers’ water management initiatives. With the launch of two new mid-sized sensors, the VQ-860-G and the VQ-840-GL, RIEGL topobathymetric sensors are capable of greater flexibility with respect to platform compatibility and can now be deployed on many variations of airborne platforms, including small aircraft, helicopters, and larger UAVs, particularly as it relates to inland waters data collection in complex terrain where larger aircraft may be un-suitable. These new sensors provide a more economical alternative to inland and coastal topo-bathymetric data collection while maintaining high point-density capability and improved depth performance with a cost-effective entry to the market.
xyHt 8 APRIL 2024

OpenStreetMap Now a Digital Public Good
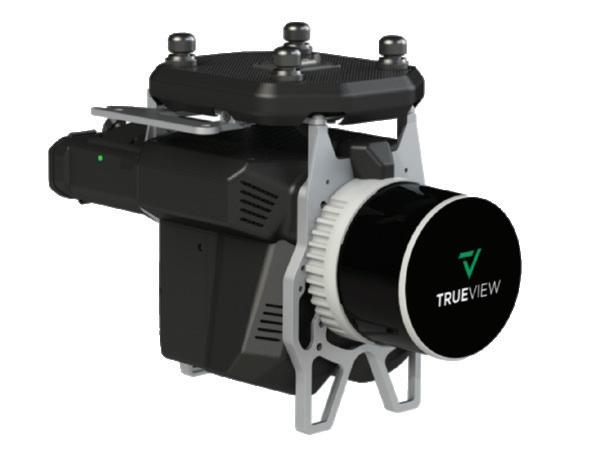
GeoCue Announces Three New TrueView 3D Imaging Systems
GEOCUE, A PROVIDER OF GEOSPATIAL HARDWARE AND SOFTWARE SOLUTIONS, has set the stage for a groundbreaking year with the introduction of three new TrueView Lidar Systems and an innovative FLEX pricing plan.
The newly launched TrueView 3D Imaging systems include the TrueView 540, the TrueView 545, and the TrueView 585, each catering to distinct market needs. To complement these additions, GeoCue is also introducing the innovative FLEX pricing options on flagship models TrueView 515 and 535 payloads.
“FLEX pricing is more than just a pricing strategy. It’s a strategic response to industry demands.” says Vincent Legrand, who works with GeoCue. “By introducing FLEX, we empower our customers with a comprehensive solution, seamlessly integrating field-proven technology and LP360 software. FLEX allows you to conserve working capital, improve cash flow, and achieve a strong return on Investment, making it a comprehensive and forward-thinking choice for our valued customers.”
IN A NUTSHELL, PUBLIC GOODS ARE PRODUCTS THAT ARE ACCESSIBLE TO ALL without exclusion or inhibition. This is similar to how we use and access digital data: the use of these goods by one person does not reduce the amount available for others. The United Nations wants to apply this not only to open data but also to open-source software, open standards, and open content.
According to the UN, promoting digital public goods is key to achieving sustainable development goals. Last February, OpenStreetMap, the collaborative open-mapping project, was declared as a “digital public good” by the Digital Public Goods Alliance (DPGA). As one of the first global-scale mapping initiatives, the success of OpenStreetMap is unparalleled and can be measured by its impact on various sectors.
Not only is it being used in humanitarian efforts, but it is also tapped by companies such as Meta (Facebook), Apple Inc., Craigslist, Foursquare, Snapchat, and Strava to improve their own geospatial services. Founded in the UK by Steve Coast in 2004, OpenStreetMap has more than 10 million users who update and maintain the free online maps through open collaboration.
Other important open geospatial initiatives on the DPGA list include Europe’s Global Human Settlement Layer, Kenya’s Ushahidi crowd mapping tool, and Norway’s MET API that provides 10-day weather forecast data for any geolocation in the world.
— Marc Delgado, marc.delgado@xyht.com
Stonex’s New X70GO SLAM Laser Scanner
X70GO IS A REAL-TIME 3D MODEL RECONSTRUCTION DEVICE which integrates inertial navigation module with a high-performance computer and storage system. It is equipped with a 360-degree rotating head, which, combined with the SLAM algorithm, generates high-precision point cloud data. A 12 MP visible-light camera provides texture information, while a visual camera guarantees stronger real time preview with GOapp. Mapping results are generated immediately inside the scanner, right after scanning, and users can choose if they want to color them and improve their accuracy, postprocessing with GOpost software.
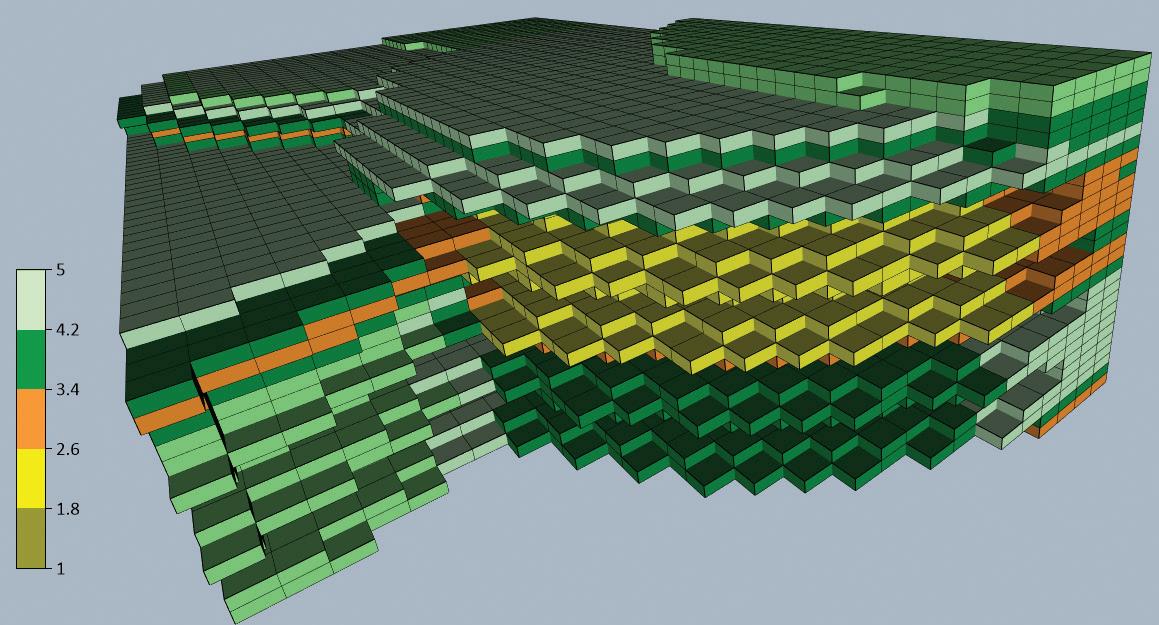
Golden Software’s Latest Surfer Mapping and 3D Visualization Package
GOLDEN SOFTWARE HAS FURTHER ENHANCED THE 3D VISUALIZATION CAPABILITIES of its Surfer mapping and 3D visualization software to give users a complete picture of their subsurface data. The expanded visualization tools in the latest Surfer version make it easier than ever to create 3D grid files for the viewing and analysis of drillhole data.
“We built a larger selection of options and greater flexibility into the Surfer visualization functionality with the goal of enabling users to fully exploit their 3D drillhole data,” said Kari Dickenson, Surfer product manager. “Surfer users can now gain a more comprehensive understanding of the subsurface environment around their wells and drillholes.”
xyHt 9 APRIL 2024
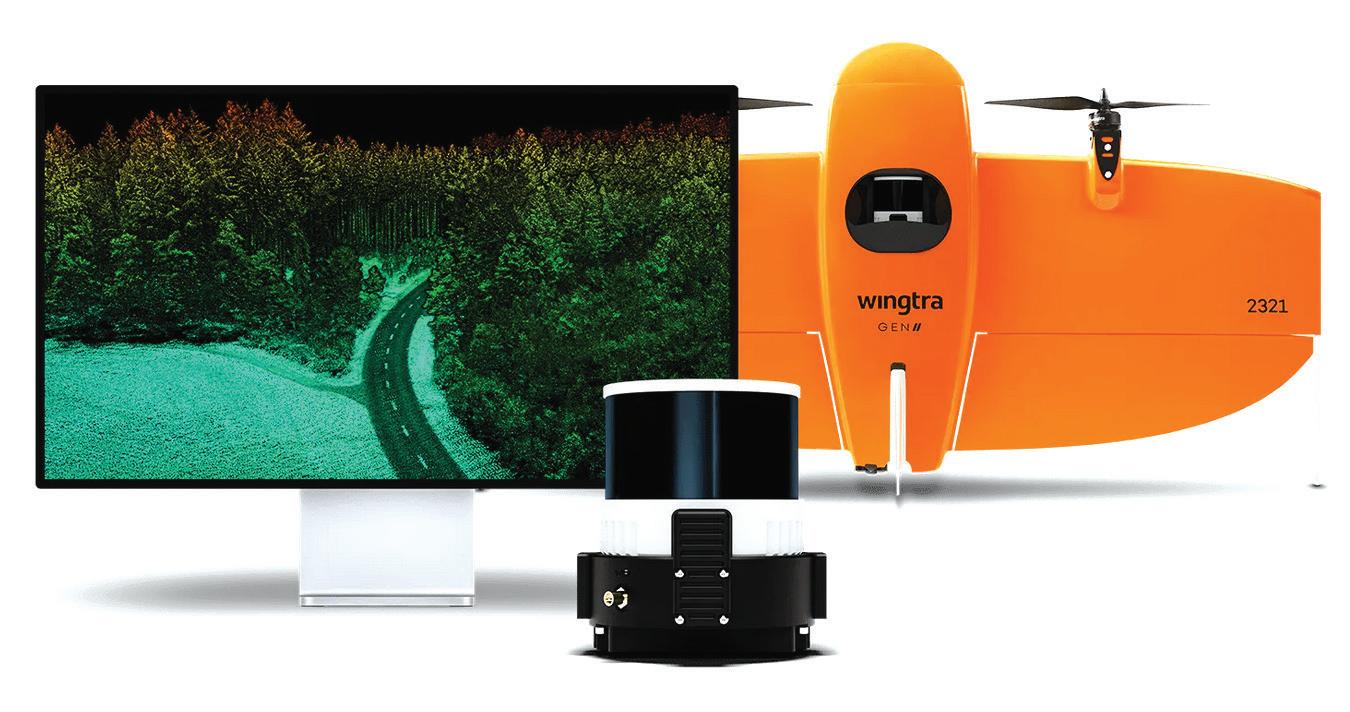
Wingtra Intros VTOL Lidar Solution
WINGTRA HAS INTRODUCED A LIDAR UAV MAPPING SOLUTION THAT COMBINES the WingtraOne GEN II UAV with a newly developed lidar sensor. This integration seeks to advance UAV lidar efficiency, increase accuracy, and simplify integration.
The lidar solution incorporates a Hesai scanner, Inertial Labs IMU, and NovAtel GNSS designed to optimize data acquisition and reduce the need for post-processing strip alignment. This advancement offers immediate access to precise terrain information following each flight and enhances the efficiency of mapping and photogrammetric analysis in various sectors.
Diamond Aircraft and Vexcel Strengthen Cooperation
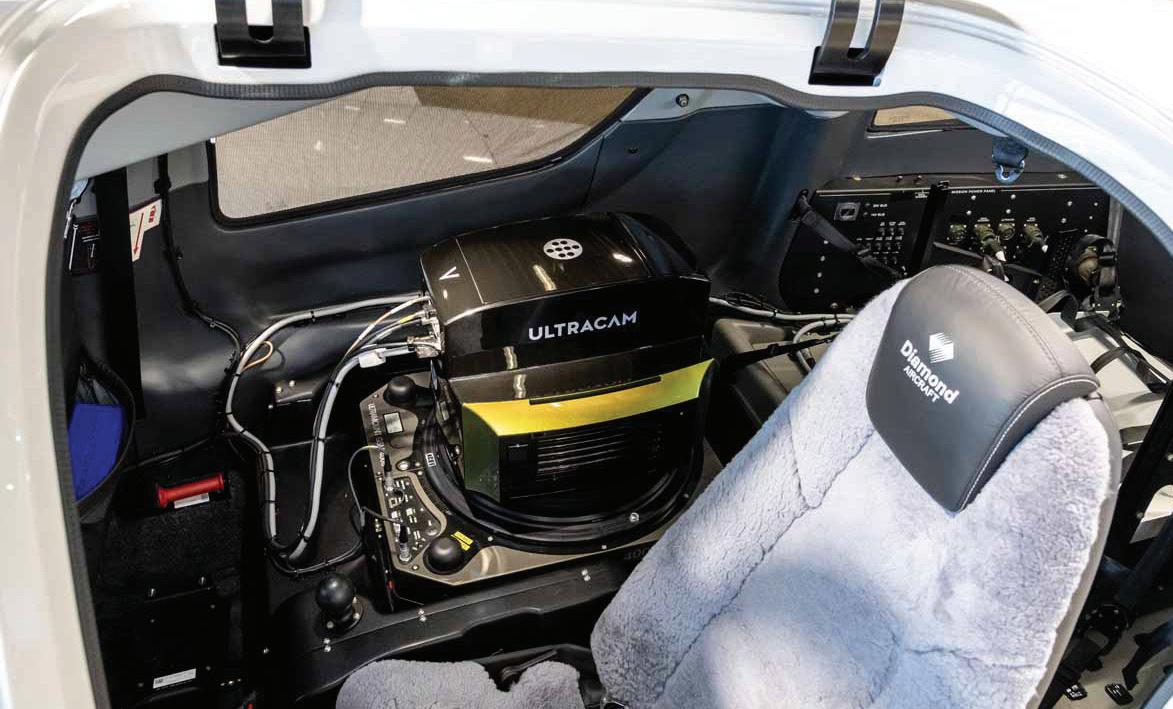
DIAMOND AIRCRAFT AND VEXCEL IMAGING STRENGTHEN COOPERATION in special mission aircraft applications and announce the next collaboration for a further expansion of Diamond’s special mission aircraft state-of-the-art sensor portfolio.
“Diamond Aircraft and Vexcel Imaging have been enjoying a successful business partnership for many years with both companies being at the forefront in their business fields,” says Mario Spiegel, sales manager at Diamond Aircraft Special Mission Aircraft Division. “So, it was only logical that we would also work together on the integration of the new UltraCam Dragon 4.1 on our DA62 MPP SurveyStar platform.”
xyHt 10 APRIL 2024


xyHt 11 APRIL 2024
UNDERGROUND TAKING SURVEYING
By Ben Shinabery
Louisville’s massive Mega Caverns presented challenges for a huge subterranean survey
Every day more than 150,000 people drive past the interstate billboards advertising the Louisville Mega Caverns not realizing they just drove over what is classified as the largest commercial building in Kentucky, even though it is entirely underground.
What once was a massive subterranean limestone quarry in the heart of urban Louisville is now an environmentally conscious,
high-security commercial storage facility that is so massive it contains the only fully underground aerial ropes challenge and zipline course in the world: The Louisville Mega Caverns.
HISTORY
For 42 years in the middle of the 20th century, the cavern was mined to provide crushed stone to the growing Louisville
metro area. With each blast and every truckload of stone removed, the underground cavern grew until the mining ended and the cavern covered 4 million square feet of space 75 to 100 feet below the surface. In 1989, private investors envisioned leasing climate-controlled storage between the 85- to 90-foot-tall rock pillars that were left to keep the mine from collapsing under the city. It is these structural pillars that classify the mine as a building.
The Mega Caverns began development through special zoning and building permits, creating a business model for the largest recycling center in Kentucky while erecting walls between pillars for individual lease
xyHt 12 APRIL 2024
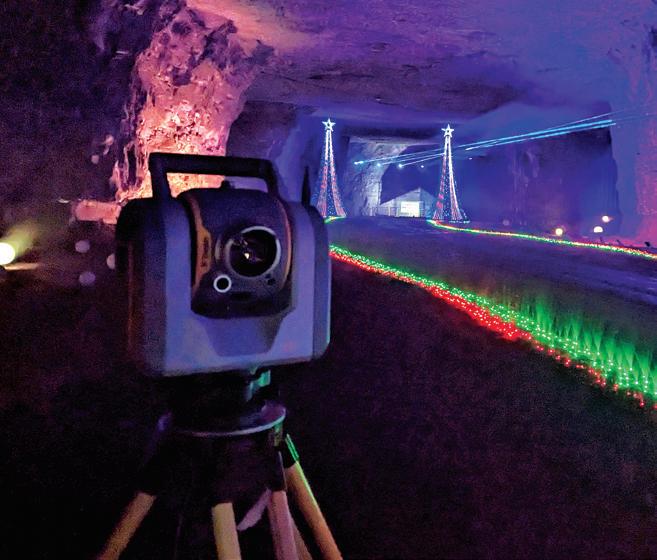
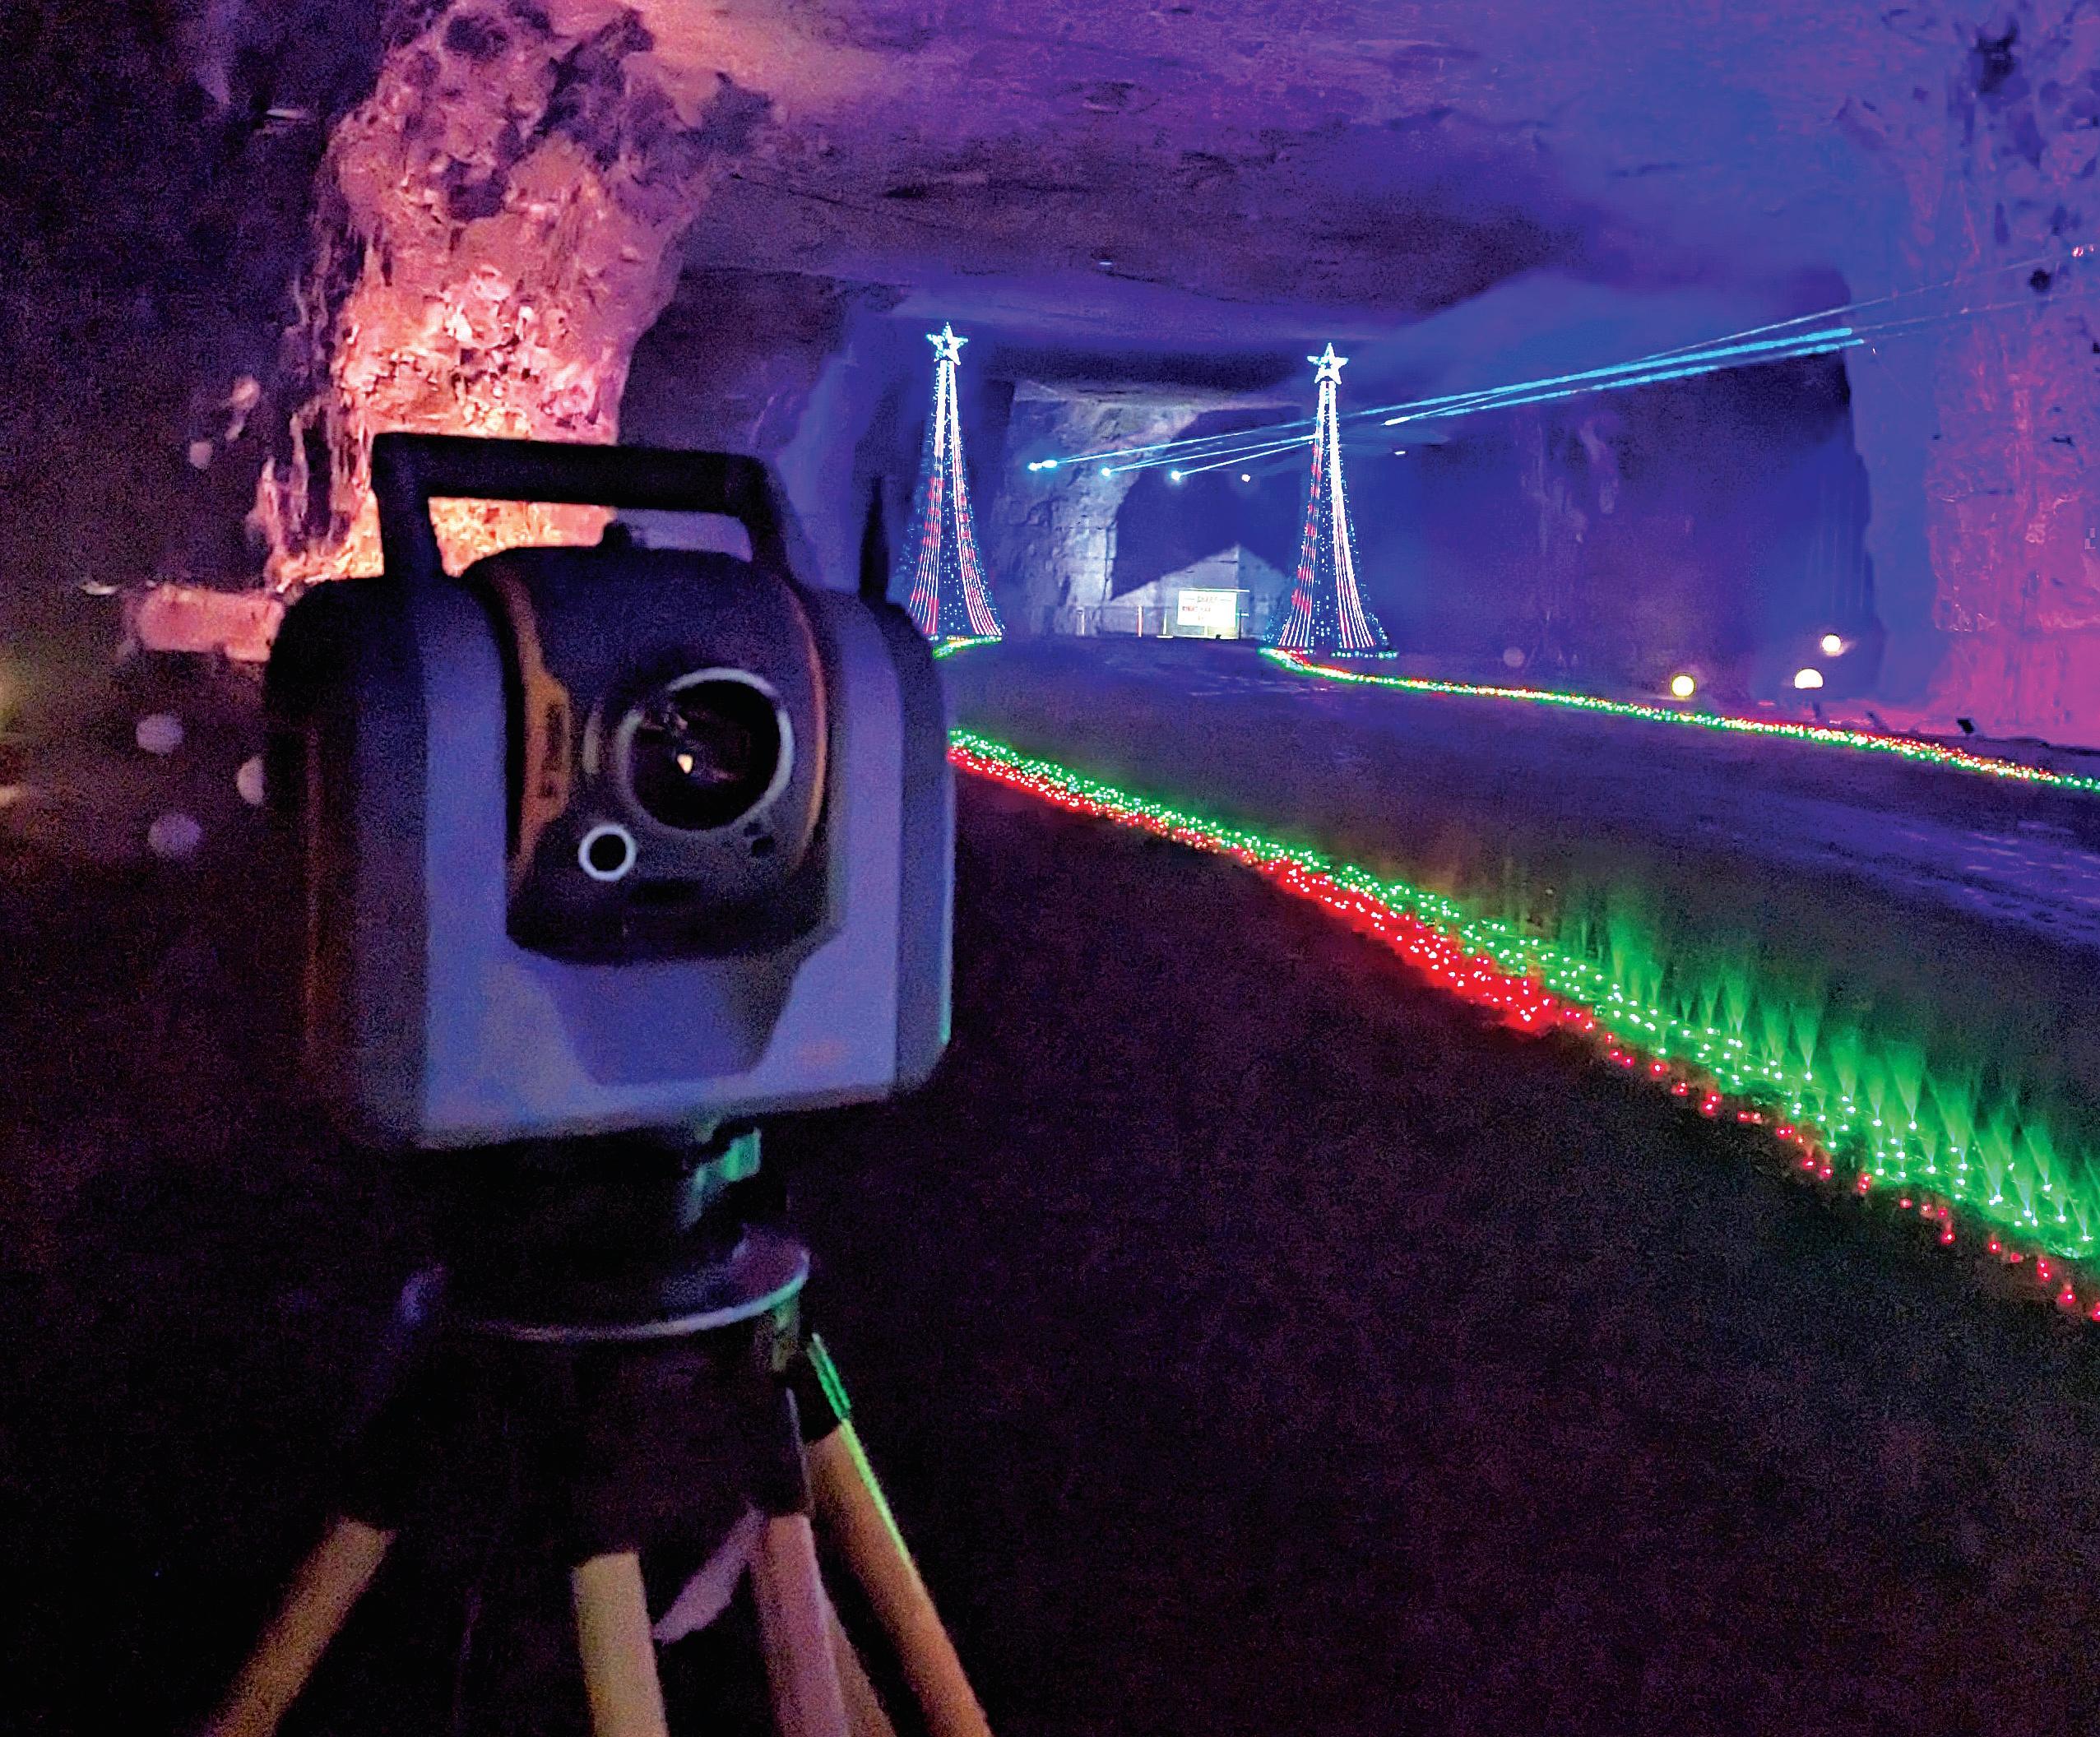
Surveying during the largest underground Christmas lights show in the world
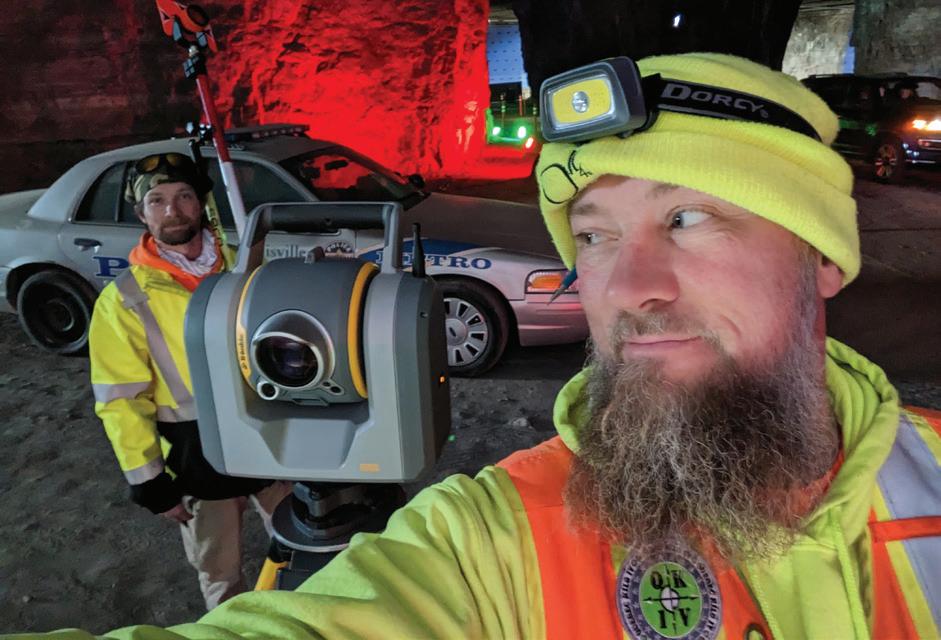
areas. More than just commercial storage, the Mega Caverns wanted to give people unique underground experiences unlike anywhere else in the world. So, the owners created the Mega Zipline, an adventure ropes course called Mega Quest, and during the Christmas season an underground Christmas lights driving tour that is more than three miles long.
Through all this development, the Mega Cavern never had an accurate land survey relating the recorded legal descriptions to the excavated portions with precise measurements to the horizontal extents and the vertical ground and ceiling elevations.
THE PROJECT
During the summer of 2022, the Mega Caverns hired Qk4, Inc. to perform an ALTA/NSPS Land Title Survey of the property boundaries and underground limits as well as a topographic survey of the interior portions of the cavern, including building walls, underground roadways, drainage sump pits, and the full zipline course.
Qk4 had worked on a few small-format scanning and design projects for this client and had previous awareness of the lease spaces but had never completed an underground boundary survey, and Louisville
Metro Planning and Design Services had never reviewed and approved an underground minor subdivision plat for land division.
More than just a modern boundary survey, the commercial property updated its title insurance and needed a full ALTA/ NSPS Land Title Survey to relate any title encumbrances affecting the property horizontally and vertically because of the elevation limits in the legal descriptions.
From previous work, Qk4 had some survey control, but it was going to take more than just a traverse and a few survey shots to capture every existing pillar and man-made improvement within the 100-acre site. The survey project team planned to use every modern survey tech advantage to capture a full 3D digital twin above ground and below.
Ben Shinabery, PLS and vice president for land survey at Qk4, Inc., led the survey team. In the 10 months it took to complete the survey, 10 Qk4 survey team members spent 732 hours:
• Establishing a control network inside and out with 96 survey control points and 150 additional scanning targets tied to KY
State Plane Coordinates, North Zone for future reference with Trimble R12i GNSS, and Trimble SX10 robotic total scanners for least squares adjustment processed in Trimble Business Center (TBC).
• Drafting rudimentary legal descriptions in poles using Carlson Survey running on AutoCAD Civil 3D, referencing historic property evidence on the above ground surface.
• 3D terrestrial scanning every accessible square foot of the interior of the cavern using Trimble SX10, x7, x12 scanners.
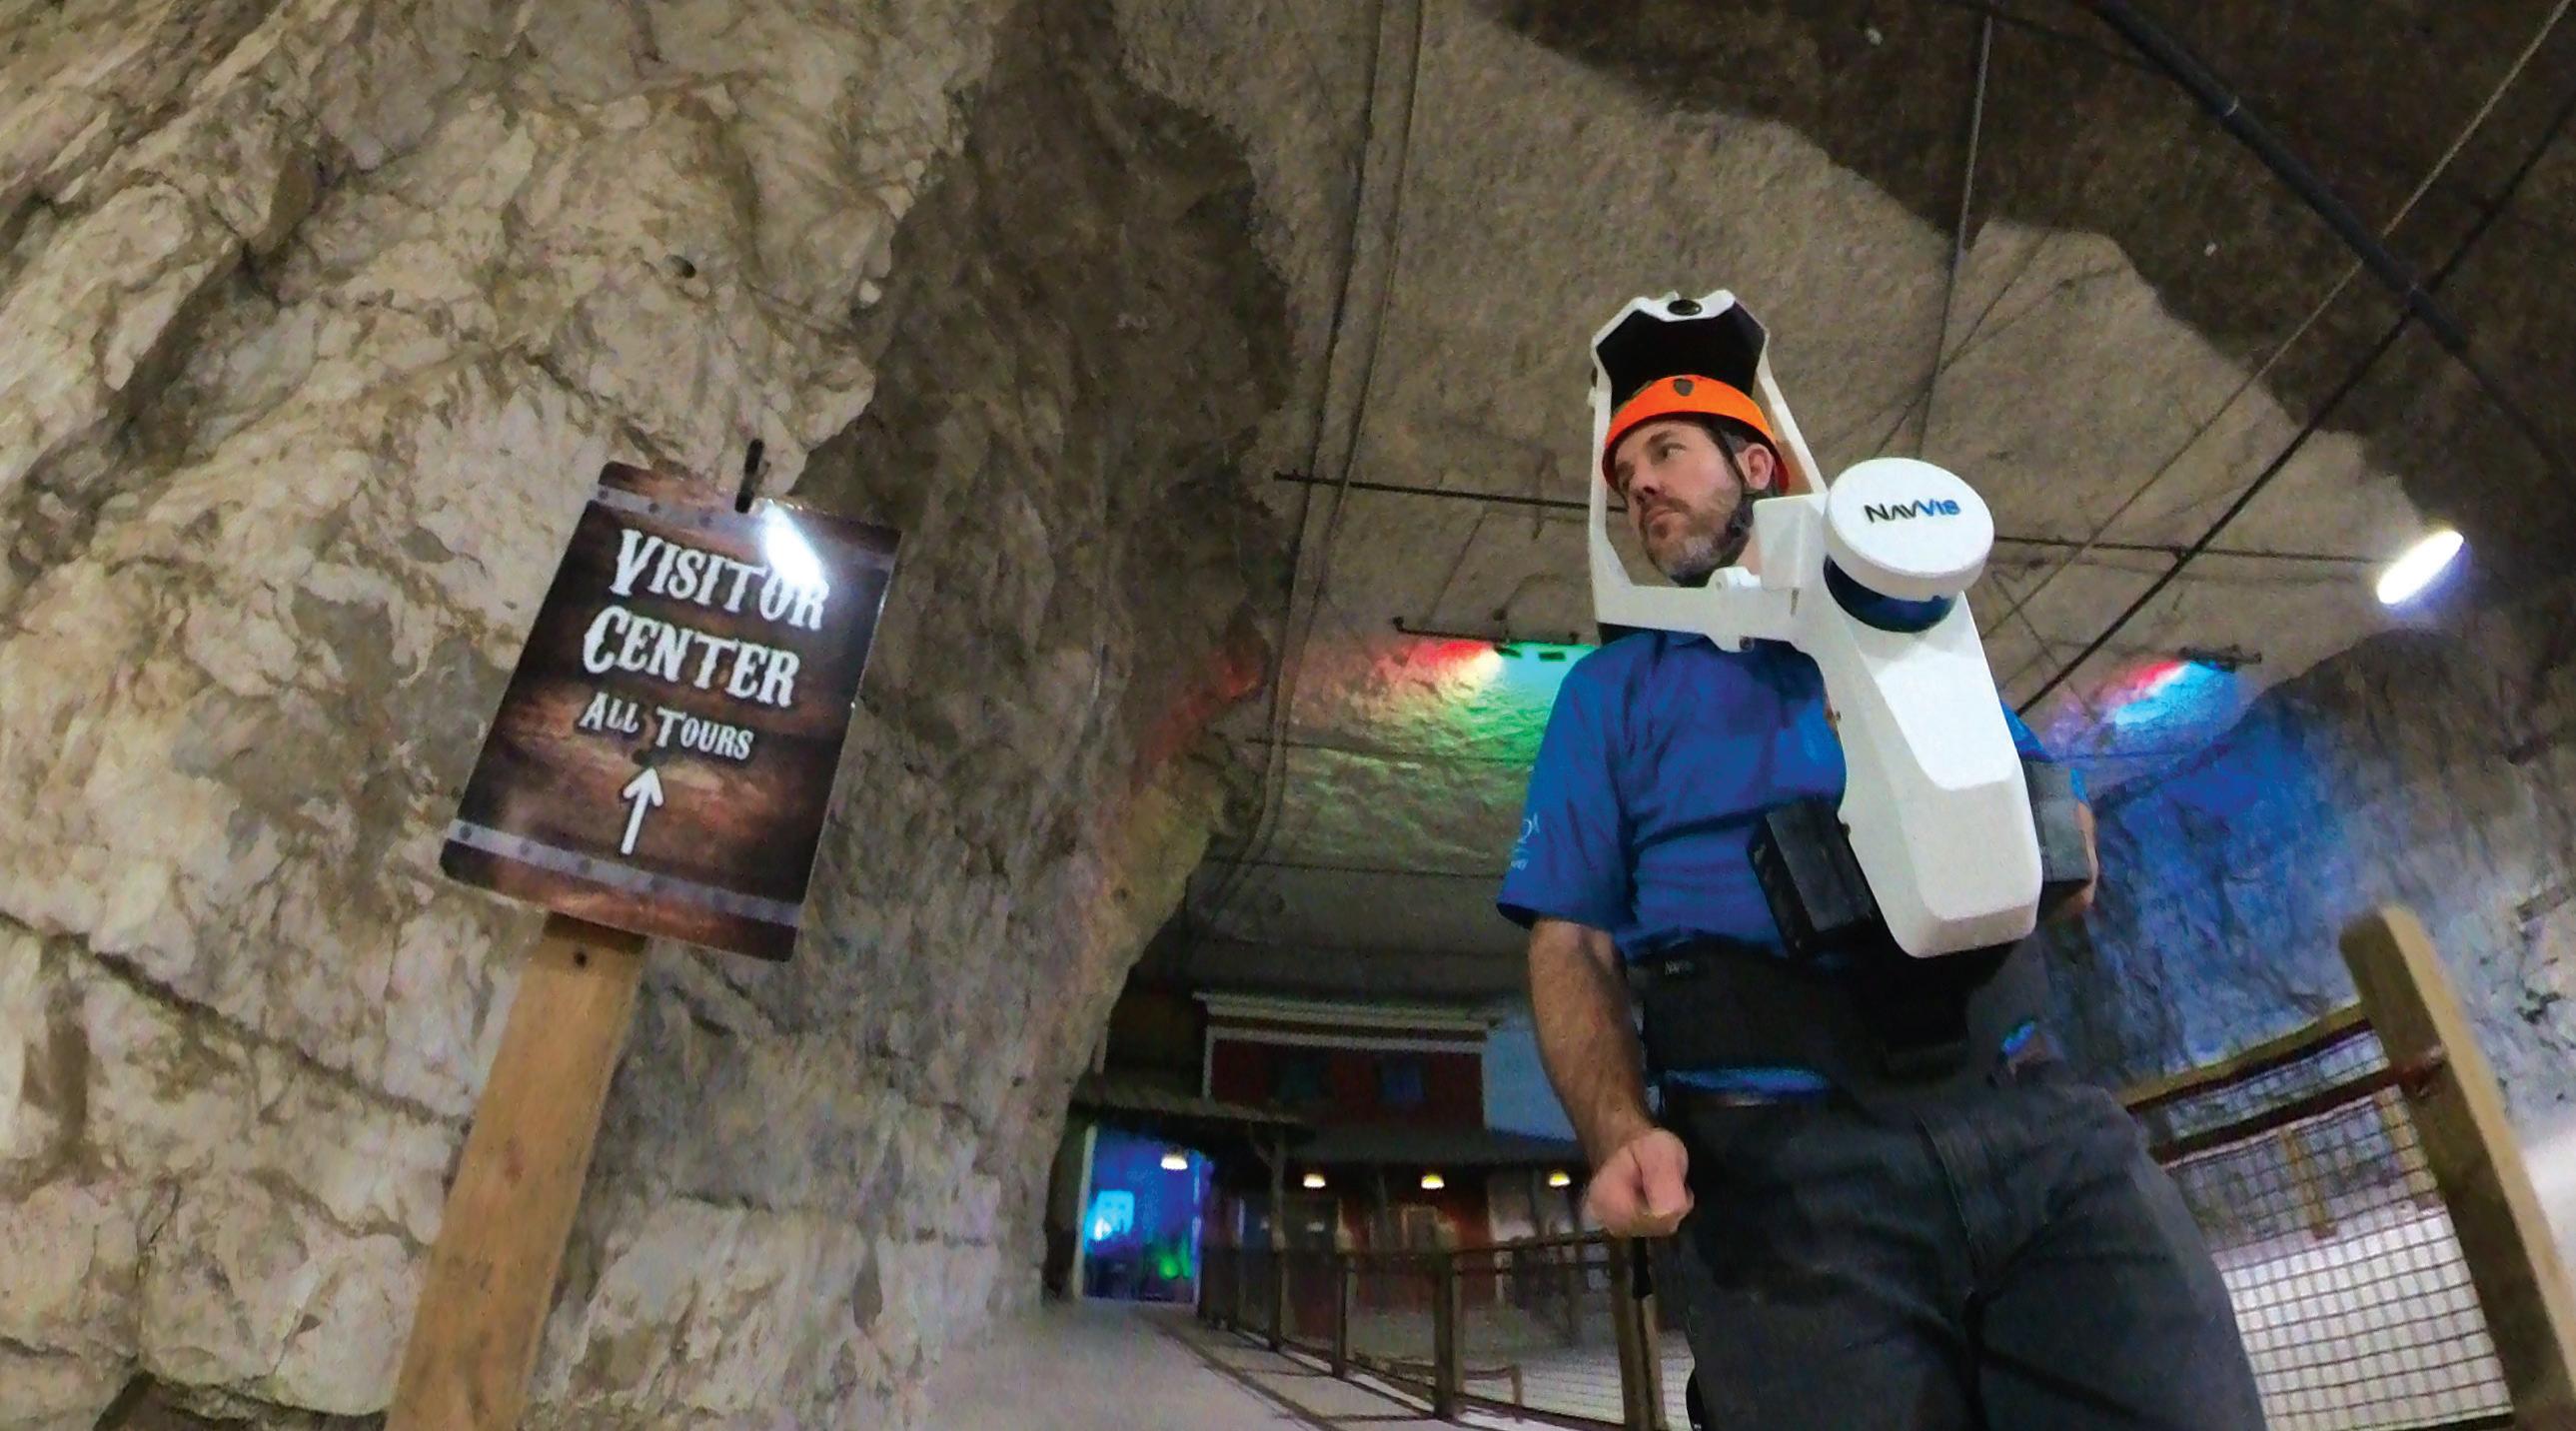
• Mobile lidar scanning more than six miles of route trajectory underground, collected with the Trimble MX9 mobile mapping system (100GB) and the NavVis VLX Mobile SLAM system (100GB) for full 3D digital twin registered in TBC.
• Extracting 3D ground and ceiling features through Bentley Microstation ORD Survey and TopoDOT software.
• Compiling and resolving property boundary evidence with basemap features in one combined AutoCAD Civil3D DWG.
The traverse network was adjusted throughout the collection area with a modern dense, cross-tied, least squares adjustment. This method saved time and effort by flagging problem control points within the network. The field crew could then focus remeasuring to those points instead of re-running the entire traverse to reach
xyHt 13 APRIL 2024
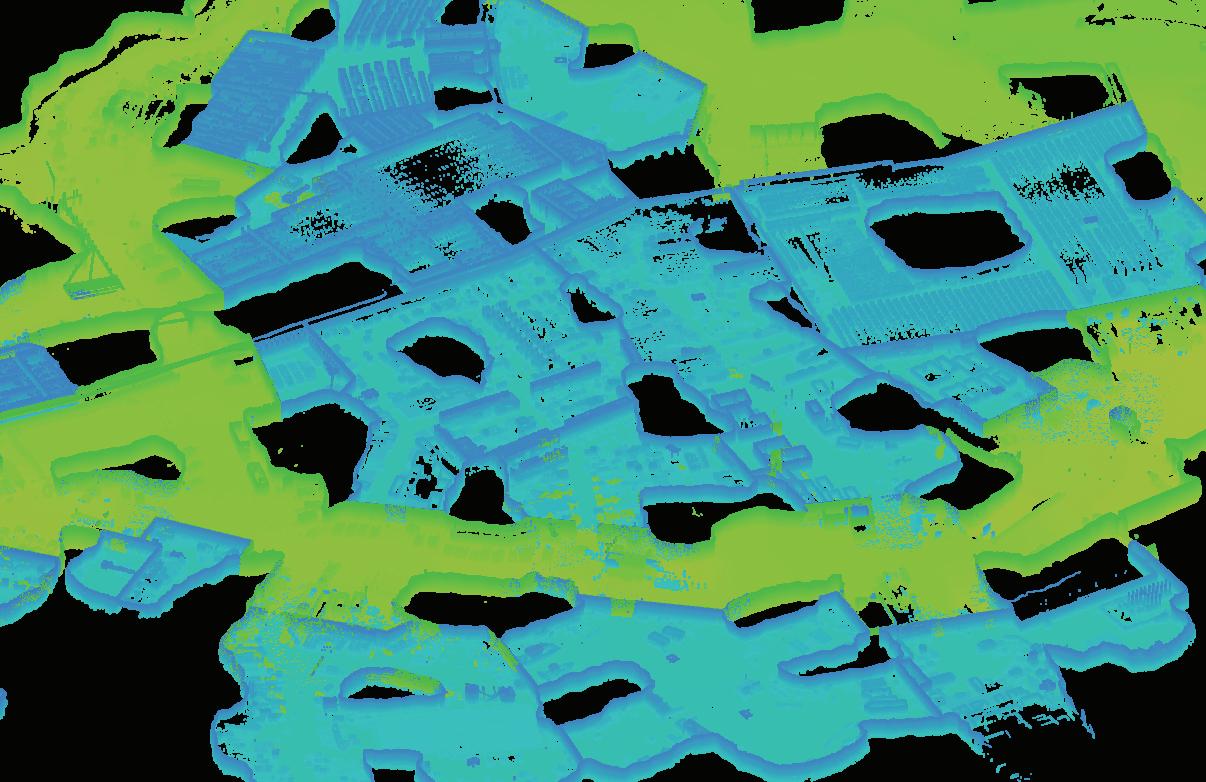
Underground storage buildings colorized in blue, truck routes in green, black voids in the data are rock columns between buildings
Matt Jenne & Steve Holliger setting the network of survey control and LiDAR targets
specified relative precision ratios.
“I have never run a traverse underground like this before,” said Steve Holliger, CST Qk4 crew chief. “This was a once-in-a-lifetime survey. It was pretty awesome.”
Visual reference targets allowed terrestrial scans collected on control to register SLAM lidar routes to project coordinates. The visual reference targets also served to align the mobile mapping trajectory to project coordinates without relying on the GNSS signals that are typically used for roadway mapping projects.
Processing the mobile mapping project
proved to be a significant challenge.
Working in Trimble Business Center using PFIX, a software function within the mobile mapping module, Qk4 was able to constrain the four miles of underground mobile trajectories to the checkerboard targets.
PFIX allows the software to adjust the mapping route just like a complex traverse adjustment similar to historic land survey methods but with thousands of corrections along the route. Without PFIX the underground mapping would have only had the sensitive IMU to track the MX9’s position and the accuracy would have been much reduced.
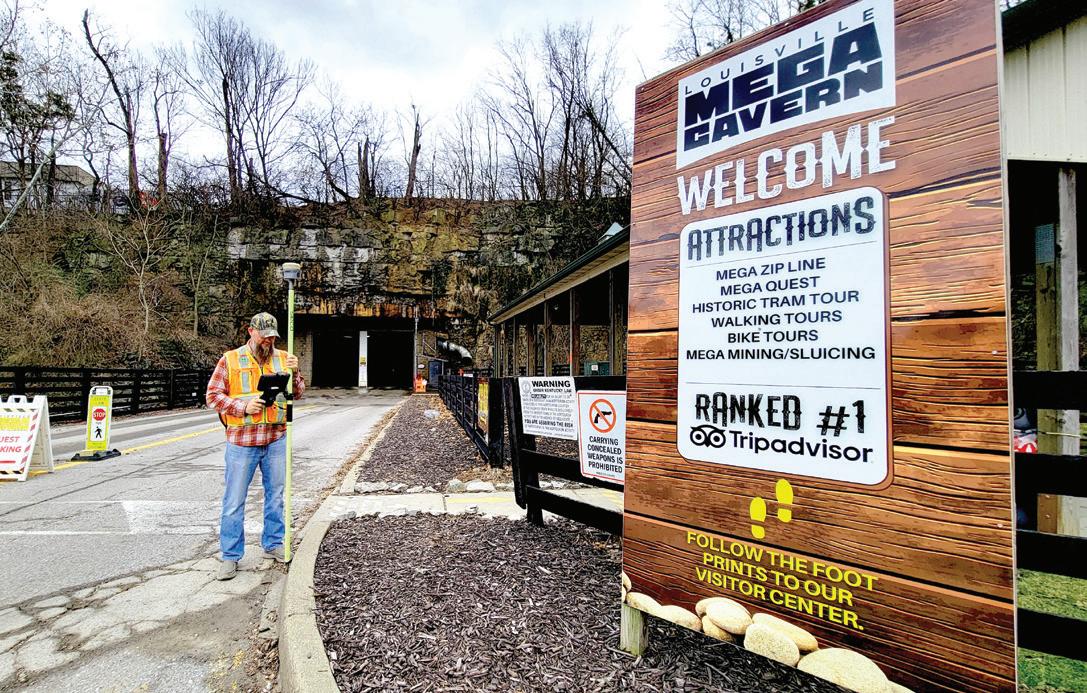
Property corners for the multitude of privately-owned parcels above ground were collected with robust GNSS survey receivers through local base and rover RTK giving crews the flexibility to walk directly
to referenced property corners across more than 100 acres of urban subdivisions. All this data would have overwhelmed surveyors just a few years ago through simple traverse adjustments and all side shots run from terrestrial total stations.
Because of the unique aspects of this 3D survey, Seiler Instruments, the local Louisville survey equipment dealer, produced a highlight video of the underground mobile mapping collection process with their Trimble MX9 mapper https://tinyurl. com/UndergroundMapping. This project was the first time trying out the MX9 underground.
Even though the Mega Caverns owns more than 100 acres underground, the one remaining above ground parcel that provides legal access to the cavern entrances from a public road contains only 4.205 acres. That single parcel is the only tax lot associated with the Mega Caverns in Jefferson County and served as the access point for a new underground minor subdivision plat associated with this survey project.
Before 2022, Louisville Metro Planning and Design Services had never reviewed any application for underground subdivisions. Creating a 2D plat of a 3D space is a chal-
xyHt 14 APRIL 2024
Ben Shinabery collecting SLAM LiDAR of the visitor center
Steve Holliger collecting shots for the ALTA/NSPS Land Title Survey.
lenging task, especially if property owners, attorneys, and insurance assessors need to understand spatially what separates above and below ground boundaries.
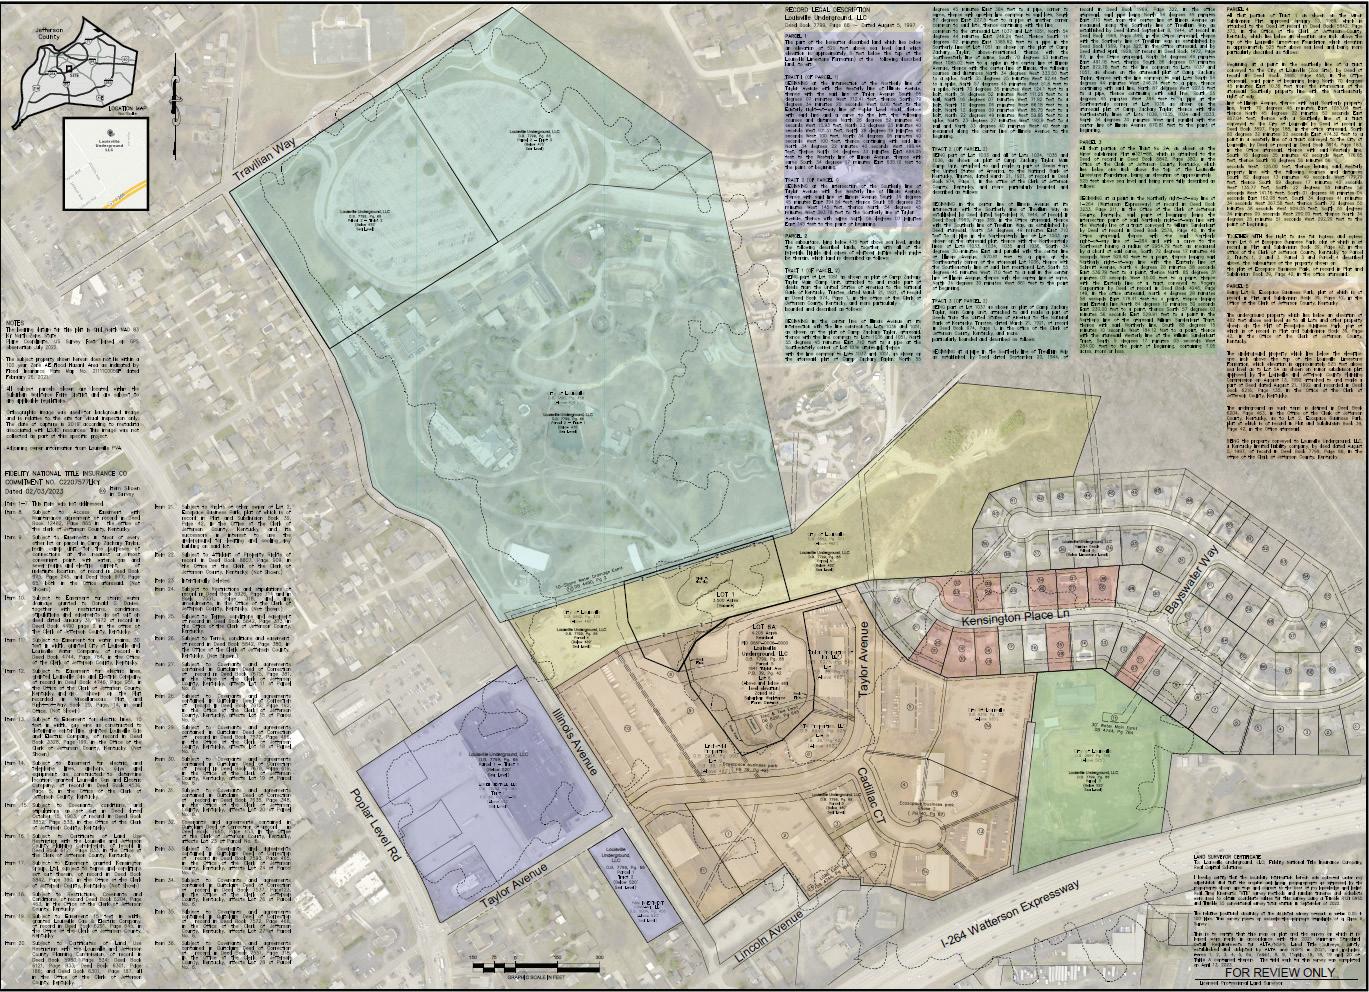
The solution in the rendering of the final subdivision plat included scale details of ground surface topographic contours and the relationship to different below-ground described elevations. The recorded plat is the only 3D underground survey plat ever to be filed at the Jefferson County clerk’s office.
Beyond the need for an accurate boundary survey, ALTA/NSPS Land Title Survey, and 3D minor subdivision plat, the data collected for the Louisville Mega Caverns has opened various other extended applications for Qk4 on this project. The existing lease
areas within the climate-controlled storage building underground had been calculated decades ago by single baseline estimates because the non-uniform perimeters of the support pillars are difficult to measure by hand.
Now with a full scan of the interiors, actual floor plans can be produced, and the exact areas and even volumes can be documented for new clients. New development plans for new buildings referencing actual underground topographic features can be designed, including ingress-egress distances, roadway connections, and facilities for office and loading dock spaces.
With a 3D digital archive of the Mega Caverns, no measurement needs to be
estimated moving forward. The dataset has created new opportunities for both the owners of the space and for Qk4’s survey team as they analyze and extract information from the point cloud. The value of the survey on this project lies in the living and growing value for future use.
“We learned many lessons about the capability of our survey team and the methods and processes we use for all our projects,” Shinabery says. “Trust previous experience to help make sound decisions, don’t say ‘It can’t be done because it never has been done,’ and be willing to push the boundaries even if it takes you underground.”
CONCLUSION AND FUTURE IMPLICATIONS
The Louisville Mega Cavern project, realized through the pioneering efforts of Qk4, Inc., marks a significant milestone in land surveying, demonstrating the profound impact of integrating advanced technologies such as 3D scanning and mobile lidar. This endeavor not only showcases the capabilities of modern surveying techniques in complex environments but also gave experience and confidence for future projects.
The insights gained from this project illuminate a path forward for the surveying field, emphasizing the necessity of innovation and adaptability. It challenges us to rethink traditional methods and embrace new technologies, potentially revolutionizing how we understand and interact with the space around us.
As we move forward, let the Mega Caverns remind us of the boundless possibilities that lie in the convergence of curiosity and technological advancement. It's a call to the surveying community to push beyond conventional boundaries and explore new horizons in our quest to map the future.
“Surveying the Louisville Mega Caverns was the most fun I’ve had working on a project. It presented many new challenges and opportunities to improve my skills and learn new techniques,” says Matt Jenne Qk4 survey technician. “Most surveyors would dream of working on a project like this.” ■
Ben Shinabery, PLS is the Land Survey Director at Qk4, Inc. and the NSPS Director for Kentucky. He is an early-adopter of technology for all types of land survey.
xyHt 15 APRIL 2024
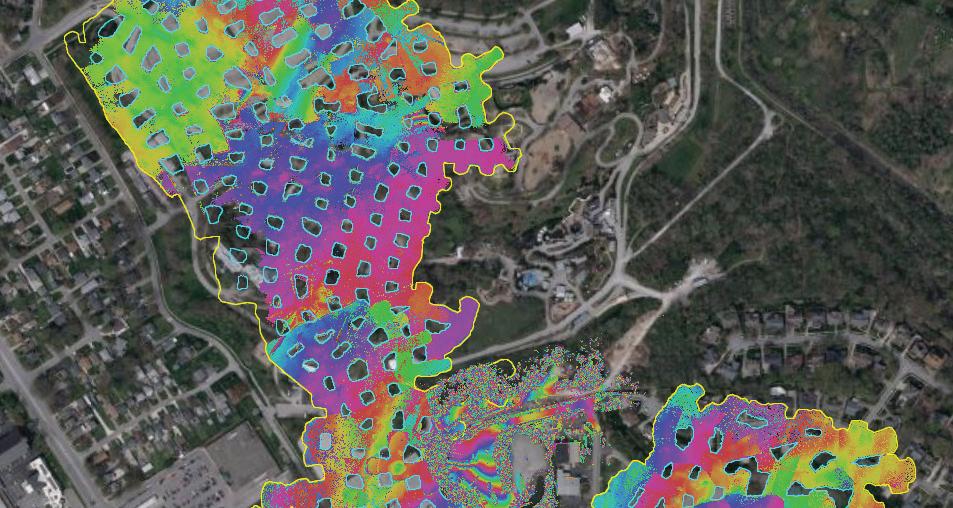
Top: Colorized scans overlaid onto an aerial map of Louisville. Bottom: A portion of the ALTA/ NSPS Land Title Survey with boundaries highlighted by legal description.
ROLLING ALONG VIRTUAL HIGHWAYS

Urban mobility in Europe gets a much-needed boost as cities develop digital twins for their road networks
By Marc M. Delgado, PhD
xyHt 16 APRIL 2024
digital twin technologies can improve urban mobility planning.
Innovative

If you ever find yourself riding one of London’s iconic taxis, a chat with the driver will surely turn to the city’s worsening traffic situation. Cabbies should know, because along with other motorists and commuters in the UK’s capital, they are spending more time stuck in gridlock.
Congestion in London is notoriously horrific causing people to lose an average of 156 hours in 2022. That’s roughly equivalent to a full week inside vehicles according to a report by Inrix, a mobility analytics company that examined traffic data from more than 1,000
cities in 50 countries. London tops the logjam list after Chicago (155 hours), Paris (138 hours), Boston (134 hours), and New York (117 hours). So, if you drive or commute every day and don’t live in any of these metropolitan cities, consider yourself lucky.
Yet cities outside London fared no better. During the same year, the hours lost in bottlenecks were relatively high in smaller-sized cities like Bristol (91 hours), Manchester (84 hours), and Birmingham (73 hours). Overall, the average UK motorist spent 80 hours in traffic jams—seven hours more than in 2021.
Aside from causing time delays, traffic congestion burns the environment and breaks the bank. Air pollution levels along busy roads are comparable to gridlock zones where drivers tend to leave their vehicle’s engine running while not moving. Idling vehicles release exhaust fumes into the air and waste an enormous amount of petrol and money. According to the Inrix report, the average UK commuter spent £707 ($895) in lost time and paid £122 ($155) more for fuel due to traffic jams.
The UK’s Transport Minister, Jesse Norman, wants to improve all that by promoting the creation of a digital twin for the country’s transport system. The plans are outlined in the Transport Digital Twin Vision and Roadmap 2035 and were unveiled during the Connected Digital Twins Summit held in London last year.
“The UK is a global leader in transport technology partnering with industry,” he said. “The Vision and Roadmap for Digital Twins shows how the Department for Transport is supporting innovative digital twin technologies for a cleaner, greener, and more efficient transport system.”
Connected Places Catapult (CPC), an accelerator agency focusing on technological innovations for cities and transportation, developed the digital twin roadmap for the UK’s Transport Research and Innovation Board (TRIB), the main government body that coordinates transport-related research activities.
“The use of digital twin technology has the potential to transform the UK transport sector to deliver better outcomes for the user and advance the transition to net zero emissions,” according to the TRIB website.
When the digital twin of the UK’s transport network is completed, it will include several features that will benefit the commuting public. One of them will be the ability to perform real-time simulations of vehicular flows to help road authorities anticipate traffic jams and implement adaptive road controls. Another will be the capacity to optimize the best possible use of multimodal transport and make the movement of both people and goods faster.
The aim of the UK transport digital twin, however, is not only to improve travel times but also to minimize air and noise pollution. For example, Slingshot Simulations, a simulation-as-a-service software company based in Leeds, has received support from the CPC and TRIB in developing the Compass Engine, a digital twin that can run traffic flow simulations and predict the emissions and noise levels based on different traffic scenarios.
Slingshot Simulations has already successfully implemented a case study in Bristol to illustrate how its digital twin technology can rapidly assess the road-by-road impacts at a city-scale. Five other UK companies are now developing transport-related digital twins that will demonstrate how this new technology can deliver useful products for the country’s mobility sector.
xyHt 17 APRIL 2024

The UK’s turn to digital twins seems to be a part of a broader shift by national governments and cities in Europe toward improving their transportation networks via digitization. A survey of urban digitization efforts published in 2021 by researchers from the Technical University of Catalonia, in Spain, found that cities in the old continent are emerging as the main center of new
digital twinning developments worldwide. Today these ventures are proving to be more than just side projects. As fuel prices rise and citizens become more aware of the environmental impacts of their mobility choices, urban leaders in Europe are finding innovative ways to refine their transport infrastructures and transform the quality of city living by virtual replication.

DIGITAL E-UROPE
Leading the pack in digital twin building is Tallinn, the capital city of Estonia. Being located in the most digitally advanced country in the world may have given this city a huge head start because ever since its independence in 1991, the country reinvented itself from scratch and went fully computerized. In this Baltic country of 1.3 million people, almost all public services are accessible online and no less than 92 percent of households have an Internet connection.
When Tallinn city planners built its city’s digital twin a few years back, they started with a simple 3D mapping representation of the old town. But with advances in lidar point cloud mapping and building information modeling (BIM), its urban digital model now covers the entire city.
Tallinn’s digital twin provides a useful template for urban planning, analysis, and design. However, because it lacked the ability to simulate changes in urban mobility and build scenarios to improve transport planning, city planners decided to create a fully digital transport twin. They launched it in 2021.
“We reached a point where an additional tool would be very helpful to analyze both
xyHt 18 APRIL 2024
London is one of the most traffic-congested cities in the world.
Antwerp’s digital mobility platform can help its citizens choose from various intermodal means of transport, including trains, buses, and even bicycles.
traffic and public transportation issues,” urban mobility expert Grigori Parfjonov said in a blog post. He works at the Tallinn Transportation Department, which uses the digital twin of the city’s transport network to predict problems in urban mobility and provide practical solutions to traffic.
Based on the PTV Visum software, a transport planning platform, Tallinn’s pioneering road digital twin allows city authorities to simulate traffic situations as well as evaluate future improvements to the city’s public transport network. The software not only incorporates vehicles in Tallinn’s digital transport model but also includes the movement of pedestrians to improve the mobility experience for every road user.
“The transport model is a digital tool that brings together all available data to help us understand how and when people move around Tallinn,” said Andrei Novikov, deputy mayor of Tallinn. For example, traffic simulations can be used to decide on the vehicular capacity of specific streets and support the upgrading of the city’s public transport network.
Besides Estonia, the UK can also look toward Germany for lessons in digital twin building. Cities such as Stuttgart and Munich are focusing on improving urban mobility and quality of life by digitally twinning their road networks with environmental data.
Stuttgart’s digital twin model, for example, controls and optimizes urban traffic so that pollutant emissions from cars can be reduced. Based on Hexagon’s geospatial enterprise platform and Fujitsu’s cloud services, the city’s twin also monitors parking space occupancy and flood levels. The Stuttgart Urban Digital Twin project also provides city planners with a vast amount of mobility and environmental data, according to Jens Schumacher, head of IT for the Stuttgart Civil Engineering Office. “The IoT analysis platform from Hexagon and Fujitsu will give us the ability to use that data to make smarter decisions for the good of our city,” he said.
twin more dynamic, allowing users to fuse the real and digital worlds with the use of mobile technology.
Christine Kugler, city councilor and head of the Department of Climate and Environmental Protection for Munich, said the city’s digital twin represents a significant stride toward digitized environmental planning to achieve a climate-neutral and low-pollution city. “It allows us to analyze real-time environmental data using our comprehensive digital infrastructure.”
What makes all these digital twins function is their focus on integrating the geospatial context of the road, the basic building block of any transport-based city model. To have a geospatially correct digital twin means that each segment of the road network is represented in highly accurate dimensions that pays special attention to their spatial location and topology.
Doing so allows urban planners to make use of connected sensors on the ground to
buses, and even bicycles. In turn, the data generated by users of this smart system has allowed Antwerp to improve its public transportation services and mobility.
THE BEATEN ROAD IS THE SAFEST
Cities around the world are confronted with the same big challenges to mobility. The first is how to keep up with increasing demand for urban transport as populations grow. According to the World Bank, nearly 70 percent of people will live in cities by 2050 when urban population will double to six billion.
The second problem is rising costs, which may be harder to fix. Building new transport infrastructures in cities can take time to finish and are usually expensive. In the face of these pressing issues, cities must still be able to provide transport systems to support commuters who live in cities.
Investing in digital twins now, therefore, may guide city managers in tackling the challenges of planning, monitoring, and managing urban mobility. With digital twins, city planners can simulate different urban transport options and evaluate their performance before construction begins. This can lower budget costs and optimize the use of scarce open spaces.

capture different types of location-based data and visualize traffic events on the fly, while at the same time apply real-time analytics to support fast and actionable decision making.
The good news is that “the digital twin city market is booming,” as stated in a World Economic Report released last August. And that growing interest of cities to build their own virtual copies is driven largely by the availability of digital data and faster computing power.
Munich’s approach, however, goes even further by incorporating highly detailed geospatial data, including real-time weather data, traffic volumes, and noise or air pollution measurements. This makes its digital
The port city of Antwerp in Belgium has been doing just that. Since 2018 its Generic IoT Platform (GIP), developed by IT company Sirus, combines various data in real time from thousands of sensors scattered in the city to improve the intermodal mobility of its citizens. The GIP platform can be accessed via a public website by anyone who needs information on the most efficient route to get them to reach their desired destinations, either by using trains,
Yet the same report also concludes that developing one is a complex undertaking, even in more technologically advanced countries. According to the DUET Project, a European initiative that promotes the use of digital twins in the public sector, there are still several challenges in committing to the use of this mirroring technology. ■
Marc Delgado, PhD, is a GIS specialist who crisscrosses continents teaching GIS in Asia, Europe, South America, and Africa.
xyHt 19 APRIL 2024
The digital twin of Tallin’s transport network can predict problems in urban mobility and provide practical solutions to traffic congestion.
The surveying and geospatial communities in the United States have been using geodetic datums that were designed and implemented at a time when the Global Positioning System (GPS) was in its infancy. Yes, we are referring to NAD 83 and NAVD 88, the horizontal and vertical geodetic datums that have been in use for decades. Well, changes are coming to the nation’s positioning infrastructure and all our geospatial data.
The National Geodetic Survey (NGS), which sits within the National Oceanic and Atmospheric Administration (NOAA), is responsible for defining, maintaining, and providing access to this positioning infrastructure, called the National Spatial Reference System (NSRS). Since 2007, NGS has been working to overhaul the NSRS as part of a herculean modernization program. Horizontal positions are currently defined by the North American Datum of 1983 (NAD 83). This will be replaced by four tectonic plate-fixed terrestrial reference frames, which will provide latitude, longitude, and ellipsoid height information referenced to specific epochs in time. Vertical positions or elevations are currently defined by the North American Vertical Datum of 1988 (NAVD 88) in the contiguous United States (CONUS). Other states and territories have their own vertical datums. These will be replaced with the new geopotential datum, partly including a geoid model that spans the entire northwestern quadrant of Earth.
The new datum and reference frames will be accessible nearly anywhere, removing the need to rely solely on aging physical infrastructure like survey marks,

NOAA’s NEW GEODETIC DATUM
Replacing NAD 83 and NAVD 88 have been in the works for a long time; now the change is getting near
BY JUAN PLAZA
which currently help define NAD 83 and NAVD 88. The new terrestrial reference frames that will replace NAD 83 will be accessed via reference stations that continuously receive Global Navigation Satellite Systems (GNSS) data like GPS. These reference stations are known as CORSs, or Continuously Operating Reference
Stations, some of which are maintained by the NGS as part of the NOAA CORS Network (NCN). This continuous GPS data allows NGS to estimate errors introduced into GPS measurements, such as those from changing conditions in the atmosphere, particularly water vapor and precipitation. This information is then used by NGS’s Online Positioning Users Service (OPUS) to process user submitted data and improve the accuracy of the resulting coordinates.
Users can use OPUS to help accurately determine any geometric position, which includes latitude, longitude,
xyHt 20 APRIL 2024
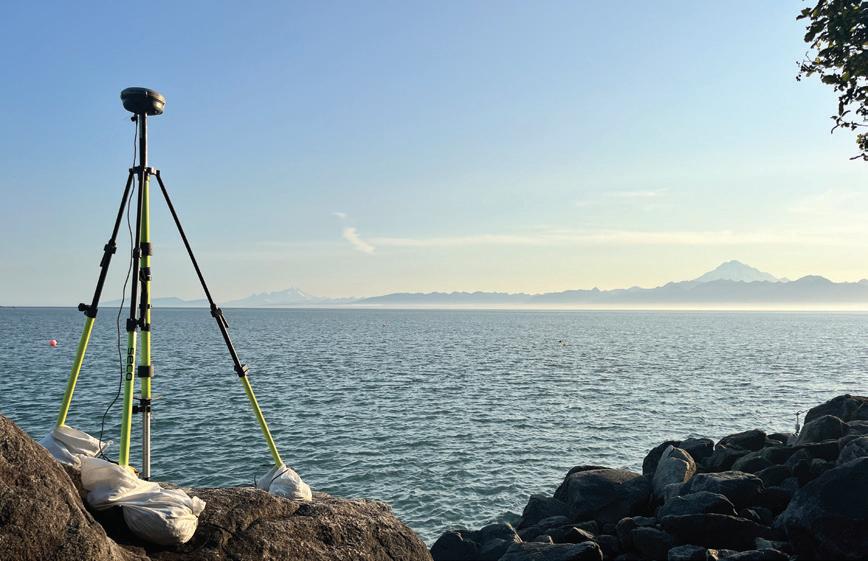
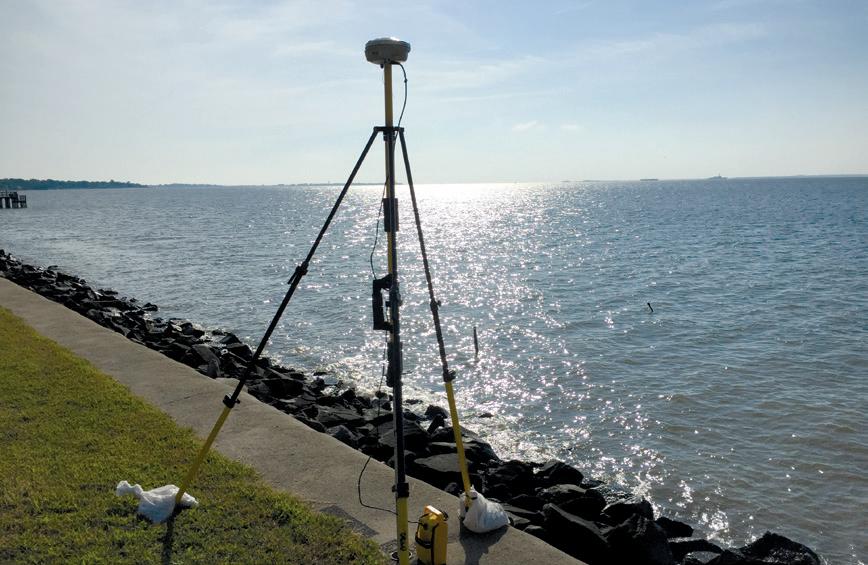
Left: GNSS Receiver measuring a precise static location in Cook Inlet, Alaska. Right: GNSS receiver measuring ground subsidence in Newport, Rhode Island.

and ellipsoid heights, computed using an ellipsoid model of the earth. An ellipsoid is used as a rough approximation of the shape of the earth; however, we know that the earth is not a perfect ellipsoid. As a result, we need other models to fill in the picture.
The first type are digital elevation models that reflect the varied topography of the earth, including features such as mountains, valleys, rivers, and shorelines. The second type are models of gravity, such as the geoid models, that relate to the varying strength of gravity according to the mass of the underlying land, with highs in mountainous regions and lows in less dense areas. Combining ellipsoid heights from GNSS with a new NGS geoid model will define orthometric heights (colloquially called “heights above sea level”) in the modernized system.
Galen Scott, NGS constituent resources manager at NGS, said the changes are not only exciting, but hugely relevant for our industry.
“The current vertical datum for CONUS and Alaska, NAVD 88, was developed by adjusting together 2.2 million kilometers (1.36 million miles) of geodetic leveling data collected by surveyors walking across the country making precise observations between nearly 800,000 benchmarks over the course of nearly a century,” Galen said. “It was a huge effort that resulted in a very accurate model using the best science of the time. But things have changed, and the reality today is that satellite data is critical to most of the geospatial data workflows now used across the industry.
“The new geopotential datum and terrestrial reference frames will take advantage of many technological advances and will provide a foundation for geospatial data that is not only more accurate and more accessible, but nationally consistent, aligned to international standards, and aligned to our current understanding of the center mass of the earth, around which all our positioning satellites orbit. All of these updates together will enable us all to get more out of our geospatial data sets than ever before.”
The centerpiece and one of the most impressive accomplishments of the NSRS modernization program was GRAV-D, or Gravity for the Redefinition of the American Vertical Datum project.
“The new reference frames will rely primarily on GNSS, such as GPS, as well as on a gravimetric geoid model resulting from the GRAV-D Project,” Galen emphasized.
According to NGS, these new reference frames will be easier to access and to maintain than the current NSRS, which relies on physical survey marks that deteriorate over time.
“Some issues that were not well accounted for in the current NSRS are continental drift and land deformation. But this time we have designed the modernized system to better account for these important types of changes on our dynamic planet,” says Galen. “Historically, we lumped together the North American and Caribbean tectonic plates for NAD 83. Now we understand and can measure how
xyHt 21 APRIL 2024
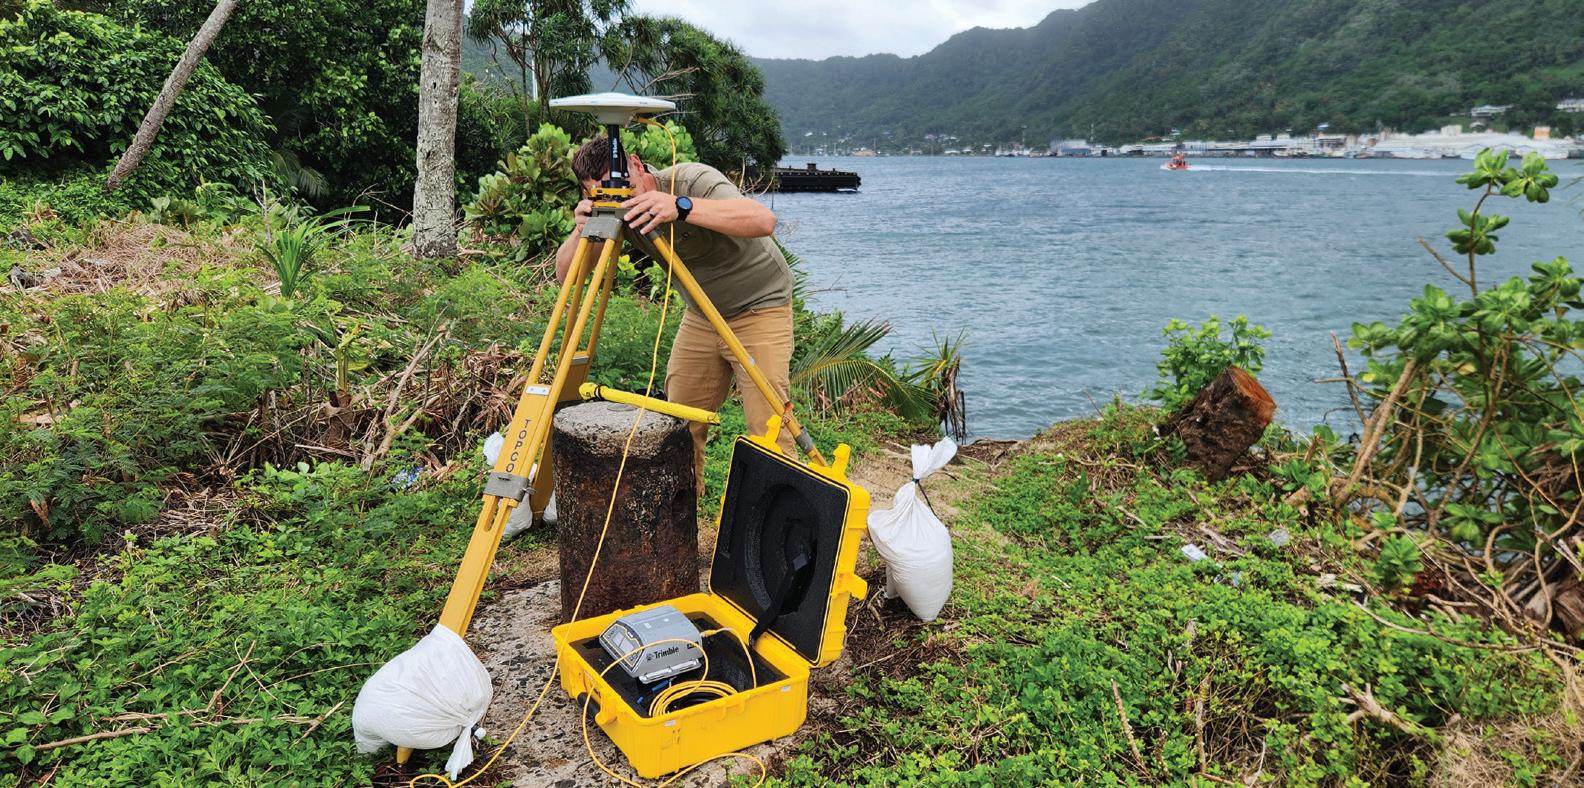
NOAA surveyor carrying a tripod in American Samoa.
GNSS receiver measuring a precise static location in American Samoa.
those plates rotate individually, so this time we have defined four Terrestrial Reference Frames (TRFs) for the four tectonic plates within our areas of responsibility. These include NATREF2022, PATREF2022, MATREF2022, and CATREF2022 named for the North American, Pacific, Marianas, and Caribbean plates, respectively. We’ve also introduced reference epochs for coordinates, that are like timestamps for survey data to help us make sense of changes in the landscape over time.”
Another big issue that was addressed during the preparations for the release of the new NSRS was the exact definition of the center of mass of the earth.
“I know that it sounds strange, but NAD 83 was not geocentric.” Galen said. “Over the decades, scientists have perfected our understanding of the exact location of the center of mass of the earth. This is essentially the point around which the earth rotates and satellites orbit. NAD 83 is non-geocentric by about 2.2 meters (7.2 feet) which complicates the matter when using GNSS satellite data.
In CONUS, NAVD 88 is both biased (by about one-half meter) and tilted (about one meter coast to coast) relative to the best global geoid models available today. In addition to this bias and tilt, NAVD 88 suffers from the fact that it was made from old leveling data on marks that
may have moved since they were surveyed, and the update process used did not effectively account for vertical land motion over time. All these issues are being addressed in the modernized system.
The new terrestrial reference frames will be completely geocentric and will rely on GNSS data that does not deteriorate over time and is much harder to remove by external forces.
“Another historical fact that might sound superfluous, but it plays a key role in the accuracy of the new model is that in the past the crews working on horizontal measurements and vertical measurements were different,” Galen said. “Now the geometric and geopotential (or horizontal and vertical) systems are defined together and that will bring an extra layer of consistency to the new system.”
So, when will the new system be available?
“Well, it’s not a binary answer or a day and night deployment,” Galen said. “This is an enormous undertaking, and it will not all come out at once. In fact, we just had a webinar called Progress Toward a Modernized NSRS on February 8, 2024, that explained the remaining steps and timelines. In a nutshell we will be rolling out modernized NSRS components onto NGS’s BETA website beginning in mid-2024 and are aiming
for all the data and a limited set of tools to be available by mid-2025.
As each component is rolled out, it can be tested and the process of being incorporated into geospatial data workflows can begin. Once all components are available, another full six months of testing will continue, culminating in the actual replacement of the current NSRS with modernized NSRS sometime in 2026.
However, the time to prepare is now. While tools will be available to facilitate the transformation of specific position information, it can take years to change products, services, or databases. Surveyors and geospatial professionals may want to begin examining the metadata of current databases and records that may be impacted and plan for the effort required to transition them to the new system based on the accuracy requirements of the data and related products. For more information, check out the Transitioning to the Modernized NSRS section within the NGS Blueprint 3 document.
Another issue that might be important to examine as an industry is that many state and other governmental entities passed laws requiring that public works or maps reference NAD 83 or NAVD 88 and many private contracts have similar references. Those laws or contracts will need to be changed to refer to the current
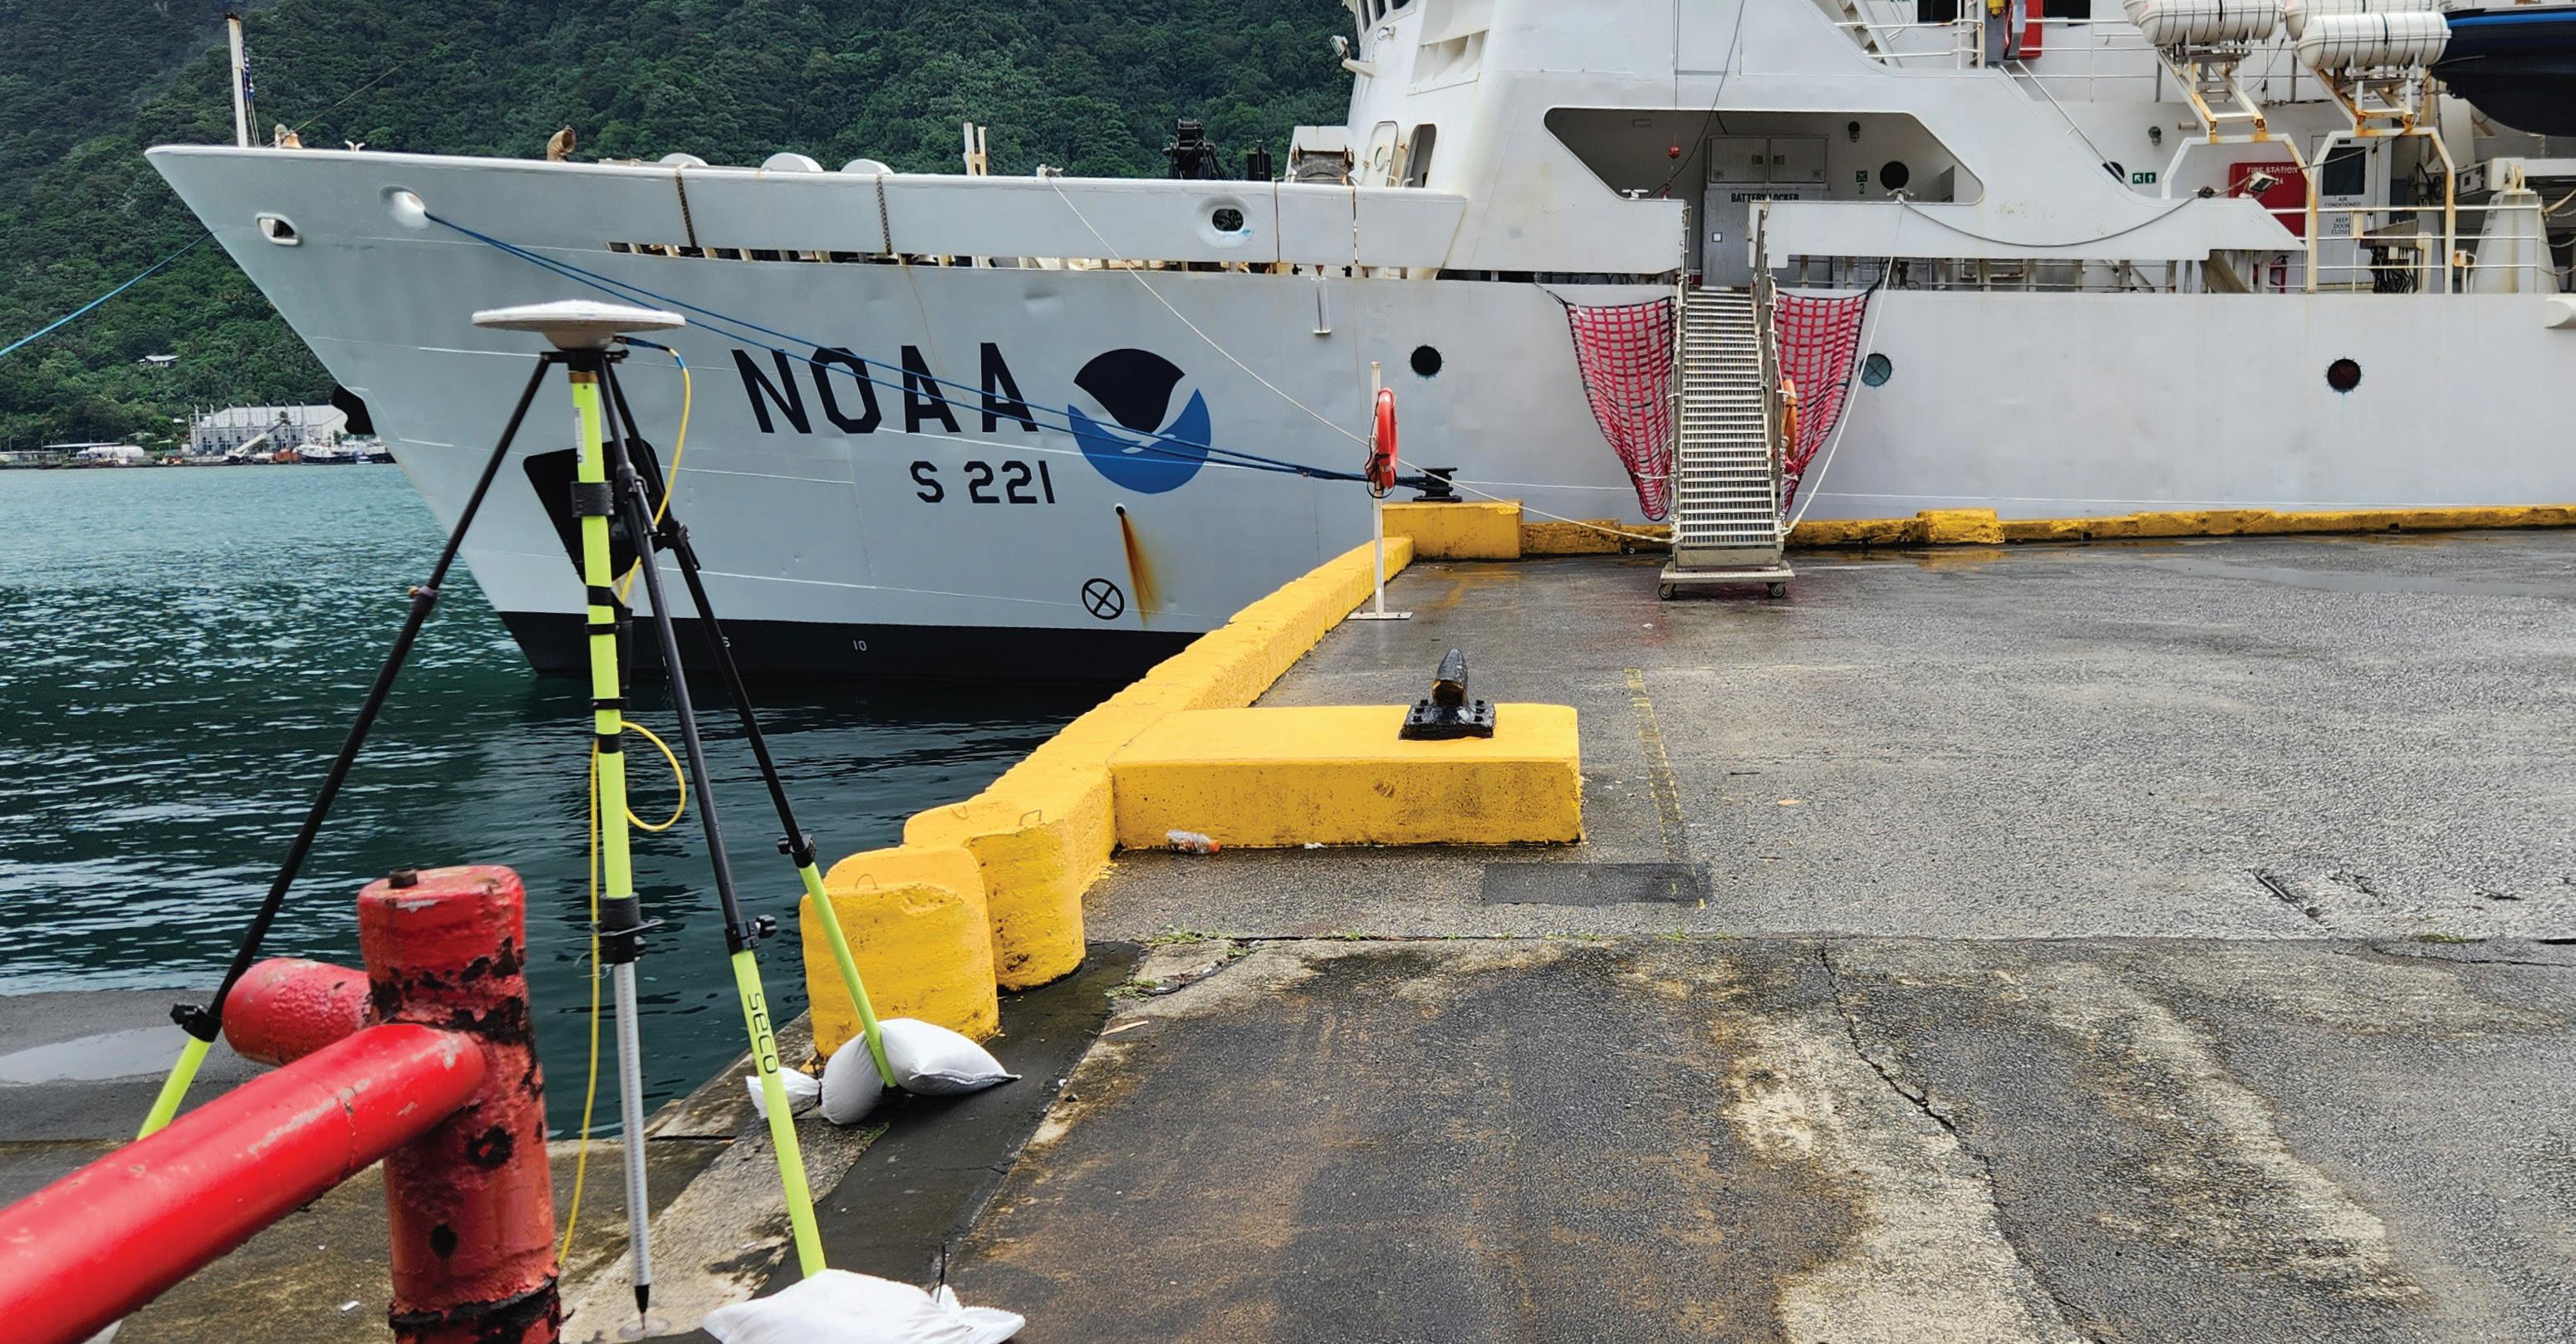 GNSS Receiver in front of a NOAA research vessel in American Samoa.
version of the NSRS, and examples are available on the NGS “Get Prepared” page. Starting to plan now will help you be well positioned for the change.
“The benefits of the new system are not quantified just in terms of accuracy, but there’s also a huge economic impact that will take place over 10 years.” Galen said.
An economic study by NOAA was commissioned to look at the financial benefits of updating horizontal and vertical datums to more accurately reflect the satellite-based nature of our profession today and in the years to come. The study mentions that the overall number of persons employed in surveying and mapping is estimated between 170,000 and 200,000.
The study concludes that a conjectural estimate of the net benefit of GRAV-D is in the vicinity of $240 million per year. The present discounted value of benefits of $240 million per year over 15 years is $2.2 billion. Combining the benefits of the $2.6 billion estimate of the benefits of GRAV-D in avoided costs of expensive long distance geodetic leveling with the $2.2 billion from improved floodplain management yields a combined estimate of the present value of benefits of GRAV-D over 15 years of $4.8 billion.
“We are confident that the transition to a modernized NSRS will contribute greatly to the accuracy of the mapping in the country, and it will allow surveyors and geospatial professionals to adapt their methodologies and workflows to the new system in a way that would benefit all involved,” concluded Galen.
For further information about the specific changes and to keep track of the specific release dates, go to www. geodesy.noaa.gov and subscribe to the different newsletters that are updated continuously. ■
Juan B. Plaza is a drone and general aviation consultant based in Boca Raton, Florida. He specializes in the modern uses for crewed and uncrewed aviation in the areas of mapping, lidar, and precision GNSS. He is also a commercial pilot and frequently flies photogrammetry missions in Cessna Citation jets and Piper Aztec light twin.


xyHt 23 APRIL 2024
TAKING CARE OF BUSINESS
Kompass offers business a management solution built by surveyors
Managing an expanding AEC company requires skill and patience, but growing the company calls for far-sighted strategy.
Better ways to do routine tasks must be implemented, even for tasks like timesheets and human resources. Sometimes when that happens, the efficiencies can be astounding. The savings have been great as a result of a Boston-based geospatial company adopting the Kompass platform; so great that the company has been able to grow substantially.
BY JONATHAN BARNES
In 2021, Boston-headquartered Feldman Geospatial had about 80 employees and too many apps managing various aspects of the business. Invoices, spreadsheets, CRM, and other areas were siloed in different platforms, wasting employee time on tasks and being confusing as well. The platform plethora was impeding the company’s growth, and something had to change.
“It became unmanageable,” said Paul Foley, president of Feldman Geospatial, noting that the company was seeking a business management platform and were referred to Kompass by Murphy
xyHt 24 APRIL 2024
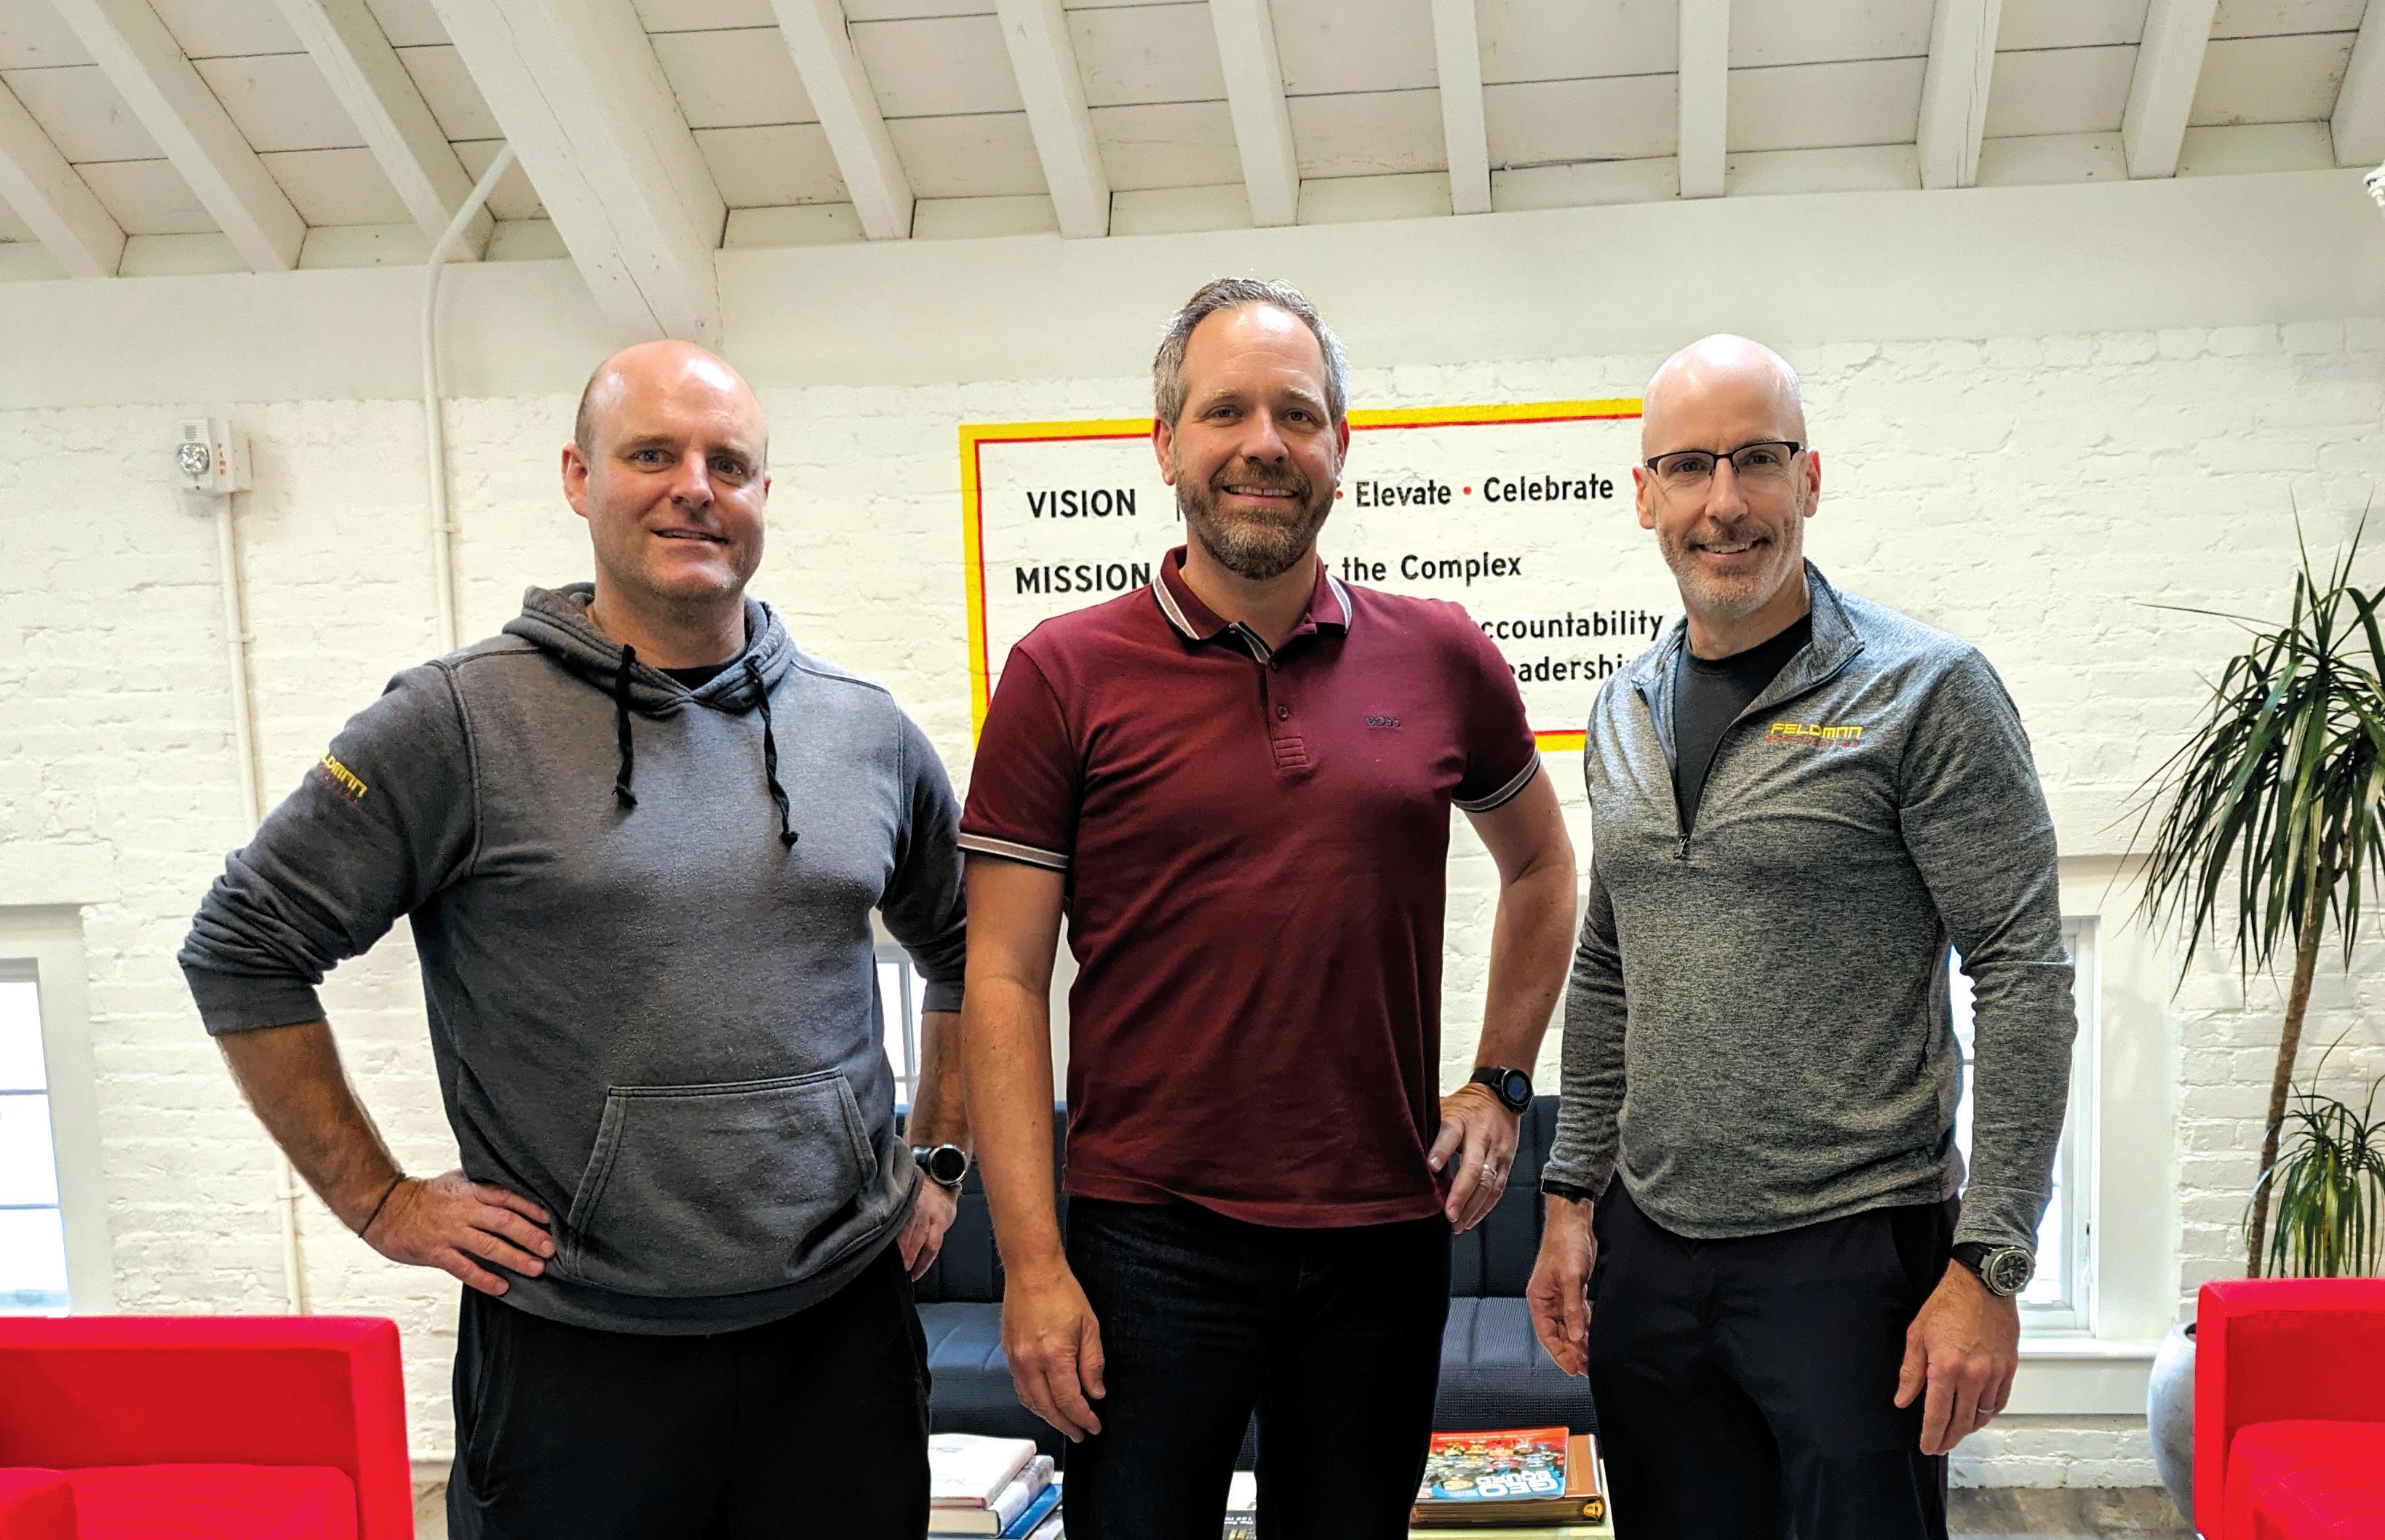
Kai Duebbert, founder and CEO of Kompass, with clients Paul Feldman (right) and Damien Raffle (left).
Geospatial’s CEO. “We evaluated some off the shelf products, but Kompass was a no-brainer.”
Since adopting Kompass in June 2021, Feldman Geospatial has been empowered, through seamless business management in part, to grow to about 100 employees. It wasn’t a big surprise for Foley. He had an inkling that Kompass would greatly help Feldman Geospatial, because he’d worked previously with Niall Murphy, CEO of Murphy Geospatial.
“Kompass was key to growing our company to one of the leading geospatial companies in Europe,” Murphy says on the Kompass website. “The effective way it organizes sales, operations, HR, and finance functions is ideal for small to medium-size companies like ours, saving time and cost, while being a joy to use.”
Like an increasing number of AEC-focused platforms these days, Kompass software was developed based on the work experience of construction pros. The software was originally developed 11 years ago for Murphy Geospatial to solve its needs and was beta-tested and refined before going to market. When it was ready, Kompass was spun off as a startup from the geospatial firm.
Kai Duebbert, founder and CEO of Kompass, said the platform evolved from work experience. It helps solve common problems surveying companies face every day, problems that Kompass leaders know well from their previous work.
“I’m originally a surveyor myself. This system came out of practice…We created it to address major pain points including scheduling crews, scheduling equipment, and timesheets,” Duebbert said. “It has project management, CRM and financial capabilities. We cover all the major processes.”
For Feldman Geospatial, adopting Kompass wasn’t too tough, but it took some time and help from the platform’s experts. Adoption of the platform meant immediate visibility, connectivity, and timeliness of scheduling, among many other benefits to Feldman Geospatial.
“Our field people can see their schedules two months in advance, with all the info they need on the fly,” Foley said. “It’s really helpful to them to access this [function], and also easy to simply verify

their daily timesheet. They know where they will be going to work, what vehicles they’ll need, and more.”
Managers for Feldman Geospatial can access all of the information they need for their jobs through the platform, and hence, be able to allocate all assets needed for a project and better plan future projects. That’s part of the intent of the platform.
“Our system is focused on the functionality [of a task], like equipment management, or even scheduling paid time off for an employee. We try to keep it as simple and intuitive as possible. It lets you do your business management work, and then lets you get back to your billable work,” Duebbert said.
With an easy to use, intuitive dashboard, Kompass allows employees of a company to quickly handle proposals and scope management, projects and tasks, equipment scheduling, staff scheduling and timesheets, employee expenses, and invoices and payments. It eases managing employee vacations and allowances, and includes an employee directory. Outfitted with comment functionality, email notifications, integration with your internal file server and Quickbooks online, and more, Kompass simplifies a company’s business management.
The platform is there with a ready and capable hand for its subscribers, who can get help from Kompass experts whenever they need it. Kompass provides free support for its customers, who can buy the software at a monthly rate. It offers all any
AEC company requires, Foley said.
“The platform provides everything you need for your company. It’s not just for survey companies either,” Foley said.
The Kompass system launch in his company might have been smoother, but it wasn’t due to Kompass but rather, the large amount of corporate data that Feldman Geospatial had to incorporate into the system, Foley said. The savings have been phenomenal.
“It’s saved us a large amount of time…It’s hours per week per employee. With our company at 105 employees now, that’s a savings of thousands of dollars per month.”
Foley said the company’s managers have been extremely happy with the flexibility of the Kompass platform, and like the ability to immediately see where their crews are working.
His one regret in the Kompass adoption is that he didn’t implement the system sooner, because it would’ve been easier to do so if Feldman Geospatial had done it as a smaller company.
“If I were to do it again, I would do it much sooner,” Foley said. “I would definitely move to Kompass when your company is employing 30 people, because the bigger you are, the bigger the lift [in adopting the platform].” ■
xyHt 25 APRIL 2024
Jonathan Barnes is a Pittsburgh-based freelance journalist and tech writer.
Kai Duebbert, founder and CEO of Kompass, with clients Paul Feldman (right) and Damien Raffle (left).
THE ENDURING TECHNOLOGY OF DIGITAL LEVELS Part One
For nearly three decades, the foundational technology and design of precision levels for surveying has not changed much. It has not had to. Sometimes, when something is done right the best course is to stick with it.
BY JODIE HARTNELL
Much has been written about the 50-year milestone of the Global Positioning System, while another 50-year milestone has been largely overlooked. It has been half a century since the technology of precision levels for surveying and geodesy reached what is widely considered to be its peak. And it has been nearly 30 years since automation was added to deliver such precision in a timely and effective manner.
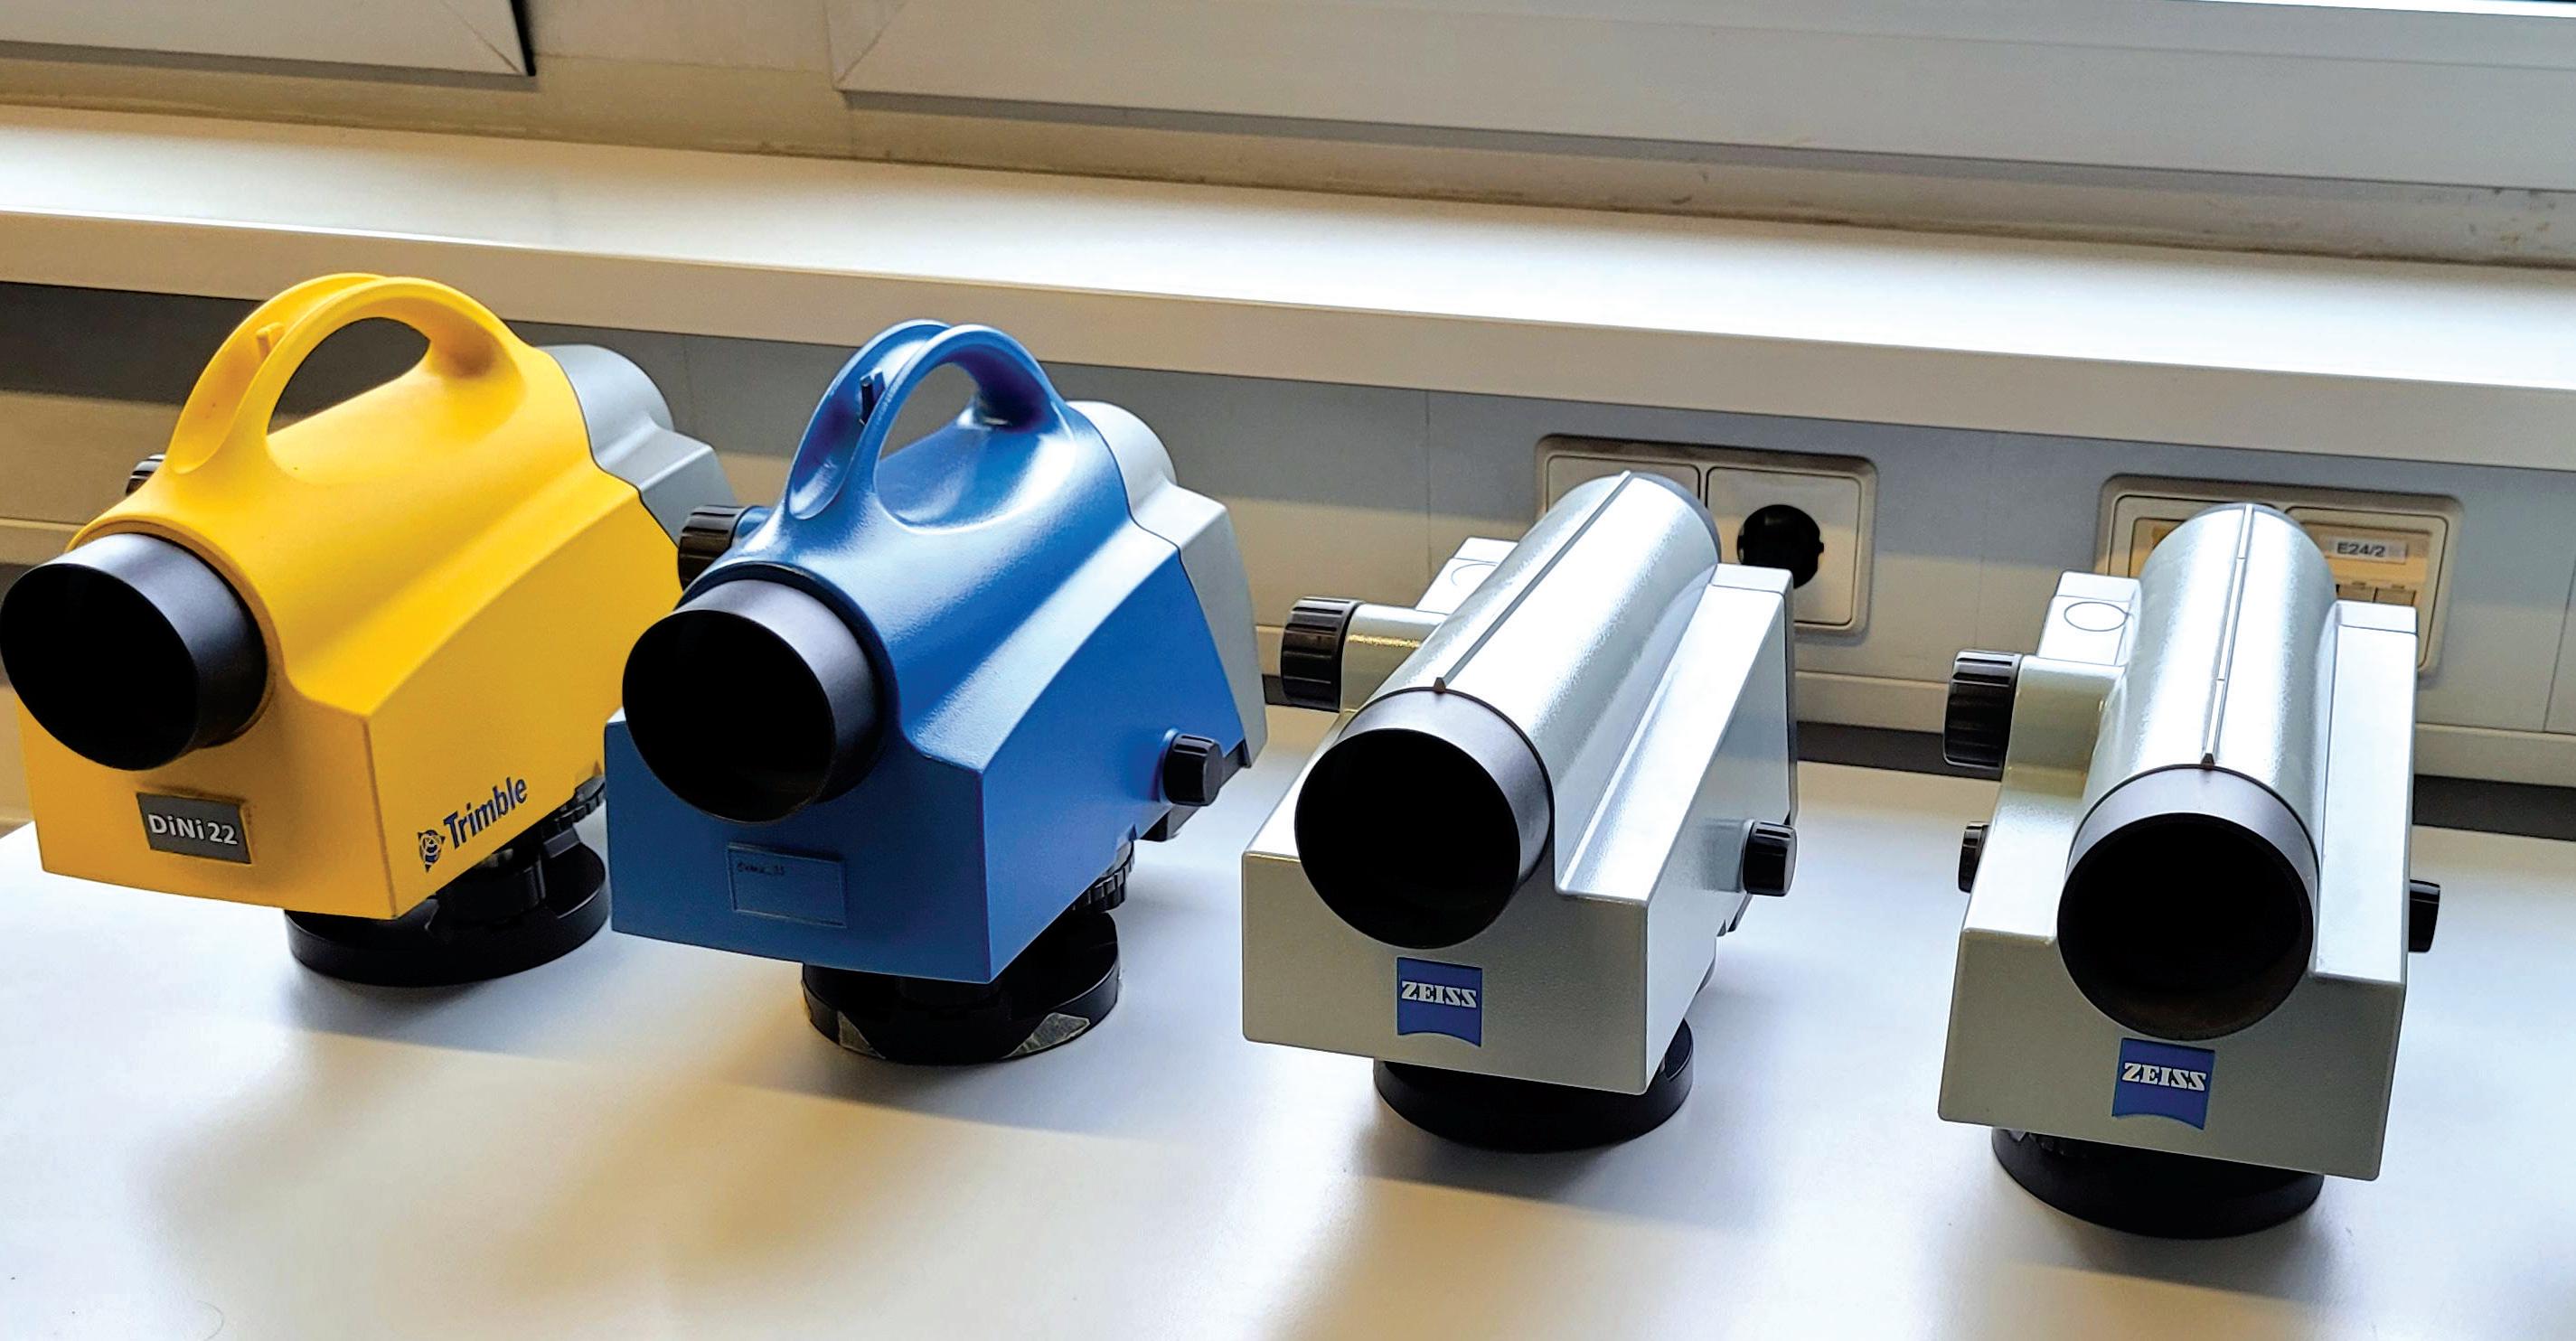
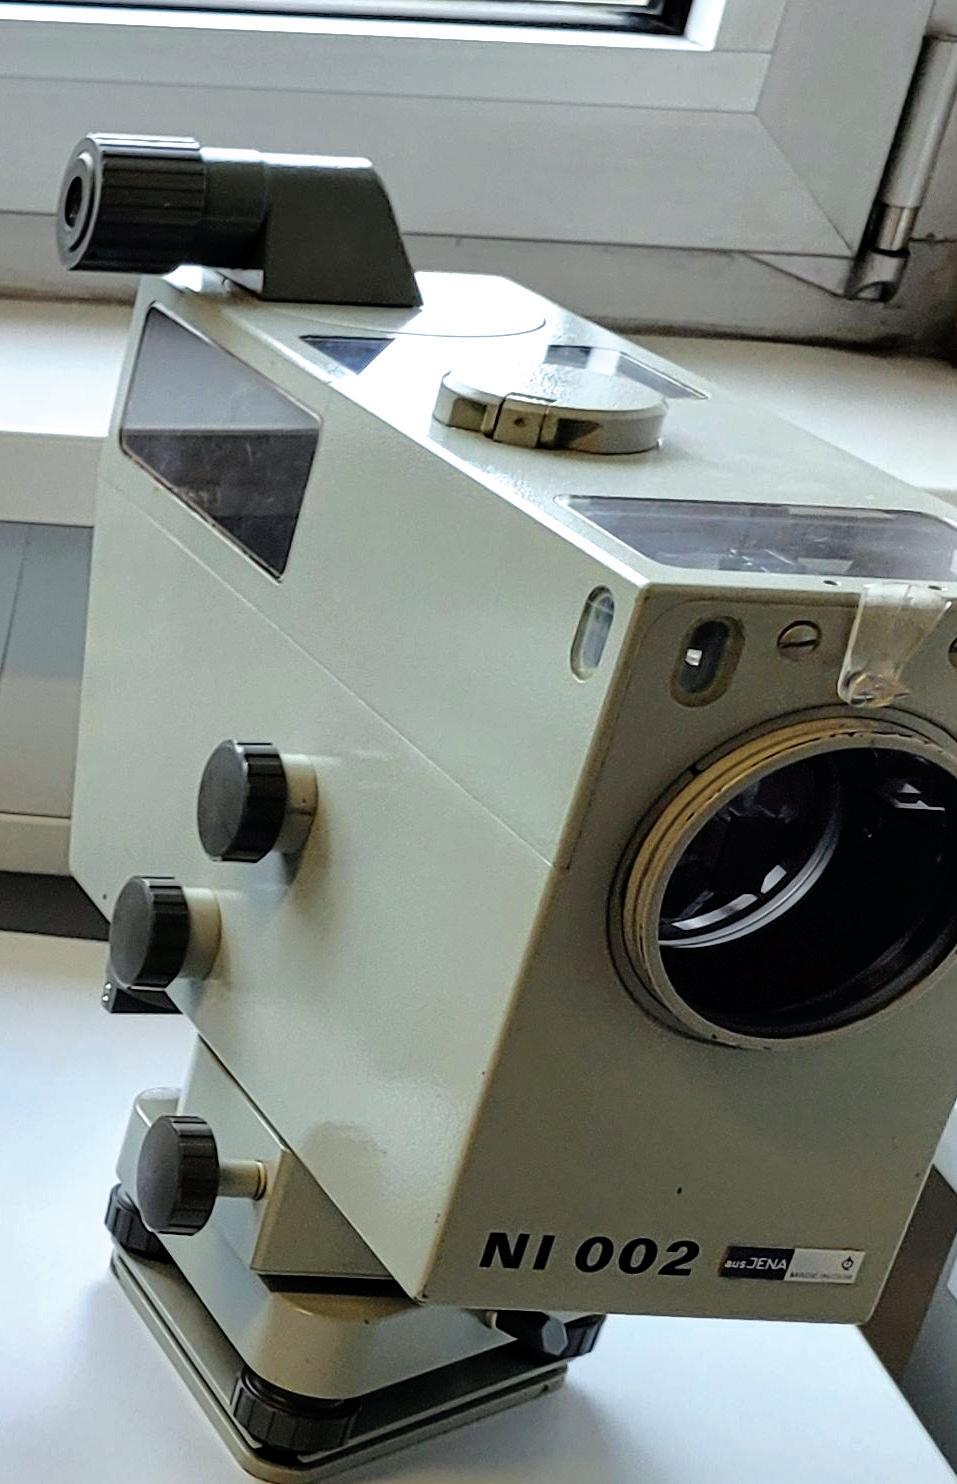
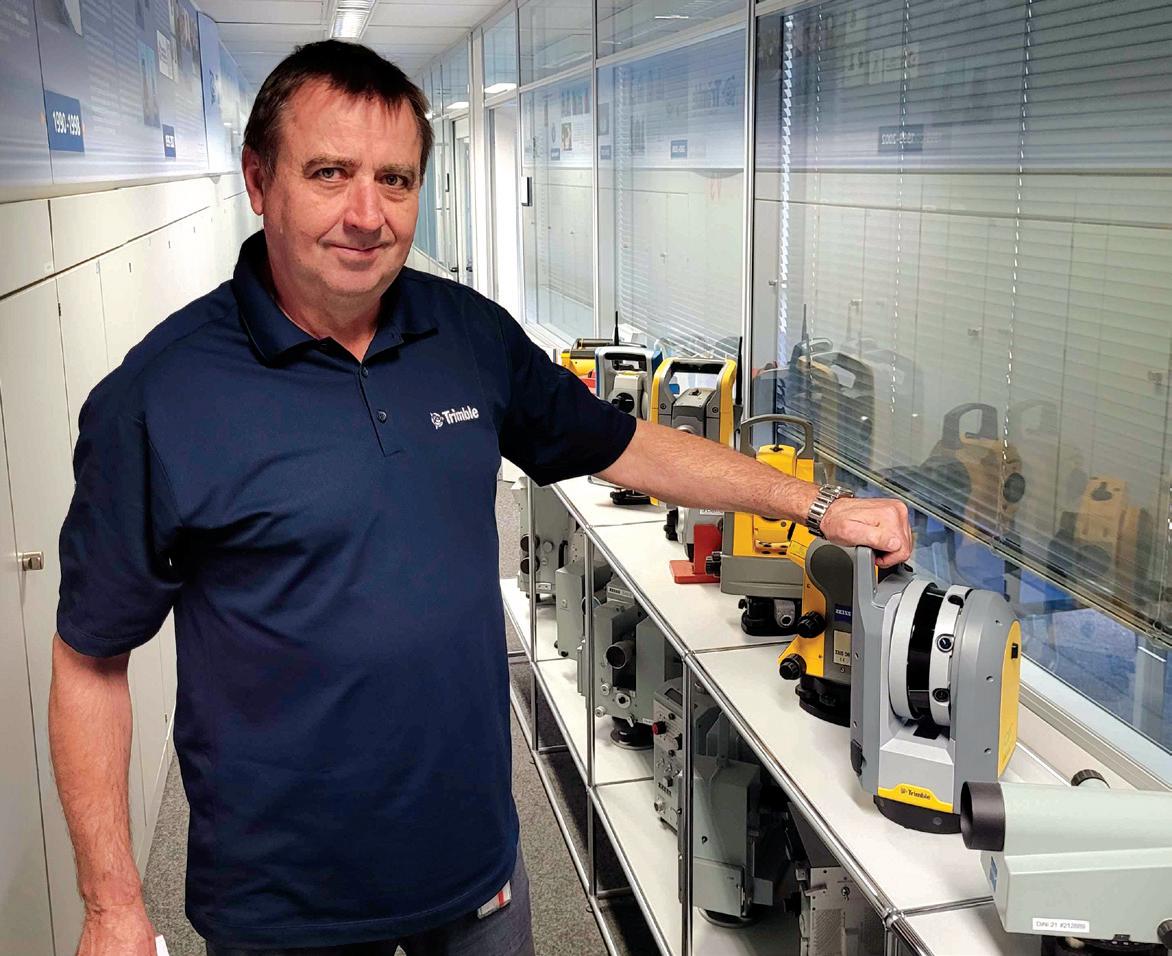
“This is one of the world’s most accurate levels,” said Torsten Kludas, managing director of Trimble Jena GmbH, referring to the Ni-002, released by Zeiss in 1973. “There is nothing like it today, and it is still used as a reference instrument.”
The advent of instruments like the Ni-002, that could achieve ± 0.2 mm/km in double-leveling ignited a flurry of research and development that would culminate two decades later in the form
xyHt 26 APRIL 2024
An evolution of digital levels, with the pioneering analog Zeiss Ni002 (right) and Trimble DiNi (left).
of the ubiquitous digital levels’ surveyors rely on today.
How did such instruments achieve this level of precision? Let’s back up a little and look at the history of precision surveying instruments.
THE MODERN INSTRUMENT ERA
A wide variety of leveling methods have been employed throughout history. Giving
way to the predominance of spirt levels (a sealed glass tube with an air bubble in alcohol). One of the earliest examples was introduced in 1661. For centuries there were many variations and configurations of bubbles and surveying instrument telescopes. In 1832 the “Y” style level was developed by English engineer William Gravatt. Later would come the easier-to-use “dumpy” or builders-style levels, auto, self-leveling, and tilting levels. Yet there were precision thresholds that would only be broken with a combination of advances in optics, machining, and scientific research.
The modern era for levels (and theodolites) came at the beginning of the 20th
century based on work by the key figures of Carl Zeiss (the mechanic), Ernst Abbe (the scientist), Otto Schott (the glass chemist), and Heinrich Wild (the surveyor). From the collaborative environment these pioneers and others fostered at the optical systems manufacturer Zeiss in Jena, Germany, came what many consider the first truly modern surveying instruments.
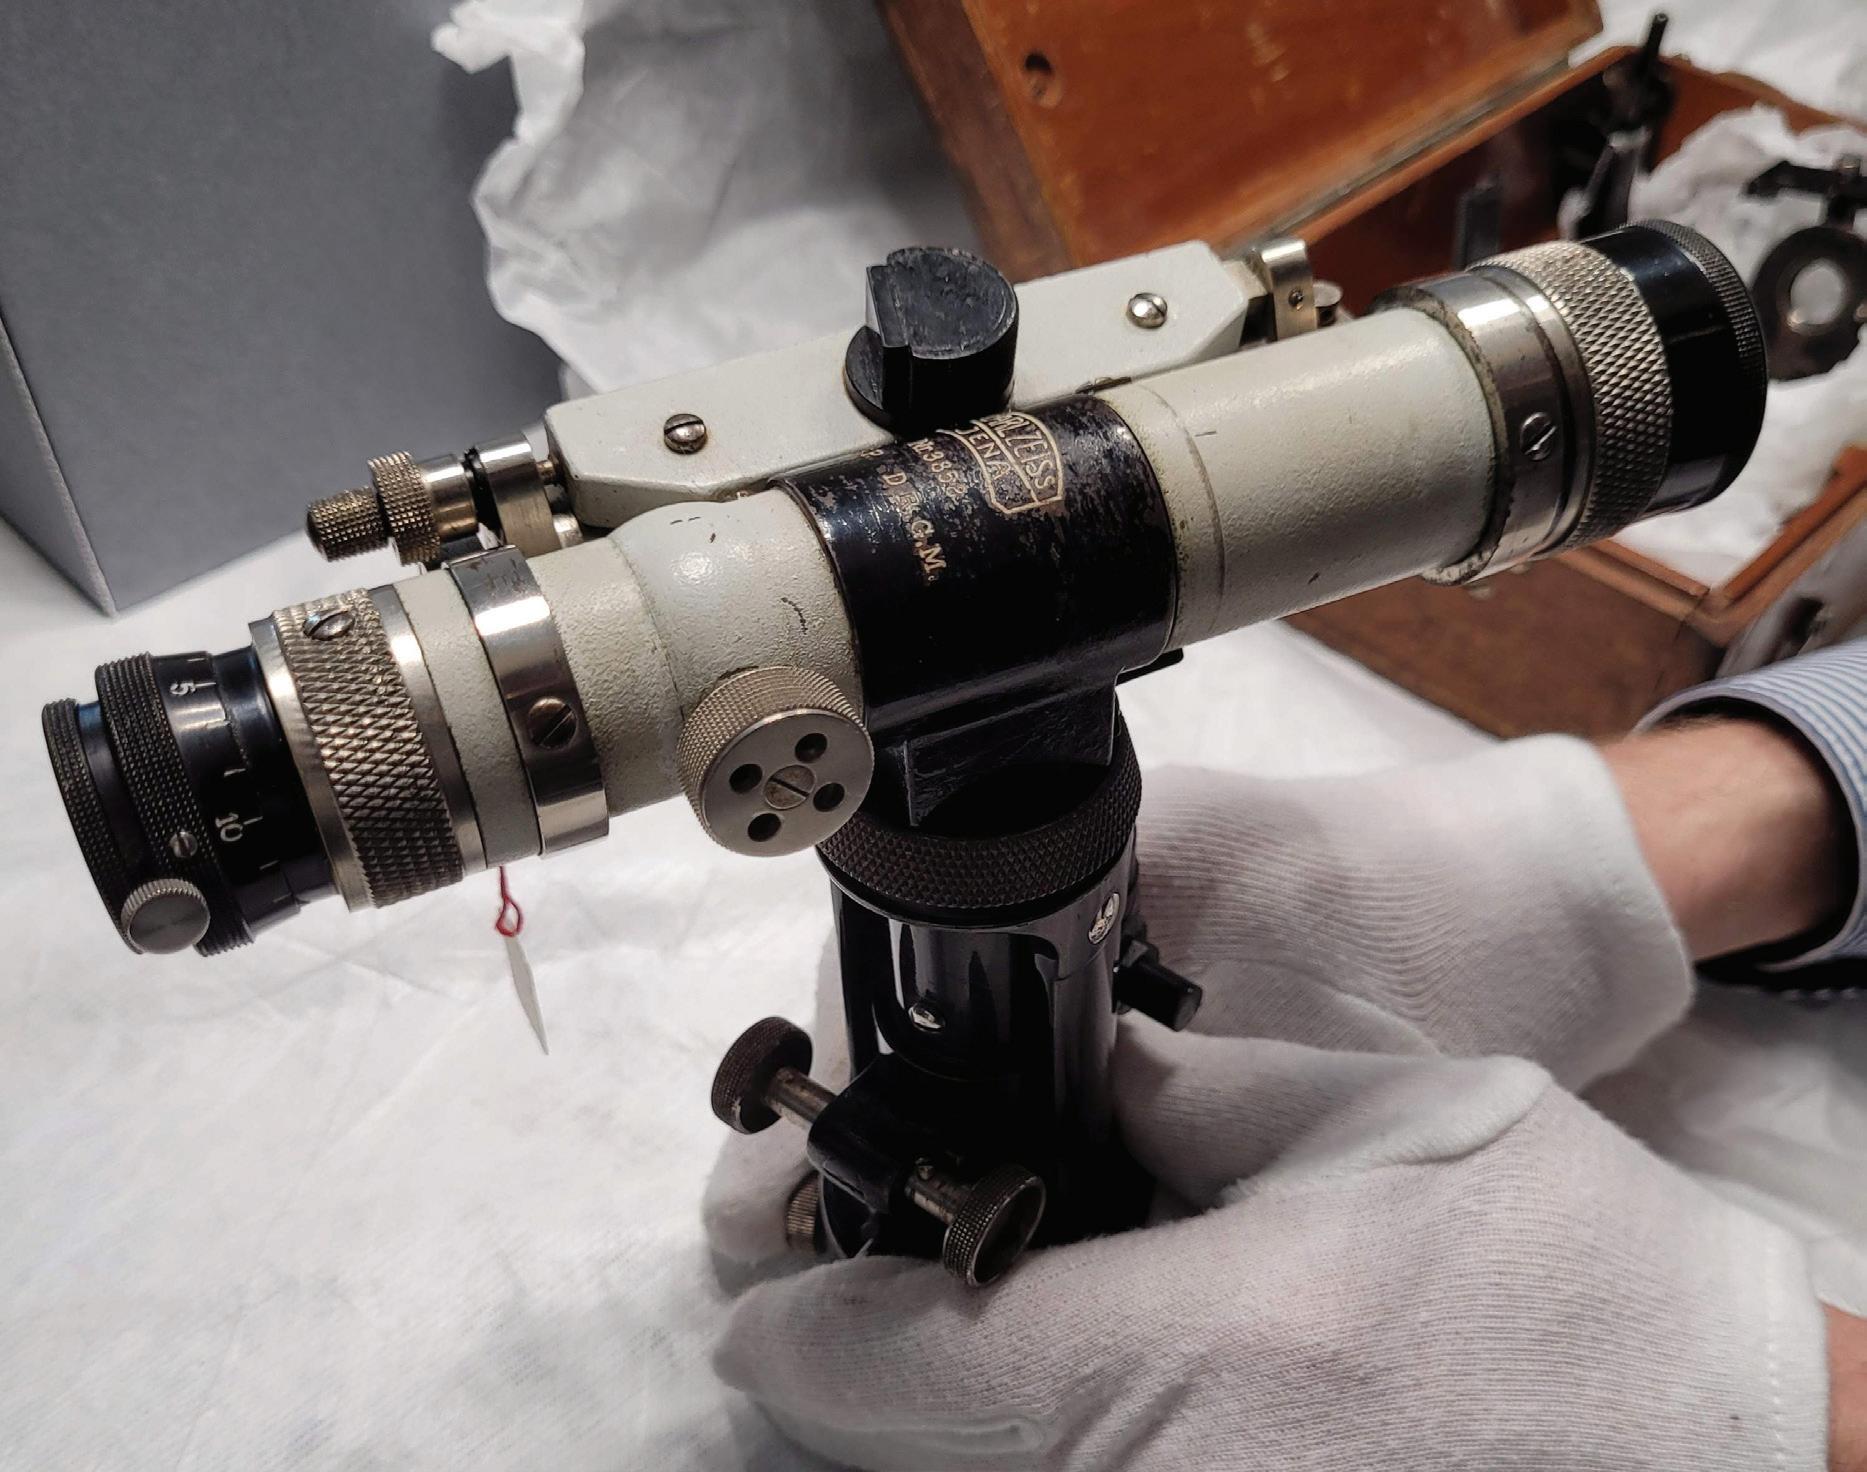
In 1909, Zeiss introduced the Ni 1 level, which was one of the first instruments manufactured in serial production. Between 1920 and 1922, research and development for the Th1 theodolite (based on Heinrich Wild’s design) was complete, officially hitting the market in 1924 as the first optical theodolite from Carl Zeiss.
Such instruments featured advanced and compact optics, such that telescopes did not have to be as long or heavy as in legacy instruments. Other features included glass circles, internal focusing telescopes (which were also reversible and rotatable), prismatic split coincidence bubbles, a cylindrical vertical axis, and more. Among these are foundational elements we still see in today’s total stations. Wild would go on to form his own company in Switzerland, that produced many famed instruments and begat a legacy of successive companies (e.g., Wild Heerbrugg and Leica Geosystems). He even went over to design instruments for a competitor, Kern.
The Zeiss brand grew into a broad family of technology, science, and manufacturing companies and spinoffs. This continues across many industry sectors, including innovations adopted by surveying instrument manufacturers like Trimble, Spectra Geospatial, and others.
The later 20th century brought a steady refining of the technology of levels, by Zeiss and other manufacturers, to include familiar brands such as Leica, Nikon, Topcon, Trimble,
Pentax, and more. The Zeiss Ni-002, Kludas says, featured a unique reversing mirror compensator.
“We have here a two-reading possibility,” said Kludas, noting observation windows in the sides of the Ni-0002 he was demonstrating. “We can make a second face leveling measurement by flipping this mirror.”
This provided what is called a “quasi-absolute horizon,” the mean of the two readings being nearly independent of the distance between instrument and leveling rod. This also meant less of a need to balance foresight and backsight distances. With the optical-mechanical elements evolved to yield such high precisions, the next goal was to digitally automate field operation. What followed was incorporation of photogrammetry into the process, to read specially marked rods, and digital processing.
THE BASICS
Digital levels are comprised of relatively few components; nowhere near as electro-mechanically complex nor as densely packed with components as say, robotic total stations. They seem light by comparison. However, the amazing precision digital levels deliver comes from the application of sophisticated physics built into these highly refined and calibrated components.
The telescope components, the object and focusing lenses serve for operator
xyHt 27 APRIL 2024
Torsten Kludas
sighting, but also to project the image of the coded rod to the CCD. For instance, on some digital levels, the CCD might only need to “see” 30 centimeters of the coded rod. While there is a circular bubble on the level, this is just to get it close enough for refinement by the compensator.
Unlike the compensators in total stations, that might be liquid surface, camera-based, with two axis mirrors and silicon oil, the DiNi for instance employs a pendulum. You can hear the click of the pendulum if you tilt it. The vertical axis needs to be finely machined, to provide a smooth and consistent
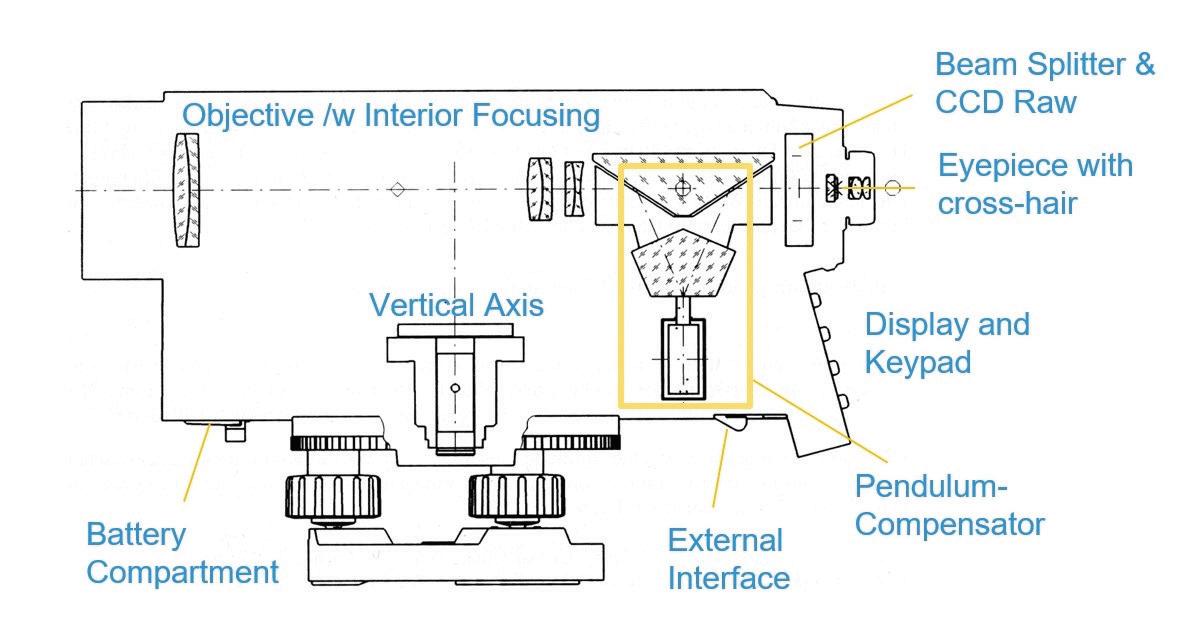
motion. The rest of the housing contains the electronics boards, keyboard, display, data card slot and/or data port, and a battery compartment.
Externally, to ensure the best results, requires a high-quality tripod, and a coded Invar rod. These specialized rods typically have a core of Invar, which is a nickel–iron alloy with a very low coefficient of thermal expansion. The rod has a casing around it with the code printed on one or both sides. While the invar rod and code may remain consistent after many uses, the wear and tear on the rod assembly below the rod can become a factor. For these and many other reasons, the rod and level need to be checked regularly. There are simple office procedures
for doing this, and many precision-leveling crews do this before each leveling campaign. Levels and many Invar rods delivered with calibration certificates (which must be noted for certain types of leveling, for instance to meet various national standards). Levels can be sent back to manufacturers for further calibration and re-certification. However, for rods there are few facilities that can recertify; it can sometimes cost more to ship a rod overseas for recertification than to buy a new one. With careful handling, storage, and transportation, Invar rods can last many years, as can the levels.
As noted, temperature is one of the external factors that affect performance. Others include the ambient illumination, particulate matter in the air, humidity, turbulence, vibration, unstable ground, etc. Guidelines for the most precise classes of leveling prescribe strict procedures and ancillary equipment. For instance, keep the level out of direct hot sun (umbrellas are recommended in some published guidelines), don’t set up or turn on pavement, use portable rod turning point
xyHt 28 APRIL 2024
The Zeiss Ni 1 level, archived at the Deutsches Optisches Museum in Jena, Germany.
Internal components of the DiNi digital level. Source: Trimble Jena GmbH
“turtles.” Per some guidelines, turtles need to be over a certain weight, and you may need to use turning spikes pounded deep into soft ground, etc.
The U.S. Federal Geographic Data Committee Specifications and Procedures to Incorporate Electronic Digital/ Bar-Code Leveling Systems details procedures/equipment requisite of higher order/class leveling and gives the performance specs that digital levels must meet. Fortunately, digital levels on the market can meet such specifications.
Further, submission of levels to various agencies might have additional requirements; note keeping, minimum ties to control of a minimum order/class, temperature readings, etc. For instance, to submit levels for higher orders/classes, use of a thermistor is prescribed (a calibrated temperature sensor; with two external probes for reading high and low reading on the tripod).
Some good deep reading on the subject, examining the sources of systematic error, testing, and calibration is the doctoral thesis of Dr. Helmut Woschitz: “System Calibration of Digital Levels: Calibration Facility, Procedures and Results” (2003), and the related paper from the INGEO2002 Surveying Conference by Woschitz and Brunner.
Despite this seemingly large list of external and internal sources of systematic error, modern digital levels deliver high precision at or near the highest listed specifications (in most conditions) with simple best field practices, regular checks, and care of the equipment. Digital levels are very high precision but almost too sensitive in some cases. Users find that setting up the level on some bridges can be easily affected by the bounce and vibration from traffic and wind. And there are special procedures for shooting over bodies of water.
In Part Two, we will examine the evolution of a popular, modern digital level. ■
Jodie Hartnell is a geographer, chef, freelance writer, and winner of the Chartered Institution of Civil Engineering Surveyors publishing award. Jodie studied geography on both sides of the Atlantic and has settled in beautiful British Columbia.


xyHt 29 APRIL 2024
Instrument Repair


Instrument Repair Equipment Positions

Navigation Electronics, Inc. 124 Toledo Drive Lafayette, LA 70506 (337) 237-1413
Website: www.neigps.com
Georgia Office: (770) 729-8005
Alabama Office: (256) 665-5589
Mississippi Office: (662) 347-1117
Arkansas Office: (870) 273-6333
Florida Office: (850) 228-2070
Seiler Instrument Geospatial Offices in IL, IN, KS, KY, MI, MO, NE, WI 877-330-6303
Email: servicedept@seilerinst.com
Website: www.seilergeo.com
Education
College of the Canyons
Land Surveying
26455 Rockwell Canyon Road
Santa Clarita, CA 91355 (661) 362-5096
Email: Regina.Blasberg@canyons.edu
Website: www.canyons.edu/SURV
Associate of Science Degree Courses offered ONLINE (Video Conferencing)
New Mexico State University
Geomatics Department
1060 Frenger Mall – Room 130 Las Cruces, NM 88003
Phone: (575) 646-6748
Email: kwurm@nmsu.edu or elaksher@nmsu.edu
Website: https://et.nmsu.edu/geomaticssurveying//
Fully online program and +2 option. BS Degree
Troy University
Surveying and Geomatics Sciences Program Geospatial Informatics Department
344 Wallace Hall Troy, AL 36082
Phone: (334) 808-6727
Fax: (334) 670-3796
Email: geospatial@troy.edu
Website: www.troy.edu/geospatial BS Degree, ABET-ASAC accredited www.instagram.com/troygeospatial www.tiktok.com/@troy_geospatial
University of Maine
Surveying Engineering Technology Program
5711 Broadman Hall, Room 119 Orono, ME 04469-5711 (207) 581-2340
Email: um.set@maine.edu


Website: http://www.umaine.edu/set/svt/ Bachelor Degree. abet-taac
Contact Angie Duman to place your listing here! angie.duman@xyht.com
xyHt 30 APRIL 2024 CLASSIFIED ADVERTISING CONTACT ANGIE DUMAN TO PLACE YOUR AD
Available Stay Connected www.xyht.com



 GNSS Receiver in front of a NOAA research vessel in American Samoa.


