
INTERNATIONAL THE GLOBAL MAGAZINE FOR GEOMATICS WWW.GIM-INTERNATIONAL.COM ISSUE 5 2022 • VOLUME 36 SINGAPORE’S JOURNEY TOWARDS A NATIONWIDE DIGITAL TWIN LIDAR DEEP LEARNING FOR ANCIENT MAYA ARCHAEOLOGY CAPTURING THE ARCTIC AND ANTARCTIC Use of GIS Tools for Land Expansion in Colombia Empowering Indigenous Communities with Innovative Mapping Technology SPECIAL EDITION: PRESTIGIOUS PROJECTS


The eSurvey E200 GNSS Receiver helps surveyors to increase data collection productivity in every job they do. Easily carry it in various complex environments and use it in any rover station scenarios, benefitting from its lightweight and compact design.E200 esurvey-gnss.comRECEIVERGNSS SURVEYINGPRODUCTIVEPOWERFUL TechnologyaRTK TechnologyAtlas60 SurveyTilt


P. 31 Capturing the Arctic and Antarctic Capturing and measuring the environment in the Arctic and Antarctic is a particularly challeng-ing job. The area of interest is often covered by a thick blanket of snow and ice, while extreme temperatures can be dangerous for both the surveyor and the equipment, plus strong winds and bright sunshine can further hinder the work. However, it is essential to map these parts of our world as their future is under pressure, not least due to climate change.
P. 14 Lidar Deep Learning for Ancient Maya Archaeology
ADVERTISEMENTS Information
On the front cover of this issue of GIM International: Indigenous youngsters preparing their equipment – consisting of GNSS antennas and mobile data collection apps – to measure the limits of the Gunmaku territory in Colombia. The Dutch Kadaster is supporting the sustainable development of rural communities in Colombia by bringing smart GIS tools closer to remote communities to facili-tate land administration.
P. 23 Mapping Europe’s Highest Peak with a UAV Mount Elbrus, with its peak of 5,642m, is the highest mountain in Europe. This makes it a re-markable attraction for adventurers, hikers and skiers from around the world, which calls for safe and permanent infrastructure.
CONTENTS 3ISSUE 5 2022 | INTERNATIONAL | DIRECTOR STRATEGY & BUSINESS DEVELOPMENT Durk Haarsma FINANCIAL DIRECTOR Meine van der Bijl TECHNICAL EDITOR Huibert-Jan Lekkerkerk CONTRIBUTING EDITORS Dr Rohan Bennett, Frédérique Coumans HEAD OF CONTENT Wim van Wegen COPY-EDITOR Lynn Radford, Englishproof.nl MARKETING ADVISOR Myrthe van der Schuit BUSINESS DEVELOPMENT MANAGER Jurjen Visser CIRCULATION MANAGER Adrian Holland DESIGN ZeeDesign, Witmarsum, www.zeedesign.nl
EDITORIAL CONTRIBUTIONS All material submitted to Geomares and relating to GIM International will be treated as unconditionally assigned for publication under copyright subject to the editor’s unrestricted right to edit and offer editorial comment. Geomares assumes no responsibility for unsolicited material or for the accuracy of information thus received. Geomares assumes, in addition, no obligation to return material if not explicitly requested. Contributions must be sent for the attention of the content
Local indigenous youngsters have mapped the boundaries and sacred sites of their village, Gunmaku in the Sierra Nevada of Santa Marta, northern Colombia, and the indigenous authori-ties are happy with the result. The Dutch Kadaster is supporting the sustainable development of rural communities in Colombia by bringing smart GIS tools closer to remote communities to facilitate land administration. This project in Gunmaku shows how existing technology can em-power indigenous communities to protect their lands.
P. 18 Singapore’s Journey towards a Nationwide Digital Twin When it comes to utilizing the true potential of digital twin technology, Singapore is miles ahead of most other governments. Even those that have already embraced the concept of the digital twin have often not yet fully realized their plans, while many other cities and countries are still only taking their first steps. This article takes a closer look at how things currently stand in Singapore and at the nation state’s transformation journey so far. The building blocks for success include developing a sustainable system, taking a long-term view from the start, and ensuring the availability of sufficient geospatial professionals.
While it is possible to capture ancient Maya sites hidden beneath jungle canopy in remote loca-tions using airborne Lidar, identifying them is still a time-consuming process. Typically, 3D point clouds are converted to 2D topographic relief images that tend to miss smaller archaeological mounds that are critical to understanding human-environment interactions with implications for today’s global challenges. This project directly analysed Lidar data using deep learning to dramatically speed up the processing time and increase the accuracy of archaeological site identification.
P. 8 Use of GIS Tools for Land Expansion in Colombia
manager: wim.van.wegen@geomares.nl. P.O.GeomaresBox112, 8530 AC Lemmer, The Netherlands T: +31 (0) 514-56 18 54 F: +31 (0) 514-56 38 Nowww.gim-international@geomares.nl98gim-international.commaterialmaybereproducedin whole or in part without written permission of Geomares. Copyright © 2022, Geomares, The Netherlands All rights reserved. ISSN 1566-9076
GIM INTERNATIONAL GIM International, the global magazine for geomatics, is published bimonthly by Geomares. The magazine and related e-newsletter provide topical overviews and accurately presents the latest news in geomatics, all around the world. GIM International is orientated towards a professional and managerial readership, those leading decision making, and has a worldwide circulation.
SUBSCRIPTIONS GIM International is available bimonthly on a subscription basis. Geospatial professionals can subscribe at any time unless Geomares receives written notification of cancellation at least 60 days before expiry date. about advertising and deadlines are available in the Media Planner. For more information please contact our marketing advisor: myrthe.van.der.schuit@geomares.nl.
P. 5 Editorial P. 6 Headlines P. 26 Cadastre at Wartime P. 37 Visited for You: Lidar for Drone 2022 P. 40 Creating a 3D Model of the Famous Budapest Chain Bridge
Subscriptionshttps://www.gim-international.com/subscribe/print.viawillbeautomaticallyreneweduponexpiry,
To subscribe to GIM International go to www.gim-international.com/subscribe COVER STORY
The main task of the aerial mission described in this article was to inspect the existing cable car route around the station of Garabashi and to create an accurate map of the area for the potential future extension of the cable car all the way up to the Priut station (4,050m).
INTERNATIONAL SINGAPORE’S JOURNEY TOWARDS A NATIONWIDE DIGITAL TWIN LIDAR DEEP LEARNING FOR ANCIENT MAYA ARCHAEOLOGY CAPTURING THE ARCTIC AND ANTARCTIC Use of GIS Tools for Land Expansion in Colombia Empowering Indigenous Communities with Innovative Mapping Technology


Field-proven accuracy Supreme Unmatchedreliabilityproductivity Phase One o ers a range of aerial solutions to specifically address the challenges of imaging data acquisition for photogrammetric mapping and mesh modelling, helping our customers to increase productivity and reduce costs andLearntime.more geospatial.phaseone.comat AerialSolutionsNextPhaseOneGeneration 01. 02. 01 - PAS 880i 02 - PAS 280i


EDITORIAL 5ISSUE 5 2022 | INTERNATIONAL |
Looking at the term we chose, it is actually very fitting. The projects that we selected are ‘deceitful’ in that they do nothing special, they just do their job where geoinformation is concerned. However, they are also blinding or have a dazzling influence in the context in which they are placed. Take for example Singapore’s Nationwide Digital Twin.
Now, anyone who has ever done any Lidar surveying will know that trees are the single largest issue with that technique. If possible, survey companies will wait until the trees are free of leaf. No such luck here. Detecting small ground changes through the trees is ‘interesting’ in itself; doing it by deep learning even more so: again, prestigious indeed.
Prestigious projects? This issue is about prestigious projects. I was asked to write a column for this issue and, slightly short of both time and good ideas, I had a closer look at the articles. While ransacking my brain for a good column, I decided to just look up the exact meaning of prestigious. Well, that opened a whole can of worms (which, when writing a column, is generally good news…). Looking at the renowned (prestigious?) Merriam-Webster dictionary, I found that prestigious actually has a very interesting origin. The word comes from the Latin praestigiosis, meaning ‘full of tricks’ or ‘deceitful’, according to Merriam-Webster. In the 19th century, the word developed to mean ‘blinding or dazzling influence’ in English which, looking at how a magician works, is actually not too great a leap. So, what then is a prestigious project? When discussing the themes for this year, we introduced the term to give specific projects a podium. These are projects that, as far as technologies are concerned, are fairly run-ofthe-mill, but that the context makes prestigious. So, it may be extremely large (in size or budget), executed in an environment that is very hostile (physically, environmentally or politically), or it may even open up new pathways in a related subject using ‘our’ standard instruments.
Is a digital twin prestigious? Not as a technique, but looking at the geographical scope it is still quite a feat. Of course, Singapore is not the largest country in the world, but it is also not an easy one for a digital twin, with its large percentage of built-up area: prestigious indeed.
ComNav 43 eSurvey 2 Gexcel 36 Gintec 16 FIG 4 FOIF 22 Phase One 4, 34 RIEGL 39 SOUTH 16 Trimble 12 YellowScan 44 Advertisers
Deep Learning for Ancient Maya Archaeology then… Lidar is something that we have been doing for ages, also in archaeology, and deep learning may still be under development but it is hardly new. The combination, however, is not done very often, making it already more special. But then look at the environment: the area is mainly rainforest.
Then on to another article, the use of GIS tools for land expansion in the Sierra Nevada de Santa Marta in Colombia. On the first page, a photograph of people with a GNSS receiver (of which the data will be used in a GIS). Talk about old-school techniques. Then, when you start to read you become aware of the complete lack of information and, more importantly, that the project is not run by a government but by local people. Yes, they are trained by Dutch government employees, but the intention is to make a lasting change locally. Maybe even more relevant is that it is about indigenous people reclaiming the land of their forefathers from more recent settlers. Prestigious? Not in the context of blinding, but hopefully with a dazzling influence for the indigenous people, so yes! Actually, most ‘project’ articles in this magazine probably deserve the title prestigious. After all, if they were not, the author would probably not have written them, and even if they did, hopefully our editorial board would have revoked them before they ever reached your eyes. This magazine just has slightly more dazzling projects than other issues… Huibert-Jan Lekkerkerk, technical editor info@hydrografie.info


A digital twin is only as good as the data that composes it. Without solid data, a digital twin can fall short of the expectations. AVEVA Point Cloud Manager has been developed to manage massive amounts of 3D point cloud data to create an accessible, detailed and secure digital twin. It can process huge, metic ulous datasets with engineering-grade accuracy, ensuring that physical and digital project representations perfectly align. This allows users to make trust worthy, informed decisions, reduce project rework, and improve safety on critical assets.
NavVis and AVEVA Join Forces to Energize the Digital Twin NavVis is partnering up with AVEVA to provide users with the technology to access reliable as-built 3D point cloud data and panoramic images. NavVis is known for its advanced reality capture, digital factory, and digital plant solutions. AVEVA is a global leader in industrial software.
The construction process starts with the measurement of existing structures, then the majority of soil and existing infrastructure is removed, and new soil and infra structure are put in its place to upgrade the entire area. To efficiently receive their client’s IFC-formatted 3D models and to expedite data capture and new construction, NCC utilizes a Trimble SX12 scanning total station and a TSC7 controller running Trimble Access software. Access to models in the field helps NavVis VLX has both SLAM capabilities and can tie into measurement points in GNSS-denied environments.
Work on the Bergen Light Rail Project is not delayed by winter weather. The Trimble SX12 operates in the cold without issues. (Courtesy: NCC)
When Bybanen Utbygging was hired for the complex Bergen Light Rail Project in Norway, it decided to go paperless and provide all building information for Phase 4 via 3D BIM models. Vestland County Municipality and parties in the Urban Growth Agreement for Bergen had asked Bybanen Utbygging to manage the light rail design, construction and operations with an emphasis on environmentally friendly solutions. This fits in with a broader trend of growing concerns about the environment, driving organizations to explore new tactics to make engineering, planning and construction ‘greener’. Not only does Bybanen Utbygging’s innovative approach conserve resources, it also improves the flow of information when sharing updates with construction contractor NCC.
| INTERNATIONAL | ISSUE 5 20226 HEADLINES
Norwegian Light Rail Project Goes Paperless with Digital 3D Models
Airbus’ third instrument for the Sentinel-1 satellite series features a world premiere of a new separation mechanism which will help avoid space debris. The C-band radar for the Copernicus Sentinel-1C satellite is now on its way to ‘meet’ its spacecraft at Thales Alenia Space facilities in Rome, Italy, where it will undergo integration and testing. The satellite is scheduled for launch in the first half of 2023. The C-band radar beam produced by the instrument can determine changes in the Earth’s surface with an accuracy of a few millimetres, supplying imagery for maritime and land monitoring, emergency response, climate change and security. Synthetic Aperture Radar (SAR) has the advantage of operating at wavelengths not impeded by cloud cover or a lack of illumination and can acquire data over a site during the day or night in all weather conditions. Having a primary operational mode over land and another over open ocean allows pre-programmed operation. Typically, a radar image is acquired over a wide swath (250km) with high geometric (typically 5m by 20m) resolution. eyes on Earth.
Airbus Delivers Third Radar for the Copernicus Sentinel-1 Mission


Fugro to Develop Digital Twin of TransmissionDenmark’sNetwork
Intermap Wins Contracts for Colombia’s National Mapping Initiative
New TechnologiesSynchronizesPartnershipUAVforLidar Data Collection and Processing
Paolo Guglielmini Named as New President and CEO of Hexagon announced that Paolo succeed Ola Rollén as president and CEO of Hexagon AB, effective from 31 December 2022. Hexagon is a global leader in digital reality solutions, combining sensors, software and autonGun Nilsson has decided to step down as CEO for Hexagon’s principal shareholder MSAB on 1 October and consequently leave her position as chairman of Hexagon AB at the 2023 Annual General Meeting (AGM). MSAB, in consultation with Hexagon’s nomination committee, intends to propose Ola Rollén as new chairman of the board at the 2023 AGM. Guglielmini, currently Hexagon’s chief operating officer (COO) and president of Hexagon’s Manufacturing Intelligence (MI) division, has served in key roles since joining Hexagon in 2010, from strategy and business development to M&A and general management. Paolo Guglielmini.
GIM-INTERNATIONAL.COM
7ISSUE 5 2022 | INTERNATIONAL |
Denmark’s Energinet has awarded Fugro a 5-year framework agreement to capture aerial Lidar and imagery data of the 3,000 kilometres of lines in the electricity transmission network. The acquired geospatial data will be processed through Fugro’s Roames technology to develop a 3D digital twin of the network to report on critical clearances. As part of the framework, Fugro will partner with Energinet to develop a vegetation growth model to assist future vegetation and asset management programmes. Energinet is the Danish national transmission system operator Fugro is set to employ a lightweight helicopter equipped with scanning technology – including digital cameras and a Lidar system – to collect high accuracy geodata of Energinet’s network. The data will then be processed and analysed using the Fugro Roames technology, which combines innovative 3D mapping techniques with advanced machine learning and cloud computing. Fugro Roames will be used to create a 3D virtual network model of Denmark’s power distribution network.
SPH Engineering and GreenValley International are combining their expertise to deliver drone software technologies for Lidar data collection and processing. The companies align UgCS mission planning software and Lidar360 data processing software to optimize the workflow with Lidar data collected with a UAV. The partnership is ready to provide a full end-to-end software toolchain for airborne Lidar applications. It includes flight planning and data collection (done using UgCS) and data processing (using Lidar360), which are necessary for deliv ering meaningful results such as elevation models, terrain mapping and modelling, forestry scanning, and power line inspection. Example of a NEXTMap digital terrain model. Lidar imagery processed with GreenValley International’s Lidar360 software solution.
Intermap Technologies has been awarded two more contracts with the Instituto Geográfico Agustín Codazzi (IGAC) to provide digital terrain models (DTMs) to support the government’sColombianmanagement of natural resources. Total contracts awarded under the Task Orders, which will be completed within the next 30 days, exceed US$660,000. Intermap Technologies is a global leader in geospatial content development and intelligence solutions. Working in partnership with Grupo GeoSpatial S.A.S., Intermap is supporting Colombia’s national mapping programme and has now been awarded the second and third contracts for high-resolution NEXTMap digital terrain models. The project area covers 38 high-priority municipalities as well as the area of the Paramillo and Puinawai national natural parks. The second phase contract award is 2.7 times larger than the Phase 1 contract. The third phase contract was awarded at the same time owing to Intermap’s ability to provide exquisite data with speed.


EMPOWERING INDIGENOUS COMMUNITIES WITH INNOVATIVE MAPPING TECHNOLOGY
Local indigenous youngsters have mapped the boundaries and sacred sites of their village, Gunmaku in the Sierra Nevada of Santa Marta, northern Colombia, and the indigenous authorities are happy with the result.
| INTERNATIONAL | ISSUE 5 20228
The Dutch Kadaster is supporting the sustainable development of rural communities in Colombia by bringing smart GIS tools closer to remote communities to facilitate land administration. This project in Gunmaku shows how existing technology can empower indigenous communities to protect their lands. hiked through rough terrain to map the area that belongs to their community.
Up until March 2022, as with many other parcels that the indigenous community is purchasing to recover its ancestral land, the limits of Gunmaku had never been well defined and property documents were not available. Therefore, indigenous youngsters received training in the use of GNSS antennas and mobile data collection apps. They then
Figure 1: Indigenous youngsters preparing the equipment to measure the limits of the Gunmaku territory.
Use of GIS Tools for Land Expansion in Colombia
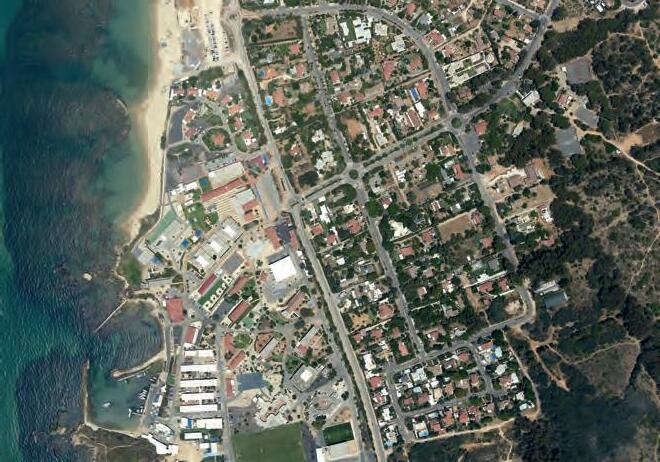
EXPANSION OF THE INDIGENOUS RESERVE “We want to expand the existing Indigenous Reserve by 307,000 hectares to be able to protect the forests and rivers of the Sierra,” said Danilo Villafañe, leader of the Indigenous Arhuaco Community in Magdalena, in a meeting with the Colombian Ministry of Agriculture and other land institutions in February 2022. The Sierra Nevada of Santa Marta in northern Colombia was originally the territory of four ethnic indigenous groups, but nowadays it is populated with many settler farmers who arrived from other departments and who are producing coffee, bananas and palm oil. Therefore, the indigenous communities prefer not to use the word ‘expanding’; instead, they talk about ‘recovering’ or ‘reclaiming’ territory, since they consider it all ancestral land. This ancestral territory goes all the way up to the Linea Negra, an imaginary black line that consists of several indigenous sacred places (see Figure 2), but where cities have arisen since the colonists arrived several centuries ago. Currently, the official indigenous territory in the Sierra Nevada is registered as an Indigenous Reserve and is, at approximately 640,000 hectares, much smaller than the original ancestral territory. The indigenous community wants to recover part of its territory to conserve the natural resources in the Sierra Nevada. They consider themselves the ‘guardians of the Sierra’ and want to protect the nature there. Therefore, the community has requested government

The lack of spatial information limits the extent of the indigenous community’s objectives, since it is unknown what land is already regarded as their property and which parcels still need to be purchased by the community. To support these processes, the Dutch Kadaster (the cadastre, land registry
Gunmaku is an indigenous village in the Sierra Nevada of Santa Marta that is part of the Arhuaco ethnicity. The Arhuaco community has a strong cultural identity linked to the natural environment. Gunmaku is not part of the official Indigenous Reserve; instead, it is one of the parcels that the Colombian Government donated to the indigenous community in 2011 for the establishment of a so-called Pueblo Talanquero to create a safety corridor around the whole Sierra Nevada. The Gunmaku settlement has a mixed school attended not only by Arhuaco children, but also by children of Kogi and colonist farmers. It is one of the areas that is projected to be part of the official Reserve. However, the limits of Gunmaku have never been well defined and property documents are non-existent. Only the elders, the indigenous authorities, understand the extent and history of their territory. According to the authorities, their vision on the territory needs to be passed on to the youngest generation. Therefore, the support for an extension of the Indigenous Reserve, something that needs to be done through the buyout of the settler farmers in the region. The indigenous community aspires to repurchase all the parcels within the proposed 307,000 hectares to annex this land to their Reserve. The farms that are purchased have often never been registered, and transactions between the farmers and the indigenous community are also informal. The community receives support from national and international organizations to be able to buy these farms, but only limited information is stored at the time of purchase. As a result, there is no database of the indigenous community’s land properties. The expanses of land are immense and hiring land surveyors is too expensive for the community. Since there are no maps of the indigenous parcels, the areas and locations are mostly unknown.
BY NICOLAS PORRAS, MATHILDE MOLENDIJK AND LAURA BECERRA
GUNMAKU COMMUNITY
FEATURE 9INTERNATIONAL | and mapping agency of the Netherlands) is supporting the Arhuaco community through capacity building for parcel data collection using the fit-for-purpose land administration approach. Communities receive training to measure land boundaries and other relevant information in an efficient and transparent way, using smart and userfriendly GIS technologies. Consequently, young representatives of several indigenous communities came together for a training exercise in one of their villages, Gunmaku, to learn how to measure their territory.
LACK OF SPATIAL INFORMATION
Figure 2: The Gunmaku community is located several kilometres west of the official boundaries of the Indigenous Reserve, but within the Indigenous Black Line.


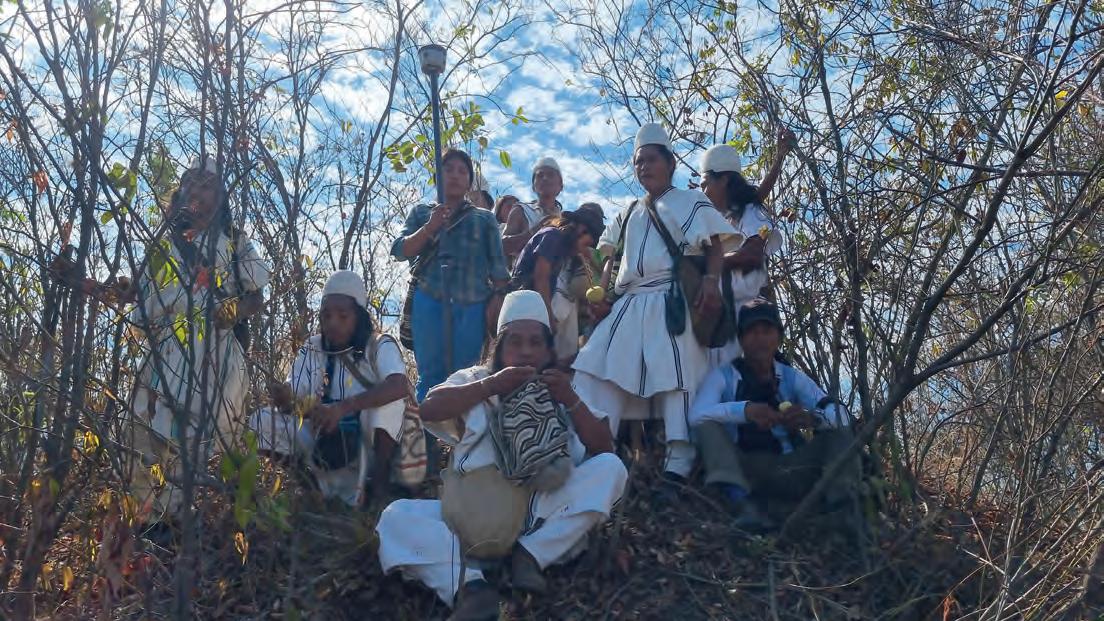
The training was not without its challenges; some of the youngsters even had to walk over eight hours to reach the training location in Gunmaku. But during the training, the youngsters were very motivated and one of the participants – Felipe – was particularly enthusiastic. Fascinated by maps but without the technical tools to map land, he showed the rest a quite accurate hand-drawn map of the area where he lives, indicating which parcels were occupied by the indigenous community and which parcels were occupied by settler farmers. After a day of training, the community decided to measure the boundaries of the Gunmaku parcel. A large group of more than 40 representatives of the whole indigenous community was formed for the fieldwork. The elders led the group, since only they knew the precise location of the parcel boundaries, while the newly trained youngsters operated the measuring equipment. Besides the trained youngsters, many children from the local school in Gunmaku also joined in. Because this was an educational activity, the teachers Figure 4: Felipe from the indigenous community shows his hand-drawn map of the area. Figure 5: The group was led and supervised by the indigenous authorities. gave the pupils a day off to accompany the fieldwork team.
The Field Maps app has been optimized by Kadaster and its partners to be able to store all relevant data in a simple and straightforward way, which made it easy for the community to learn how to use it. Likewise, Trimble’s GNSS antennas are user-friendly and measure according to the strict local standards, with the RTX correction services.
The 35 youngsters who were chosen by the indigenous authorities to participate in the training learned to measure parcels using the high-precision GNSS devices of Trimble and the Esri Field Maps app for data collection. It was a short and practical course that focused on issues including how to understand maps, how a GNSS device works, how to collect field data, and how satellite images can be used.
| INTERNATIONAL | ISSUE 5 202210 maps of the village are not only for official registry purposes, but also to maintain traditional knowledge within the community.
ROUGH TERRAIN
The trek to perform the measurements started by heading uphill, providing a beautiful overview of the indigenous territory, THE PROJECT SHOWS THE IMPORTANCE OF EMPOWERING COMMUNITIES
INDIGENOUS GRASSROOTS SURVEYORS
THEMSELVES TO MAP THEIR LANDS IN ORDER TO PROTECT THEIR NATURAL AND CULTURAL HERITAGE

including blue sky, the Tucurinca river and a forest that had withstood the drought period but was slowly turning back to green. But the roughness of the terrain was also directly visible. Five community members strode ahead of the fieldwork group, using their machetes to make the trocha (a small trail to give access to the terrain’s limits). Gunmaku is surrounded by densely forested mountains, so walking along the boundary is difficult and sometimes impossible. The limits are not marked with poles or fences, but instead the cut trails serve as an indication of the boundaries. The history of every boundary point of the territory was explained to the youngsters in their own language (Arhuaco), often taking up to 20 minutes per point (translation time not included). The consultants from Kadaster left the group after the first mountain, but the indigenous youngsters continued since they are more used to walking long distances in temperatures of over 30ºC. The mapping of the complete boundaries took the group two days of exhausting but satisfying fieldwork.
On the evening after the surveying activities, the participants presented and explained the map to the rest of the community. This was the first time that the indigenous authorities could see a map of the limits of Gunmaku; they were delighted with the results and immediately requested a printed version. Now that the limits of Gunmaku had been identified, it was also possible to locate sacred sites with which the community had a spiritual connection within the parcel. These sacred locations were searched for and named by the indigenous community and directly put on the digital map. The meaning of each sacred point was also added to make sure that the information will be preserved and understood by the youngest generation. The map also facilitated the identification of neighbouring farms, some of which are the property of indigenous families while others are owned by settler farmers. These farms will at some point also need to be mapped, as will the other thousands of parcels that the community aspires to buy.
Now it is up to the indigenous community to continue deploying these surveying Figure 7: The fieldwork resulted in a map of the Gunmaku parcel boundaries and sacred sites. of Gunmaku visible in the background.
FEATURE 11ISSUE 5 2022 | INTERNATIONAL |
SPIRITUAL LAND
CONCLUSIONS The work in Gunmaku shows the importance of empowering communities themselves to map their lands in order to protect their natural and cultural heritage. It can sometimes be challenging to provide access to existing smart GIS tools for groups that have a great need for them, but this project is an example of how the use of GIS technology has enabled young indigenous people from the isolated Arhuaco community in northern Colombia to map their surroundings for the first time, based on input from the indigenous elders about the boundaries of their territory. This will allow them to strengthen their negotiating position with the government in talks to recover their land and to make their area an official reserve.


Across 3. Professional Land Surveyor 4. Optical survey instrument 5. Vertical angle 7. Survey glass 8. Detailed record of real estate and property 10. Survey mark 11. Satellite-based survey equipment 14. Elevation reference point 15. Survey pole 16. Horizontal angles Down 1. Network adjustment method 2. Wooden survey stake 3. Boundary reference point 4. Survey legs 6. Small wooden survey reference point 9. Survey with elevations 12. Locate known coordinates 13. Trimble Office Software The Most Trusted Brand in Surveying Surveying Basics Crossword Puzzle © 2022, Trimble Inc. All rights reserved. GEO-212 (04/22) 1 2 4 8 13 11 12 16 15 9 10 14 3 5 6 7
ACKNOWLEDGEMENTS
FURTHER READING https://arcg.is/99meK0gunmaku-colombiahttps://www.kadaster.com/about-us/
FEATURE 13ISSUE 5 2022 | INTERNATIONAL |
Nicolas Porras has an MSc in Geo Information from Wageningen University and is a consultant for Kadaster’s projects in Colombia, with a focus on fit-for-purpose land administration and geographic information systems.
Mathilde Molendijk is a manager at Kadaster International, the Netherlands, with a focus on land administration in the region of Latin America and the Caribbean. Previously she worked as a programme manager – responsible for the coordination of international MSc programmes –Laura Becerra is a cadastral engineer from the Universidad Distrital in Bogotá and is a consultant for Kadaster’s land administration projects in Colombia. Her fields of interest cover cadastre, remote sensing and geographic information systems. methodologies in the rest of the area. There are still more than 300,000 hectares to measure, which can only be achieved by involving members of the community themselves. Obviously, the neighbouring farmers also need to be included in the activities, since the expansion of the Indigenous Reserve will have an impact on their current land occupation. They need to be willing to sell their parcels to the community.
The indigenous youngsters from various villages were enthusiastic and established a text group to enable them to maintain continuous contact in order to coordinate all their efforts. They are now eager to support the municipality’s cadastral updating process that will start in a few months. In the meantime, the indigenous authorities and the Colombian government will have to agree on the implementation of the methodology and make various decisions, such as whether to buy new GNSS equipment and how to plan the work in such a wide area. The Dutch Kadaster will continue to support the current processes by searching for more accessible equipment and helping the indigenous organization to establish a database for the land parcels.
ABOUT THE AUTHORS
This work is part of the LANDat-scale programme in Colombia, financed by The Netherlands Enterprise Agency (RVO) and executed by Kadaster in cooperation with ICCO Cooperation and Tropenbos Colombia. Within this programme, Kadaster works with several Colombian land institutions such as the National Land Agency (ANT), Geographic Institute Agustín Codazzi (IGAC) and the Superintendency of Notaries and Registration (SNR).


First, there is a deluge of Lidar data that requires significant and costly manual labour to interpret. Second, automated and manual data processing techniques still miss nearly 50% of small archaeological mounds due to topography and variations in vegetation height and density.
AUTOMATING THE
PREVIOUS RESEARCH To address the first challenge, a few archaeologists started to employ deep learning, a sub-field of machine learning, which has demonstrated state-of-the-art performance on automated object recognition tasks. While successful, this previous research was limited to the application of deep learning to 2D data, excluding available 3D data, and did not focus on smaller archaeological features. This project is unique because it addresses this gap using deep learning-based processes that can classify archaeological sites directly from Lidar 3D point cloud datasets and improve the While it is possible to capture ancient Maya sites hidden beneath jungle canopy in remote locations using airborne Lidar, identifying them is still a time-consuming process. Typically, 3D point clouds are converted to 2D topographic relief images that tend to miss smaller archaeological mounds that are critical to understanding human-environment interactions with implications for today’s global challenges. This project directly analysed Lidar data using deep learning to dramatically speed up the processing time and increase the accuracy of archaeological site identification. accuracy of identifying small archaeological features beneath deep canopy in diverse environmental conditions. CASE STUDY Lidar data from the UNESCO World Heritage Site of Copan (Figure 1 and 2) Honduras, was used as the primary dataset to develop new deep learning models and subsequently compare the classification accuracy of deep learning models using 2D and 3D data. From
In the past decade, airborne Lidar has captured thousands of previously undocumented ancient Maya archaeological features, confirming the vast scale of classic (250–800CE) Maya cities. However, archaeologists face two major challenges.
Figure 2: Aerial view of Copán’s civic-ceremonial Core (Courtesy: Richard Wood, Heather Richards-Rissetto, Christine Wittich, UNL)
Figure 1: Archaeological Site of Copán, Honduras.
| INTERNATIONAL | ISSUE 5 202214
Lidar Deep Learning for Ancient ArchaeologyMaya IDENTIFICATION OF HIDDEN ARCHAEOLOGICAL SITES USING 3D POINT CLOUDS


DEEP LEARNING: OBJECT CLASSIFICATION AND SEMANTIC SEGMENTATION
METHOD The PointConv (Wu, Qi and Fuxin, 2019) deep learning architecture was employed to identify ancient Maya archaeological sites from Copan’s Lidar data. The method was tested against CNN processes relying on 2D data, using Inception-v3, to determine the most effective approach. In addition, data augmentation strategies for working with small 3D datasets were evaluated. The results of these experiments demonstrate that the PointConv architecture provides greater classification accuracy in identifying Maya archaeological sites than the CNN-based approach. This result demonstrates a path for researchers to make use of 3D point cloud data directly in deep learning models while improving accuracy and reducing data preparation time.
In the late 1970s and early 1980s, the Copan Archaeological Project carried out a simple mapping survey using a plane table and alidade, over 25km2 around Copan’s main civic-ceremonial centre. The analogue maps were georeferenced and digitized to establish a Copan Geographic Information System (GIS). In 2013, the MayaArch3D Project captured Lidar data for the same spatial extent using a Leica ALS50 Phase II system mounted on a Piper Aztec aircraft. The target point density was ≥ 15 pulses/m2 and all areas were surveyed with an opposing flight line sidelap overlap of ≥ 50%. The average first-return density was 21.57 points/ m2 and the ground return density averaged 2.91 points/m2. Following acquisition, the Lidar data went through several (timeconsuming) stages of post-processing that incorporated ‘standard’ bare-earth algorithms and semi-automatic and manual methods to classify 3D points into four classes: (1) Vegetation (green), (2) Ground (yellow), (3) Figure 3: Example of 3D cloud points from airborne Lidar of Copán, Honduras.
DATASET PRE-PROCESSING For the 3D model training, raw laser (LAS) formatted files were used from shapefiles annotated by the archaeologists. Then, 10,024 points for each input data file were uniformly sampled and the normal vectors were computed from the point clouds. The primary parameters for the point cloud data
– was the cultural and commercial centre of a powerful ancient Maya kingdom. The city has awed explorers, archaeologists and visitors since the 1500s and is the most thoroughly excavated Maya site. In 427CE, Yax Kuk Mo became Copan’s first dynastic ruler, founding a dynasty that encompassed 16 rulers and spanned almost 400 years until succumbing to environmental and sociopolitical pressures that befell the kingdoms of the Maya Southern Lowlands. Copan’s location in a narrow valley with altitudes ranging from 569–1,408m along the Copan River results in varied topography, diverse vegetation and varied land-use practices, and is therefore representative of the challenges faced across the Maya region in identifying archaeological sites from Lidar.
For decades, computer vision specialists have studied the problem of automating object classification and semantic segmentation. Convolutional neural networks (CNNs) have proven most successful; however, they require large amounts of labelled training data, often in the range of millions of images that are pre-labelled and/or segmented by hand. This poses a difficulty when working with small datasets, typical of remote sensing and, in particular, archaeology. Previous research suggests that the application of transfer learning – a machine learning method that improves performance using knowledge learned from a previous task – for small datasets improves model accuracy. In terms of 3D shape classification, point-based methods have demonstrated some of the highest accuracy; thus, this research used a point-based transfer learning architecture to identify ancient Maya archaeological sites.
PROJECT DATA: ARCHAEOLOGICAL AND LIDAR
Figure 4: Graph illustrating the accuracy of deep learning with augmentation methods.
Dr Heather Richards-Rissetto is an associate professor of anthropology in the School of Global Integrative Studies (SGIS) and a Faculty Fellow in the Center for Digital Research in the Humanities (CDRH) at the University of Nebraska-Lincoln specializing in geospatial 3D applications for cultural heritage.
15ISSUE 5 2022 | INTERNATIONAL | BY HEATHER RICHARDS-RISSETTO, DAVID NEWTON AND AZIZA AL ZADJALI FEATURE
ABOUT THE AUTHORS
David Newton is an assistant professor at the University of Nebraska-Lincoln where he leads the Computational Architecture Research Lab (CARL). CARL is dedicated to the research and development of next-generation computational design technologies that will make for a more environmentally and socially sustainable built environment. Professor Newton holds degrees in both architecture and computer science.
Dr Aziza Al Zadjali is a data scientist at Oman telecommunication company working on the design and implementation of marketing machine learning use cases. Archaeological Features (red), and (4) Ruin Grounds (purple) (see von Schwerin et al., 2016) (Figure 3).


The 3D and 2D deep learning models were evaluated based on the accuracy of the test datasets, which were not used for training. Additionally, the models were evaluated based on augmentation methods. Figure 4 shows the classification accuracy of the augmentation methods. The 3D model achieved 88% accuracy on the testing data without augmentation, 91.7% using a Gaussian noise-based approach, 92.4% using random rotations, and 95% accuracy with combined augmentation. In comparison, the 2D model was only able to achieve an accuracy of 87.8% using this same combined augmentation strategy. In part, the success of the 3D deep learning results from the inclusion of Z elevations, unlike the 2D hillshade images.
CONCLUSION AND FUTURE WORK
While airborne Lidar is transforming archaeology, identifying archaeological sites is still extremely time-consuming and expensive because standard filtering algorithms tend to fall short. In the Maya region, this task is particularly challenging because sites are hidden below jungle canopy and appear as mounds that are difficult to distinguish from natural topography. To date, only a few deep learning projects have been applied to archaeology, and these have employed 2D approaches. In contrast, this project illustrates that raw 3D point cloud data can not only be used in deep learning approaches but provides higher accuracy in identifying ancient Maya sites of all shapes and sizes. Future work will refine the employed methods and incorporate a larger dataset of ancient Maya sites from Belize to continue to disentangle the impacts of variable topography and vegetation not only for deep learning approaches but also for understanding what we can learn from ancient environmental engineering.
17ISSUE 5 2022 | INTERNATIONAL | FEATURE include XYZ coordinates and normal vectors using CloudCompare. For the 2D comparison, hillshade images were labelled and divided into two sets of sub-images: (1) positive class: archaeological structures and (2) negative class: areas without archaeological structures. Both subsets included background comprising 3D points representing diverse topography and vegetation type and density.
Large amounts of data are needed to train deep learning models, but the Copan dataset was not large enough; therefore, two data augmentation methods artificially generated new data from the existing data to create a larger and more variable dataset: (1) random rotation and (2) jittering via Gaussian noise. The same data augmentation strategies were employed for the 3D and 2D models. The 3D training dataset comprised 142 positive samples (containing archaeological sites) and 142 negative samples (only natural features). The 2D training dataset comprised 410 positive samples and 430 negative samples with a variety of hills, mountains and flat areas (vegetation was removed because it obscures sites). Through data augmentation, the dataset size was tripled for both 3D and 2D model training. For 3D and 2D model training, 80% of the dataset was used, and the remaining 20% was used for testing.
RESULTS
DATA AUGMENTATION AND TRAINING 3D AND 2D DEEP LEARNING MODELS

| INTERNATIONAL | ISSUE 5 202218 Singapore’s Journey towards a Nationwide Digital Twin ADVANCED GEOSPATIAL DATA FORMS CORNERSTONE FOR SUCCESSFUL TRANSFORMATION Singapore cityscape skyline at Marina Bay at twilight.

The same two key mapping methods were adopted in both phases, namely laser scanners and cameras, although they were mounted on different platforms in each Singapore assumed ‘pole position’ in 3D urban planning back when it first started planning and conceptualizing its national 3D mapping project in 2012. The project was subsequently rolled out in two key phases: Phase 1 (aerial mapping) in 2014 and Phase 2 (street mobile mapping) in 2015. The aim BY WIM VAN WEGEN, HEAD OF CONTENT, GIM INTERNATIONAL
The design stage of the Singapore National 3D Mapping project between 2012 and 2014 revolved around consideration of the geomatics framework of data capture, model, manage and deliver. For data capture, the Singapore Land Authority (SLA) looked for digital sensors and platforms able to deliver rapid digital mapping data with reliable and accurate results to support planning and operational usage. For the data model, the authority explored digital workflows and data formats that would support interoperability between applications, systems and – in a fine example of forward-thinking – even digital Thetwins.SLA was keen to ensure digital data management and interaction between the huge amount of data at each refresh campaign, not just in a locational context but also in time/space. Another important condition was that the digital data delivery should be user-friendly in order to allow non-technical users to adopt and adapt with minimal technical learning curves.
Figure 1: The National 3D Mapping of Singapore project created core geodata such as DSM, DTM, orthophoto, 3D building models, imagery and point clouds.
FEATURE 19ISSUE 5 2022 | INTERNATIONAL |
When it comes to utilizing the true potential of digital twin technology, Singapore is miles ahead of most other governments. Even those that have already embraced the concept of the digital twin have often not yet fully realized their plans, while many other cities and countries are still only taking their first steps. This article takes a closer look at how things currently stand in Singapore and at the nation state’s transformation journey so far. The building blocks for success include developing a sustainable system, taking a long-term view from the start, and ensuring the availability of sufficient geospatial professionals. was to map the entire nation with rapid data capturing technologies to create an accurate, reliable and consistent national 3D map that supports government agencies in their policy formulation, planning, operation and risk management. This national 3D map serves as the foundation of Singapore’s digital twin.
Data and people were identified as the two essential aspects. When it comes to the geospatial data, the philosophy is ‘capture once, use by many’. This ‘whole-ofgovernment’ approach is aimed at minimizing duplicative efforts, and translates into economies of scale and the common use of authoritative datasets by government agencies and consultants when working on projects. Thanks to the boundary conditions of the most accurate, reliable and high-resolution data, applications utilizing the data yield reliable results as the basis for informed decisions and predictions. In addition, open data and open source have been advocated since the very start of Singapore’s 3D mapping journey. The open data enables users to use appropriate tools to meet their organization’s needs, regardless of their applications and systems.
THE START OF SINGAPORE’S 3D MAPPING JOURNEY
AERIAL AND STREET-LEVEL MAPPING OF SINGAPORE

UNDERGROUND AND INDOOR MAPPING
In 2017, the SLA entered into a partnership with the City of Zürich and the Singapore ETH Centre (SEC) to initiate the Digital Underground project, aimed at developing a reliable map of Singapore’s underground utilities for planning and land administration purposes. The first phase mainly involved the formulation of the roadmap and project strategy. The second phase focused on building the foundations of a sustainable utility mapping ecosystem that will continuously provide reliable 3D utility information to both the public and private sectors. A framework for the governance of data quality was developed and the Utility Survey Standards were reviewed, before subsequently being introduced in 2017. Now, in the third phase, workflows are being developed for the capture of reliable digital subsurface utility data.
ENSURING UP-TO-DATE GEOSPATIAL DATA
There have also been some small-scale trials using terrestrial scanning to capture 3D indoor spaces, but these are still in an early stage. The SLA is constantly on the lookout for suitable capturing technology such as backpacks or handheld laser scanners. Depending on the use of the mapping data, the main challenges so far are scan-to-model/ scan-to-BIM and the industry’s slow adoption of 3D data. While some of these challenges may be overcome with machine learning and artificial intelligence (AI), a lot of effort is still needed to validate the reliability of the results from these outcomes and to encourage the geomatics profession to embrace such technology.
| INTERNATIONAL | ISSUE 5 202220 capital investment and maintenance. The SLA adopted a commercially available software-asa-service (SaaS) solution from Bentley Orbit to manage the large volume of mobile mapping point clouds and panoramic imagery. This has also facilitated the sharing of data with other users with scalable cloud resources to support the long-term sustainable mapping programme and the city-level digital twin.
Besides above the ground, the SLA is also working on a national subsurface digital twin of Singapore. Almost all of the nation state’s utility assets are buried underground in order to free up valuable above-ground space for other purposes. However, Singapore’s ongoing expansion – both above and below the surface – means that the subterranean space available for utility services is becoming increasingly scarce. Information about existing subterranean services and structures is not always available, accurate or up to date. As a result, the infrastructure agencies and utility licensees face significant challenges in terms of planning new infrastructure and managing project timelines/costs. Needless to say, there is also a heightened risk of damaging utility assets during excavation work.
In order for the digital twin to remain relevant in the long term and to achieve its full potential, it is vital that the geospatial data is kept up to date. Singapore has pursued two strategies to safeguard this: 1) A mapping programme was established, ensuring ongoing funding for continuous data acquisition to keep the 3D city models updated, and 2) Exploration and investment in rapid mapping phase. For aerial mapping, data capture was conducted from fixed-wing aircraft, whereas street mobile mapping was conducted from a moving vehicle on the ground. The first versions of Singapore’s National 3D Mapping project were concluded in 2015 and 2017, creating core geodata such as a digital terrain model (DTM), digital surface model (DSM), orthophoto, 3D building models at various levels of detail, imagery and point clouds. The street mobile mapping captured all public roads in Singapore, which resulted in no less than 600 billion point clouds and three million panoramic images and amounted to approximately 25TB of data. That mountain of data will continue to grow because the journey towards becoming – and remaining – a smart, resilient and sustainable nation requires constant data updates to keep the information current. This massive amount of geospatial data in various forms and formats turned out to be challenging to handle and integrate. The managing and sharing of nationwide-scale datasets is also a challenge for mapping agencies due to the need for highperformance IT infrastructure, which requires Figure 2: A 3D reality mesh of Gardens by the Bay. Figure 3: LoD2 3D city models.
According to the SLA, reliable information about underground utilities offers three major benefits: 1) Better land administration and planning outcomes, as well as land use optimization, 2) Fewer uncertainties and risks during the planning and design of infrastructure development, and 3) Minimal disruption to the environment and subterranean services, combined with improved safety of construction and engineering works.


ABOUT THE AUTHOR Wim van Wegen is head of content at GIM International and Hydro International. In his role, he is responsible for the print and online publications of one of the world’s leading geomatics and hydrography trade media brands, Geomares. He is also a contributor of columns and feature articles, and often interviews renowned experts in the geospatial industry.
The SLA has a clear view on the current state of geospatial data related to 3D city modelling. Victor Khoo, director of the Survey & Geomatics Division at the SLA, emphasizes that 3D city models or a digital twin will not replace the 2D or 2.5D geospatial data. Instead, in most cases, the geospatial data is the building block for the 3D city model. From an application perspective, 2D/2.5D geospatial data will still remain critical and useful for many applications for which 3D is not suitable or efficient. From the perspective of geospatial data infrastructure, Khoo admits that there is still a maturity gap between 2D and 3D in terms of standards, governance, data model, format and visualization. Many efforts are ongoing to close that gap and he considers it critical for geospatial professionals to be involved in those Internallyefforts.inthe geospatial industry, thanks to technological advancements for both data capture and 3D modelling, it is now more attainable to develop useful and accurate 3D city models. Externally, the digital revolution in sectors such as the built environment, climate resilience and future mobility has generated a strong demand for digital twins. Therefore, Khoo’s message for the industry is that, in order to drive the adoption of digital twins, geospatial professionals should work closely with users to understand the use cases and provide high-quality and reliable 3D data.
THE GAP BETWEEN 2D AND 3D GEOSPATIAL DATA
wim.van.wegen@geomares.nl technologies such as Lidar solutions for data acquisition and AI-based 3D modelling. The aim is to map the whole nation once every five years using aerial mapping, and to refresh the street mobile mapping data every two years. Technologies such as remote sensing and terrestrial surveying are deployed in non-flight years so that changes on the ground can be detected and updated if necessary. In the meantime, Singapore is keeping abreast of developments elsewhere by monitoring how other cities and mapping agencies are conducting their campaigns.
FEATURE 21ISSUE 5 2022 | INTERNATIONAL |
ACKNOWLEDGEMENTS
Figure 5: On-site data capture in Singapore.
The SLA is convinced that 3D mapping and 3D city modelling will be the foundation for city-scale digital twins. Khoo urges other national mapping agencies (NMAs) and national geospatial agencies (NGAs) to step up to ensure that authoritative 3D city models are developed and continuously maintained. He envisions that – as AI, the Internet of Things (IoT) and immersive visualization such as virtual reality (VR) and augmented reality (AR) increasingly converge – the 3D city models and digital twins maintained by NMAs and NGAs will be used as key elements for applications in the emerging metaverses.
CONSIDERATIONS WHEN EMBRACING THE DIGITAL TWIN CONCEPT Digital twins exist for different purposes and requirements in multiple forms, resolutions and formats: at building level, precinct level, town level or city level. The key building blocks for a successful digital twin include repeatable and rapid reality capture, expandable and open data modelling, and accurate, reliable data coupled with technology. In Singapore, an open data format is being favoured as this enables the transition to new and emerging technology whenever it becomes available. Above all, reliable data is the key as it creates the basis for deriving accurate insights and supports informed decision-making. One fundamental prerequisite is the availability of enough proficient geomatics engineers to perform 3D mapping in order to ensure the accurate capture of real-world data as input for the digital twin.
WHAT’S NEXT? Singapore’s transformation journey has been shaped by the firm belief that future cities will be powered by the digital twin concept.
The author would like to express his gratitude to the Singapore Land Authority for the pleasant collaboration and in particular to Victor Khoo and Hui Ying Teo, whose contributions were essential in the realization of this article. Figure utilities.subsurfacemappingradarpenetratinguseExploring4:theofgroundin
3D geoinformation underpins a variety of governmental urban planning applications. For example, it allows planners to simulate how new development will affect the surroundings, supporting flood risk management to prioritize mitigation measures in areas prone to flooding and helping to protect coastlines. The highfidelity building models of Singapore have enabled a nationwide scan of potential roofs and walls capable of harnessing natural solar power as a source of sustainable and green energy. On the aviation front, the digital models of buildings near the airport and the terrain facilitate the identification of obstacles to improve flight safety and planning. As Khoo points out, Lidar and high-resolution imagery coupled with precise positioning also support the research and development work for autonomous platforms. From an asset management perspective, his other colleagues specialized in trees and parks have re-engineered their tree inspection process and management by using the point cloud to measure tree height, girth and spread as the basis for tree health assessment and scheduling the tree pruning activities for public safety.


Time sensitivity was an additional challenge as weather changes can disrupt the mission and a one-day mission can stretch into a week. In this particular case, the team was able to execute all the mission flights within one day.
The aerial mapping team investigated the
Aerial photography in mountainous terrain has a vast number of specific features and limitations. For example, flights over mountainous regions are unpredictable due to the thin air and rapid changes in weather, as sudden storms and extremely cold weather are common even in the summer season.
CHOICE OF EQUIPMENT
The other challenge is the terrain itself; for example, the team noticed that the take-off location had changed since they were previously in the area. The most suitable choice for an accurate and safe mission is vertical take-off and landing, as landing with a parachute will probably result in the loss of the aircraft due to wind drift and the inability to locate the device in mountainous terrain.
Elbrus is a glaciated stratovolcano that is rich with iron, and areas above 3,000m are heavily glaciated, presenting an additional challenge as the surface tends to change due to melting ice and shifting stones. The high volume of iron also interferes with radio signals.
The unmanned aerial vehicle (UAV) operators needed to prepare themselves and their equipment carefully. For example, the altitude at Elbrus is high enough to require acclimatization, and increased liquid intake is required during the time spent in the mountains. From an equipment perspective, the main challenges lie in unspecified or incorrect terrain maps, which may cause a drone to crash. Limited altitude configurations may lead to poor quality data or even the loss of the drone, and magnetometer sensor malfunction in the zones of magnetic anomalies may lead to the loss of control of the drone or even the loss of the drone as a whole.
CHALLENGES OF MAPPING AT HIGH ALTITUDE
INSPECTING AND CAPTURING CABLE CAR ROUTES
, FIXAR, LATVIA
FEATURE 23ISSUE 5 2022 | INTERNATIONAL |
Conquering Elbrus: Mapping Europe’s Highest Peak with a UAV
Mount Elbrus, with its peak of 5,642m, is the highest mountain in Europe. This makes it a remarkable attraction for adventurers, hikers and skiers from around the world, which calls for safe and permanent infrastructure. The main task of the aerial mission described in this article was to inspect the existing cable car route around the station of Garabashi and to create an accurate map of the area for the potential future extension of the cable car all the way up to the Priut station (4,050m).
BY VASILY LUKASHOV AND LAINE KUZMANE

| INTERNATIONAL | ISSUE 5 202224 losses and interference from geomagnetic anomalies, which led to magnetometric sensor malfunction. This resulted in the drone landing somewhere in the mountain area or returning to the start position and aborting the mission. Another fixed-wing solution with a launch catapult system was tried, but was also unsuccessful as the drone landed with its parachute system in an inaccessible area, plus it could only be used up to 3,600m, which is not high enough. The team chose the fixed-wing autonomous vertical take-off and landing drone Fixar 007 equipped with a Sony A6000 camera for photo image capture and a post-processing kinematic (PPK) sensor for precise positioning for post-processing. This solution was chosen as it is resilient to geomagnetic anomalies as it has no magnetometer sensors onboard, it has a proprietary autopilot system, and it is designed to fly above 4,000m. The drone is equipped with special propelling systems for missions above 3,000m to ensure operations in thin air conditions. Additionally, an aerodynamic design and wind resistance of 12m/s made it suitable for use in the mountainous area. The drone system allows altitude changes within a single mission and ensures landing with 2m precision, avoiding equipment damage or loss. The default terrain tracking of the unit made it possible to execute flights safely and with high precision. The team also required additional equipment such as a diesel power generator to charge the mission planner computer, as the lithium-ion batteries in the computer discharge significantly faster at high altitudes, limiting the mission planning software running time to 20 minutes. Performance of the UAV’s Li-po batteries was not affected by the high altitude.
location features and set up equipment that is able to withstand the challenges of working at high altitude, as several previous takes by other teams proved not to be up to the task. For example, copter drones suffered from GPS View of the cable car route and the Mt. Elbrus peaks. Equipped FIXAR 007 at Mt. Elbus.
Executed flight plans in the xGroundControl mission planning software.


Vasily Lukashov is the founder& CEO of FIXAR. He is an gineer, developer and innovator of unmanned aerial solutions with deep roots in the industry since a young age. He developed the FIXAR 007 model with its aerodynamic design and patented fixed-angle-rotor configuration that avoids dead weight. He has considerable experience in aeromodelling and aviation in business, education and competition settings. Laine Kuzmane has extensive experience in content creation for unmanned aerial solutions and application industries, with a background in journalism, public relations and marketing, having successfully driven communication at international manufacturing companies. She currently holds a marketing position at the full-stack UAV development start-up FIXAR.
Orthomosaic of the mapped area.
3D model.
3D MODEL FOR CABLE CAR ROUTE
ABOUT THE AUTHORS
TIME SENSITIVITY WAS AN ADDITIONAL CHALLENGE AS WEATHER CHANGES CAN DISRUPT THE MISSION AND A ONE-DAY MISSION CAN STRETCH INTO A WEEK
In changing weather conditions in high mountainous terrain, high-quality photographic material was gathered to inspect the planned cable car route and to be used later for the design and construction of the new cable Metashapecar.software was used for the postprocessing to build detailed orthomosaic and
3D models for further area examination and construction evaluation. Link to 3D model: bs3RSeDWRnGxvXDc0wPh8A/1https://fixar.nira.app/a/ Video: https://youtu.be/MZLQjaQldY0
DATA COLLECTION To collect high-quality data, an autonomous approach was chosen as this ensured stable and safe flights. The mission was split into four flights which were designed in the mission planning software xGroundControl before arriving at the flight location, reducing the time spent on-site. As the drone had to change altitude during the mission, it experienced temperature changes which could result in water build-up in the equipment. In this case, no build-up was identified, even after a temperature change from below to above 0°C. The default terrain tracking provided additional safety and precision in the mountainous terrain. As a result, detailed images of the terrain with a total area of 8.2km2 were captured with a resolution of 5cm/pixel for a total period of four hours, operating a FIXAR 007 with an onboard equipment weight of 1,000g. The PPK technology was used for mapping as RTK (real-time kinematic) technology is limited in mountains due to the GPS signal interference.
FEATURE 25ISSUE 5 2022 | INTERNATIONAL |


The 100% publicly financed institution still has some financial resources, but they are now more limited since the war means that the state’s funds are needed for other purposes. That is a source of great concern at StateGeoCadastre’s head office, although that is not what kept Serhii Zavadskyi awake at night at the beginning of the war. “One of the major worries was the lack of staff. Since the beginning of Russia’s invasion of Ukraine, 123 StateGeoCadastre employees have joined the armed forces, plus we are keeping a close eye on all our employees who remain in Ukrainian territory that has been seized by
Cadastre in Wartime
Restricted public access to information is the main difference between the cadastre during wartime and the cadastre in peacetime, besides of course the concerns about staff and systems. Major projects, such as facilitating the sale of state-owned land, have been put on hold.
When asked about the challenges his organization faces today, Serhii Zavadskyi, head of the State Service of Ukraine Despite the current conflict, the topographic and cadastral land-register services of the Ukrainian StateGeoCadastre are still operational, certainly in the regions where the country is not under attack.
CURRENT
| INTERNATIONAL | ISSUE 5 202226
LACK OF STAFF
THE SITUATION IN UKRAINE
Serhii Zavadskyi: “People are the most essential resource for StateGeoCadastre in all of its activities.” (Image courtesy: StateGeoCadastre)
for Geodesy, Cartography and Cadastre (StateGeoCadastre) in Kiev, stays admirably calm: “About 50 of our regional offices have been seized by the occupants and are totally unavailable at present. Eight of our premises are seriously affected as a result of the Russian Federation’s armed invasion. To ensure that the organization can continue to function, personnel from the regional offices that are under occupation have been or will be partially transferred to other regions or cities in Ukraine. We have made backups of our data so it is safe. We keep copies of all essential databases on different servers, with restricted StateGeoCadastreaccess.”is a huge organization with around 10,000 employees and hundreds of points of contact in the regions. But then, Ukraine is a very large country; comprising more than 600,000km2, it ranks 46th in the world in terms of size. StateGeoCadastre is responsible for the geodetic surveying and mapping of this vast area, as well as the cartographic registration of cadastral parcels and the title registration of land. The registration of property titles is done by another government agency, the State Register of Property Rights to Real Estate.

DATA BREACHES
SATELLITES What also helps is Elon Musk’s satellite infrastructure: Starlink. SpaceX quickly responded to the Ukrainian government’s call on Twitter to help keep the internet working in war-struck Ukraine even when there are power outages. Today, more than 10,000 stations help connect and support critical energy and telecommunications facilities, healthcare and other facilities.
Still on the topic of satellites, even in the current circumstances StateGeoCadastre has not replaced aerial photography or ground-based surveying with satellite images. Zavadskyi: “They are sometimes used as input for certain hybrid monitoring activities. But the images from space are not the answer to today’s challenges, whereas traditional surveying is often more suitable for updating basemaps in severely damaged urban areas and so on.” This does not mean that StateGeoCadastre is not interested in Earth observation and satellite positioning-based initiatives like EUSpace4Ukraine (see box) aimed at helping to tackle the humanitarian challenges in the country. StateGeoCadastre intends to make use of the platform if necessary, but so far that has not been the case according to Zavadskyi.
When asked what advice he would give to comparable organizations elsewhere to ensure they are prepared for a war, Zavadskyi says: “Transferring data to cloud storage is the best option. Do something about the legal obstacles if they still exist. There should be a strategy in place for evacuating the database in the event, and the procedures should be regularly tested in real life.”
FEATURE 27ISSUE 5 2022 | INTERNATIONAL |
BY FRÉDÉRIQUE COUMANS, CONTRIBUTING EDITOR, GIM INTERNATIONAL
BE PREPARED
So far, there has been no evidence of a data breach by the Russians in Ukraine; any cartographic resources have been given with the permission of the Ukrainian Armed Forces’ topographic service. However, all geospatial data owners and producers have been advised to stop publishing and disseminating geodata via geoportals in order to prevent database breaches. Zavadskyi observes: “The lack of unrestricted public access to information is what distinguishes the cadastre in conflict from the cadastre in peacetime. Everything is still in place in terms of developing and maintaining the registers. One of the most difficult issues following the war may be the demand for information such as up-to-date topography in the aggressor. Fortunately, none of our staff have been physically injured, but everyone has clearly sustained some emotional and psychological damage,” he explains. “However, people have mobilized; even in the absence of proper resources, everyone is trying to protect the nation. When it comes to the defence of our state, there is a higher degree of understanding. Because of the elimination of bureaucratic barriers and our focus on the accomplishment of the ultimate aim – military victory – any critical process can be completed in a couple of hours. As a result, people are the most essential resource for StateGeoCadastre in all of its activities.”
StateGeoCadastre was given ten Starlink units throughout the country. Currently, internet quality from Starlink in eastern Ukraine is not as good as in the west because Ukraine does not have its own Starlink ground station. But no war, no matter how destructive, can last forever. The Ministry of Digital Transformation of Ukraine announced that “after the victory, together with Elon Musk, we plan to build our own Starlink ground station to improve the quality of satellite Internet for all Ukrainians.”
Many regional offices are seriously affected, such as in Prymorsk. (Image courtesy: StateGeoCadastre)
“Secondly, data is normally kept in two secure data centres: the primary and the backup, which must be located a significant distance apart from one another. It’s necessary to develop a high-quality geospatial data infrastructure and geoinformation tools, allowing users to deal with data in both secure and public modes. And thirdly, it’s important to devise an effective means to shield information from the enemy, and to reconsider the notion of making public data as open as possible for re-use,” he adds.

LAND REFORM
ABOUT THE AUTHOR Frédérique Coumans is contributing editor for GIM International. For more than 25 years, she has been covering all aspects of spatial data infrastructures as editor-in-chief of various magazines on GIS, data mining and the use of GIS in business. She lives near Brussels, Belgium. been put on hold during the Russian military “Weinvasion.were absolutely ready to launch the land market reform,” states the head of StateGeoCadastre firmly. Since the majority of the state land it is not currently properly marked in the cadastre, the organization had started to train regional land surveying engineers in the accurate demarcation and registration of cadastral plots. The introduction of automatic information exchange with the State Register of Titles has also been an important step. The same goes for the countrywide deployment of a geoportal, which delivers the essential information to notaries and other stakeholders. Apart from supporting the land reform, the geoportal will contribute to making geospatial public data more accessible to the Ukrainian public and private sectors. It will be easier to disseminate the 1:50,000 scale digital topographic map and the topographic database about the Ukrainian territory. The organization was planning to follow these with maps at 1:10,000 and 1:25,000 scales, as well as procedures for real-time updates and the rollout of a geographical names system, and so on. There were also plans to launch remote sensing for tracking land usage and the evolution of natural resources. “After the war, the projects can immediately be resumed in full capacity,” he says resolutely.
ACCELERATE THE VICTORY Zavadskyi concludes the interview with a heartfelt statement: “The cruel war that the Russian Federation has been waging against employees continue to work despite the full-scale invasion and are doing their best to accelerate our victory. That is now the focus of the Ukrainians, as well as on providing assistance to our armed forces, which are bravely defending Ukraine and keep risking their lives for our country every single day. I know that Ukraine is not alone in her endeavour to win and to rebuild everything that was inhumanely destroyed. These trying times have truly shown us the many international, real friends and of that I am very proud. After all, in the fight against evil, it is important to be united.” the liberated regions. However, we have no way of yet comprehending how serious these issues will be for us and our fellow public administrations. And there are some things that you can’t prepare for. For instance, the Ukrainian global positioning system is partly functioning. Station disassembly is a serious issue everywhere. Most ground stations are operational; they work in collaboration with other commercial networks. But as for the stations that exist in the territories temporarily controlled by the Russians, we have no idea what has happened to them.”
Another huge challenge Ukraine has to tackle (with support of The World Bank and others) is that the country is in the midst of a land market reform, with StateGeoCadastre playing a leading part in the execution. Of Ukraine’s total land area of 60 million hectares, roughly 42 million is classified as agricultural land. 25% of all agricultural land is owned by the state. The rest was distributed in small parcels some 20 years ago among members of former communist collective farms. The owners either lease this land to large agricultural holdings or farm the land themselves, although there are about seven million small landowners in Ukraine. In 2021, laws were passed to open up the agricultural land market. To give ‘small’ farmers a head start, in the initial years a Ukrainian citizen can buy a maximum of 100 hectares (aided by cheap loans). From January 2024, this will increase to a maximum of 10,000 hectares for all Ukrainian citizens/ legal entities. A referendum is set to decide whether foreigners should continue to be excluded. However, this reform project has
Vitali Klitschko, Mayor of Kiev, and his brother Wladimir Klitschko with the Starlink terminals provided
| INTERNATIONAL | ISSUE 5 202228


According to the EUSPA executive director, there are some challenges that must be permanently addressed: “Thanks to testimonials of refugees and NGOs operating at the borders, we have identified several challenges and areas of need. Potentially helpful solutions to address these include: 1) Applications for safe, timely and accurate navigation for population migration, 2) The provision of online platforms for the coordination of public/ private helpers, 3) Applications to help the understanding and inventorying of damage in Ukraine territories, and (4) safety and rescue solutions.”
MORE INFO https://www.euspa.europa.eu/euspace4ukraine
The humanitarian support also extends beyond the Ukrainian borders and could involve ‘normal’ GIS applications. “For example, mobile applications that help people integrate in a new country utilize maps showing important points of interest such as medical facilities, schools and addresses for local support,” he explains.
APPLICATION SPECTRUM
Stimulating the Use of EO and Satellite Positioning in the Ukrainian Relief Effort
Rodrigo da Costa, executive director of EUSPA, comments: “We want to mobilize the EU space innovation community to provide technological solutions that can enhance humanitarian support for the Ukrainian people. Eight colleagues with knowledge of space technologies are working, part-time, on the EUSpace4Ukraine task force.” The multidisciplinary team is currently spending most of its time communicating with interested parties to better understand their needs and explain the platform’s processes and activities. As of mid-June, the platform listed projects from 27 organizations: 17 application developers and 10 user organizations and data providers. A hackathon event was organized in early July to attract new participants and further encourage the development of new applications using data from the EU Space Programme.
THE EU SPACE FOR UKRAINE PLATFORM:
Rather than being aimed at helping the Ukrainian army or assisting the prosecution of war crimes, the EUSpace4Ukraine initiative is focused on ‘humanitarian support’. This covers a wide range of uses: from supporting NGOs delivering medical goods using drones, to practical solutions that help people fleeing the war to integrate into life in EU countries. “Earth observation data might also contribute to analysing the effects of the war in Ukraine, such as evaluating distribution routes, assessing the post-event damage or supporting agriculture and forestry,” adds Da Costa. “Some of the solutions listed under the EUSpace4Ukraine initiative can provide Copernicus data as well as processing and dissemination capabilities that can help in updating base maps. That is a challenging task, particularly in areas that face dramatic changes in infrastructure and land cover as a result of the bombing.”
FEATURE 29ISSUE 5 2022 | INTERNATIONAL |
The EUSpace4Ukraine platform focuses on satellite data-based applications that help to deliver medical and food supplies, support evacuation efforts and also help refugees find their way in other EU countries. The platform has been initiated by the European Union Agency for the Space Programme. By fostering the development of competitive Earth observation (EO) applications, the EU Agency for the Space Programme (EUSPA) – which has its head office in Prague, Czech Republic – contributes to stimulate innovation-based growth in the European economy. At the same time, the agency aims to contribute to the safety of EU citizens and the security of the member states. In April 2022, EUSPA worked together with the European Commission to create the EUSpace4Ukraine platform. The platform is aimed at matching developers of EO and navigation apps with NGOs and other ‘helpers’ in war-torn Ukraine. The applications can incorporate satellite data from any distributor and are publicly available online.

www.gim-international.com


FEATURE 31ISSUE 5 2022 | INTERNATIONAL |
MAPPING PROJECTS
, HEAD
Advancements in technology for observing and capturing details about the Earth have opened the door for new projects to enlarge our knowledge of remote and inhospitable areas, and the Arctic and Antarctic are prime examples. These regions are popular locations Capturing and measuring the environment in the Arctic and Antarctic is a particularly challenging job. The area of interest is often covered by a thick blanket of snow and ice, while extreme temperatures can be dangerous for both the surveyor and the equipment, plus strong winds and bright sunshine can further hinder the work. However, it is essential to map these parts of our world as their future is under pressure, not least due to climate change. This article provides an overview of some recent adventurous surveying projects and applications in some of the coldest regions on our planet – from mapping penguins to monitoring icebergs using UAVs, and from mapping the impact of global warming on the Greenland Ice Sheet to creating a digital twin of Antarctica. for a wide variety of research projects that observe and monitor the environment. When mapping habitats, field-based studies are combined with geospatial data for analysis and modelling purposes. Remote sensing methods play an important role in studying the dynamics of glaciers and ice sheets. Meanwhile, mapping of the seafloor of the polar seas has gained momentum, not least thanks to the rapid pace of development in sensor miniaturization and autonomous mapping.
CONTENT, GIM INTERNATIONAL
INSIGHT INTO SOME INTRIGUING
Capturing the Arctic and Antarctic POLAR BY WIM VAN WEGEN OF

MONITORING ICEBERG MELT FROM THE AIR AND UNDERWATER An iceberg is a floating mass of ice that has broken off a glacier or an ice sheet. They can often float around for a number of years. Climate change is accelerating the glacier retreat, which is leading to an increase in the number of icebergs. In the Northern Hemisphere, thousands of them are formed each year along Greenland’s west coast. These often drift southwards to Newfoundland with the cold Labrador Current. In the seas around Antarctica, they drift northwards, ending up in the sea between South Africa and South America where the water is warmer, causing the ice to melt quickly. As icebergs melt, they release freshwater into salty ocean waters, which has a significant impact on local circulation. To gain a better understanding of how global circulation will change in the future, it is crucial to accurately map iceberg melt rates. In recent years, UAVs MAPPING PENGUINS IN ANTARCTICA In Antarctica, student researcher Lana Lenourry has been on a mission to map the breeding sites of penguins. This project was part of the Antarctique 2.0°C Expedition, which is an interdisciplinary study on climate change and humankind’s environmental footprint. Phenomena such as sea level rise and glacier retreat due to climate change are likely to affect the habitat of Antarctica’s penguins. Understanding how penguins occupy the space today will make it easier to anticipate which changes they will face. Analysing the spatial distribution of the different penguin species helps to determine nesting trends according to the species studied and consequently to highlight potential competition for access to breeding space. Mapping an iceberg with a UAV and multibeam sonar. (Courtesy: Airborne Drones)
The WingtraOne UAV was deployed for mapping the top layer of the Greenland Ice Sheet.
For the survey to map penguin colonies, a YellowScan Mapper was loaded on a DJI Matrice 300 unmanned aerial vehicle (UAV or ‘drone’) while flying at 60m altitude at 10m/s. The system was able to map all types of terrain in the area, ranging from dry to snowy to soggy. The temperature was between -5°C and 5°C in the peninsula as the project took place in the Antarctic summer, so the cold was not a problem. However, the weather was unpredictable and changed rapidly. Some flights had to be carried out while it was snowing. Wind was also a risk factor; some of the missions had to be postponed and even abandoned because of the wind speed. These challenging climate conditions were intensified by time pressure; the team only had one day per site, making it necessary for them to quickly come up with an effective process to map and identify all the penguin species present in the area. The YellowScan Mapper was equipped with a camera module, enabling the selection of flight parameters for photogrammetry purposes. The base station for the geolocation by satellite was provided by Teria. Lenourry had received some training from Instadrone and YellowScan to prepare her for UAV mapping, but as a non-experienced pilot she soon discovered how difficult it can be to access a site. The transport cases provided to move the equipment (especially the UAV) were not at all adapted for the Antarctic terrain, which involved landing from the sea and moving in several inches of snow. Ultimately, the team members had to strap the transport cases on their backs, which was a considerable drain on their energy Sinceresources.Antarctica is among the most poorly mapped places on Earth, it was difficult to prepare for the mission in advance due to the lack of access to accurate, high-resolution maps. Moreover, the crew had no internet access in the field. The combination of the YellowScan Mapper and the Matrice 300 UAV proved to be a reliable and effective solution in these demanding circumstances. The UAV flights resulted in digital elevation models (DEMs) that enabled the penguins and their nesting areas to be identified and mapped in each zone to analyse their segregation.
| INTERNATIONAL | ISSUE 5 202232


ABOUT THE AUTHOR Wim van Wegen is head of content at GIM International and Hydro International. In his role, he is responsible for the print and online publications of one of the world’s leading geomatics and hydrography trade media brands, Geomares. He is also a contributor of columns and feature articles, and often interviews renowned experts in the geospatial industry.
FEATURE 33ISSUE 5 2022 | INTERNATIONAL |
In another similar initiative on the Earth’s southernmost continent, the Australian Antarctic Division has announced its ambition to develop a digital twin of East Antarctica (also called Greater Antarctica), which makes up the majority of the Antarctic continent. This project is still in an early phase, but there are reports of plans to use drone fleets to map inaccessible areas and an Antarctic ‘eye’ with integrated sensors and cameras feeding back real-time information. have proven to be a useful tool for this task, provided that they are properly equipped. The geospatial data that is acquired by the UAV from above the iceberg is used to create a dense point cloud and a surface mesh. Since the iceberg is in motion during the survey, the geodetic GPS positions are used to correct the gaps in order to construct the point cloud. The surface DEM can then be used to predict the volume of the tip of the iceberg. However, in order to get a clear picture of the iceberg situated below the water – which often accounts for 90% of the total mass – this is combined with data derived from multibeam sonar-equipped subsurface vehicles to create a subsurface DEM. This process results in a full 3D model of the whole iceberg.
Machine learning and artificial intelligence are being leveraged in order to get the most out of the complex information that is available.
DIGITAL TWIN OF ANTARCTICA
The Greenland Ice Sheet is a vast mass of ice covering an area of approximately 1.7 million square kilometres, which is around 80% of the whole of Greenland. It is the second largest ice mass in the world, after the Antarctic Ice Sheet. Its average thickness is more than 2 kilometres, and the ice is more than 3 kilometres thick at the thickest point. However, in 2012, the top layer of the land ice on Greenland had melted so quickly during the summer that NASA researchers at first thought there was something wrong with the satellite imagery. Ice drilling results show that such rapid melting occurs once every 150 years, but then in 2019 it happened again. To better understand this worrying situation, researchers from the Department of Geoscience at the University of Fribourg, Switzerland, are using drones to map the melt-prone areas of the ice sheet. The project is still in full swing. The research team has chosen to use the WingtraOne UAV, equipped with a MicaSense RedEdge-MX multispectral camera. The WingtraOne has proven itself during a multitude of projects under harsh conditions. In Alaska, the Swiss-engineered UAV has been used for mapping glacier changes as well as for avalanche risk inspection and permafrost monitoring. Greenland is similar to Alaska in terms of having large areas that are complicated to map due to challenging wind vectors. The vertical take-off and landing (VTOL) fixed-wing capabilities make this UAV a safer choice and enable the project team to fly at an altitude of about 400m (1,300ft) above the ice to gather data. Moreover,
solutions such as the WingtraOne are particularly suitable as they are able to reach high levels of location accuracy without the need for extensive ground control, facilitated through the integrated multi-frequency PPK module.
wim.van.wegen@geomares.nl underlying the Antarctic Ice Sheet. Shades of brown visualize above sea level, whereas bedrock below sea level is shown in shades of blue. (Courtesy: NOAA).
As Professor Amos Storkey from the School of Informatics at the University of Edinburgh added: “It is all about learning how to best piece together the current sources of knowledge to provide greater clarity about what we can know and good measures of what we don’t.”
MAPPING THE GREENLAND ICE SHEET
Digital twins of buildings, cities or even entire countries are becoming increasingly commonplace, so why shouldn’t it be possible to create a digital version of a whole continent? And there are several initiatives that are attempting to do just that for Antarctica. The most prominent one is the 4D Antarctica project, which is aimed at advancing the understanding of the Antarctic Ice Sheet’s supra and sub-glacial hydrology, its evolution, and its role within the broader ice sheet and ocean systems. The ambition is to create a dataset composed of icesheet-wide hydrology and lithospheric products, Earth observation (EO) datasets as well as a state-of-the-art ice-sheet and hydrology model to gain a full understanding of Antarctica and its dynamics. The numerous project partners include British Antarctic Survey (BAS), The University of Edinburgh, Technical University of Denmark (DTU), ETH Zürich and the German Aerospace Center (DLR). In an interview with ESA, Noel Gourmelen from the University of Edinburgh explained: “By harnessing satellite observations, numerical simulations and artificial intelligence, we have built a twin of the Antarctic ice sheet system, its hydrology, surrounding ocean, atmosphere and biosphere. We have used the Antarctic twin to track the whereabouts of melt water on and under the ice sheet, and to explore how fringing ice shelves melt under various hydrology scenarios.”
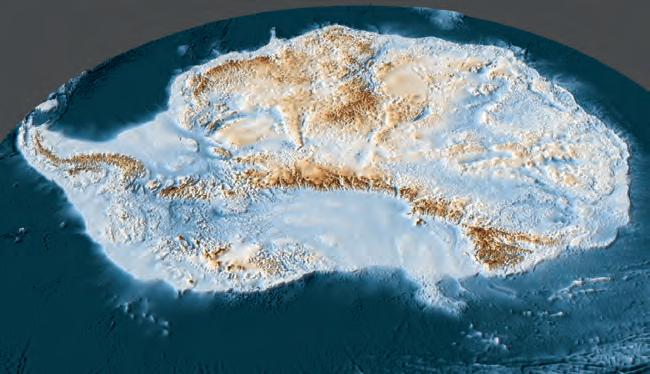
| INTERNATIONAL | ISSUE 5 202234 Eyefly has been working with a Phase One 100 Megapixel camera for over six years. This professional camera in combination with the company’s expertise ensures the best end product. Read more below about the benefits of this camera and how it can support inspection and mapping projects.
EVERYTHING FOR THE DESIRED FINAL PRODUCT “High quality photos make for high quality products. For each project, we determine how we will collect the photos and with what resolution. In this way, we can ultimately deliver the desired product. A 3D point cloud is often the basis for our end products, requiring the level of detail of the point cloud to match the products that are being realised.”
The Benefits of Mapping with a 100 Megapixel Camera
MAP A LARGER AREA IN LESS TIME
The image above shows how large the area is that can be captured with a 20, 45 and 100 Megapixel camera. As shown, a 100 Megapixel camera captures a significantly larger area in one go. This enables work to be carried out much more efficiently: fewer photos are needed to map a larger area, meaning that flying takes significantly less time.
CAPTURE 6 TIMES MORE SURFACE AREA “Compared to the most commonly used 20 Megapixel cameras, we gain an average of 6 times as much surface area in the same flight time. Because we capture a larger area in one go, this also means that we can process the images quicker and more efficiently,” says Remco Kootstra, CEO of Eyefly.
The Experiences of Eyefly with Phase One iXM


Eyefly has extensive knowledge in every field of expertise. By having various specialists for every application, we ensure accurate and complete data to the highest standard. One of the specialties is gathering and processing geographic data. Eyefly provides 2D and 3D models which are the basis of volume measurements, altitude readings, DTMs (Digital Terrain Models), 3D visualisations and maps for project management purposes. Besides geographic data, Eyefly also specializes in inspections. Possible markets are oil and gas, offshore, construction, civil and installations. Gathering data in both infrared and RGB are amongst the possibilities. Inspections of wind turbines, insulation, leakages, solar panels, power pylons, objects and hard to reach locations are the most common applications. The image below shows the difference in camera type, resolution and the level of detail of the point clouds.
As Eyefly does not always fly in the most optimal weather conditions, there are additional challenges. In certain weather conditions; for example, if it is a dark and extremely cloudy day, or if there is a lot of sunshine, shadows can appear in the images. This significantly impacts the visibility of small details. The iXM 100 Megapixel camera from Phase One offers a high dynamic range, allowing the shadows and dark photos to be edited easily with appropriate software. This increases the depth of the image and results in substantially better visibility of important details.
SPONSORED ARTICLE 35ISSUE 5 2022 | INTERNATIONAL |
THE IXM 100MP CAMERA FROM PHASE ONE OFFERS A HIGH DYNAMIC RANGE, ALLOWING THE SHADOWS AND DARK PHOTOS TO BE EDITED EASILY WITH APPROPRIATE SOFTWARE
LEARN MORE Eyefly - eyefly.nl Phase One - geospatial.phaseone.com
ABOUT EYEFLY
Founded in 2014 as one of the first professional drone companies in the Netherlands. As a pioneer in the field of drones, Eyefly has developed into one of the most versatile, innovative and professional drone companies focussing on inspections, data processing and 2D and 3D mapping. Eyefly is fully certified to conduct commercial drone flights within Europe. This way the contractor can be certain that the flights are executed in a safe and reliable manner and that they are all carried out according to the appropriate laws and regulations.
MORE DEPTH AND DETAILS THROUGH DYNAMIC RANGE


WWW.GEOMARES-MARKETING.COM


REPORT 37ISSUE 5 2022 | INTERNATIONAL | sites of penguins. Connecting to prepare the industry and exchanging knowledge to pave the road to the Lidar technology of the future: this would be a sound description of the objectives of the YellowScan Lidar for Drone 2022 Conference. The venue of the Domaine de Verchant chateau, a wine domain dating back to the 16th century that is situated just outside the city of Montpellier, proved to be an excellent location to accommodate this gathering of attendees from over 30 countries.
REVIEWING THE YELLOWSCAN LIDAR FOR DRONE 2022 CONFERENCE
CONTENT, GIM INTERNATIONAL
HEDGEROWS AND PENGUINS YellowScan is renowned for its large portfolio of Lidar solutions for a multitude of applications, offering a full ecosystem for its users. The company has built a distribution network across many parts of the world, which was reflected in the variety in the speakers’ countries of origin. Overall, the conference programme presented the versatility of A relaxed vibe, sunny weather with summer temperatures, smiley faces, a charming wine estate as venue and very approachable members of the organizing hosts of the Lidar for Drone 2022 Conference: YellowScan celebrated its tenth anniversary in style. Despite the festive atmosphere, the backbone of the event was formed by the highly informative conference programme, with speakers from all over the world – resulting in a backpack full of Lidar-fuelled inspiration for the trip back home.
UAV-Lidar mapping, which became visible after just the first couple of presentations. Edward Vainu from Estonia took the audience on a journey across his country, where the entire power line network is being monitored with drones, while Fearghus Foyle taught the attendants by video connection about monitoring hedgerows for biomass measuring purposes – a brilliant UAV-Lidar mapping application in Ireland, a country with no less than 689,000 linear kilometres of hedgerows. Surveying under challenging circumstances should be no limitation for Lidar solutions, and this was emphasized by several presentations dished up during the two-day conference programme. Lana Lenourry even took the participants to Antarctica, where she recently conducted a penguin mapping project with the YellowScan Mapper mounted on a DJI Matrice 300. This adventure showed how important it is to trust the equipment. Lenourry was able to map more than ten different sites, each of several dozen hectares, while flying in demanding conditions: wind, snow and cold. In a completely different climate zone, the combination of drones and Lidar technology proved to be key in the discovery of hidden Maya structures in the Guatemalan jungle. The discoveries were made possible by mapping the area with a Qube 240 payload, a high-end Lidar scanner designed for the Trinity F90+ eVTOL fixed-wing mapping drone from Quantum-Systems. Imagine what other discoveries may be just around the corner, bearing in mind the strong suspicion that countless buildings from earlier civilizations are still hidden under the rainforest. The advancing Lidar technology offers new possibilities to uncover these, as the project presented by Martin Herkommer of the German drone manufacturer showcased.
The Bright Side of Mapping BY WIM VAN WEGEN, HEAD OF

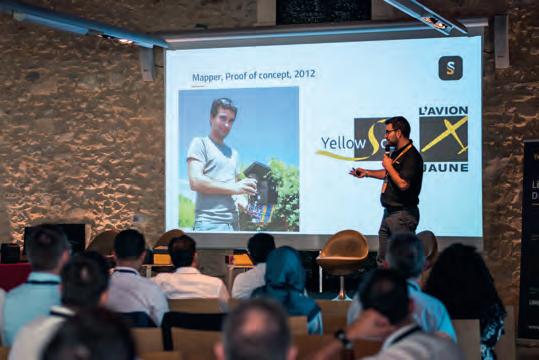
Isabelle Le Tellier, a loyal participant of the YellowScan conferences, immersed the audience in various examples of UAV-Lidar for archaeological projects in different places, ranging from the Alps to the famous tidal island of Mont-Saint-Michel and its surrounding bay, to Madagascar. The study of pirate occupations of the bay of Ambodifotatra brought archaeologists to work in a geographical area never before investigated. The project encompasses the study of the defence systems using old and current cartography, the inventory and study of batteries still in place, the capturing of the remains of pirate camps on the coast using Lidar and the study of the state of underwater remains in the bay such as pirate shipwrecks.
The impact of a Lidar investment on a small company was painted in a very colourful way by the incredibly inspiring presentation of Arnaud Denisot. “Lidar saved my business,” this self-made UAV-Lidar specialist informed his audience. Originally an aerial video/ photography specialist, he saw his revenue melt like snow in the sun when Covid-19 hit the world, as most of his clients were in the tourist industry. With a background as an IT engineer, he re-established himself with a drone services company headquartered in Bali, Indonesia. The new company, Bali Drone Production, gathered steam as a result of its drone and photogrammetry services, but when Arnaud bought his first Lidar scanner – the YellowScan Vx15 high-precision and long-range UAV-Lidar solution – this turned out to be total game changer, marked with the launch of a new specialized mapping branch of the company, called MSDI. While demand for video and photography vanished, the need for Lidar mapping remained: power line inspection, road development projects, monument conservation and mining – applications that provided Arnaud with a massive amount of work: “We can now be a major player in UAV-Lidar survey services in Indonesia, provide accurate data in correlation with the environmental constraints we encounter here, and intervene quickly on urgent projects.” His company was even selected to digitize the Mandalika Circuit, to integrate it into the newest version of the MotoGP 22 video game.
Other applications that were covered at this festive edition of the conference were the mapping of Carcassonne and its mountain castles in France for obtaining UNESCO world heritage certification, the mapping of slopes and landslides for disaster management purposes in Malaysia and the monitoring of Also worth mentioning is the contribution delivered by Bálint Vanek on creating a digital twin of the famous Budapest chain bridge. Capturing and modelling the bridge was done using ground surveys, aerial scans and even a boat. The combined survey methods enabled the project team to create a digital twin from 1cm-resolution digital images and Lidar point clouds with a high scale accuracy, enabling precise distance, area and volume measurements.
The demo mapping of the vineyard of the Domaine de Verchant chateau and the demo of colourizing point clouds were also a prominent part of the event.
The second day of the Lidar for Drone conference started with a presentation on how UAV-Lidar proved to be a very good solution for avalanche risk detection. UAVs equipped with various sensors, including Lidar of course, were used in an evaluation of new
One session was dedicated to the question how Lidar compares with traditional mapping technologies. Traditional survey methods are often much more time-consuming than aerial Lidar, and relative costs are also an important factor to be taken into consideration. Traditional survey methods not seldomly turn out to be more expensive than aerial Lidar. With YellowScan’s solutions getting lighter and more compact over the past couple of years, they offer improved versatility because survey professionals can quickly deploy them at a lower economic cost relative to traditional surveying methods. Day one of the conference programme ended with a slideshow of photos with a lot of selfmockery, including some unborn concepts, a drone crash and some crazy photos that nicely reflect the atmosphere in the company. The evening was reserved for celebrating ten years of YellowScan, with a cocktail dinner and a cake in the shape of YellowScan survey equipment, enabling the attendants to literally get their teeth into Lidar solutions!
PIRATES AND MOUNTAIN CASTLES Elsewhere in Asia, the SVAMITVA project sparks the imagination. With no less than 664,369 Indian villages to map, this is truly a survey project at a mind-blowing scale. Sajid Mukhtar of ROTER, a company that has been a pioneer in providing surveying and mapping technology in India, informed the audience of India’s prestigious project to realize clear ownership of property in rural inhabited areas. This huge-scale mission is performed by mapping land parcels using drone technology –UAVs equipped with optical, infrared and Lidar sensors – and providing a ‘Record of Rights’ to village household owners and issuing legal ownership cards to the property owners.
AERIAL LIDAR RETURN ON INVESTMENT
| INTERNATIONAL | ISSUE 5 202238 technologies for avalanche risk detection in order to keep the roads open in Norway in winter. The mission took place in the area surrounding the iconic Trollstigen road, one of Norway’s most famous scenic routes that is renowned for its hairpin bends around high mountain peaks. It was certainly a challenging survey project, due to the vertical cliff face, high elevation differences, challenging winds and GNSS shadow.


written in Python programming language • cloud connectivity for remote operation and data transfer via LAN, Wi-Fi, and 3G/4G LTE • flexible scan data acquisition scheduling • flexible threshold value setting • no extra software required – webserver on scanner for browser-based data and result publication Monitoring App data comparison and visualization of differences to the reference data set Design Compare App data comparison to a given 3D design model, visualization of undercut and overcut Slope Angle App calculation and visualization of local slope angles and the areas above the critical slope angle RIEGL VZ-i Series for highest accuracy and optimal performance: RIEGL Mining Apps for highest efficiency in the field: RIEGL VZ- i SERIES LASER SCANNERS FOR MINING RIEGL MINING APPS FOR REAL TIME ANALYSIS AND PROCESSINGMiningAppsforRIEGLVZ-iSeriesScanners WATCH OUR VIDEO Explore the full RIEGL product portfolio at www.riegl.com Austria | USA | Japan | China | RIEGLWORLDWIDE | Australia | Canada | United Kingdom
All the comments we heard are added to something you best can describe as a wish list or to-do list, inspiring the YellowScan experts to further advance our Lidar solutions.”
•
As well as providing many intriguing case studies, the programme also included sessions in which business cases – for instance by RIEGL – were put in the limelight. The demo mapping of the vineyard that surrounded the venue and the demo of colourizing point clouds were also a prominent part of the event, while the same goes for the hands-on exercises –jointly powered by Terrasolid – that were held in parallel with the conference sessions.
5 mm • customized
GROWING KNOWLEDGE
REPORT 39ISSUE 5 2022 | INTERNATIONAL |
The YellowScan Lidar for Drone 2022 conference showed what Lidar can bring to the business by demonstrating the rewards of investing in this innovative technology. Morgane Selve, one of YellowScan’s event organizers, was very happy with the outcome of the two Lidar-packed days. “The passion of our customers makes us really feel good. We received so much great feedback, which is an important source for improving our products.
Excited mapping professionals exchanging knowledge and advocating the strength of Lidar technology, this probably summarizes the two-day event on the outskirts of Montpellier.
YellowScan is a company with a very open character, where craftmanship is core. The company has steadily built a strong reputation in the market with its very own identity. What safely can be regarded as one of the building blocks of their success story is the ability of all the employees to speak English (which is not self-evident in French companies), making it a lot easier to be a “partner in crime of businesses that want to do Lidar,” as Morgane Selve said. While happy clients and positive feedback alone are already icing on the cake, the product launch of the YellowScan Voyager was the real party piece of the event. The Voyager is the highest range system in YellowScan’s portfolio and is developed to be used onboard either UAVs or crewed aircraft. The laser scanner’s specs can be personalized to fit all sorts of different project and platform needs, and its launch will certainly contribute to the massive 20% market increase that YellowScan has enjoyed over the past couple of years. ranges up to 2500 m, accuracy apps
the condition of forests using multispectral data and Lidar, making it possible to evaluate the tree canopy and create indices to help monitor vegetation health.


THE PROCESS OF MAPPING AN ICONIC STRUCTURE
Creating a 3D Model of the Famous Budapest Chain Bridge
| INTERNATIONAL | ISSUE 5 202240 One of the most iconic structures in Budapest, Hungary has to be the Széchenyi Chain Bridge. It spans the River Danube between Buda and Pest, connecting the eastern and western halves of the city. Originally built in 1849, the chain bridge is at the heart of Budapest, with the Parliament buildings nearby as well as the Two Hungarian companies designed a three-step data collection workflow to overcome the challenges in this urban surveying project, which included the use of UAVs and remote-controlled boats for Lidar and photogrammetry data. The result: a digital 3D BIM-compatible model of Budapest’s iconic bridge over the River Danube to assist in preparations for restoration and renovation work.
Hungarian Academy of Sciences. Upcoming maintenance work intends to expand the capacity of the bridge for cycle and pedestrian tourism so that more people can use the crossing. It is also being rebuilt with lighter materials. The bridge had been bombed in World War Two and rebuilt with concrete at the time, which made it age more quickly and also made it heavier. Maintaining the original style of the bridge, complete with beautiful cast-iron designs, is important to preserve the heritage of this model but the restored version will be lighter and more durable. A 3D model is required to create an original record of the bridge and assist in measurements for preparing for restoration and renovation work.
The Széchenyi Chain Bridge in Budapest is facing complicated restoration work.

SAFETY AND SECURITY ASPECTS OF UAV-BASED CITY MAPPING
The location of the bridge in the centre of Budapest makes it a difficult area to survey. Firstly, drone use in urban areas is generally subject to various restrictions worldwide due to potential disruption for people or distraction of traffic. Secondly, as this bridge is close to the office of the Hungarian Prime Minister as well as other government buildings, there are even stricter regulations for UAV use. VentusTech had to have special permission from the Hungarian aviation authorities, and was given specific rules that included not flying closer than 100 metres to the balcony of the Prime Minister’s office. Once they had gained authorization to fly drones in the centre of Budapest, the team set to work. They also had access to a bathymetric survey to analyse the riverbed directly underneath the bridge. With this, they were able to reconstruct the terrain underwater as well – and even discovered unexpected factors, such as a car that had previously crashed into the water there.
The chain bridge is over the River Danube, which is of course an active waterway with changing water levels. Ventus-Tech needed to gather data about the channel, the riverbanks and the bridge itself to create a comprehensive 3D model. Ventus-Tech has its own GPS and GNSS systems that it would use to get accurate geolocational data about the sites. For data collection, the two companies agreed on a multi-faceted data collection 1.workflow:Theywould use both drones and remotecontrolled boats to gather data from above and below the bridge. 2. The drones and boats would carry both Lidar sensors and cameras to gather photogrammetry and Lidar data in separate 3.flights.Post-processed kinematic (PPK) processing would be used to compensate for lack of ground control points (GCPs) around hard-to-access areas to reduce blank spots beneath the bridge. Data collection was not simple though, as the team faced multiple challenges in this
The bridge was carefully scanned with sensors mounted both on UAVs and remote-controlled boats.
The bathymetric survey of the Danube was combined with photogrammetry and Lidar data.
3D MODELLING OF AN ICONIC BRIDGE IN THREE STEPS
CASE STUDY 41ISSUE 5 2022 | INTERNATIONAL |
REQUIREMENTS FOR SUCCESSFUL DATA COLLECTION FOR PHOTOGRAMMETRY Data collection with drones for photogrammetry requires overlap between images, and ideally also requires certain lighting conditions for optimal results. The team had to work fast because construction crews were already starting to set up scaffolding on the underside of the bridge. They collected nadir imagery with the drone as well as photos with a 30 0 tilt oblique. The DATA COLLECTION, POST PROCESSING AND DATA MANAGEMENT
A project of this scale and size entails multiple contractors. The two specialists who worked on creating a 3D model are Bimfra and Ventus-Tech. Both Hungarian companies are specialized in assisting design, construction and maintenance work. In a collaborative effort, they shared ideas for workflows that could enable them to gather both photogrammetry and Lidar data of the bridge as well as riverbed and riverbank details. They split the work between them: VentusTech managed data collection, post processing and on-site activities, whilst Bimfra was in charge of data management and 3D modelling. They used a combination of unmanned aerial vehicles (UAVs or ‘drones’) and remote-controlled boats to collect data from every angle of the bridge, working to a tight schedule to complete data collection prior to scaffolding being mounted around the bridge. Both companies were operating on a pro bono basis, committed to the effort by their appreciation of the bridge and recognition that a 3D BIM-compatible model made with photogrammetry could be a valuable deliverable.
urban surveying project, but the greatest was orchestrating and coordinating the multiple surveying methods involved. After the data was collected it would be shared with Bimfra to initiate the building information modelling (BIM) workflows. Ventus-Tech needed to be able to collect all the data without errors in one visit, and ensure it could be merged on various processing platforms including Pix4Dmapper.


3D MODEL OF THE BUDAPEST CHAIN BRIDGE
cameras and sensors on the boat had 45 0 and 60 0 tilts to make sure they could get the best result from the underside of the bridge. The flight with the drone was automated, but due to the high water traffic on the River Danube as well as the high tide pushing the boats off course, the boat was piloted without any automation. The boat first did a sweep of the north side of the bridge and then the southern side to make sure that both sides of the structure were captured in equal Tdetail.heexperience of both Bimfra and VentusTech was a big asset that contributed to the success of this project. The Ventus-Tech team knew that they would face challenges getting authorization to fly as well as maintaining geolocational accuracy. Between the two of them, they were able to accommodate for this in multiple areas, including the GPS reception. During the data collection for the boat, the team had two GPS receivers. They geolocated the camera with one receiver and used the other to compensate that data. When they found errors for geolocation during processing, they used both values as well as dead-reckoning to deal with the signal being blocked under the bridge, enabling the team to minimize issues with accuracy.
ground sample distance (GSD) of the project was around 1 centimetre per pixel, providing a high level of detail. This means that the intricate detailing on structures on the bridge can easily be revisited on the 3D model. Thanks to using PPK processing, the accuracy of the project was consolidated after processing. This helped to save time on-site because of the threat of scaffolding obstructing data collection. Bimfra then used BIM software to generate highly detailed results that can be used for structural engineering. Through their coordination, Bimfra and Ventus-Tech were able to accomplish a successful BIM workflow by analysing the requirements early on and capturing the data with the required level of detail so they could manage it in a common data environment. The team had to deal with multiple challenges for this project, and had only 30 days of authorization in which they could complete the flights. Working with drones in urban areas is not easy, but the team were able to get their desired results with accuracy they could trust thanks to processing with specialized photogrammetry software. Now, Bimfra and Ventus-Tech have a digital 3D BIM-compatible model of the Budapest Chain Bridge that will be used by construction and restoration teams in the planned maintenance work.
| INTERNATIONAL | ISSUE 5 202242
After data was captured, the images were processed in Pix4Dmapper. The overall The remote-controlled boats were easy to deploy as a mapping tool. The final model in Pix4Dmapper turned out to be a perfect replica of the real bridge.


Benefits of this CORS network: Make high precision GNSS service widespread and more economical Boost the development of IoT, national positioning infrastructure and UAVs, precision agriculture Speed up the application of 5G autonomous driving ComNav incorporated telecom providers to build the world’s largest CORS network with 4400 stations ComNav incorporated telecom providers to build the world’s largest CORS network with 4400 stations ComNav incorporated telecom providers to build the world’s largest CORS network with 4400 stations


Meet us at UAV Expo Las Vegas 2022! Booth September208 6-8, 2022 Caesars Forum, Las Vegas, NV, USA asVersatilityitsfinest. A new LiDAR is born The YellowScan Explorer can be mounted on a light manned aircraft or switched to different types of UAV platforms. Combined with 1-year unlimited technical support and training, our users will be ready to take full advantage of Explorer’s functionality and successfully complete their surveying projects.


