Beyond either/or: integrating hydrographic technologies for a data-driven future A plea for a paradigm shift
Making subsea history by locating Endurance
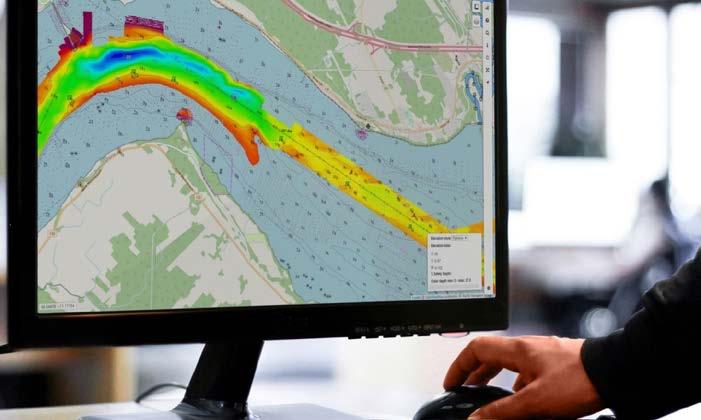
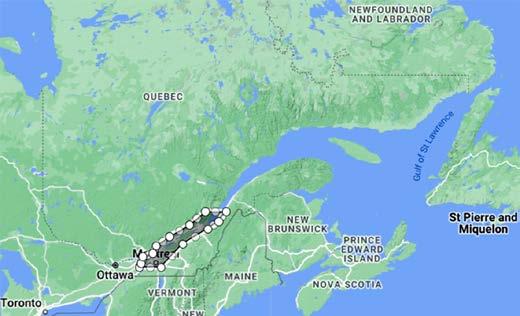
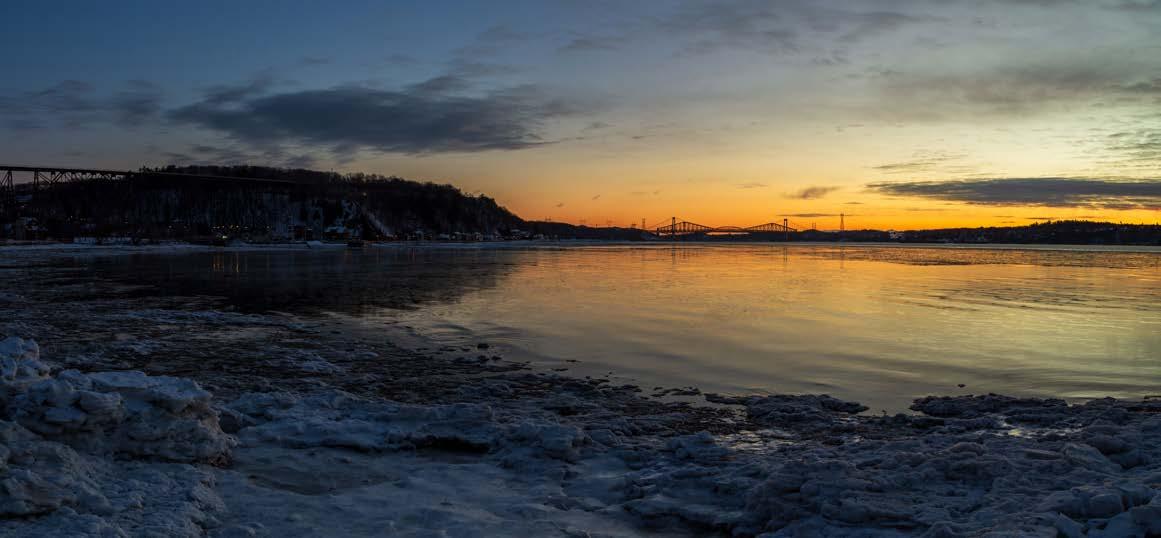
Autonomous bathymetric survey of the UK Atlantic S-100 sea trials in the St Lawrence River
Director Strategy & Business Development
Durk Haarsma
Financial Director Meine van der Bijl
Editorial Board Huibert-Jan Lekkerkerk, Mark Pronk, BSc, Marck Smit, Auke van der Werf
Head of Content Wim van Wegen
Copy Editor Serena Lyon
Marketing Advisors Myrthe van der Schuit, Peter Tapken, Sandro Steunebrink
Circulation Manager Adrian Holland
Design Persmanager, The Hague
Hydro International is an independent international magazine published by Geomares. The magazine and related e-newsletter inform worldwide professional, industrial and governmental readers of the latest news and developments in the hydrographic, surveying, marine cartographic and geomatics world. Hydro International encompasses all aspects, activities and equipment related to the acquisition, processing, presentation, control and management of hydrographic and surveyingrelated activities.
Subscriptions
Hydro International is available on a subscription basis. You can subscribe at any time via https://www.hydro-international.com/ subscribe. Subscriptions will be automatically renewed upon expiry, unless Geomares receives written notification of cancellation at least 60 days before the expiry date.
Advertisements
Information about advertising and deadlines are available in the Media Planner. For more information please contact our marketing advisor (myrthe.van.der.schuit@geomares.nl) or go to www.geomares-marketing.com.
Editorial Contributions
All material submitted to the publisher (Geomares) and relating to Hydro International will be treated as unconditionally assigned for publication under copyright subject to the Editor’s unrestricted right to edit and offer editorial comment. Geomares assumes no responsibility for unsolicited material or for the accuracy of information thus received. In addition, Geomares assumes no obligation for return postage of material if not explicitly requested. Contributions must be sent to the head of content wim.van.wegen@geomares.nl.
Almost 100 years after the burial of famed British polar explorer Ernest Shackleton, his legendary ship Endurance was finally located at the bottom of the Weddell Sea in Antarctica. In this interview, Nico Vincent talks about the challenges involved in surveying at more than 3,000m depth.
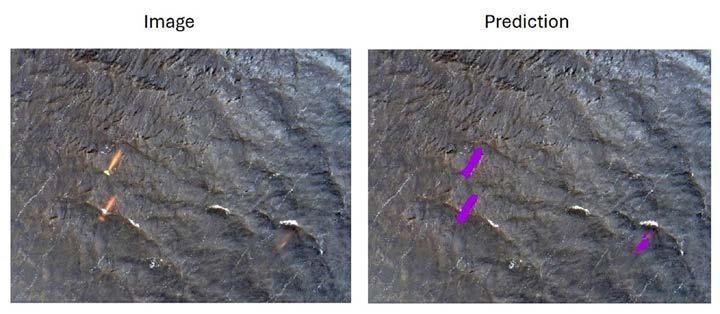
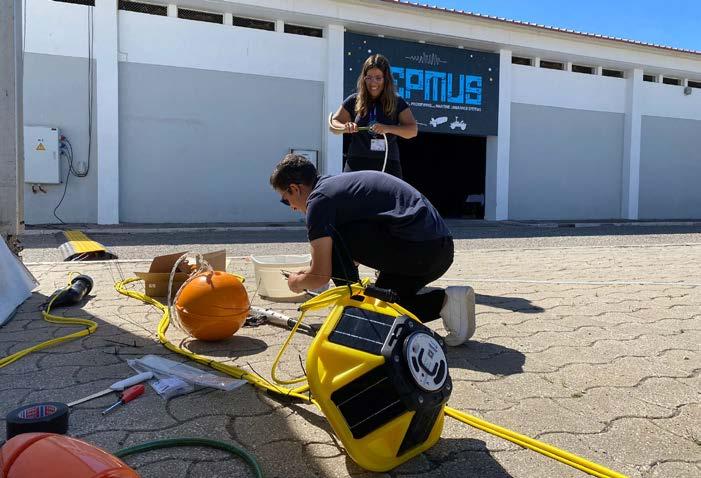
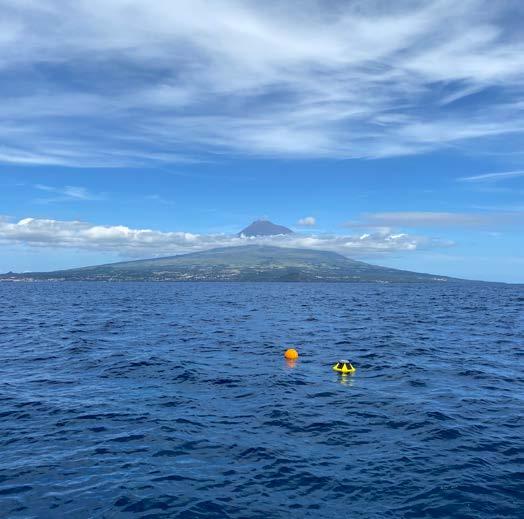
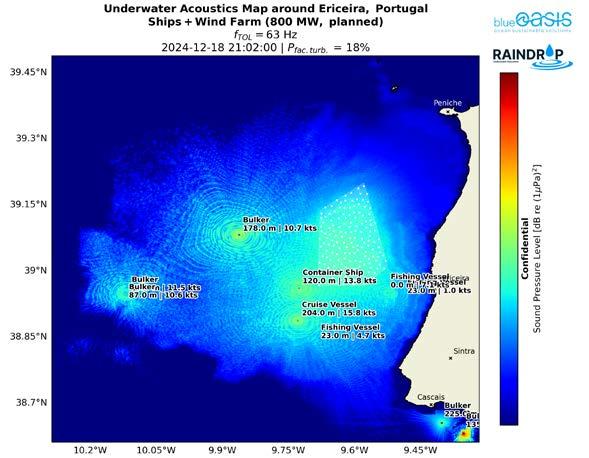
Underwater acoustic technology has long been a key tool in the hydrospatial industry. However, the growing power of computing and diverse data streams are creating new survey capabilities. Portuguese startup blueOASIS is leveraging this in passive acoustic monitoring (PAM).
Ensuring safe maritime navigation is costly. UKHO charts millions of square kilometers, including busy shipping lanes. To optimize this process, XOCEAN was chosen to provide reliable hydrographic survey data using USVs. The data collected exceeded the rigorous IHO Order 1a standards.
The IHO plans a phased rollout of S-100 navigational information starting 1 January 2026. In preparation, the Canadian Hydrographic Service, Canadian Coast Guard, Teledyne Geospatial, and PRIMAR have teamed up to provide data services for S-100 route monitoring.
The future of hydrography lies in intelligent integration, seamlessly combining diverse technologies for maximum efficiency and cost-effectiveness This article argues for a paradigm shift: moving to a holistic, vertically integrated model that leverages the unique strengths of each technology.
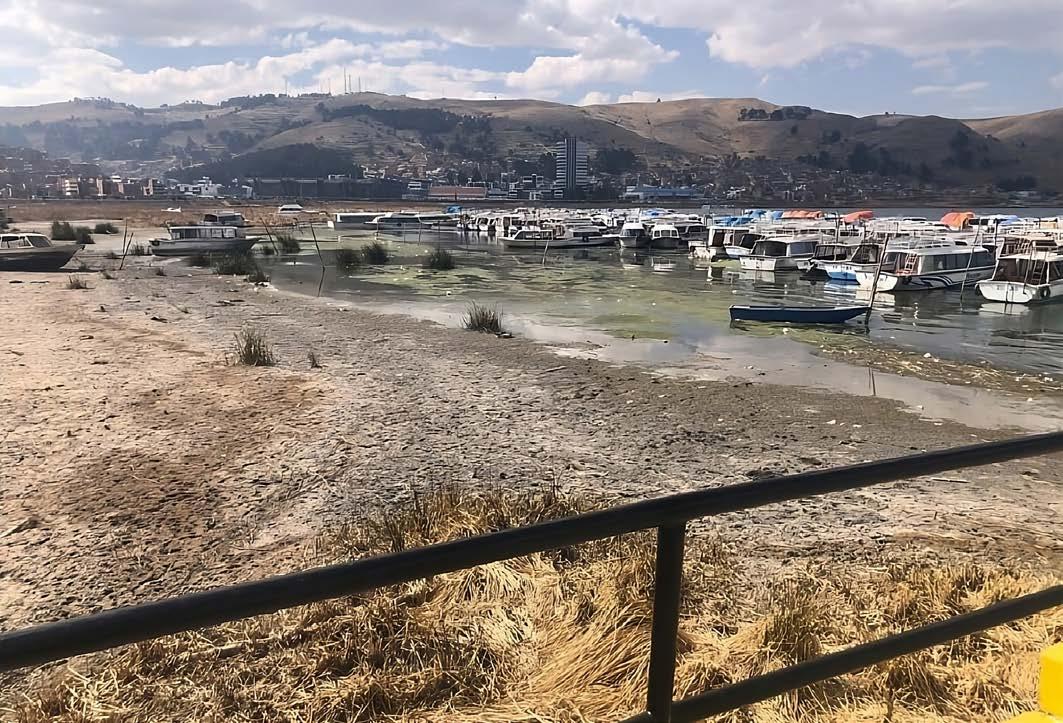
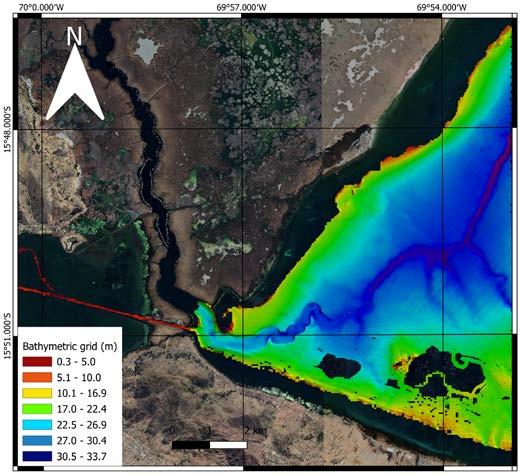
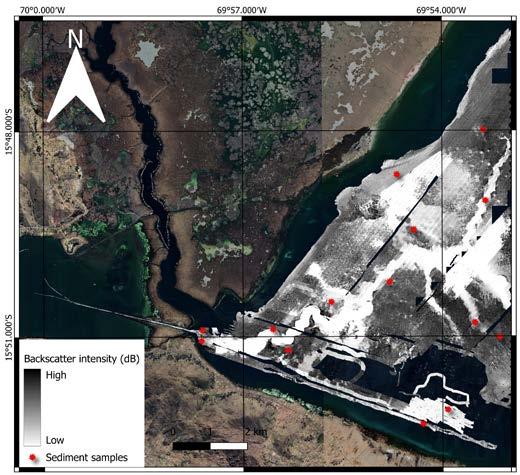
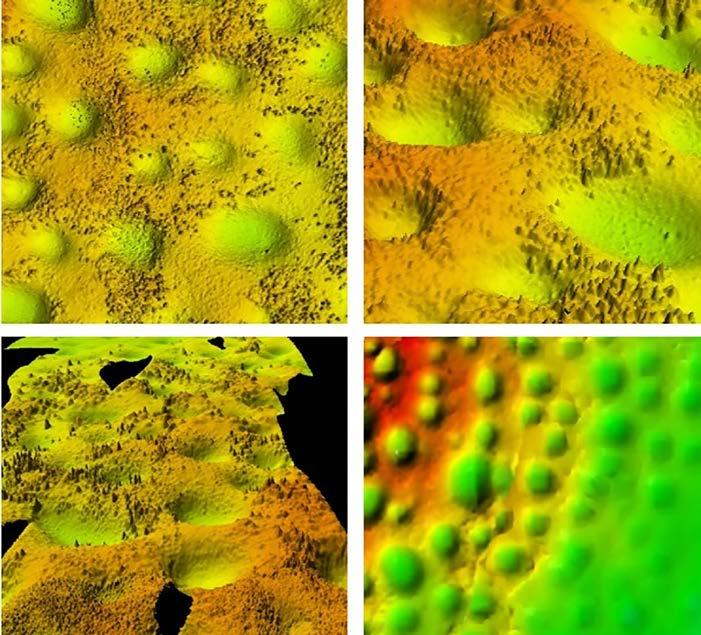
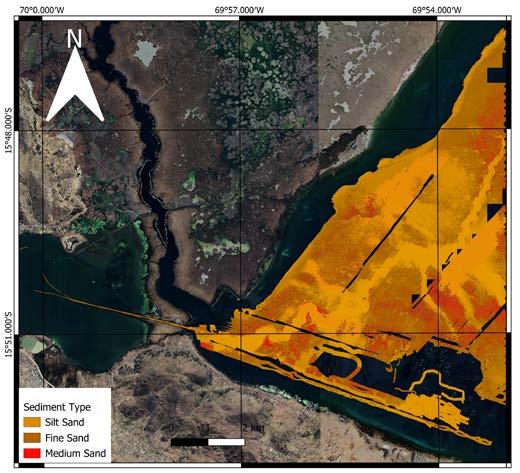
In October 2024, officers from the Category “A” Specialization Programme in Hydrography for Naval Officers of the Peruvian Navy conducted their complex multidisciplinary field project at Lake Titicaca, which is the highest navigable lake in the world (3,800 metres above sea level).
The application of GeoAI to the marine environment may be less apparent than its use on land, but the basic functions of GeoAI can certainly be applied to the marine domain, both above and below the water. These functions can be utilized across a wide spectrum of marinerelated activities.
The rise of AI solutions, especially in the offshore industry, does not mean our work is done. The key question is not whether AI can replace us, but how we can leverage it to make smarter, more informed choices. After all, AI is not magic, but understanding what we want it to achieve is.
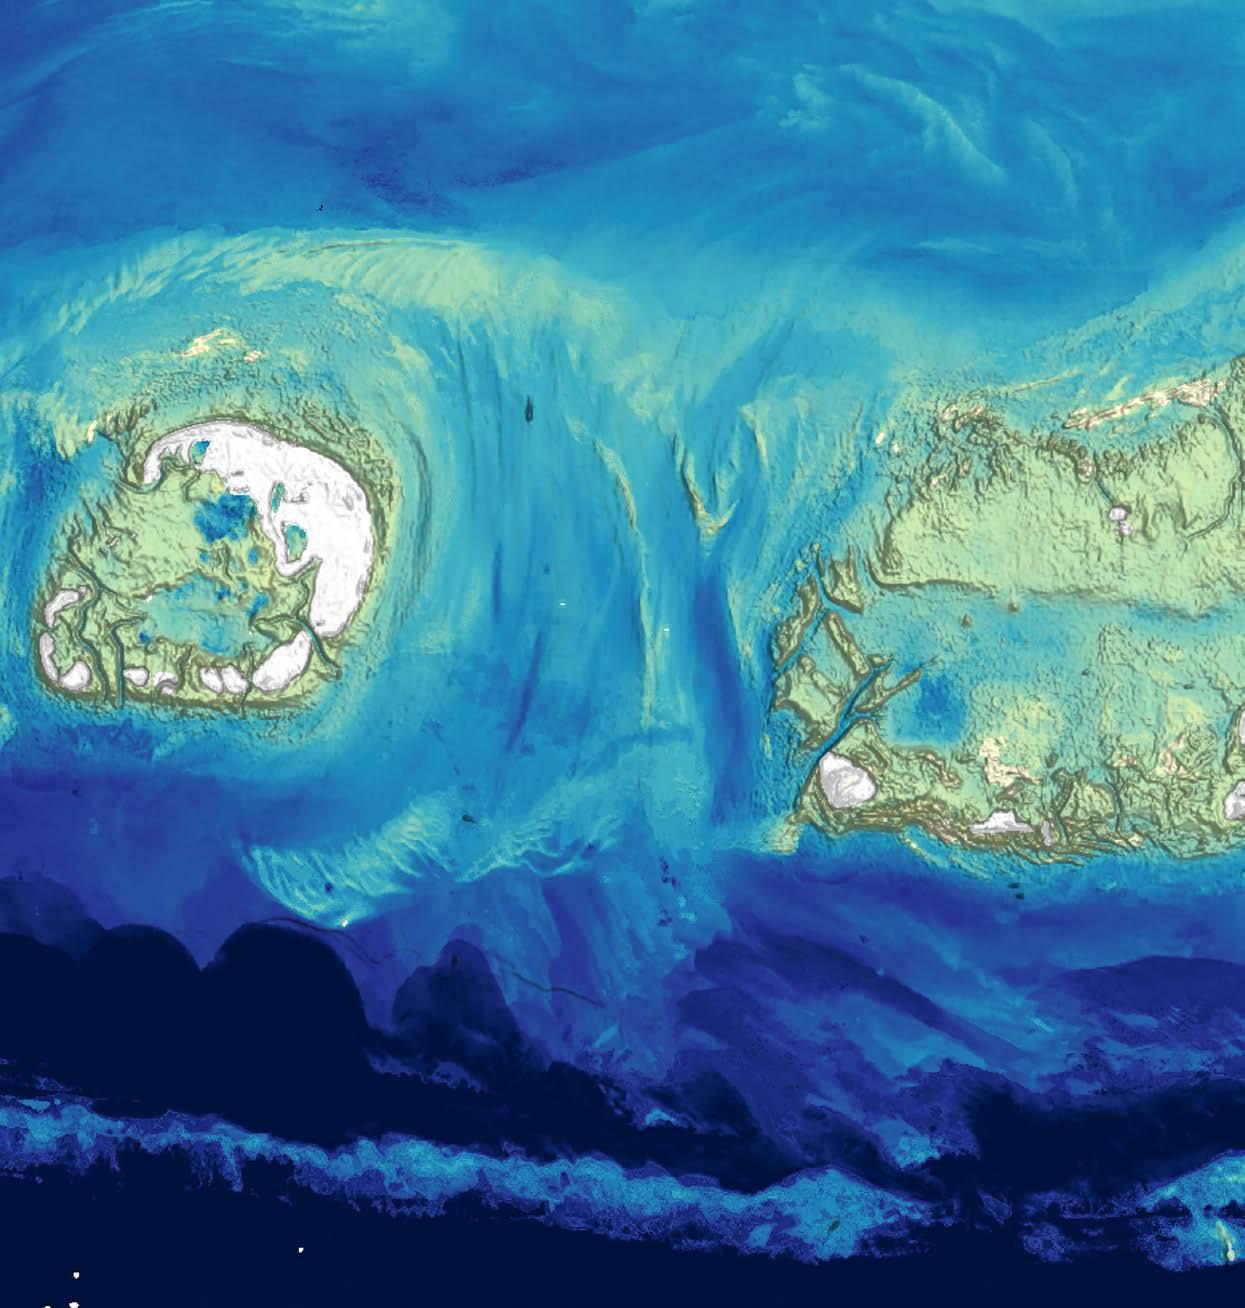
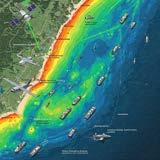
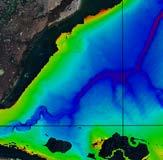
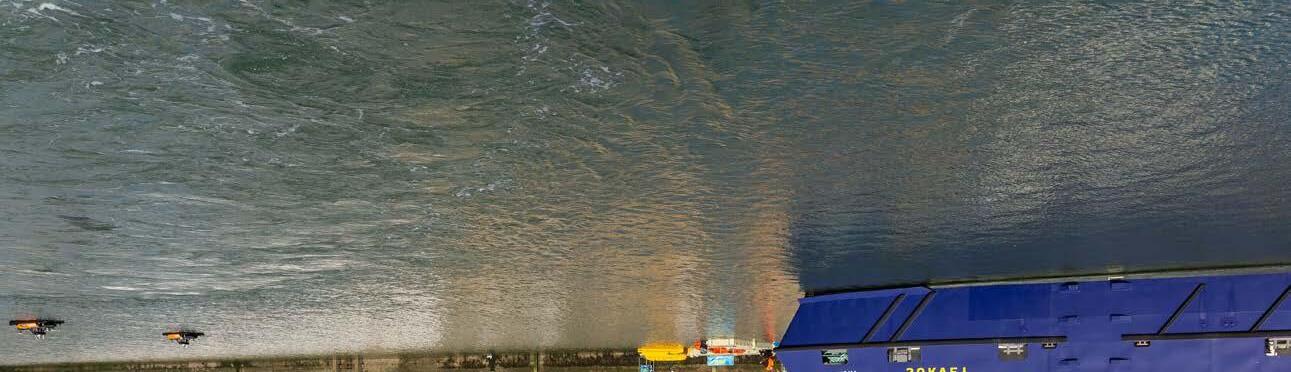
Satellite-based mapping and analysis hold immense promise for government hydrographers, intelligence agencies, and organizations involved in maritime navigational safety, updating bathymetric information, and coastal development planning, to name a few applications. On the front cover of this issue, a depth map of the Florida Keys uses LADSAT data acquired in February 2024. (Image courtesy: NASA Earth Observatory)
Highs and depths
The term ‘digital twin’ has gained significant popularity in recent years, becoming a buzzword in various industries, particularly in the context of emerging technologies and innovations. Hypes come and go, but every hydrographer has come to the realization that the hype is over and the virtual (underwater) world is an important extension of the physical one.
Digital twins are an important cornerstone of hydrography. By integrating and making sense of a huge range of ocean science data (historical and real-time), they are enhancing the world’s understanding of the ocean.
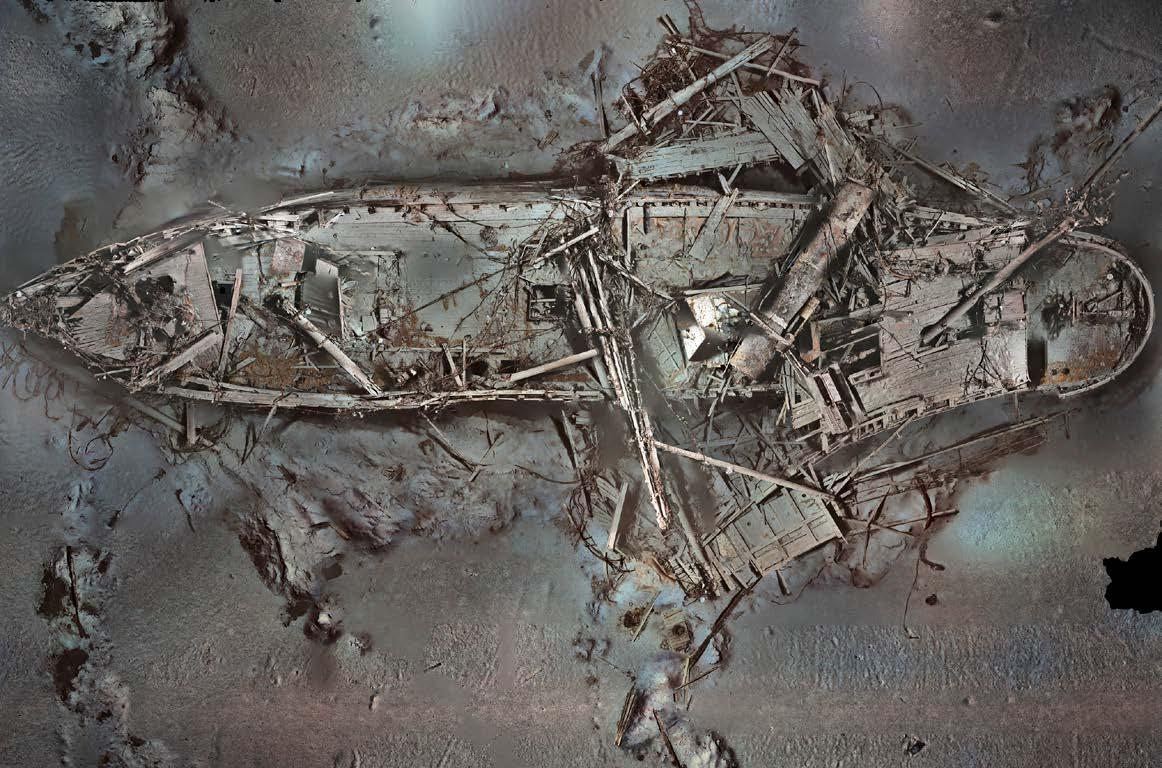
Scanning shipwrecks also results in digital twins. These virtual replicas will inform researchers about how to better preserve the other hundreds of thousands of deep-sea shipwrecks around the world, from ancient wooden ships to World War II vessels. After more than 100 years hidden in the icy waters of Antarctica, Sir Ernest Shackleton’s ship Endurance has been revealed in extraordinary 3D detail. For the first time, we can see the vessel – which sank in 1915 and lies 3,000m down at the bottom of the Weddell Sea – as if the murky water had been drained away. The digital scan, which is created from 25,000 highresolution images, was captured when the ship was found in 2022. This edition of Hydro International contains an exclusive interview with Nicolas Vincent, deputy expedition leader and subsea project manager of the Endurance22 expedition. Now if that doesn’t spark the imagination, I don’t know what will!
Hydrographic professionals are quite literally exploring the deepest depths – and, perhaps somewhat surprisingly, reaching new heights! – as the recent Lake Titicaca survey reveals. Officers from the Category “A”
Specialization Programme in Hydrography for Naval Officers of the Peruvian Navy carried out a complex multidisciplinary field project at Lake Titicaca in Peru – the world’s highest navigable lake at 3,800 metres above sea level. This project at a fascinating location is also the subject of one of the articles in this issue. Employing an optimized methodology that harnesses cutting-edge multibeam technology – and placing special emphasis on derived backscatter data – this approach uncovered depths far greater than previously recorded. It demonstrates how this technique can provide a more precise and detailed view of the study area’s seabed, offering new insights into what was previously uncharted underwater terrain.
Hydrographic surveying can be done from vessels equipped with underwater, surface, aerial or even space-based devices. For too long, the conversation has focused on comparing technologies –multibeam vs. Lidar, Lidar vs. satellite, and so on. This ‘either/or’ mindset is outdated, as Kyle Goodrich pleads in this issue. Each method, whether it uses sound, light or reflectance, has its limitations when measuring a complex environment. Instead of pitting one technology against another, we should adopt a ‘both/and’ approach. The future of hydrography is in smart integration, combining different technologies to achieve better efficiency, cost effectiveness and environmental responsibility. Goodrich argues for moving from siloed methods to a holistic, vertically integrated model that maximizes the strengths of each technology.
Maximizing the strength of hydrography is one of the reasons Hydro International exists, and we hope that everyone appreciates this and subscribes to our weekly newsletter, our magazine and our LinkedIn groups (the channels Hydro International and Hydrography both belong to us).
Wim van Wegen Head of content, Hydro International wim.van.wegen@geomares.nl
TCarta launches SDB solution to enhance nautical charts in shallow waters
Shallow coastal zones, where ship groundings are most common, often contain the least accurate and most outdated data on official nautical charts. To bridge this gap, TCarta, a leader in hydrospatial mapping, has launched a new line of satellite reconnaissance charts designed to complement official marine navigation maps in these challenging waters. The new chart products were unveiled to the hydrographic community on 25 February at the 2025 Esri Federal GIS Conference in Washington, DC. Derived from recently acquired satellite imagery, TCarta satellite reconnaissance charts are digital maps adhering to International Hydrographic Organization S-57 and S-100 data model standards with the same appearance and symbology as official navigation aids. However, the TCarta charts do not replace official nautical map products, which are primarily designed for marine navigation in commercial shipping lanes. The new TCarta satellite reconnaissance charts contain upto-date details of seafloor depths, sandbars, reefs, shoals and other submerged hazards – along with floating dangers – in the nearshore environments that are often poorly mapped or out of date on official maritime charts. Offered at off-the-shelf 1:20,000 scale and custom 1:4,000 scale, the TCarta products are delivered in file formats ready to load into popular marine navigation software as well as common GIS software platforms.
Key step forward in smart navigation with S-100 standards
TCarta has introduced a new line of satellite reconnaissance charts to supplement official marine navigation maps in shallow waters. (Image courtesy: TCarta)
Dutch water management and infrastructure agency enters USV partnership with Demcon
In a significant development for digital navigation, the IHO Member States have officially adopted the first operational standards under the S-100 framework. This decision marks a major milestone, allowing coastal states to produce official products and services aligned with these standards, driving the evolution of maritime navigation. The adoption of these standards also carries important implications for ocean data collection and sea surveys. To fully leverage the potential of these new products, enhanced data will be essential, paving the way for more accurate and comprehensive mapping of the seas. This shift represents a crucial advancement in the global maritime landscape. “The availability of operational versions of these standards represents the real starting point for coastal states to embark on the journey to produce official S-100 products,” stated John Nyberg, director of the technical programme at the IHO. The S-100 framework represents a transformative leap forward by enabling the seamless integration of diverse datasets within a single ECDIS. This will allow mariners to overlay various data layers –such as ENCs, detailed depth information and dynamic data on water levels and currents – greatly enhancing situational awareness and decision-making.
The S-100 framework allows users to integrate navigation data with dynamic information on depth, water levels, currents, weather and more, all within a single system. (Image courtesy: NOAA)
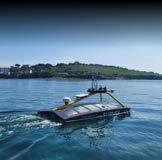
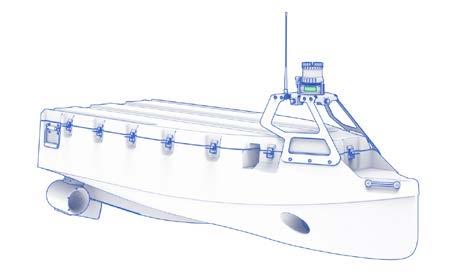
Rijkswaterstaat, the directorate-general responsible for public works and water management in the Netherlands, is introducing a new uncrewed surface vessel (USV) for hydrographic measurement tasks. The organization has entered a four-year partnership with Demcon Unmanned Systems to acquire its first USV with autonomous navigation functionality. Less than two metres long, this compact, high-tech vessel is designed for use on inland waters. Developed in the Netherlands and now in serial production, the USV is expected to be delivered later this year. Once in place, Rijkswaterstaat will begin process integration, training and maintenance. Rijkswaterstaat chose to partner with Demcon Unmanned Systems due to the stringent demands for the design and the strict standards for system security, sustainability and cybersecurity. The fully electric USV also stood out with its patented dynamic positioning system with a shaft- and rudderless drive and the use of a robust, environmentally friendly and recyclable HDPE hull. Lastly, the fact that Demcon – as a Dutch leader in the field of innovative maritime automation and electric, autonomous, unmanned vessels – can offer support, service and maintenance locally was also seen as a plus.
Developed in the Netherlands, the new USV is set to enter serial production. Rijkswaterstaat plans to deploy the USV for hydrographic measurements, with delivery expected later in 2025. (Image courtesy: Demcon Unmanned Systems)
Leica CoastalMapper opens up new airborne bathymetric mapping possibilities
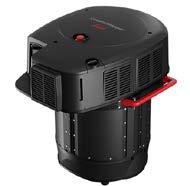
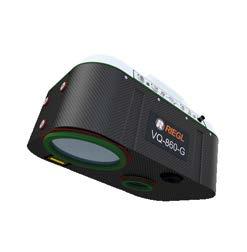
Leica Geosystems has unveiled the Leica CoastalMapper. According to the manufacturer, the new airborne bathymetric Lidar solution increases coastline and river survey efficiency by 250% compared to previous sensor generations, thanks to a wider field of view and the ability to be flown at higher altitudes. As airborne Lidar bathymetry continues to advance, it is poised to become an essential tool for hydrographic surveyors, attracting significant interest within the industry. The CoastalMapper represents an advanced approach to airborne hydrographic mapping, supporting a multitude of applications. “We aim to empower our community with tools that meet current needs, anticipate future challenges and push the boundaries of bathymetric mapping,” stated Anders Ekelund, vice president of airborne bathymetric Lidar at Leica Geosystems. “We’re beyond pleased to offer our customers this radically enhanced system for more detailed and efficient surveys. Powering easier yet more comprehensive data analysis and supporting a broad range of bathymetric applications, the CoastalMapper opens mapping possibilities that were hard to achieve before.” The CoastalMapper integrates a high-performance bathymetric Lidar module with a Leica TerrainMapper-3 topographic Lidar and imaging sensor in a compact, lightweight sensor head. It captures up to one million bathymetric and two million topographic data points per second, while providing RGB imagery at a 5cm ground sampling distance (GSD) and NIR at a 7cm GSD. Covering up to 360km² per hour, the system enables efficient, high-resolution data collection.
The CoastalMapper integrates a high-performance bathymetric Lidar module with the Leica TerrainMapper-3. (Image courtesy: Leica Geosystems/Hexagon)
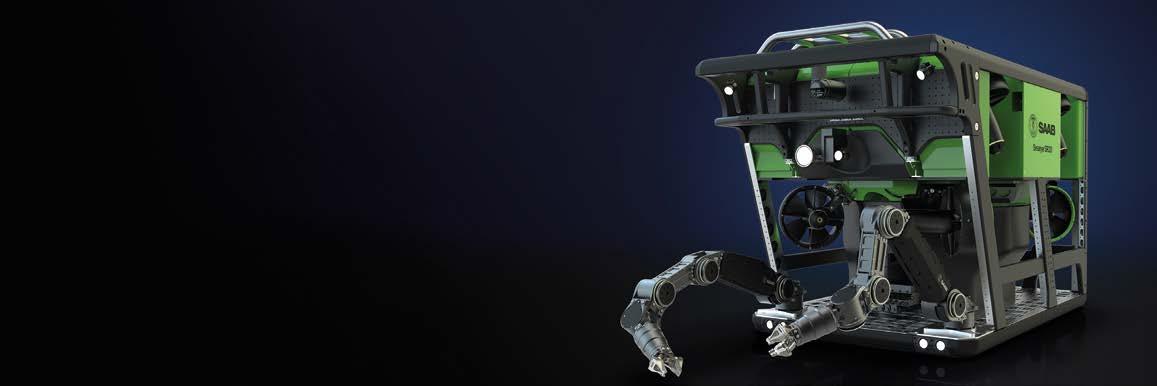
Kystdesign signs ROV contract with NIOZ
Fugro strengthens capabilities with EOMAP acquisition
Fugro has announced the acquisition of EOMAP, a market leader in the satellite-based mapping and monitoring of marine and freshwater environments. By integrating Earth observation (EO) technology into its existing mapping solutions, Fugro is making a significant move in its strategy to expand within the water sector.Over the years, EOMAP has been a valued partner in numerous Fugro projects focused on climate and environmental adaptation. These include the ISPRA Seagrass Coastal Restoration project, in which Fugro mapped the entire Italian coastline. More recently, the two companies collaborated on the COASTS project, which advances the integration of coastal data and blue carbon ecosystem modelling, with pilot initiatives in Europe and the Maldives. Since its founding in 2006, EOMAP has been a pioneer in EO technology, setting new standards with its patented algorithms. The market for EO solutions is expanding rapidly, driven by stricter environmental regulations, the urgency of addressing climate change and growing awareness of the vital role that marine ecosystems play in our planet’s health. With this acquisition, Fugro – one of the world’s leading geodata specialists – further enhances its extensive portfolio of mapping, modelling and monitoring solutions. “This acquisition is a big step forward, enhancing our capabilities in the water market and allowing us to better serve our clients with satellite EO technology. We welcome the EOMAP team to Fugro,” stated Robert Hoddenbach, Fugro’s global director Climate & Nature.
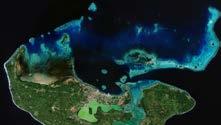
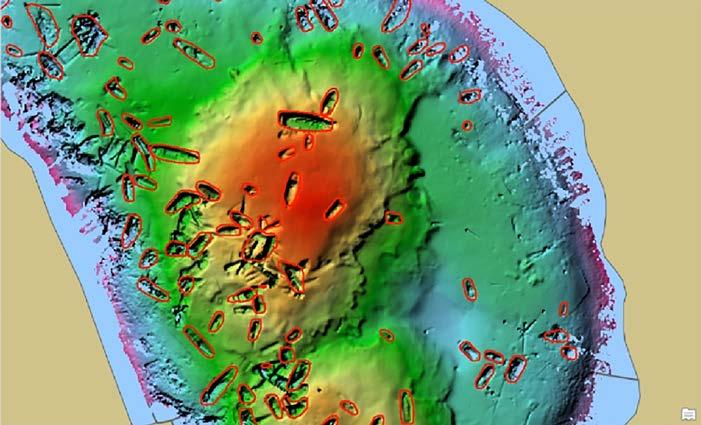
Satellite-derived bathymetry imagery of the Tonga archipelago in very high resolution. (Image courtesy: EOMAP)
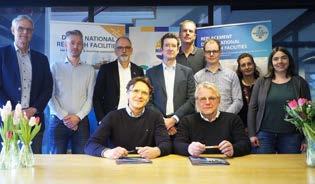
Kystdesign, the Norwegian manufacturer of custom ROVs and components, has signed a contract with the Royal Netherlands Institute for Sea Research (NIOZ) for the construction of the advanced remotely operated vehicle (ROV) Supporter 6000. The agreement was finalized this week by NIOZ director Han Dolman and Kystdesign director Tore Nedland. Scheduled for delivery in June 2026, the Supporter 6000 will serve the entire Dutch marine research community. Designed for ultra-deepwater operations, the Supporter 6000 can reach depths of up to 6,000 metres – combined with exceptional flexibility and advanced capabilities. It features six high-resolution cameras and 41 electrical connectors for integrating external equipment such as tooling, survey sensors and additional cameras. The system also includes 24 proportionally controlled hydraulic functions. Additionally, the ROV control system supports a range of automated functions, including AutoPOS and AutoTRACK, and enables over-the-horizon control from a remote operations centre onshore. “We currently don’t have anything like it available for the Dutch scientific community,” explained Gert-Jan Reichart, head of the NIOZ Ocean Systems department. “The robot is equipped to take over the work of humans at great water depths. With its six high-resolution cameras and strong gripping arms, it forms our eyes and arms underwater. One of these arms can rotate along seven different axes: that’s more than a human arm can move.”
The project team at the contract signing ceremony for the construction of the underwater robot, held at NIOZ. (Image courtesy: NIOZ)
The headlines section features a selection of recent news articles published on our website (hydrointernational.com). Each entry presents a snippet of the full article, which can be accessed via the QR codes – an easy and worthwhile way to explore more context and background information.
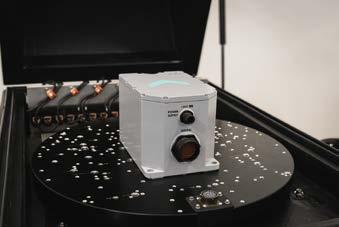
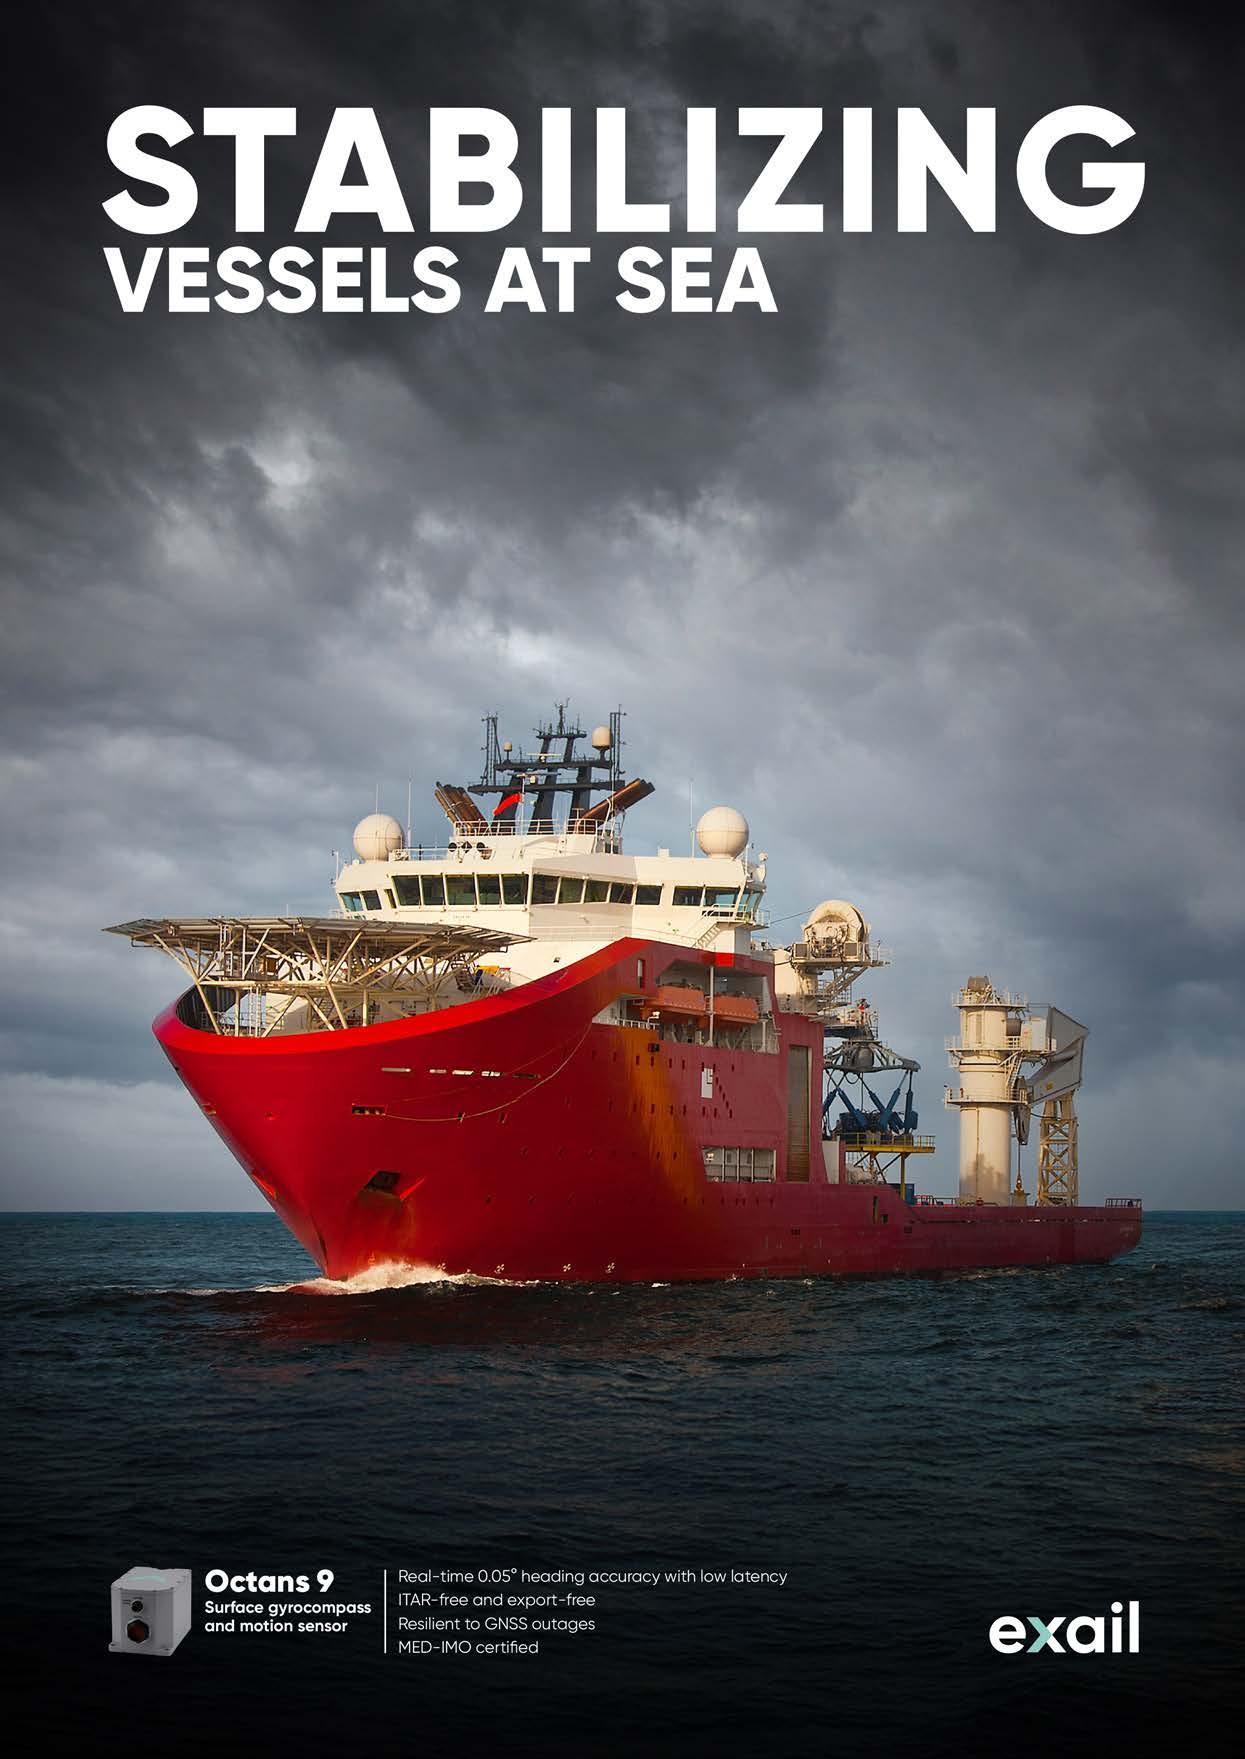
Exail introduces Octans 9 gyrocompass for marine precision
Exail’s Octans 9 Attitude and Heading Reference System (AHRS). (Image courtesy: Exail)
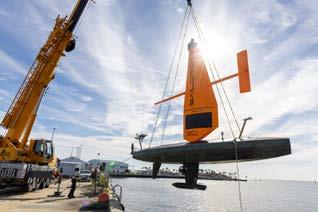
Saildrone embarks on first ocean mapping survey of Florida’s coastal waters
Exail has launched its new Octans 9 Attitude and Heading Reference System (AHRS), the latest addition to its range of navigation solutions. Building on the proven success of previous generations, Octans 9 delivers several upgrades to enhance operational performance across applications, such as dynamic positioning, vessel navigation and offshore platform stabilization. Leveraging Exail’s Fiber Optic Gyroscope (FOG) technology, Octans 9 offers precise measurements with a heading accuracy of 0.1° secant latitude and a heave measurement accuracy of 5%. The system is designed to remain resilient during GNSS outages, ensuring uninterrupted operations even in challenging conditions. The latest model introduces a range of improvements, including a more robust and compact design that is 25% smaller than the previous generation, as well as lower power consumption at just 12W. It features an upgraded user interface, which simplifies integration into existing systems, and benefits from an exportfree status that streamlines international distribution and export processes. Additionally, it incorporates advanced filtering and alignment-in-motion capabilities, ensuring precise stabilization for high-speed vessels and dynamic applications.
Saildrone is launching two ten-metre Saildrone Voyager uncrewed surface vehicles (USVs) from its St. Petersburg, FL facility, beginning a mapping mission as part of the Florida Seafloor Mapping Initiative (FSMI). This multi-year effort is focused on providing stakeholders across the state with accessible, high-resolution seafloor data of Florida’s coastal waters within the continental shelf. At 2,170 kilometres long, Florida’s coastline is second only to Alaska’s among US states. Many parts of the Florida coast remain unsurveyed, with existing nautical charts relying on outdated and low-resolution data. The goal of the Florida Department of Environmental Protection (FDEP) initiative is to provide updated mapping data of coastal systems, which is critical for protecting offshore infrastructure, habitat mapping, restoration projects, emergency response, coastal resilience and hazard studies for the state’s citizens. “Saildrone is proud to support the Florida Seafloor Mapping Initiative with our unique and innovative Voyager USVs. As a member of the St. Petersburg community, we are excited to contribute to a project that seeks to improve our coastal resilience and enhance our ability to predict storm surge impacts by providing high-resolution bathymetry,” said Brian Connon, Saildrone vice president ocean mapping. “Saildrone USVs efficiently and safely collect high-resolution bathymetric data while minimizing environmental impact.”
Saildrone is dispatching two ten-metre Saildrone Voyager uncrewed surface vehicles (USVs) from its St. Petersburg, FL facility, marking the start of a coastal mapping mission. (Image courtesy: Saildrone)
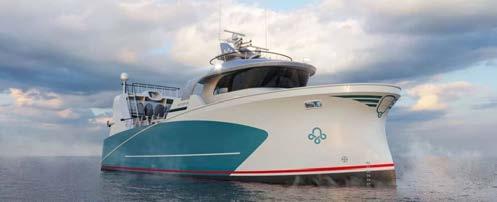
Project Octopus: a multifunctional vision for sustainable seas
The fishing sector in many parts of the world is facing challenging times, with declining catches and a dimming outlook for the future. Uncertainty is stalling innovation and making it difficult for cutter fishermen to secure financing for much-needed investments. However, amidst these hurdles, fisherman Jacob Brands is charting a new course with ‘Project Octopus’ – an innovative initiative that aims to transform the fishing industry in the Netherlands but that also holds promise for marine researchers such as hydrographers. By integrating advanced technology and innovative approaches, Project Octopus could serve as a valuable platform for exploring underwater environments, conducting detailed underwater mapping and fostering collaboration between fishermen and the scientific community. Project Octopus is centred around an innovative cutter vessel designed to be both sustainable and versatile. The 32-metre ship will be capable of transitioning from a fishing boat to a research vessel within days, paving the way for experimentation and innovation in sustainable fishing practices. By integrating in-depth knowledge of the sea with leading-edge techniques and data, this vessel promises smarter and more adaptive operations, such as tailoring catches to meet real-time market demand.
Brazilian Navy conducts high-resolution survey of historic shipwreck
In a significant hydrographic and archaeological achievement, the Brazilian Navy has obtained the first bathymetric data of the wreck of the former auxiliary vessel Vital de Oliveira, which was torpedoed by the German submarine U-861 in 1944. The discovery, made in the year marking 80 years since the end of World War II, was part of the commissioning of the modern hydro-oceanographic research vessel Vital de Oliveira. Both vessels were named in honour of Frigate Captain Manoel Antônio Vital de Oliveira, patron of hydrography in Brazil. The coincidence of the survey being conducted by a namesake vessel adds a symbolic layer to the discovery. The wreck was located on 16 January 2025, approximately 35 nautical miles (65km) off the coast of Macaé, Brazil, with support from local divers. Using a multibeam echosounder and sidescan sonar, the team mapped the seafloor relief and generated high-resolution acoustic images of the hull. The data provides critical insights into the vessel’s condition, structural integrity and conservation status. According to Lieutenant Captain Caio Cezar Pereira Demilio, an archaeologist with the Navy’s Historical Heritage and Documentation Directorate (DPHDM), the findings contribute to underwater archaeology, naval history and marine engineering. “Shipwrecks serve as material records of Brazil’s maritime past, offering insights into trade routes, naval strategies and historical conflicts,” he stated. The wreck was first identified by divers responding to a fisherman’s report of a net caught on the seafloor. Upon closer inspection, the obstruction was found to be a cannon, prompting notification of the Brazilian Navy.
Sonar technology has enabled underwater archaeologists from the Brazilian Navy to accurately identify the location of the shipwreck resting on the seafloor. (Image courtesy: Brazilian Navy)
New Arctic seabed chart marks significant progress in ocean floor mapping
A major leap in seafloor mapping has been achieved with the release of Version 5.0 of the International Bathymetric Chart of the Arctic Ocean (IBCAO). Announced by The Nippon Foundation-GEBCO Seabed 2030 Project, this update adds 1.4 million square kilometres of new data – an area more than three times the size of Sweden – to the global seafloor map. This latest advancement brings the world closer to a fully mapped ocean floor by 2030, delivering unprecedented detail of the Arctic seabed. Beyond expanding our knowledge, the enhanced dataset supports safer navigation, scientific research and informed decision-making for ocean policy and exploration.Established in 1997, IBCAO has long been the authoritative source of bathymetry for the Arctic Ocean, with the latest version –published in Scientific Data by Nature – representing a quantum leap in detail, with a grid-cell size of 100 x 100 metres, compared to 200 x 200 metres in the previous version. This achievement was made possible through advanced compilation methods, including the use of cloud-based distributed computing and the integration of metadata. The release also highlights the challenges and innovations associated with mapping the Arctic Ocean, where perennial sea-ice cover and extreme conditions have traditionally limited data collection. Overcoming these obstacles has required groundbreaking technology and international collaboration. Martin Jakobsson, co-head of Seabed 2030’s Arctic and North Pacific Regional Center, stated: “The release of IBCAO Version 5.0 is a testament to the collaborative effort of the Arctic research community and our dedication to overcoming the challenges posed by the extreme Arctic environment. This dataset not only furthers our understanding of the Arctic seabed, but also exemplifies the power of teamwork in advancing global knowledge.”
(Image
The new Arctic Ocean map is regarded as a major milestone in the global effort to map the seafloor.
courtesy: Martin Jakobsson)
Project Octopus revolves around an innovative 32-metre cutter vessel, combining sustainability and versatility. It can transition from a fishing boat to a research vessel within days. (Image courtesy: Padmos)
Surveying 3,000m beneath the ice
Making subsea history by locating Endurance
By Lynn Radford, contributing editor, Hydro International
In March 2022, almost precisely 100 years after the burial of famed British polar explorer Ernest Shackleton, his legendary ship Endurance was finally located at the bottom of the Weddell Sea in Antarctica. In this exclusive interview, Nico Vincent talks about the challenges involved in surveying at more than 3,000m depth, and provides insight into the state-of-the-art hydrographic technology used to overcome the unique sea ice conditions.
What was your role in the 2022 search for Endurance?
When a previous mission to find Endurance had unfortunately been unsuccessful in 2019, the Falklands Maritime Heritage Trust (FMHT) decided to organize its own expedition to locate the wreck. In 2020, I was delighted to be appointed by the benefactor of the FMHT as subsea project manager of this expedition, called Endurance22. After accepting the role, I immediately asked for a detailed ‘lessons learned’ report explaining all of the issues encountered in 2019. In fact, that illustrates just one of the parallels between Shackleton’s story and our own – it’s essentially a story of failure, because without those earlier failures, we could never have achieved success this time around.
What were the key considerations when selecting the equipment for surveying at a depth of 3,000m in sea ice?
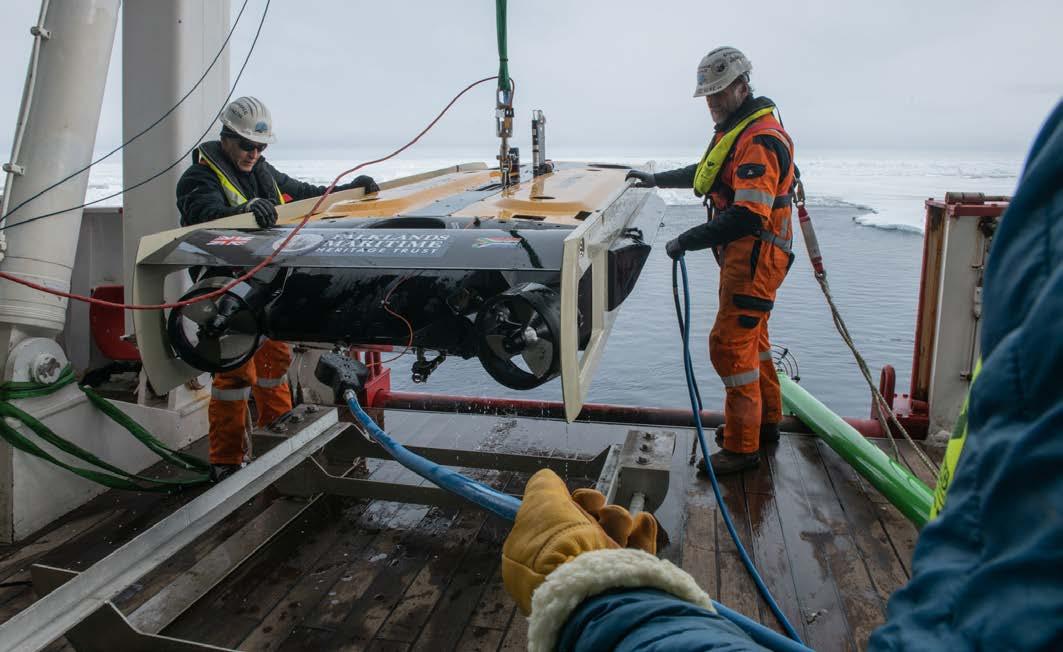
The 2019 expedition had used a Kongsberg HUGIN autonomous underwater vehicle (AUV), but it was lost and the mission had to be abandoned. I truly believe the HUGIN is the fastest and most efficient vehicle on the market. But it’s not a question of quality; it’s about picking the right vehicle for the right job. If you’re driving on the snow, you really need a four-wheel-drive vehicle, not a Formula 1 race car like the HUGIN. So the senior management at Ocean Infinity, the project’s subsea contractor, suggested the Saab Sabertooth: a rugged, robust and reliable hybrid AUV/ROV. In fact, we took two of them along with us – ‘Ellie’ and ‘Doris’ – but in the end only Ellie was used.
About Ernest Shackleton and Endurance
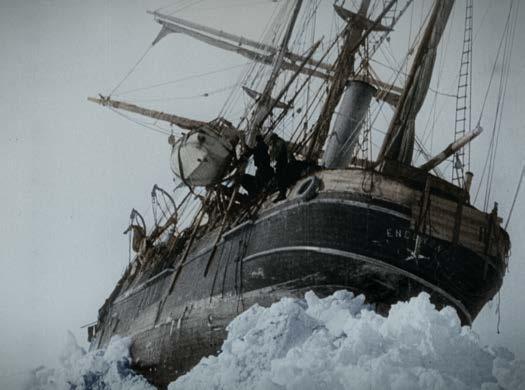
On 1 August 1914, Ernest Shackleton and his crew set sail from London on the 44m-long Endurance, one of the strongest wooden ships of that time, with the aim of crossing Antarctica on foot. Before even reaching mainland Antarctica, the vessel became trapped in the thick pack ice in the Weddell Sea on 18 January 1915. The crew had no choice but to sit it out and wait for the ice to thaw at the end of the winter.
Despite the harsh sub-zero conditions, Shackleton succeeded in keeping everyone’s spirits high day after day. But as the months passed, the relentless force of the evershifting ice gradually crushed Endurance, forcing the crew to abandon ship on 27 October. She eventually sank on 21 November 1915. Determined that he and his crew would get out alive, Shackleton showed perseverance, leadership and inventiveness as he embarked on a superhuman journey of survival including a trek across the ice followed by a 1,300km voyage in small wooden lifeboats. Despite the failure of the expedition, Shackleton’s story is regarded one of history’s most epic tales of triumph in the face of adversity. He died of a heart attack during a subsequent expedition to Antarctica. He was buried on the island of South Georgia on 5 March 1922.
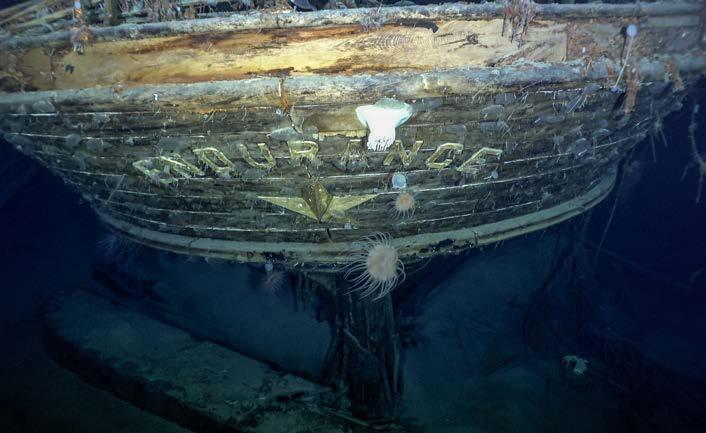
The stern of Endurance underwater with the name and emblematic polestar. (Image courtesy: Falklands Maritime Heritage Trust)
To avoid the Sabertooth becoming lost, as the HUGIN was, we decided to tether it to the vessel using a 3mm-diameter Kevlarencased fibre-optic cable, and deploy it as a ‘wired AUV’. This would give us full manual control in case of emergency, and also ensured that the data would be transmitted to our on-board control room in real time. To protect the delicate tether from the ice and also help us monitor it, the engineering team designed a steel collar: a 9m length of pipe equipped with a circular yellow buoy on top, like a big fishing float.
I knew time would be our enemy on the expedition – and, in sea ice, everything takes four or five times longer – so I was always looking for ways to save time. For example, even though the maximum acoustic tracking slant range of our equipment was 12km, I had 25km of cable fitted to the winch so that we wouldn’t have to waste time respooling in the case of failure.
For surveying mode, the AUVs were equipped with sidescan sonar; we chose the EdgeTech 2205 for its long range and efficient coverage, with an R2Sonic 2024 multibeam as gap-filler for the nadir data. In sea ice, you can forget everything you think you know about surveying in open water. Whereas you would normally keep a short range and stay directly above the AUV, we just had to accept we were going to drift and have a very high horizontal range. This was intensified in the Weddell Sea by the ocean current phenomenon called the Weddell Gyre, which causes the ice to drift clockwise in a huge circular motion. On site, we experienced drift speeds from 0.1 to 1 knots. That’s why we chose the Sonardyne USBL tracking system in low-frequency (LF) mode because we wanted to extend the slant range detection, giving us a horizontal range of up to 11km away from the vessel.
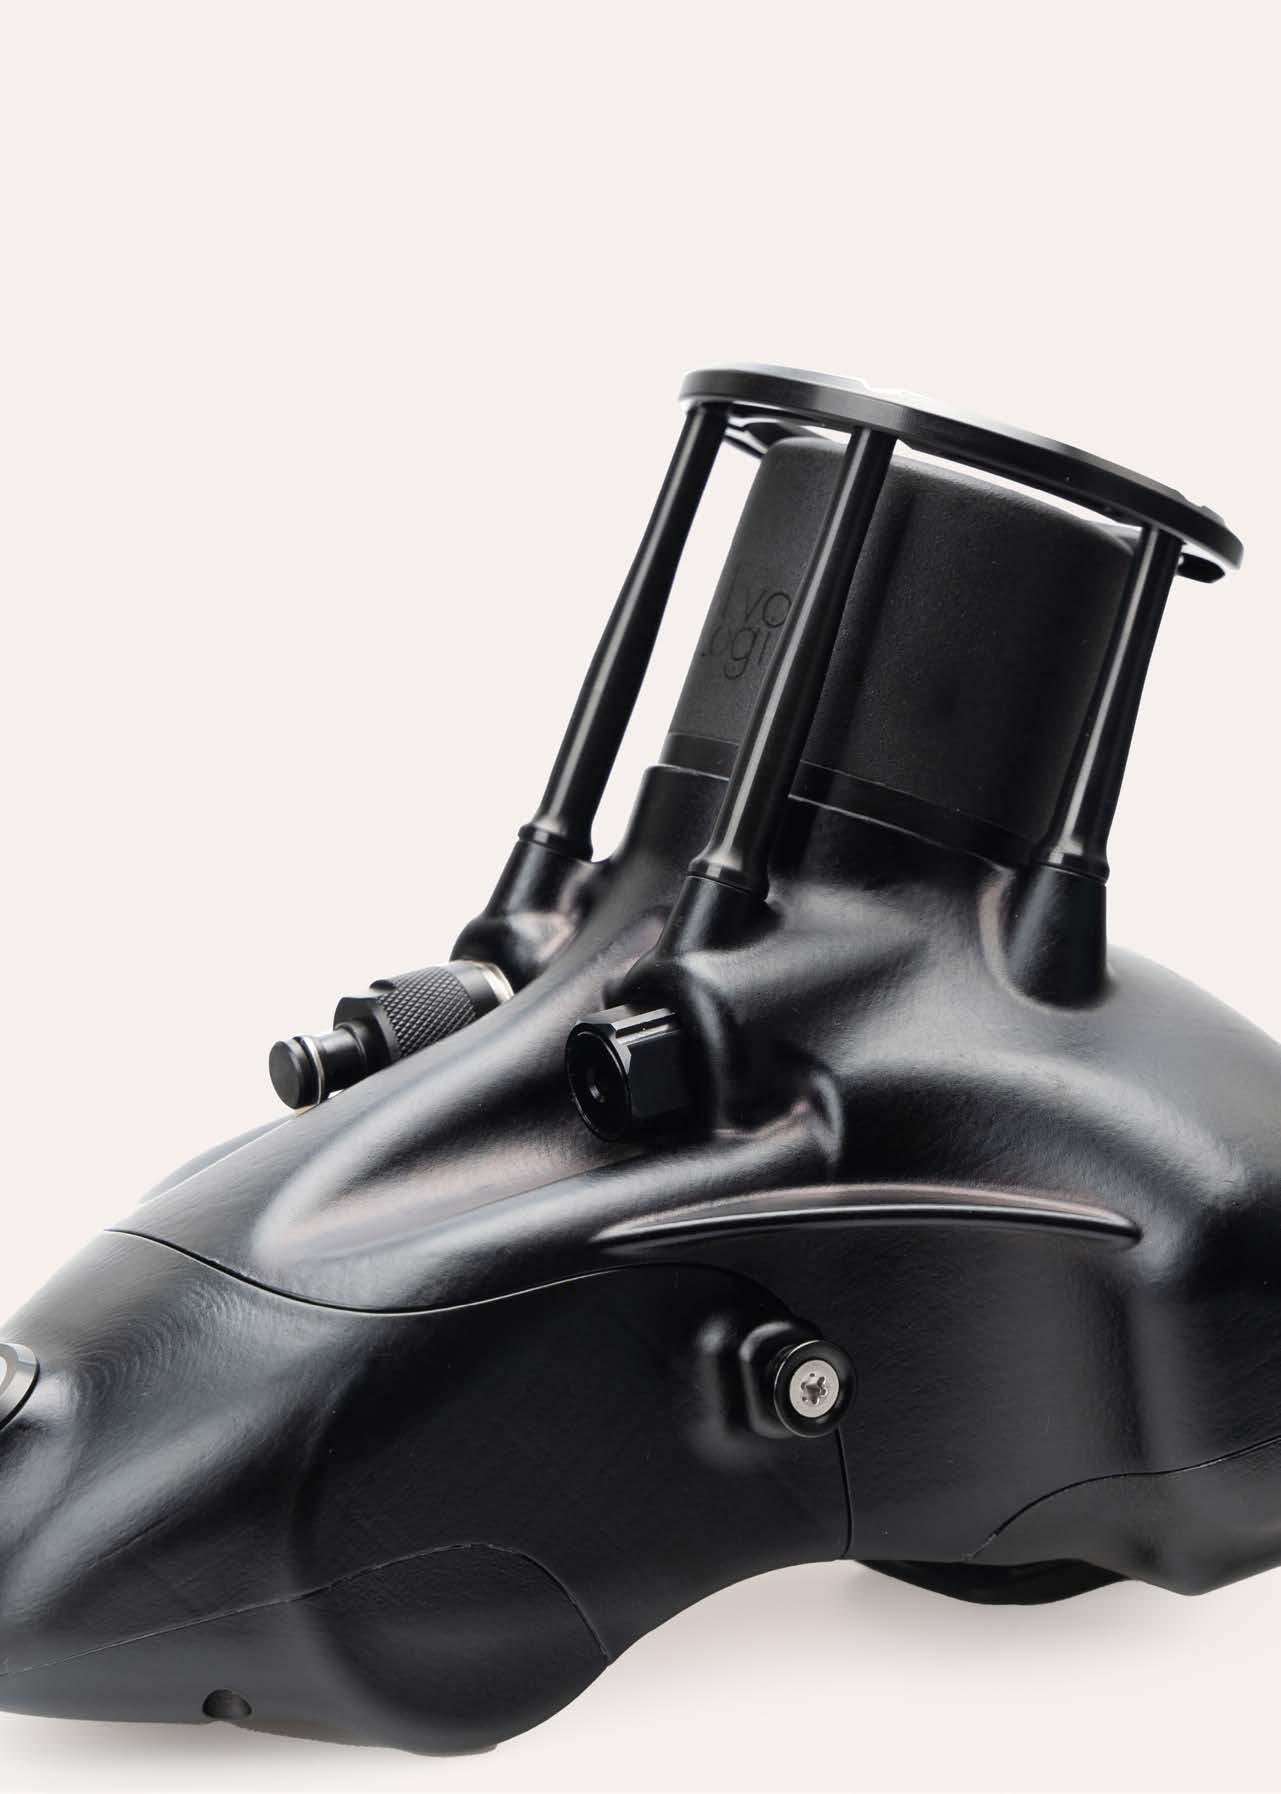
Assuming that we successfully located the wreck, we also needed to document it, which would mean converting the Sabertooth into inspection mode. For this, we had on board an ultra-high-resolution laser scanning and photogrammetry system able to produce a 3D digital twin of the wreck with an incredible 1mm resolution. This had been specially developed in close collaboration with Voyis Imaging and McGill University in Montreal, Canada. To be able to zoom in
on details, this was supplemented by a 4K broadcast camera from Deepsea Power and Light in the USA.
Which operational challenges did you anticipate in the Weddell Sea?
In another parallel with Shackleton himself – who referred to the ice as his “chief anxiety” – I realized that the main challenge would be the ice. In fact, FMHT were concerned that the SA Agulhas II might not even be able to reach the search box due to the ice conditions. Therefore, as a backup solution, we engineered a full-scale portable ice camp solution. Because all the personnel, equipment and consumables – weighing more than 40 tons in total! – had to be deployable by helicopter, no item was allowed to weigh more than 1.5 tons. Even the operations room, measuring 2.7mx2.1m, was small enough to be airlifted. As part of this backup plan, we built a sled-mounted launch and recovery system for the AUV that could be pulled across the ice, and we even invented a hydraulic drill auger capable of boring a 3m-wide hole in up to 5m-thick sea ice if necessary. In September 2021, we started training the crew how to
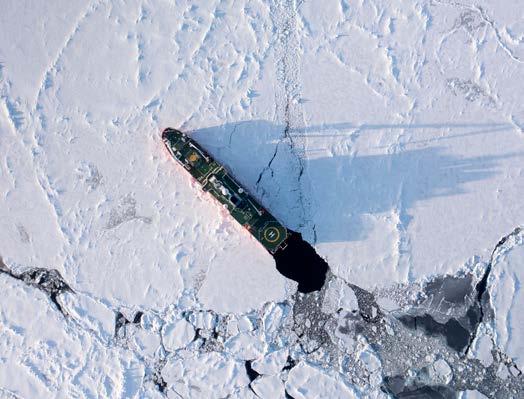
SA Agulhas II surrounded by sea ice as it makes its way towards the coordinates to find the Endurance. (Image courtesy: Falklands Maritime Heritage Trust/James Blake)
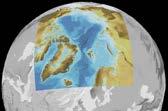
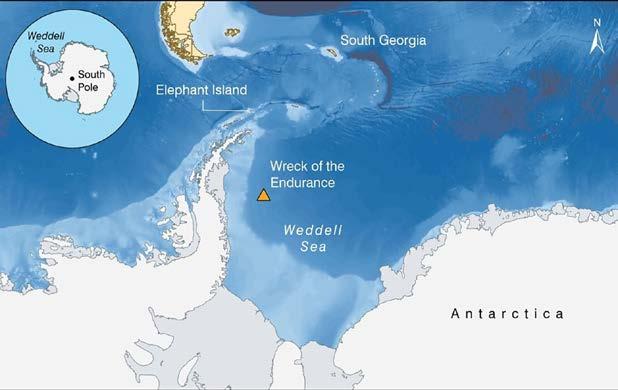
Topographic map pinpointing the location of Shackleton’s Endurance (Image courtesy: British Antarctic Survey)
Endurance, frozen and keeled over from the pressure of the ice. (Image courtesy: BFI/Frank Hurley)
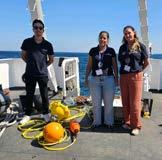
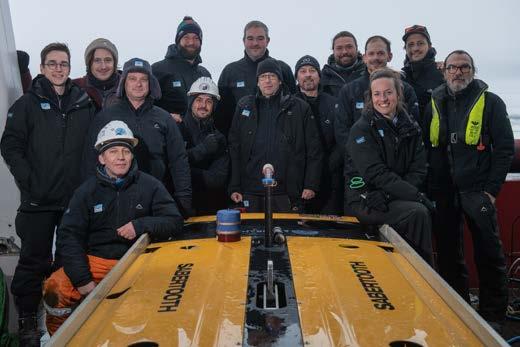
Endurance22 expedition crew members stand proudly with the AUV they used to find Endurance at the bottom of the ocean. (Image courtesy: Falklands Maritime Heritage Trust/Esther Horvath)
deploy and disassemble the ice camp quickly – at a plastic ice rink, in fact – and we generated a 15m3 ice cube so they could practice using the drill.
We realized the ice drift due to the Gyre would be another huge challenge. Firstly, it would be important to manoeuvre our vessel into the right position before each dive; we would need to ‘park’ on the right side of the search box and drift over the wreck site, so to speak. And while the AUV was underwater for a dive, for many hours at a time, the sea ice motion would constantly change the vessel’s position on the surface. To anticipate this, we needed a reliable forecast of the pack ice in the Weddell Sea. Therefore, during the preparation phase, our expedition leader Dr John Shears worked with the German company Drift+Noise Polar Services to develop the state-of-the-art PRIIMA forecast system. By combining near-real-time satellite radar images with a mathematical wind and ice drift model, this gave us an updated 72-hour forecast every six hours. This, combined with our ability to constantly update the ROV with our current location so that it knew where to resurface, was absolutely crucial.
About Endurance22
Organized and funded by the Falklands Maritime Heritage Trust (FMHT), the Endurance22 expedition brought together world-leading marine archaeologists, engineers, technicians and sea-ice scientists on a mission to find the wreck of Sir Ernest Shackleton’s ship Endurance, which was trapped and crushed by the ice and sank in the Weddell Sea in 1915. On 5 February 2022, the team left Cape Town on SA Agulhas II, one of the largest and most modern polar research vessels in the world. The 132m-long, 22m-wide ice breaker weighs 11,700 tonnes, is powered by four diesel-electric generators each providing 4,000 horsepower, and cost US$127 million to build in 2012. Despite the harsh conditions, including freezing temperatures and heavy sea ice, the wreck was successfully located on 5 March 2022, and subsequently surveyed and filmed. On the voyage home, SA Agulhas II made an unscheduled stop at South Georgia to allow the team to pay their respects at Shackleton’s grave.
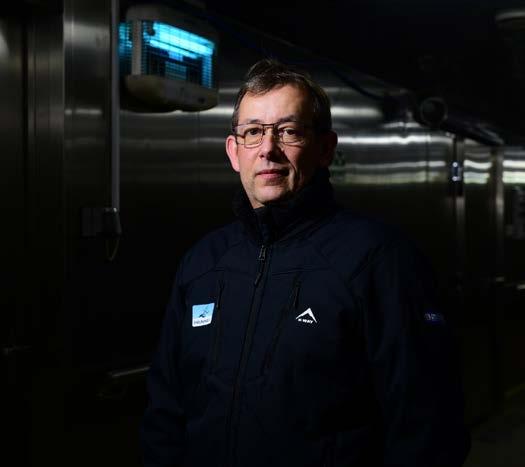
Nico Vincent, expedition subsea manager for the Endurance22 expedition. (Image courtesy: National Geographic/Esther Horvath)
Once you arrived in Antarctica, how did the reality measure up to your expectations? And how did you solve unforeseen problems?
Even though we had spent years working on the planning and preparation, once we got on site everything was different. But we knew it would be – that’s why it was decided that I should be on board for the expedition, to be able to modify procedures in line with the ever-changing situation without losing valuable time. On all missions, I like to have a Plan 1, Plan 2 and so on rather than a Plan A, Plan B and so on, because then you’re limited to just 26 plans and associated solutions. I think we were already at Plan 125 when we arrived at the search location, and we made many more changes in the days after arrival!
No matter how much training you do, you’re never prepared for the actual climate conditions in Antarctica. Even though we arrive there in the summer, by the end of the project the water temperature was minus 1.8⁰C, the air temperature dropped to minus 14⁰C and the wind chill could be minus 25⁰C. The whole crew were tremendous. Working round the clock in 12-hours-on, 12-hours-off shifts was tough, and especially the people working on the back deck really suffered a lot, but they didn’t complain. I suppose history gave us all a sense of perspective; unlike Shackleton and his crew a hundred years earlier, we at least had hot food, dry beds and warm high-tech clothing!
The freezing conditions were also a challenge for the equipment and we had a number of technical issues. In particular, we suffered a charge issue with the batteries powering the Sabertooth and were obliged to speed up the process to launch charge after arrival on deck. We eventually realized that both our winches – prototypes built especially for the mission – were exerting too much tension on the cable. Call it foresight, but a few months earlier at the Saab Test Centre I had spotted a 20-year-old winch lying around that had previously been used by the Finnish navy. I always have a few reservations about prototypes, so I had arranged for the old winch to be brought along as an emergency back-up. When we tried that instead, the Finnish winch produced much less tension on the tether and also reduced the pullback on the AUV, which immediately improved the battery endurance. And because we didn’t actually
need to deploy the ice camp solution, we erected one of the tents on deck and added a heater to shelter the equipment from the elements.
Given the time constraints, how did you optimize the efficiency of the search?
With a search box of roughly 120nmi2 (420km2), the search area was relatively small by normal standards – the HUGIN could probably have covered it in a single run in normal open-sea conditions. But despite the excellent forecasting model we were using, we never knew exactly where we would end up – we were drifting at speeds of up to one knot sometimes. So we had to work really hard to ensure 100% coverage with no gaps and reasonable overlap. After a few days, we decided to work with the ice rather than against it. We subdivided the search box into 70 smaller sub-boxes that could be covered more easily within each six-hour forecast. Based on the weather and drift predictions, and thanks to the amazing technical skills of everyone on board, we could position the vessel to maximize the AUV’s dive efficiency each time.
After a few days of surveying, on 20 February, we thought we had found the wreck, but it turned out to be just a debris field according to the archaeologist and director of exploration, Mensun Bound. That was disappointing, but also slightly encouraging because I thought it meant the actual wreck could be close by. But then the days ticked by with no success. We were given a ten-day extension, but weather conditions were worsening and time was running out. Then after 20 days and 30 dives, when we had covered 81% of the search box, we finally found Endurance.
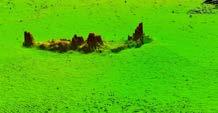
What happened when the wreck was finally found? I was called into the control room at 4:05pm on 5 March when lowfrequency sonar feed of debris had been picked up on the screen. Switching to the high-frequency sonar left no doubt that it was Endurance. The seabed was perfectly flat and uniform, so seeing the wreck was like seeing an oasis in the desert.
Despite the perfect sonar images, I wanted to see wood. Batteries were running low but we conducted another pass, this time with the camera switched on, moving from the port-side midship over the top, then turning to go to the bow. Then the batteries ran out and we had to do an emergency ascent vehicle recovery procedure. But it had allowed us to confirm 100% that we had found the full vessel.
After three years of work, to suddenly see her in front of my eyes, I was of course very excited. But I had to keep a cool head; we had just two days of the expedition left and we still had the whole inspection to do. So after allowing everyone to celebrate for about two minutes, it was time to get back to work. In training, the Sabertooth changeover from survey mode to inspection and laser scanning mode had taken 36 hours. In reality, I guess due to adrenalin, the crew did it in just 13 hours. This meant we were ready to dive again on the next day, which allowed us to complete two inspection dives.
Although we only got to spend eight hours with the wreck in total, it allowed us to capture over 25,000 high-resolution images. And they revealed that the wreck is amazingly well preserved, with a huge volume of artefacts visible. I’ve found several wooden shipwrecks in my career and usually nothing above the seabed survives the effects
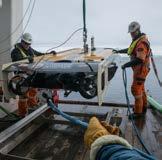
Frédéric Bassemayousse (r) and J.C. Caillens, offshore manager, recover the AUV after a dive in search of Endurance. (Image courtesy: National Geographic/Esther Horvath)
Nico Vincent is a subsea engineer, surveyor and underwater vehicle manager with more than 30 years of experience on deep-sea projects. Today, Vincent is recognized as the ‘special project maker’ for deep-sea missions around the world. Just some of the notable projects he and his team have been involved in include the recovery of the world’s deepest cargo of silver coins from the wreck of SS City of Cairo, the location of the fighter plane of Antoine de Saint-Exupéry, and discovery of the world’s deepest wreck: the USS Samuel B. Roberts (at 6,895m depth) in the Philippine Sea. They have also located the missing naval submarines AJA San Juan and La Minerve, and helped investigate significant air accidents, including Air France AF447 in 2009, Malaysia Airlines Flight MH370 in 2014 and EgyptAir Flight MS804 in 2022. Following the failure of the unsuccessful expedition to find Endurance in 2019, Vincent worked for over three years non-stop to plan Endurance22. He is a member of the Society of Underwater Technology, la Société des Explorateur Français, and The Explorer Club, who awarded him on behalf of the Endurance22 team their prestigious Citation of Merit in 2024 for the discovery of Endurance. Vincent is now the operations manager of Deep Ocean Search Ltd. (www.deepoceansearch.com).
of sea life. But Endurance looks like she sank just yesterday. She’s magnificent and amazing, exceeding everyone’s expectations.
How is the success of Endurance22 helping to advance knowledge and understanding?
Although Endurance has been found, she is protected under the international Antarctic Treaty, meaning the site cannot be damaged, removed or destroyed, so the wreck will remain undisturbed. This, in combination with the challenges associated with reaching the location, means that the digital twin of the wreck – built using our 25,000 highresolution images – is an extremely valuable resource for future research and education. For example, it is being used as input for an archaeological report currently being produced by the Falklands Maritime Heritage Trust, and it can also be used for many other purposes, such as by marine biologists studying sea life. Information gathered during the expedition is also being used in a broader context. For example, data collected
About Nicolas Vincent
3D scan of Endurance, generated from 25,000 high-resolution images. (Image courtesy: Falklands Maritime Heritage Trust)
by the scientists working on the ice above Endurance can help in the study of climate change. Meanwhile, at Stellenbosch University in Cape Town, they are analysing the vessel’s performance during the expedition as the basis for building future ice breakers.
Additionally, to bring Shackleton’s story to a new generation through education and outreach, some 33,000 of schoolchildren across the globe were following our mission through the online Reach the World project. It’s amazing that the kids got so involved, interested and excited – on the day of the discovery, many of them even cheered “We’ve found Endurance” rather than “They’ve found Endurance”, and we got ten million impressions on TikTok.
I believe we need more exploration in this world and less conflict, so it really is an honour to have been part of this story and to inspire the future generation in this way. I’ve also been touched by the magic of Antarctica and can’t wait to go back – which is ironic, because having grown up in the French Alps, I hated the snow. In fact, that’s mainly why I studied hydrography when I was 18, so I could ‘escape’ to warmer climates and swim with dolphins! But above all, of course, it was a great honour to follow in the footsteps of Shackleton himself.
How does Shackleton serve as an inspiration for you, and how can his story inspire the hydrographic community in general?
I think two quotes from Shackleton sum this up perfectly. The first is “Difficulties are just things to overcome.” We were part of a huge challenge to do something that had never been done before, in the ‘worst place in the world’ in terms of remoteness and weather conditions, and under immense time pressure. To overcome such difficulties, we had to throw out everything we thought we knew and
focus on what worked efficiently in that situation. And just as team spirt was key to the survival of Shackleton’s crew, teamwork was absolutely key to our success in solving the challenges we faced. You can’t work alone; each team member in the group supported the project, and I don’t just mean the 15 members of the subsea team, but also all 65 expedition members and 45 crew members – and not forgetting our dedicated person ashore, who really worked without stopping.
Shackleton’s second quote, which I think is particularly relevant for the hydrographic community, is “I believe it is in our nature to explore, to reach out into the unknown. The only true failure would be not to explore at all.” Let’s remember, despite the Seabed2030 project, much of the Earth’s ocean floor has still not been surveyed. Technology is advancing extremely fast with new types of sensors being developed and new vehicles that can survey at much deeper depths. We’re entering a new era for subsea survey, and access to new and more efficient technologies can create opportunities for exploration, which is good for mankind. Let’s work together to use tech to open up the world.
More information https://endurance22.org
Book: ‘Endurance: The Discovery of Shackleton’s Legendary Ship’, John Shears and Nico Vincent, National Geographic Partners, ISBN 978-1-4262-2383-9
Uncrewed satellite-operated mission capturing seabed and backscatter data
Autonomous bathymetric survey in the UK Atlantic
By Finn Delaney, XOCEAN, Republic of Ireland
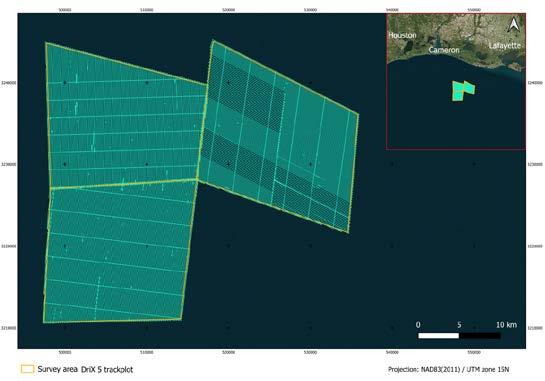
Ensuring safe and efficient maritime navigation is a critical task for coastal nations, but can also be a lengthy and costly exercise. The UK Hydrographic Office (UKHO) is responsible for charting millions of square kilometres of seabed, including some of the busiest shipping lanes in the world. To help advance this objective, the UKHO chose XOCEAN to provide accurate, highquality and reliable hydrographic survey data using uncrewed surface vessels (USVs). Notably, XOCEAN was contracted in late 2023 to carry out a comprehensive bathymetric survey under the UK SW Approaches Lot 1 of the Seabed Mapping Framework.
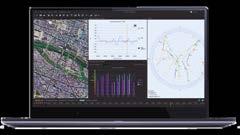
Five XOCEAN USVs, outfitted with sophisticated multibeam echosounder (MBES) technology, were used over two areas, covering a combined 2,218 sq. km, south-west of the Isles of Scilly. The survey was methodically organized, from planning to mobilization out of St Marys on the Isles of Scilly. Operations ran across two phases, an initial acquisition phase and then infill and detailed wreck investigation surveys. Operated remotely via satellite, the use of USVs enhanced both safety and efficiency. XOCEAN’s highly flexible operational structure meant it could easily navigate the harsh environmental conditions posed by a winter season (November–March) deployment and the logistical complexities of deploying uncrewed vessels from a small island off the UK mainland, minimizing costs and schedule risk.
Introduction and background
For more than 225 years, the UKHO has been mapping and updating charts that enable it to provide reliable navigation data for safe and efficient maritime navigation. It is a huge task, with a vast territory to cover and continuous updates. Updating areas with low-resolution and outdated information is a priority, as is using viable alternatives to traditional survey approaches that can make operations more efficient and achieve carbon reduction targets. This is why UKHO was keen to prove the use of uncrewed
technology for large-scale civil hydrography data collection and chose XOCEAN as its data provider.
Since it was founded in 2017, XOCEAN has been dedicated to harnessing the potential of USVs to deliver accurate and reliable hydrographic survey data. Its vision is to transform traditional survey methods by using innovative technology and uncrewed systems. Through honing its expertise and cultivating partnerships, the company has become a leading player in civil hydrography,
delivering the superior hydrographic data needed for effective maritime navigation and environmental management.
The project involved a comprehensive bathymetric survey of the Haddock Bank
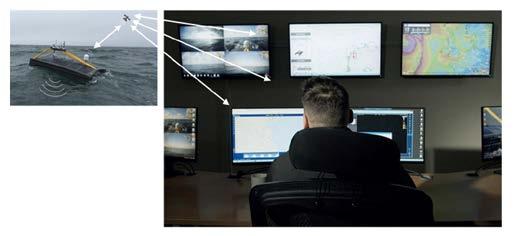
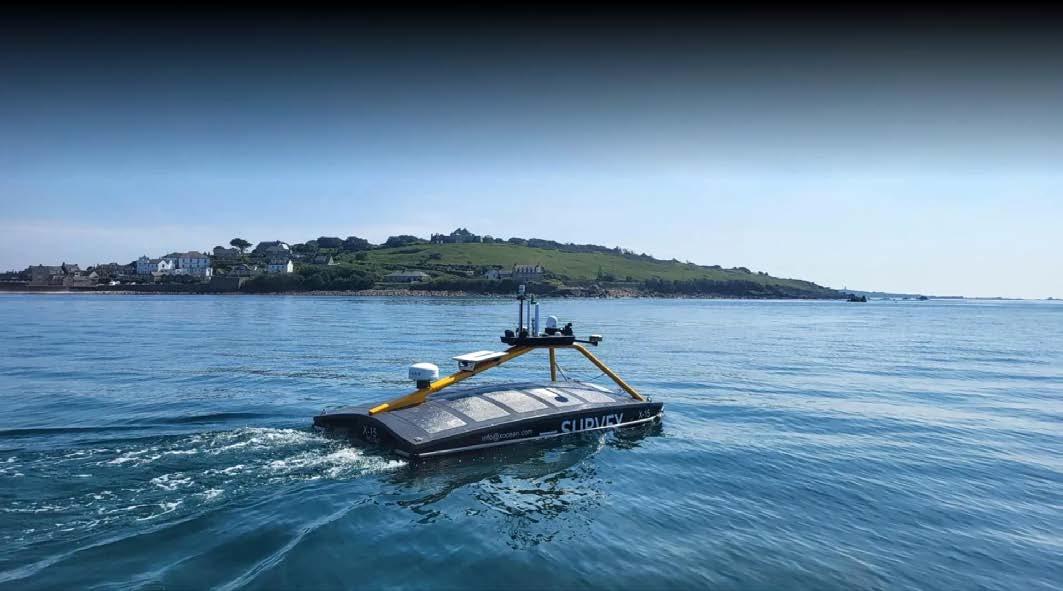
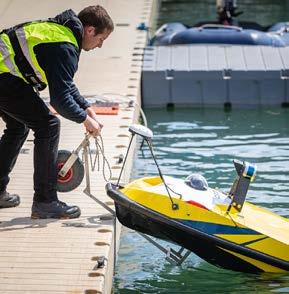
XOCEAN USV pilot navigating a USV over the horizon via satellite communication.
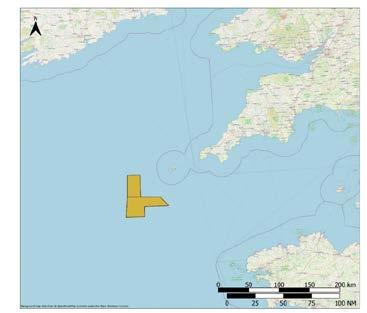
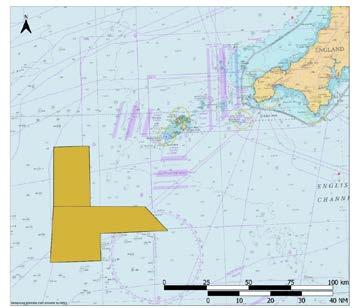
Survey area with respect to UK, Ireland and French coastlines.
Survey area in relation to the Isles of Scilly.
chain and contracting strategies to support the remote operations.
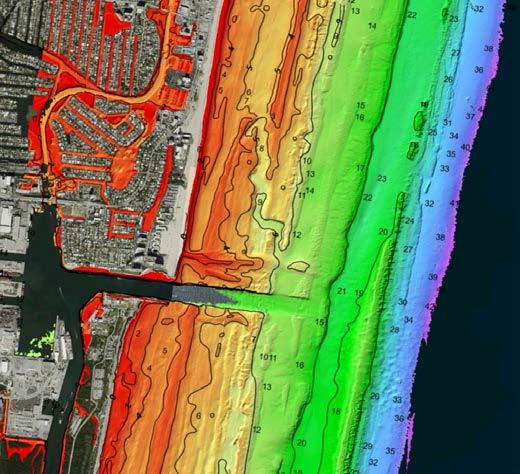
area, 30–60 nautical miles south-west of the Isles of Scilly, off the UK coast, and covered two distinct areas with a combined area of 2,218 sq. km in 100–120m water depths.
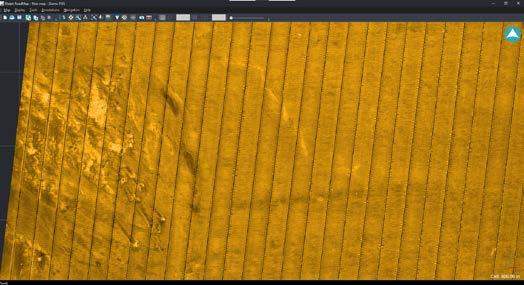
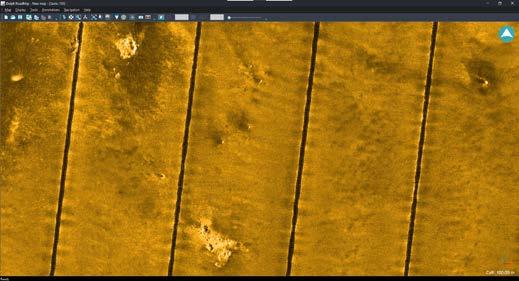
Five USVs, equipped with MBES technology, were piloted remotely from shore to collect high-resolution seabed and backscatter data to International Hydrographic Organization (IHO) Order 1a standards.
This pioneering approach both enhanced the safety of survey operations, by allowing pilots and surveyors to remain onshore, and ensured continuous, real-time monitoring and data collection through the use of enhanced satellite communications.
Challenges and objectives
XOCEAN’s project for the UKHO involved overcoming a series of significant challenges, all tied to stringent objectives aimed at advancing hydrographic survey capabilities. The primary scope was comprehensive multibeam bathymetric data acquisition, including backscatter, high-resolution data over 53 charted wrecks. The project was scoped to complete more than 10,000 line kilometres of survey using five USVs over 100 acquisition days.
The first challenge concerned environmental and operational conditions. The survey area, in the Southwest Approaches to the UK, is exposed to the harsh winter Atlantic swell, experiencing significant wave heights (Hs) of more than 2m, routinely reaching up to 3.5m. These conditions required the careful management of risks and operational difficulties. A second challenge was logistical coordination. The mobilization and demobilization of multiple USVs required careful planning. This was further complicated by the operations being based out of a small harbour on a remote island, which demanded efficient planning of spares and effective supply
XOCEAN’s flexible operational structure navigated these challenges. It could take advantage of the ability to launch and recover the USVs across a wide variety of slipways and crane facilities and to redeploy project teams during weather downtime to avoid unnecessary costs.
Another challenge was the technical and quality standards. Meeting the IHO Order 1a standards as specified in the “Standards for Hydrographic Surveys, Special Publication No. 44, 6th Edition, 2020”, along with the UKHO’s stringent technical requirements, was crucial. This included additional survey system verifications such as MBES repeatability tests, infill and detailed wreck surveys.
One of the survey objectives was to maximize resource efficiency. Using a remote operations model, XOCEAN aimed to maximize the use of its resources during favourable weather conditions while reallocating crew to other surveys during periods of downtime. This approach optimized operational efficiency and ensured continuous data acquisition, which was critical for meeting the project timelines. Another objective was to ensure high-quality data collection. The goal was to provide full coverage MBES and conduct crosslines every 5km or a minimum of five per survey block to meet the high standards required for hydrographic data accuracy and repeatability. The third objective concerned adaptability and safety. The use of USVs was strategically chosen to mitigate the risks associated with operating in challenging sea conditions, thereby enhancing the safety of survey operations and reducing seafarer exposure hours.
Solutions
XOCEAN adopted a multifaceted approach to address the challenges presented by the UKHO hydrographic survey project. First, it made use of advanced sonar technology and selection. To ensure highresolution seabed mapping, XOCEAN equipped the XO-450 USVs with state-of-the-art NORBIT WINGHEAD B51s 200kHz sonars. These
XOCEAN USV departing for SW Approaches.
sonars were chosen for their wide swath capabilities and high data quality, making them ideal for the precise and detailed bathymetric survey data required. The selection of the NORBIT WINGHEAD sensors was strategic, focusing on their compatibility with the USVs and their reported performance in deepwater surveys. The sensors were configured to optimize data acquisition in the challenging conditions of the survey area, with specific settings tailored to handle the wide range of depths and sea states encountered during the project.
Secondly, innovative software was used for data processing. XOCEAN used the latest CARIS software for hydrographic data processing, facilitating the efficient handling of large datasets and enabling real-time processing and visualization of multibeam echosounder data. The use of CARIS also helped in maintaining consistency across the data management process, ensuring that all collected data adhered to the UKHO’s stringent quality standards. A robust data management strategy was also crucial for the success of the survey. This strategy included rigorous data consistency checks and validation protocols to ensure that all collected data met the high-quality standards required for marine navigation and safety.
Thirdly, the integration of Starlink ensured enhanced communication and data transfer. XOCEAN has integrated Starlink satellite communication technology onboard their fleet of USVs. This provided high-speed, low-latency internet connectivity, enabling seamless data transfer and real-time communication between the remote operators and the vessels. The use of Starlink allowed for immediate data processing and analysis, significantly accelerating the decision-making process and ensuring timely delivery of survey results.
Finally, detailed hindcast weather modelling was used to understand the expected operable uptime for acquisition, helping to inform and optimize the number of USVs required to meet the project deadlines.
Implementation
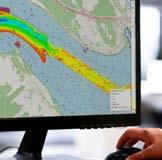
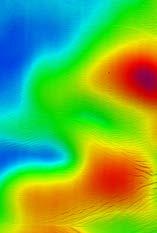
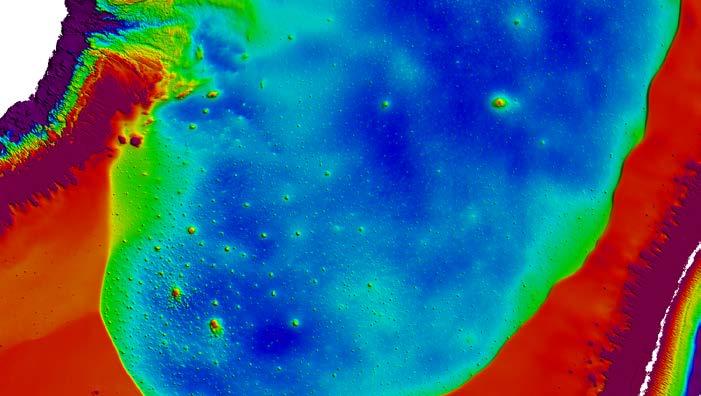
Example bathymetric overview in 120m water depth with a wreck visible in the top right quarter of the image.
The SW Approaches Lot 1 implementation was carefully orchestrated across several phases, each critical to project success. The first phase was commissioning at XOCEAN Ireland. This included calibrating the NORBIT WINGHEAD B51s 200kHz sonars and integrating Starlink communication systems onto the USVs.
Following commissioning, the project moved to mobilization out of St Marys on the Isles of Scilly. During mobilization, the team deployed the USVs and ensured all systems were fully operational and optimized for the initial survey operations. The first survey phase, Phase 1, took place in the Haddock Bank area of the Southwest Approaches. This phase involved comprehensive seabed mapping to capture initial bathymetric and backscatter data, with continuous real-time data transmission via Starlink for immediate processing and analysis. The transition between Phase 1 and Phase 2 involved
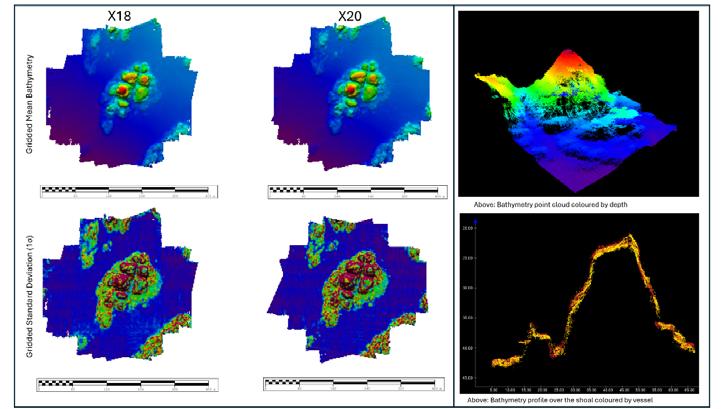
Examples of rigorous cross-fleet calibrations undertaken prior to surveying
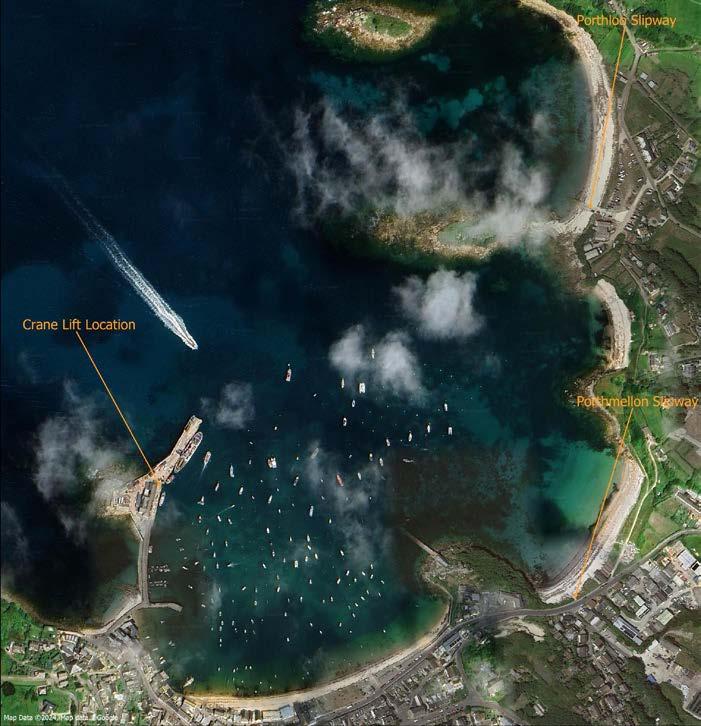
USV launch options on St Mary’s.
reconfiguration and resupply of the USVs at St Marys, preparing for a focused survey of infill areas and detailed wreck surveys. Phase 2 was followed by a demobilization period where the USVs were retrieved and equipment was checked.
In addition to the main survey phases, the project schedule included periods for weather standby at St Marys to ensure safety and operational readiness in response to changing weather conditions, maximizing survey efficiency during suitable periods.
The data processing and delivery of raw deliverables were handled by XOCEAN. This included processing all collected data to meet the project’s quality standards and preparing initial reports. The final analysis and detailed reporting will follow on from the main processing phase and raw data delivery.
Throughout the project, rigorous mission planning, robust hindcast weather modelling and analysis of weather statistics were critical. A strategic approach both optimized the deployment of resources and ensured high standards of data accuracy and project deliverables, showcasing XOCEAN’s capability to manage complex maritime projects.
Results
XOCEAN’s deployment of five USVs off the Isles of Scilly marked a significant achievement in civil hydrographic surveying for the UKHO. The USVs, operated by pilots and surveyors from onshore locations, conducted extensive bathymetric surveys of the seabed, enhancing
LiDAR Topo-Bathymetry
About the author
Finn Delaney is a business development manager at XOCEAN, specializing in offshore wind development. He previously managed a hydrographic survey company based in Galway, Ireland, which operated globally with a strong emphasis on offshore renewable energy markets. Delaney is an IHOqualified hydrographic surveyor and is passionate about high-resolution MBES surveying and leveraging quality data to solve complex problems.
the understanding of underwater features ranging from depth variations and habitats to ridges, boulders and shipwrecks.
The data collected from these surveys both met and surpassed rigorous IHO Order 1a standards, achieving an unprecedented level of precision. This high-quality data will be crucial in the production of accurate nautical charts, significantly enhancing maritime navigation safety. Additionally, the data will support extensive marine environmental assessments and advanced sustainable practices within the blue economy.
Beyond either/or: integrating hydrographic technologies for a data-driven future
By Kyle Goodrich, TCarta
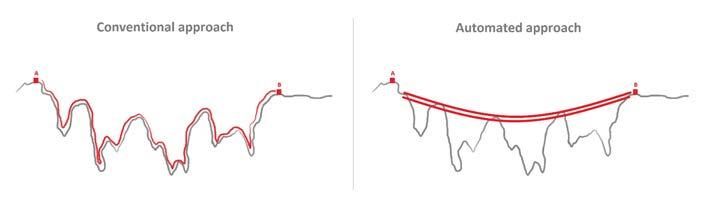
For too long, discussions about hydrographic surveying methods have centered on comparing individual technologies – multibeam vs. Lidar, Lidar vs. satellite, satellite vs. multibeam. This ‘either/or’ and one versus the other mentality is outdated. Each of these methods, whether using sound, light or reflectance, is an imperfect tool for measuring a complex environment. Instead of debating the merits of one approach over another, we need to embrace a ‘both/and’ strategy. The future of hydrography lies in intelligent integration, seamlessly combining diverse technologies for maximum efficiency, cost-effectiveness and environmental responsibility. This article argues for a paradigm shift: moving from sequential, siloed approaches to a holistic, vertically integrated model that leverages the unique strengths of each technology.
Current practices often fall short. To give some examples of operational inefficiencies: Lidar flights over remote islands without prior weather or water condition checks via readily available or tasked satellite imagery; repeated topobathy Lidar reflights for small areas easily filled by satellite data; small vessel surveys in coastal zones running aground on unsurveyed shoals – all preventable with integrated approaches. Even in regions with open data policies, the time lag between data collection and availability can be significant, especially given the rate of environmental change. These operational gaps are not just inconvenient; they often represent wasted taxpayer money and missed opportunities for enhanced safety. A cost-focused argument demands that we maximize the value of every survey, prioritizing operational efficiency and focusing on desired outcomes, not simply sensor-based specifications.
A vision for integration
Imagine a hydrographic workflow where satellite-derived bathymetry (SDB) informs and improves topobathymetric Lidar acquisition, identifying optimal flight times based on daily water clarity trends and therefore minimizing reflights. SDB then serves as a planning tool for multibeam
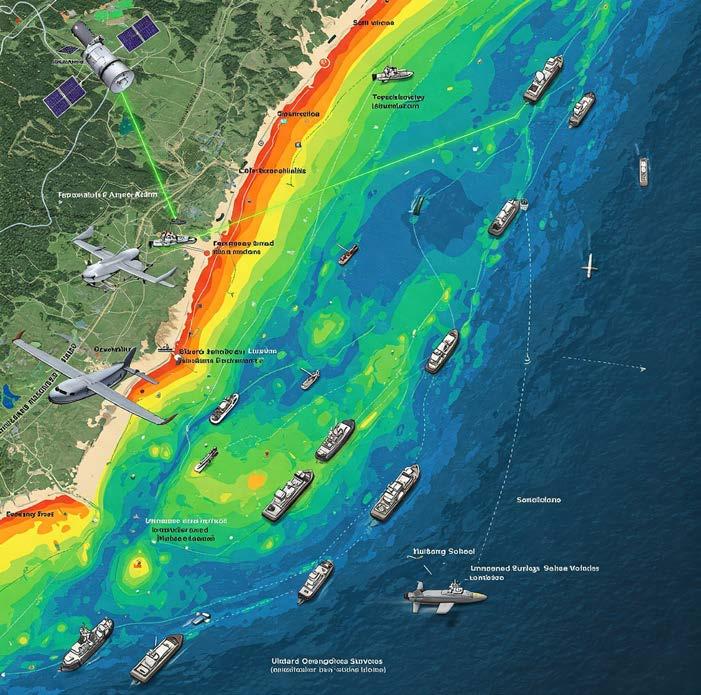
An artificial intelligence perspective on integrated systems for coastal mapping based on prompts from this article and Hydro International content on hydrographic mapping technologies. (AIgenerated image by Gemini)
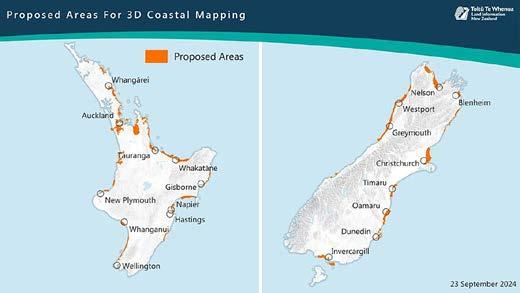
surveys, optimizing track lines and enhancing safety by highlighting potential hazards. This integrated approach is not just theoretical. For one promising example, see Land Information New Zealand’s (LINZ’s) forward-thinking approach in New Zealand, mandating water condition tracking to optimize bathymetric Lidar collection.
The hydrographic landscape is transforming, and integrated hydrography has shifted from a vision to a necessity
SDB and other Earth Observation (EO) data also have use as the geospatial ‘glue’ connecting land and sea, bridging the intertidal zone and providing a valuable baseline for higher-resolution data. A recent example of this approach can be seen at NOAA’s Office for Coastal Management (OCM), with an example of high-resolution topobathymetric models with SDB included at the coastline, bridging the gap between hydrographic data and topography in a challenging location for coastal mapping: Alaska.
This integration extends to uncrewed vessel data acquisition. SDB can de-risk USV operations through mission planning and hazard avoidance. The technology exists today for satellite-derived electronic charts to provide reconnaissance for a USV operating in remote islands in the Pacific Ocean with digital chart information delivered via space-based high-speed internet.
Reversing the situation, information from Lidar collection and in situ measurements from field operations can inform and improve SDB models, creating a powerful feedback loop for continuous improvement. USVs can provide valuable in situ data for validation of SDB surfaces where other means are not available. This is technology integration: a full stack of sensors, from satellites in space to underwater vehicles and seafloor devices, focused on a challenging problem: mapping and characterizing the ocean floor and coastal zone.
Overcoming barriers and embracing the future
Several barriers or disincentives hinder widespread integration. Government requests for quotation (RfQs) and framework contracts often contract out individual survey technologies separately, discouraging integrated solutions. The biggest obstacle may
Kyle Goodrich is the president and founder of TCarta. With a 24-year career in geospatial, hydrospatial and hydrographic fields, Kyle is a passionate leader within the ocean mapping community, with an extensive background in satellite remote sensing with a focus on the coastal zone. Founded in 2014, TCarta is well established as a global leader in marine remote sensing products and services with a track record of innovation, developing new markets for new products and delivering marine geospatial projects around the globe.
however be mindset. We must move beyond the ‘either/or’ thinking and recognize the synergistic potential of integrated approaches. This requires a shift in RfQs and framework processes, calling for integrated solutions and focusing on the best approach for the specific location, not just a pre-determined platform or survey method.
The rise of the blue economy, with its increasing emphasis on environmental monitoring, further strengthens the case for EO in coastal mapping. With advancements such as wave kinematic bathymetry, space-based Lidar’s well-proven capabilities and the development of high-resolution customizable hyperspectral satellites, the future of satellite-based hydrography itself is multimodal and one of integrated techniques. Perhaps that is what draws future hydrographers and next-generation ocean explorers to the alternative hydrographic method of satellite-based surveying.
Parting thoughts
The hydrographic landscape is transforming, and integrated hydrography is no longer just a vision; it is a necessity. By combining the strengths of diverse technologies – from SDB and Lidar to multibeam and USVs – we can unlock unprecedented levels of efficiency, cost-effectiveness and environmental stewardship. This integrated approach is not just about better data; it is about a deeper understanding of our oceans and a commitment to a sustainable future. Recent industry developments, such as the acquisition of a leading SDB and EO company by the world’s largest hydrographic survey firm, signal a clear trend: the future of hydrography is vertically integrated. EO is no longer a niche technology but a core component of modern hydrographic solutions. This acquisition validates the growing importance of SDB and EO and underscores the value of integrated services for an ‘all-sensor’ approach. To further accelerate this evolution, collaboration and partnerships in this arena should be encouraged. It is time to move beyond ‘either/or’ and embrace the power of ‘all of the above and below’, working together to shape the future of hydrography.
About the author
Cognitive object recognition, classification and change monitoring underwater
GeoAI in the marine domain
By Matt Woodlief, Esri
GeoAI is the application of artificial intelligence (AI) fused with geospatial data, science and technology to solve geographic-based problem sets. GeoAI, therefore, is not a product to be bought and sold, but an integrated method, or pattern, for conducting spatial analysis using the power of computers. The use of GeoAI on land has been widely publicized for use cases such as object detection (buildings, roads, trees), land use classification and change detection. The application of GeoAI to the marine environment may be less apparent, but the basic uses of GeoAI – object detection, classification and change detection – can certainly be applied to the marine domain, both above and below the water. These uses can be applied across a wide spectrum of marine-related activities, including chart production, marine security and environmental protection and monitoring.
Hydrographic offices have a mandate to protect life at sea. To do this, they need to produce accurate navigational charts with timely updates. However, accurate and timely have long been at odds. Using an object detection model with a GIS, such as ArcGIS Pro, the path from data to chart can be automated. The Esri GeoAI team set out to prove this use case in preparation for the 2020 User Conference.
Natural disasters or other regional phenomena can mean drastic changes are required to navigational charts. In 2012, Hurricane Sandy devastated the area around Jamaica Bay, NY. A post-disaster bathymetric survey identified numerous wrecks that were unaccounted for in the S-57 chart over this 100km2 area. The Esri GeoAI team decided that a supervised classification method would be required, so they would need training
samples to feed into the algorithm. They enhanced the bathymetric surface with a shaded relief function to better highlight the elevation changes. Using the built-in deep learning toolset in ArcGIS Pro, they used the collected training samples to train then execute the model, resulting in hundreds of new detections. They then reviewed the detections to determine which required charting and which could be excluded. Note that, while shipwrecks were the target in this experiment, other objects with a unique pattern could easily take their place.
Monitoring the natural environment
In addition to surveying for safe navigation, many hydrographic offices have an array of sensors collecting vast amounts of data to monitor the biology, chemistry and physical oceanography of their coastal waters. For example, NOAA estimates that it collects about 20TB of data every day. Models are required to sift through this information and alert humans when action is needed.
Canada’s Department of Fisheries and Oceans (DFO) regularly surveys Canadian Arctic waters to assess whale populations for stock assessment. Aerial imagery is regularly
Figure 1: Shipwrecks detected from deep learning model.
collected and used in conjunction with satellite imagery for this purpose. DFO and Esri Canada set out to see if there could be a use for GeoAI in the form of deep learning to detect Beluga whales from imagery. Beluga whales were chosen to train the model because of their lighter colour and size, which makes them easier to detect than other Arctic marine mammals such as narwhals, walrus or seals. They found that using an object identification model led to many false positives as the whales, floating sea ice and whitecaps all look similar. Instead, they used pixel-based classification, which applies a similar process to object detection in that labelling and training are required, but these models segment out the pixels by value and location, grouping similar pixels into classes. The models effectively do the tedious ‘panning and scanning’ for the human analyst and target areas of the imagery that need review and verification. By employing these models, DFO hopes to be able to review imagery in the season it was collected, providing more timely information. The model accuracy was estimated to be 80–85%. Like all models, it can be tuned further with more training samples. So, while not perfect, the models give analysts a major boost in efficiency, especially when they can be run inside a software suite already in use.
To give another example, identifying and monitoring the coastline is a monumental task, but one that allows scientists to gain an understanding of the effects of climate change. When coupled with the estimate that nearly 15% or about one billion people live within ten kilometres of a coastline, this
data collection is of great importance to our society. The United Kingdom Hydrographic Office (UKHO) set out to establish a baseline extent of the global coastline with a greater accuracy than ever before. Its combined use of data science techniques, machine learning (ML) algorithms and human expertise to solve a geographic problem is a notable use of GeoAI. Because of the many variations of coastlines around the world, it used a pixel classification method called Otsu Thresholding, essentially segmenting the image into two categories: coastline and not coastline. Using this method, it was able to produce a much more detailed coastline map than that previously available. This more detailed map will allow for the finergrain study of the effects of changing climate and the environmental impacts of natural phenomena such as shoreline erosion.
GeoAI is not just useful to ‘detect things’ in imagery. In fact, machine learning and deep
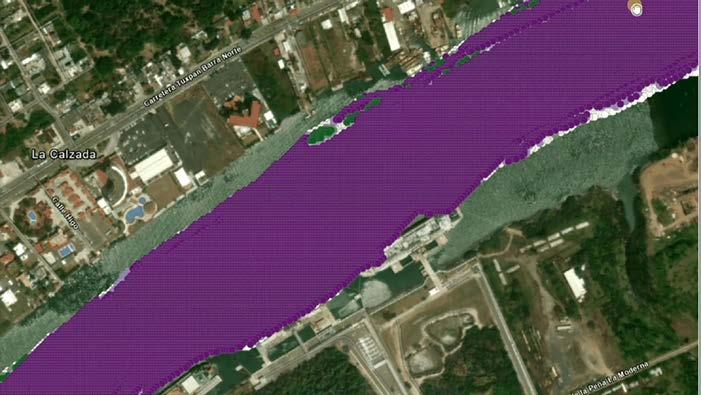
learning models are built into a variety of tools at the disposal of a GIS analyst. Esri and Hypack partnered to complete a proof of concept where Esri forecasting tools would run on Hypack collected data to forecast where sedimentation would occur around the Port of Tuxpan, MX. The idea was to use the 20+ years of bathymetric data to train the model to predict when and where sedimentation is occurring around the port area that could affect the size of vessels using the port. This analysis used a deep learning technique called time series forecasting. Time series forecasting searches for patterns and trends to use in making a prediction for a future value. In this case, that was a value for the depth of the channel at that location. Using this forecasted depth measurement to subtract from the safe navigational depth, Esri was able to predict where, when and how much sediment would need to be removed to keep the channel safe for navigation.
Protecting the blue economy
Continuing the theme of massive scale, it is estimated that 70% of global trade is carried by marine transportation. One study by the United Nations concluded that the value of the blue economy is US$3–6 trillion every year. There is obviously a lot at stake if the resources are not used equitably and sustainably. One of the scourges of the blue economy is illegal, unreported and unregulated (IUU) fishing, the impacts of which have been widely studied. Global Fishing Watch, an international non-profit organization, uses a GeoAI pattern by combining satellite imagery, big data feeds and machine learning to determine where and when IUU is taking place, and the participants. It does this in near real time by analysing AIS and VMS feeds and satellite
Figure 2: Results of time series forecasting. Violet indicates areas where sedimentation above the threshold is likely to occur.
Figure 3: When using high-resolution drone imagery, the model was able to identify whales that were partially or wholly submerged. (Image courtesy: Bryanna Sherbo, Canadian Department of Fisheries and Oceans)
Figure 4: GIS and GeoAI enhance maritime safety, decision-making and economic benefits. Hydrographic offices and chart producers leverage GIS for data management and automated chart production, while climate change monitoring organizations can use GeoAI to analyse decades of data for change detection. (Image courtesy: Esri)
imagery object detections. It also filters out non-fishing activities through analysis of the speed and direction of a given vessel and makes the data available for download and access via API. This use of the GeoAI pattern gives anyone with an internet connection access to a massive global dataset. Authorities can also use this data to monitor IUU in their economic zones.
Another example: about 30% of the world’s oil comes from undersea reserves. While big spills dominate the news cycle, NOAA estimates that thousands of spills occur in US waters every year. Fortunately, oil spills leave a pattern on the water that can be recognized by computer vision and used in a GeoAI pattern to indicate where an oil spill has occurred and its extent. Models can then be used to predict where the oil will travel based on currents and other environmental factors. Chen and Small (2022) used image/pixel classification techniques to isolate pixels containing oil from the non-tainted water. The unique aspect of their study was to go beyond the visible spectrum and use the imagery collected from infrared sensors. The result shows that oil can be detected from the surrounding seawater due to the contrast in thermal properties, indicating that GeoAI can go beyond the visible spectrum to detect anomalies that the human eye cannot.
Risks and challenges for GeoAI in the marine environment
Using GeoAI patterns is not without risk or challenges. The largest risk is misidentification or misclassification. Even if a model reaches a confidence level average of 90%, that confidence level changes from feature to feature and pixel to pixel. Human intervention is therefore required to verify the results of any output from the models. In fact, subject matter expertise is required not only to interpret the results, but also to provide the training samples for the model. In a similar vein,
there is a real risk of misinterpreting or overestimating what a model is outputting, for example if the model was misconfigured or the analyst does not fully understand what the model is doing. Take the case of the sedimentation research in Tuxpan, in which it was easy to conclude that the model reported dangerous levels of sedimentation in certain precise locations. However, the nuance is important. What the model is actually saying is that, based on past measurements, dangerous levels of sedimentation are statistically likely to happen in this location rather than somewhere else. There are of course many additional factors that can cause this to change; the model can only use the data it is supplied with, which leads to the next major challenge: the lack of appropriate data.
Data needs to be appropriate for the application and the objects that need to be detected. In the example of the oil spill detection, threeband RGB imagery would not have been appropriate as the near infrared (NIR) band was needed to detect the heat differences between the oil slicks and surrounding water. Similarly, in the whales example, researchers needed a resolution of 30cm or better to detect whales. A good rule is the pixel size needs to be smaller than the subject; that is, a 10m resolution will not be sufficient to detect Baluga whales, which average 4.6m in length. On the topic of resolution, analysts need to be aware that finer resolution images require more computer resources for processing. It may be determined during the project planning phase that, to balance resources and accuracy, the data needs to be resampled into a coarser resolution. If using a pre-trained model, the analysis needs to understand which data was used to train the model and use the same data format and resolution, or else the model will produce unreliable and incorrect results or fail entirely.
Running AI/ML models in the GeoAI arena is a compute-intensive exercise. To run GeoAI and deep learning workflows within the ArcGIS Platform, Esri recommends, at a minimum, a CPU with four cores, 8GB of RAM and a dedicated GPU with 4GB of memory. The optimal requirement to run the processes on larger datasets is nearly double.
The machine will also need ample storage space to hold the base data, temporary output and final results.
Using GeoAI methodologies requires a significant investment in time. The time spent labelling objects for deep learning processes or resampling datasets to fit the requirements of the model is not trivial. In fact, most time will be spent preparing the data for the model. Depending on the size, resolution and available computing power, models can take hours or days to run. Keep in mind though: a single person may be able to process one image a day, but the machine can process hundreds, usually making the time invested in preparing the data worthwhile.
Reducing risks and challenges with GIS
The potential for GeoAI to help map and understand our oceans is compelling, but only if the risks and challenges can be mitigated. GeoAI is focused on solving geographic problems, so it makes sense to select a GIS platform in which the analysis can be performed from start to finish. The GIS can ingest images from satellites, aerial and drone-borne cameras, terrestrial scanners and sonar devices. This flexibility allows the analyst to first explore the dataset to understand its format, resolution and pixel type, then focus on the application that would be best supported by this dataset.
About the author
Using the correct resolution for the object to be detected is the first step in preventing misclassification. To begin exploiting the image, there are well-documented built-in tools and Python libraries so the analyst can select the best tool for the task at hand, whether that is labelling the objects for deep learning or running an object detection workflow. These models usually require a few minor adjustments to account for the new data. Additionally, GIS writes the results of the model directly to an interactive map, facilitating the QA/QC process. Likewise, the GeoAI tools provide result metadata which helps assess the accuracy of the model. Misclassification can also be avoided by including a human in the loop prior to publishing the results.
Desktop GIS, such as ArcGIS Pro, can access data directly from cloud storage, which eliminates having to move large amounts of data locally. Furthermore, the use of spatial extent parameters available in the GIS-based tools let the analyst prepare smaller areas to test the models prior to running them on the
More information
Matt Woodlief is a technical consultant with Esri. He has a passion for discovering new applications for GIS technology. He studied history at Illinois State University and pursued a master’s in Professional Studies: Geographic Information Technology from Northeastern University.
entire dataset. This can help mitigate some of the risk pertaining to available computing resources. To help save time in the data preparation process, pre-trained models are available to establish baseline outputs and identify whether additional training samples are needed.
GeoAI has many fascinating use cases for the marine domain. Hydrographic offices and chart producers can leverage the ability to detect objects and create an automated pipeline from data collection to chart production, and organizations monitoring the effects of climate change can automate the analysis of decades worth of data to find change. The ongoing efforts of non-profit organizations can be enhanced by leveraging this new technology to protect Earth’s oceans from overfishing and contamination. This is of course not without risk, but leveraging a modern GIS platform such as ArcGIS can greatly enhance the efficiency of the analyst to go from data to results. GeoAI is an accessible method for almost anyone in the marine domain.
What Is GeoAI? | Accelerated Data Generation & Spatial Problem-Solving. (n.d.). https:// www.esri.com/en-us/capabilities/geoai/overview (accessed 1 February 2024).
Hains, D., Schiller, L., Ponce, R., Bergmann, M., Cawthra, H. C., Cove, K., Echeverry, P., Gaunavou, L., Kim, S., Lavagnino, A. C., Maschke, J., Mihailov, M. E., Obura, V., Oei, P., Pang, P. Y., Plackal, G. P. N., & Sharma, S. L. (2022). Hydrospatial - Update and progress in the definition of this term. The International Hydrographic Review, 28, 221–225. https:// doi.org/10.58440/ihr-28-n14 Singh, R., & Singh, R. (2020, July 14). How we did it: Detecting Shipwrecks using Deep Learning at UC 2020. ArcGIS Blog. https://www.esri.com/arcgis-blog/products/arcgis-pro/ analytics/detecting-shipwrecks-using-deep-learning/ (accessed 1 February 2024). NOAA: https://oceanservice.noaa.gov/ocean/observations/data-standards.html UKHO Blog Post: https://ukhodigital.blog.gov.uk/2020/02/12/creating-coastlines-usingdata-science/ CDFO story map: https://storymaps.arcgis.com/stories/ cd9b97dd21a84440823de71243e8b3ae Global Fishing Watch: https://globalfishingwatch.org/
Building an acoustic digital twin of the ocean
The Silicon Valley of smart ocean technologies
By Guilherme Vaz, founder & CEO, and Hermen Westerbeeke, CCO, blueOASIS
Underwater acoustic technology has been part of the hydrospatial industry’s toolbox for many decades, but as we witness throughout our industry, the combination of increasingly capable computing power and multiple data streams from new as well as old sources is creating new survey capabilities and products. One company exploiting this nexus in the field of passive acoustic monitoring (PAM) is the Portuguese startup blueOASIS. While building a contribution to the European Digital Twin of the Ocean, it aims to make the Azores archipelago the centre of underwater acoustics research and innovation.
After working in the Netherlands for 18 years, the R&D computational fluid dynamics coordinator of MARIN, Dr Guilherme Vaz, decided to return to his native Portugal in 2019. Initially he joined WavEC, a non-profit marine renewables research institute, but noticing a big gap between industry and academia with no private sector companies providing R&D services to the naval, maritime and offshore energy industries, he decided to found Blue Ocean Sustainable Solutions, better known as blueOASIS. Established in October 2021 in Ericeira, 35 kilometres northwest
of Lisbon, blueOASIS made good use of the local Ericeira Business Factory incubator programme, graduating in February 2022 with four employees.
Right from the start, blueOASIS has taken an Industry 4.0 approach, bringing together expertise and experience in highperformance computing (HPC), machine learning & artificial intelligence, and big data & cloud computing. Equally, blueOASIS has also focused on ocean sustainability from its inception, working on solutions for renewable energy, sustainable aquaculture,
decarbonization of the maritime sector and biodiversity monitoring, to name but a few.
blueOASIS has strong ties to the Azores and intends to consolidate the Azores islands as a hub for ocean technologies, attracting investment and developing local capabilities. To this end, the company plans to expand operations and invest in strategic partnerships with regional institutions. It has an office and workshop on the island of Faial and uses the surrounding ocean to develop, test and validate its products. At the start of 2025, the core blueOASIS team has grown to over 20 people, augmented by PhD candidates, external collaborators and a specialized team of about a dozen experts in labelling underwater acoustic data.
Pioneering spirit
In its relatively short existence, the expertise of the blueOASIS team in the field of hydrodynamics has already earned the company the reputation of a reliable partner in the maritime industry. Using a range of medium- to high-fidelity numerical tools such as computational fluid dynamics, the team has worked on projects such as the underwater exhaust scoop geometry analysis for a yacht, the estimation of the shallowwater total resistance of an electric ferry vessel, and the assessment of the thruster efficiency degradation due to thruster-hull interaction for clients such as DAMEN and the Jan De Nul Group.
blueOASIS staff preparing a SCOUT buoy for deployment.
The same expertise also established blueOASIS as a trusted supplier to Portugal’s renewables sector. Portugal is a pioneer in the development of floating wind technology. The Windfloat 1 project installed the world’s first floating 2MW wind turbine off Póvoa do Varzim in 2011, powering the current Windfloat Atlantic with three 8.4MW platforms installed off Viana do Castelo. The main advantage of floating wind energy is that it can be installed in deep waters, where more intense and consistent winds are found. For a country like Portugal, whose exclusive economic zone is mainly in deep water and about 19 times larger than its land area, floating wind technology has enormous socio-economic potential.
The blueOASIS team has worked on a wide range of floating wind and other renewables projects, such as the design and optimization
About the authors
Guilherme Beleza Vaz is the CEO of blueOASIS. He spent 18 years at MARIN, serving as the overall coordinator of CFD developments for the last three. In 2019, he moved back to Portugal to become CSO of the Renewable Energy Institute WavEC and founded blueOASIS in 2021.
Hermen Westerbeeke is the CCO of blueOASIS. His career spans over 25 years, covering executive, commercial and operational management across various sectors. Most recently, he was the commercial director of UHI startup PlanBlue and an advisor at the World Geospatial Industry Council.
Simulated underwater acoustics map around Ericeira, Portugal, showing sound pressure levels resulting from noise produced by a selection of vessels and a wind farm.
of floating structures and mooring systems and the assessment of wave and tidal resource potential. It is part of the ongoing HORIZON Europe-funded FLOATFARM project, led by TU Berlin, which aims to significantly advance the maturity and competitiveness of floating offshore wind technology.
This all makes for a thriving R&D services company with happy customers, and that is where this blueOASIS story could finish, if it was not for Guilherme’s ambition to also develop new products and spin these out as ‘new’ startups.
Digital twin
With a deep understanding of PAM, underwater acoustics and machine learning and hands-on experience with the analysis and modelling that HPC can support so well, Guilherme identified a market opportunity for a digital twin based on underwater acoustics data.
Digital twin is a popular term these days and mostly used for digital models that lack the essential element of being continuously fed with observation data. Many models bearing the title ‘digital twin’ may have come about by means of machine learning using observation data, but unless a digital twin continues to be fed with observation data, which allows it to evolve and remain the ‘digital doppelgänger’ of the real-world system it is supposed to mimic, it is nothing more than a sophisticated snapshot in time.
With Hydrotwin, blueOASIS has created a proper digital twin. Using the Spotter platform from San Francisco-based Sofar Ocean as a starting point, blueOASIS added edge computing and AI capabilities to create the SCOUT-S PAM system. Particularly innovative is the edge computing capability, which allows for the in situ preprocessing of sensor data, improving processing efficiency and reducing data communication requirements. Where an uninterrupted data flow is essential, the SCOUT-C system connects directly to land-based
A SCOUT buoy in operation off the coast of Faial, Azores.
facilities or seaborne vessels by cable. The data generated by multiple SCOUTs feeds into Hydrotwin’s cloud-based platform, where it can be combined with other relevant data streams, depending on the application. For example, PAM data combined with data on environmental parameters such as water temperature and salinity, and blueOASIS’s own sophisticated HPC-driven noise propagation models (RAINDROP), can be used to identify and locate different sources of engine noise. When compared with automatic identification system (AIS) location data and AIS vessel registration data regarding the vessel’s size and propulsion type, vessels that should but do not have their AIS on can be identified. However, a similar combination of PAM, environmental and AIS data could also allow the creation of a digital twin of the seabed topography.
The Hydrotwin platform has also been trained to identify and locate several aquatic species (cetaceans). Through its work in the marine renewables sector, blueOASIS understands the impact that regulation pertaining to marine ecosystems
has, as well as the market opportunities that this creates for its PAM systems and Hydrotwin technology. It is part of the HORIZON Europe-funded PHAROS project, led by the Canary Islands Ocean Platform (PLOCAN), which supports the European Union’s ‘Restore our Oceans and Waters’ mission, one of the EU’s five missions to bring concrete solutions to some of our greatest challenges. PHAROS is also linked to the European Digital Twin of the Ocean (DTO). In PHAROS, blueOASIS leads the development of two local digital twins, one for Gran Canaria and one for Iceland, and the integration of these with the European DTO.
Hydrotwin was spun out as a stand-alone entity in May 2023 and has received investments from venture capital firm Portugal Ventures, the Singapore-based family office and private investment firm August One, and US investment firm Dexterity Financial.
Future aspirations
Looking ahead, blueOASIS in cooperation with the local authorities intends to
create the first North Atlantic Underwater Acoustics Centre in the Azores by 2026. The archipelago’s strategic location in the North Atlantic, its unique ecological system and environmental conditions, the collaborative research network that includes institutions such as the Okeanos Institute of Marine Sciences of the University of the Azores and the Escola do Mar (School of the Sea), as well as the supportive business environment, make it an ideal location. Moreover, the decision of the Azores government in October 2024 to establish the Azores Marine Protected Area Network (RAMPA), the largest Marine Protected Area network in Europe, creates the conditions in which such an Underwater Acoustics Centre will thrive. With this centre, blueOASIS intends to make Faial island the Silicon Valley of smart ocean technologies.
More information
www.blueoasis.pt www.hydrotwin.pt
Test your software/equipment with the IHO’s S-100 route monitoring products
S-100 sea trials in the St Lawrence River
By Stéphane Thériault, Annie Biron and Louis Maltais, Canada
Following the adoption of the new ECDIS performance standard at IMO MSC106 in November 2022, the International Hydrographic Organization (IHO) has planned a phased rollout of S-100 navigational information starting on 1 January 2026. In preparation, the Canadian Hydrographic Service, the Canadian Coast Guard, Teledyne Geospatial and PRIMAR have collaborated to offer data services focused on S-100 route monitoring requirements. IHO endorsed Canada’s proposal for real-world testing of S-100 route monitoring products in the St Lawrence River as a designated international S-100 sea trial area starting in June 2025.
The successful implementation of S-100 services depends on factors such as global data availability, maritime community endorsement and integration into existing operations. Conducting trials demonstrates the practical benefits of S-100 services, allowing stakeholders to test standards in real-world scenarios, gather feedback and make adjustments before full-scale implementation. Comprehensive testing of all route monitoring layers with encrypted and digitally signed data is crucial for achieving
robust standards. Feedback from trials will refine product specifications and ensure the successful implementation of S-100 systems by January 2026.
The adoption of S-100 product specifications and high bandwidth data links offers fleet managers new opportunities to implement modern route optimization tools. These tools can integrate authoritative digital nautical information such as weather, route planning, surface currents, water levels,
high-resolution water depths and port data. They will enhance navigation safety, optimize payloads, reduce carbon emissions and lead to greater fuel and time savings. The upcoming St Lawrence River S-100 sea trials highlight Canada’s commitment to the S-100 suite, contributing to global maritime safety and efficiency efforts.
How to participate
OEMs, pilots, mariners and other interested parties are invited to register for the dedicated data service prepared by PRIMAR, free of charge for the duration of the trials. The data will be available from June to November 2025. Registration opens in March 2025 and can be done by contacting support@primar.org. Participants will provide their assessment, the context in which the data was used, and the observed outcomes.
Figure 1: Bathymetric Surface Data (S-102) for the Saint Lawrence River, produced by the Canadian Hydrographic Service, displayed in an ECC-developed viewer tool. (Image courtesy: Electronic Chart Centre)
Figure 2: 2025 S-100 sea trials area.
This valuable feedback will be analysed and shared with data providers and the IHO.
The trial area
The St Lawrence River is a busy waterway that is ideal for sea trials due to its tidal influences, varied currents and narrow dredged navigation channel with deep-water sections with seasonal continuous survey activities. Additionally, it features several bridges, overhead cables and numerous navigational aids. The designated area for the sea trials is the section of the St Lawrence River between Sault-auCochon (47.02N, 70.63W) and the Port of Montréal (45.50N, 73.56W), covering approximately 350km/190 nautical miles of waterway.
S-100
products and services available during the trials
The sea trials service offer aligns with the IHO roadmap for the S-100 implementation; namely for the first edition of S-98, which handles interoperability between different layers in the future S-100 ECDIS. The same roadmap indicates that priority for S-100 ECDIS is for layers used in route monitoring mode. The S-100 products and services available will include:
S-101 Electronic Navigational Charts
S-102 Bathymetric Surfaces
S-104 Water Level Information for Surface Navigation
S-111 Surface Currents
S-124 Navigational Warnings
S-128 Catalogue of Navigational Products
S-129 Under Keel Clearance Management Information
By subscribing, users will have the advantage throughout the trials of accessing up to date navigational layers through the PRIMAR service. For example, water level and surface currents layers will be updated daily, while bathymetric surfaces will be updated periodically as new surveys are run.
These trials offer a unique opportunity for stakeholders to test their equipment and software in situ or in a simulated environment, and to evaluate how these data layers can enhance navigation and operations. Participants can conduct a variety of tests, such as assessing system performance and compatibility, performance benchmarking, ease of use, accuracy and reliability, and the benefits of combining different data layers. They can also explore new operational possibilities and evaluate overall improvements to navigation safety. Feedback on all these aspects will be invaluable and shared with the community to drive further improvements.
Participating organizations
Several organizations are involved in making the various S-100 datasets and services available for the sea trials:
Canadian Hydrographic Service
Since 1883, the Canadian Hydrographic Service has studied Canadian waters to ensure their safe, sustainable and navigable use. Its mission is to provide up to date, authoritative and standardized hydrographic and geospatial information. Using technological advancements and more than a century of expertise, the CHS has become a recognized world leader in hydrography.
Canadian Coast Guard
As a special operating agency of the Canadian Department of Fisheries and Oceans, the Canadian Coast Guard helps the department meet its responsibility to ensure safe and accessible waterways for Canadians. It also plays a key role in ensuring the sustainable use and development of Canada’s oceans and waterways.
PRIMAR
PRIMAR is an international collaboration dedicated to providing a consistent and reliable electronic navigational chart (ENC) service, and operated on a non-profit basis by the Norwegian Hydrographic Service (NHS) in close cooperation with Electronic Chart Centre AS (ECC). PRIMAR aims to support authorized partners with flexible, user-friendly, efficient and timely solutions, ensuring that end users are provided with an ENC service that is recognized for its quality and overall contribution to marine safety and efficiency at a global level.
Electronic Chart Centre
ECC is a centre of expertise for the collection, validation, distribution and visualization of electronic charts and maps. ECC’s vision is to contribute to greater safety and security, lower costs and enhanced efficiency at sea and on land, by the rapid development of technology to meet its clients’ needs.
Teledyne Geospatial
For over 35 years, Teledyne CARIS has been making software designed for the marine GIS community. Not only renowned for its product but also for outstanding customer service, CARIS software is selected by national mapping and charting agencies, survey companies, port and waterway authorities, oil and gas companies and academic institutions worldwide.
Figure 3: Coverage of the St. Lawrence River S-100 sea trials area.
Specific tests might include integration testing to ensure the datasets work seamlessly with existing systems, performance benchmarking to measure how well the system performs under different conditions, user experience evaluation to assess the ease of use and user interface design, operational impact assessment to identify new operational possibilities and improvements in efficiency, and accuracy and reliability analysis to verify the precision and dependability of the data. Participants should also be on the lookout for potential issues or areas for enhancement, such as system compatibility to ensure the data integrates well with various hardware and software, performance bottlenecks to detect any slowdowns or inefficiencies in the system, user interface challenges to note any difficulties users may face while interacting with the system, and data inconsistencies to identify any discrepancies or errors in the data.
Conclusion
S-100 is answering the need for a modern, better platform for efficient and safe navigation. The importance of the St Lawrence River to the Canadian economy makes it the perfect candidate for these trials where real, official S-100 data, services and equipment will be put to the test. Our team is looking forward to your participation and thanks you in advance for making these trials a success.
More Information
Full details about the Canadian S-100 sea trials and the registration process can be obtained from www.canadas100.ca.
Sample S-100 datasets can be obtained from the CHS’s web page: https://charts.gc.ca/data-gestion/s-100/products-servicesproduits-eng.html
About the authors
Stéphane Thériault has worked in the hydrographic sector for 30+ years, helping various hydrographic offices and companies with successful implementations of electronic charting tools and related procedures. He currently works for the Canadian Hydrographic Service (CHS).
Annie Biron began her career with the CHS in 2001. She has held various positions in the organization as a professional, supervisor of different work units, and manager of two divisions. She became Director of Hydrography for the Québec region in 2022.
Louis Maltais is Director of Navigation Geospatial Services and Support at the CHS. Based in Ottawa, he leads national efforts on CHS products and services. Louis has played a key role in transforming hydrographic science in Canada, including the development of the S-100 standard for hydrographic data, leading to a significant impact on marine geospatial data and navigation.
Figure 4: Panoramic view of the St. Lawrence River, the 1908 railway bridge, Cap-Rouge Bay, and the Pierre Laporte and Quebec bridges at sunrise in winter. (Image courtesy: Shutterstock/Anne Richard)
Advancing seabed mapping: the power of the Sams 150 synthetic
First deployment of this next-generation survey solution in the Gulf of Mexico
The integration of Exail’s DriX uncrewed surface vehicle (USV) with Exail’s Sams 150 advanced synthetic aperture mapping sonar represents a breakthrough in marine survey technology. This combination offers an unprecedented level of efficiency, accuracy and endurance in seabed mapping. As the first deployment of its kind, this innovative pairing was recently operated in the Gulf of Mexico, in a collaboration between Exail and David Evans & Associates Inc. (DEA) for the National Oceanic and Atmospheric Administration (NOAA) Office of Coast Survey, demonstrating its potential to transform hydrographic survey operations.
By leveraging advanced technologies such as multibeam echosounders (MBES) and imagery from a synthetic aperture mapping sonar, the DriX is capable of complete coverage feature detection for nautical charting of the seafloor and detecting underwater objects with unprecedented precision. This unique combination of DriX and Sams 150 represents a major step forward in the efficiency and accuracy of bathymetric surveys in support of nautical charting.
Unique combination
DriX, a 7.7m-long, highly stable USV, is designed to withstand high-sea conditions. Equipped with a specialized gondola, the USV incorporates advanced sensors, including Sams 150, an MBES and an optional sub-bottom profiler.
Exail’s Sams 150 is an advanced sonar system that combines the operability of traditional sidescan sonar with the enhanced capabilities of synthetic aperture sonar (SAS) technology. It features tight integration with Exail’s Phins inertial navigation system (INS) and other positioning systems to ensure superior motion compensation and deliver georeferenced images by design. The result is consistent, high-resolution sonar imagery, surpassing conventional survey methods in efficiency, coverage and data integrity.
Sams 150’s two processing modes make it highly adaptable to various operational scenarios. These are the SAS mode, for applications requiring centimetric resolution, and the inertial sidescan sonar (inSSS) mode, which utilizes the SAS hardware to extend conventional sidescan processing. This mode is more resilient to platform motion and supports faster data acquisition. The inSSS mode – which was utilized for the operational deployment in the Gulf of Mexico – ensures resilience to motion and enables rapid, high-quality data acquisition.
“A key advantage of this setup is the specially designed gondola, engineered by Exail to seamlessly integrate these advanced sensors (Sams, MBES, INS and option for a sub-bottom profiler) while preserving the DriX’s superior hydrodynamic performance,” explained Olivier Moisan, DriX operations manager. The streamlined gondola design maintains the vehicle’s speed, stability and low fuel consumption. This allows the DriX to operate for extended durations without compromising its efficiency or agility, making it an ideal platform for long-endurance survey missions. “The integration of Sams 150 within the DriX’s gondola – rather than being towed by a vessel – reduces operational complexity and enhances overall survey performance,” added Olivier Moisan.
Demonstrating capabilities in the Gulf of Mexico
The first operational deployment of DriX with Sams 150 took place in the Gulf of Mexico in autumn 2024, validating its performance in real-world conditions. The mission underscored the effectiveness of this next-generation survey solution. Launched and recovered from Cameron, LA, the USV was remotely operated from the Cameron Remote Operation Center (ROC) and from an ROC in Vancouver, WA. The survey covered an impressive 3,729 nautical miles across three designated areas, totalling 861.8 sq km. With its very low fuel consumption,
The DriX H-8’s specially designed gondola preserves the USV’s hydrodynamic performance. (Photo courtesy: Exail)
aperture mapping sonar and DriX USV
DriX could navigate in supervised autonomy for several days before returning to port. The survey was conducted between six and seven knots, providing an excellent compromise between data quality and operational efficiency.
The survey was carried out using the skunk stripe method in relatively shallow waters (19–23m), where the MBES collected bathymetric data along a near nadir swath while the Sams 150 captured inSSS imagery along the outer edges with a much greater range up to 100m with a line spacing of 180m.
Sams data was processed using Delph Geo, Exail’s proprietary sonar processing suite. The software provided a real-time waterfall display during acquisition visible from the ROC. In post-processing, Delph Geo enabled efficient batch processing of extensive survey areas, providing gain correction and seamless data merging across multiple survey lines. Despite the challenging conditions in the Gulf of Mexico, with sea states occasionally reaching level four, the software ensured the production of high-quality, motioncompensated sonar imagery.
“The application of the DriX using the combined MBES and Sams 150 systems allowed us to duplicate the production of our larger vessel running MBES and conventional towed sidescan sonar, which required more staff and produced a larger carbon footprint,” explained Jon Dasler, director of Marine Services at DEA. “This helped us meet several of our objectives for the project, which were: to acquire data that met strict NOAA requirements for nautical charting with a lower carbon footprint, to survey in heavier seas than our larger vessel, and to improve the quality of life for our valued hydrographers, enabling them to return home when not on watch in the Vancouver ROC.”
Shaping the future of ocean mapping
NOAA directed this work to support its “Map Once, Use Many Times” initiative, ensuring that the high-quality bathymetric data collected is accessible for a wide range of applications, from nautical charting to scientific research.
The data acquired through this production contract not only supports safe navigation and the flow of maritime commerce but also benefits federal, state and local agencies by providing critical insights for environmental monitoring, coastal management and more. As the technology behind the DriX USV continues to evolve, it is set to play a pivotal role in shaping the future of ocean mapping and maritime operations. By successfully demonstrating the synergy between DriX and Sams 150, this operation paves the way for future deployments in diverse marine environments.
Area covered by the DriX H-8. (Photo courtesy: DEA)
Sams 150 inSSS imagery, Gulf of Mexico, covering a 560 × 200 sq m area, highlighting clusters of boulders and sparsely scattered objects. (Photo courtesy: DEA)
Sams 150 inSSS imagery, Gulf of Mexico, covering a 4 × 2 sq km area, displaying detailed seabed morphology. (Photo courtesy: DEA)
Peruvian Navy assesses water levels and lake-bed composition
Surveying Lake Titicaca
By Alvaro Manrique, Leonardo Ponce de León, Francisco Peralta and Manuel Ibarcena, Peru
In October 2024, officers from the Category “A” Specialization Programme in Hydrography for Naval Officers of the Peruvian Navy conducted their complex multidisciplinary field project at Lake Titicaca at Puno in Peru, which is the highest navigable lake in the world (3,800 metres above sea level). The purpose of this survey was to address issues in the lacustrine environment due to hydrological processes that have occurred in recent years in this water body.
For example, it aimed to evaluate the vertical reference level used for sounding reduction and the creation of backscatter mosaics by optimizing resources to achieve a characterization of the lake-bed using a Norbit iWMBS (0.9° x 1.9°) 400kHz multibeam echosounder integrated with Applanix Wavemaster II OEM GNSS/INS
and acquisition software Norbit WBMS GUI v11.3.2 and DCT v3.2.1. The post-processing was done with QPS maritime geomatics software solutions Qimera v2.6.2 (multibeam processing) and FMGeocoder Toolbox v7.11.1 (backscatter processing), and maps were developed with QGIS v3.34.15 Prizren.
Vertical reference level employed
The vertical reference level is a persistent issue in aquatic areas during hydrographic surveys, and even more so in a navigable water body such as Lake Titicaca, which presented an anomaly of -1.23 metres relative to its historical level according to the National Meteorology and Hydrology
Figure 1: Current water level in Puno Bay, Lake Titicaca. (Image courtesy: SENAMHI, 2024)
Service (SENAMHI) in 2023, reaching levels not recorded since 1999. This trend towards historically low levels is due to changes in the usual rain patterns that directly feed the lake, as well as the tributary basins and aquifers that contribute to the lake’s water balance (see Figure 1). SENAMHI indicates that the lake’s water level is at critical levels lower than those of 2023 due to a rainfall deficit, with certain regions experiencing periods of up to 40 days without precipitation and higher daytime temperatures, which cause an increase in the evaporation rate in the Titicaca hydrographic region. Data was obtained from the Hydrological and Meteorological Station within the Bay of Puno and analysed by SENAMHI.
The vertical reference level of Lake Titicaca is 3,809.93 metres above sea level. This level has been established as the hydrographic
About the authors
Alvaro Manrique is a hydrographic surveyor category “A” and “B” and second officer of the Peruvian Hydrographic School, with a strong vocation for field activities in the branches of hydrography, physical oceanography, geodesy and topography. Extensive experience in planning and execution of singlebeam and multibeam bathymetric surveys (deep, medium, shallow waters, rivers and lakes), data gathering, post-processing and analysis, and survey planning and processing with topographic drone data for the generation of geospatial products.
Leonardo Ponce de León is a hydrographic surveyor category “A” and head of the hydrographic survey division of the Directorate of Hydrography and Navigation, specialized in multibeam mapping, geodesy and topography.
Francisco Peralta is a hydrographic surveyor category “A” and head of the hydrographic instruments division of the Directorate of Hydrography and Navigation of Peru, with a vocation for hydrography, oceanography, geodesy and topography activities.
Manuel Ibarcena is a hydrographic surveyor category “A” and head of the physical oceanography division of the Directorate of Hydrography and Navigation.
zero of the lake since 1955. Due to the issues presented in the HIDRONAV-6525 chart ‘Puno Bay’, a comparative analysis was conducted between the 2008 bathymetric survey and the multibeam survey carried out by the officers from the Category “A” Specialization Programme in Hydrography for Naval Officers of the Peruvian Navy, using the same vertical reference level marks. During the 2024 survey, the water level was at 3,807.80 metres above sea level, more than two metres below the historical level.
Multibeam data for bottom characterization
Previously, bottom characterization was carried out by means of physical sediment samples at homogeneously distributed sampling points determined according to the area extent, which was timeconsuming and costly. However, the methodology recommended
Figure 2: Bathymetric grid of the nautical chart HIDRONAV-6525 ‘Puno Bay’.
Figure 3: Backscatter mosaic and sediment sample points of the Lake Titicaca study area.
by the International Hydrographic Organization (IHO) through its standard S-44, sixth edition, suggests that bottom characterization be performed by a combination of complementary methods. These include inference methods, such as backscatter, derived from the processing of data obtained by multibeam bathymetry, and physical methods, which involve the direct collection of bottom samples using a grab, allowing a detailed analysis of the granulometry and composition of the sediments in the study area. The different types of bottom classified by granulometry scatter sound in various ways, providing information on their roughness and hardness. The integration of backscatter and bathymetry data using multibeam echosounders therefore provides a detailed picture of the bottom.
The backscatter acquisition parameters were adjusted due to the lake environment conditions, which differ from those of the marine environment. The backscatter intensity (dB) presented in Figure 3 corresponds to the fundamental echo level from the lake bottom, obtained without any calibration procedures. The processing was performed using QPS FMGT, which provides tools for normalizing backscatter imagery. Initially, the backscatter mosaic was generated with a resolution of 0.3 metres, and greyscale values were adjusted according to reflectivity. Secondly, angular range analysis (ARA) was conducted to characterize the data, and thirdly a beam pattern correction was applied. Finally, 14 sampling points were selected in areas with the highest reflectivity variation, where physical sediment samples were collected. The backscatter values were correlated and adjusted in the mosaiced data conforming to the physical sediment samples obtained with a Van Veen grab sampler, inferring their granulometry and providing key information for their analysis and description. This procedure is recommended for backscatter analysis for future studies.
To ensure a highly accurate product, the survey was conducted according to the standards of a special order hydrographic survey. This approach was particularly relevant in the peripheral areas of the acoustic beam, where ambient noise and beam scattering introduce higher uncertainties.
Comparative analysis of multibeam bathymetry
The comparison between the data obtained in the present survey and that from the 2008 nautical chart showed differences of up to three metres. It should be noted that this comparison was made in the depth ranges of three to ten metres, ten to 20 metres and above 20 metres. These discrepancies highlight the need for more frequent updates of the lacustrine basin cartography and underscore the importance of considering water-level variability in future hydrological analysis. The observed differences between historical and current data and their impact on navigational safety are notable. Furthermore, this considerable variation in lake depths suggests that the vertical reference level used in the 2008 nautical chart, given that more than 16 years have passed and recent records show lowerthan-usual levels, should be evaluated to establish a new reference level for sounding reduction. This would provide greater safety for navigators, in line with the current average levels of the lake.
The analysis of the obtained results also revealed patterns of circular depressions in certain areas of the lake-bed, whose
genesis could be associated with aquaculture activities in the region, as shown in Figure 4. These findings are important for understanding the dynamics of the bottom of Lake Titicaca.
Analysis of backscatter mosaics
The physical sediment samples collected at the 14 sampling points were analysed in the chemical laboratory of the Directorate of Hydrography and Navigation and the results obtained were correlated with the reflectivity values represented in greyscale, based on the decibels backscattered from the lake bottom. This correlation allowed the sediments to be classified into the following categories: silty sand (-71dB to -41dB), fine sand (-41dB to -28dB) and medium sand (-28dB to -11dB). This analysis facilitated the reclassification of the raster image generated from the backscatter mosaic, achieving a comprehensive characterization of the lake bottom throughout the study area. The results of this reclassification are displayed in Figure 5.
Conclusion
The water level of Lake Titicaca has shown significant depth variations in recent years, which are primarily attributed to decreased
Figure 4: Depressions on the lake-bed.
precipitation in the region and the tributary rivers that feed the lake. This issue has been demonstrated through comparisons made using an optimized methodology to leverage state-of-the-art multibeam technology – in which derived backscatter data was key – revealing significantly lower depths than historically recorded. This methodology allows for a more accurate and detailed representation
of the study area’s bottom, significantly reducing associated costs and time. The analysis leads to the proposal to update the lake’s reference level for sounding reduction, also known as the hydrographic chart vertical datum, with the aim of providing greater safety for lake navigators. Additionally, the lake-bed depressions, which were found below the aquaculture stations, presented a case study for using geophysical survey methods to determine their origin. The results of a bottom characterization therefore provide valuable insights and contribute to the understanding of the lake bottom composition. Public and private geosciences research institutions are interested in being part of this kind of hydrographic activity to share knowledge and complement their work.
Acknowledgements
The authors would like to thank the head of the hydrography department of the Peruvian Directorate of Hydrography and Navigation, Commander Rodrigo Torres Santa Maria, without whose support and management this complex multidisciplinary fieldwork would not have been possible.
G Meet 360+ world leading manufacturers and service providers
G Discover the latest marine autonomous systems, survey tools and biological and chemical sensors
G See equipment live with 180+ hours of free training & demonstrations
G Navigate the year ahead and have your questions answered at the free conference
Figure 5: Textural map of the bottom characterization of the Lake Titicaca study area.
Power to AI? Power to the people!
By Dino Dragun, Hidrocibalae, Croatia
The rise of artificial intelligence (AI) solutions, especially in the offshore industry, does not mean our work is done. The key question is not whether AI can replace us, but how we can leverage it to make smarter, more informed choices. After all, AI is not magic, but understanding what we want it to achieve is.
To successfully integrate AI, we first need a clear strategy. This means deeply understanding our existing processes, identifying inefficiencies and recognizing bottlenecks that impact efficiency and cost the most. We must assess how our workflows are structured, where the biggest time losses occur, and which processes contribute most to operational expenses. Only with this insight can we determine where AI adds value and where human expertise remains irreplaceable. One thing is certain: AI is here to stay and will continue evolving. To remain competitive, we must adapt and find ways to integrate AI effectively into our workflows.
AI’s economic potential is undeniable, with estimates projecting a US$15.7 trillion[1] contribution to the global economy by 2030. As businesses increasingly recognize its impact, 72% of organizations worldwide[2] have integrated AI into at least one business function, marking a significant rise in adoption. What were once heavily manual processes just a few years ago have now been radically transformed. A prime example is seabed boulder detection, where automation has accelerated processing by several dozen times, depending on data quality, seabed morphology and sediment type. By drastically reducing processing timelines, this advancement is directly improving the efficiency of offshore construction and monitoring.
AI adoption in offshore industries depends largely on the type and characteristics of data. AI is most effective in structured, numerical and repetitive datasets, such
as bathymetry, coordinate-based spatial mapping and magnetometry anomaly detection, where patterns are well-defined and statistical learning can automate large portions of processing. However, more complex, interpretative and decisionbased processes – such as sub-bottom profiling, seismic interpretation, geological assessments, hydrography-driven seafloor classification, marine geophysics surveys or real-time processing of seismic survey data during acquisition – still demand extensive human expertise. These processes require deep integration of multidisciplinary knowledge, making full automation challenging and in some cases, particularly in critical infrastructure monitoring or high-risk offshore operations, too high-risk for AI to be fully adopted without human oversight.
Strategic AI integration: enhancing, not replacing, offshore workflows
The key to unlocking AI’s full potential in offshore industry lies in assisted workflows, where AI enhances efficiency but remains a support tool rather than a decision maker. This distinction becomes particularly evident when comparing two approaches
to improving process efficiency – the conventional and AI-based methodologies – which apply across various offshore operations, from construction, infrastructure establishment and monitoring to surveying, data analysis and processing.
The conventional approach is characterized as highly labour-intensive, time-consuming and dependent on expert interpretation, requiring significant manual effort and relying on proven, widely used methodologies, workflows, practices and software tools. This is visually represented in Figure 1 (left), where conventional processing follows a complex, winding route, reflecting the stepby-step nature of traditional methods. On the right side of Figure 1, the automated approach integrates automation at key points, making the entire workflow more efficient. This reflects the principle that AI is most effective when strategically applied to specific tasks rather than replacing human expertise entirely.
This approach is often a hybrid solution, combining automated processes with AI-driven enhancements to unlock its full
Figure 1: Conventional and automated approach.
potential. Automation introduces flexibility and adaptability, while AI, when trained on well-structured and properly modelled datasets, further optimizes and accelerates the process. By leveraging both, offshore data processing can achieve greater efficiency, reduced manual workload and improved accuracy, ensuring a streamlined and scalable workflow.
Ensuring reliability in AI-driven processes
The primary challenge in these processes is the need for rigorous quality control of AI-generated outputs. Ensuring data reliability requires deep expertise in specific scientific disciplines, making seniority and domain knowledge crucial for validation. At the same time, the hydrography, marine geophysics and seismic industries are evolving rapidly; particularly in renewables, where the demand for skilled professionals exceeds supply. This talent shortage further highlights the need for AI augmentation rather than replacement, ensuring that human expertise remains at the centre of critical decision-making while AI optimizes workflows and speeds up processing.
Structured data models for AI training
Training AI models requires well-structured and properly modelled datasets, rather than simply feeding large volumes of raw data. Without carefully prepared training data, AI struggles to generalize patterns, leading to false positives, misclassifications and unreliable predictions. High-quality datasets must include clear metadata, labelled features and diverse environmental conditions to ensure adaptability to real-world variability. Relying on unstructured data increases the risk of overfitting noise or missing critical anomalies, reducing reliability. The key to effective AI-driven automation is not just big data, but well-modelled, high-quality training data that accurately represents the target environment.
Regulation and standardization: closing the gap
The regulation and standardization of AI in the hydrography, marine geophysics and seismic industries should advance more rapidly to ensure alignment with legal frameworks governing ethics, privacy and security. Without clear guidelines, uncertainty will persist, slowing adoption, increasing risk and limiting AI’s full potential. A structured regulatory framework would provide clarity, build trust and create the conditions for responsible and effective AI deployment.
This process depends on cooperation between ethical and security regulators, international standardization bodies, offshore industry organizations and corporate leadership. Frameworks such as the EU AI Act and GDPR establish legal and ethical boundaries, ensuring fairness, transparency and data protection. However, without accompanying technical standards, compliance remains challenging in practice. International organizations responsible for standardization, such as ISO, contribute significantly to defining how AI should function in offshore environments, but their impact would be strengthened by industry-specific guidelines.
About the author
Dino Dragun is the CEO and founder of Hidrocibalae, a leading marine geophysical data centre, and a board member of CROAI, the Croatian AI Association. With over a decade of experience in the offshore industry, he focuses on business strategy, strategic development and advancing innovative approaches in offshore data management.
The offshore industry plays an essential role in shaping AI adoption, ensuring it aligns with safety protocols, operational efficiency and risk management. At the same time, leading offshore companies can help bridge the gap between regulatory requirements and real-world applications by fostering shared industry-wide principles. Without clear and consistent guidelines, inconsistencies in implementation will continue, creating hesitation among businesses looking to integrate AI into their operations.
Until a well-defined regulatory and standardization process is in place, many companies will approach AI adoption with caution due to legal uncertainties and operational risks. Accelerating this process would provide clarity, remove barriers and allow the offshore sector to embrace AI with greater confidence, unlocking its potential to enhance efficiency, safety and sustainability.
Conclusion
Over time, the application of AI will continue to yield increasingly reliable results, and we are already seeing improvements in efficiency and accuracy. However, the transition will not be immediate, as the high stakes and inherent risks in offshore operations make full automation unlikely any time soon. That said, we should remain optimistic and continue pushing boundaries, exploring new possibilities and accelerating AI adoption where feasible. By strategically integrating AI into workflows, we can enhance efficiency while maintaining expert oversight, ensuring that innovation drives progress without compromising reliability and safety.
The future of offshore AI will not be decided by technology alone, but by the people who learn how to use it best.
References
1. PwC (2020). Sizing the Prize. What’s the Real Value of AI for Your Business and How Can You Capitalise? https://www.pwc.com/gx/en/issues/analytics/assets/pwc-aianalysis-sizing-the-prize-report.pdf
2. Statista. (2024, December 5). AI adoption among organizations worldwide 2017-2024, by type. https://www. statista.com/statistics/1545783/ai-adoption-amongorganizations-worldwide/
Bathymetric Lidar enhances monitoring and mitigation of environmental impacts
Aerial surveying for climate action
By Ada Perello, EAASI
In the constantly evolving landscape of climate change, geospatial science stands out as a vital tool for understanding and addressing the complexities of our changing world, with aerial surveying playing a significant role in this effort. In this short article, the European Association of Aerial Surveying Industries (EAASI) highlights how Woolpert is using airborne topobathymetric Lidar to showcase the critical contribution of aerial surveying in advancing climate change monitoring.
In the constantly evolving landscape of climate change, geospatial science stands out as a vital tool for understanding and addressing the complexities of our changing world, with aerial surveying playing a significant role in this effort. In this short article, the European Association of Aerial Surveying Industries (EAASI) highlights how Woolpert is using airborne topobathymetric Lidar to showcase the critical contribution of aerial surveying in advancing climate change monitoring.
Over the last two decades, there have been significant advancements in aerial survey technology, revolutionizing crewed aerial surveying operations. These advancements have enhanced the accuracy, efficiency and versatility of aerial surveys, expanding their applications across various sectors.
In parallel, an alarming acceleration of climate change has been observed. According to the World Meteorological Organization (WMO), 2023 was the warmest year on record. Remarkably high land and sea-surface temperatures have been prevalent since June, coupled with an unprecedented decrease in Antarctic Sea ice levels. Disturbingly, the areas impacted by drought have surged by 29% since the turn of the millennium. The frequency of extreme weather events is soaring, painting a gloomy picture. Unless greenhouse gas emissions are curbed, these impacts will intensify, bringing even graver consequences.
Benefits of aerial surveying
How can aerial surveying help? Aerial surveying plays a crucial role in climate change monitoring. Modern aerial platforms can gather diverse data, enabling tracking of changes in land cover, vegetation health and other climate variables over large spatial scales. Aeroplanes and helicopters provide access to difficult or dangerous-to-reach areas, essential for monitoring remote areas like glaciers, ice sheets and coastal regions. The frequency of data collection is high, allowing consistent tracking of climate variables over time, and aiding in a more comprehensive understanding of changes in the climate.
For monitoring changes in coasts and rivers, crewed aerial surveying employs bathymetric Lidar and photogrammetry. Bathymetric Lidar provides precise underwater topography mapping, essential for studying coastal erosion and its impact on habitats. Photogrammetry aids in monitoring riverbank erosion and sediment transport. These insights contribute to sustainable coastal and riverine management to address climate change-induced challenges.
Bathymetric projects
Woolpert was contracted to acquire topobathy Lidar data of Saint Lucia’s entire landmass and coastal zone. The contract
Leading geospatial specialist Woolpert delivers aerial survey services including topographic and bathymetric Lidar data around the globe to assist governments and local communities in making informed decisions to mitigate the impact of natural disasters. (Image courtesy: Woolpert)
About the author
Woolpert collected high-altitude bathymetric Lidar data from 3,048 metres, or 10,000 feet, over Fort Lauderdale, Florida, in 2021 via newly patented technology incorporated into the BULLDOG sensor. The data measured depths in excess of 55 metres. This image notes the range of depths in soundings and contours, courtesy of NOAA’s Electronic Navigational Charts map service. (Image courtesy: USACE/JALBTCX)
was signed under the World Bank’s Disaster Vulnerability Reduction Project (DVRP), which aims to measurably reduce vulnerability to natural hazards and climate change in Saint Lucia and the Eastern Caribbean Region.
In 2022, Woolpert was contracted by The Pacific Community to collect topo-bathy Lidar data and aerial imagery for the Kingdom of Tonga. The data was collected to support nautical charting for navigation safety, infrastructure planning and rehabilitation, and disaster resilience and recovery. This project is part of The Pacific Community’s Pacific Resilience Program, also funded by the World Bank. It is working to strengthen early warning systems and enhance natural disaster and climate change resilience across Pacific Island countries prone to natural disaster events such as cyclones, storm surges, coastal inundation, earthquakes and tsunamis.
Woolpert has supported several US organisms, including the Joint Airborne Lidar Bathymetry Technical Center of Expertise (JALBTCX),
Ada Perello is the communications manager at the European Association of Aerial Surveying Industries (EAASI), which was established in 2019 to unite companies generating geographic data from crewed aerial platforms and has experienced rapid growth ever since. Prior to joining EAASI, Perello worked in external communications for organizations like IMO, FAO and the private sector. She holds a master’s degree in Journalism and International Business Administration.
National Geodetic Survey, National Oceanic and Atmospheric Administration (NOAA NGS), Office for Coastal Management, National Oceanic and Atmospheric Administration (NOAA OCM) and United States Geological Survey (USGS), with topo-bathy Lidar data acquisition in the Pacific Region and the USA for coastal resilience, modelling and post-storm response. Most recently in Alaska, such data supported JALBTCX and NOAA NGS in their post-storm response aerial surveys after Typhoon Merbok.
In the USA, Woolpert collects high-density Lidar of the coastline for multiple counties in Florida at the beginning of each hurricane season. In the event of a hurricane or strong storm, Lidar is captured again and a comparative analysis conducted. To assist authorities to better plan and mitigate erosion along the coastline, elevation changes are then modelled between the two datasets and a volumetric analysis created of where the sand loss and gain occurred. This aerial-derived data enables coastal communities to assess vulnerability and plan their next steps to resilience.
Potential of airborne data
Scenario simulations, particularly digital twins, have the potential to revolutionize climate-resilience decision-making. These models can simulate diverse climate-related scenarios, offering insights into vulnerabilities and necessary adaptations. Digital twins enable proactive planning and management, safeguarding both people and planet from the escalating impacts of climate change.
While airborne data collection remains a cornerstone, the true power lies in the ability to seamlessly combine and harness data from diverse sources. This synergy is a game-changer, enabling society to unravel the multifaceted impacts of climate change and land degradation with unparalleled precision. By fusing insights from aerial surveys, satellite imagery, ground-based data and advanced sensor technologies, we gain a comprehensive understanding of our changing world. It is through this multi-layered approach that we can equip ourselves to address the challenges posed by climate change, armed with the knowledge needed to make informed decisions, adapt to shifting circumstances and work towards a more sustainable future.
3D mapping of New Zealand’s coastline kicks off
A new project is getting underway to map large parts of New Zealand’s coastline in remarkable detail to help communities mitigate the impacts of climate change and understand the country’s ever-changing coastline. Toitū Te Whenua Land Information New Zealand (LINZ) has selected two suppliers to collect high-definition Lidar data as part of its 3D Coastal Mapping programme.
Stuart Caie, who is leading the programme for LINZ, explained that the data will be instrumental in creating 3D maps of vulnerable and densely populated coastal areas: “Being part of a small island nation, New Zealanders living and working near the coast are exposed to climate events and natural hazards such as tsunamis, and these will impact valuable infrastructure, environmental and cultural assets close to the sea, as well as coastal biodiversity.”
The two companies contracted to collect the Lidar data are Woolpert NZ for the North Island and NV5 Geospatial for the South Island. Areas planned to be mapped this summer include coastlines in Gisborne, Bay of Plenty, Taranaki, Manawatu-Whanganui, Hawke’s Bay, Wellington, Oamaru, Timaru, Dunedin, Southland and Westland.
Lidar for understanding coastal dynamics
Planes need to fly at around 500 metres above the ground when capturing the Lidar data, so people may notice when planes
are in their area.
“Coastal mapping data is used by scientists and environmental planners to better understand how the country may be impacted and help keep communities and infrastructure safe, as well as protect ocean biodiversity through improved habitat mapping.”
Proposed areas for 3D coastal mapping in New Zealand. (Image courtesy: LINZ)
LINZ’s 3D Coastal Mapping programme will create baseline data for up to 40% of the coast over the next three years. The data will be made freely available on the LINZ Data Service website and the LINZ Basemaps service once processed.
By leveraging Lidar, extensive portions of New Zealand’s coastline have been mapped in extraordinary detail, offering a comprehensive view of its constantly evolving shoreline. This high-resolution data enhances the understanding of coastal dynamics and supports more accurate assessments of both terrestrial and shallow marine environments.
“As we’ve seen with other Lidar data on land, the coastal data can be used to assess changes to the coast through erosion or subsidence, build-up of dirt and debris from cyclones or weather events, and land uplifting from earthquakes,” Caie added. “We know scientists are excited about this data and the modelling that it can enable, especially as storm surges are likely to become more frequent as sea levels rise in the future.
“To know how much New Zealand will be impacted, we have already begun installing global positioning receivers at sea-level gauges around the coast. These sensors measure changes in the vertical movement of the land and, coupled with the sea-level gauges, will allow us to work out the effect of sea-level rise over time,” Caie continued. “This information will go hand-in-hand with the coastal mapping data for analysis by researchers and planners.”
The data will be used to update nautical charts for maritime safety, a core part of LINZ’s hydrographic work programme.
LINZ’s 3D Coastal Mapping programme will create baseline data for up to 40% of New Zealand’s coast over the next three years. (Image courtesy: Pixabay)