

Visibilizing the Invisible
Leveraging Technology to Foreground Nature in the City

Acknowledgements
This research ‘Leveraging technology to foreground nature in the city’ was conducted in Bangalore and Kathmandu. The research is partly funded by the Royal Academy of Engineering (RAE) under the Reversing Environmental Degradation in Asia and Africa (REDAA) program. We acknowledge the support of Utopia, our project partner in Kathmandu.
We acknowledge the support of APSA (Association for Promoting Social Action) in facilitating the primary research in Bangalore.

Methodology
City Comprehension
City Region Spatial Linkages
Historical Evolution
Visibilising Nature in the Expanding MetropolisBangalore’s Valley and Tank Systems
Ecosystem Services Offered by Tanks
Ecological Fragmentation
City Comprehension Summary
Ward level Visualization
Training a lens at the Ward Scale
Land use Plan
Locating Informality
Parks and Open Spaces
Social Infrastructure - Anganwadis
Summary

Settlement level Visualization
Training a lens at the Settlement/ Neighbourhood Scale
Janatha Colony
Climate Stressors and Coping Mechanisms
Sarojamma Badvane
Climate Stressors and Coping Mechanisms
Knowledge Dissemination
Co-ideating Tenets for Data Platform
The Context
Charting pathways to sustainable cities remains a challenge in the twenty-first century, more so in the global South, where unprecedented urbanisation, attendant environmental degradation and increasing inequity and inequality exacerbated by changing climates are glaringly visible. Even as the focus on the urban ecology discourse has seen renewed academic and practitioner interest, its influence on formal urban planning and policy approaches remains limited. Positioned at the crossroads of urban studies and environmental studies, the urban ecology discourse constitutes a useful framework to explore nature in the city inclusive of the everyday day living and livelihoods that nature supports. The myriad forms of living, lived experiences and livelihoods are near invisible in formal plans and policies thanks to the dominant top-down, siloed and fragmented approach to plan cities.
Conventional planning approaches do not facilitate an understanding of the entwined relationship between everyday living environments and ecological dependencies. If not visibilised, these approaches will intensify the already existing socio-spatial-economic fragmentation. It is in this context that a comprehensive visibilisation of nature in the ‘everyday’ city emerges critical, especially to understand cities as sociospatial-ecological landscapes and the impact of urbanization-induced climate change on these landscapes. Such a visibilisation is critical to knowledge production that o be seen (mainly in the context of making minority/marginalised groups more visible to the mainstream). We use the concept of ‘lived’ city to signify the complex, multi-faceted and dynamic nature of everyday activities that defies the manufactured binaries of state-society and formal-informal.


Conventional planning approaches do not facilitate an understanding of the entwined relationship between everyday living environments and ecological dependencies.
The Dynamic and Complex Lived City
The Imagined and Planned City
Identification of Scales


The research leverages technology to zoom into a sub-city scale - the ward and the settlement scale - to get a comprehensive understanding of various socio-ecological-spatial relationships. In the first instance, the technology tool of KoboCollect is used to collect and collate qualitative and quantitative data. In the second, a digital platform is envisaged for data visualization to visibilise the everyday city.
To visibilise nature in the lived city, the project took a multi-scalar (city, ward and settlement) process of data collection and spatialization. Each scale called for a distinct approach and a distinct data visualization format. While secondary data was used to spatialize the city-scale data, geo-tagged audio-visuals and oral narratives were used at the sub-city scale. Using existing digital visualization platforms, the perceptions and lived experiences are gathered and overlaid spatially with the secondary data to integrate different streams of knowledge (qualitative, experiential, quantitative, scientific) in comprehending the everyday city. Finally, a stakeholder workshop was convened to co-ideate the

Dissemination of knowledge


tenets of a data platform that is relevant and useful for inclusive urban and climate planning of cities. Insights from the stakeholder workshop were used to design a preliminary wireframe for the platform.
The research leverages technology to zoom into a sub-city scale - the ward and the settlement scale - to get a comprehensive understanding of myriad socioecological-spatial relationships.
Stakeholder Workshop Digital Tool
City
02
Methods
The research is conducted in two cities – Bangalore and Kathmandu, employing a mixed-methods approach relying on secondary research and primary field engagement. At the city scale, the approach relied on secondary data in different formats sourced from scholarly articles and books, government documents, census data, remote sensing indices and popular media amongst others. Maps emerged as a primary data visualization tool to spatialize city ecology, historical evolution and urban expansion.
At the ward scale, the available secondary data offered a surface-level understanding, necessitating a ground-truthing exercise on two counts: firstly, to avoid any discrepancies in the collected data (elaborated in the subsequent sections) and secondly, lack of granular data, thus masking a nuanced understanding of the ward. The quality of data called for primary engagement that sought to address data gaps and verify the accuracy of available data. Transect walks, focus group discussions and key informant interviews with people in the ward were used to collect data and make comprehensive thematic maps of environmental assets/ elements, basic services, built fabric, mobility, informal settlements and climate impacts.
Delving deeper, at the settlement a complete lack of secondary data led to a primary engagement through transect walks, focus group discussions and key informant interviews. Two settlements were identified based on their proximity to urban ecologies – a lake and a storm water drain (Rajakaluve). KoboCollect – a mobile-based tool was leveraged to

collect and collate primary data (qualitative and quantitative) at this scale. To begin with, a survey questionnaire/guidance was prepared on KoboCollect around settlement history, access to basic services, and relationship with ecological features. Kobo allows for data capture in multiple formats like photographs, video recordings, audio recordings, geo-location and notes. Data visualization formats such as sketches, maps and audio-visuals were explored. For instance, video recordings captured the oral narratives of the community, sketches documented the spatial relationships and nuances of the settlement, and maps communicated the spatial distribution of activities and the relationship of the settlement with the larger city.
Kathmandu
Bangalore
Experience of Using KoboCollect
The KoboCollect allows for capturing information as notes, audios, visuals and videos. While the questionnaire was used to guide the FGDs, overall, the tool limits useability.
The tool facilitated collecting and collating quantitative data on the demographics of the settlement (people, number of households, number of resources such as community toilets and anganwadis) and frequency and location of climate-change induced events amongst others. However, capturing qualitative data is a challenge. As the conversations were intended to be open-ended, guided by a semi-structured questionnaire, the fluidity and complexity of data that emerged was difficult to record on KoboCollect. Further, while the tool allows capturing data as photos, audio, and videos, it does not allow diverse forms of data to be captured simultaneously. For example, it does not allow recording a video while an audio recording is going on or making notes while video recording. This restricted the process of gathering different information simultaneously. Finally, while the tool worked without an active internet connection as it stored the data locally, it was challenging to send large/heavy data (e.g., videos and photos) to the server for centralized storage and download.


City Comprehension
Official documents, Books, Articles, Maps
Secondary Sources
Ward Visualization
Themes
City-region Linkages
Evolution
Tank System
Ecosystem Services
Encroachment of Wetlands
Climate Events
Ward Plan Case Studies
Ward Committee Functions
Residential
Land Use
Cadastral Maps
Bus Routes
Commercial
Parks and Open spaces
Public Spaces
Old Settlements
Lake Boundary
Water Supply and Sanitation
Anganwadis and Schools
Slum settlements
Interview with Ex-councilor
FGDs, Transect walks
Primary Sources
Missing land use data and erronous mapping
Settlement History
Encroachment of lake
Missing Bus routes
Shortage and coverage
Shortage and location
Identification of informal settlements
Transformation
built character
Vending zones
Settlement Visualization Knowledge Dissemination
Google Satellite images and Revenue maps
Secondary Sources
Study of surrounding urban fabric
Cadastral Maps Old Settlements
Lake Boundary
FGDs, Transect walks, Key informant Interviews
Primary Sources
Stakeholder Workshop
Themes
Settlement History
Transition in Urban Landscape
Livelihoods Community Spaces
Climate Stressors
Relationship with ecology
Preliminary Wireframe for digital tool
Use-case Exploration
Low-fidelity Prototype
High-fidelity Prototype


03
City Comprehension
Sarakki Lake
City-Region Spatial Linkages
The characteristic topography of Bengaluru has been a critical determinant for its water systems and water flow dynamics which in turn has determined how human life and development aggregated. The city and its topography takes the shape of an inverted saucer with the highest areas located in a flat centre with gradually slopes towards the south-east and south-west. This terrain is further characterized by several interspersed ridges and valleys that delineate smaller watersheds in the land. A central ridge that runs from north to south marks the structure of the land morphology defining four major valley systems: Hebbal, Arkavathy, Koramagala-Challaghatta and Vrishabhavathy valleys.

Historical Evolution
The historical evolution of Bangalore was mapped leveraging multiple secondary data. The mapping reveals the city’s temporal expansion: pete – cantonment – municipality-metropolismegapolis and a concurrent transformation in the city’s ecology. As the city expanded from a jurisdictional area of 66.2 sq km in 1949 to its present area of 800 sq km, the municipality and utilities failed to keep pace. In particular, in the period starting 2006, the city witnessed a four-fold expansion where it engulfed 110 neighbouring villages and eight smaller municipalities in the vicinity. As the city’s jurisdiction expanded, the planning body failed to steer growth through its plans.


BBMP
Dakshin
Pinakini
BMA
Nandi Hills
TG Halli Reservoir
Hesaraghatta
Arkavathy
Banerghatta
Historical Evolution


1700s Pete
Cantonment
Megalopolis


Cantonment Expansion
Late 1800s
Early 1900s
Late 1900s Municipality
Metropolis
Early 2000s
Visibilising Nature in the Expanding Metropolis - Bangalore’s Valley and Tank Systems
Bengaluru was historically called ‘Kalyananagara’, a city of kalyanis or lakes. The four valley systems within the Bangalore Metropolitan Area – Arkavathi Valley, Hebbal Valley, Koramangala Challaghatta Valley and Vrishabhavathi Valley host five lake series -Yellamallappa Chetty , Varthur , Hulimavu , Puttenahalli and Byramangala.
The Bengaluru Metropolitan Area was reported to have 1,521 water bodies in the 1800s as recorded by the Environmental Management and Policy Research Institute (EMPRI) - an autonomous institute established by the Government of Karnataka. As per EMPRI’s survey of 2017, only 684 (out of 1,521) exist. The remaining 837 waterbodies are either lost or converted to other uses. The 1,521 lakes are inventorised in the Lake Atlas, providing detailed information for 497 wetlands. This includes the lakes morphology, biotic condition, water quality, hydrology and socio-economic dimensions (please refer the images on page 44).
The research visualized this data on maps to provide a city-scale snapshot of the wetlands and the Eco-System Services these offer. The lake atlas identifies the 102 lakes that no longer exist. Majority of these (#88) are located within the municipal area. Further, the maximum lost lakes are found in the KoramangalaChallaghatta Valley, manifesting in more flood hotspots in this valley. The valley-wise lakes lost, and flood-prone areas are mentioned in the adjacent table.

Valley
Arkavathy
Hebbal
Koramangala -Challaghatta Vrishabhavathy


Encroached Weltands in Bangalore

Flood-prone Areas in Bangalore

Construction debris disposed into the lake Picture Credit - Prajavani, Logical Indian
Filling up of a lake Picture credit - Ballotbox India
Ecosystem-services Offered by Tanks
Most lakes within the city provide recreational (and in a few cases cultural) services while those on the periphery of the city continue to embed livelihoods associated with agriculture, livestock management and fishing. Lakes in the core city have been revived for leisure, aesthetics and health. While such a spatialization allowed for an overall understanding of wetlands that continue to provision the city as well as the transformation of the socio-ecological relationships because of the urbanization; it does not allow for a deep dive to understand the specificities of the lake ecosystem.


Livestock Management
Bathing and Washing
Dhobi’s washing clothes at Madiwala lake
Ecological Fragmentation
To trace the ecological systems and their fragmentation over time, remote sensing indices such as NDVI (Normalized Difference Vegetation Index) and LST (Land Surface Temperature) were calculated using satellite imagery. A clear trend of increasing built space, decreasing vegetation leading to increase in surface temperature is visible through the maps.
LST-NDVI relationship is significantly considered in environmental studies. It is observed that as the vegetation decreased through the years the land surface temperature has increased reflecting a negative relationship between the two.
Normalized Difference Vegetation Index


Land SurfaceTemperature


City Comprehension

Summary
A spatialization of secondary data – in various formats - from myriad sources allowed for a comprehension of the city along various dimensions. While enabling an entry point to frame the challenges at the sub-city scale, such comprehension is not sufficient to provide the contextual nuances of changing climate impacts on city ecologies, attendant biodiversity loss and the disproportionate impact on the urban poor and marginalised communities that rely on these ecologies.
The panoramic view of the challenges at the city level fails to dive deep to provide an experiential dimension of the lived city.


Sub-cityWard level
Visualisation
Hunsemara settlement near Vibhutipura Lake
Training a lens at the Ward Scale
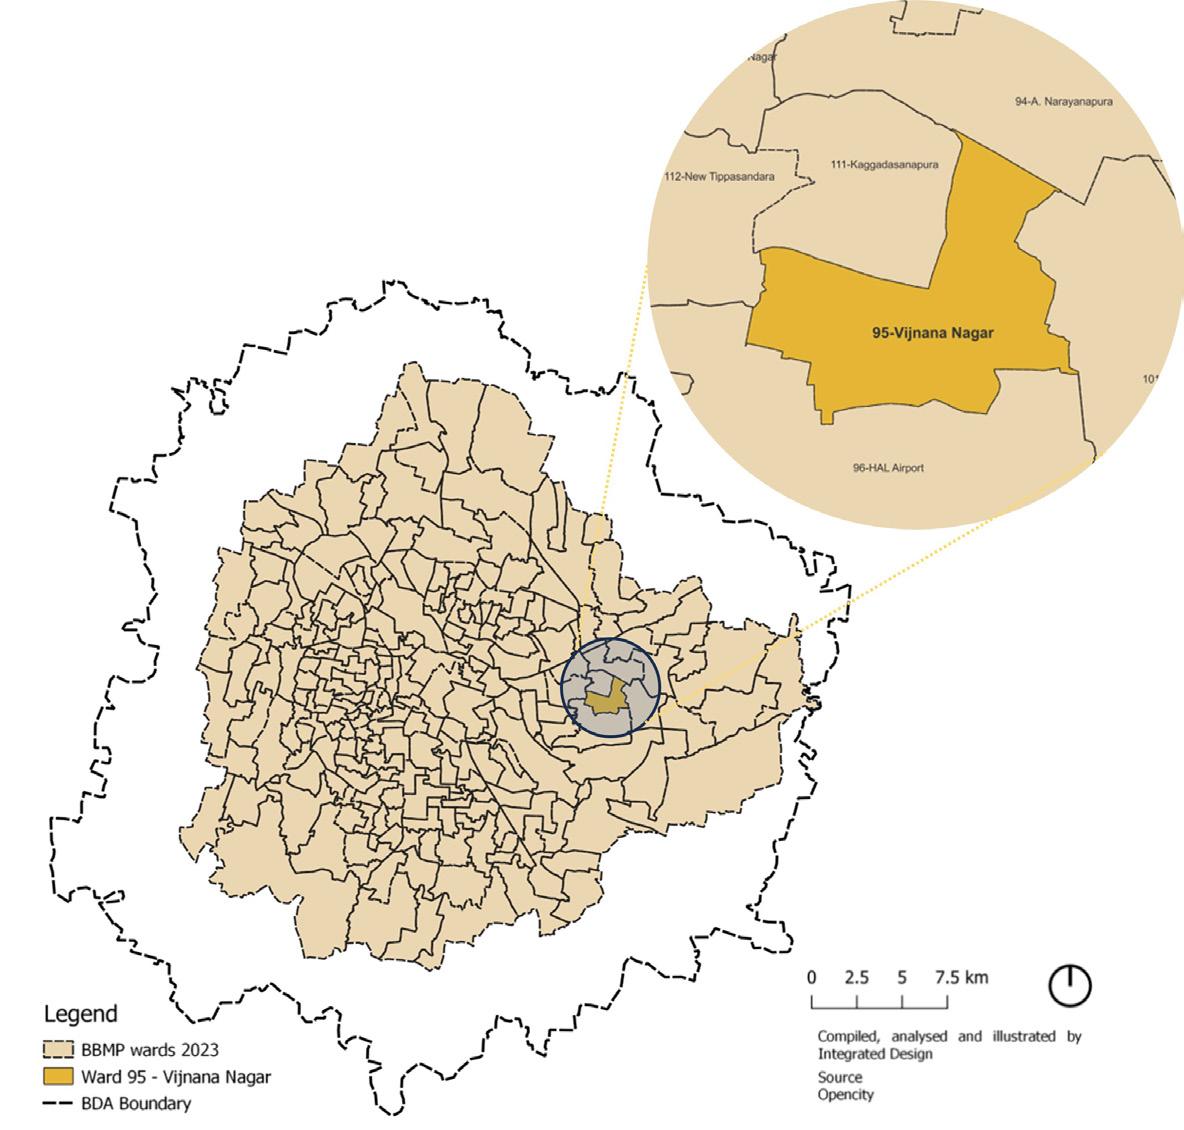
Vijinana Nagar ward1 in the Mahadevpura zone in the Koramangala Challaghatta valley was selected for a sub-city scale exploration.2 The ward had been a part of several jurisdictions before it was absorbed into the present-day megapolis. Located in the Eastern periphery, its proximal location to the city’s burgeoning IT industry on one hand, and the Outer Ring Road on the other, led to an accelerated pace of urbanization and large-scale conversion of farmlands – primarily to accommodate the rising demand for IT and residential layouts.

1 Smaller terriritorial constituencies or geographical areas within a municipal area.
2 Given that the KC valley has witnessed the disappearance of several lakes and has maximum flood-prone areas, a ward here emerged ideal for studying socio-ecological fragmentation.
Ward No.
Land use Plan
The Existing Land Use Plan (ELU, RMP 2031) provides a snapshot of the land use distribution in the ward - predominantly residential with a significant portion to the west under defense use. In the north, the ward is bordered by a railway line. The ward hosts one lake – Vibhutipura lake. The commercial spine is primarily concentrated along main roadsKaggadasapura, Basavanagar and Annasandrapalya. Additionally, there are pockets of public and semi-public spaces comprising of educational institutions and religious areas. The unbuilt private lands are shown as blank spaces in the ELU.


In ELU - Park and open space On-ground - Graveyard
In ELU - Public and semi-public On-ground - Private land, presently a part of it is a residence
In ELU - Industry On-ground - Commercial In ELU - Commercial On-ground - Residential In ELU - Parks and open spaces
On-ground- Private park inside a residential apartment.
The ward has a limited number of parks and playgrounds. A ground truthing of the ELU via transect walks revealed several discrepanciesa graveyard and a private park inside a gated residential development are shown as parks and open spaces land-use; a residential apartment is shown as commercial land use. The ground truthing exercise indicated a lack of granular zoning at the ward level. Open spaces varied in nature and usage calling for a granular categorization/ land-use.
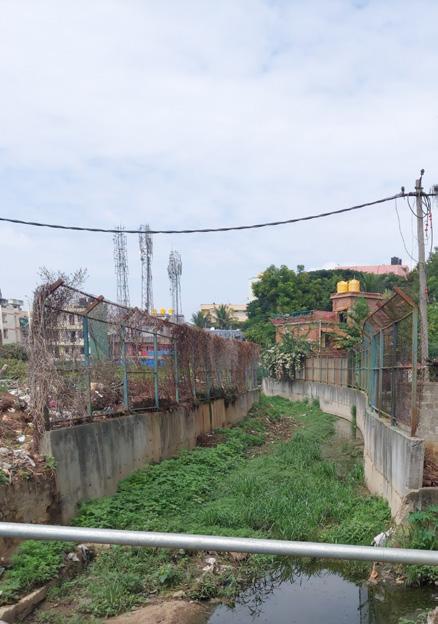
The Cadastral maps (also referred to as revenue maps) of the villages that now comprise the ward are a valuable source of data. A study of the older habitations in the villages reveals the historically evolved socio-spatial relationships between the communities and the lake. When overlayed with the present-day ward boundary, the layers are revealing on several counts, two of which merit mention. First, the exercise allowed locating historical settlements and their structuring. The original habitats were located strategically at a higher altitude while the adjacent low-lying areas were used for cultivation using the natural slope of land for irrigation. As the city expanded, an accretive transformation was observed. While an ancient temple (dating back to 1187 AC) continues to be the key marker, the surrounding built fabric has transformed from hut-like structures to cement constructions. The neighbourhood is characterized by narrow lanes that impede construction as well as the upgradation of basic service infrastructure – essential to service the increasing population. In the absence of sanitation infrastructure, sewage is directed to the lake via the stormwater drain. Informal development emerged as the dominant mode of urbanization.
Second, the original area of the Vibhutipura lake and the network of stormwater drains connecting to the upstream and downstream lakes revealed that the current area of the Vibhutipura lake is much smaller than shown in the cadastral map. Primary field work revealed


Settlement near Vibhutipura Math which dates back 1000 years formerly known as Vachhideverapura Village


Settlement between the Vibhutipura Math and lake which which is currently known as shivshakti colony.


Marked as Hosapalya in the cadastral map could not be located on ground due to establishment of commercial complex.


Settlement near the Yellamma Temple with remnants of old houses dating back to at least 4 decades ago.


Extension of Yellamma Temple settlement situated near Rama-Anjeyana temple.


encroached edges, primarily by residential land uses. The eco-system services that the lake once provided stand comprised. Even as the lake is restored as a fenced boundary with civic amenities, parks, walking track and benches, the stormwater outlet to its downstream lake is blocked leading to the flooding of the nearby low-lying areas.
While the ELU marks the Vibhutipura Lake as a waterbody, it fails to capture the lake’s ecological significance lacking crucial ecosystem services the lake provides, essentially rendering it a static representation on paper. Furthermore, the categorization of informal settlements around the lake as simply “residential” obscures their informal character and, more importantly, masks their dependence on the lake for various purposes.
This invisibility of both the lake’s ecological functions and the surrounding communities’ reliance on it is particularly concerning in a city like Bangalore, where a network of interconnected lakes plays a vital role in the urban ecosystem. As the case of Sarojamma Badavane (explored in later chapters) demonstrates, pollution and sewage flowing through stormwater drains can have a devastating impact on downstream lakes, leading to waterborne illnesses. Therefore, it is critical to make these aspects visible to sustain and maintain the functionality of the overall ecosystem.


Illegal access to the lake; Encroached area of the lake by residences


Vibhutipura Lake Livestock rearing, grazing, recreation and health
Mammals, emerging aquatic life, birds and butterflies
Doddanekundi Lake Livestock rearing, recreation and health Mammals and emerging aquatic life, birds and butterfly

Lakes Activities Flora and Fauna
Broken fence and garbage dumping
Stormwater Inlet of the lake
Bunds and islands constructed after rejuvenation
Cattle grazing observed at the lake
Locating and (Mapping) Informality


In the absence of adequate and accurate data on informal settlements, locating and mapping these is an emerging imperative, especially to comprehend vulnerable locations and people. A walk around the ward helped identify sixteen informal settlements/areas in the ward. FGDs and transect walk in four settlements led to granularity of data and information on households, settlement history and age, access to basic services, healthcare and housing typology. The data was triangulated through multiple interviews and Google satellite imagery. Majority of the informal settlements are located on precarious lands exposed to climate-related hazards. Thus, with extreme events such
as floods, the communities are at the forefront of climate-induced vulnerabilities. Granular data on vulnerabilities and risks as well as coping mechanisms is necessary to inform policy responses.
Granular data on vulnerabilities and risks as well as coping mechanisms is necessary to inform policy responses.
Parameters studied for four selected settlements
Parameters
Number of households
Ownership
Owner Tenant- 13000 rupees per month rent
Tenant - 1000 rupees per month rent
Tenant - 1000 rupees per month rent
Origin and settlement age Kolar district, 40-50 years Raichur district, 10 years Gulbarga and Raichur, 10 years Mantralaya, Raichur, 25-30 years
Basic services
Solid waste management
Cauvery water and borewell water are available, grid connected electricity and toilet facility
Daily garbage collection by municipal corporation
Tanker water, solar electricity, shared toilets with illegal water connections.
Daily garbage collection by municipal corporation
Tanker water twice a week, solar electricity and shared toilet facility.
Waste not collected. Dumping of waste into stormwater drain.
Cauvery water supply twice a week (2 connections), grid connected electricity, shared toilet.
Daily garbage collection by municipal corporation
Occupation and mobility
Men - mostly unemployed (substance abuse and theft), Women - Housekeeping, small shops and vending
Housing typology pucca and semi-pucca, narrow alleyways.
Men - construction workers; Women - Housekeeping. Use autorickshaws to reach nearest bus stop.
Blue sheet huts with sheet walls.
Men - construction workers; Women - Housekeeping. Use autorickshaws to reach nearest bus stop.
House made of metal sheets.
Men - construction workers, small traders; Women - housekeeping.
Blue sheet huts with semi-pucca houses
Healthcare and school
PHC and government school
PHC in Vibhutipura and Rameshnagar, government school in Vibhutipura.
PHC in Vibhutipura and private clinics. Government school and Brindavan tent school.
PHC in CV Ramannagar and government school in Vibhutipura.
Parks and Open Spaces

Parks and open spaces were first mapped through the ELU 2031 and then ground-truthed via a primary survey. As per guidelines and standards, the ward lacks open spaces.3 The ward features five parks, four of which are located within the lake premises. These relatively small spaces were observed as waste dumping spaces. Several playgrounds – also shown as open spaces, in effect, are affiliated to educational institutions.


Social Infrastructure - Anganwadis

Anganwadi, a day care centre is an essential social infrastructure that provides healthcare and education, especially for the poor and marginalised families. They also serve as important disaster relief centres for vulnerable populations. Thus the even distribution of this infrastructure is critical. Based on secondary data eight anganwadis were mapped. However, only three out of the eight locations were confirmed as Anganwadi. The other five had different land uses like open defence land, residential land and women’s sewing school.
According to URDPFI guidelines, each Anganwadi is expected to serve a population of 5000. Therefore, Vijnana Nagar ward with a population of 39,954, the four Anganwadis cater to an estimated population of 20,000. However, most of the Anganwadis are located in the southern part of the ward, which creates an imbalance in terms of serving the population. This information can be further used to understand at different scales from ward and higher.


Sub-City - Ward-level Visualization

Summary
As is evident, understanding the sub-city scale (the ward in this case) calls for an integrated top-down and bottom-up approach to collecting data as well as verifying existing data. Such an approach is crucial to inform city-level plans be these Master Plans, Climate Action Plans, Comprehensive Mobility Plans or the Transit Oriented Development Plans, amongst others.

Sarojamma Badvane Settlement
Training a lens at the Settlement/Neighbourhood Scale


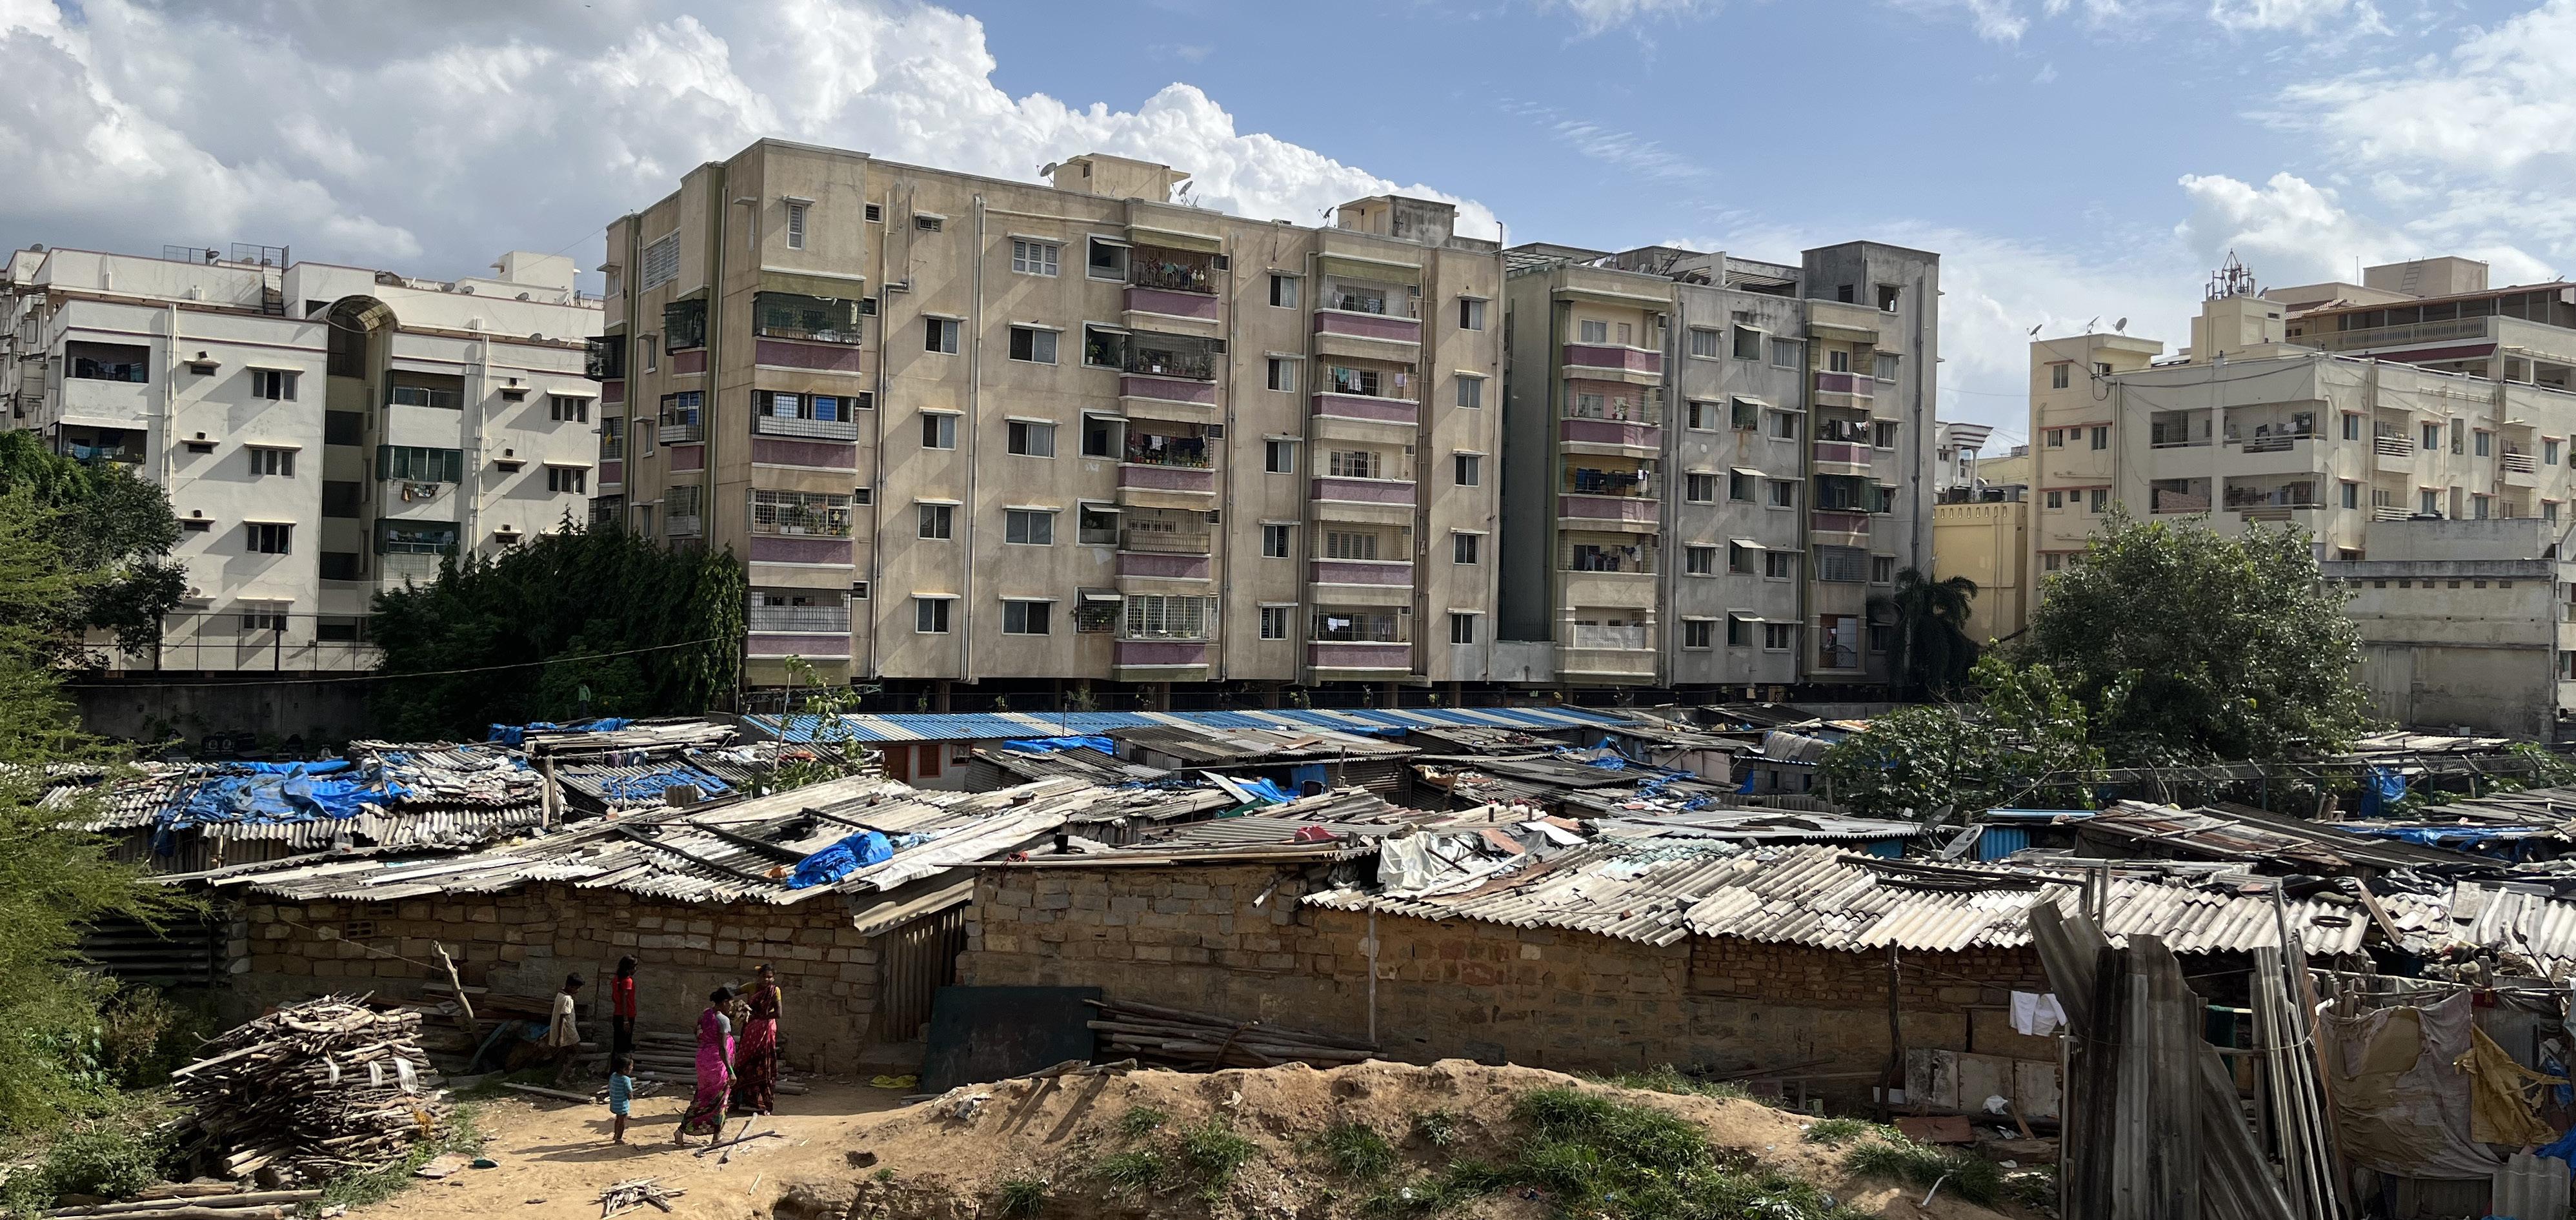
Visibilising the settlement scale is crucial given the inability of formal planning tools to account for marginalised communities and their socio-economic precarity. Two settlements – Janatha Colony and Sarojamma Badavane located on the eastern periphery of Bangalore were selected. Janata Colony is a small, notified slum settlement of 84 families concentrated in an area of about 5000 square metres. Sarojamma Badvane, on the other hand, is a nonnotified slum with approximately 200 houses. While the census data (1971-2011) allowed for an understanding of the locational context of both settlements, the cadastral maps helped understanding the evolution of the settlements, including the transitions in the planning and administrative jurisdictions. Janatha Colony is abutting a lake that once provisioned the village of Bhattarahalli (Bhatta meaning brick and halli meaning village). As urbanisation progressed, the village was absorbed by the nearest municipality before it was incorporated within the Bangalore municipal jurisdiction in 2007. Sarojamma Badvane is on either side of storm water drain (Rajakaluve) connecting Kaggadaspura lake with Beniganahalli lake. Both settlements experience intense flooding during the rainy season, thanks to shoddy urbanisation and changing climates.
An extensive primary survey was conducted in both settlements to comprehend the settlement evolution, its
Janatha Colony
Sarojamma Badvane
dependencies with the natural ecology of the lake and the rajakaluve, urbanisation induced fragmentation, changing livelihoods, available community spaces, climate stresses and coping mechanisms amongst others. The KoboCollect digital survey tool was deployed here. The data obtained was spatialised and triangulated with the satellite maps across different years as well as other spatial data including that of the Master Plan. Geographically referenced audiovisuals and field notes were used to capture the rich experiential data.


The research visibilizes the otherwise invisible vulnerabilities and coping mechanisms of both settlements. Photographs, audio-visuals and sketches became suitable tools to capture the qualitative and experiential data.


FGD conducted at Janatha Colony
FGD conducted at Sarojamma Badvane
Janatha Colony


Janatha colony located on public land is part of Bhattarahalli village, abutting the lake with the same name. While agriculture was the main livelihood in Bhattarahalli, several families were engaged in bangle-making. Both these livelihoods are no longer practiced, although some members of the community continue to sell bangles. Similarly, the sole brick factory, located strategically on the lake periphery to access to water and mud - essential materials for brick production - is no longer in existence. It attracted a migrant workforce from neighbouring districts of Mandya, Kolar, and Chikkaballapur whose once-upona-time dwellings– kaccha houses made of mud - constitute the present-day informal settlement.
Rapid urbanization of the area transformed the socioecological landscape and livelihood of the Janatha colony. Agricultural fields were converted into residential, commercial and institutional land uses. As with Vibhutipura, Bhattarahalli Lake also emerged as a cess pool making the water unfit for domestic use with many residents reporting on the deteriorating water quality of the borewells. As with Vibhutipura, Bhattarahalli Lake too was rejuvenated incorporating a walking path, park and fence.
Urban expansion has significantly impacted livelihoods,
Urban Trajectory of Battrahalli village

leading to a shift towards occupations in the service sector, such as domestic workers, security guards, and vegetable vendors. Previously, cattle ownership was widespread amongst households, but due to limitations in available grazing land, it is near negligible today.
“We used to take our cows to the lake earlier. Now the cows are not allowed and there is no space nearby for grazing. Many of my friends sold their cattle due to this reason.”


Hoskote Taluka in Bangalore District
Bangalore South Taluka in Bangalore Urban District
Krishnarajapura City Municipal Council
Krishnarajapuram Ward in BBMP Area
Medahalli and K R Puram Ward in BBMP Area
Bangalore South
Hoskote Taluk
Fragmentation of Battrahalli’s Landscape

Residential use:
R.1. Pashmina Apartments
R.2. Assetz Apartments – Sun & Sanctum
R.3. Sattva Apartments - Celesta
R. 4. Abhivrudhi Garden Layout
R.5. Allure Apartments
R.6. Arsis Developers
R.7. JD Garuda Royal Layout
R.8. Ohana 857 Apartments
R.9. R.J. Lake Gardenia Apartments
Educational Institution:
E.1. Garden City University
E.2. Don Bosco College
E.3. Church Property
Industrial:
I. Industrial Units – Mechanical, Raw
material processing
Land under litigation and dispute
L. Land under disputes
Lakes:
a. Battarahalli kere
b. Vengaiahana Kere/ K.R.Puram Lake
c. Seegahalli Lake

Streets as multi-purposes spaces


Community Toilets
Aralikatte Park
Community Well
RO Water Facility
Climate Stressors and Coping Mechanisms
The low-lying nature of Janatha Colony renders it particularly susceptible to inundation during periods of elevated water levels further exacerbated by the rejuvenation of the Bhattarahalli Lake. As the area floods, the storm runoff mixes with sewage that overflows on the streets and enters houses, posing a significant health risk. Vector-borne diseases were reported widely. In response, residents have resorted to elevating the thresholds of their dwellings. However, lack of secure tenure discourages them from undertaking permanent flood-proofing measures. The fear that investing in measures to flood proof the homes would be rendered futile if they are displaced in the future .

Flooding due to rejuvenation of the lake


“Because of the raised embankments, the water flowing into the lake has been very slow. When it rains the water collects on the streets and near our houses. The water recedes the next morning, This cycle continues.”


“Due to increased incidents of flooding, people have taken their own initiative to heighten their houses and the street level. We did not receive any funding from any organization for this, we all helped each other to cope with it.”
“Our house is adjacent to the lake and get flooded very often. Nowadays the stormwater is very dirty and smells very bad. Our kids have fallen sick due to unhygeinic conditions and increased mosquitoes.”
“The land is not ours. We have no tenure security. Many residents do not want to spend money on permanent structures due to this reason. Only if we get tenure security they will uptake more permanent solutions to cope with flooding.”

Raising threshold of the main entrance
Street level higher than the house level
Part of the house below the street
Floor level of the house lower than the street level
Part of the house below the street
Sarojamma Badvane
This settlement resides on private land. Its inhabitants, migrants from Gulbarga, moved to Bangalore for work. Access to this parcel of land was through the construction contractor who recruited them. The settlement consists of impermanent shelters, lacking access to basic water and sanitation facilities. The slum is surrounded by high-income and low-income residential neighbourhoods that provide opportunities , especially for women to be engaged as domestic housekeepers, tailors, school maids amongst other works. Sarojamma Badvane experiences flooding during the monsoon due to the overflow of the rajakaluve.
“My husband polishes silverware. I work as a househelp in neighbouring apartments. My brother has a small shop for grocery in the settlement itself.”

“We put the dirty water in this trench throughout the day. At the end of the day we fill this into a bucket and throw it in to the nallah.”
“We do not have a water or sewage connection. We fill water from a tap in the adjacent building and throw sewage into the rajakaluve.”


Sarojamma Badvane
CV Ramannagar Ward
DRDO Township
Kaggadaspura Lake


Streets as multi-purposes spaces


Open-defecation area
Residential apartments Temple
Anganwadi
Water Tap
Climate Stressors and Coping Mechanisms
Residents report that floodwaters inundate their homes for extended periods (4-6 days), displacing them with no viable alternative accommodation. Residents are forced to rely on a nearby apartment complex for potable water, while the contaminated rajakaluve water serves as their only source for washing clothes. In the absence of toilets and sanitation infrastructure open defecation is common. The settlement’s location on privately owned land presents a significant obstacle. The landowner prohibits permanent shelters, effectively hindering the implementation of long-term solutions to mitigate the flooding issue.
“This is private land and the owner does not permit us to construct permanent structures.”

“Only a handful of houses have a make-shift toilet. We use the open space near the railway line for defecation. Sometimes, it is not safe to go there during the night.”
“Flooding is a very difficult time. Dirty water enters our houses and there is nowhere to go. We cannot even sleep on the streets as they are also wet. Nobody comes to help.”
“Since flooding has increased, we have started increasing the floor level … Once, we stayed at a nearby construction site for a few days when our houses were filled with water.”

Need for Bottom-up Lens for Data Collection


EMPRI’s Lake Atlas is a valuable resource. The lake inventory is exhaustive, providing lake centric statistical and spatial data on the morphology, water quality, hydrology, and socioeconomic activities. It dentifies threats like encroachment and sewage inflow, along with proposed conservation strategies. Yet, it is limited by its top-down gaze. Although, the inventory is premised on first-hand data collection and field observations, in not involving communities participation, it fails to capture the lived experiences of these communities - especially the poor and the marginalised - who share dependancies with the lake. In doing so, it fails to factor in their perspectives, aspirations and needs. Even though the Atlas identifies the type of encroachment (school,

Bhattarahalli lake
Vibhutipura lake
playground, dwelling, unauthorised plot) and area of encroachment, the strategy of ‘eviction’ takes a generalized stance without deliving into the socioeconomic realities at play of the poor and marginalized who largely depend on these lakes. For instance, in Bhattarahalli, the Atlas records the presence of no livestock near the lake, however, the transect walk and interview with the residents of Janatha Colony revealed the presence of cattle within the colony.
Thus, a bottom-up appoach to data collection that prioritizes participation is crucial. This deeper understanding is necessary to develop effective and equitable solutions for the sustainable management of the city’s lakes and communities that depend on them.
Bhattarahalli lake
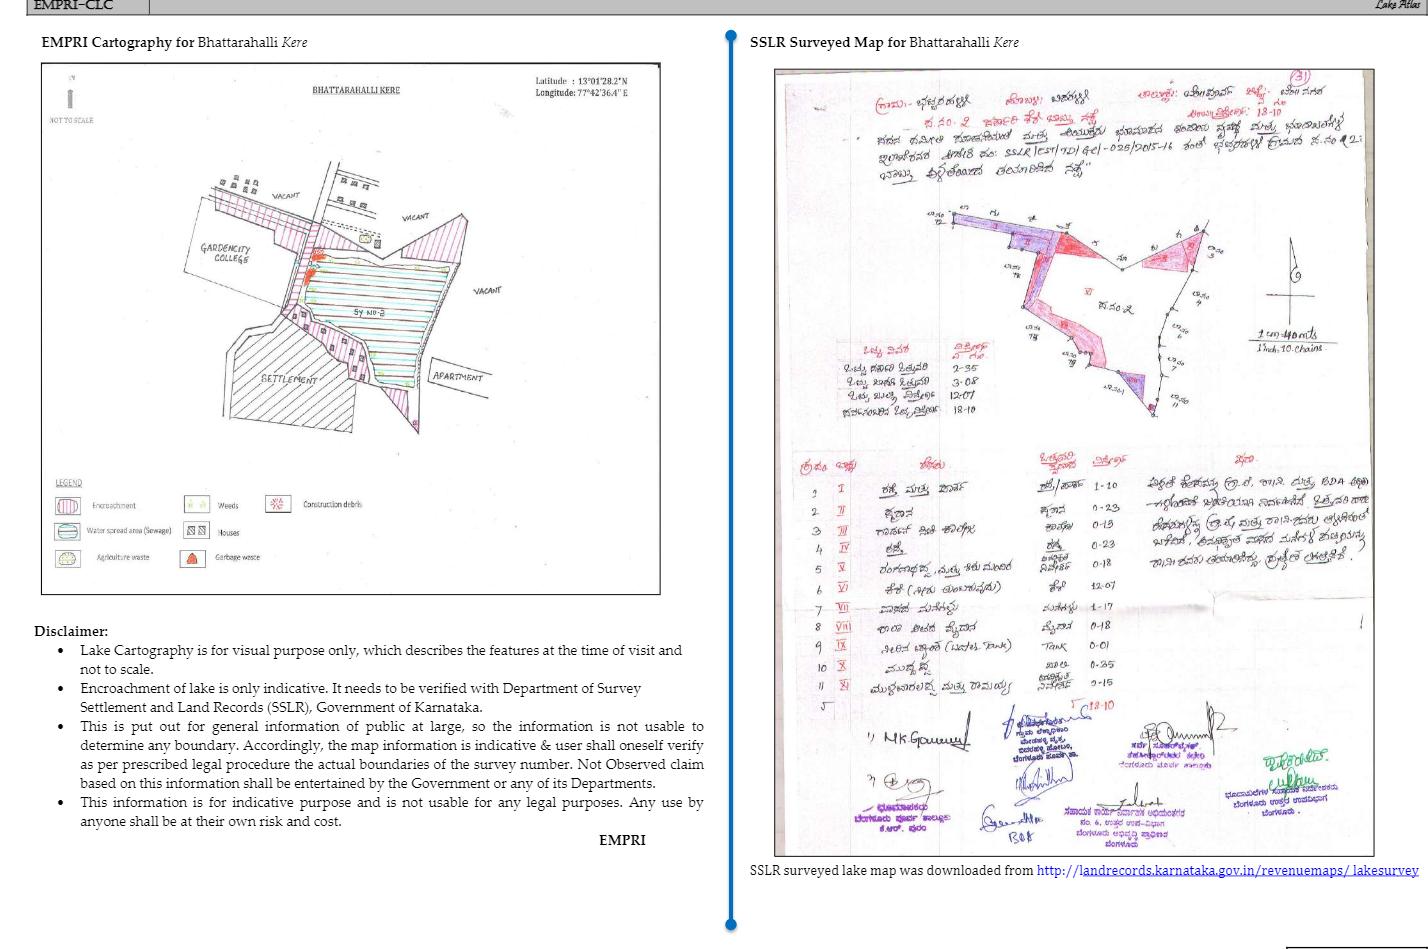
According to the direction of the committee and the commissioner and based on the land records revenue department order no. SSLR|EST|TD|GC|-025|2015016, Bhattarahalli village Survey no. this map has been prepared.
Overall Information Overall Government Encroachment Overall
Encroachment Roads and Park
Burial Ground
Garden City College Road
Ranganath Appa and Shishu Mandir
Kere (Water Filling)
Settlements
School Playground
Water Tank
Mundappa
Mulavaralappa and Ramaiah
Note Under the village accountant and BDA authority the lake has been jointly measured. The encroached areas have been recorded as per the village authorities. The list of Unauthorised houses has been appended separately.


Knowledge Dissemination 06
Co-ideating Tenets for Data Platform
The methods and findings of the action research were shared at a stakeholder workshop, fostering collaboration amongst a diverse group of city managers, academic experts, nongovernmental organizations (NGOs), practitioners, and young professionals. The overarching objective of the workshop was to gather feedback on the need for and relevance of such an exercise; and, ideate on co-creating a platform to be used by decision-makers (amongst other stakeholders) for improved decision-making.
The workshop revolved around three overarching discussion themes:
• Governance and Planning Challenges: Concerns were raised regarding lack of skills within governments to conduct such an in-depth exercise as well as resource deficits in operationalising comprehensive, community-driven (bottom-up) planning processes.
• Community Engagement Imperative: The need for robust community involvement in data collection and utilization was emphasized.
• Data Management Considerations: Challenges related to data accountability, validity, and regulation were highlighted. The interactions session threw up several questions as listed on the next page.


The stakeholder workshop emphasized the exploration of use cases around the digital platform.
Neighborhood Engagement and Ground-Truthing
“Can we effectively engage the residents in data collection and analysis? How can we ensure our data reflects the on-the-ground realities of the city? Do residents really have the luxury of getting involved in these exercises?”
Visibilization and Ethics
“While efforts to increase visibility of urban issues often hold merit, are there potential pitfalls to consider? Do residents truly desire to have their challenges documented? What aspects become visible, and what remains hidden? Who wields the power to determine what is made visible?”

Data Utilization and Accessibility
“While existing data sets may be available, how can we effectively interpret and utilize such information? Who shoulders the responsibility for data analysis and interpretation? How can we make this information readily accessible to the community?”
Data Stewardship and Governance
“Who will be entrusted with the management of the data set? Who will establish and enforce regulations governing data collection, analysis, and presentation?”
Data Objectivity
“Can we definitively claim the data represents absolute truth? How can we ensure the objectivity of the information we collect?”
