De-constructing Climate Change & Heat Stress for the Urban poor

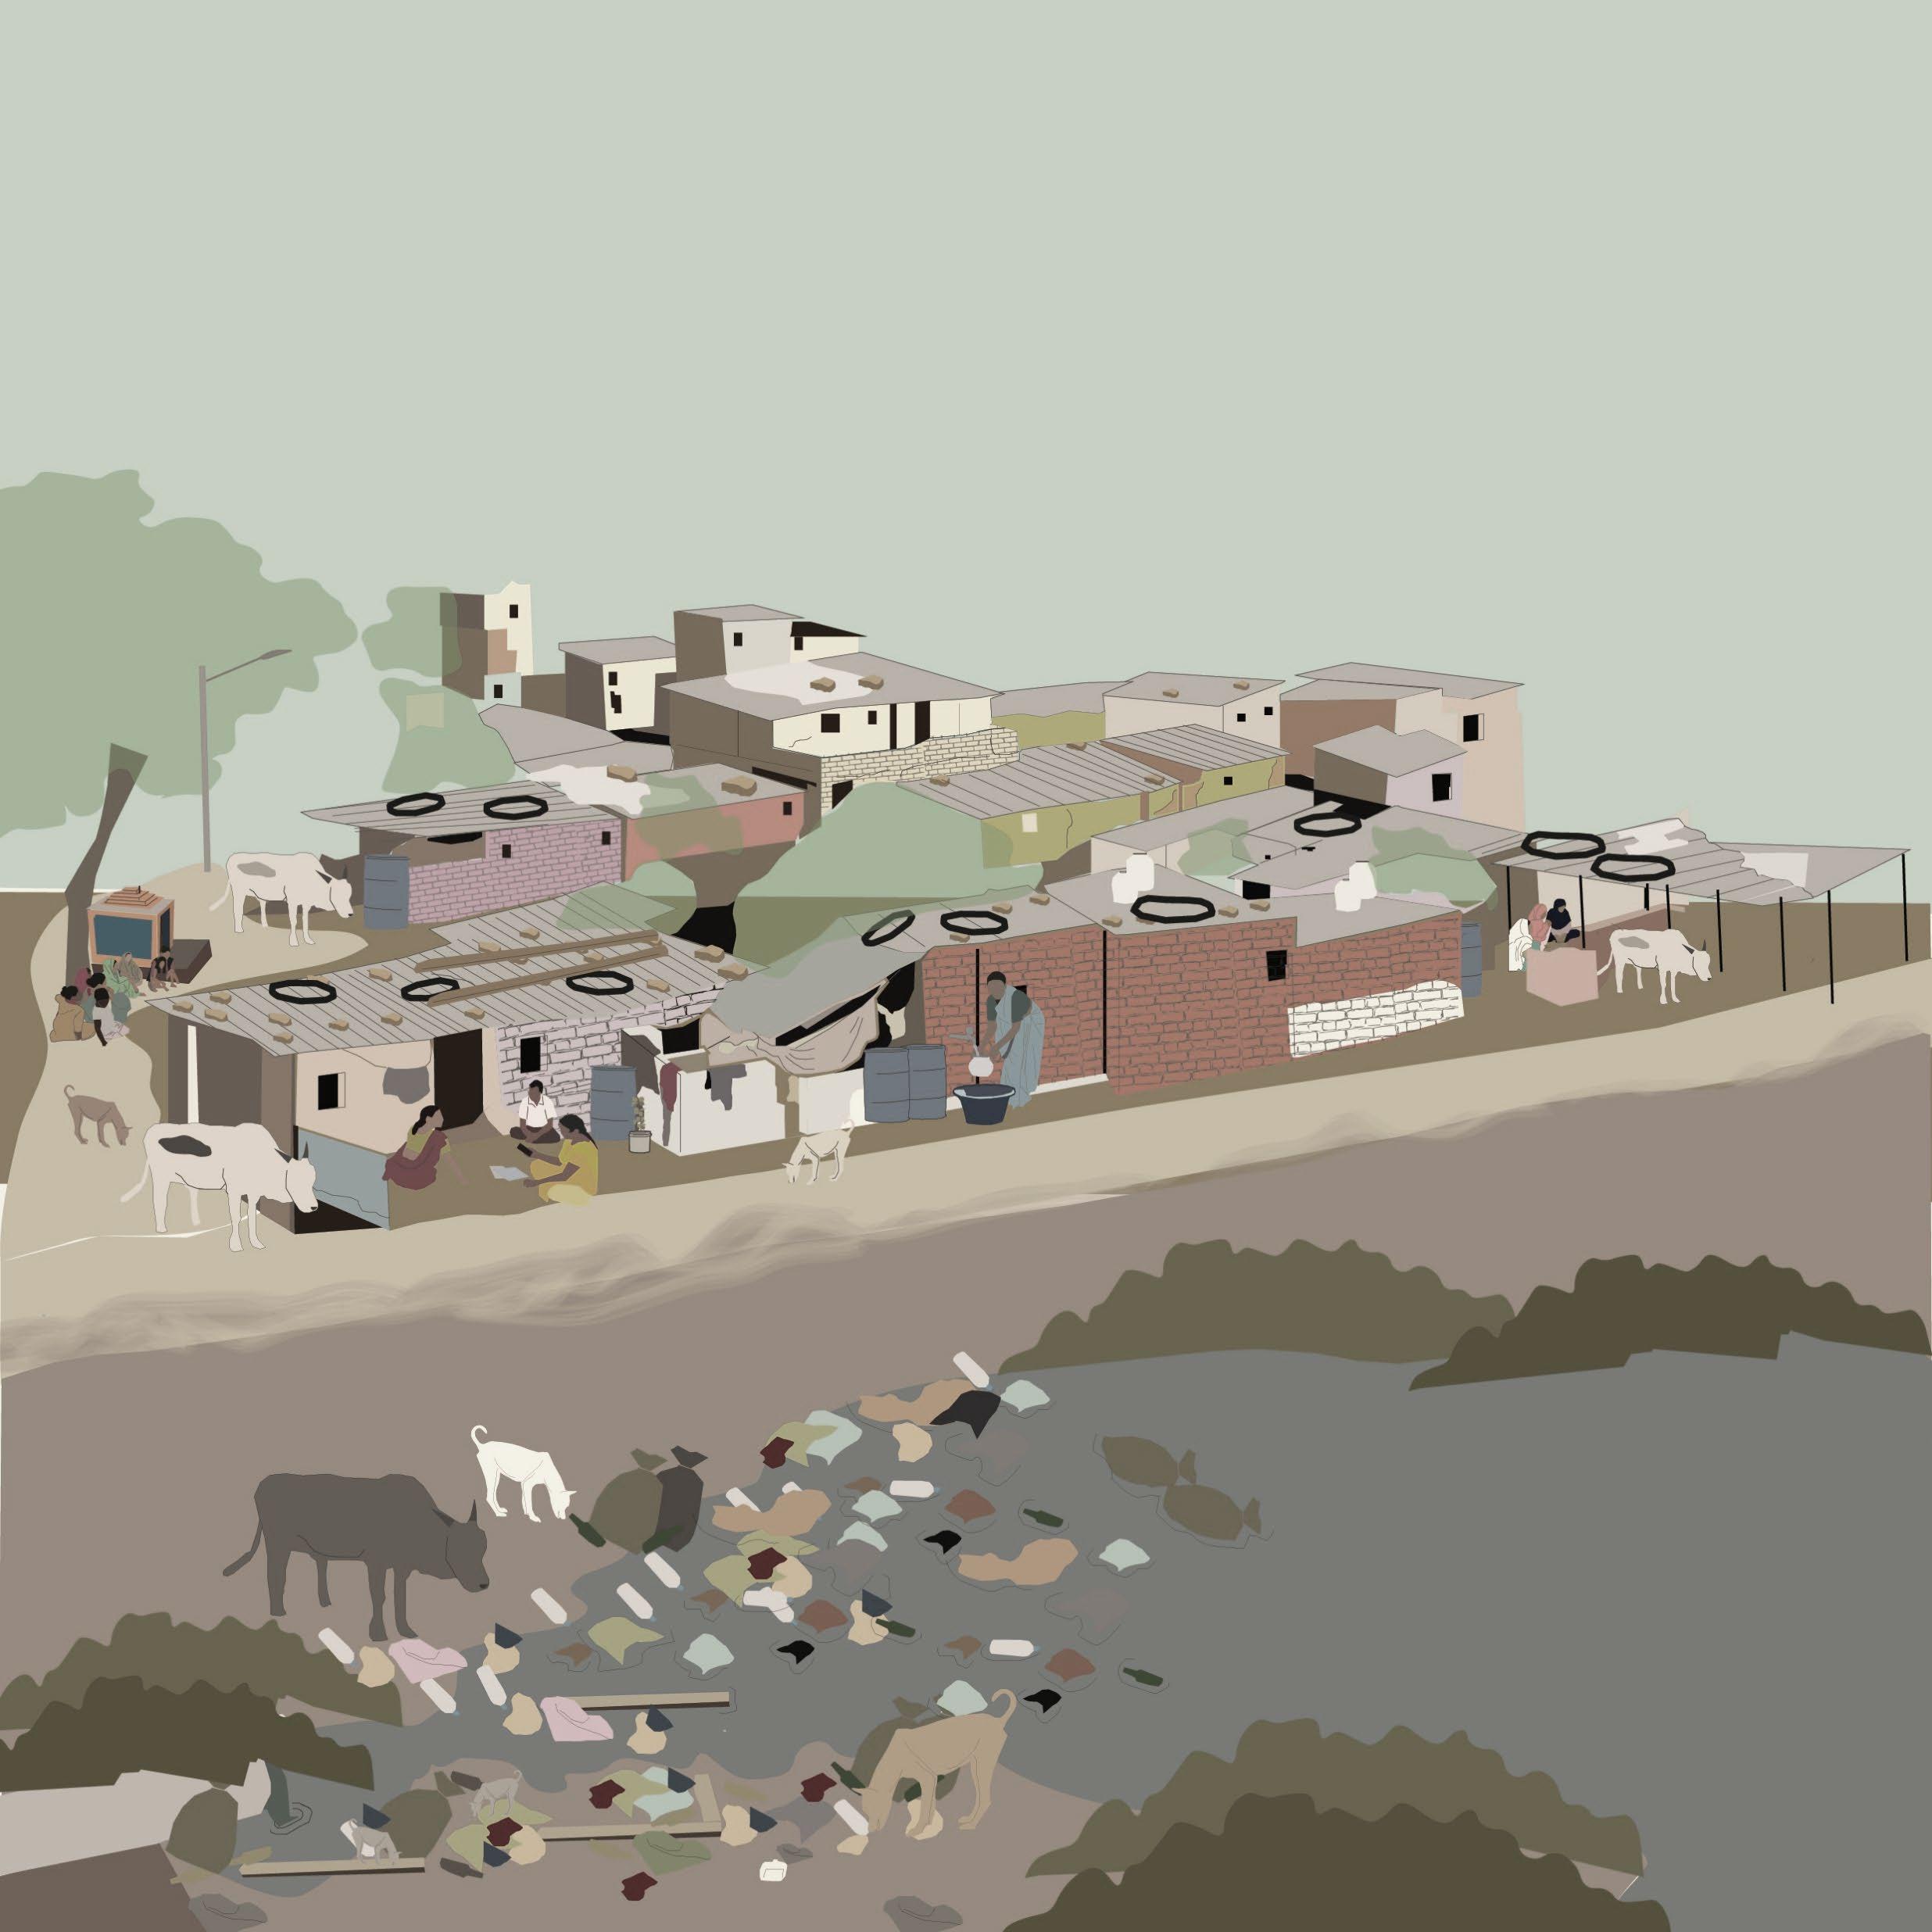
A Handbook on
This handbook was compiled by Integrated Design (INDÉ) as a part of the project titled ‘Communitybased Climate Action Plan in Urban Poor Settlements of Bhopal’ funded by the Humanitarian Innovation Fund (HIF), Elrha. The field partner for the project was Gujarat Mahila Housing SEWA Trust (MHT). We acknowledge the support of Elhra and its partner organisation SEEDS, India (Sustainable Environment and Ecological Development Society) in carrying out the project.

The information presented in this handbook is based on secondary research as well as information and insights gathered from selected urban poor settlements in Bhopal as a part of the abovementioned study. More details about the study are available in the ‘Community-based Climate Action Plans (C-CAP)’ developed for the three pilot settlements.
More details on the authors: Mahila Housing Trust (MHT)- https://www.mahilahousingtrust.org/ Integrated Design (INDÉ)- https://www.integrateddesign.org/

The icons used in this book have been sourced from the Noun Project https://thenounproject.com/ and modified, as necessary.

A Handbook on Climate Change: Deconstructing Climate Change & Heat Stress for the Urban poor Published in 2022

This work is licensed under the Creative Commons Attribution-NonCommercial 4.0 International License. To view a copy of this license, visit http://creativecommons.org/licenses/by-nc-sa/4.0/
You are free to use, share and make derivative works of this publication only for non-commercial purpose under the condition that you appropriately attribute it , and that you distribute it only under a license identical to this one.

A Handbook on Climate Change
De-constructing
Climate Change & Heat Stress for the Urban poor
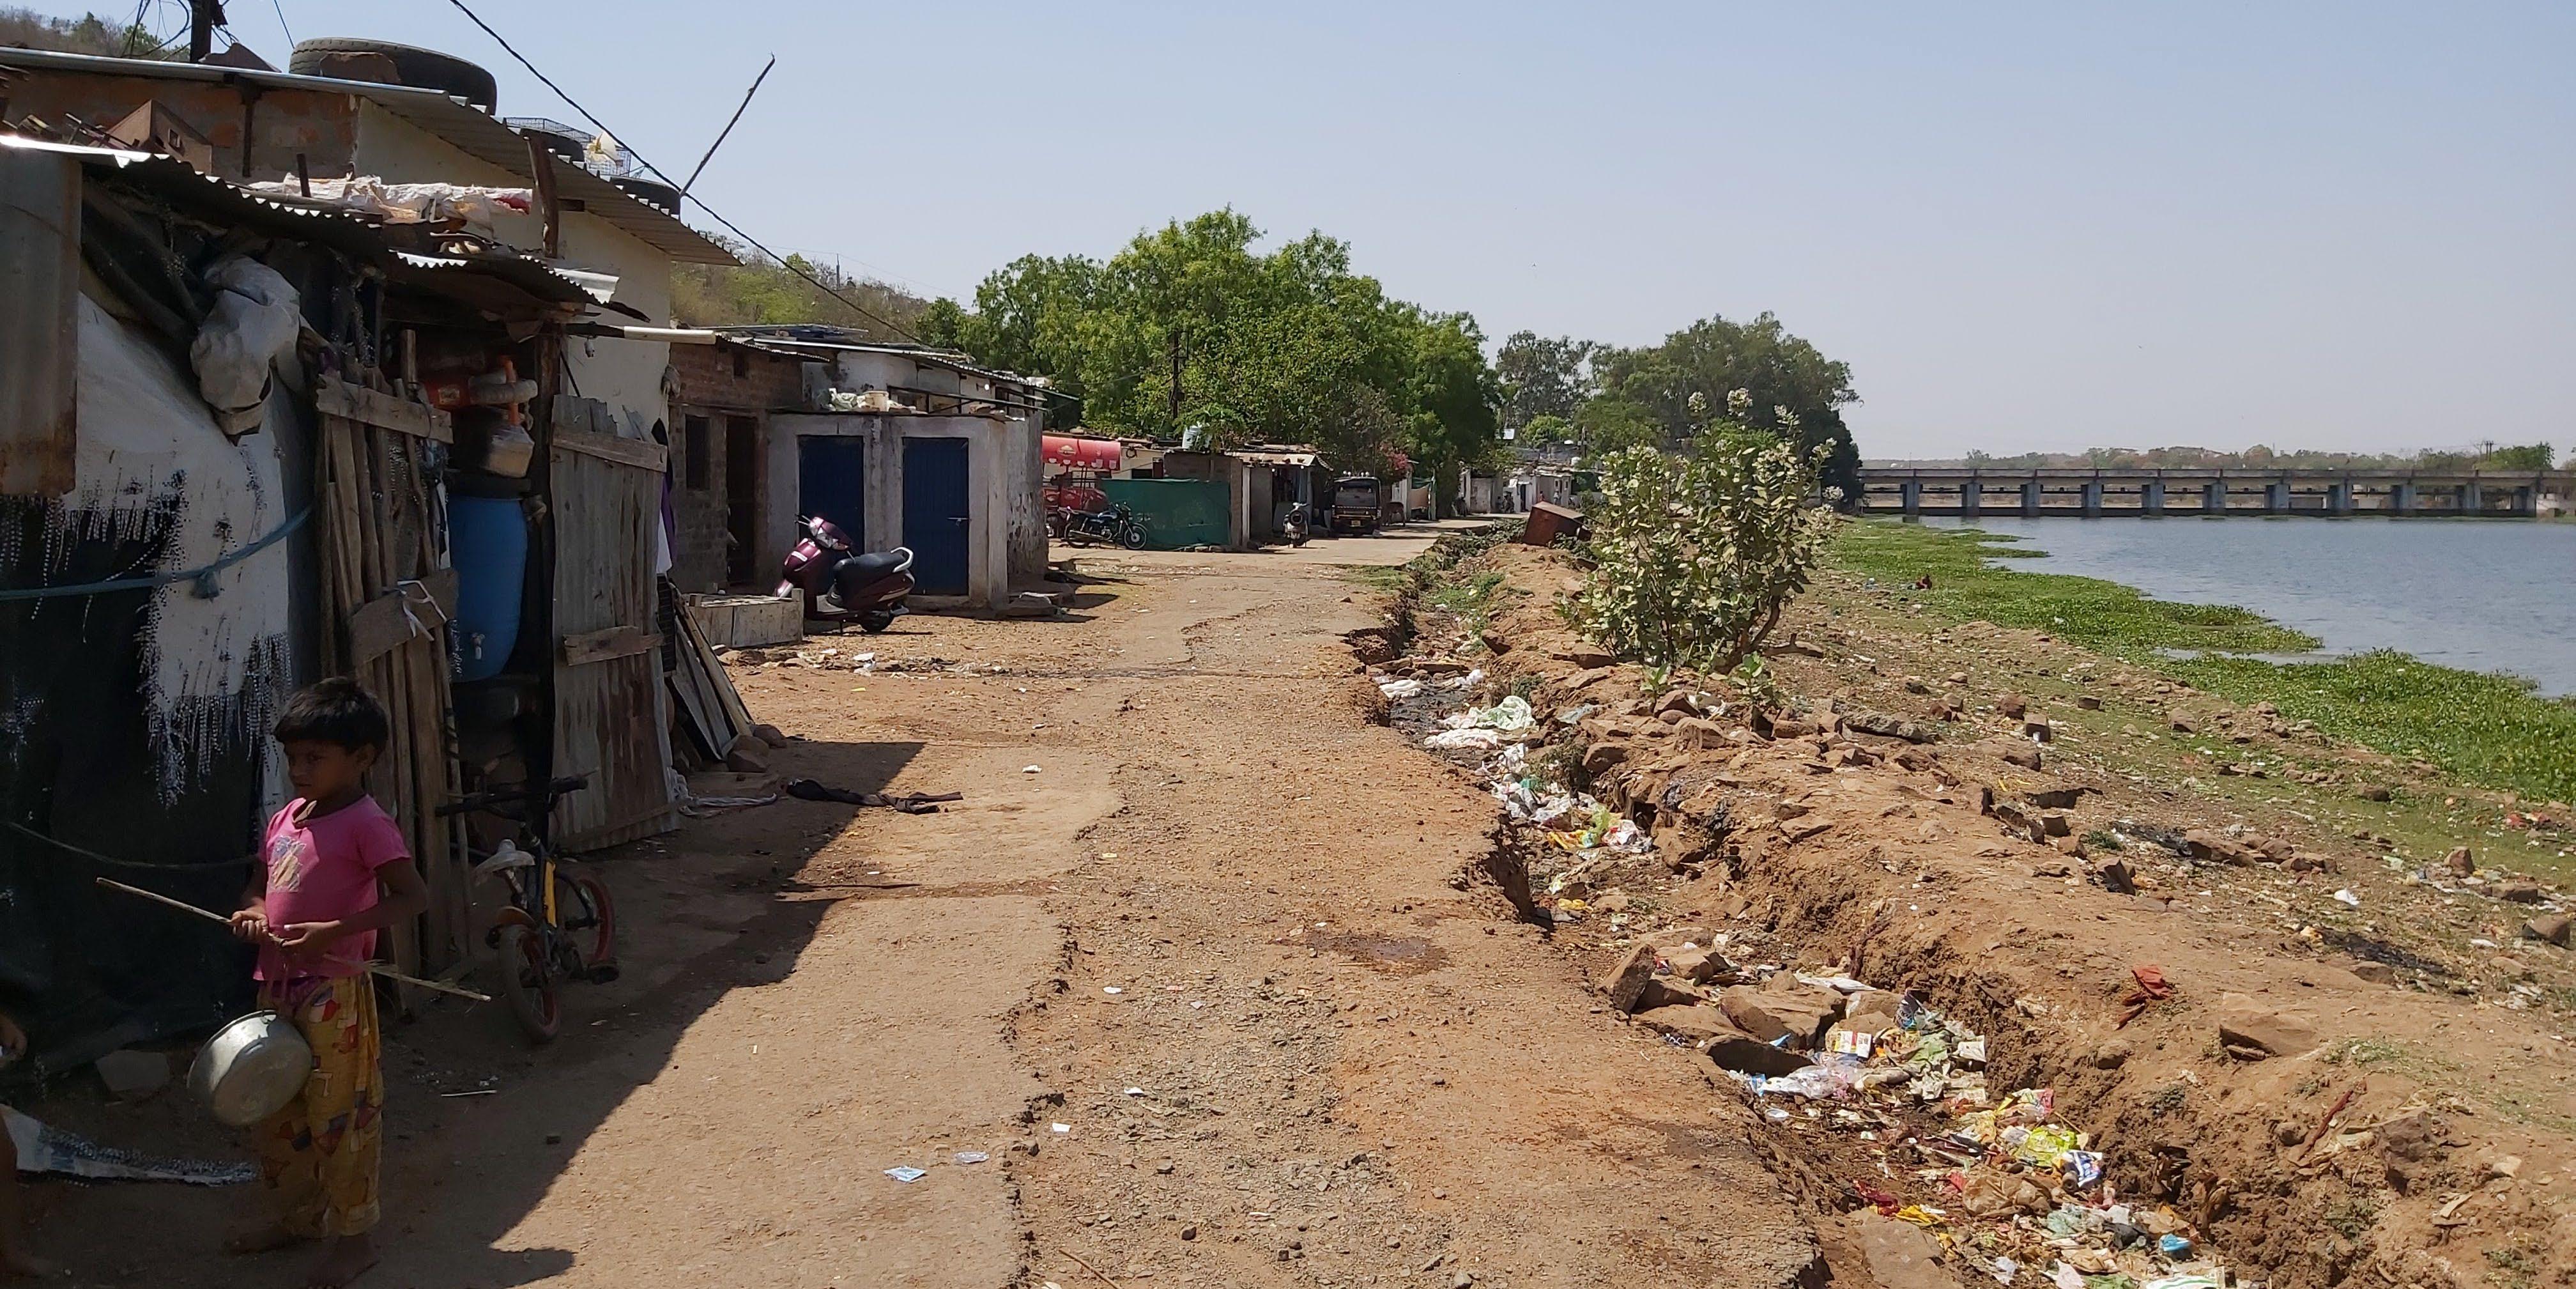 Badhbadha Settlement, Bhopal

Content 01
Why
Who
Using
General
02 Let’s Understand Climate Change Better 01 08 03 What is a Heat wave? 16 What causes a Heat wave? Heat waves in India Heat waves impacts on a city (Bhopal) Heat wave impacts in an urban poor area Facing a heatwave at the individual & community level 04 Assessing Vulnerability & Adaptive Capacity 22
Introduction
this Handbook?
can use this Handbook?
this Handbook
Concepts
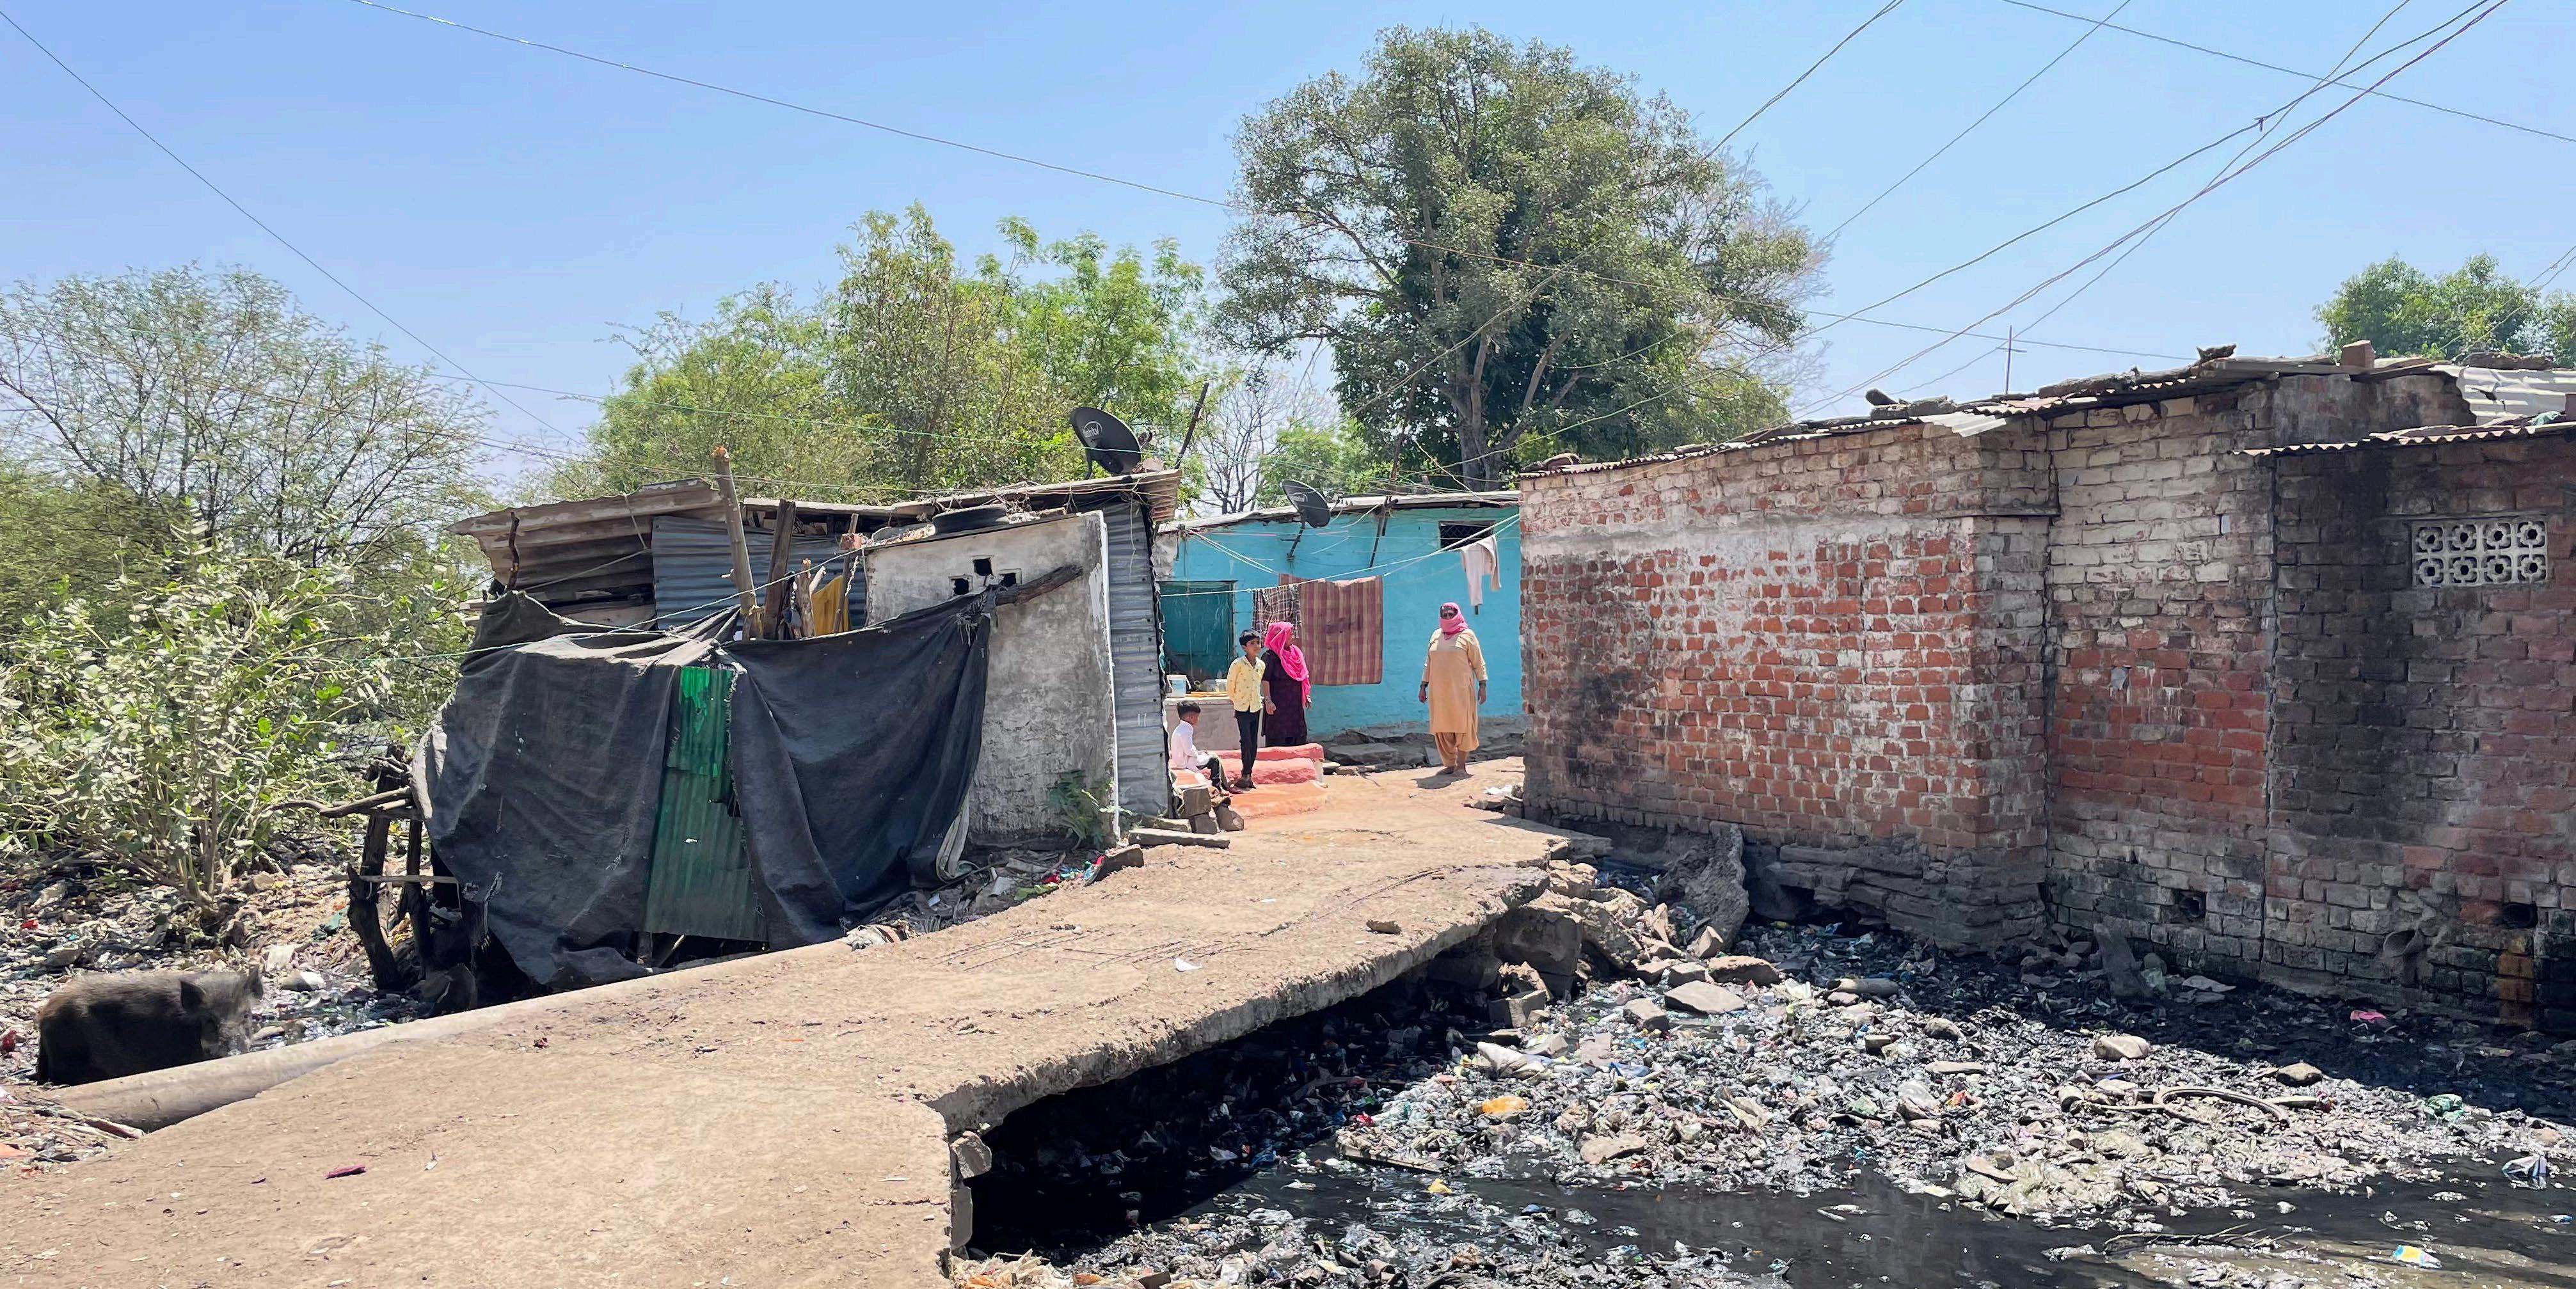 Nehru Colony, Bhopal
Introduction
The climate crisis is here; and its impacts are being felt across the globe- albeit in varying degrees and intensities. Climate science is increasingly able to show that much of these impacts gaining intensity due to anthropogenic activities. 1 Climate science is also making it strikingly clear that citiessocio-economic and cultural melting pots of human activityare the main sources of climate forcers. 2 At the same time, cities are hotspots of socio-economic vulnerability and inequity, physical manifestations of which take the form of unplanned slums/informal settlements. Located on the most vulnerable landscapes in cities, the most rapid growth in climate vulnerability and exposure has been in these unplanned urban pockets.2,3,4
Global dialogues on climate change stress that the greatest gains in well-being in urban areas can be achieved by reducing climate risks for low-income and the marginalised through targeted interventions focusing on the informal settlements. Transformative climate actions, that anchor on intersectionality, gender responsiveness, and inclusion, can advance equity and environmental justice over the long termnot just for the urban poor, but for all urban residents.2 There is thus an urgent need to support this vulnerable populace in responding to the increasingly intensifying effects of climate change.

1
Why this Handbook?
Years of socio-economic vulnerability has led the urban poor to employ a variety of coping and adaptation mechanisms at the time of climatic disasters. However, with increasing intensity and frequency of these events, the formerly successful coping and adaptation strategies of the urban poor are being challenged. How can we help them in adapting to climate change impacts better? As a first step in supporting them, the urban poor need to be empowered with information about climate change and the expected local effects of the same.5 This is first and key objective of this Handbookhelping the urban poor understand climate change in simple and relatable ways.
Climate change is leading to changes in landscapes as well as physiology. While the first is visible and relatable, the latter is rarely framed within and pinned to climate change. The second objective of this Handbook is to highlight the intrinsic relationship between landscapes and people while seeking to assist the most vulnerable to articulate the everyday changes in their lives and living within the context of changing climate. There are critical gaps in information about the nuances of climate change impacts on the urban poor and their settlements. The more we document and understand this information, the better we are positioned to design plan and policy responses that support the vulnerable groups and their habitats. The third objective of the Handbook is to contribute to this critical need by providing a framework for collecting this valuable information from marginalised communities.
Through the above objectives, the Handbook tries to integrate different streams of knowledge (qualitative or experiential, as well as quantitative or scientific) in better understanding and responding to vulnerable communities.
2
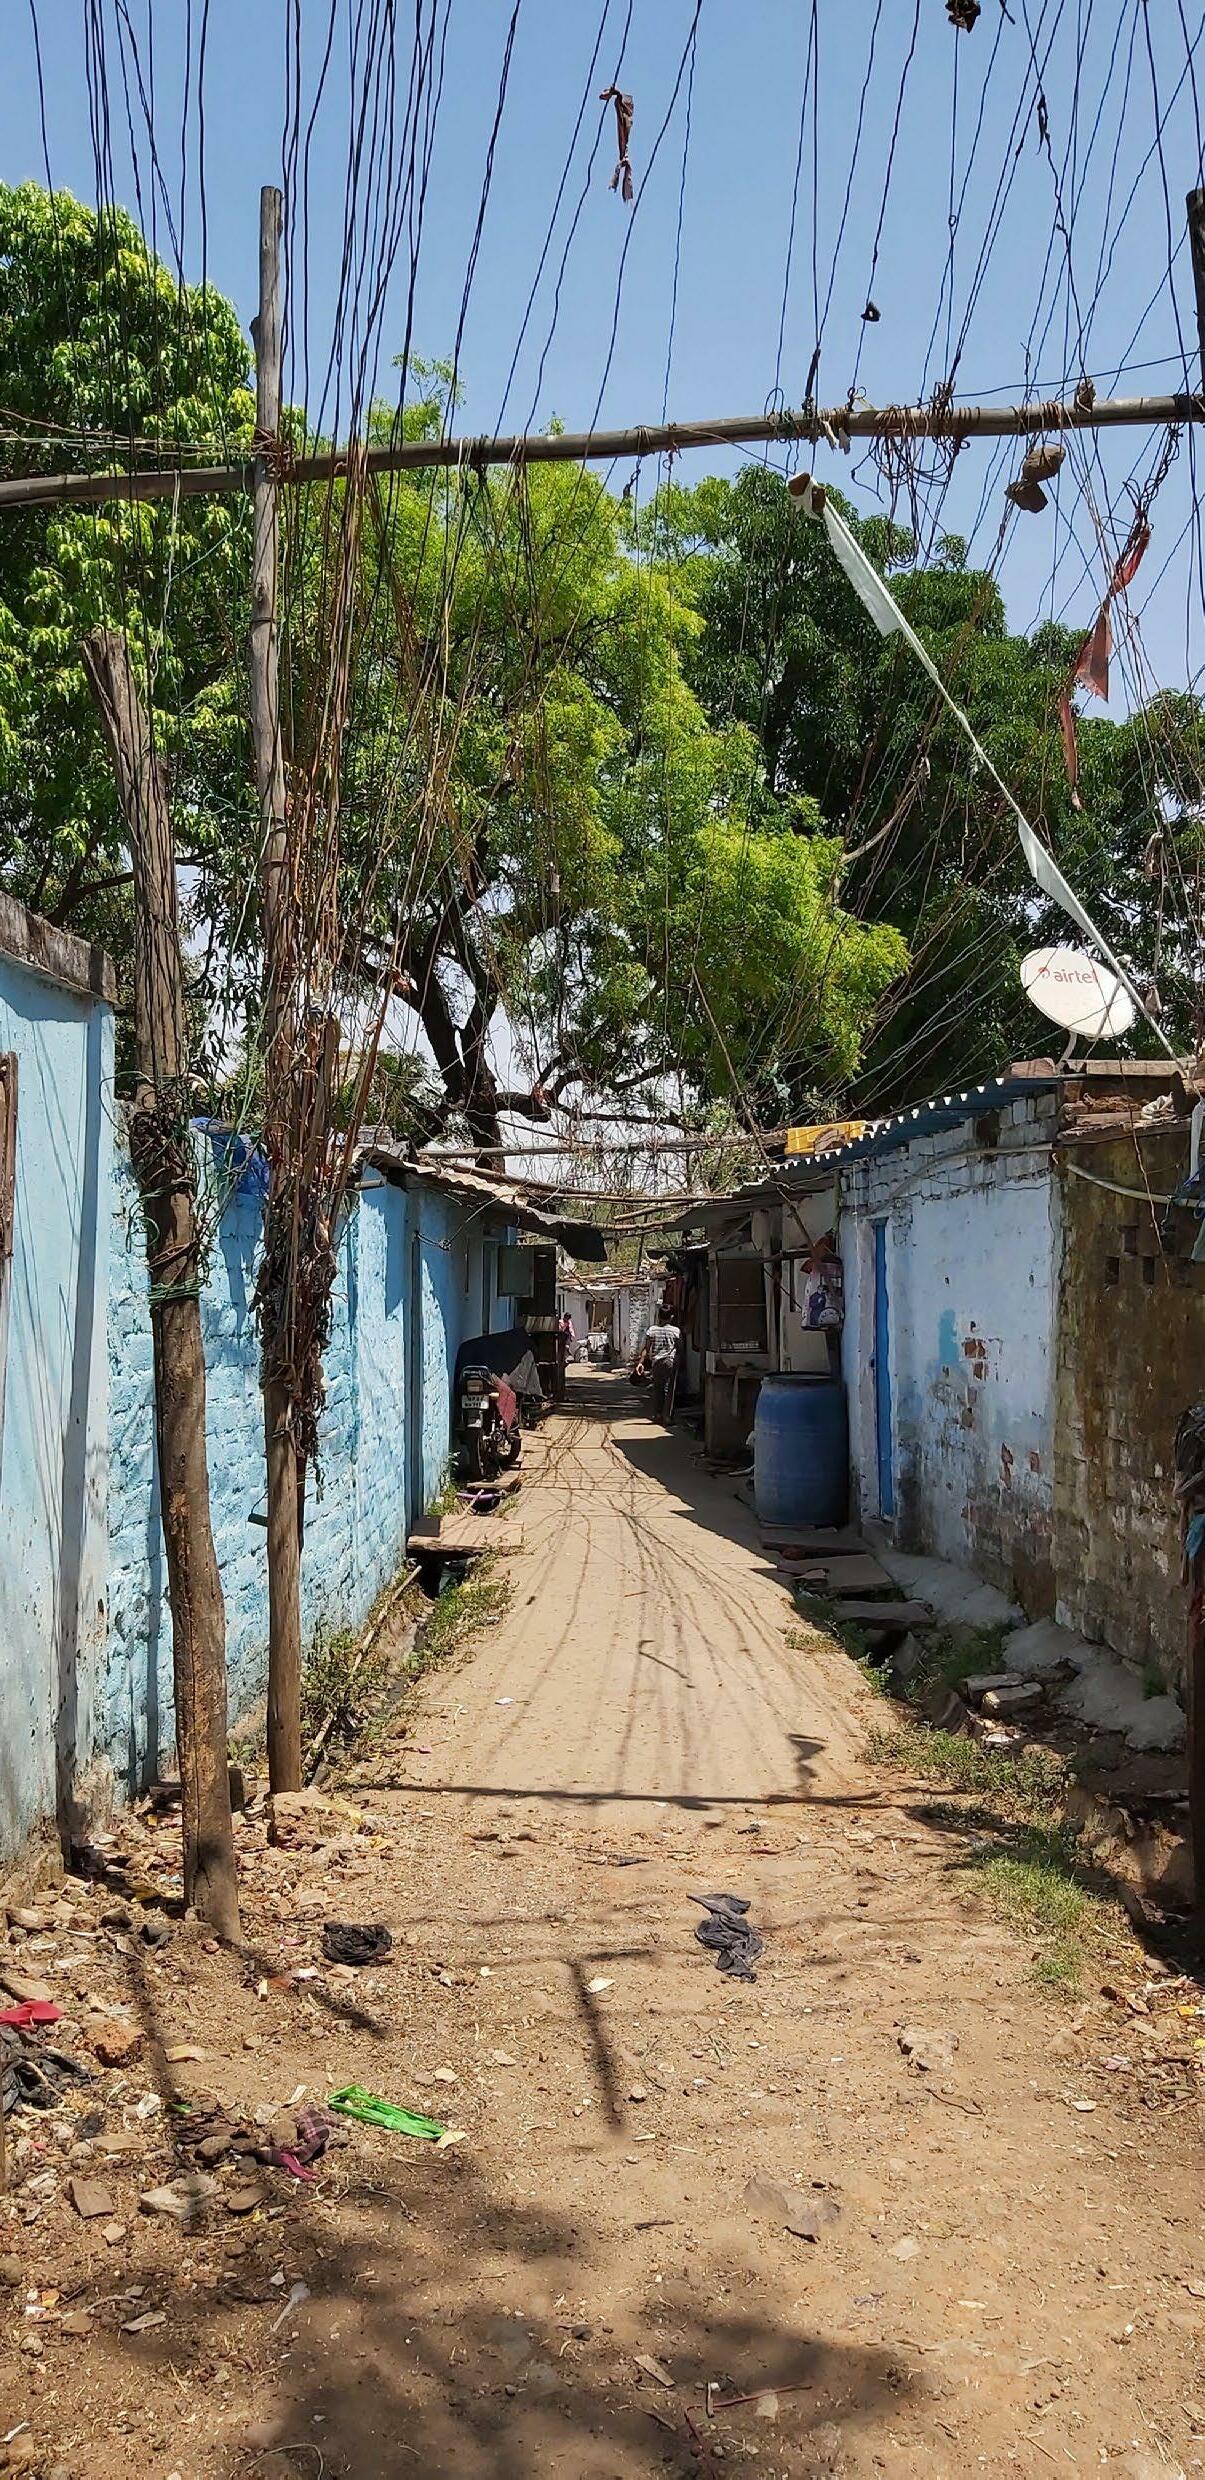
Nehru Colony, Bhopal
Who can use this Handbook?
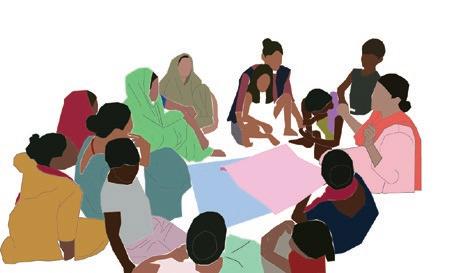
Urban Poor Communities
The primary target audience of this Handbook is the poor living in informal settlements in urban areas.
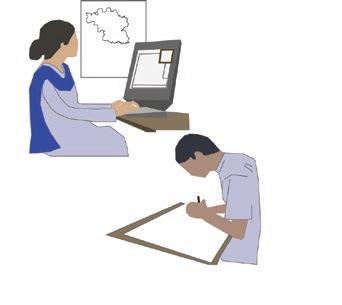
Grassroots Organisations
The Handbook can be used by CBO/NGO/grass roots organisations to help communities frame their vulnerabilities in the context of climate change.
Structure of this Handbook
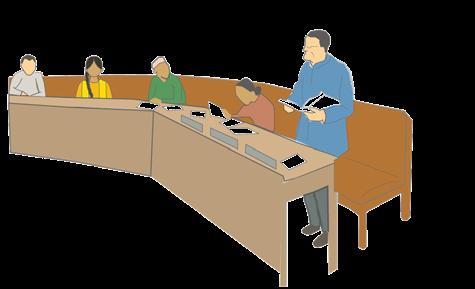
Scientists & Decision Makers
This Handbook is also designed in such a way that it acts as a tool to collect information/data from communities. This information can then be collated and shared with scientists and policy makers decision makers to reverse the flow of information
The Handbook begins by introducing the various concepts associated with climate change through simple definitions and graphics. A broad understanding of these concepts will help the reader in understanding the subsequent sections better. The second section explains the what and why of climate change and its various interconnected impacts and manifestations (on landscapes and people). The Handbook then delves deeper into the concept of heat waves and its implications at various scales- regional, city, settlement, and individual.
The impacts at the settlement and individual scales are illustrated through the everyday life of a family (including members of different age groups and gender) living in an urban poor settlement in a Central Indian city. While giving a broad list of impacts and manifestations, the Handbook provides the opportunity/ space to add on information (which may be contextualised information) about already listed impacts, or additional impacts.

3
General Concepts
Global warming
An increase in temperature near the surface of the Earth. Global warming has occurred in the distant past as the result of natural causes. However, the recent and ongoing warming is caused by people’s activities. Global warming leads to climate change.
Greenhouse effect
The way in which heat is trapped close to Earth's surface by “greenhouse gases” or heat trapping gases which acts as a blanket wrapped around Earth. Greenhouse gases include carbon dioxide, methane, nitrous oxides, and water vapor.

Climate


Patterns of weather over long periods of time. Climate is usually measured over a period of 30 years or more.
Weather
The condition of the atmosphere at a particular place and time. Some characteristics of the weather include wind, temperature, humidity, and precipitation. Weather can change from hour to hour, day to day, and season to season.
4
6
Climate change
The broader set of changes that go along with warmer temperatures, including changes in weather patterns, the oceans, ice and snow, and ecosystems around the world.
Sea level rise


Sea levels have risen because glaciers and ice sheets are melting, and seas are warming.
Ocean Acidification


Extra carbon dioxide in the atmosphere (from cars and factories) is absorbed by the oceans, making them more acidic. This can make it difficult for plants and animals in oceans to survive.
Biodiversity Loss
Warming temperatures, rising seas, melting ice, and other impacts of climate change can threaten the habitat of many plants and animals.

5
General Concepts

Heat Waves
Long periods of time with temperatures that are hotter than normal, typically lasting for several days. As the Earth warms, more areas will be at risk for hotter and more common extreme heat waves.
Wildfires
Fires that burn large amounts of forests and brush. Warmer temperatures and drier conditions can help fires spread and make them harder to put out.

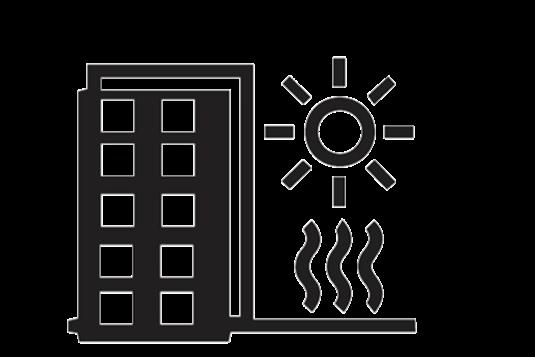
Urban Heat Island Effect
An urban heat island occurs when a city experiences much warmer temperatures than nearby rural areas. This is because urban surfaces, like roads and buildings, absorb and re-emit more heat than natural surfaces, like grass and trees. And as climate change increases the likelihood of heatwaves, the heat island effect is being worsened.

6
6
Heavy Precipitation
As the temperature increases the air’s capacity for water vapor goes up. An atmosphere with more moisture can produce more intense precipitation events.


Droughts

A period with little rain and not enough water. Global warming will increase the risk of drought in some places.
Air Pollution
Air pollution is caused by solid and liquid particles and certain gases that are suspended in the air. These particles and gases can come from car and truck exhaust, factories, dust, pollen, mold spores, volcanoes and wildfires. The solid and liquid particles suspended in our air are called aerosols.

7
Let’s understand Climate Change Better!




No matter where we live, we all experience weather: how the conditions of our atmosphere change over minutes, hours, days, weeks. We also experience climate: the weather of a place averaged over several decades.
climate has changed throughout history.
Climate change is when these averaged conditions start to change and its causes can be either natural or caused by human activities. Rising temperatures, variations in rainfall, increased extreme weather events are all examples of climate changes, but there are many others. 7



Here’s Why: The current warming trend is different because it is clearly the result of human activities since the mid-1800s. Human activities have produced the atmospheric gases that have trapped more of the Sun’s energy in the Earth system. 7


8
Earth's
So why should we be worried about Climate Change now??
Population Increase
What are some of the evidences of human induced Climate Change?
Global Temperature is Rising
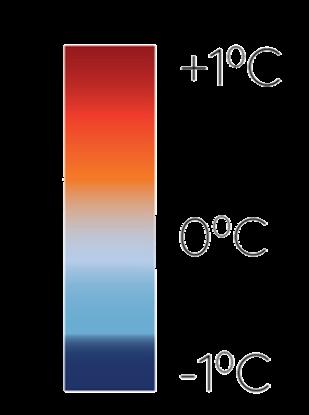
The average temperature of the Earth’s surface is warmer than at any time in the last 100,000 years! 7 The increase/decrease in temperature from the normal is shown below.8
Oceans are getter warmer
The ocean has absorbed much of the increased heat and is now warming faster than at any time in at least 11,000 years.7
Glaciers are melting
The average temperature of the Earth’s surface between 2011 and 2020 was 1.1ºC warmer than the average temperature in the late 19th century.7





Glaciers in the world are rapidly melting since 1950. This rate has not been seen in at least 2000 years. 7
Extreme Events are Increasing


Since the 1950s, there has been more frequent and more intense heatwaves, heavier and more intense rainfall events, severe droughts, and stronger cyclones. 7

9


10 Do you feel it is now hotter during summers and wetter during monsoons than before? This
Climate Change!
below,
seasonal calendar
compared
the
changes
12, 13 Averages for Central India What happened in 2022? Rainy Days 25 0C 12 0C Average Temperature Max. Min. 29 0C 13 0C 40 0C 27 0C Summer Winter Winter Monsoon 42.8 0C 29.4 0C 36 0C 26 0C 45 0C 30 0C 10 19 17 10 3 Rainfall Amount 12 30 24 16 6 31 “ Average Temperature Max. Min. Rainy Days Rainfall Amount 72 “ Summer Winter Winter Monsoon Hotter Summer Wetter Monsoon 43.3 0C 24.2 0C 38 0C 24 0C
is because of
In the image
a typical
for a city in Central India is
with
recent
that are observed.9, 10, 11,
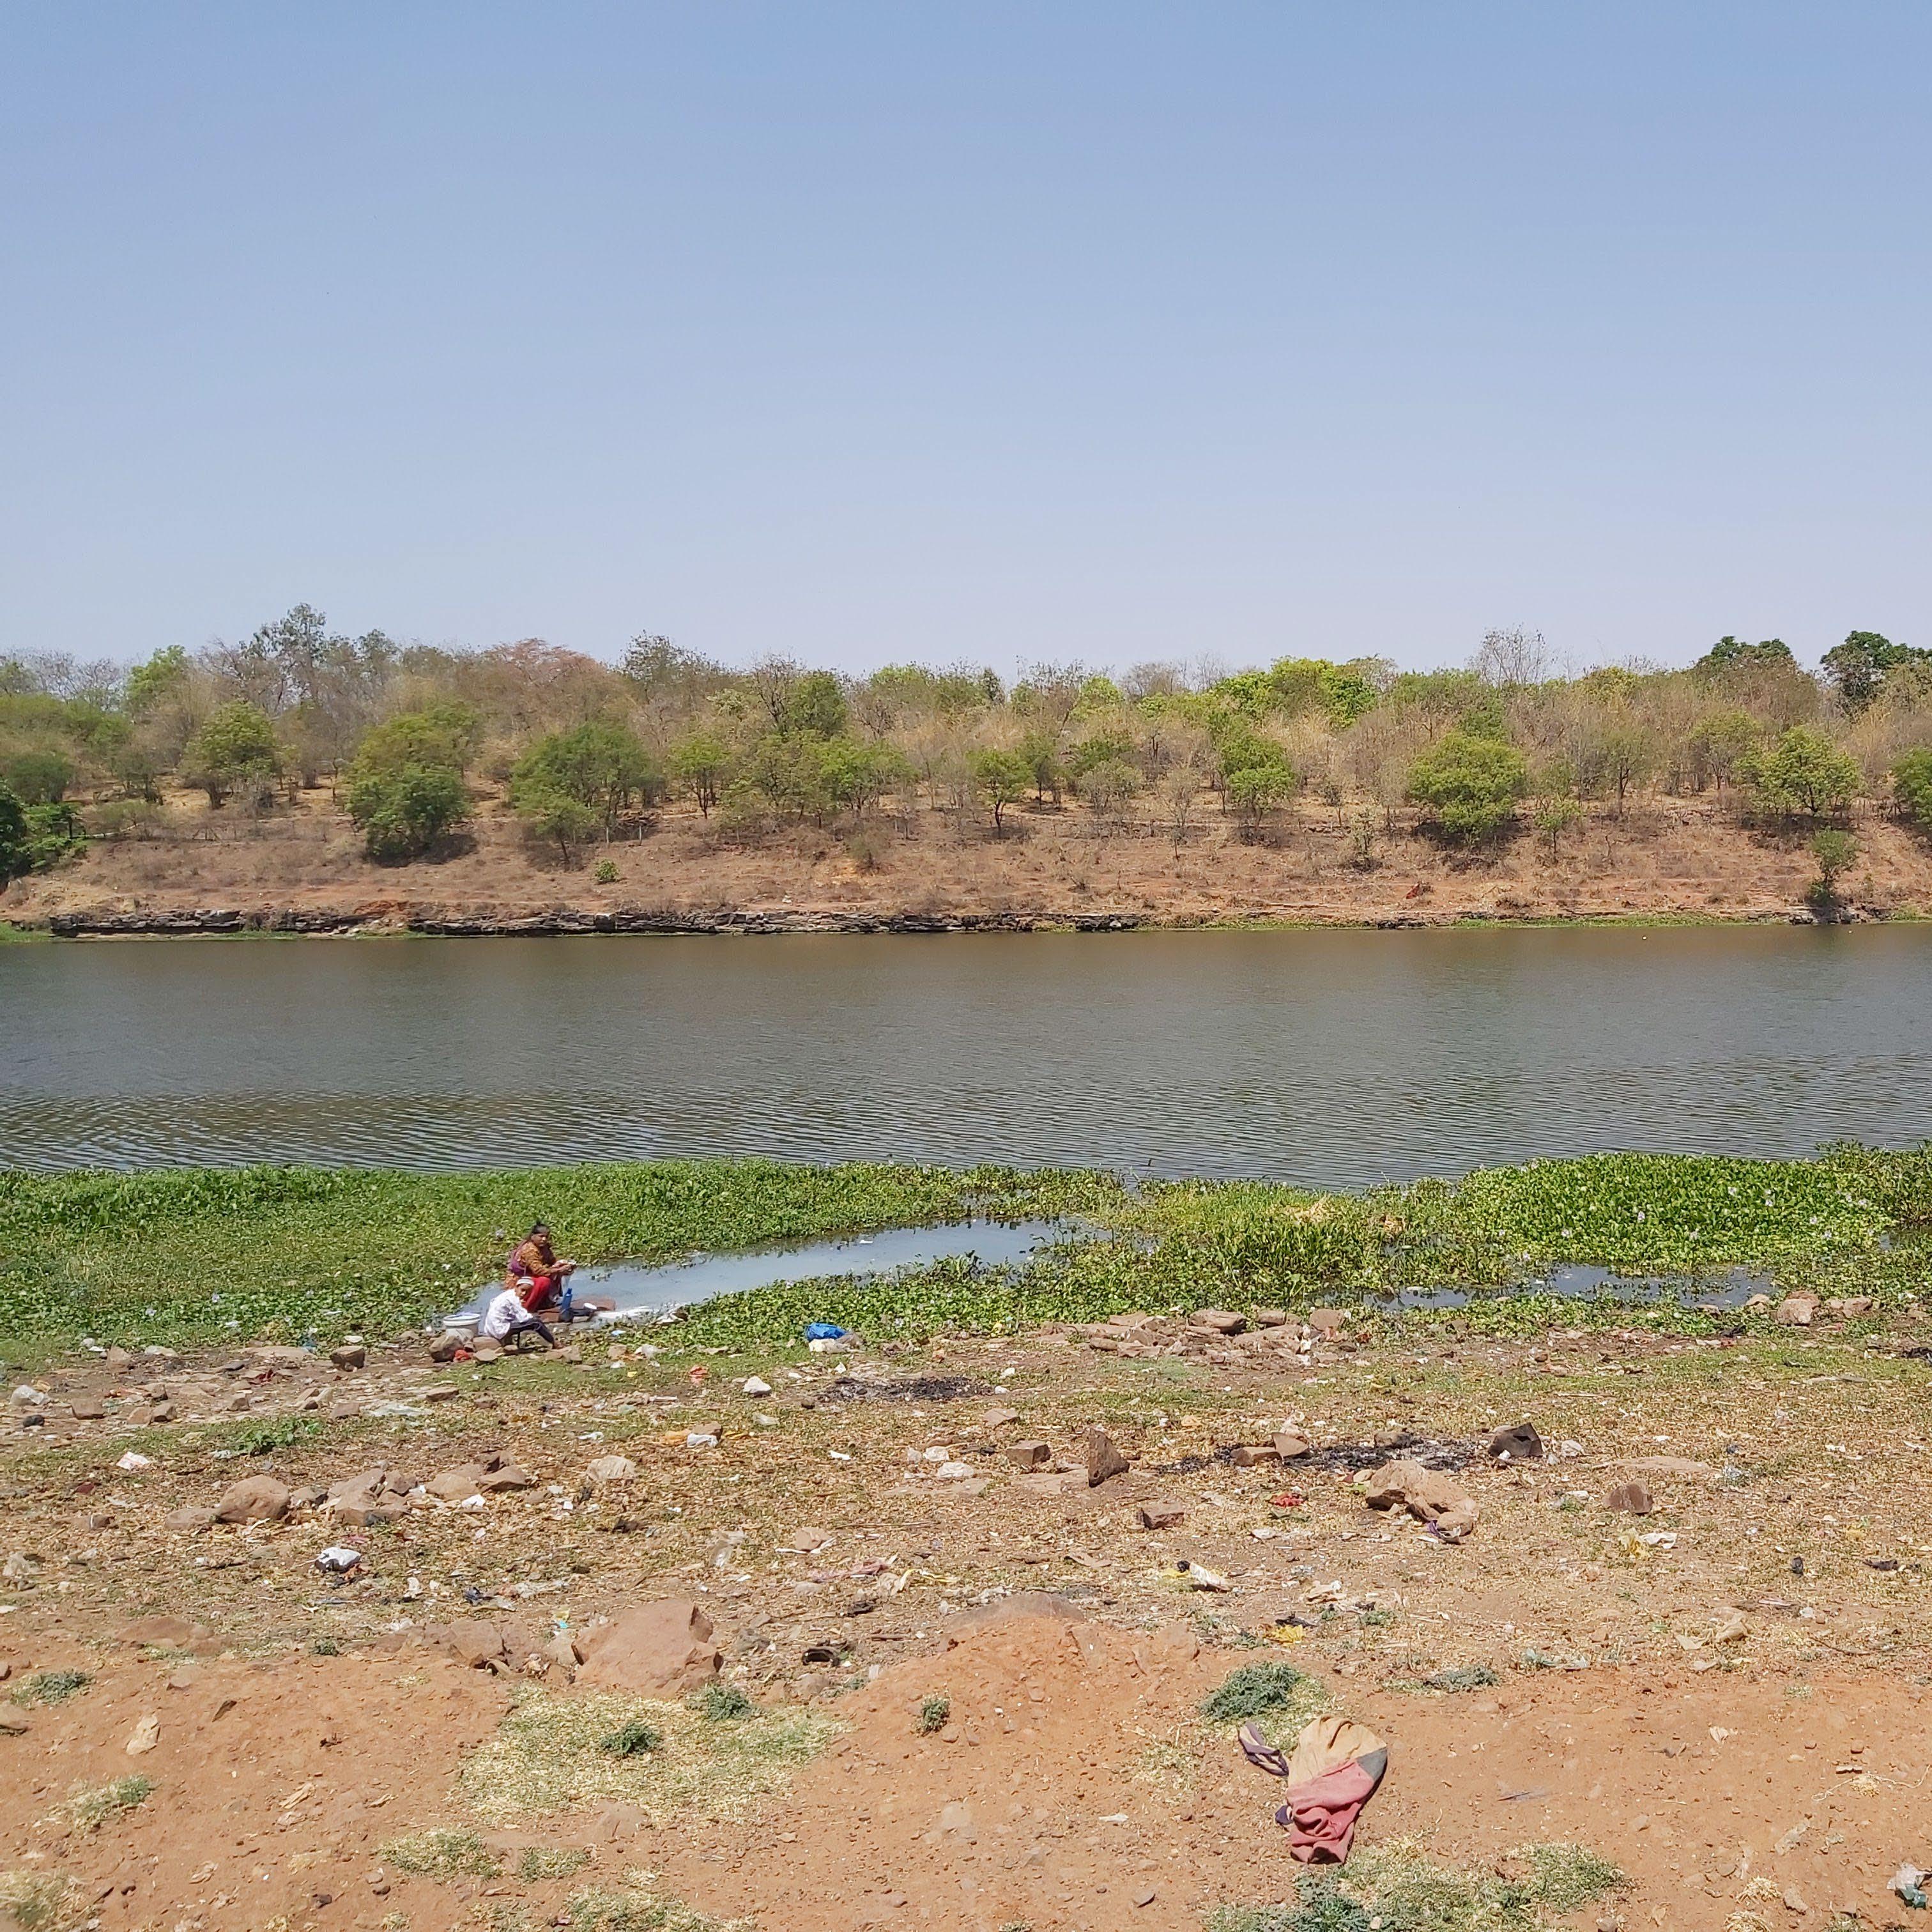 Badhbadha, Bhopal







12
Acidification Sea Level Rise
Heatwaves Heat Island Effect Crop Loss
Oceans Global Warming Impact on City & Region
The Ripple Effect Droughts Heavy Precipitation Melting Glaciers Ocean
Wildfires
Warmer





13
Economic Loss Death Disruption of Social Services
Scarcity
Risk
in Infrastructure Services
Loss
to Vector
Diseases
to Vector
Diseases
shelter and loss of assets
Access to Healthcare
Flooding
Water
Health
Disruption
Livelihood
Vulnerability
Borne
Vulnerability
Borne
Damage to
Limited
?
Climate
14
What are the other ways in which
Change is impacting you?
15
Assessing Vulnerability & Adaptive Capacity
As illustrated in the previous pages, vulnerability to climate risks, especially in urban areas, results from a combination of physical, sociocultural, economic, and institutional conditionswhich are often interrelated.27 Conditions like poor governance, inequitable access to public services, and increased social inequality amongst others create vulnerable urban pockets often occupied by the poor. 3,4
This ‘normal existence’ of the urban poor in precarious social, spatial, economic, political, and environmental settings, increases their vulnerability to climate change impacts manifold.28 For example, adverse economic conditions push the poor to locate in high-risk zones (like low-lying areas and derelict land) deemed undesirable for other development. Affordability, proximity to livelihood opportunities, and decreased eviction threats are some of the reasons the poor choose these locations.27,29 Political and social disenfranchisement makes these pockets invisible in the formal systems and processes- often depriving them of basic service provisions (water supply, drainage, solid waste management, sanitation, etc.) as well.
The Intergovernmental Panel on Climate Change defines vulnerability a function of the character, magnitude, and rate of climate variation to which a system is exposed, its sensitivity, and its adaptive capacity. That is, vulnerability constitutes the interaction between an external dimension, which is represented by the ‘exposure’ of a system to climate variations, as well as an internal dimension, which comprises its ‘sensitivity’ and its ‘adaptive capacity’
Vulnerability
=
(Exposure X Sensitivity) – Adaptive Capacity
Risk: The probability of harmful consequences, or expected loss (of lives, people injured, property, livelihoods, economic activity disrupted or environment damaged) resulting from interactions between natural or human induced hazards and vulnerable/capable conditions. Elements essential in the formulation of risk include hazard and vulnerability.30
Hazard: The probability of occurrence for a given threat. 30
Vulnerability: The propensity or predisposition to be adversely affected. 30
16
Exposure
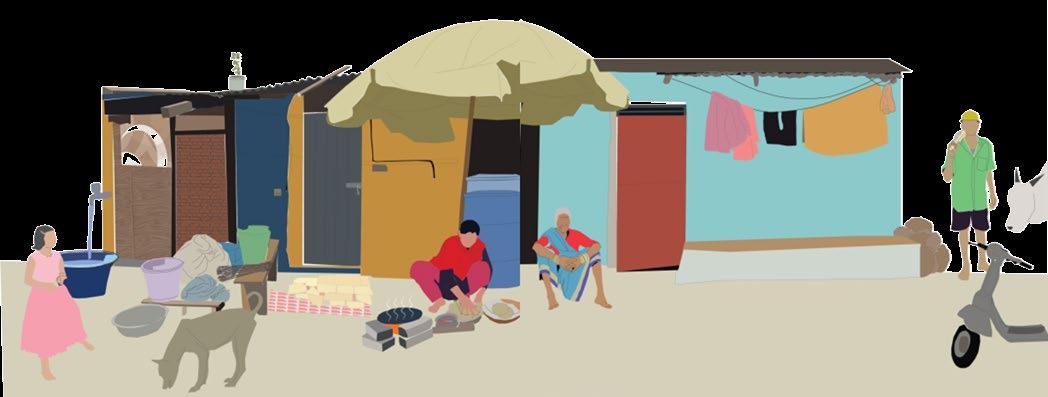
The presence of people, livelihoods, environmental services and resources, infrastructure, economic, social, or cultural assets in places that could be adversely affected. Example: Location of house in areas without tree cover.
Sensitivity
The degree to which a system is affected, either adversely or beneficially, by climate variability or climate change. Example: Use of heat absorbing materials such as asbestos sheet roofing, or use of mud tiles that reduce heat absorption.

Adaptive Capacity
The combination of strengths and resources available to an individual, community, society, or organization that can be used to prepare for reducing adverse impacts or harm and leverage beneficial opportunities. Example: Access to resources in times of stress.
17
Criteria that Determine Vulnerability & Adaptive Capacity
Given this understanding, a few criteria have been collated that can be considered to have a bearing on vulnerability, exposure, and adaptive capacity to climate change in urban poor settlements. However, each context may present additional criteria (or) sub-criteria that determine climate change susceptibility. This handbook encourages its users to add these to the list on the next page.
What are some of the other criteria that impact you & your settlement? Add these to the list on the next page. ? 18
Bhopal
Nehru Colony,
Criteria Sub criteria Why these criteria/sub-criteria?
1 Physical Characteristics
Built Fabric Density
Ground / Tree cover
Building materials


Highway, Pakka/ Katcha Roads
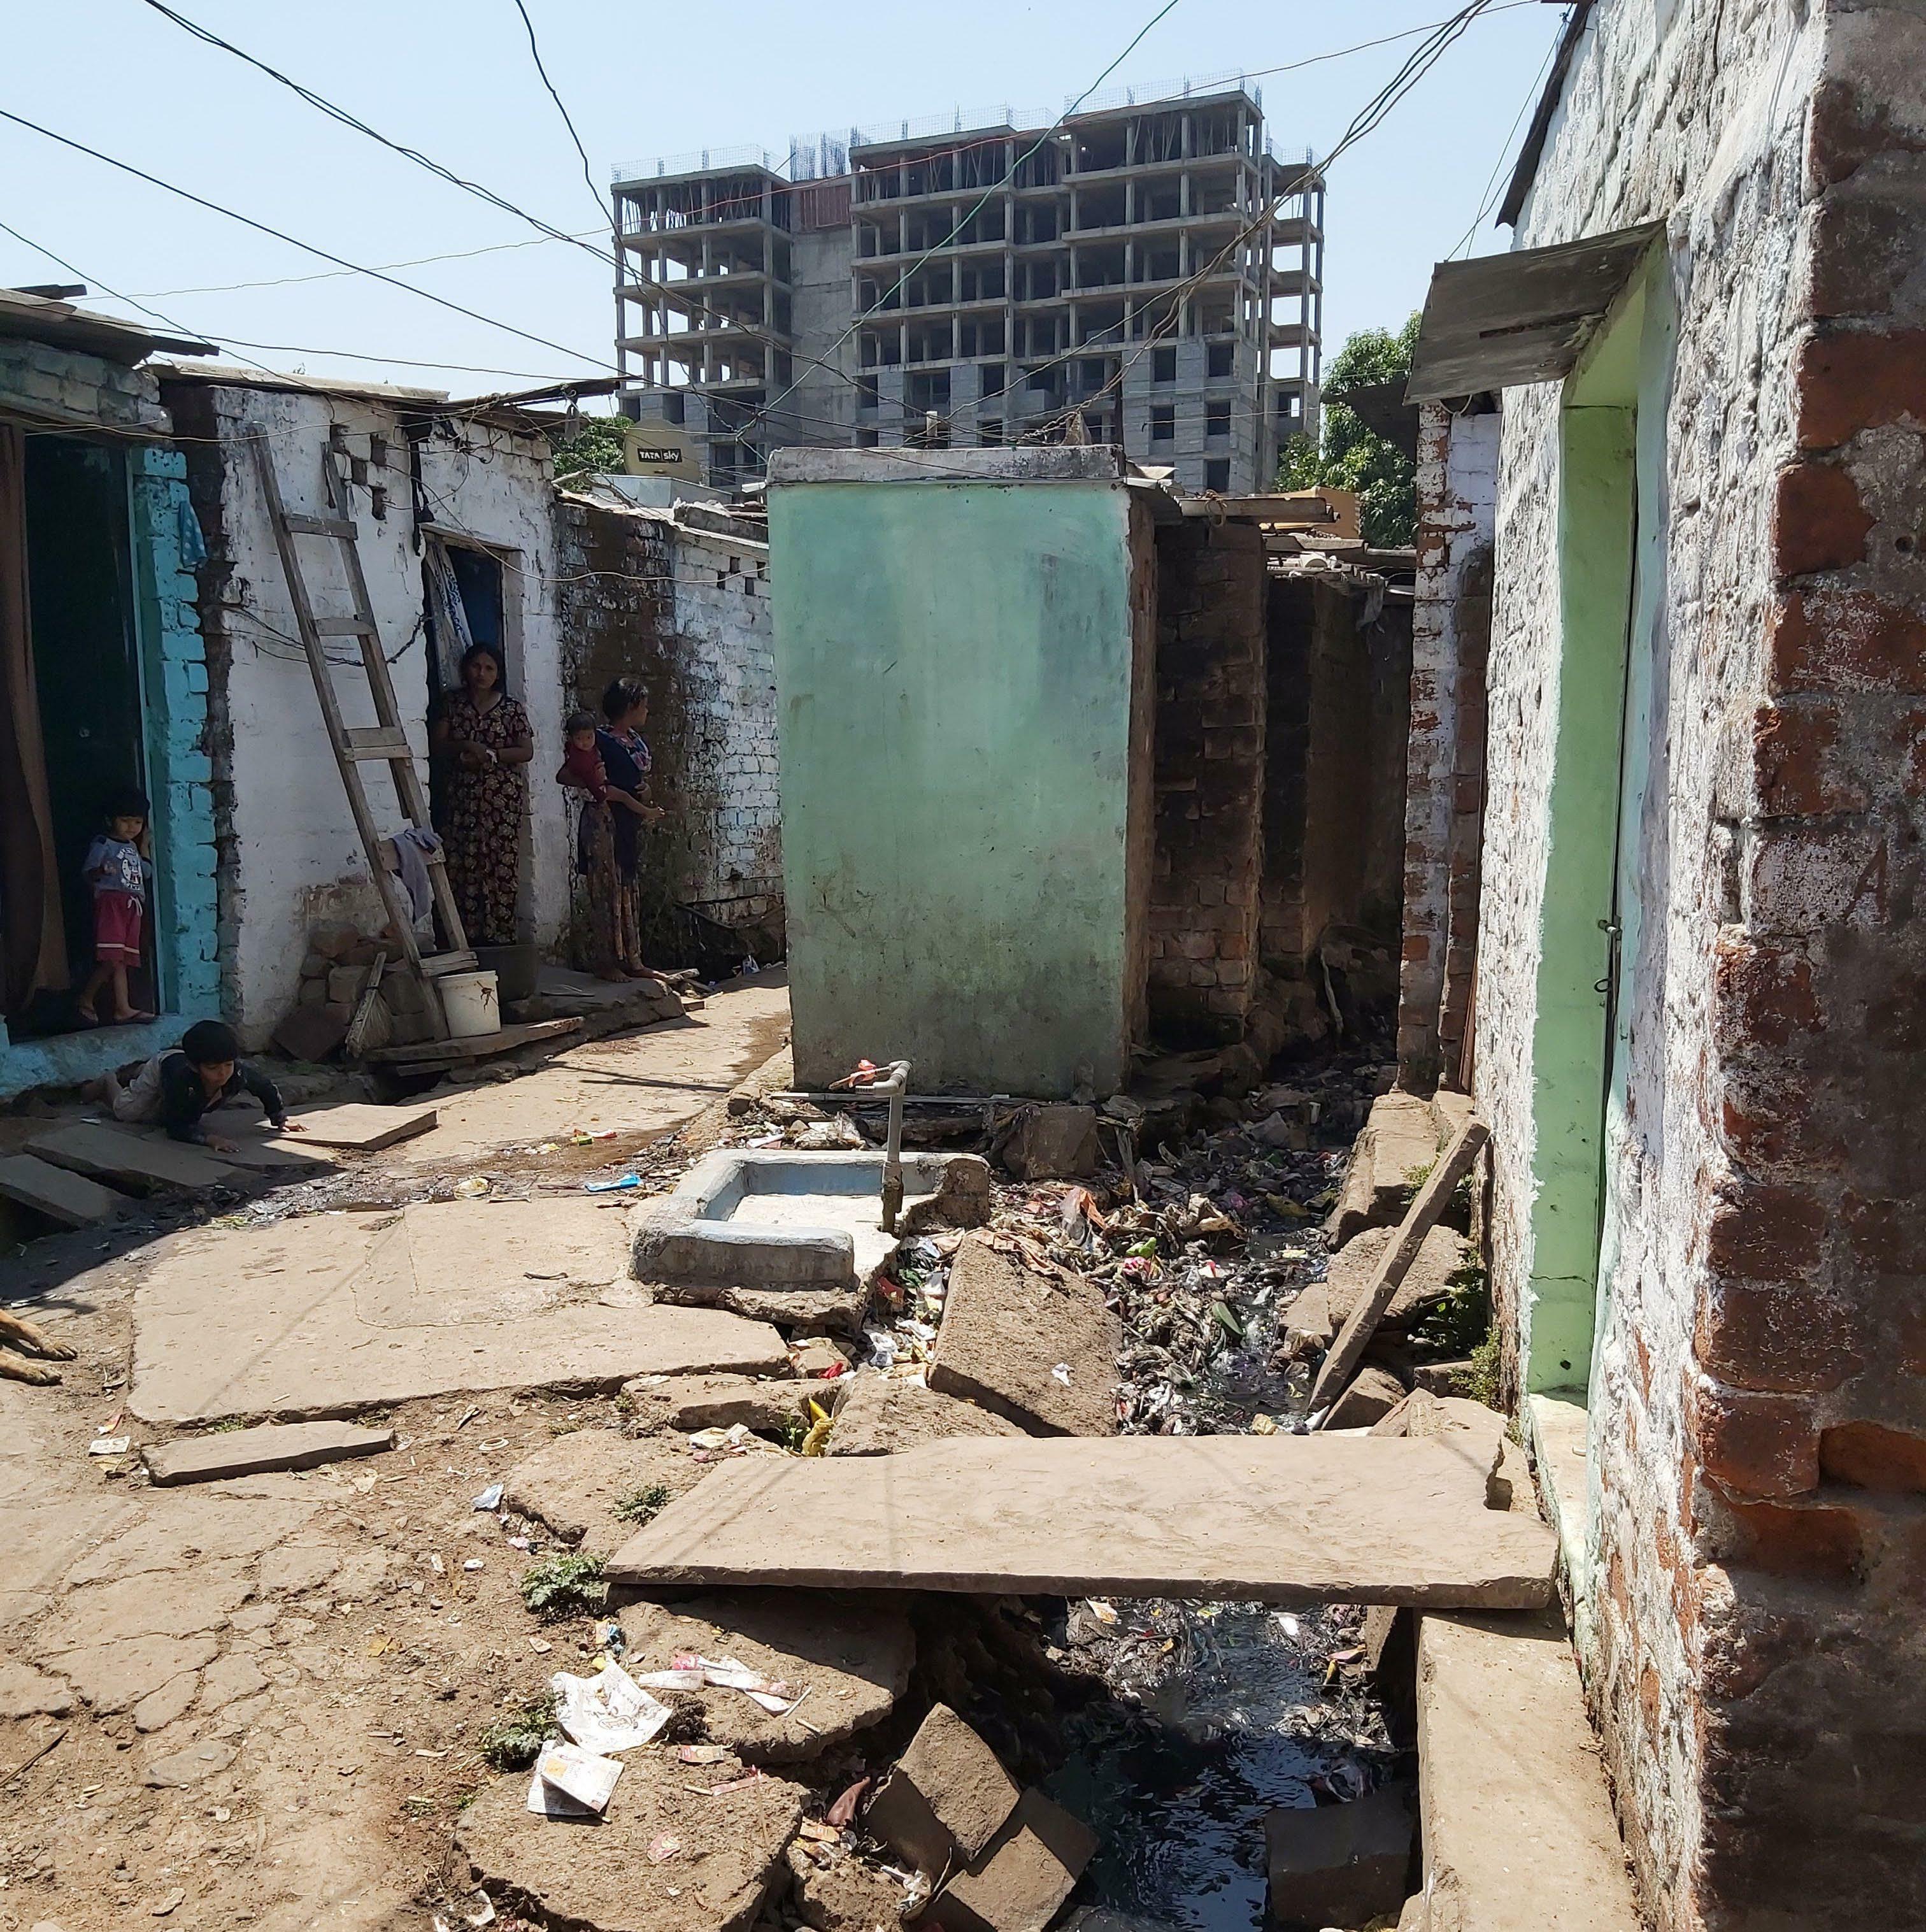
Increased population density, congested spatial fabric, and use of heat-trapping materials like tin sheets, cement sheet (asbestos), plastic, and tarpaulin increase their vulnerability to increased heat stress.

2 Topography and Proximity to Natural Features
Proximity to Waterbodies (lakes/streams/drains/rivers)
Topography (low lying area/valleys/slopes etc.)
Drainage lines
Pakka/ Katcha Roads
Location of slums in close proximity to water bodies like lakes, streams, and drains or nallahs increases their vulnerability to flooding. These water bodies often become dumping sites for the city and settlement thus exacerbating flooding risks and associated health and economic impacts.
3 Proximal Land-Use
Permeable surfaces

Stagnant water Spots
Industrial/Residential/ Commercial/Old City area
Specific features like landfill/garbage dumps/crematoriums, railways lines etc.
The land use in proximity to the slums (like industries, landfill sites, residential/commercial) areas determines the intensity of air, water, and land pollution.
#
19
Criteria Sub criteria
4 Access to Services and Public Amenities
Water supply/ Sanitation/ SWM /Electricity/Roads


Access to public health
Access to public transport
Why these criteria/sub-criteria?
Research in the global South indicates that access to services/risk reducing infrastructure like paved roads, storm and surface drainage, piped water, etc. can play an important role in decreasing vulnerability to climate change induced impacts like floods, water scarcity, and heat stress.
5 Socio-Economic Characteristics
Genesis
and Evolution
Cultural/Behavioural aspects


Livelihoods
The genesis and evolution determine the types of embedded/evolved knowledge systems that can play a role in their adaptive capacity. Similarly factors like the types/location of livelihoods and land tenure status (linked to access to services) also determine their susceptibility to climate change impacts.
Land Tenure
6 External Support


CBO Intervention
Interventions (social and technological) initiated by community-based organisations (CBO) are also evidenced to improve the adaptive capacity of the urban poor.
#
20
Criteria Sub criteria Why these criteria/sub-criteria?
#
21
What is a Heat wave?
A period of abnormally hot weather. 14 Also called ‘warm spells’ or ‘extreme heat event’. 14 Global climate change is likely to be accompanied by an increase in the frequency, intensity & duration of heat waves.7

What causes a heat wave?
A heat wave occurs anywhere when a high-pressure system develops over a large area forcing air downwards and trapping warm air close to the ground. 15

Who is most impacted?
Outdoor Workers
Construction workers and others who are exposed to heat for longer durations
High Pressure Warm air trapped
Old & Young
Because their bodies are unable to adjust to temperature changes easily Poor
Lack of access to services like proper shelter, water supply, electricity, etc.
A heat wave occurs can be accompanied by
or


High Humidity Very Dry Conditions
Urban Areas


Old, children, poor, and outdoor workers in urban areas are most impacted. Urban areas with high population density, lesser green cover, higher pollution increase the impact of heat waves.
Social Impacts
Heat-related illness and death
800 million people globally, are more often exposed to environmental risks like heat, due to poor infrastructure, building design and disadvantaged locations. 16
Economic Impacts

Productivity Loss
Globally, 2% of total working hours is projected to be lost every year, either because it is too hot to work or because workers have to work at a slower pace. 16
Ecological Impacts
Water Scarcity & Flooding
Heatwaves are leading to water shortages and increased stress in agriculture. Heatwaves are also causing glaciers across the globe to melt leading to flash floods downstream. 16

23



wave days
India 2016 2019 2022 150 174 203 17 6- 7 million Hectares Affected in 2022 18 Crop Failure Atleast 39 deaths in 2022 19 Deaths & Health Risk Disruption in Services 753 passenger train services cancelled in April 2022 20 to prioritise movement of coal rakes. This was to address the rising electricity demands.
Heat
in
Who declares a heat wave in India & when?
Temperature at which a heat wave is declared is dependent on the place.
The Indian Meteorological Department (IMD) declares a heat wave when the maximum temperature crosses the limits indicated in the table below. These limits vary across plains, hills, and coastal areas.
Heat wave (& warm night) is also declared based on ‘departure from normal temperature’ and ‘maximum actual temperature’.
If the below criteria is met at least in 2 stations in a meteorological sub-division for at least two consecutive days, then heat wave is declared on the second day.
Temperature Limits beyond which Heat wave is declared
Warm Night
When maximum temperature at night is 400C or more
Warm night is declared if departure from minimum temperature at night is 4.50C to 6.40C
Very warm night is declared if departure from minimum temperature at night is more than 6.40C
Based on ‘departure from normal’
Based on ‘maximum actual temperature’


400C or more in plains
300C or more in hills
For both plains & hills
Heat Wave if departure from normal is 4.50C to 6.40C
Heat Wave if maximum is 450C or more
Severe Heat Wave if departure from normal is 6.40C or more
Severe Heat Wave if maximum is 470C or more
370C or more in coastal areas
Heat wave if departure from normal is 4.50C or more
Heat wave if maximum is 370C or more
Source: IMD, https://internal.imd.gov.in/section/nhac/dynamic/FAQ_heat_wave.pdf 25
Heat wave prone areas in India
Heat wave months in India
Punjab Haryana Uttar Pradesh Rajasthan


Delhi
Heat wave peaks in May
Gujarat Madhya Pradesh Bihar West Bengal Orissa
Maharashtra Karnataka
Telangana
Andhra Pradesh
Kerala (Sometimes)
Tamil Nadu
(Sometimes)
Rare cases of heat wave in July also Source: IMD, https://internal.imd.gov.in/section/nhac/dynamic/FAQ_heat_wave.pdf
Mar Apr Jun Jul Aug Sep Oct Nov


26
Jan Feb
How does IMD monitor heat waves?
IMD has a big network of surface observatories covering the entire country.
These stations measure various things like Temperature Humidity
Pressure Wind Speed & Direction
Based on daily maximum temperature station data over many decades, IMD finds out the normal maximum temperature of the day for particular station. IMD then declares heat wave over the region based on changes from this normal temperature. 19
shared?
All India Weather Forecast Bulletin & Special Heat Wave Guidance Bulletins are released 4 times everyday during 1 April to 30 June in IMD website.
The heat wave information is shared with concerned State Government Authority, Media, Indian Railway, Health and Power departments etc. District wise heat wave warnings are issued by State Centres of IMD. The general public is informed through Print & Electronics Media.
Heat wave alerts by IMD
Normal Day (No Action)


Heat wave map disseminated by IMD. This map is for 29th April 2022.
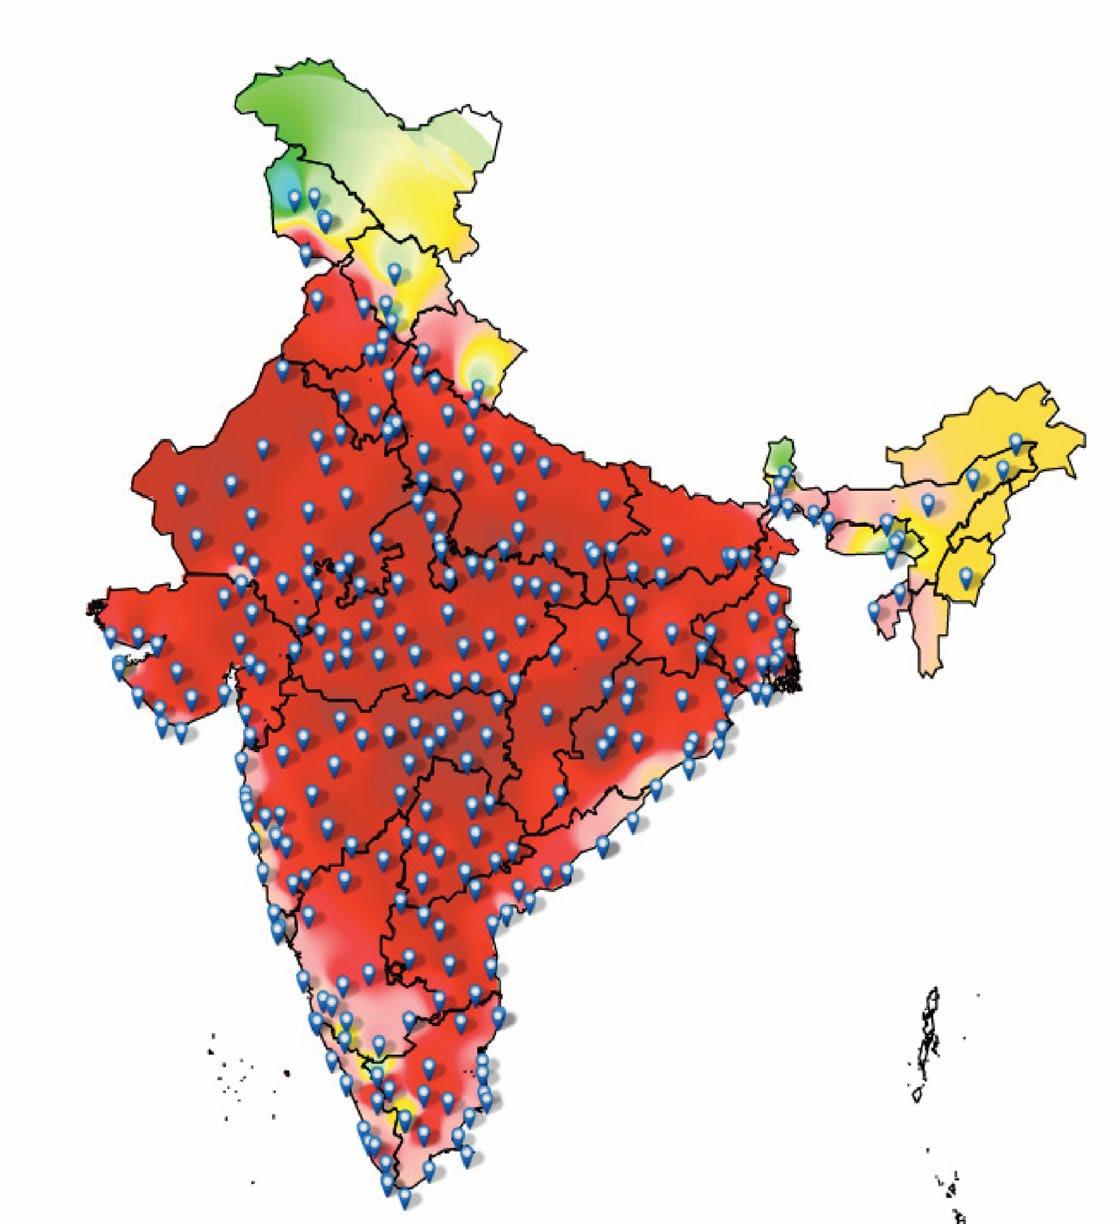
Maximum temperatures are near normal
Heat Alert (Be Updated)
Severe Heat Alert for the day (Be Prepared)
Heat wave conditions at isolated pockets persists on 2 days
(i) Severe heat wave conditions persists for 2 days (ii) Though not severe, but heat wave persists for 4 days or more
Extreme Heat Alert for the day (Take Action)
(i) Severe heat wave persists for more than 2 days (ii) Total number of heat/severe heat wave days exceeding 6.
How is information from IMD on heat waves
27
Bhopal

Number of days experiencing extreme heat conditions- above 430C has increased from 10 days in April 2021 to 28 days in April 2022 21, 22
Bhopal experienced heat waves in April, May and June in 2022
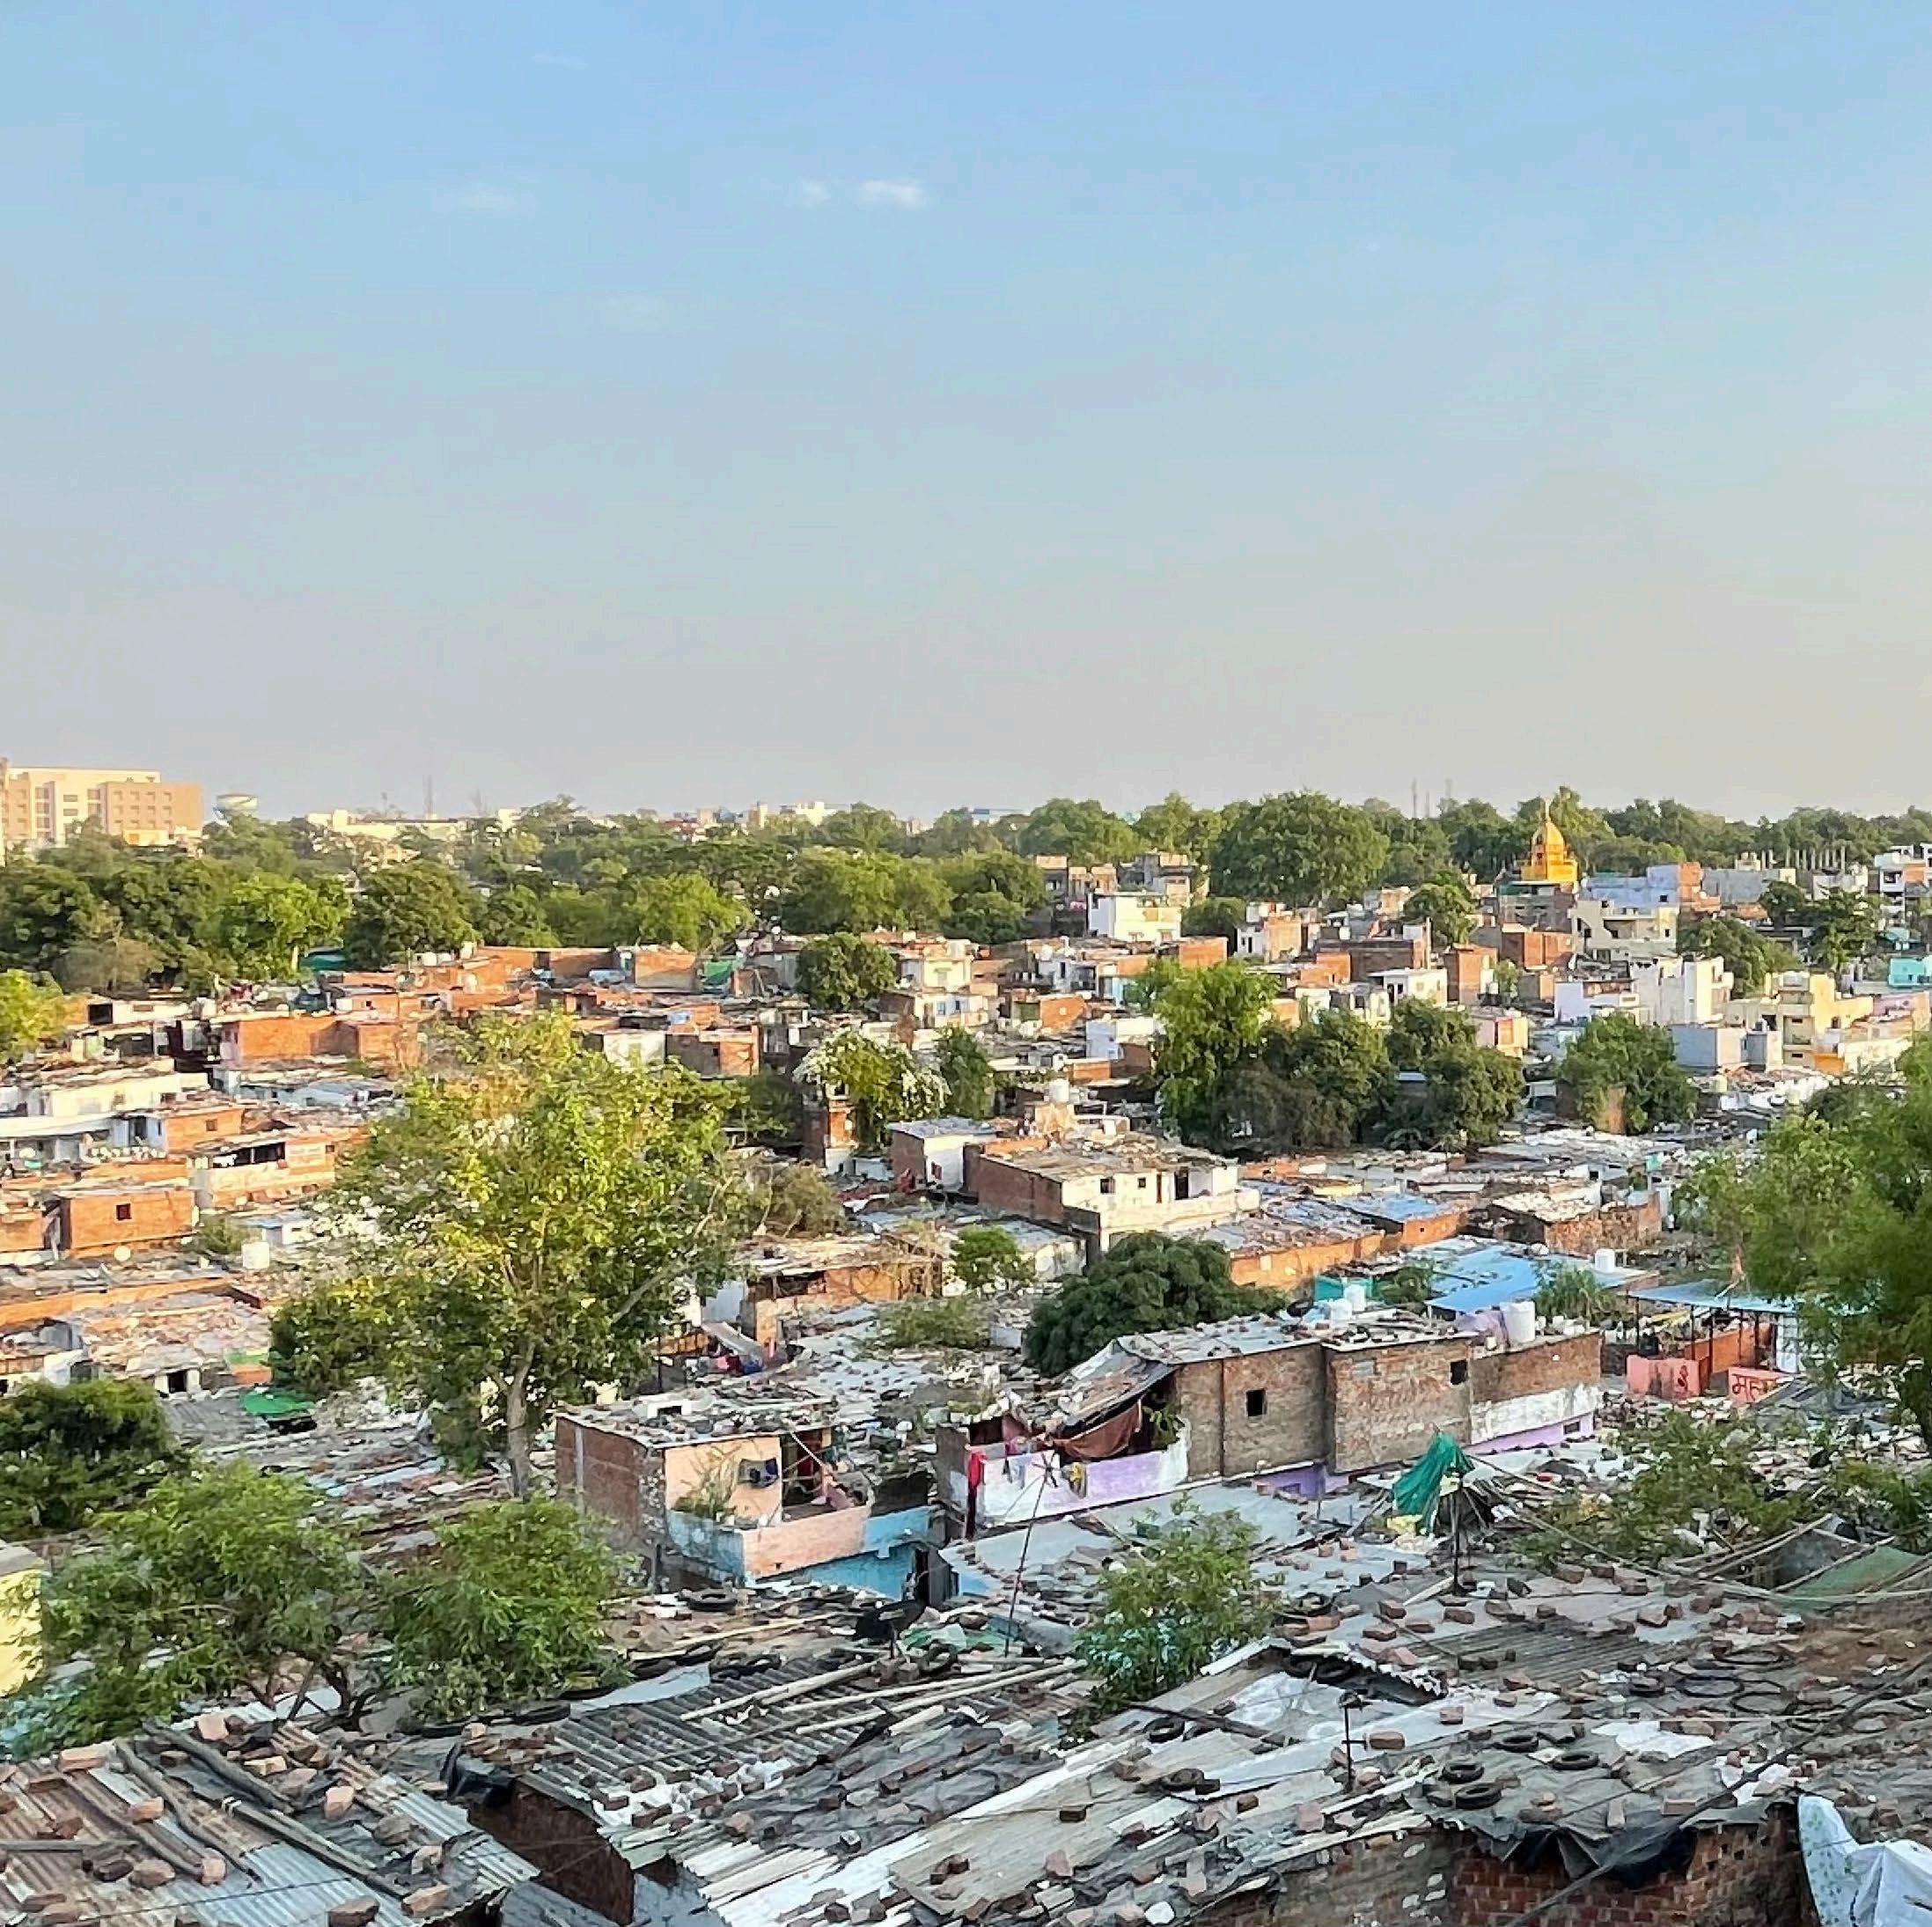
Green Cover in the City has reduced from 35% in 2009 to 9% in 2019. 24
Informal settlements have grown exponentially across the city in the past 20 years. There are 388 informal settlements in the city, which are home to 36% of the city’s households. 25
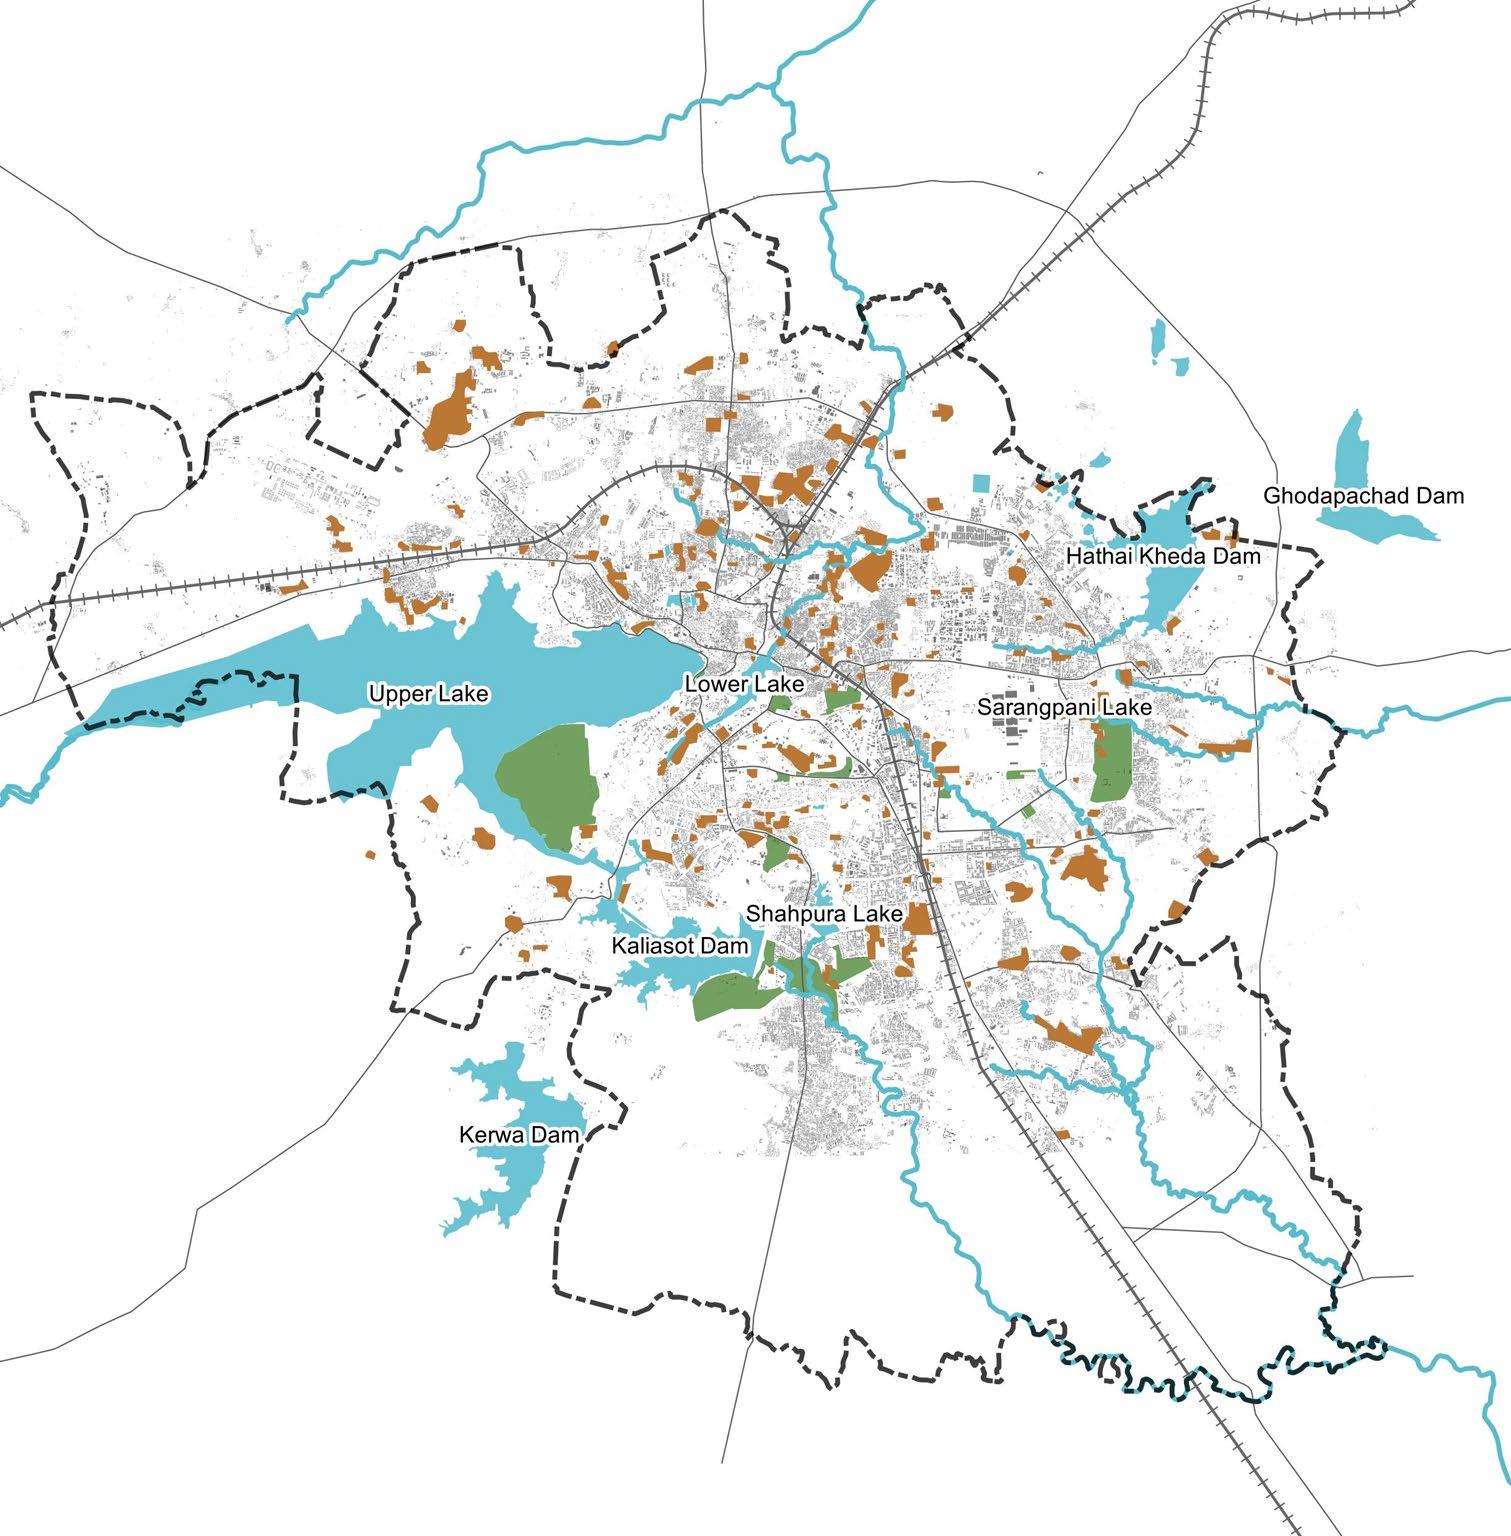
Water level in the Upper lake dipped to 1651.80 feet in 2019, which is below the minimum level of 1652 feet (needed to keep the lake alive). 26


The built area in the city has grown tremendously. 23 1989 207 sq km 353 sq km 2018 2031 Projected 53 sq km Municipal Boundary Slums Roads Green Areas Lakes/Streams Railway Line Legend 29
Land Surface Temperature of Bhopal
Upper
Informal Settlement shown on next page
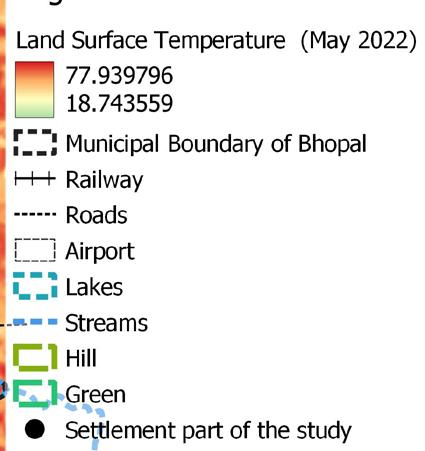
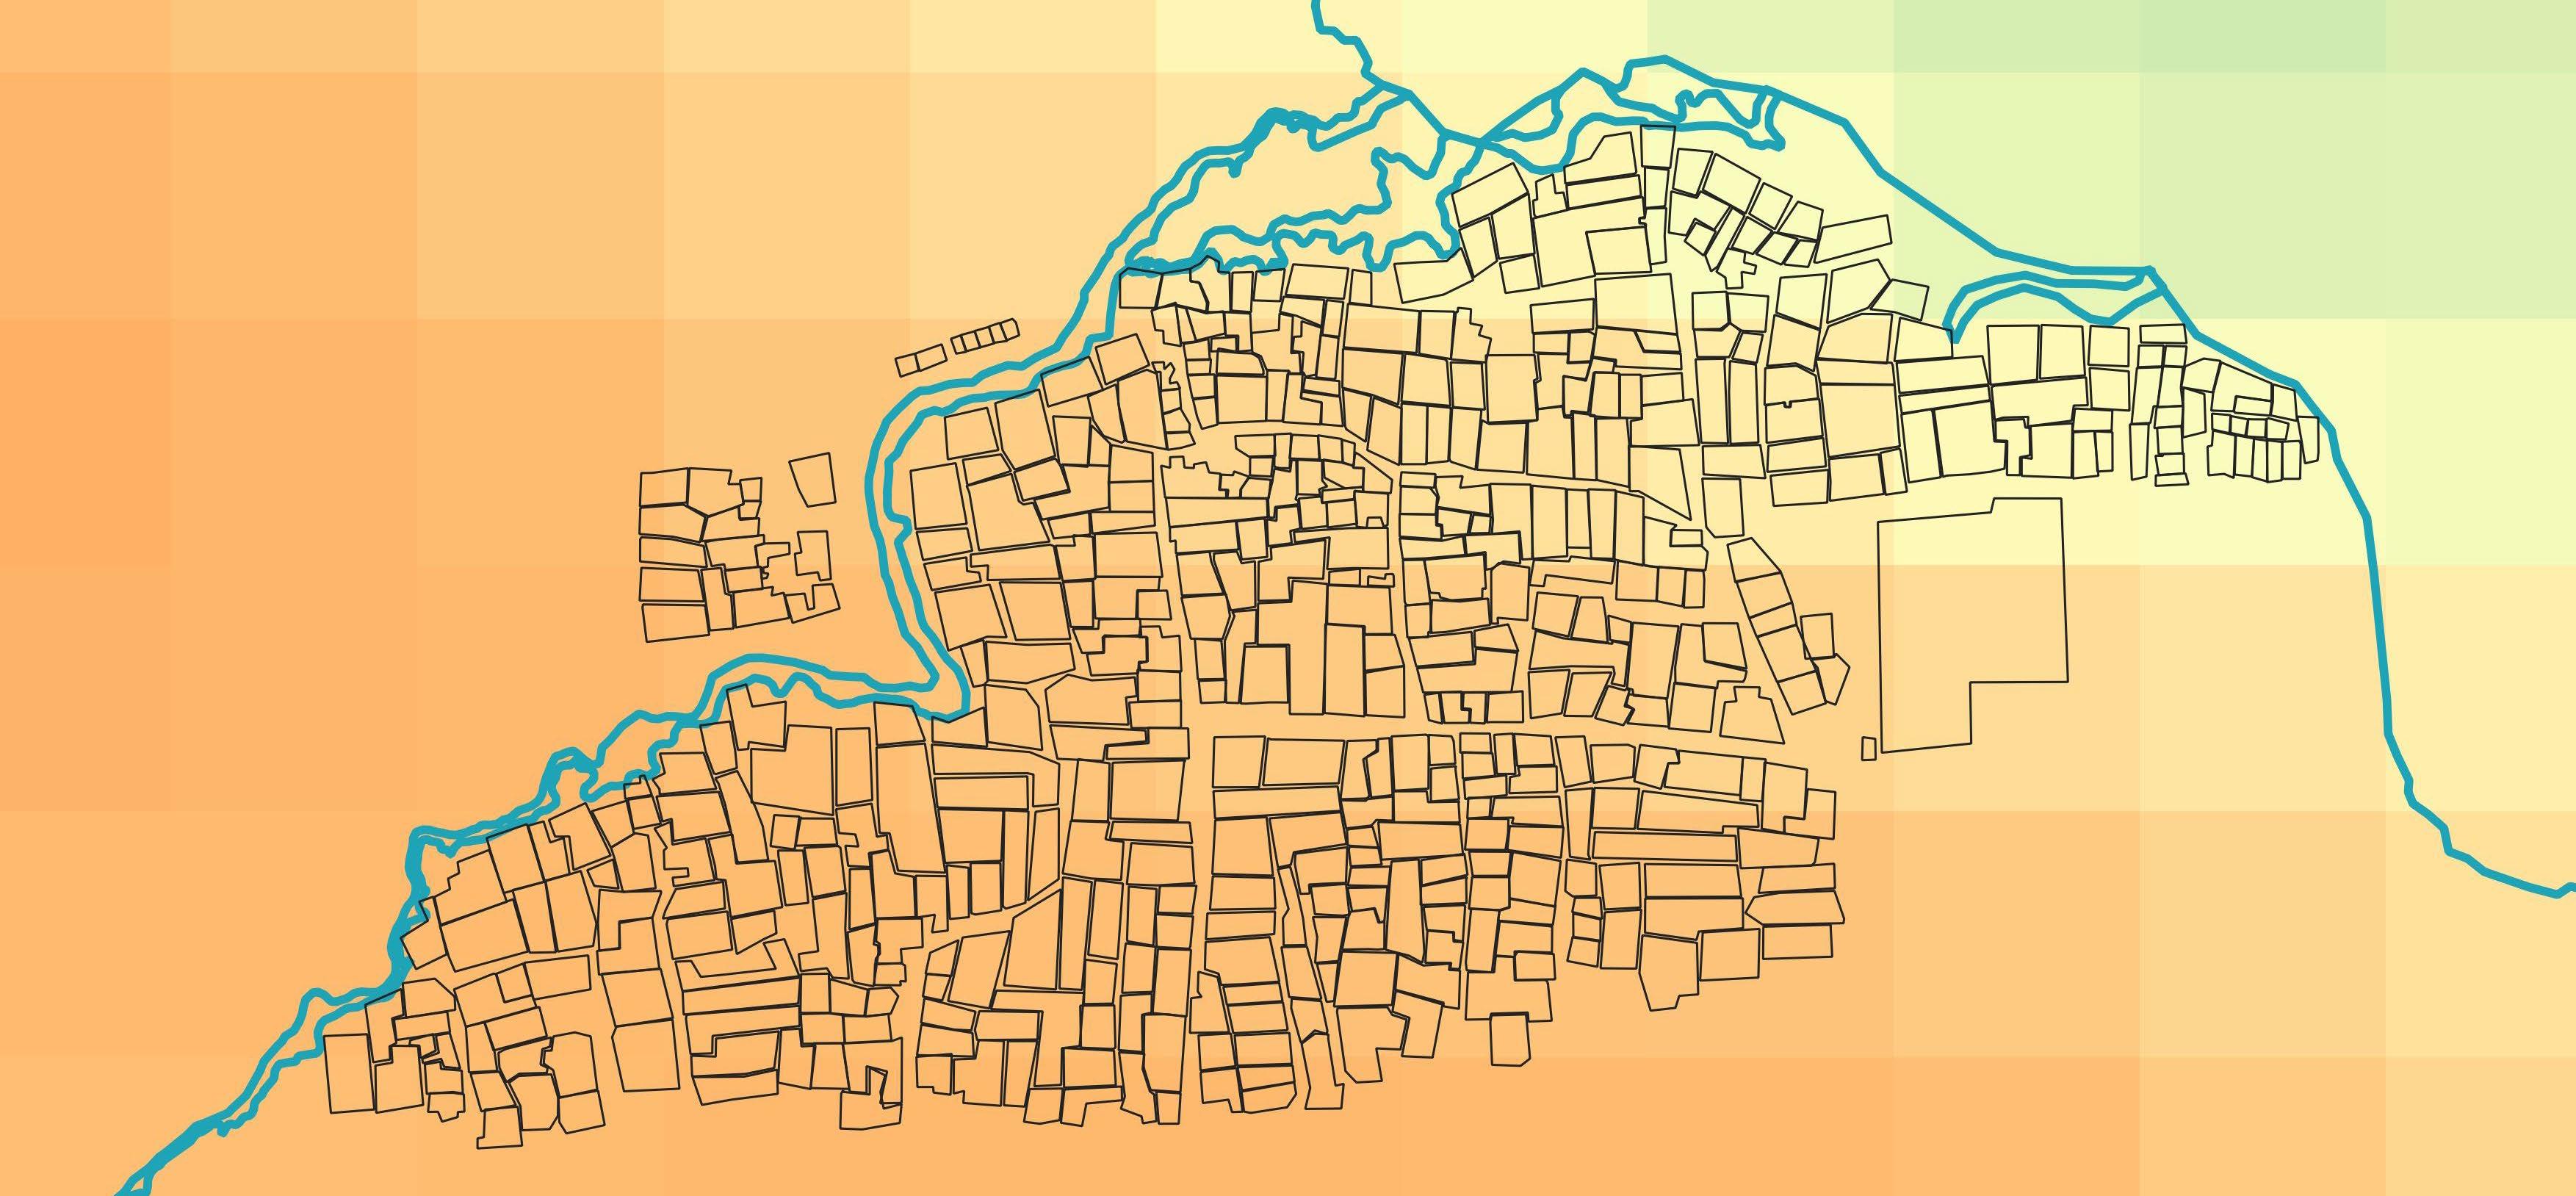
This is the Land Surface Temperature (LST) map of Bhopal city on 29th April 2022 during the heat wave.

LST is the temperature of the top of the surface of the earth which is in direct contact with a temperature measuring instrument.


560C 320C Municipal Boundary Slums Temperature Range Roads
(on 29th April 2022)
Lake Lower Lake
Kaliasot
Dam
Dam
Hathai
Kheda
Average City Temperature 410C
Kerwa
Dam


of an informal settlement
LST
in Bhopal
Sarangpani Lake
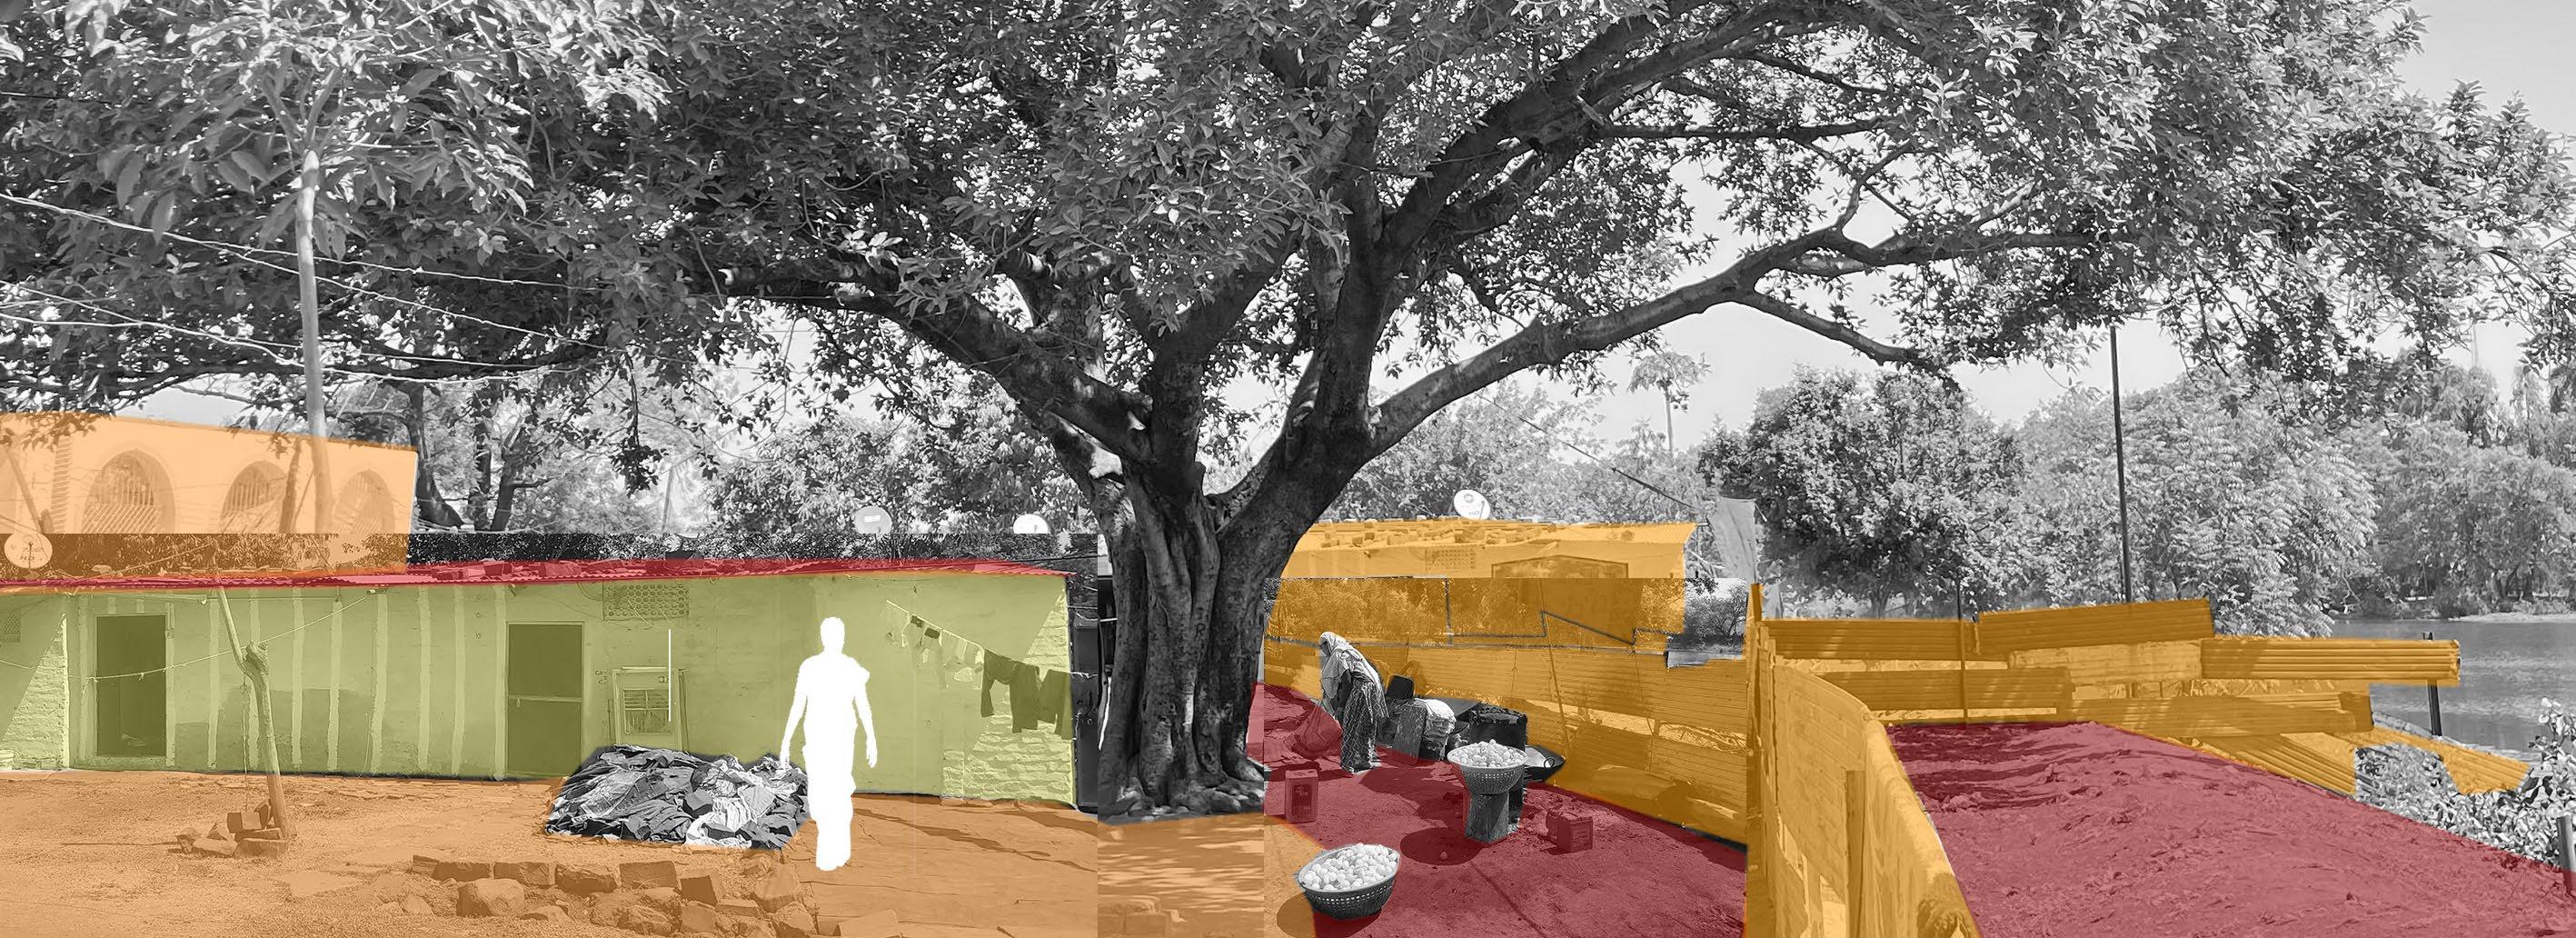
41 C 44 C 49 C Average Temperature Average City Temperature 410C High Density Housing materials that heat up faster and emit more heat Improper solid waste management Very few green and open spaces 38.2 0 C Ground 34.8 0 C Brick Wall 33 0 C Tin Sheet 70.7 0 C Dambar Sheet 62.4 0 C Gravel Ambient Temperature 40.10C 31
While the average city temperature on 29th April 2022 was 410C, the temperature within an informal settlement can go higher as shown in the above map. This could be because of multiple reasons like
Story of Shanti Nagar
This is Shanti Nagar, one of the oldest settlements in the city. It is located in a low-lying area along a small stream which has turned into a dirty nallah over time. The settlement has densified over the years and presently houses approximately 250-300 households. The houses in Shanti Nagar are made of brick walls and asbestos/tin sheet roofs. The area has 20 community taps and receives water only for 2 hours a day and most of the houses have their own toilets connected to soak pits. Most men in the settlement are daily wage workers, and the women are engaged in domestic or home-based work.
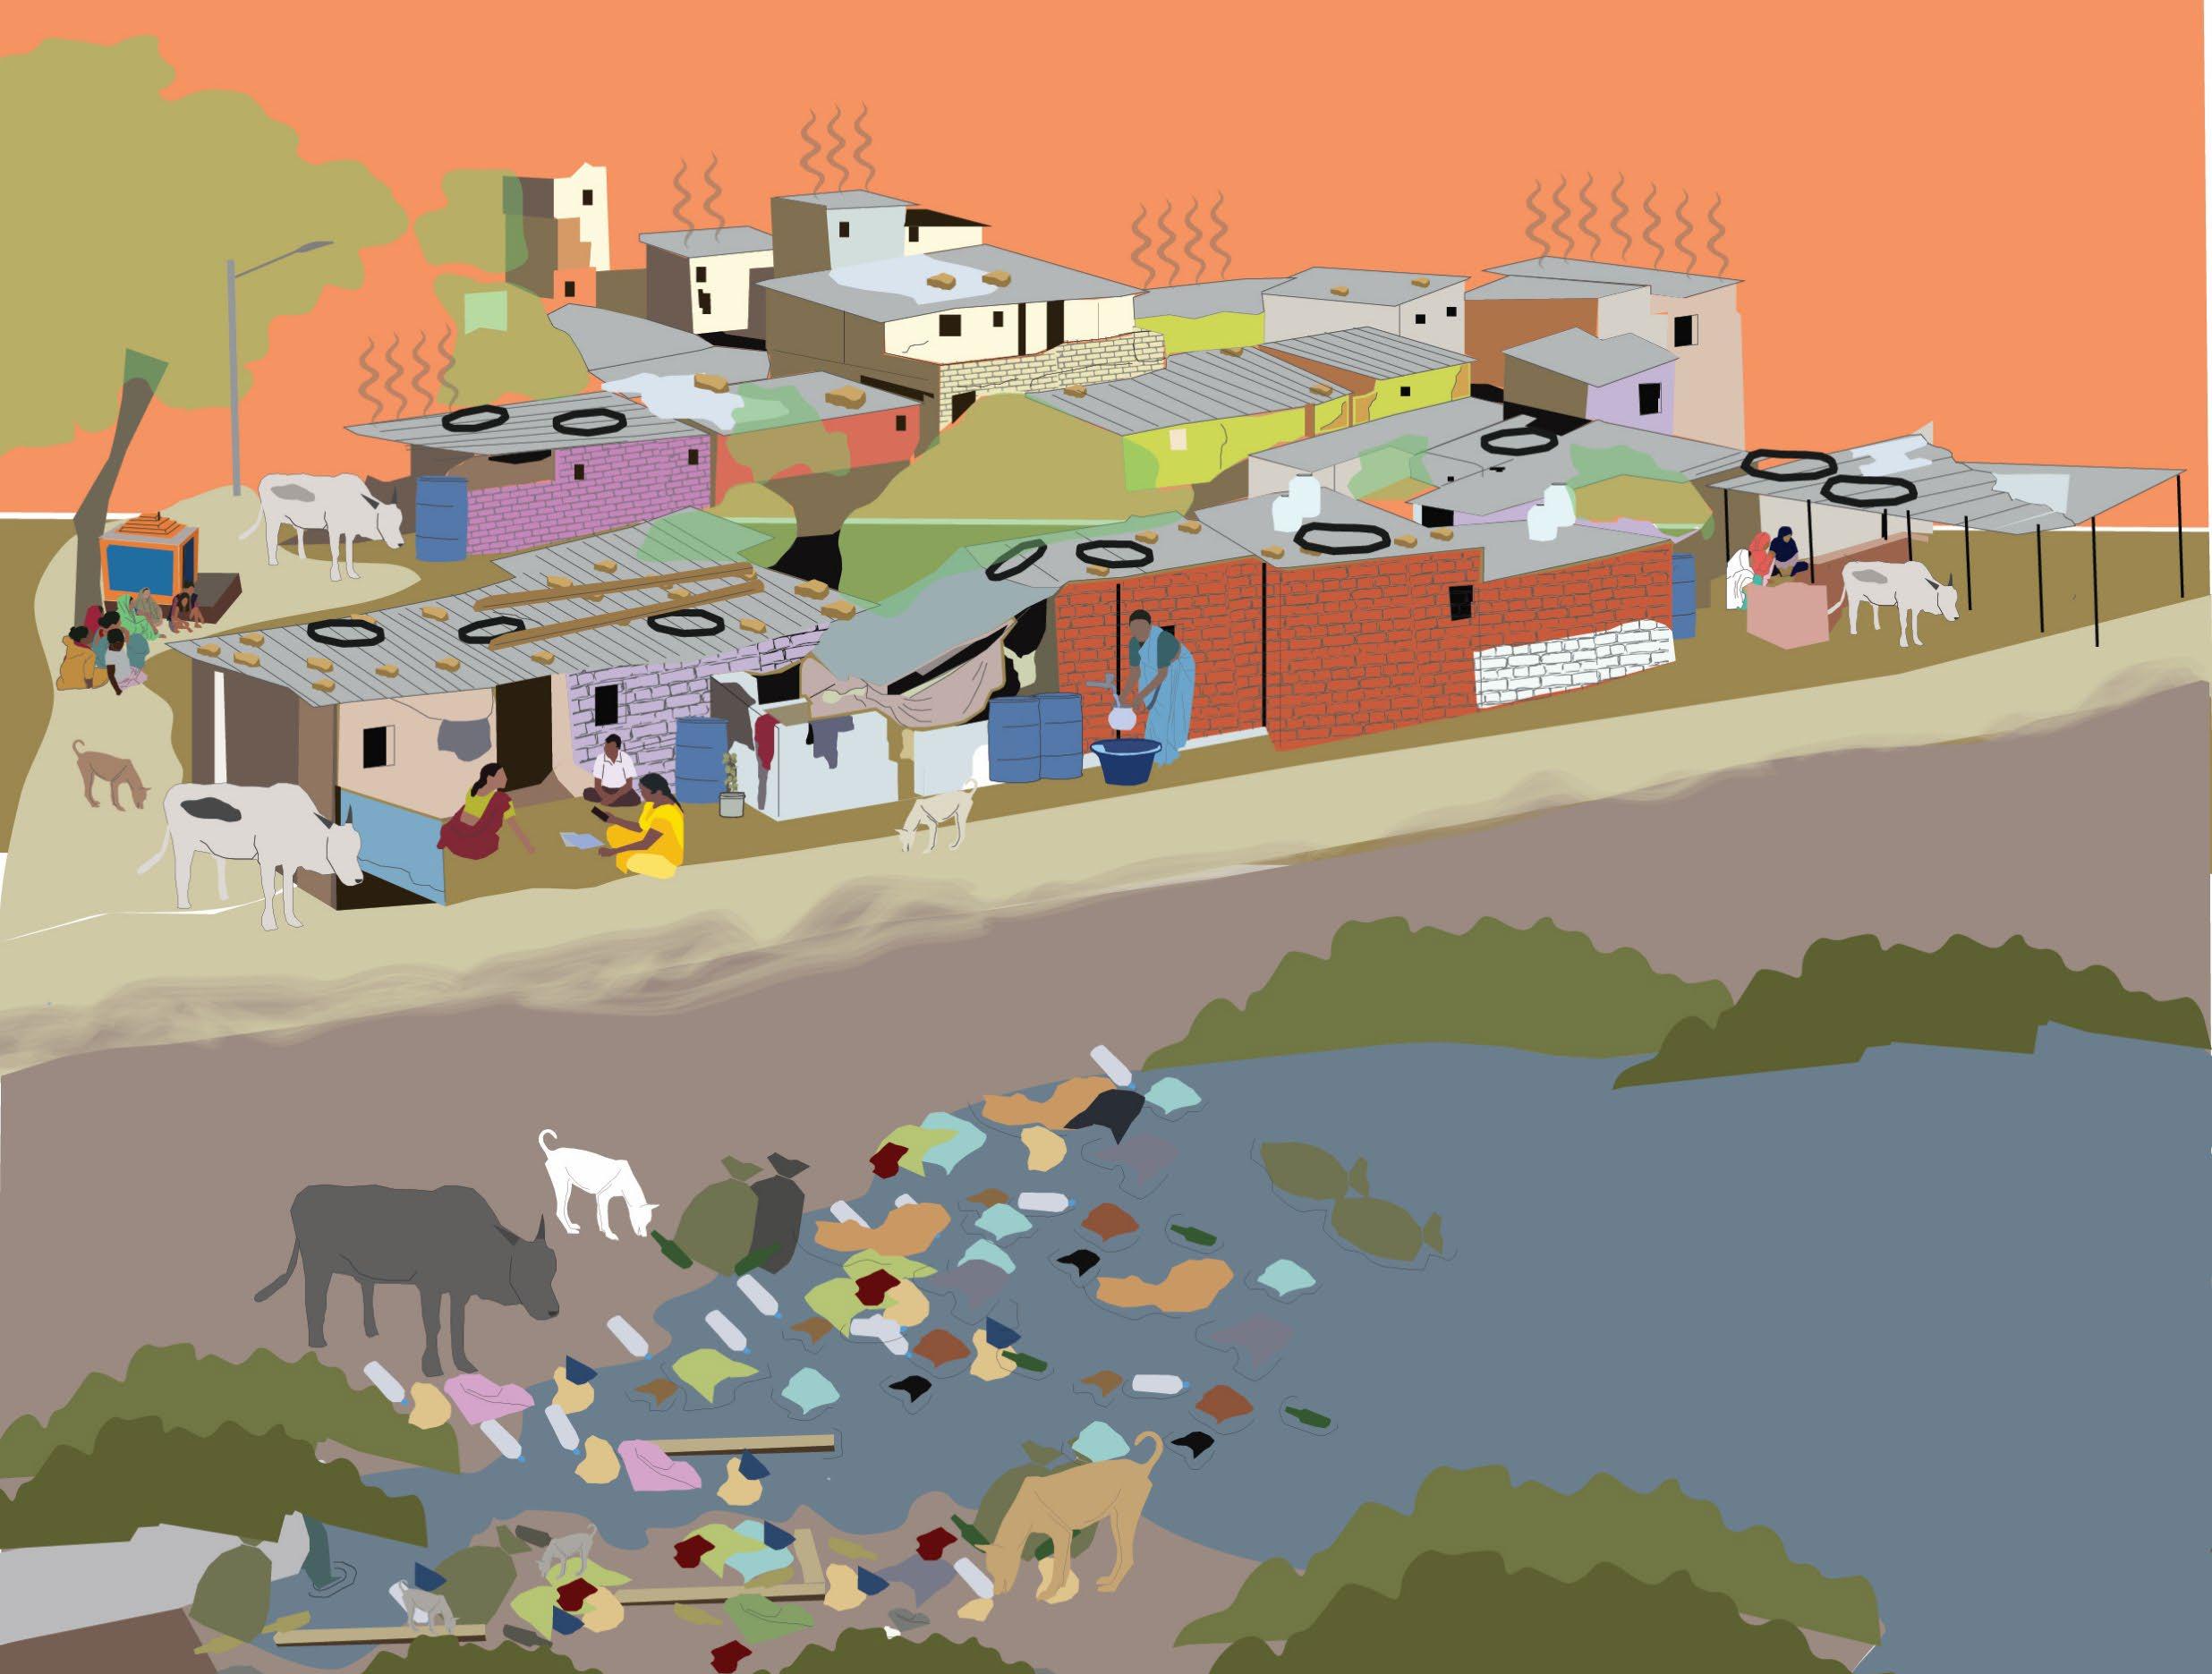
32
Shanti Nagar does not receive solid waste management services from the municipality. As a result, residents end up dumping their waste in the adjacent stream. Earlier, residents used to sleep outside at night during summer. However, they do not do this anymore because haphazard garbage dumping has led to an increase in mosquitoes and rodents.
Building materials used in the settlement (asbestos and tin sheets which absorb and emit a lot of heat), increased density, lack of green spaces, and a dirty nallah is contributing to a heat island effect within the settlement, even at night.
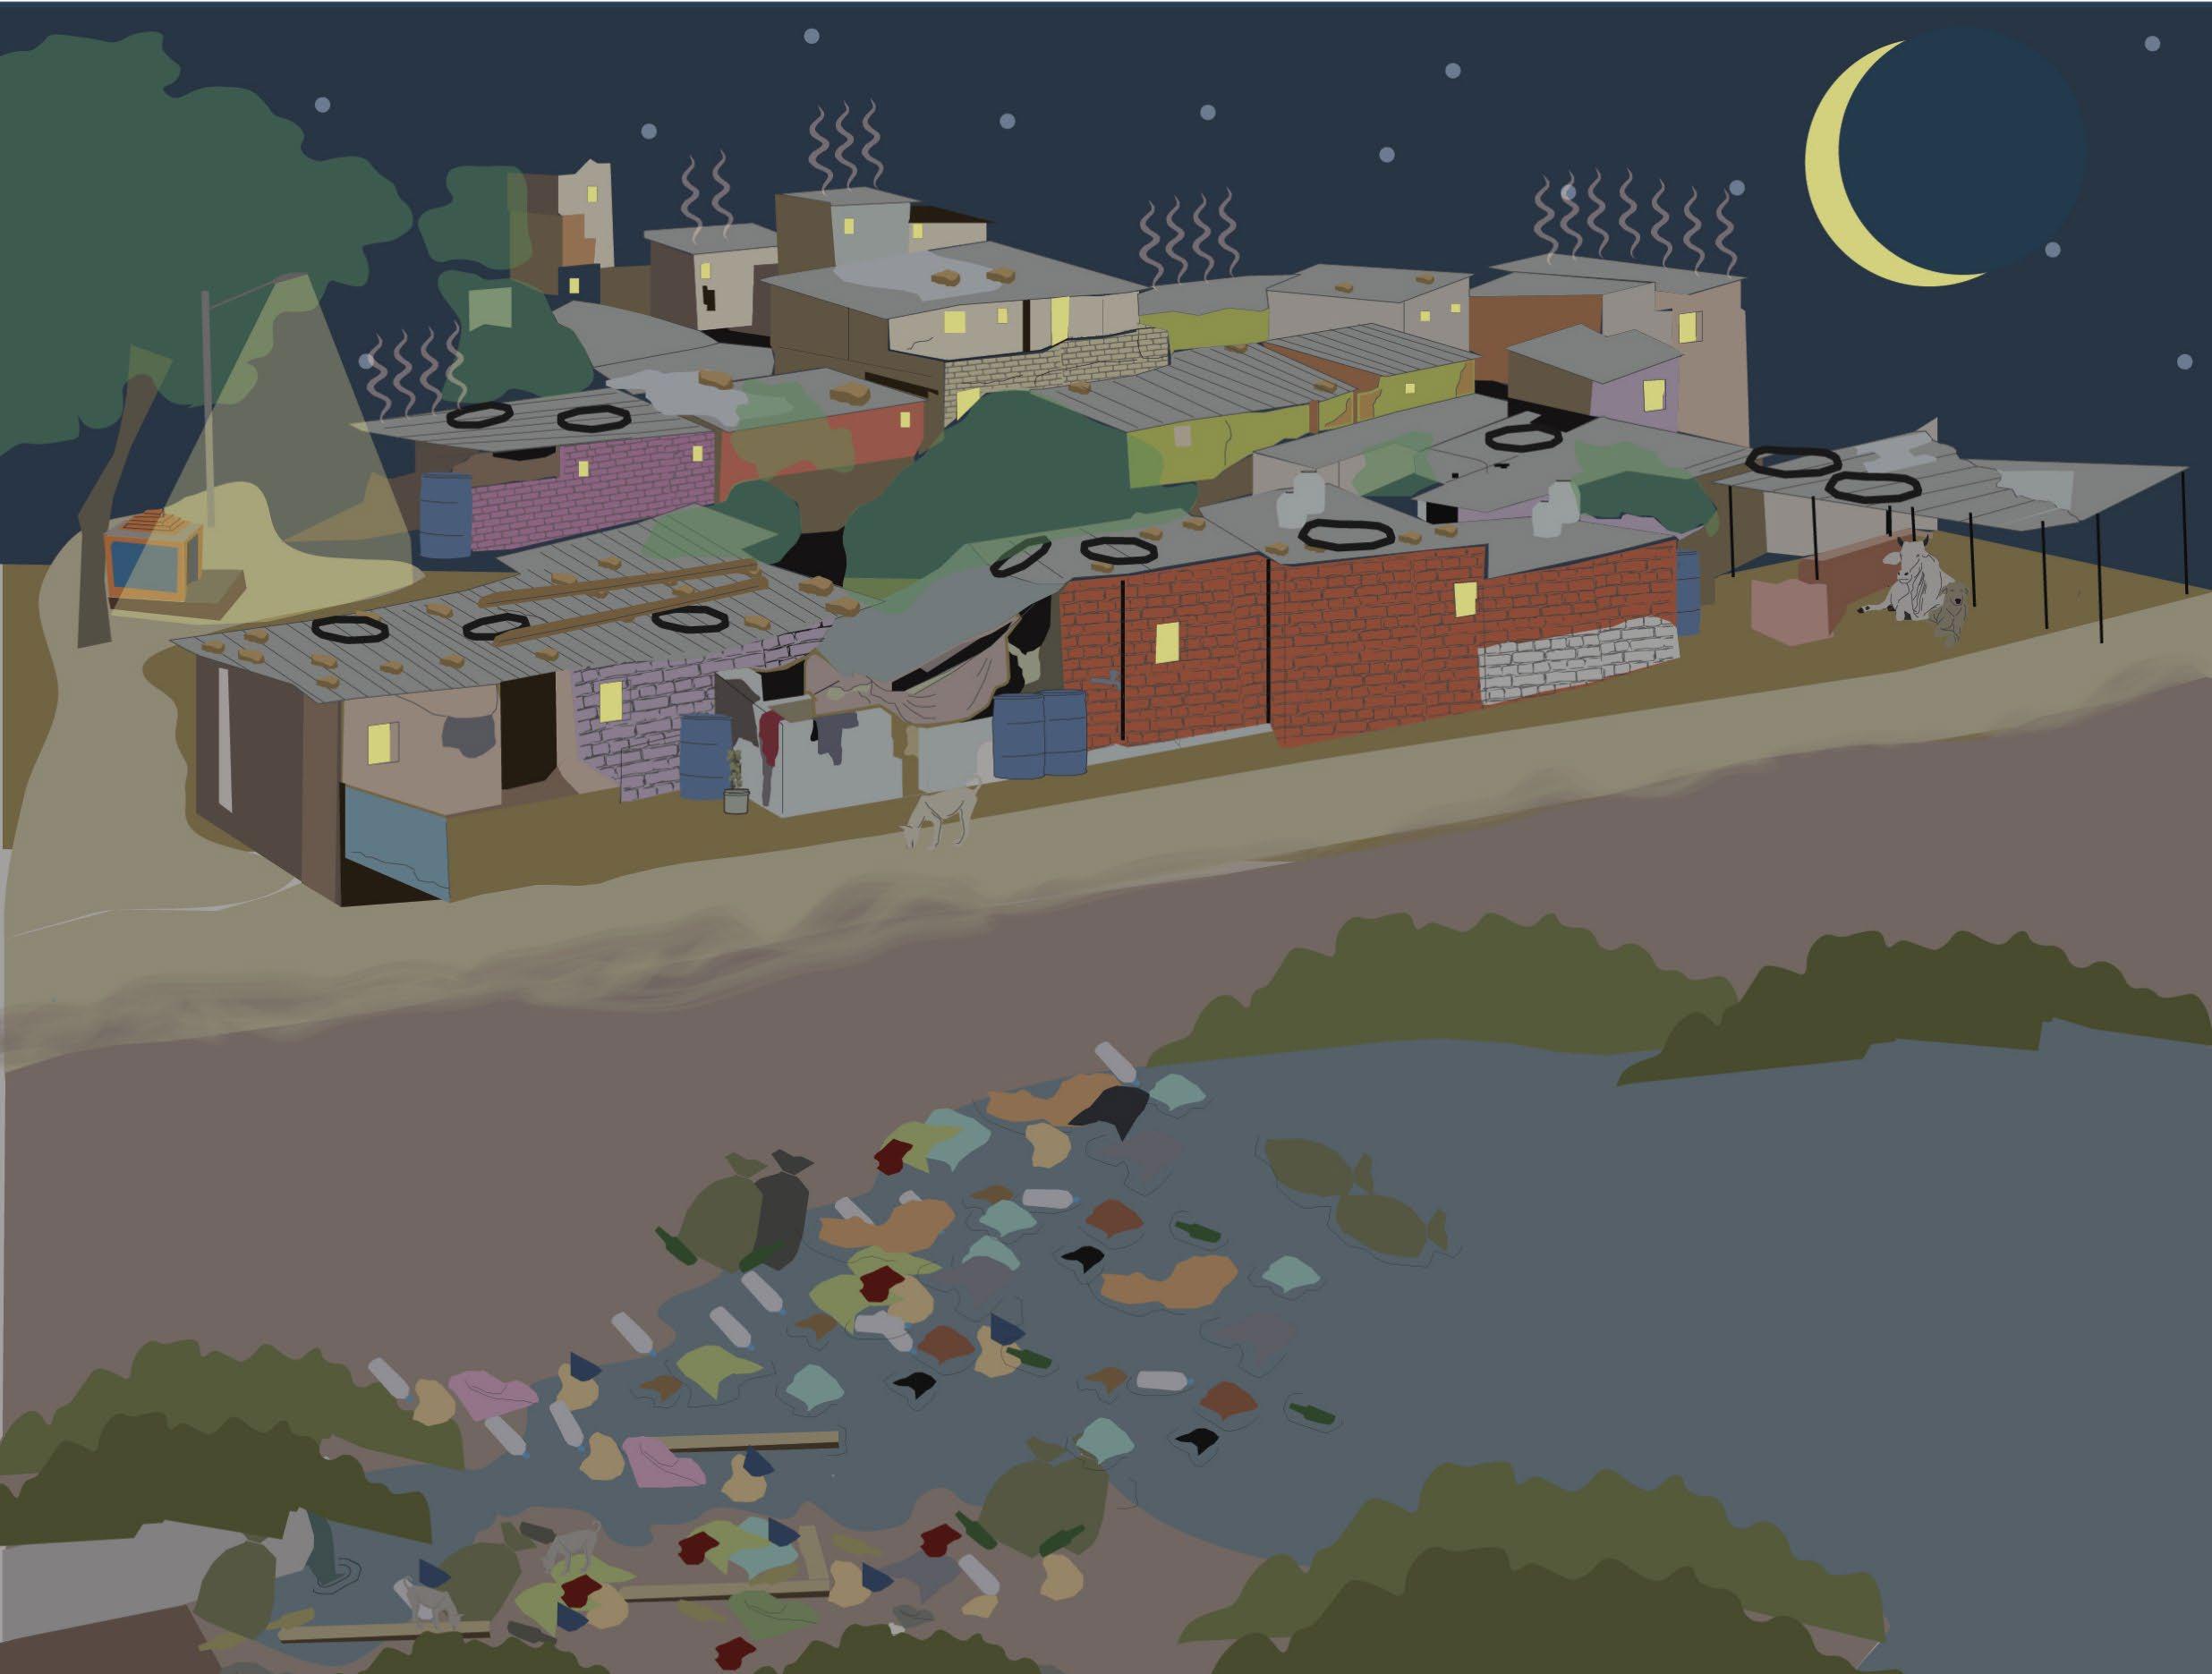
33
Conversations from Shanti Nagar
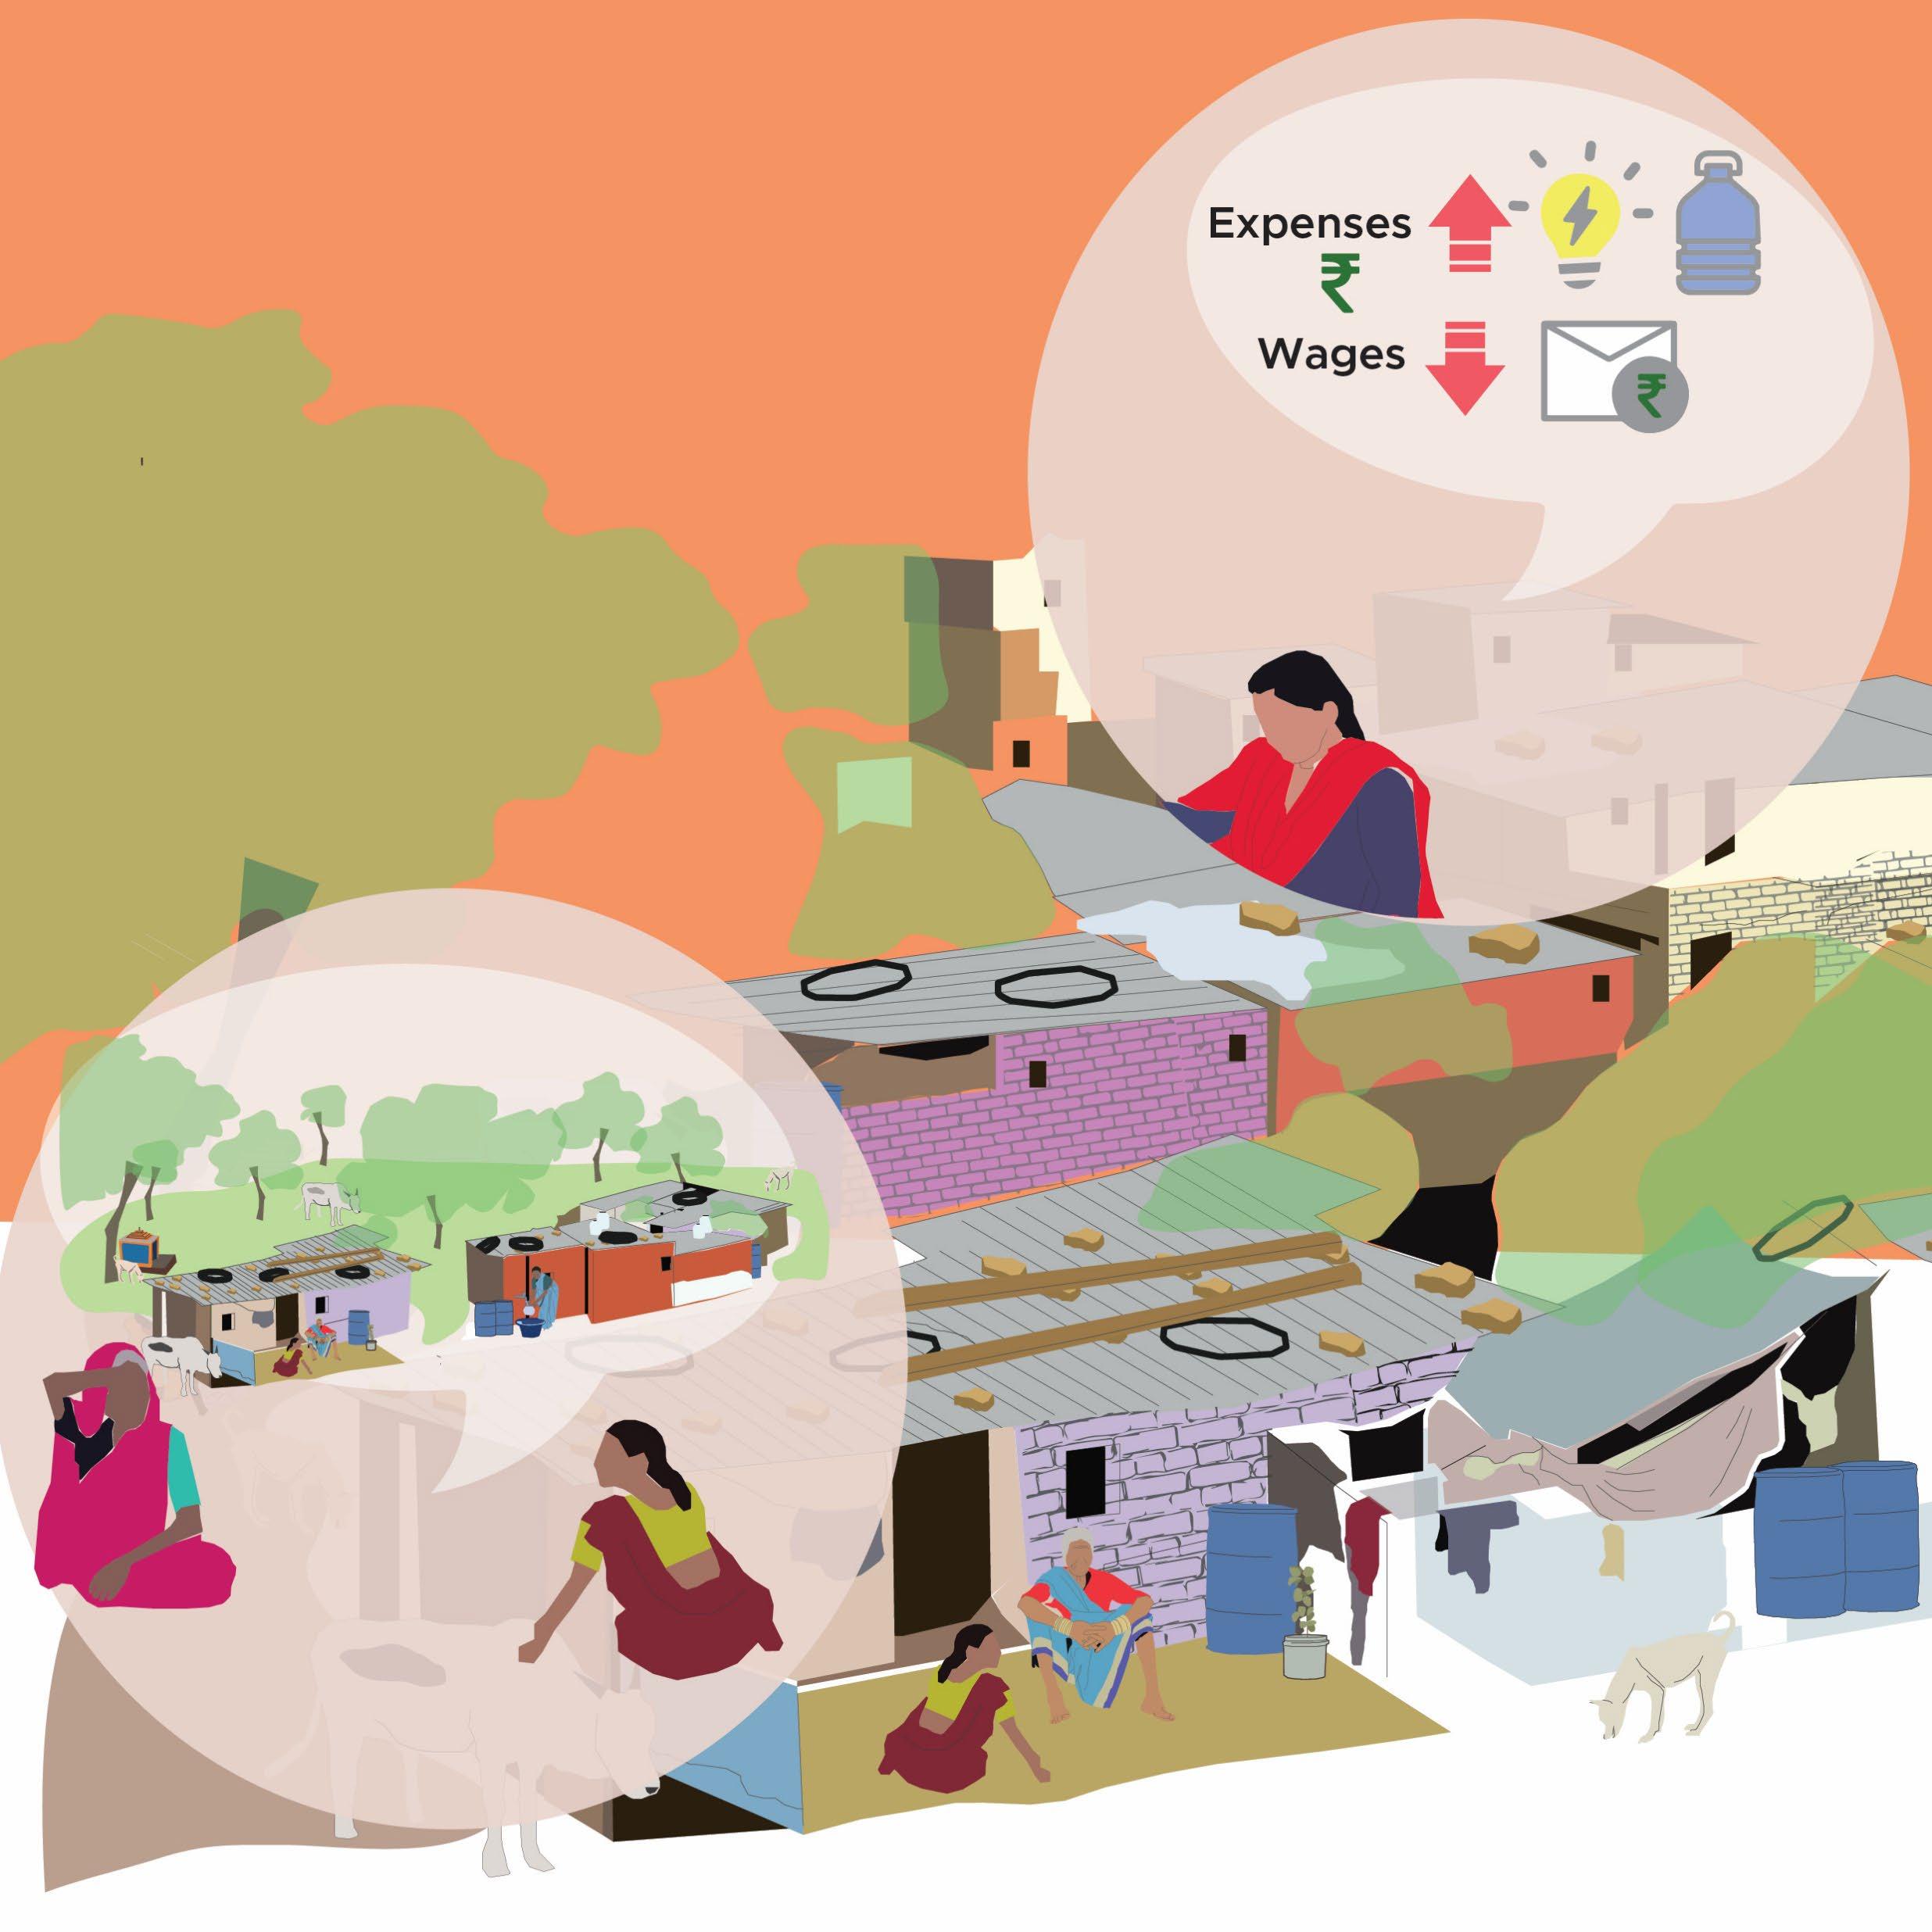
During a heatwave
“My husband and I are very worried about our expenses during this heat wave. We are rationing our household income for essential needs as we can’t afford to spend it unwisely.”

“Our locality was so much greener and cooler earlier! We had a lot of fruit trees like mango, amla, and jamun, and even big trees like Banyaan and Peepal.”

34
“The nallah was so beautiful and clean when I first came here 20 years ago. Now people dump so much garbage in it. Even sewage from the neighbouring areas flow into it. The water in the nallah has also decreased so much because of the heat”
“The heat is becoming unbearable by the day! I feel the pollution from the main road traffic and dust from the nearby construction site have worsened the heat in the area.”


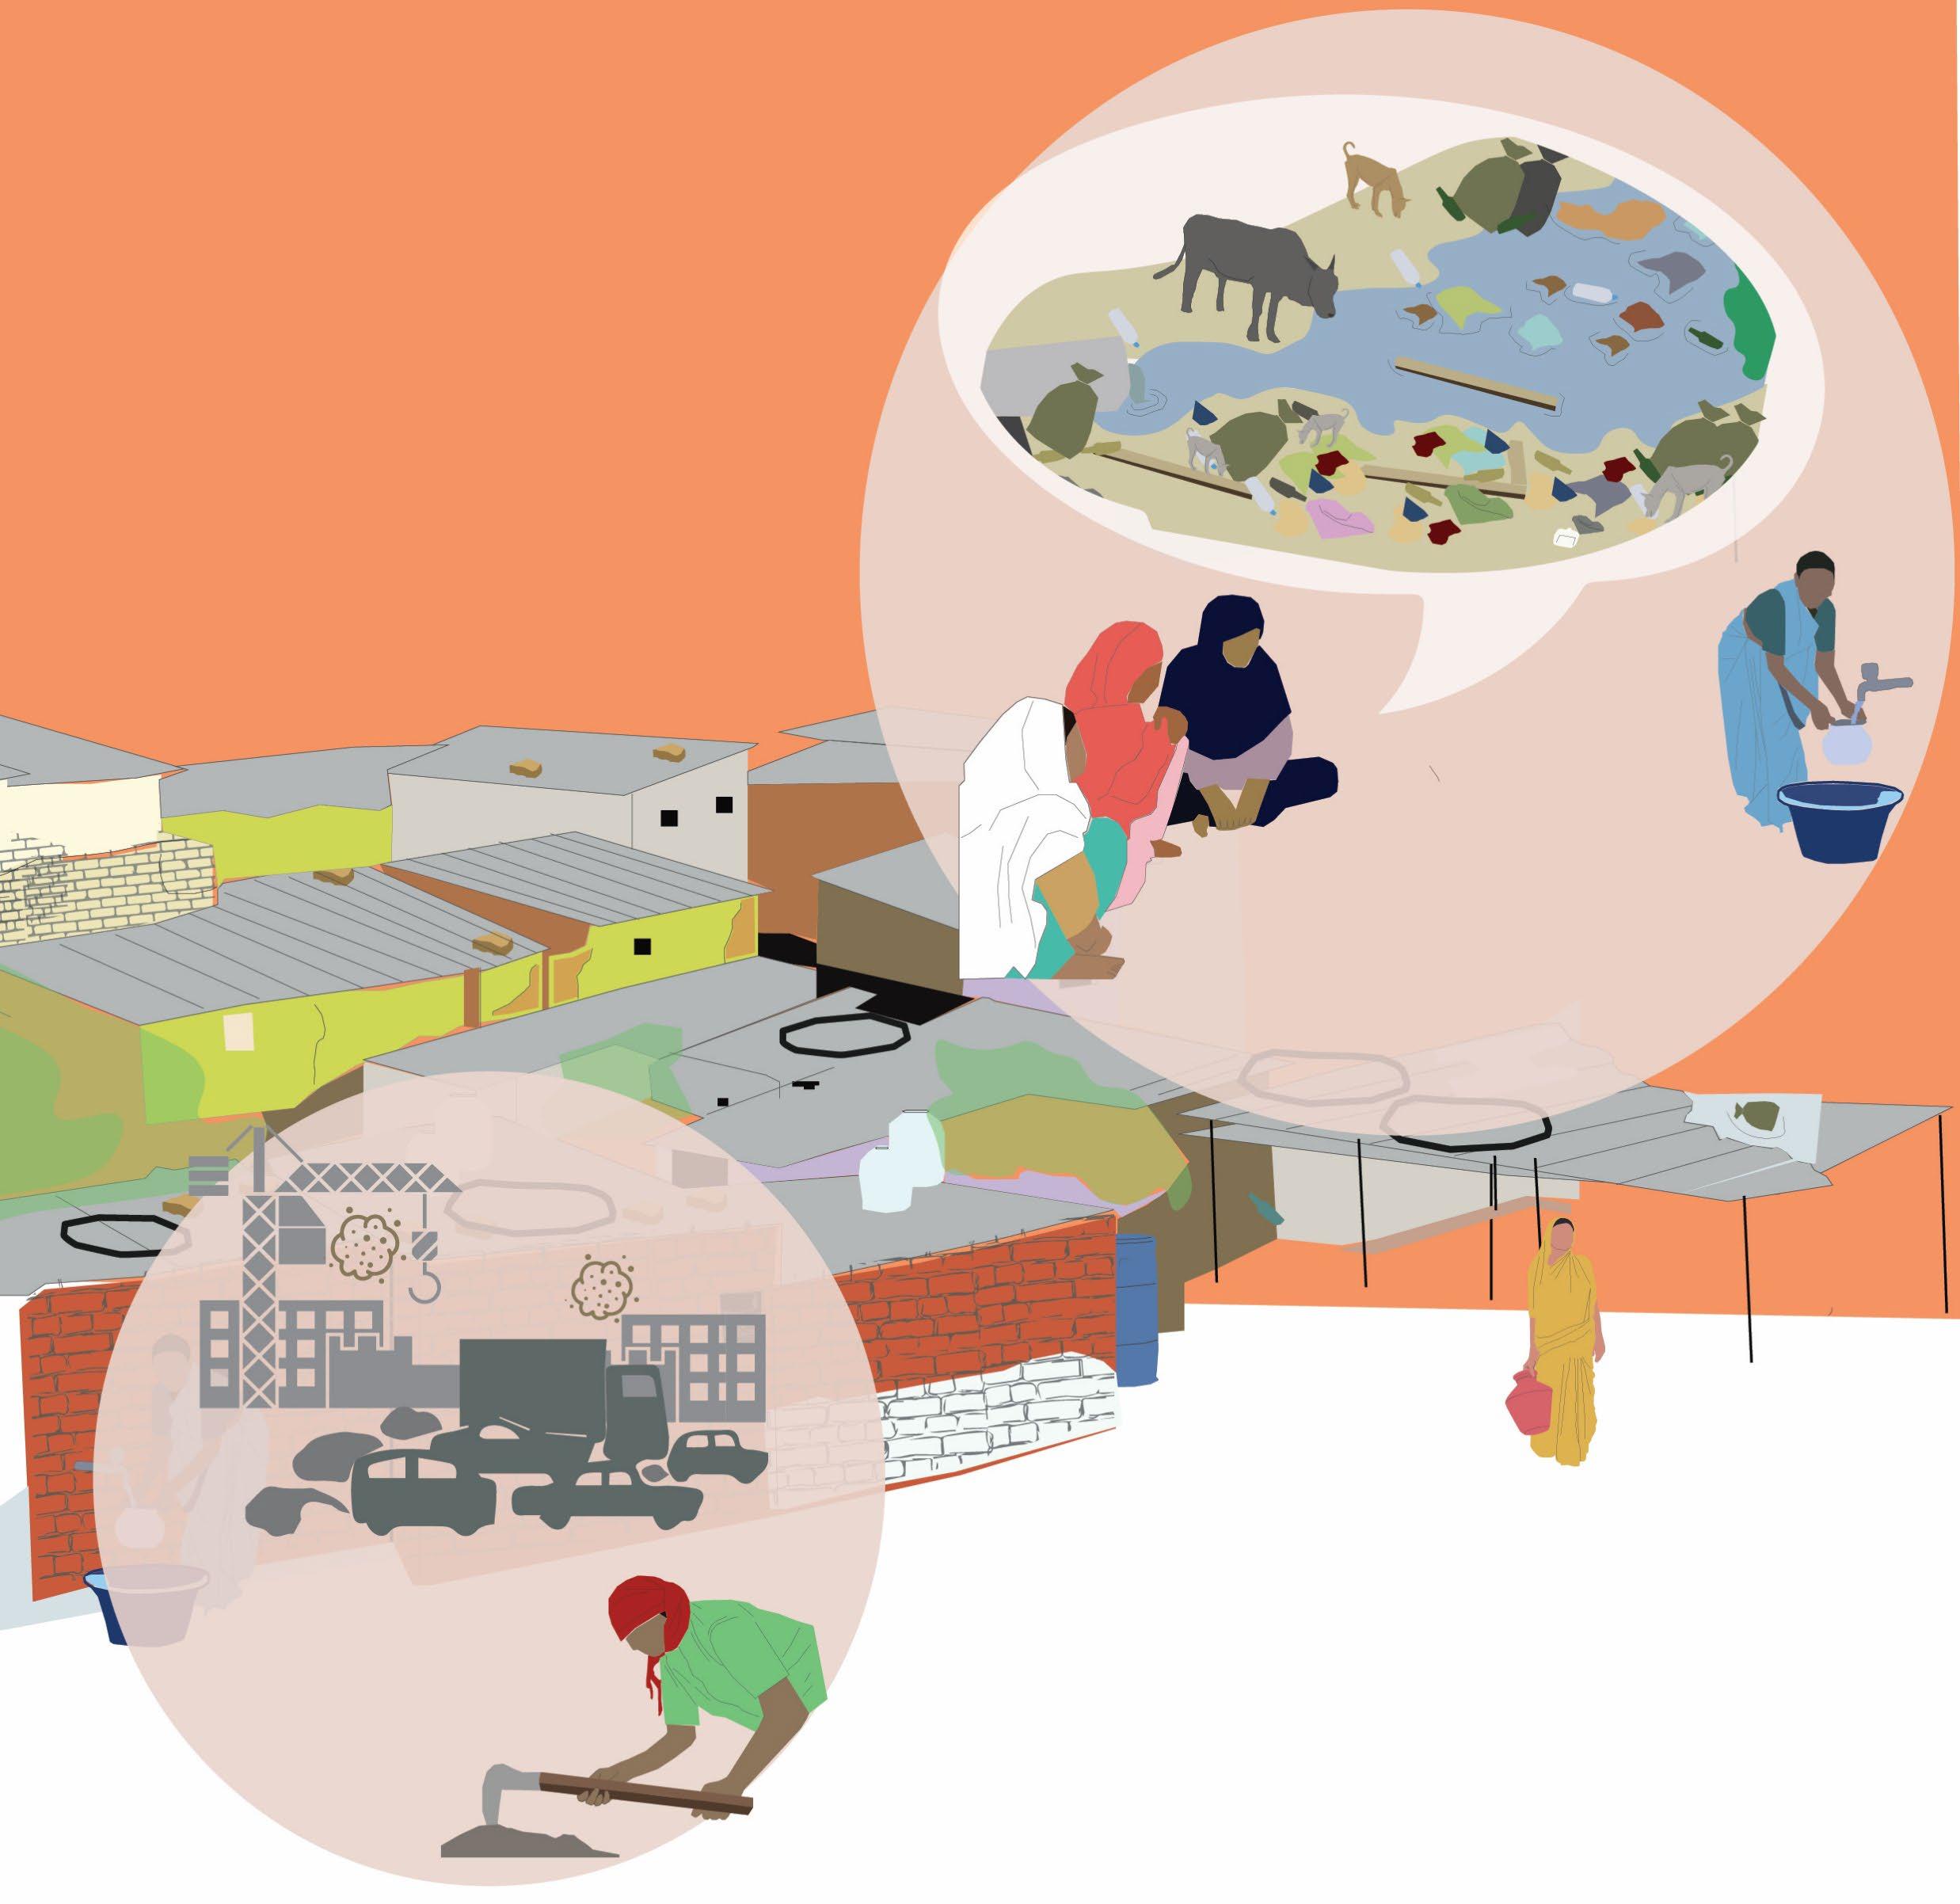
35
Conversations about the City
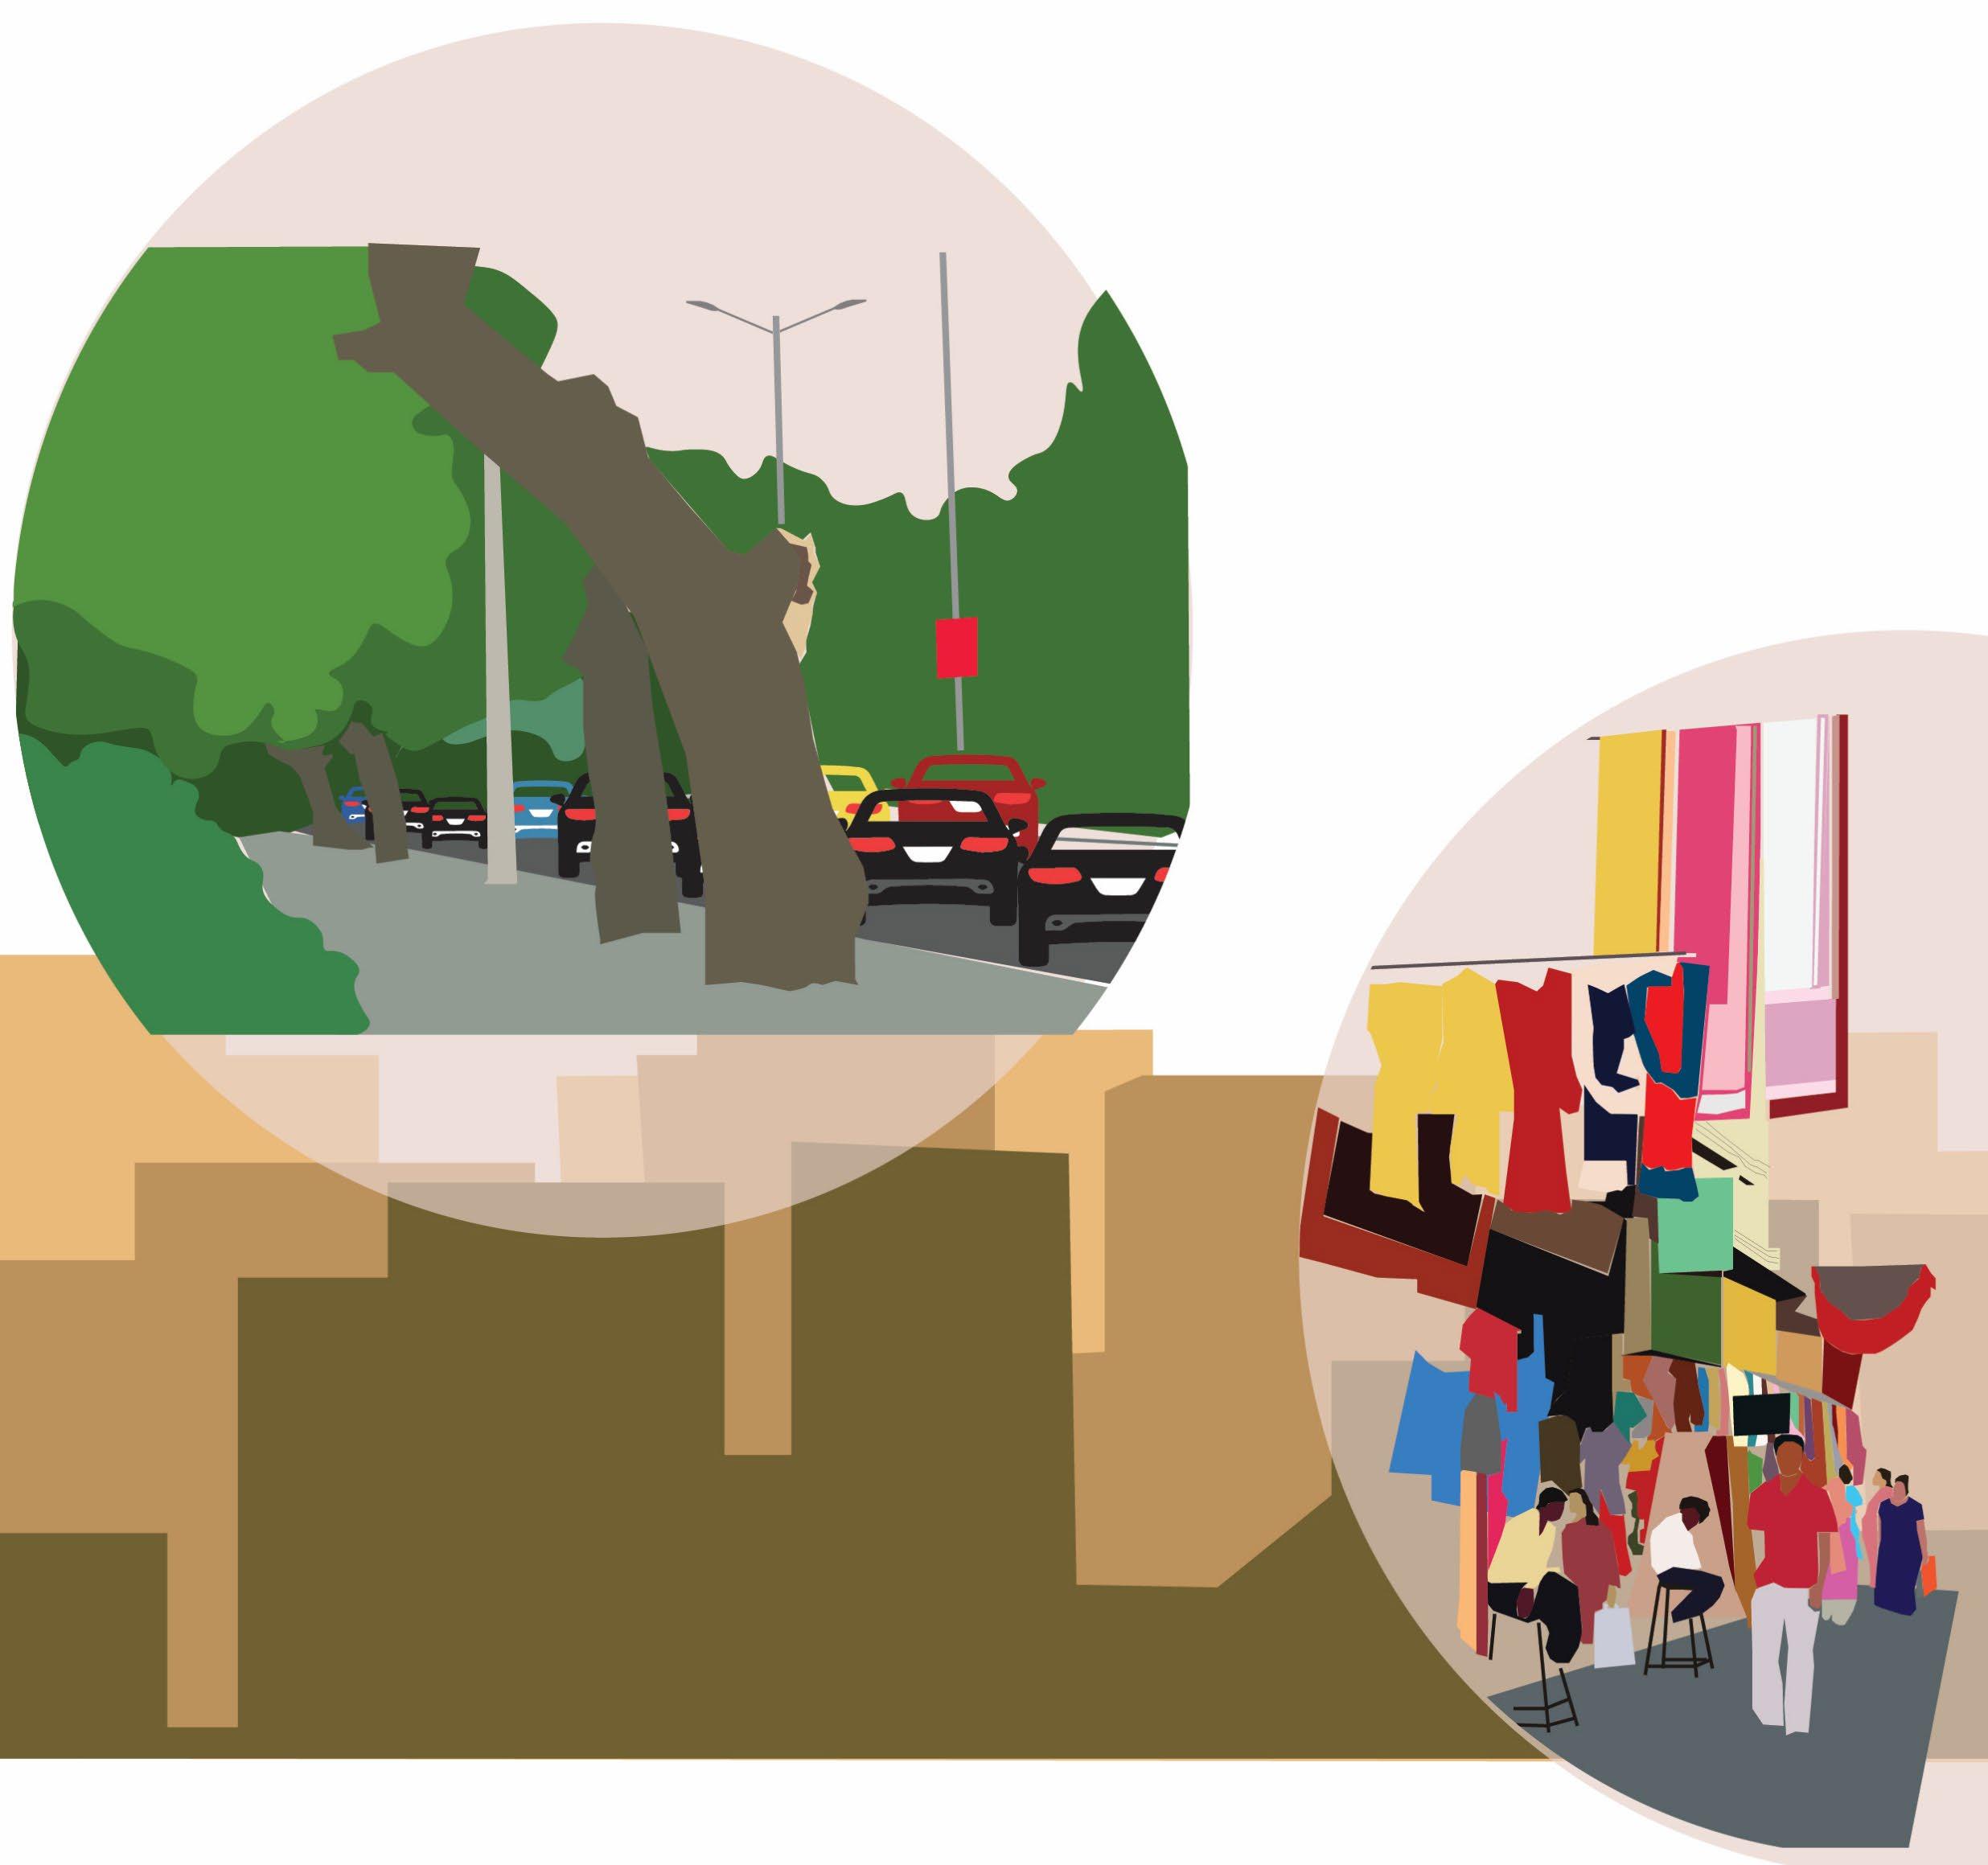
“Yes, it was indeed a pleasant walk to the lake in the older days. Now a four-lane road has come there which provides good connectivity to the new city areas. However, there is so much traffic and pollution in that area now!”
“Now that you mention, yes, there is always a traffic jam on that road. I heard Raju saying that the road widening work will begin soon and he will be going there to work.”
36
“Do you remember the time when we used to walk to the Upper lake through the forest area?”
“It’s Aruja’s daughter’s wedding. We are going to New Market for the wedding shopping”.
“I have heard its quite big and has a variety of things. Your husband works there, right? Can you tell us which area within the market is best for wedding shopping?”
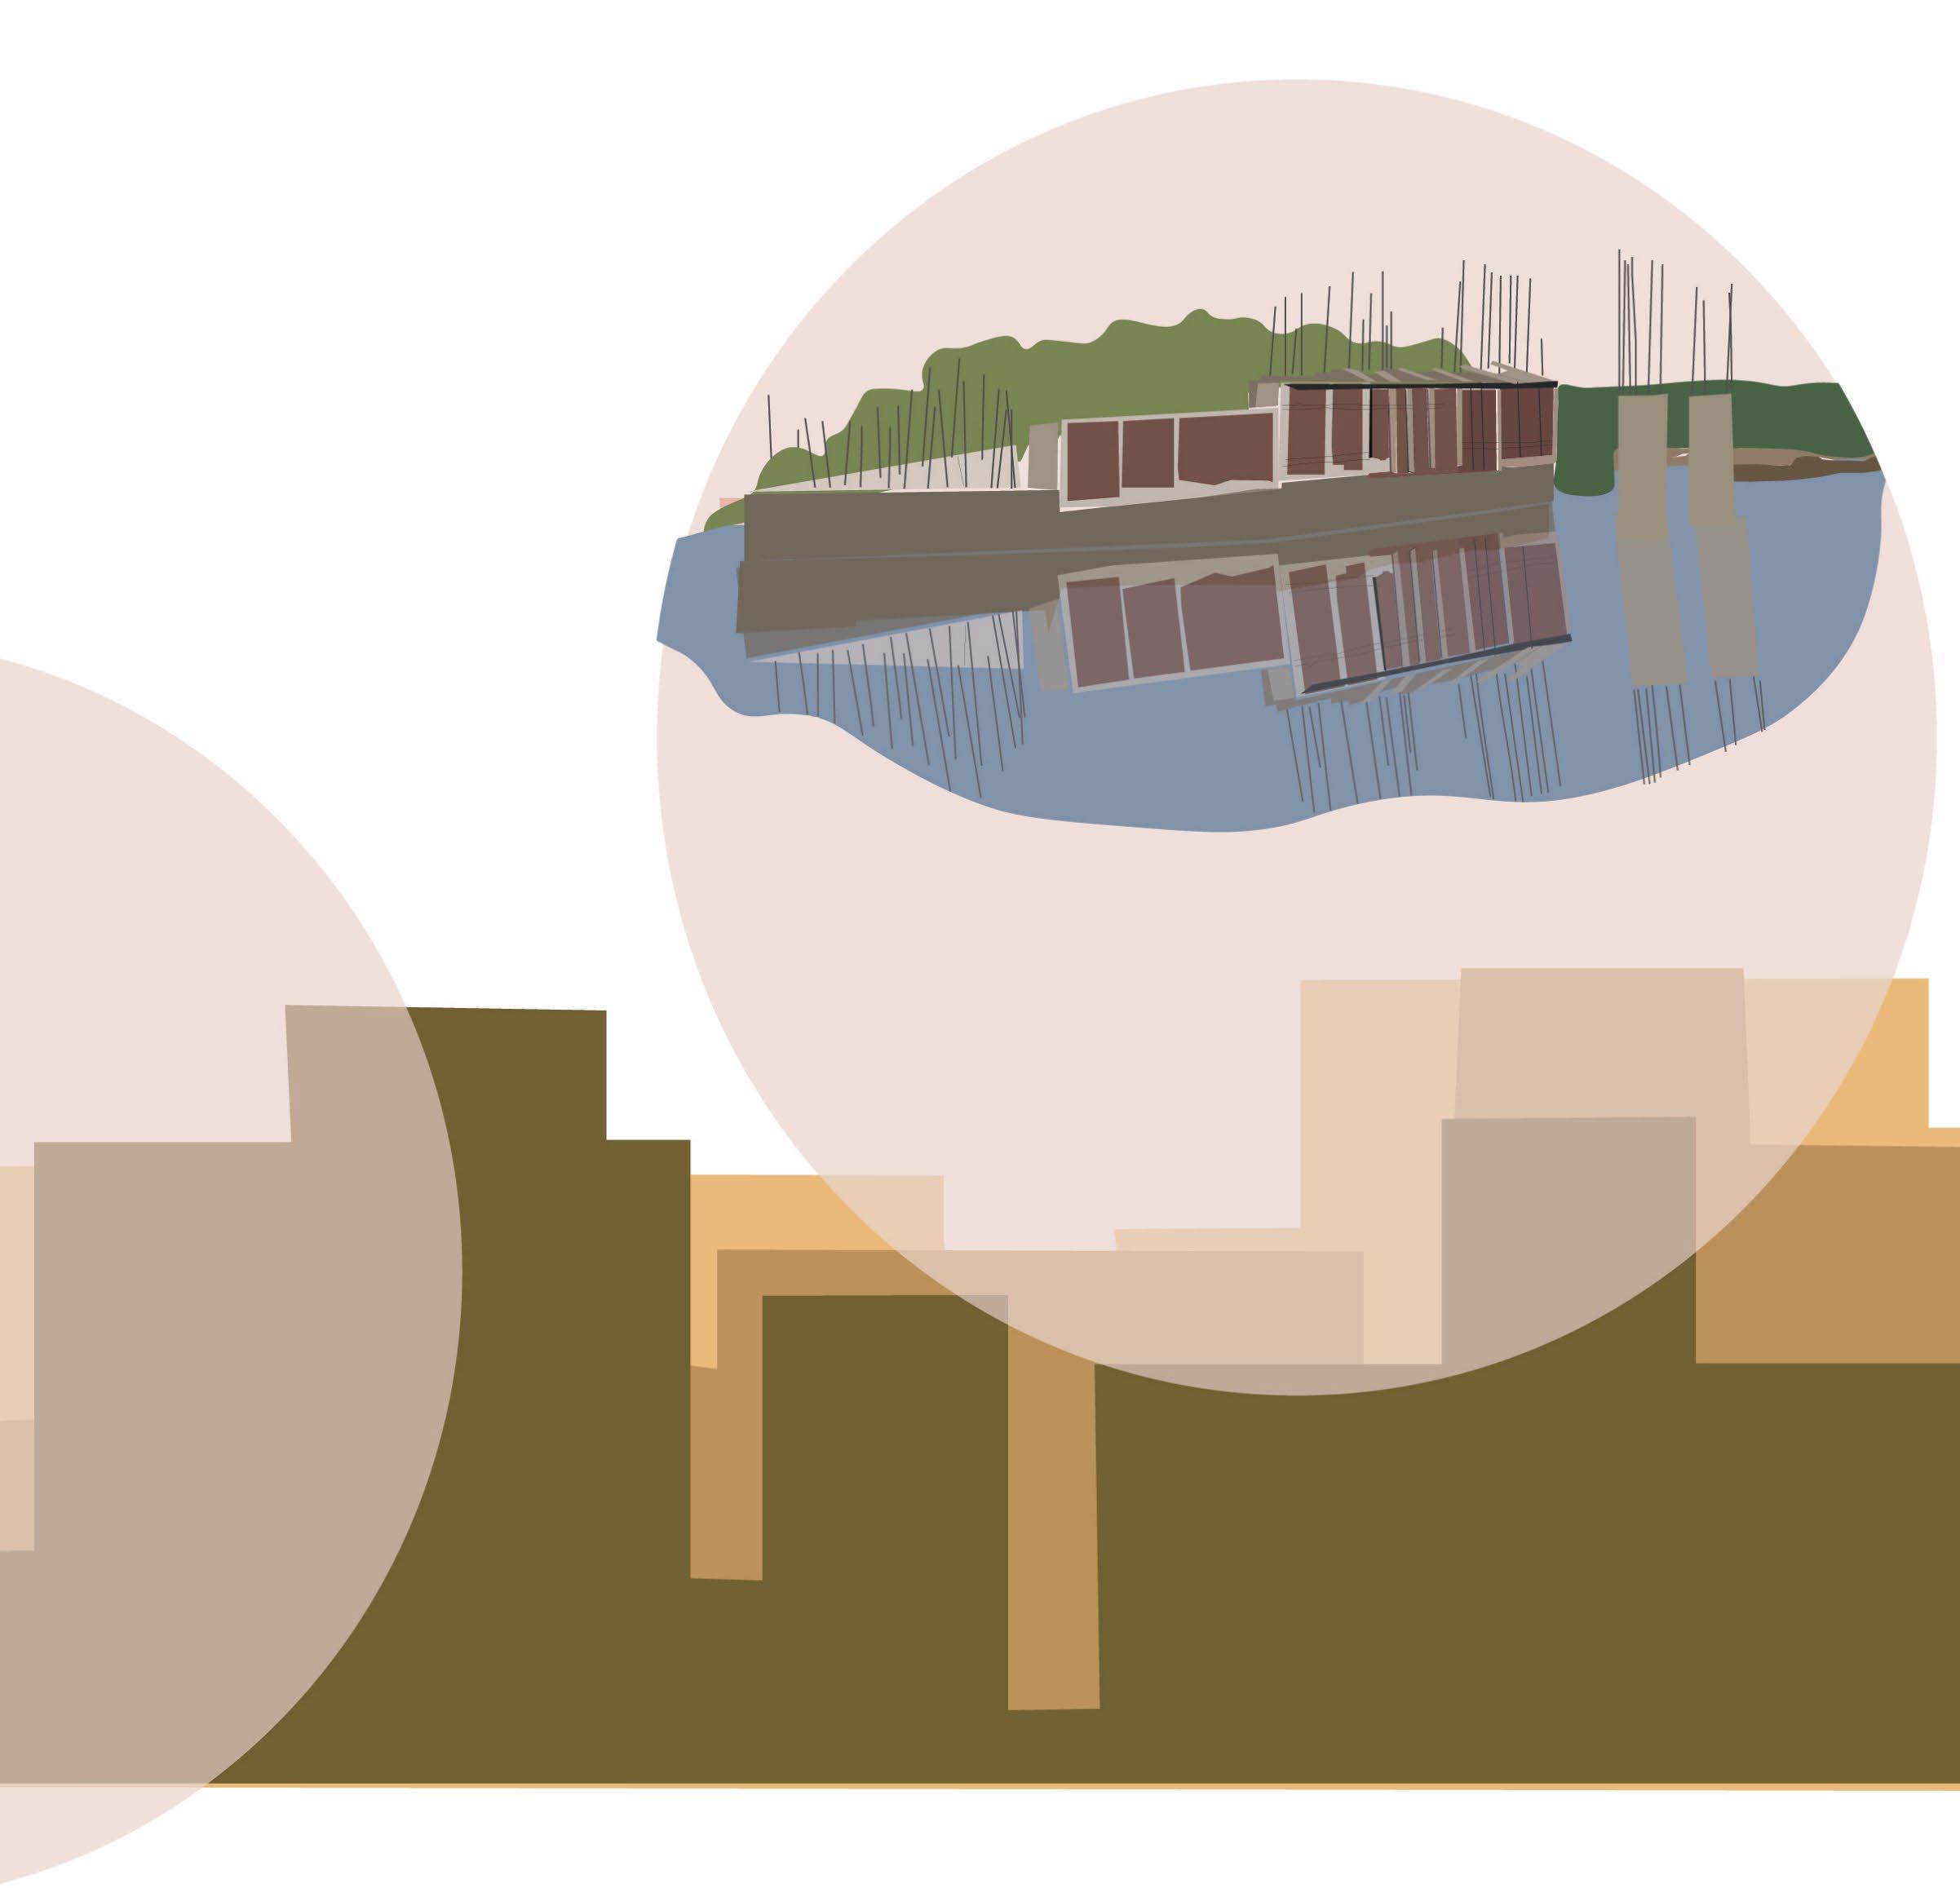
“This lake was earlier used by dhobis to wash clothes. However, I don’t see them here anymore. Now I know why! “ “A government residential complex is coming up very close to the lake. I heard Ram saying that he is getting a house there. ”
“The construction of the residential complex has already begun. I met Raja (Dhobi) a few months ago and he was telling me that the water quality in the lake was worsening. They were planning to move to Someshwar lake in the city for their work.”
“My husband has a pushcart to sell small household items in the New Market. He and some of his acquaintances are sometimes asked to move away from the main road and foot path to free up space.”
“Yes, I did hear about that! A lot of people selling small items have been shifted from the main road to a government space near by. But there is not enough space to accommodate everyone there. Many of them are going for construction work now to make a living.” “There is a new vegetable market also near the new government space. Seema’s husband was hired by the market association recently to clean the vegetable market area.”
“Isn’t that lake far away from their locality? “
“Their group (Dhobis) have decided to go there early morning to avoid traffic in that area.”
37
Story of a household at Shanti Nagar
Regular day for the family
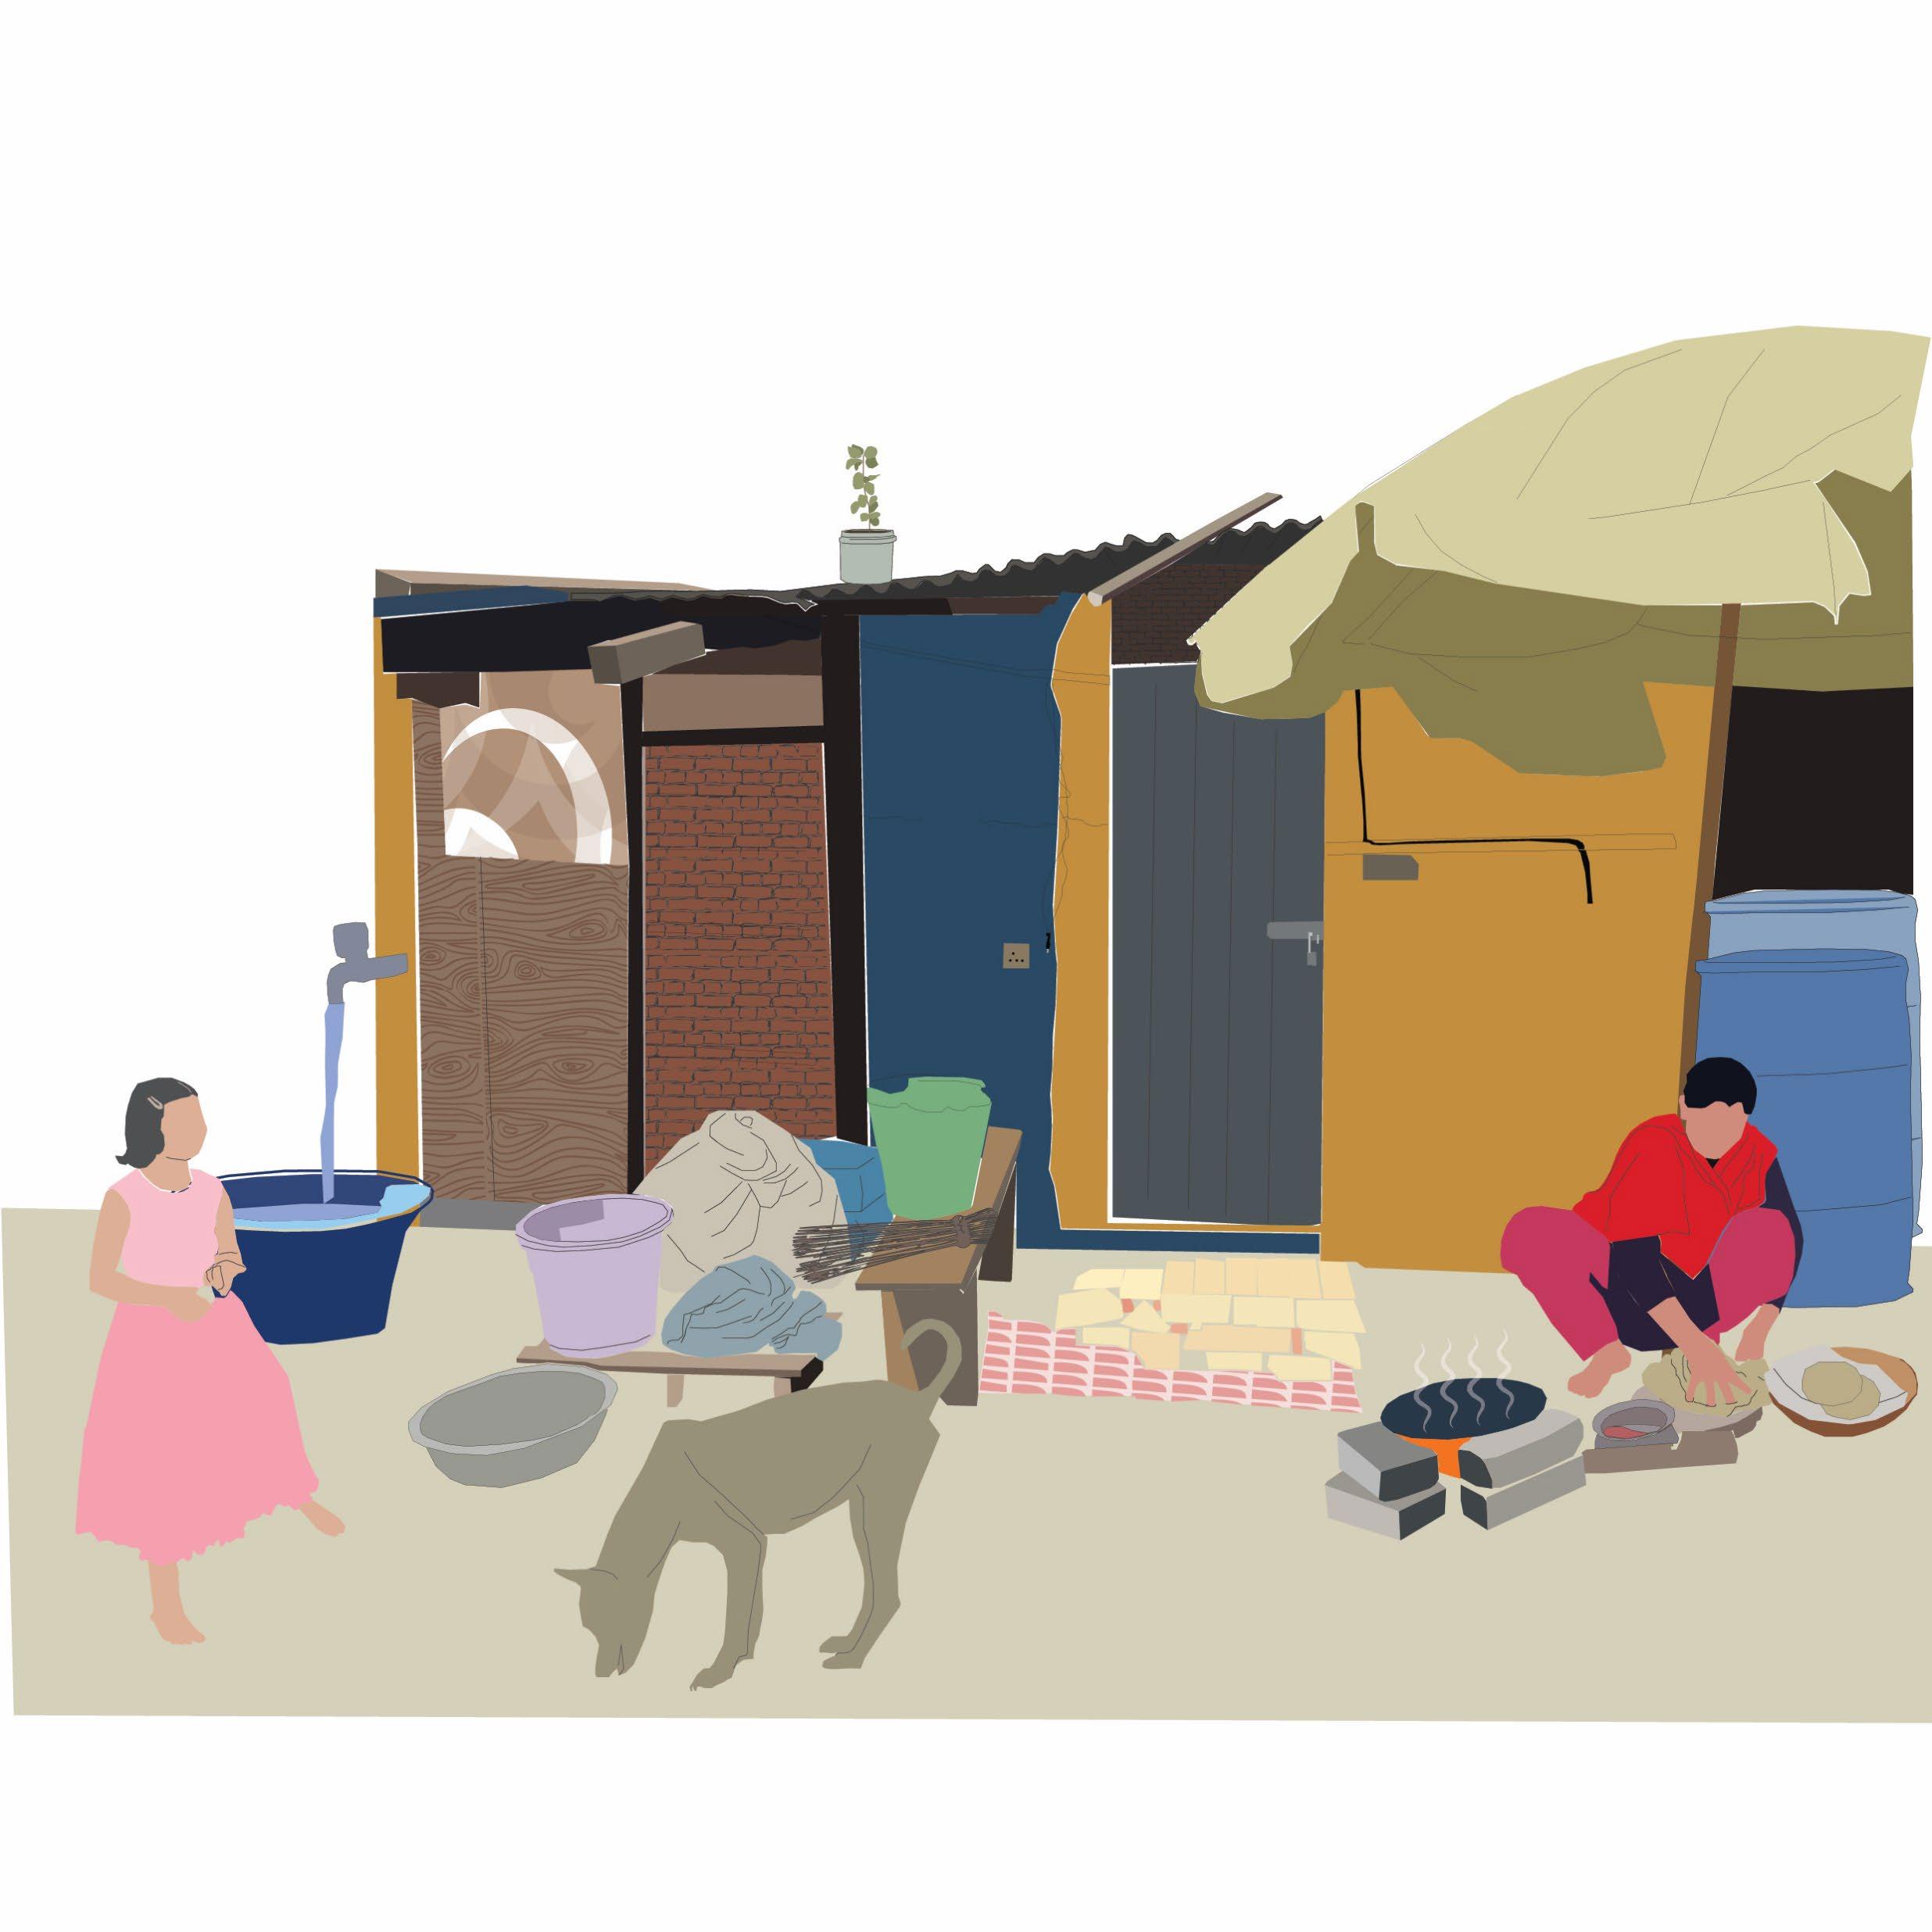
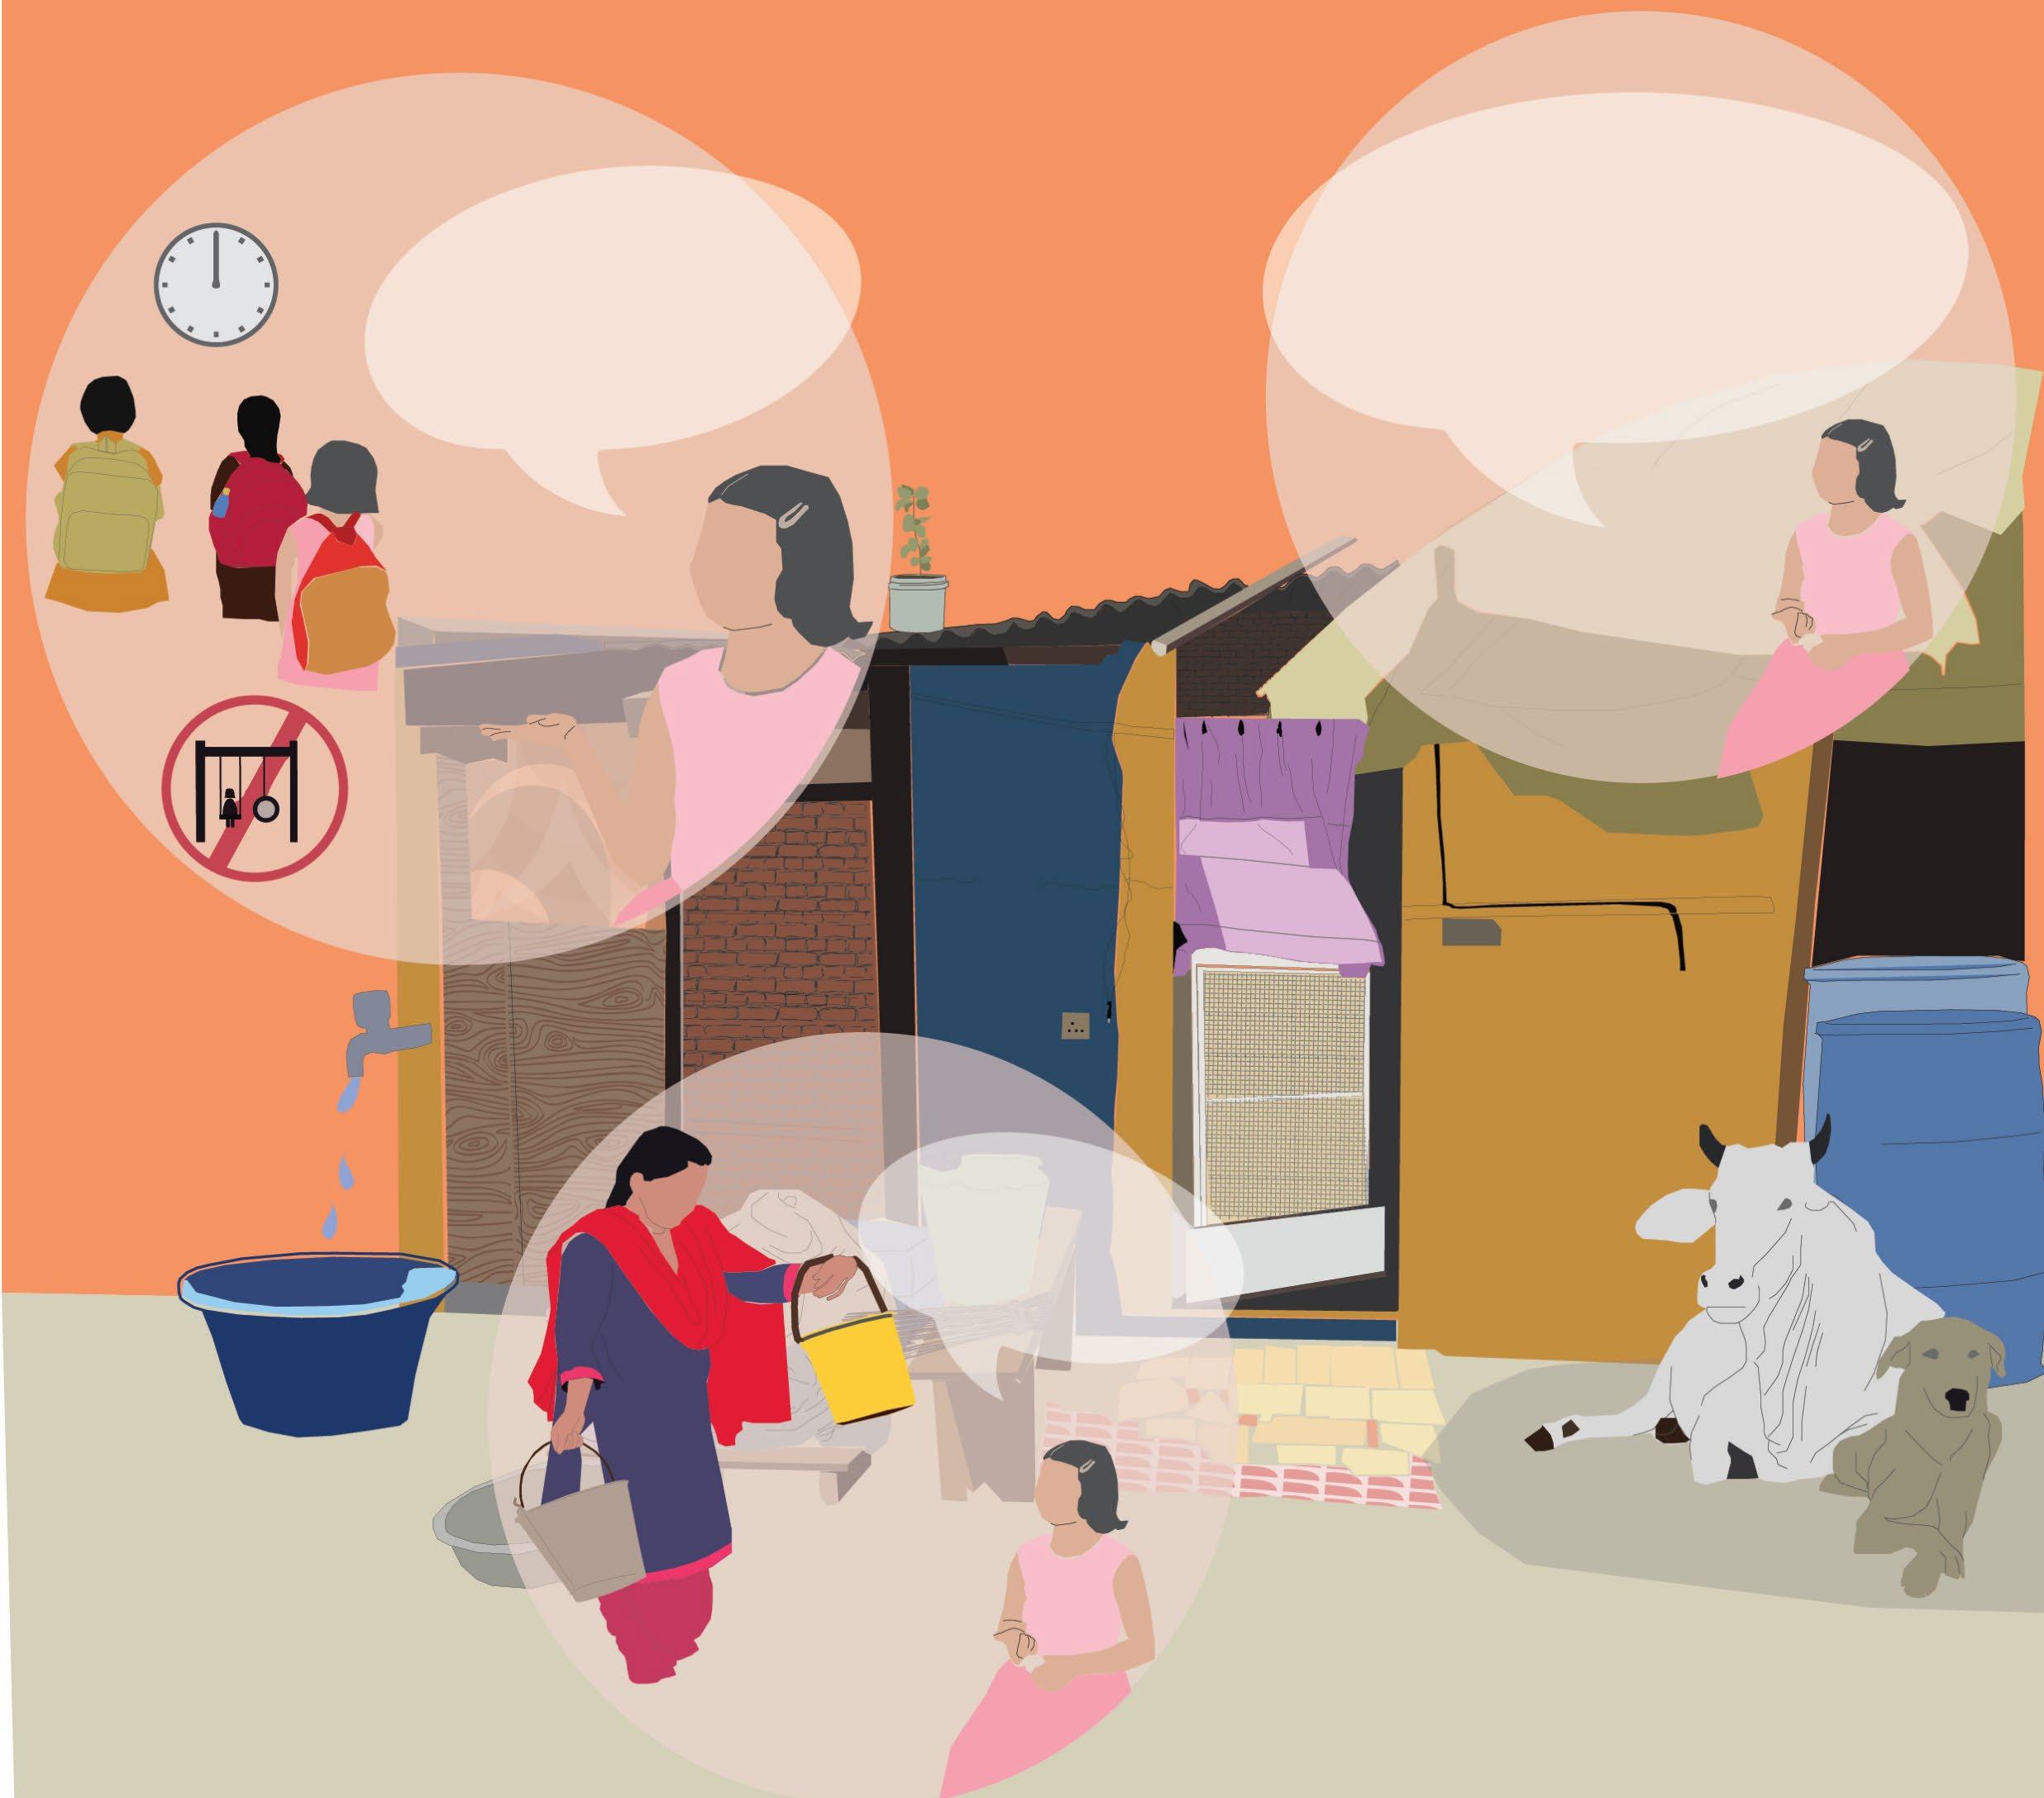
“I’m Rani and this is my home in Shanti Nagar. I have a small family and a lot of friends who stay here. My school is only 2 km away from my home, so I walk to school. Today is a holiday but I’m already ready at 7 a.m. as my mother tells me to take bath when the water comes from the community tap near our house. My mother and father go to work by 10 a.m. You can see my mother making rotis for our lunch. ”
“I’m Rani’s mother. I have already finished cleaning our house and will soon leave for domestic work in the neighbouring residential society. I’m cooking food for my husband who will also leave for his work in some time. We will be back home only late in the evening. Rani’s grandmother will look after her during the day.”
38
“Rani is my daughter and I do my best to provide for my family. Currently, I’m doing some labour work at the nearby construction site. I’m usually at the site from early mornings to late evenings. Sometimes I do other small works as and when opportunities come. But otherwise, I don’t have regular work. We won’t be able to make ends meet unless my wife and I work tirelessly everyday.
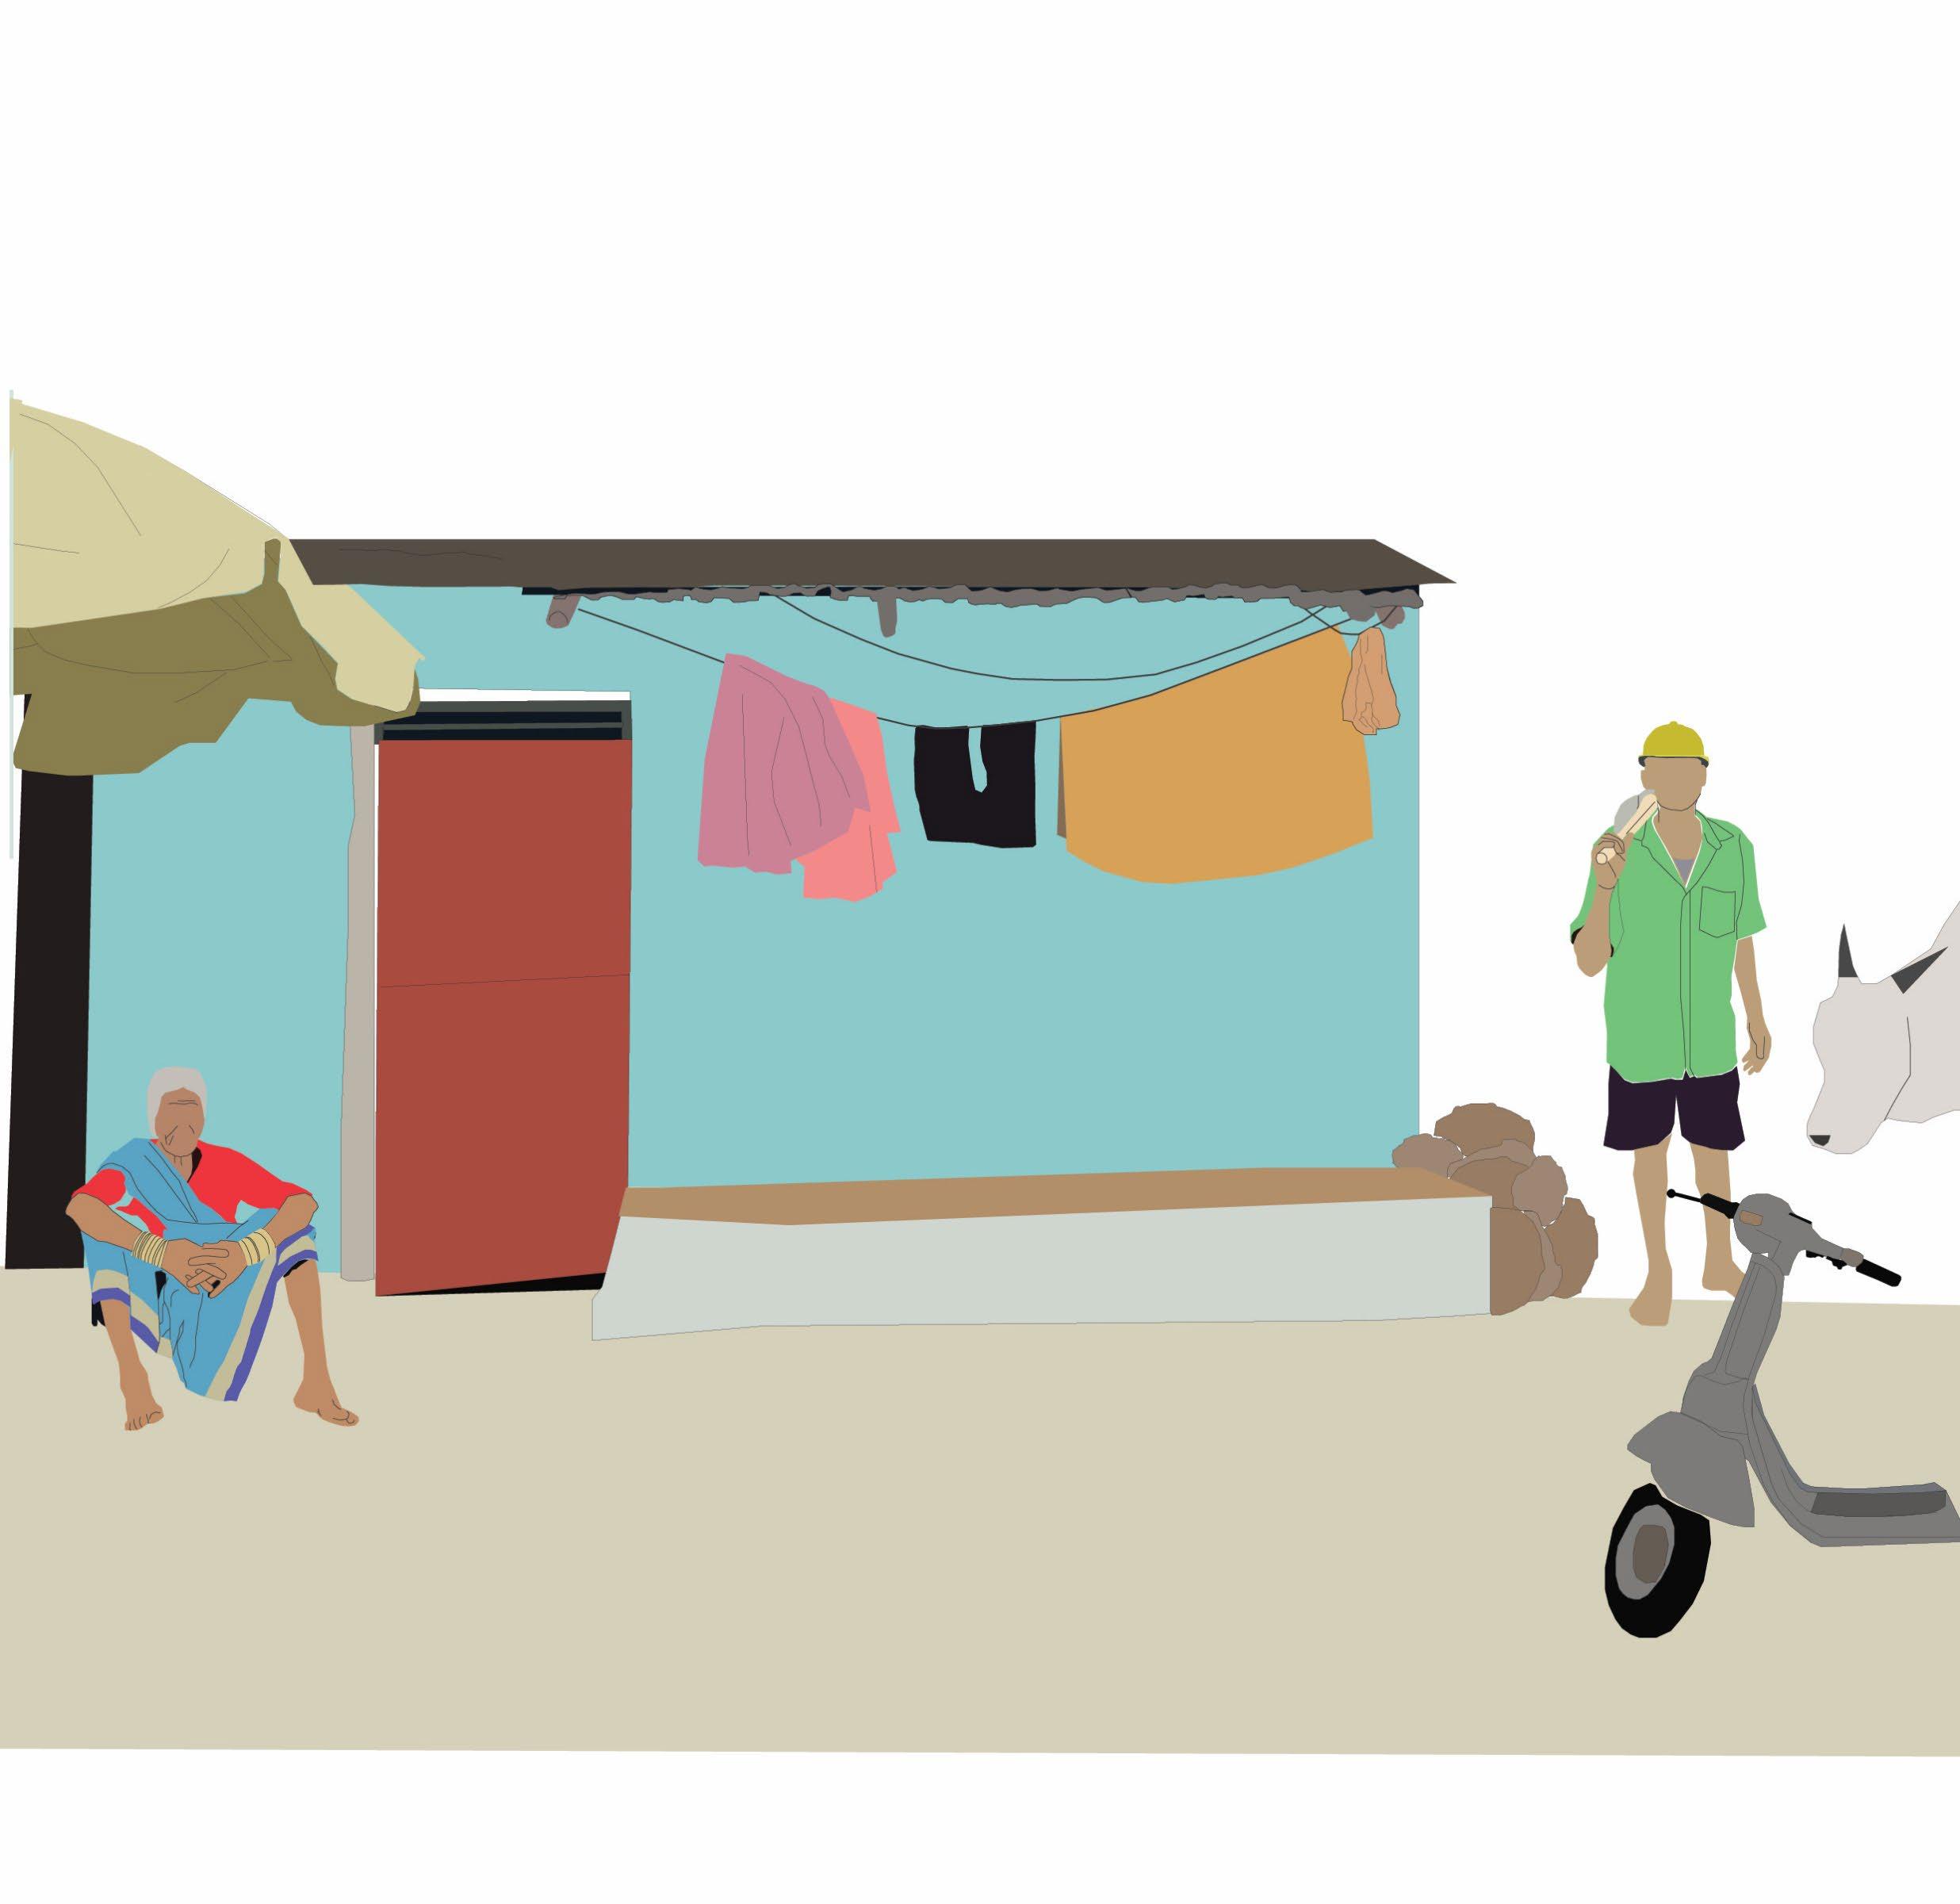
“I’m Rani’s grandmother. I stay here with my elder son, his wife, and Rani. I have been staying in this house since I got married and came from the neighbouring village. My in-laws moved to this locality after they got married. This house is all we have now, there is nothing for us back in our village. We travel to the village only during festivals. My younger son stays in another city. He travelled there for work.”
39
Story of a household at Shanti Nagar
During heatwave
“We have started using the cooler for the past one week, but today we have had it on since morning which is usually not the case.
Our dog Raja is staying with us the whole day, usually, he only comes home during lunch and dinner time.”
40
“It’s so hot today! My friends and I came back home early from school, but my mother says we can’t go out to play.”
“Today, my mother today got up early to get water from the tanker. There is no water coming from the tap.”
“Father has been coming back home early these days. He says he is very tired to play with me. ”
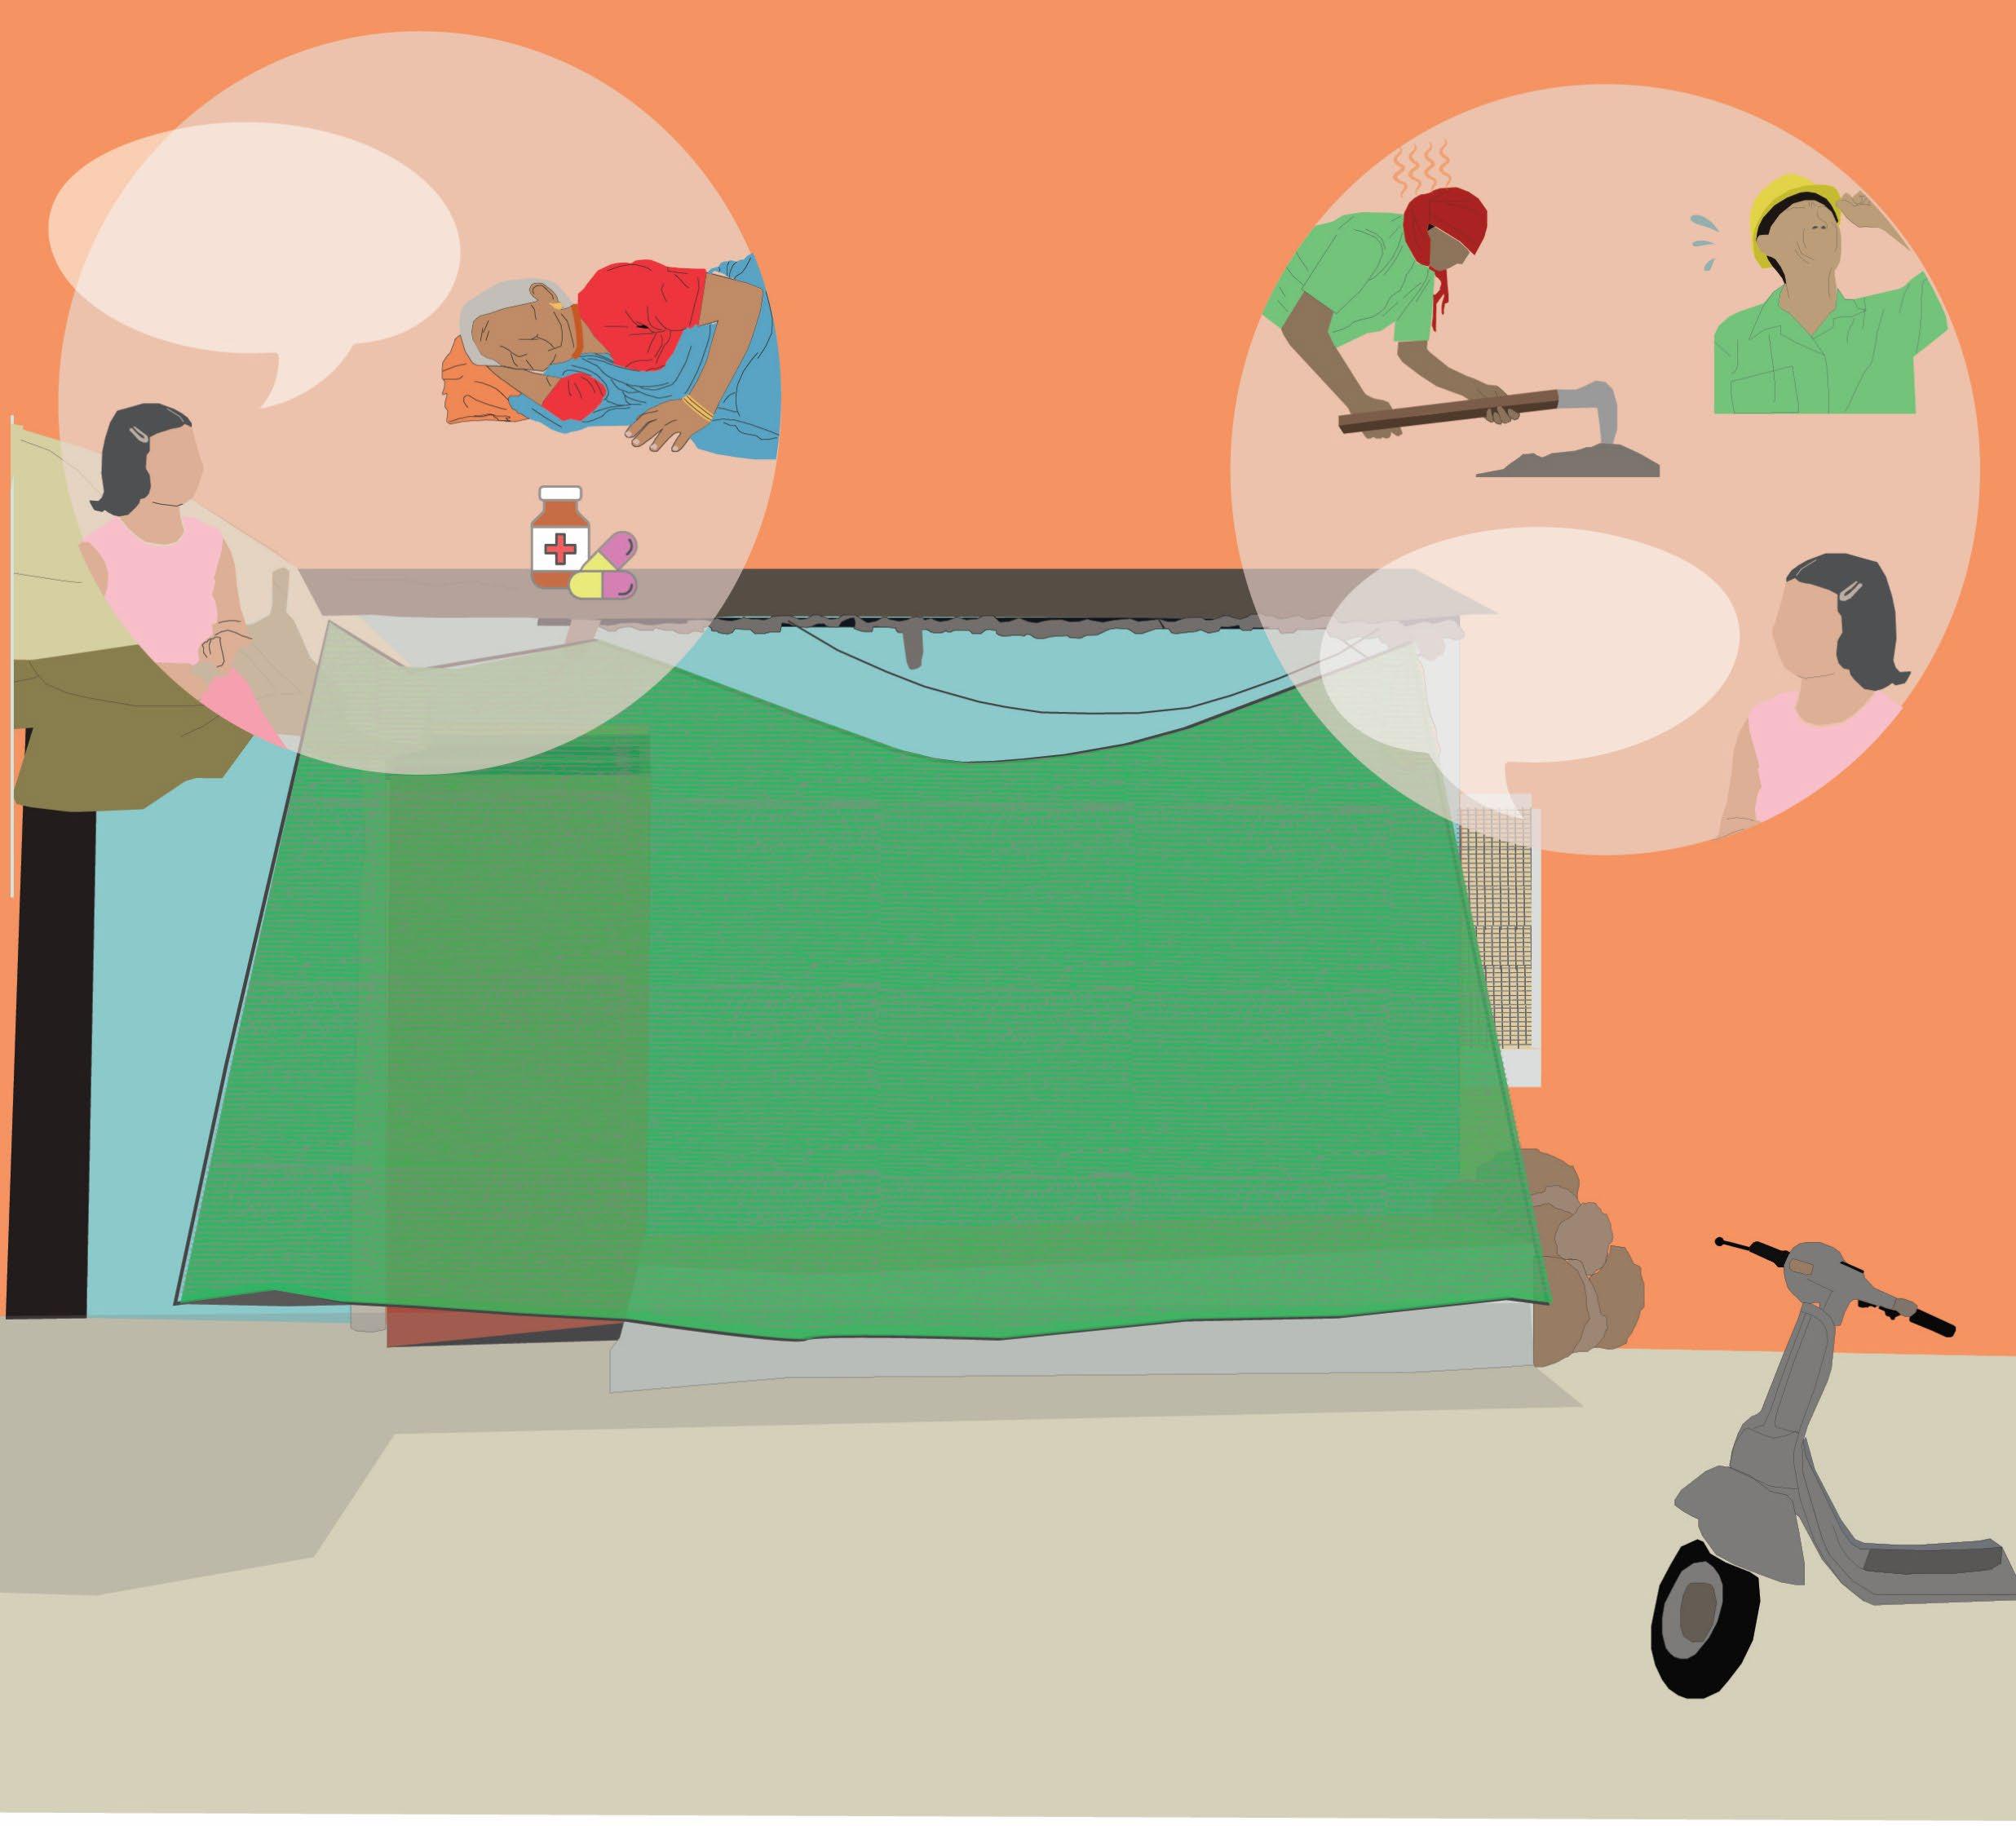
“Grandmother has been sleeping since I reached home from school. She took some medicine before resting.”
41
“It’s so hot today! I feel tired and dizzy even after taking my medicines and drinking water.”
What can we do as a community?

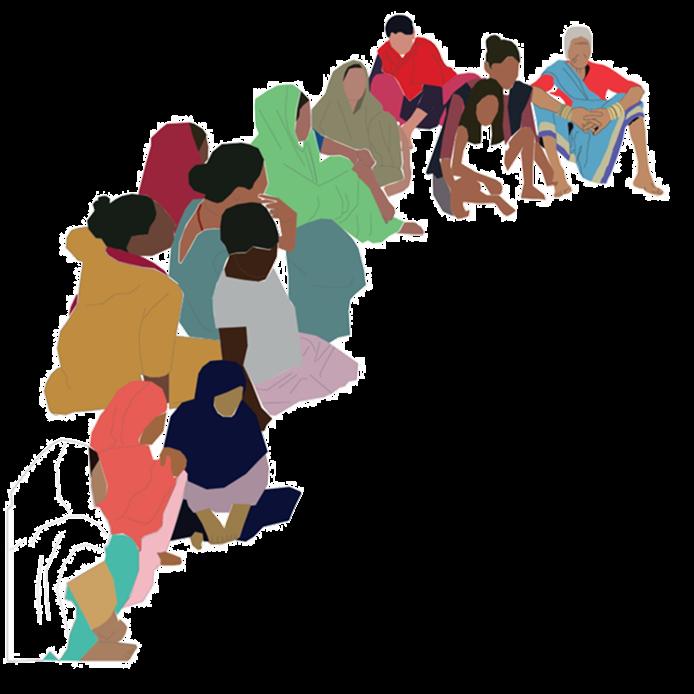
Steps proposed by the Community
Issue
!
So many trees in the settlement have been cut over the last few years. It used to be so much cooler when there were more trees and plants.
Solution
Plant more trees in the settlement and have a community garden.

!
The nallah is polluted with garbage and sewage. The water cannot be used even for washing clothes or bathing now.
Issue
Clean the nallah collectively. Request the municipality for regular solid waste management.
Solution
Solution Issue
!
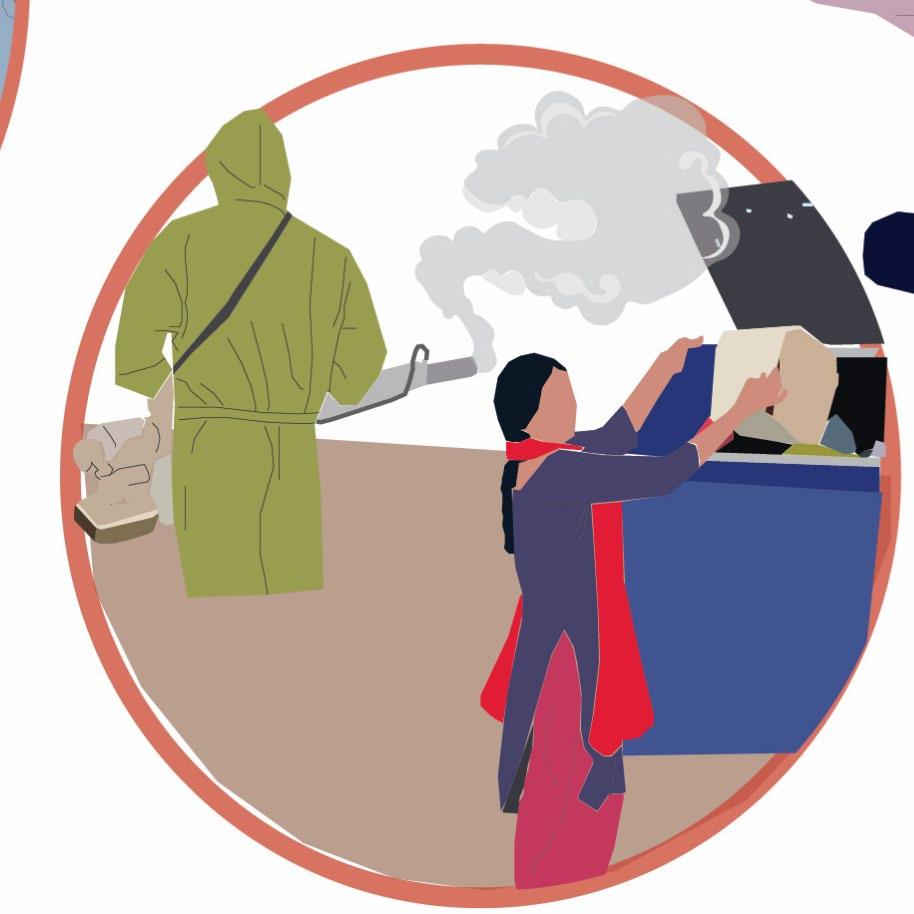
Garbage dumping has led to an increase in mosquitoes and associated diseases in the settlement.
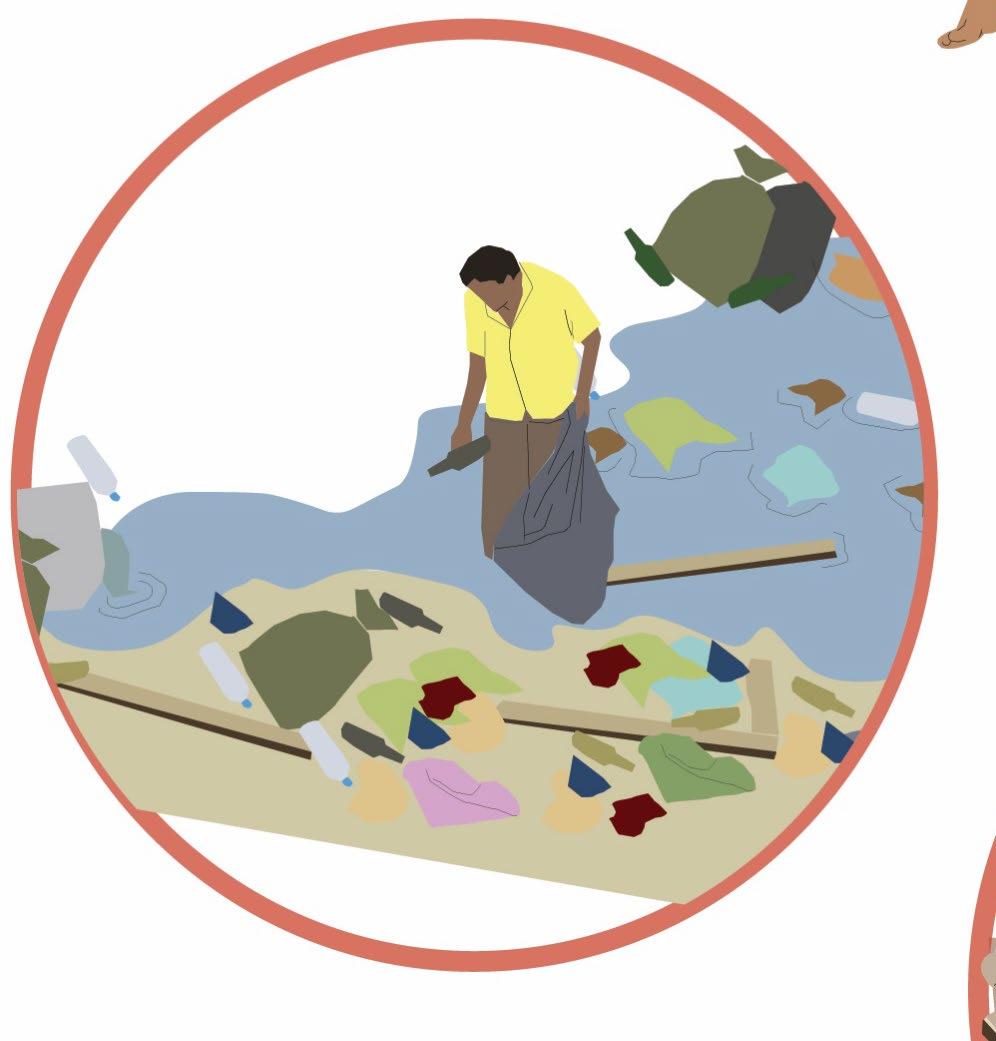
Segregate the domestic waste in the garbage bins and request regular fumigation by the municipality.
43
Risks associated with a typical inner street
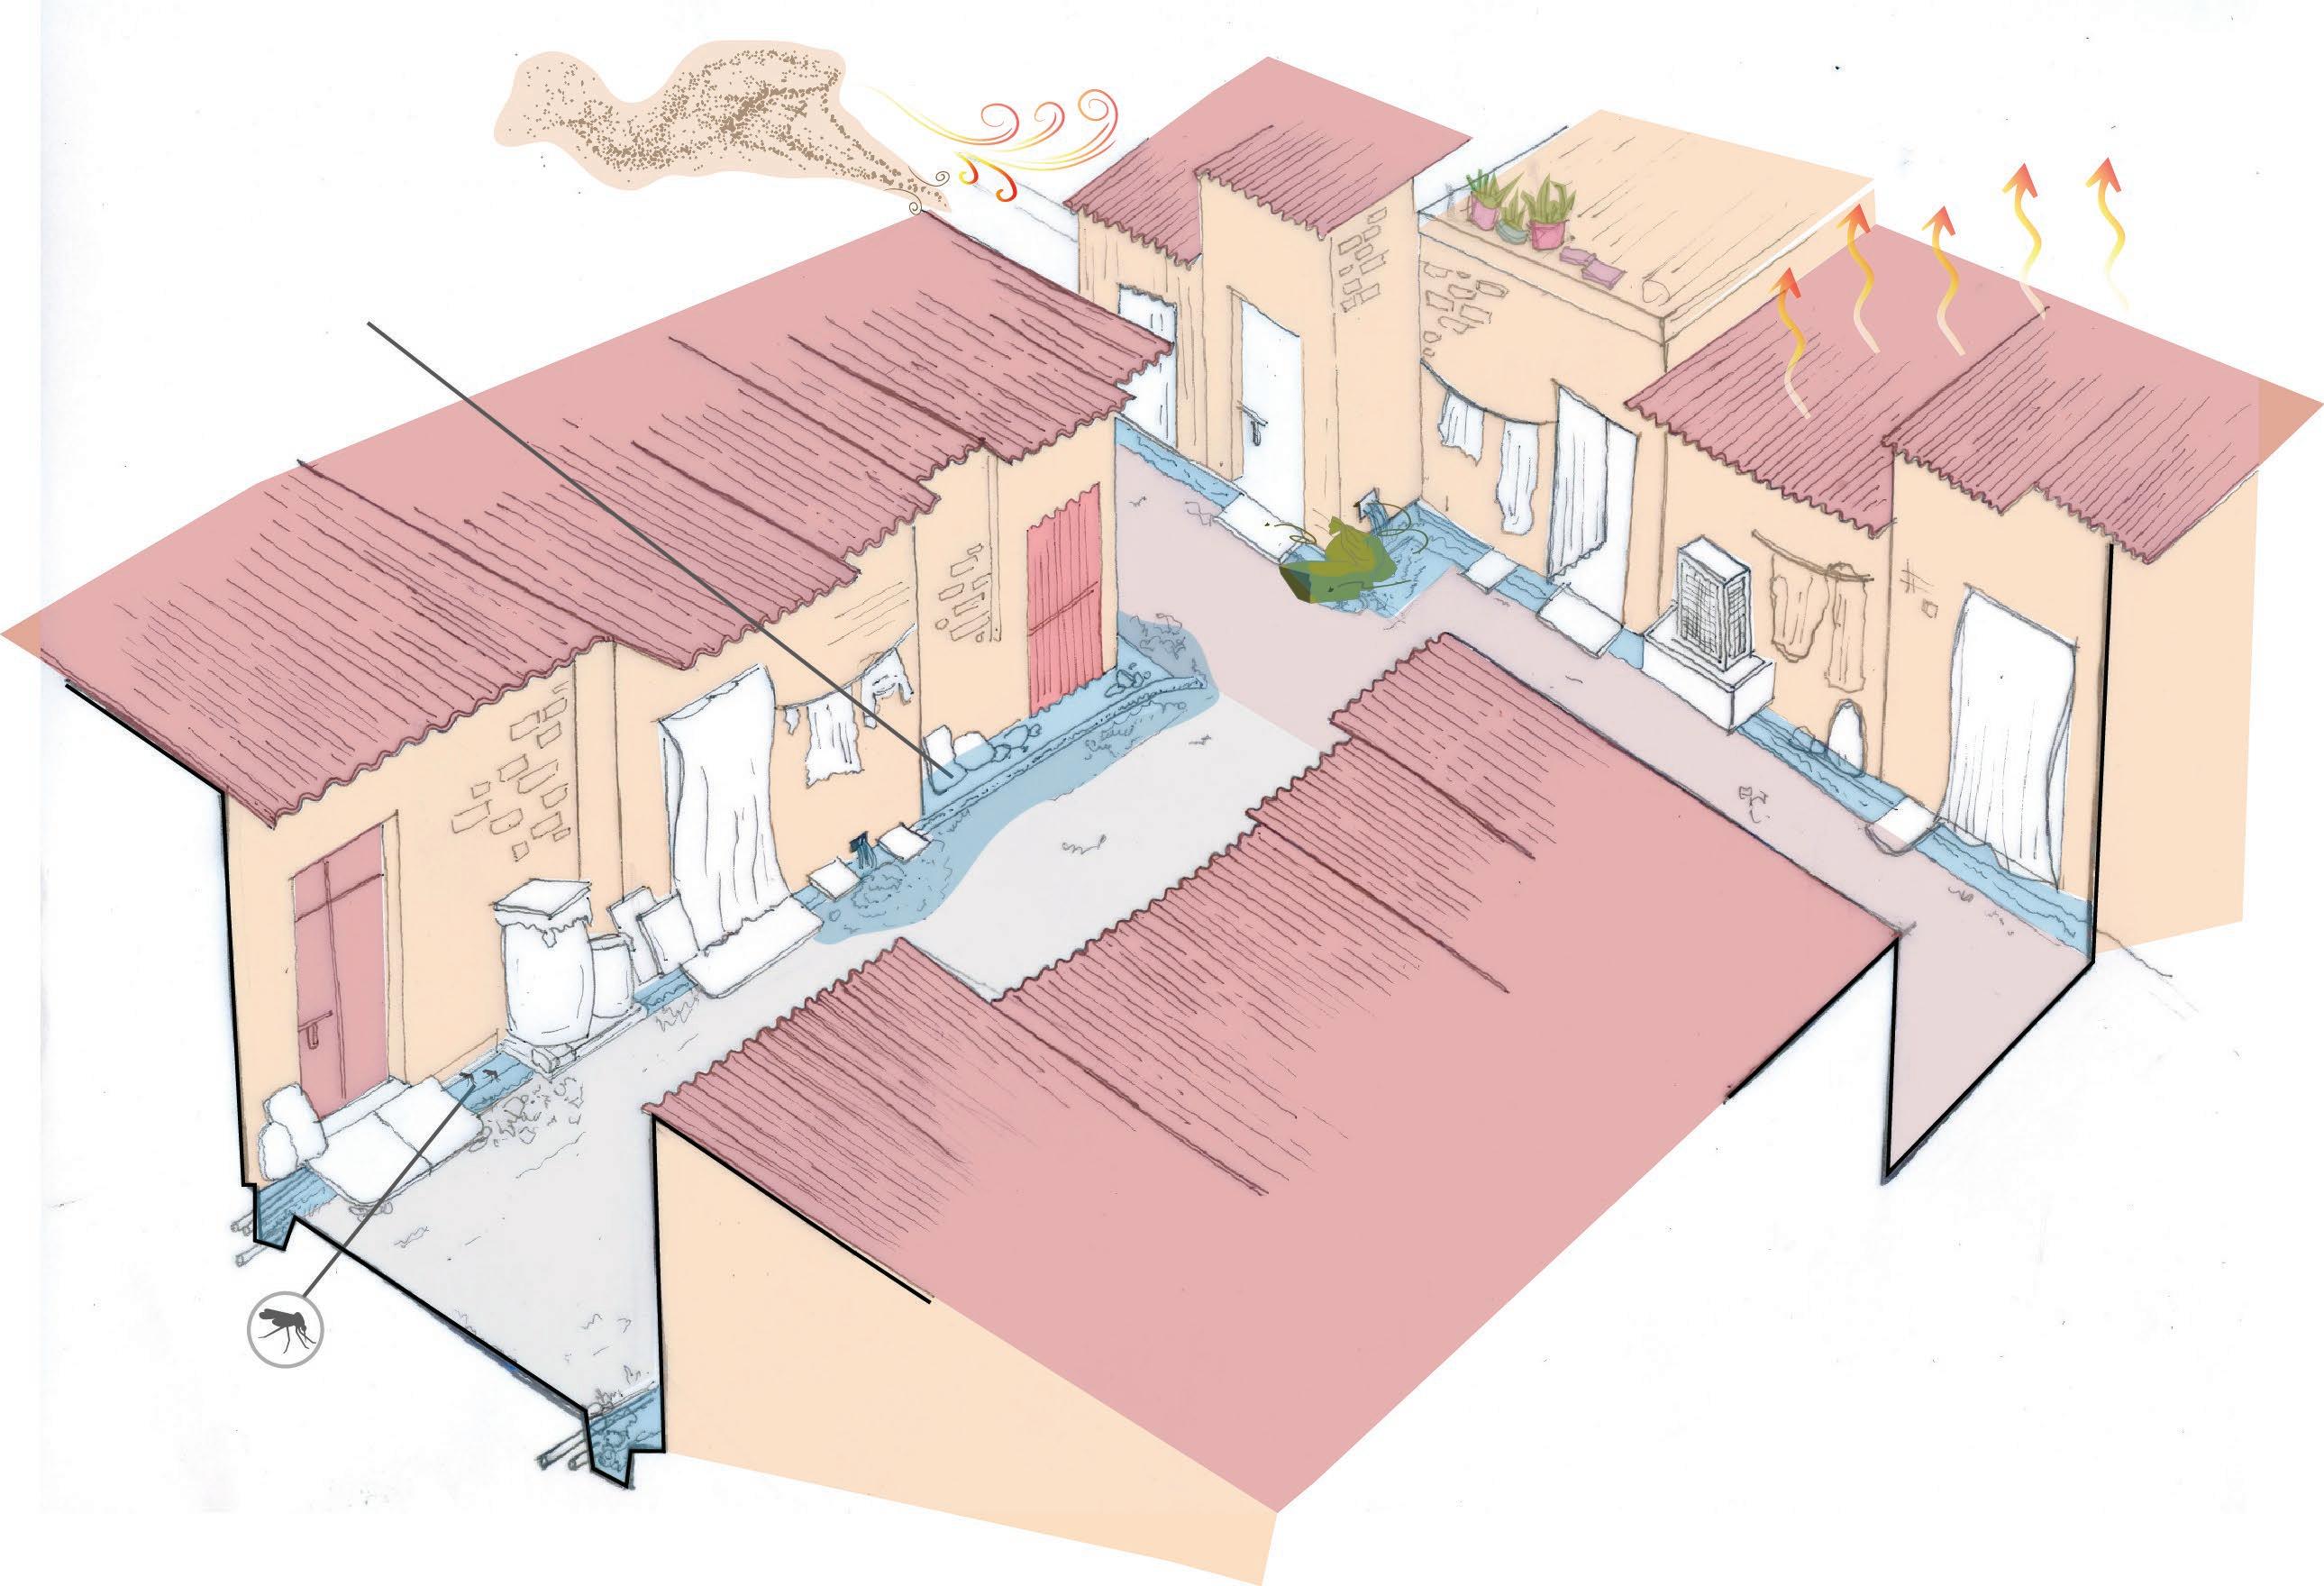
Backflow from open drains
Open drains prone to Mosquito Breeding
Hot & Dusty Loo
Heat Radiation
44
Proposed solutions for the inner street
Solution for Loo and Heat Radiation ~Shading the inner lanes of the settlement with Trellis
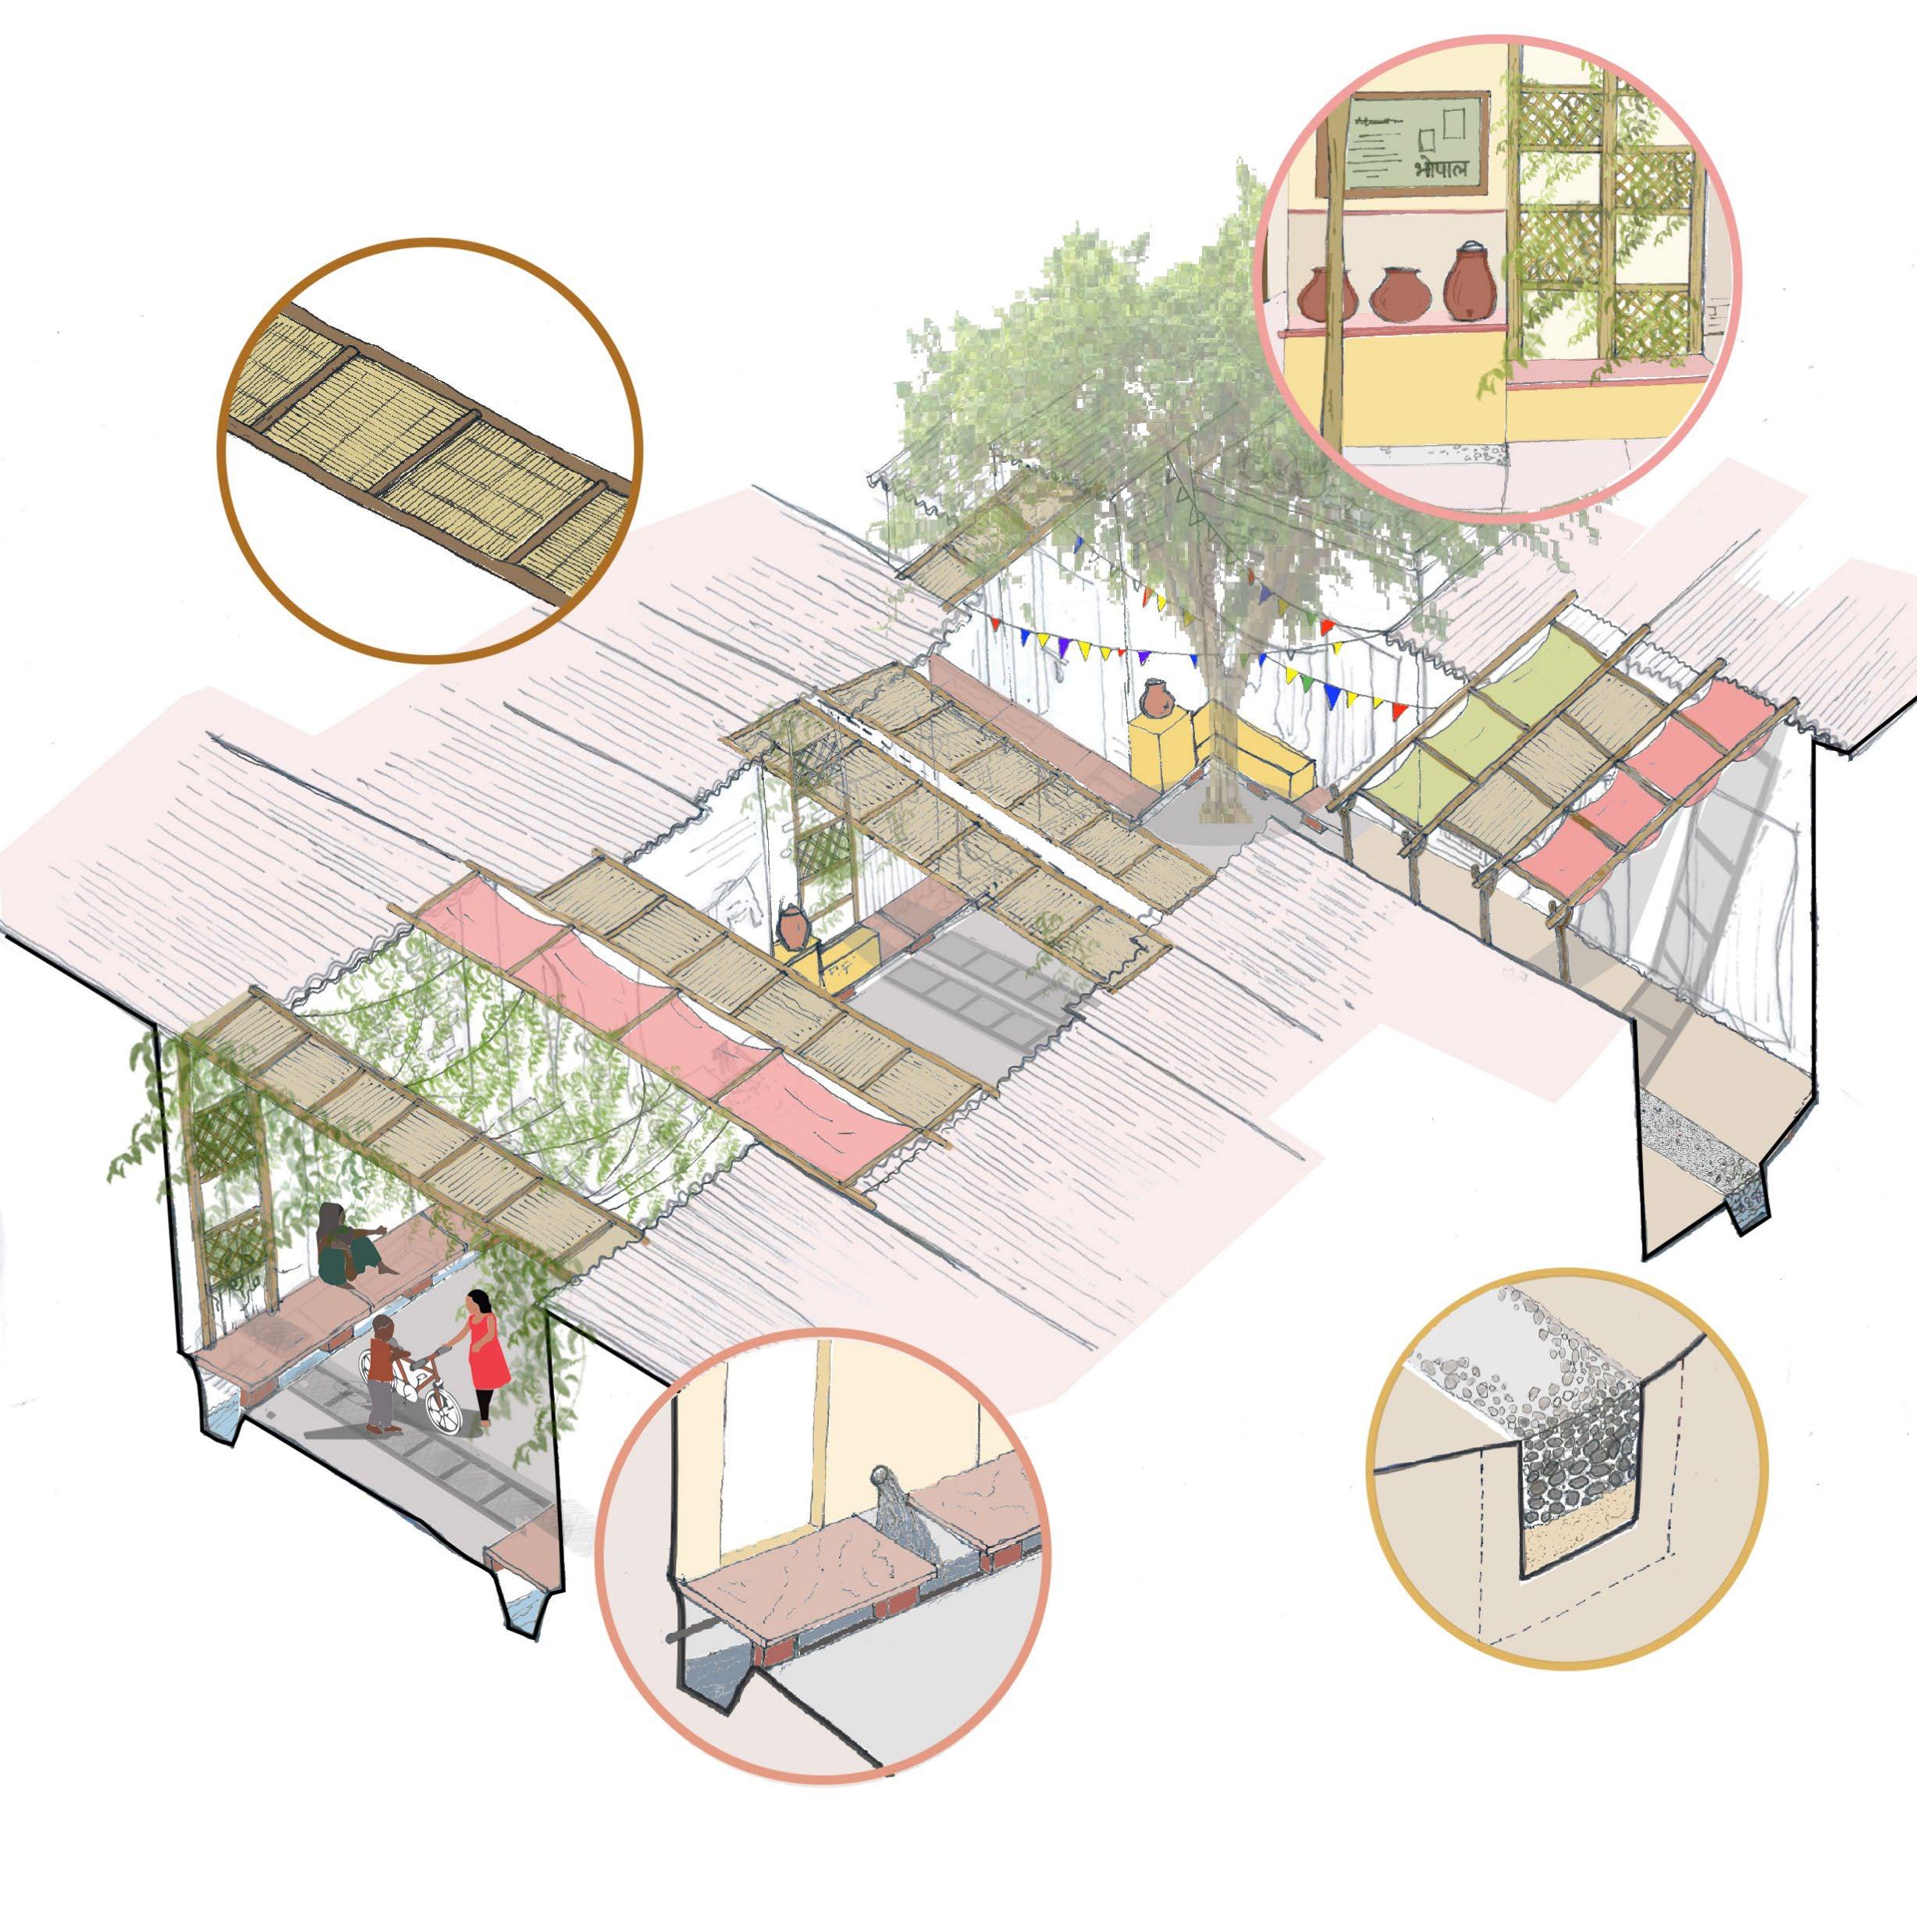
Solution for Heat and lack of community spaces ~ Pyaun and Otla for recreational activities
Solution for Slushy lanes ~ Permeable nallah system
Solution for Mosquito Breeding and Backflows ~ Covering concretised drains
45
Risk posed for unused and barren land
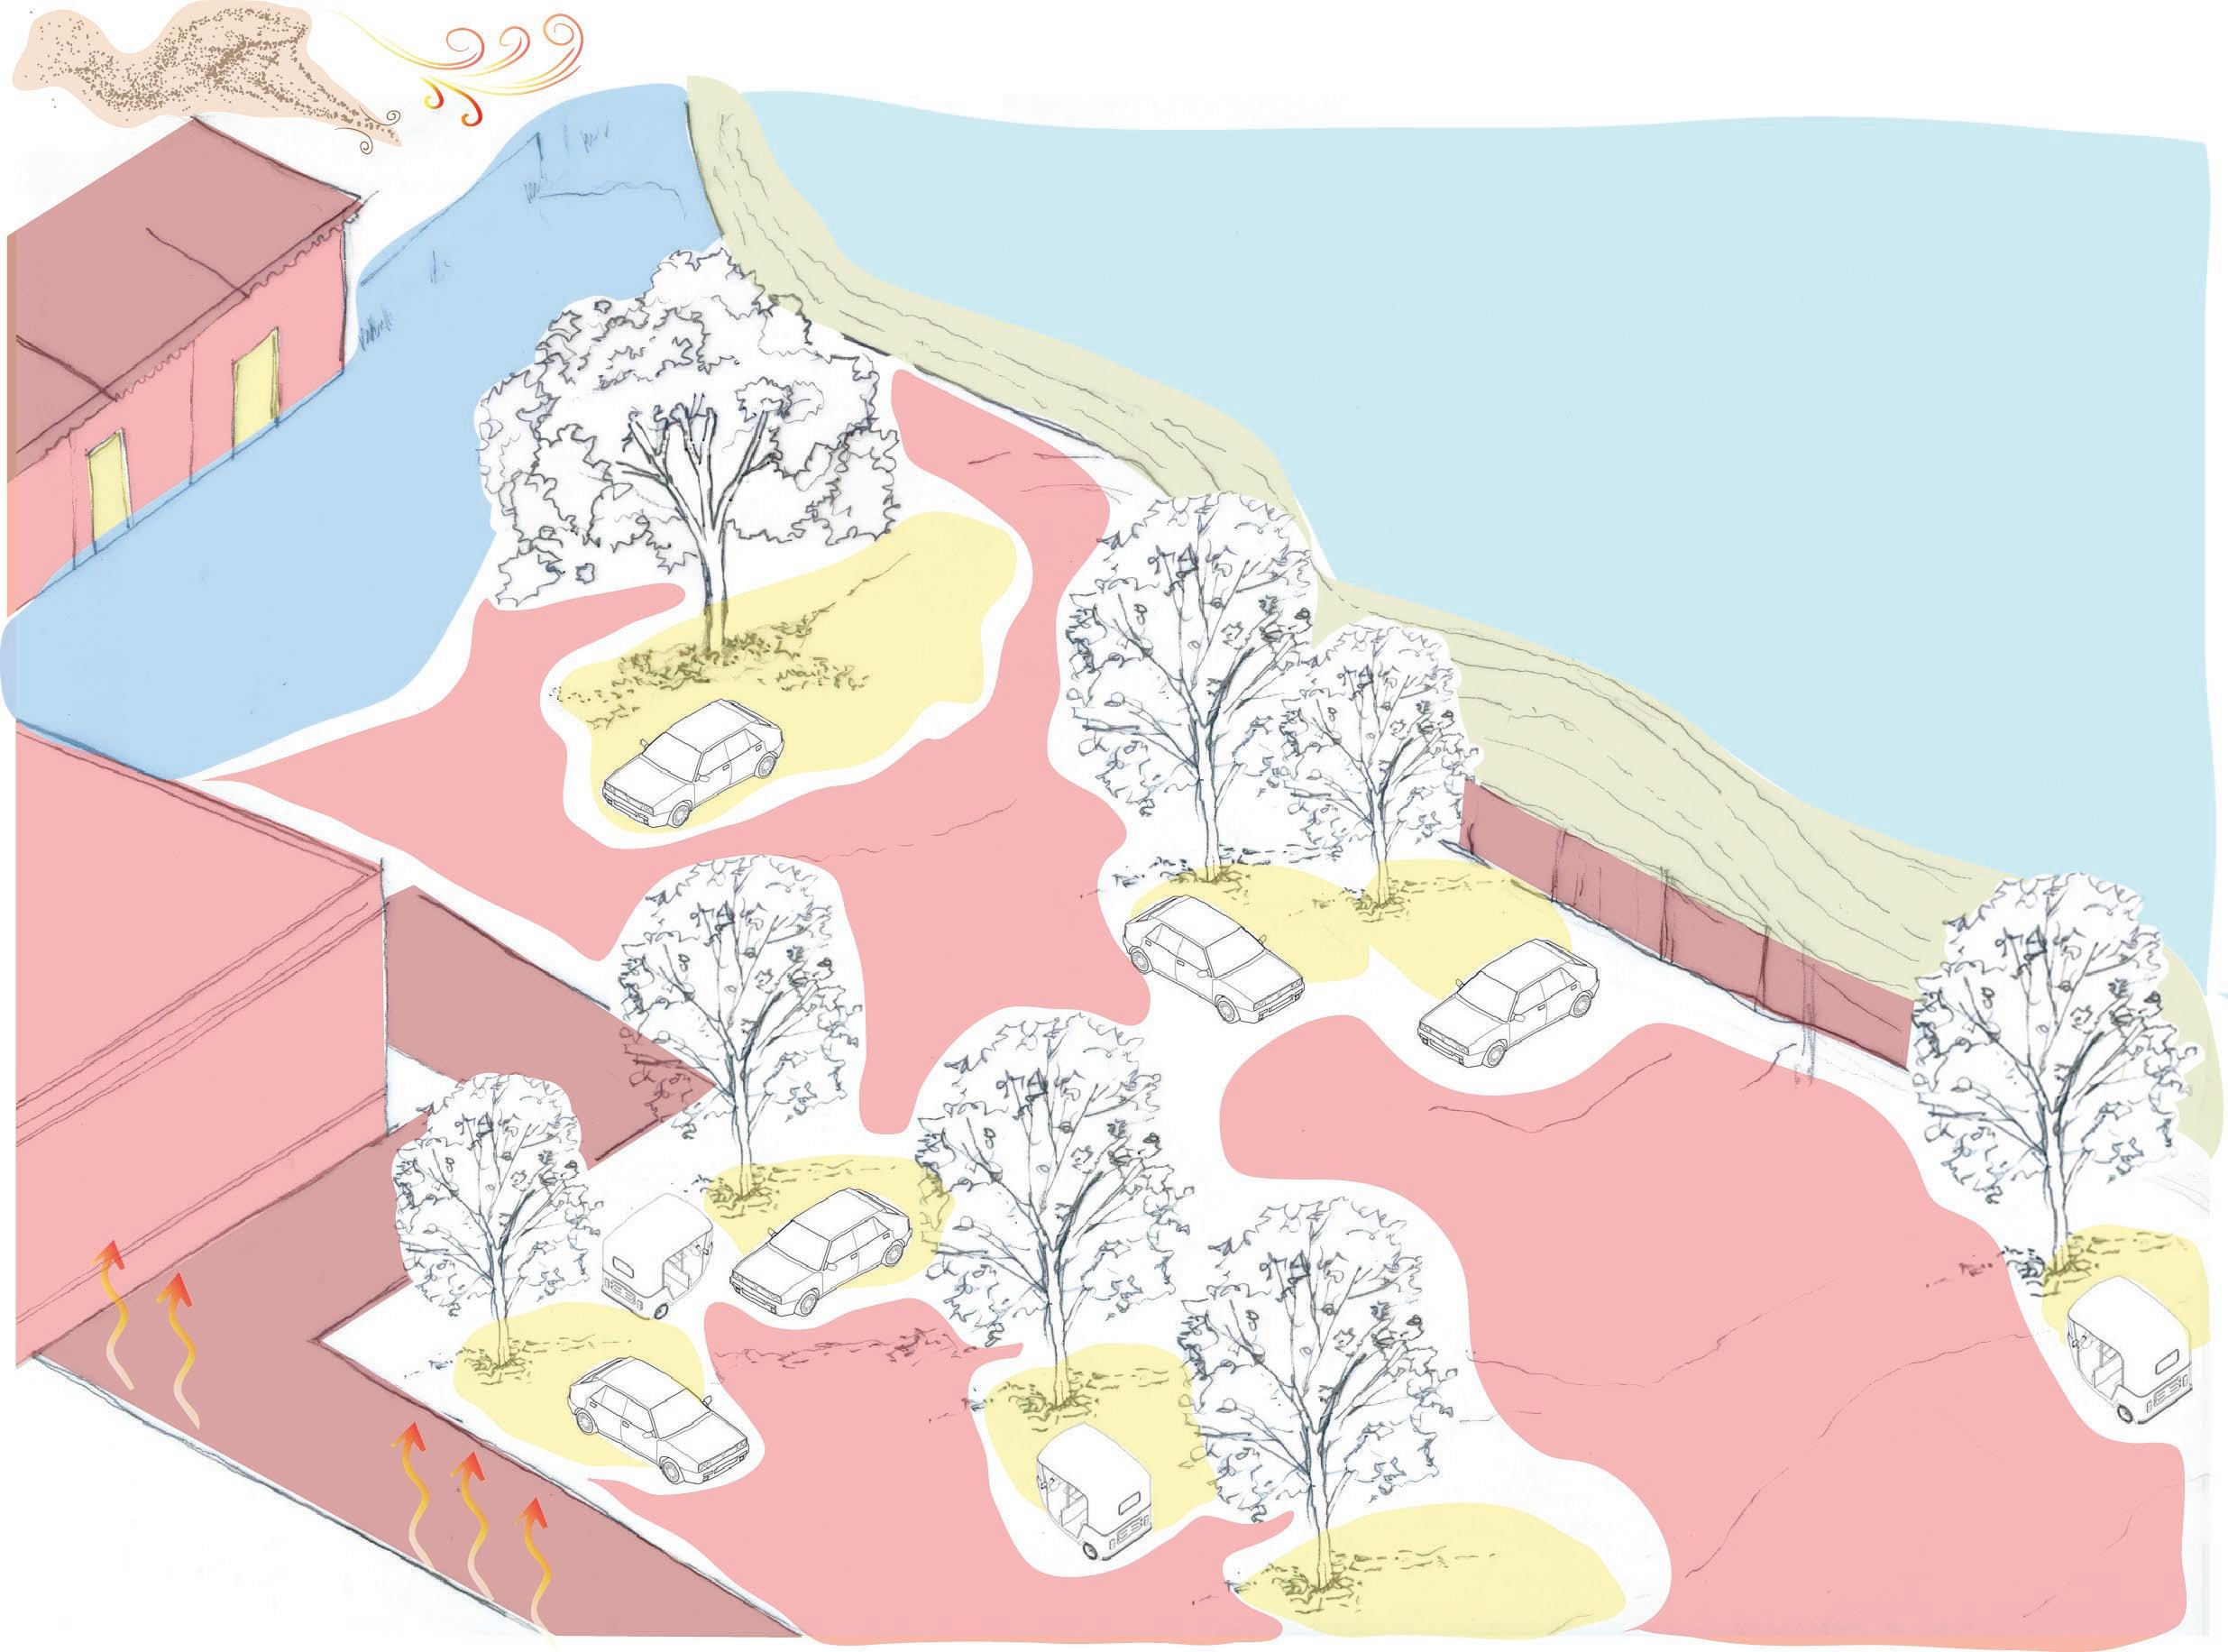
Hot & Dusty Loo
Flood Prone Area
Bank Erosion
Unorganised Parking Heat Radiation
Scarce Vegetation
46
Proposed solution for the barren land
Heat radiation and grazing lands ~ Fodder Crop Pocket
Flooding and heat radiation
~ Orchard, lined with fruit and medicinal trees
Heat radiation and unorganized parking
~ Play Area, recreation space for children and open gym for adults.
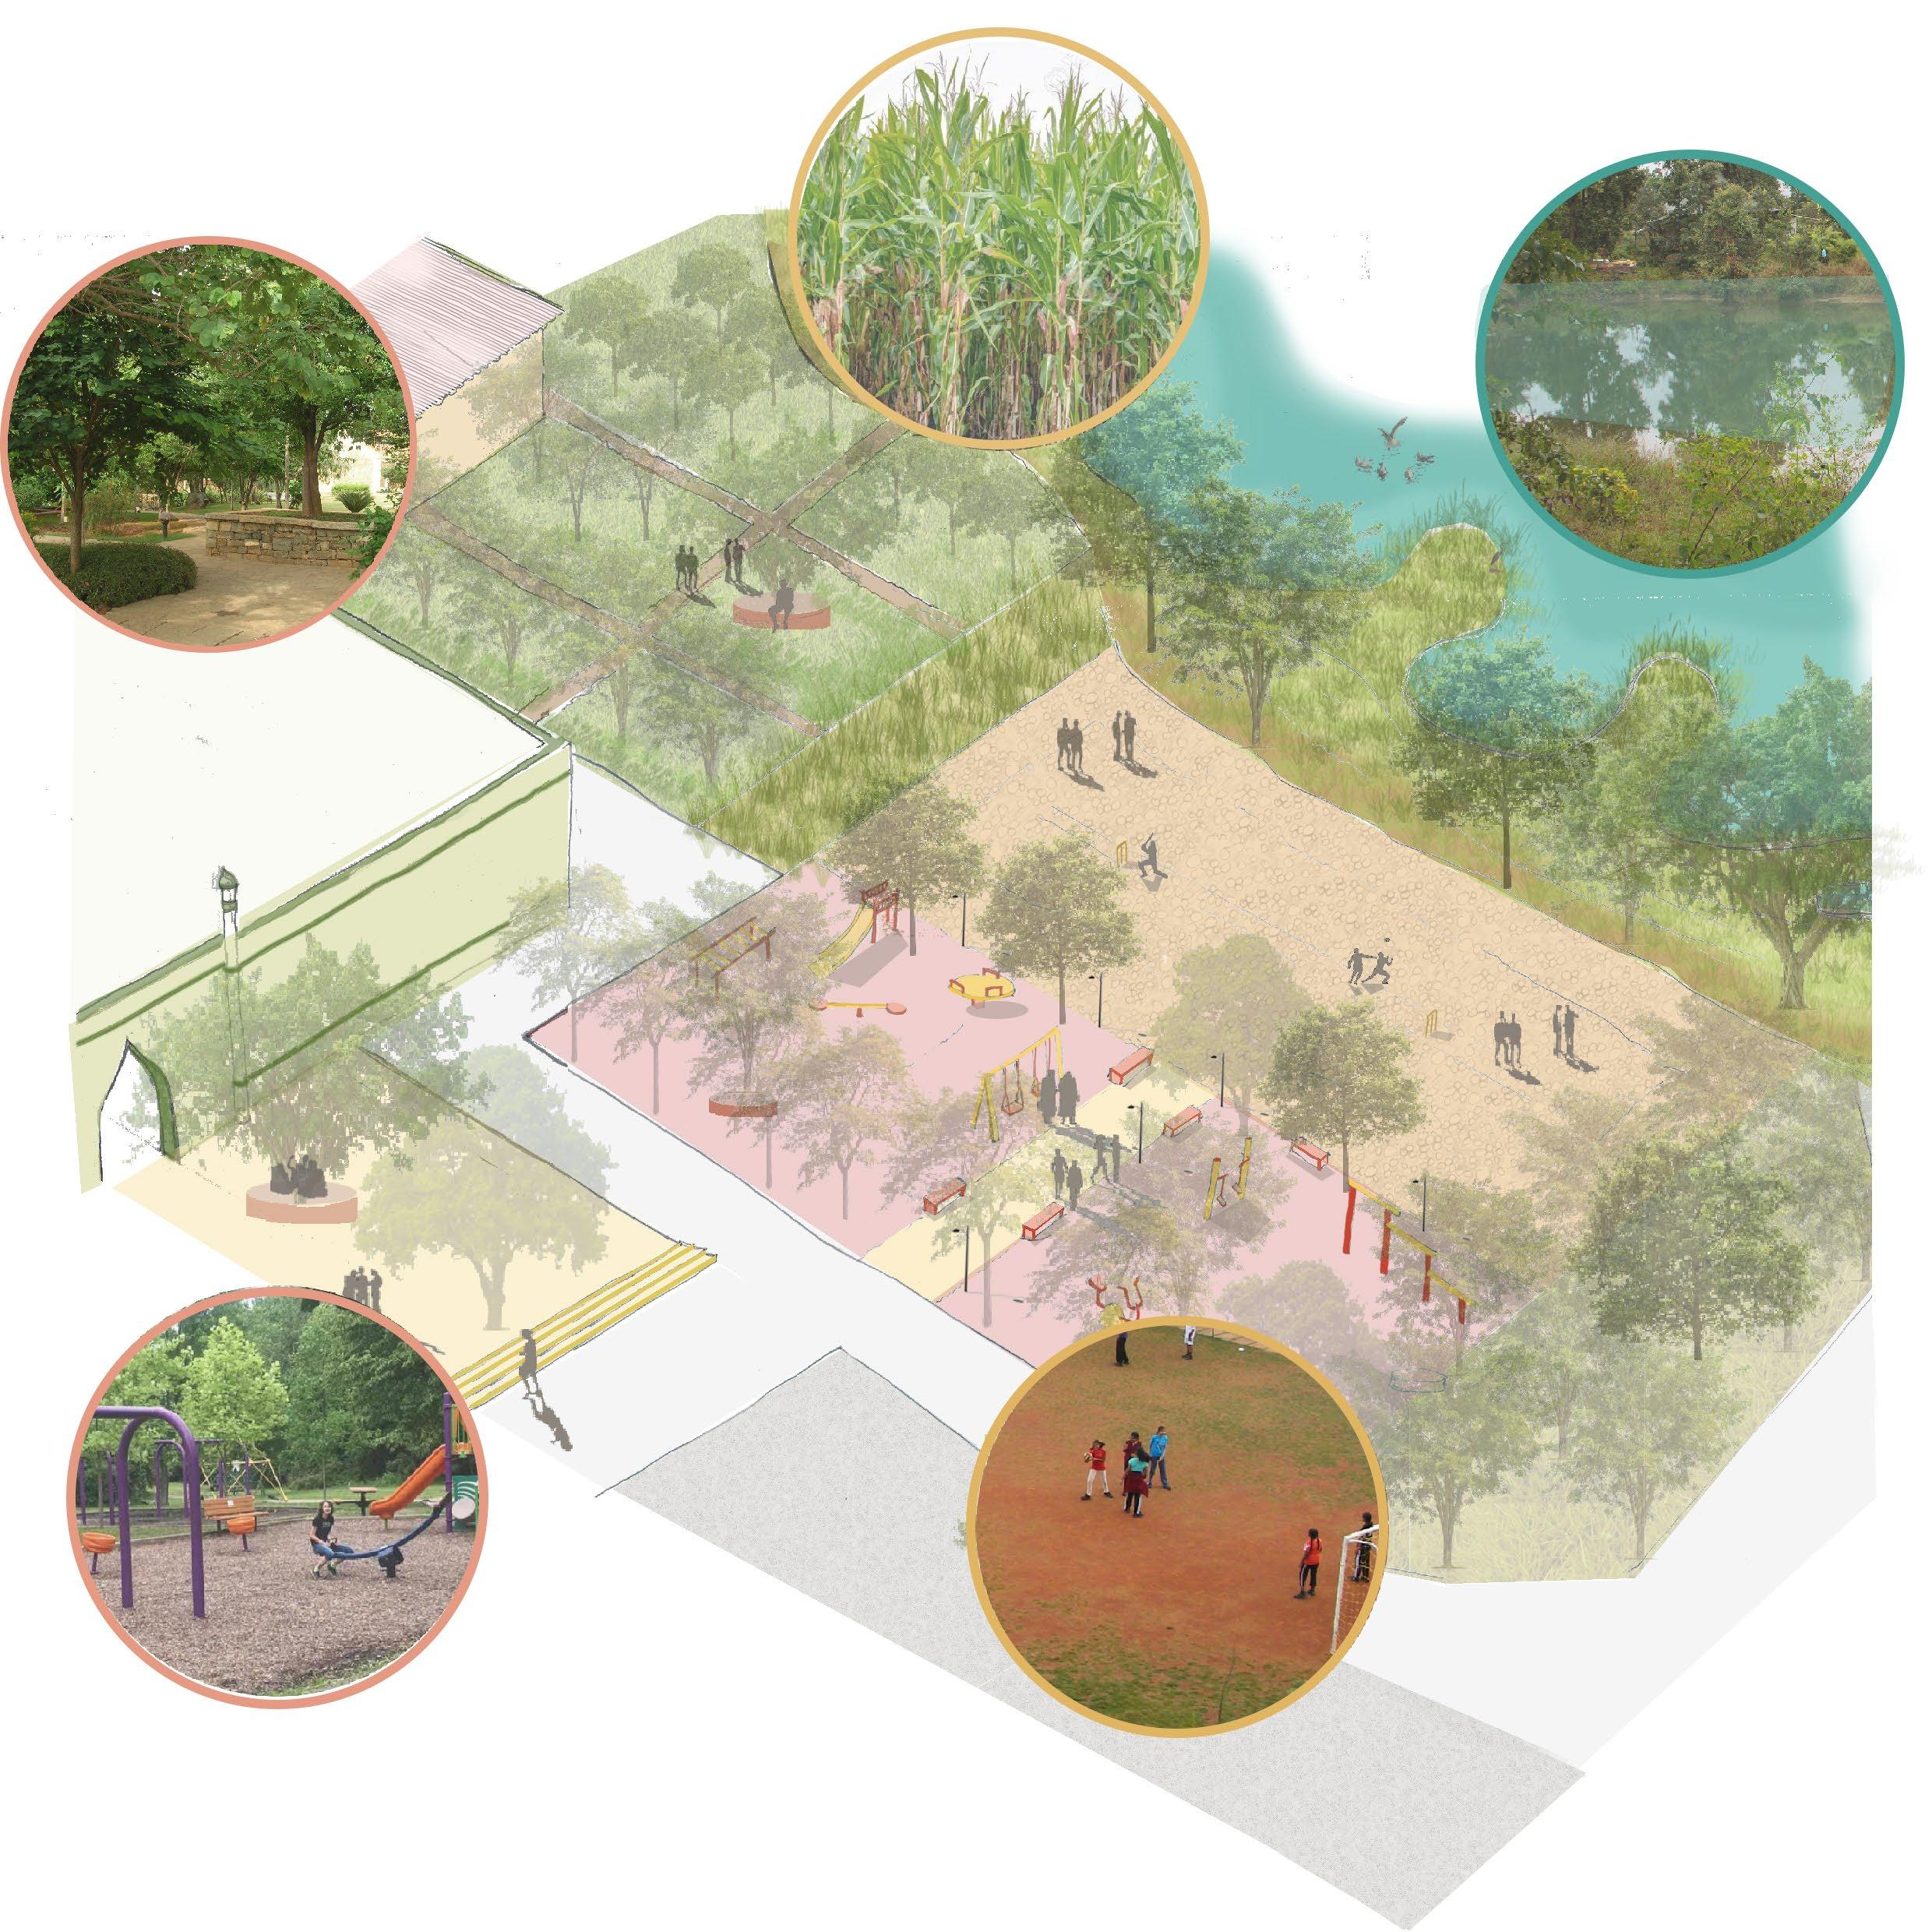
Wetland bank erosion ~ Wetland buffer system
Heat radiation and unorganized parking ~ Multi purpose
Maidan, for recreational, and cultural activities lined with vegetation.
47
What precautions should we take ?

Be alert for following symptoms
Dizziness, light headedness Body temperature more than 40° C


Hot, red and dry skin
Throbbing headache

Muscle weakness and cramps
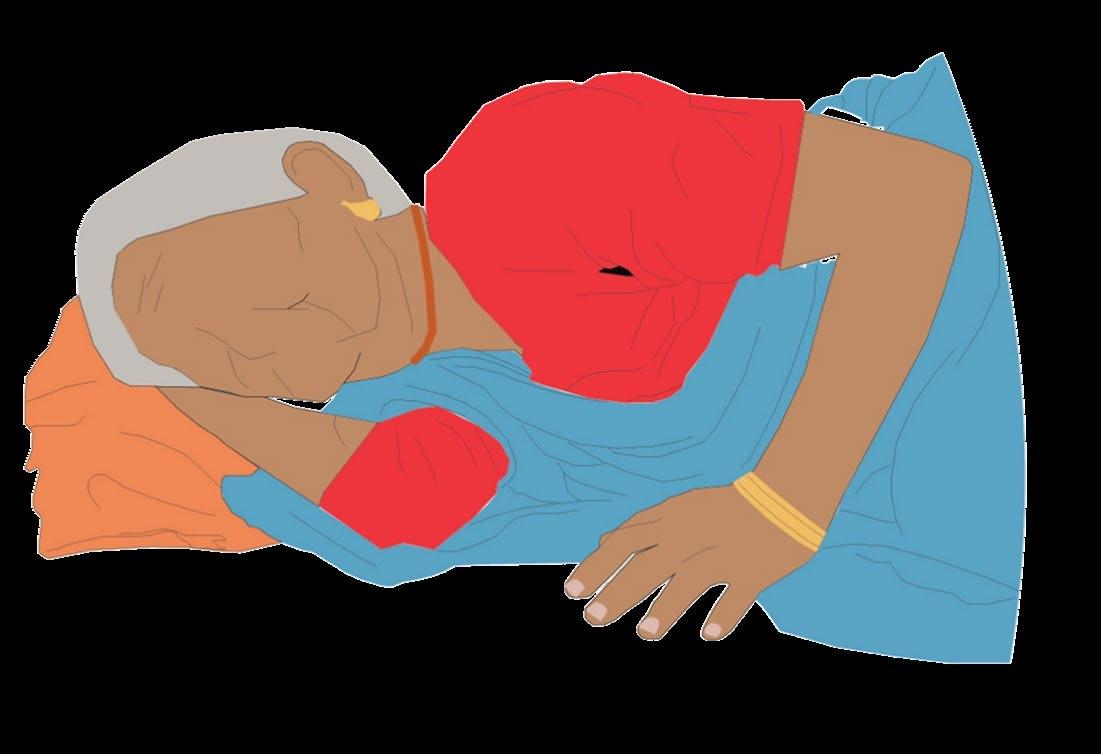
Rapid and shallow breathing
Nausea and vomiting

49
• Drink sufficient water
• While travelling, carry water
• Keep animals in shade

• Give them plenty of water
• Keep your home cool
• Use curtains and open windows at night.
• Wear lightweight, lightcoloured, loose cotton clothes.
• Use protective gear while going out in sun.

• Seek medical assistance if one faints or is ill
• Drink ORS, homemade drinks that help to rehydrate the body
Do’s
50
• Avoid going out in the sun, between 123 p.m.
• Avoid drinks that dehydrate the body.
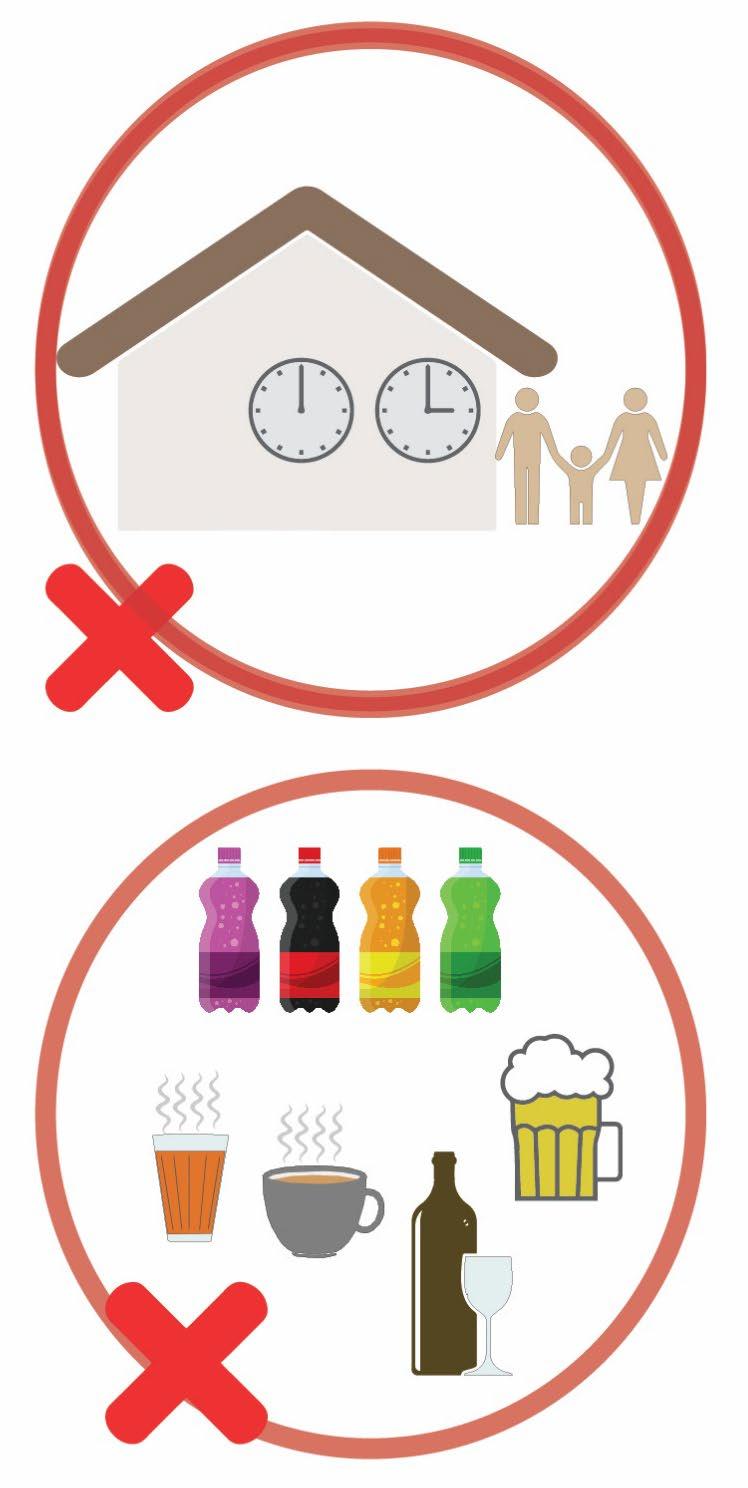
• Don’t cook between 24 pm
• Avoid strenuous activities.
• Avoid working outside between 12 noon to 3 p.m.
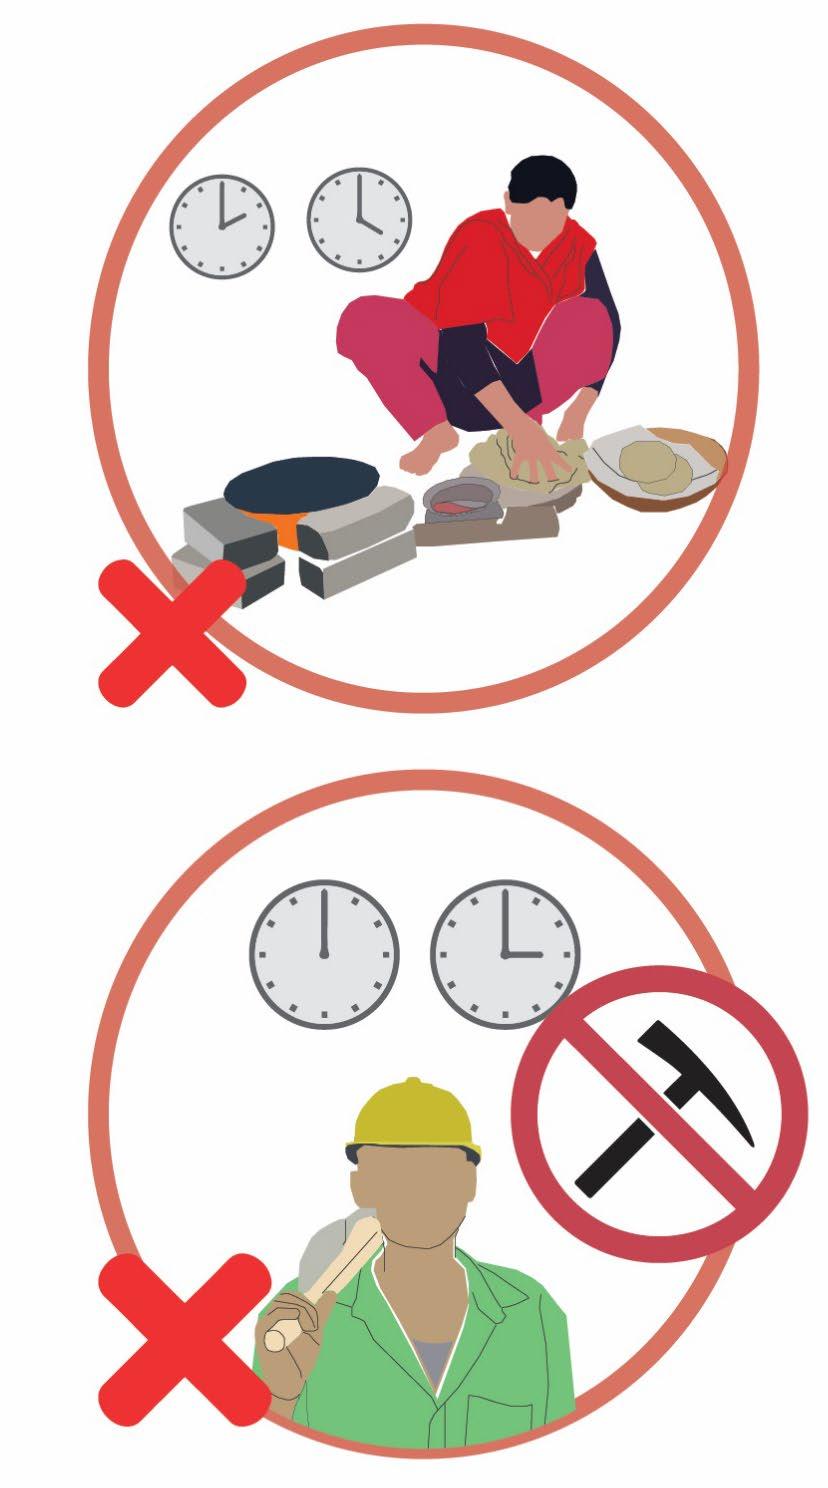
Don’t s 51
1. United Nations. (2022, September). United in Science: We are Heading in the Wrong Direction | UNFCCC. https://unfccc.int/news/united-in-science-we-are-heading-in-the-wrong-direction
2. Gallardo, L., Hamdi, R., Islam, A. K. M. S., Klaus, I., Klimont, Z., Krishnaswamy, J., Pinto, I., Otto, F., Raghavan, K., Revi, A., Sörensson, A. A., & Szopa, S. (2022). What the Latest Physical Science of Climate Change Means for Cities. Indian Institute for Human Settlements. https://doi.org/10.24943/SUPSV108.2022
3. Moser, C., & Satterthwaite, D. (2008). Towards pro-poor adaptation to climate change in the urban centres of low- and middleincome countries. IIED.
4. Basu, R., & Bazaz, A. (2016). Assessing climate change risks and contextual vulnerability in urban areas of semi-arid India. 43.
5. Salingré, A., & Braun, B. (2014). Communicating Climate Change and its Impact to Dhaka’s Urban Poor – Grassroot Workshops for Adults and Children. In Risks and Conflicts: Local Responses to Natural Disasters (Vol. 14, pp. 251–278). Emerald Group Publishing Limited. https://doi.org/10.1108/S2040-7262(2013)0000014017
6. Multiple (including Environmental Protection Agency, EPA; https://archive.epa.gov/climatechange/kids/glossary.html; Center for Climate and Energy Solutions, C2ES, https://www.c2es.org/content/climate-basics-for-kids/ ; National Aeronautics and Space Administration, NASA https://climate.nasa.gov/evidence/
7. IPCC. (2022). Climate Change 2021: Summary for All. https://www.ipcc.ch/report/ar6/wg1/downloads/outreach/IPCC_AR6_WGI_SummaryForAll.pdf
8. https://showyourstripes.info/l/globe
9. https://weatherspark.com/y/109103/Average-Weather-in-Bhopal-India-Year-Round
10. https://world-weather.info/forecast/india/bhopal/march-2022/
11. https://timesofindia.indiatimes.com/city/bhopal/heatwave-returns-bhopal-bakes-at-42-8c-night-temperature-nears30/articleshow/91973876.cms
12. https://timesofindia.indiatimes.com/city/bhopal/heatwave-sweeps-across-state-bhopal-sizzles-at-444oc/articleshow/91569642.cms
13. https://timesofindia.indiatimes.com/city/bhopal/bhopal-sizzles43-3-hottest-day-in-april-in-almost-adecade/articleshow/91167760.cms 14. https://archive.ipcc.ch/pdf/special-reports/srex/SREX-Annex_Glossary.pdf 15. https://public.wmo.int/en/files/heat-waves 16. https://futureearth.org/publications/issue-briefs-2/heatwaves/
References 52
17. https://timesofindia.indiatimes.com/india/total-heatwave-days-in-2022-over-5-times-more-than-lastyears/articleshow/93172931.cms
18. ICAR – Central Research Institute for Dryland Agriculture. (2022). Heat Wave 2022 Causes, impacts and way forward for Indian Agriculture. http://www.icar-crida.res.in/Pubs/Heat%20wave%202022%20%20Causes%20Impacts%20and%20way%20forward%20for%20Indian%20Agriculture.pdf
19. https://www.downtoearth.org.in/news/climate-change/state-of-india-s-environment-in-figures-india-recorded-280-heat-wavedays-across-16-states-in-2022-most-in-decade-83131
20. https://www.reuters.com/world/india/power-hungry-india-halts-passenger-trains-free-up-track-move-coal-2022-04-29/
21. Shukla, R. (2022, June 10). 10 cities saw harsher heatwave in 2022 compared to last year. Retrieved from Deccan Herald: https://www.deccanherald.com/national/10-cities-saw-harsher-heatwave-in-2022-compared-to-last-year-1117028.html
22. Akanksha, & Chanchal, A. (2022). Summer like no other : A Report on the Heatwave crisis in Ten Indian Cities. Greenpeace India Society.
23. Directorate of Town and Country Planning, Government of Madhya Pradesh. (2021). Bhopal Development Plan-2031.
24. https://www.newsclick.in/climate-change-bhopal-loses-5-lakh-trees-last-decade-forest-cover-down-26%25%2C-reveals-report
25. Sustainbale cities strageies UN Habitat. (2021). Sustainable City Strategy-Bhopal, Sustainable Cities -Integrated Approach Pilot (SCIAP)
26. https://citizenmatters.in/bhopal-water-crisis-upper-lake-bada-talab-tree-cover-13186
27. Haque, A. N. (2020). A ‘Whole Systems’ View of Vulnerability to Climatic Risks: The Case of the Urban Poor in Dhaka, Bangladesh. Progress in Development Studies, 20(2), 101–118. https://doi.org/10.1177/1464993420908094
28. Wisner, B., Blaikie, P., Cannon, T., & Davis, I. (2008). At risk: Natural hazards, people’s vulnerability, and disasters (2nd ed.). Routledge. https://www.preventionweb.net/files/670_72351.pdf
29. Satterthwaite, D., Archer, D., Colenbrander, S., Dodman, D., Hardoy, J., Mitlin, D., & Patel, S. (2020a). Building Resilience to Climate Change in Informal Settlements. One Earth, 2(2), 143–156. https://doi.org/10.1016/j.oneear.2020.02.002
30. UNDRR. (2004). Living with risk: a global review of disaster reduction initiatives
53


 Badhbadha Settlement, Bhopal
 Nehru Colony, Bhopal


 Badhbadha, Bhopal


