

JULY 2023


JULY 2023
Bill Zimmerman, Mayor
Bob Karwin, Mayor Pro Tem, District 1
Ricky Estrada, Councilmember, District 2
Lesa Sobek, Councilmember, District 3
Dean Deines, Councilmember, District 4
Bill Ackerman, Chair
David Foust, Vice Chair
Scott Bangle, Commissioner
Tierra Bowen, Commissioner
Laz Peterson, Commissioner
Thomas Giedroyce, Retired Commissioner
William Payne, Retired Commissioner
Jonathan Nicks, Deputy City Manager
Mariana Mitchell, Community Services Manager
Bryce Howell, Park/Landscape Maintenance Manager
Kori Jones, Senior Management Analyst
Joe Punsalan, Principal
Mike Singleton, Retired Principal
Matt Wilkins, Project Manager
Nicole Rogge, Senior Planner
Alan Pennington, Principal Analyst
Chas Jordan, Senior Analyst
Khushboo Hussain, Senior Analyst
RRC
Kailyn Haskovec, Survey Manager


Figure
Figure
Figure
Figure
Figure
Figure
Figure
Figure
Figure
Figure
Figure 3-8:
Figure
Figure
Figure
Figure
Figure
Figure
Figure
Figure
Figure
Figure
Figure
Figure
Figure
Figure
Figure
Figure
Figure
Figure
Figure
Figure
Figure
Figure
Figure
Figure
Figure
Figure 6-4:
Table 3-1: Classified Existing Parks with Associated Acres .................................................................................30
Table 3-2: City-wide Park Amenity Inventory ..............................................................................................................35
Table 3-3: Valley-Wide Park Amenity Inventory .........................................................................................................37
Table 3-4: City-wide Park Assessment Scores ...........................................................................................................38
Table 3-5: Existing Level of Service (2022) ...................................................................................................................46
Table 3-6: Level of Service Current Population (NRPA Averages) ..................................................................47
Table 3-7: Comparative analysis with southern California cities .......................................................................48
Table 3-8: Amenity Comparative Analysis ....................................................................................................................49
Table 3-9: Categorized Park Level of Service ..............................................................................................................56
Table 3-10: Top Fifteen Activities Totals by Registrant Numbers (2021-2022) ............................................64
Table 3-11: Top Fifteen Programs Totals by Registrant Numbers (2022-2023, as of March 2023) ....64
Table 3-12: Program Offerings from Southern California Recreation and Parks Organizations ........65
Table 3-13: Cultural Arts Programs from Other Recreation Organizations...................................................66
Table 3-14: Programmatic Specific Cost Recovery ...................................................................................................68
Table 3-15: Nationwide Team Sport Participation Trends ....................................................................................69
Table 5-1: Future Level of Service (2035) Existing and Planned Parks .......................................................... 86
Table 5-2: Future Amenity Level of Service (2035) Existing and Planned Parks ......................................87
Table 5-3: Level of Service Adjustment Table .............................................................................................................94
Table 5-4: Future Level of Service Table with Adjustment ....................................................................................95
Table 6-1: Infill Amenities for Nova Park Opportunity Areas ................................................................................126
Table 6-2: Infill Recommendations Table .......................................................................................................................127
Table 6-3: Future Scenario Amenity Level of Service (2035) .............................................................................128
Table 6-4: Future Scenario Level of Service (2035) .................................................................................................130
The Menifee Parks Master Plan (Master Plan) helps set the vision for the City’s park and recreational services for the next decade. According to The Hill, the City of Menifee is the seventh fastest growing city in the nation based on population increases in 2022. Furthermore, the City is anticipating growing by over 17,000 residents by 2035, according to a review of future planned residential development. With this level of growth, proper planning for the City’s park and recreation system is crucial. The City completed a parks master plan in 2016. Much of this plan has been implemented and is a major accomplishment, however, the need for additional park planning is imperative considering the expected growth. This growth provides city residents with great economic opportunities and benefits, and it poses a unique set of challenges to ensure the City is providing park and recreation needs for residents in all areas of the City. Creating new recreational opportunities where new growth is occurring and maintaining and updating existing parks and recreational facilities will be critical.
Issues regarding parks, recreation facilities, and programs were identified using various methods of input. These issues include: a review of existing plans and documents, stakeholder meetings, inventory of existing facilities, a statistically-valid and open-link survey, level of service analysis, and various community workshops and presentations. A summary of the information gathered from these sources can be found in Chapter 4 and Appendix A.


3 Community Workshops


Completed Surveys 11
Stakeholder/ Focus Group Meetings

The major issues and findings of this study include:
» Trails, pathways, and open spaces are rated the highest in terms of importance.
» Respondents feel strongly about adding walking trails/interpretive trails and more splashpads/ spraygrounds in the next five years.
» 42 percent of respondents indicated they are unaware what agency manages their closest park.
» 21 percent of respondents live in an HOA community.
» Desire to combine Valley-Wide Recreation and Park District (Valley-Wide) into the City park system.
» Park and field lighting is needed.
» Explore aquatic play elements at various parks.
» Consider multi-generational facilities.
» Incorporate accessible features at playground and facilities throughout the City.
» The top three most popular programs in the 20212022 program year were Senior Soul Line Dance, Taekwondo, and Texas Hold ‘Em.
» The top three most popular programs in the 2022-2023 program year were Texas Hold ‘Em, Fitness, and Tiny Tots Program.
» Compared to nearby cities, the City is lacking in aquatics programs, due to the lack of aquatic facilities, although many HOAs in Menifee have swimming pools.
According to National Recreation and Park Association (NRPA) (national averages), the City of Menifee is below average in:
» Swimming pools
» Splashpads/spraygrounds
» Multi-purpose fields
» Lighted multi-purpose fields
» Tennis courts
» Volleyball courts
After analyzing the findings, community and stakeholder input, inventory of existing facilities, level of service analysis, and analysis of future recreation trends, a series of recommendations were developed to guide the improvement of Menifee’s parks, recreation facilities, and programs. The project recommendations are organized into three goals: Include, Integrate, and Improve. These broad goals help to organize the overall strategies for the project.
Goals and strategies represent ideas that have evolved from the beginning of the work effort and have been influenced by public input, level of service analysis, and other factors. These broad goals and strategies identify objectives and actions which have further fiscal planning impacts, operational budget impacts, and timelines to complete. The recommendations can be found in more detail in Chapter 6.
6 5 7 Placemaking Trails, Connectivity, and Open Space Technology INTEGRATE 3 4 Administrative Financial IMPROVE 1 2 Facilities and Amenities Programs and Services INCLUDE

The following terms are utilized throughout the report and the definitions to these terms are below:
Active recreation: Structured individual or team activity that requires the use of special facilities, courses, fields, or equipment.
Amenity: A physical element that accommodates a recreational activity or sport.
Commission for Accreditation of Park and Recreation Agencies (CAPRA): A non-profit organization that delivers quality assurance and improvement to accredited park and recreation organizations throughout the country by helping them build a comprehensive management system of operational best practices.
Facility: The built features within parks that create opportunities to engage in specific games and activities. These can range from single courts or small play areas up to the recreation centers which support a wide variety of self-directed and programmed recreation.


Infill: Areas of open space within existing parks that are suitable for potential development or new amenities. Infill areas can also indicate vacant land that is not currently a park that is suitable for new park development in the future.


Multi-use trail: A designated pathway that accommodates various modes of active transportation. It is designed to be accessible to a wide range of users, including pedestrians, cyclists, joggers, skaters, and sometimes even equestrians. Multi-use trails are separate from vehicular traffic and provide a safe and scenic environment for people to engage in non-motorized activities.


Natural habitat: Native or naturalized plant communities and natural features such as woodlands, riparian corridors, and varied undeveloped landscape, including but not limited to all areas designated as environmentally sensitive habitat areas (ESHA) in the General Plan.
National Park and Recreation Association (NRPA) national averages: Amenity standards based on the 2020 Agency Performance Review Survey.
Open space: Any area of land that is essentially unimproved and designated for one or more of the following open space uses: (1) land for the preservation of natural resources; (2) land for the managed production of resources; (3) open space for outdoor recreation; (4) open space for public health and safety; and (5) protection of Native American cultural sites, including burial, historic or archaeological, sacred, or other cultural sites.
Park: Public land for passive or active recreation.
Passive natural area: Areas designated for passive recreation where minimal stress impacted the site’s resources.
Passive recreation: Recreational activities that do not require constructed facilities like sports fields or pavilions.
Playground: A space designed for children to play and explore. It may include playsets, interactive panels, and protective surfacing. The types of parks are defined in detail in Chapter 3 Park Classifications.
Level of Service (LOS): A qualitative measure to relate the quantity of park facilities. This measurement evaluates how parks, open spaces, and facilities serve the given community.
Geographic Distribution Analysis (GDA): Examines the walktime, biketime, and drivetime to the parks and open spaces within the City as determined by a GIS parkshed analysis.
Valley-Wide Recreation and Park District (Valley-Wide): A parks district that owns and maintains 24 parks within the City of Menifee and a total of 80 parks in the entire district. The District was created when Menifee was an unincorporated area of the County of Riverside. These parks were not transferred to the City when Menifee incorporated.
The scope of the Master Plan encompasses a summary of the existing planning efforts, an inventory of all parks and amenities, an assessment of the current standards, projections of future conditions, input from the community, and recommendations to the City. The Master Plan sets the future direction of the parks, playgrounds, and portions of parks and open space with improved facilities in the City of Menifee’s parks system.
Executive Summary: The executive summary provides an overview of the entire document, identifies key issues and themes within the City’s park system, and provides an overview of the recommendations.
Planning Context: The planning context gives context to the City of Menifee, the State of California, and the United States. It provides an overview of The City’s parks, recreation, and community services. It gives policies and guidance from other studies. This section describes the three different park systems, City parks, Valley-Wide parks, and HOA parks and facilities, and the impact they have on the overall park system.
Existing Conditions: The existing conditions give an overview of the demographic profile of the City of Menifee. It explains the differences between mini-parks, neighborhood parks, and community parks, and categorizes each park to its respective category. It lists the amenities of each park for both City parks and Valley-Wide parks. It shows the level of service of the entire park system based on NRPA (national averages) and compares the City to several other Southern California cities. It provides a series of maps that show geographically where parks are and analyzes current recreational program participation and trends.
Key takeaways include:
1. The City has a 2.4 park acre per 1,000 residents deficit citywide.
2. The City is lacking aquatic facilities (swimming pools and splashpads).
3. The City has high totals of program registrants. Recreational programs are very popular post COVID-19.
Community Outreach: The community outreach summarizes the information gathered from the extensive community engagement efforts completed throughout the entire planning process. It includes public input gathered from the three community workshops, statically-valid survey, stakeholder interviews, and focus group interviews. It takes community’s input and identifies key trends and priorities of the community and stakeholders.
Key takeaways:
1. There is a strong desire for a public aquatic facility.
2. Residents would like to have more adult sports programs.
3. Survey respondents want more trails and paths.
Future Conditions: The future conditions analyzes the projected parks and facilities. It also identifies recreation trends, planned residential development and population increases in the City, and these impact on the future level of service.
Key takeaways:
1. Community needs adjustment shows that pickleball courts, tennis courts, multi-purpose fields, and splashpads are the most needed amenities by the community.
2. The increased future population will create an increased demand for more park acres.
Recommendations: The recommendations identify key strategies, action items, and goals to improve the existing and future level of service of parks, recreational programs, and service delivery. This chapter also identifies infill opportunities at each existing park and potential amenities that could be incorporated at an existing park. The recommendations also provides potential funding opportunities to execute the goals and recommendations.

The history of Menifee can be traced back to Native American tribes that once inhabited the area which included Luiseño tribes, specifically the Pechanga band. By the 1700’s Spanish conquistadors landed in California and the area fell within the Spanish empire’s rule. The area was eventually annexed into the United States from Mexico in 1850 under California’s statehood.
Farming was the primary land use starting in the mid-1800s. By the 1880’s mining activity began with the discovery of a large quartz lode by miner Luther Menifee Wilson, which gave the City it’s name. Although mining and farming were prevalent in the early 1900s, the unincorporated area didn’t see much development until a major builder from Phoenix, Arizona, Del Webb, had a vision of an active retirement community and built the first major development, Sun City, in the early 1960s. Sun City can still be found near the center of the City today.
On June 3, 2008, the residents of the communities encompassing the City of Menifee voted to incorporate Menifee into Riverside County’s 26th city. The new City of Menifee was officially established on October 1, 2008. However, the parks administered by Valley-Wide Parks Service District did not transfer into the new City parks system but the city contracted with Valley-Wide to continue programs before opting to establish the Community Services Department in 2015.


2-1: Study Area
The City’s Department of Community Services is in charge of the recreational facilities, programs, and various other service areas, except for ValleyWide and Homeowner Association (HOA) parks. The goal of the department is to create community through people, parks and programs. The vision of the department is:
We enhance residents’ quality of life by delivering quality programs, services, and facilities that create lasting positive memories for youth, adults and seniors throughout the community.
The Community Services Department is comprised of the following service areas:
» Community outreach (committee and commission)
» Facility maintenance
» Outreach and education of state-wide waste and recycling initiatives
» Park and landscape maintenance
» Park development/improvement
» Recreation and leisure activities
» Senior services
» Special events
» Youth programs
» Sports: Youth and alternative

Following the building of Sun City in the 1960s, much of the City has followed the trend of master-planned communities. This includes the communities of The Lakes, Mariposa, Oasis, Audie Murphy Ranch, Heritage Lakes, Canyon Heights, Menifee Valley Ranch, Caider Ranch, and various other communities.
Though the City has various master-planned communities, some areas within the City follow less defined, rural development patterns. Examples include Quail Valley located in the northwestern section of the City, Romoland located in the northeastern section of the City, and Bell Mountain Ranches located in the south and southwest portions of the City.
The City of Menifee has been following their last Trails, Parks, Open Space, and Recreation Master Plan completed in 2016. Since then, the City has completed a number of new park projects. Presently, the City is experiencing rapid population growth and the plan is in need of an update to accommodate the new needs of the future community. Furthermore, the City is going through various planning and policy updates to help inform and manage the current growth in a sustainable and reasonable manner.

The 2023-2028 Strategic Plan Update is a five-year plan adopted by City Council in March 2023 that serves as a foundation for the City’s process, it defines the City’s shared vision for the future, and focuses resources on five strategic priorities. The plan serves as a guide to align with other city initiatives. It sets priorities, goals, and objectives and performance measures for government transparency, accountability, and continued improvement. The five strategic priorities and how the Parks Master Plan integrates these priorities are as follows:
To provide access to parks for all ages and abilities, the Connectivity and Mobility priority seeks to enhance accessibility and link the community’s resources with sustainable infrastructure. The City’s Active Transportation Plan, which fulfills one of the objectives of this priority, addresses existing and future non-motorized access to parks, schools, retail and transit for a connected bicycle and pedestrian network. Developing a comprehensive and connected park system allows residents to travel by foot, bicycle, or other mobility device. The identification of trails and incorporating the City’s Active Transportation Plan priorities are also included into this Parks Master Plan. Strategy 5, Trails, Connectivity, and Open Space recommends identifying corridors for the possibility of linear parks as traffic calming measures while improving bicycle and pedestrian connections. Technology is also a part of being connected. Strategy 7, Technology, develops strategies to increase security systems within the park system, enhance digital scheduling and facility management tools and to include virtual programs, events, and activities.
This priority aims to engage in thoughtful and collaborative planning with stakeholders to develop a distinct sense of place that makes the City a highly attractive and desired destination for residents, businesses, and visitors. Throughout the planning process of this Parks Master Plan, stakeholders, residents, Councilmembers and Parks and Recre-


ations Commissioners were engaged to guide the plan. The City is in a unique situation where it still has the room to grow, develop and enhance existing recreation infrastructure and plan parks and programs for future generations. By identifying open space, vacant properties, and listening to its residents, the Parks Master Plan looks to the future to provide its rapidly growing population the rare opportunity to shape a growing City and create its identity. Strategy 6, Placemaking provides recommendations to increase identity and relation to local natural context and built environment which will assist with building upon the existing programs and events in order to create a signature event that exemplifies the City’s unique identity. Strategy 1, Facilities and Amenities looks at different ways to leverage existing City assets for park improvements such as addressing park poor areas, exploring amenities such as splash pads and other aquatic features and providing amenities such as multi-purpose fields and courts to accommodate sporting trends such as Pickleball. Improving park amenities, planning City events, and increasing recreational opportunities helps to make Menifee a desirable place to live.
The Community Engagement and Social Infrastructure priority encourages the creation of opportunities to bring people together and enhance communication to amplify accessibility, increase awareness, and proactively deliver information to maintain quality of life. Community engagement has been a challenge since the pandemic. Many people have chosen to prioritize their time with family and friends and spend less on civic engagement. The Plan provided opportunities to bring people together at workshops, through social media, online resources and at City meetings to gather community feedback on parks, amenities, programs, deficiencies, and opportunities to improve the park system. Strategy 3, Administration, identifies strategies to collaborate with the Valley-Wide Recreation and Park District to unify the park system to better serve the needs of residents. Strategy 2, Programs and Services, has strategies that look to increase and enhance programs for individuals with disabilities, promote gardening and local food production, and create outdoor classrooms space in parks near schools. Other recommendations include strategies to create, enhance and expand existing youth and teen programs, diversifying programs to include special event programming and nature and environmental programs.
The Thriving Economy priority encourages intentional smart growth to support the City’s business community so that residents have access to businesses, housing, employment, and well-paying jobs. Planning and designing additional parks, or infill at existing parks, provides opportunities to allow people to gather and socialize, which becomes a unique attraction to the City. The Parks Master Plan summarizes these infill areas at parks and compares them with park facility and amenity deficiencies. Amenities and parks can be attractive to local businesses where programs, youth sporting events and City events can drive residents and visitors to their businesses. Amenities such as sports fields, lighted courts and aquatic facilities can keep youth and adult sports in Menifee which supports the local economy. Strategy 2, Programs and Services, discusses exploring joint-use-agreements to utilize facilities such pools for seasonal youth and
adult sports. Being able to host large youth events like soccer and baseball tournaments can provide increased annual revenue for local businesses, there must also be awareness of potential impacts on neighborhoods when large events and tournaments are planned. Strategy 4, Financial, emphasizes the continuation of grant pursuits, increase sponsorships and additional funding options to maintain and create new parks and programs. Other recommendations include implementation of an asset management system to identify, evaluate and manage park assets and will allow the City to be proactive in maintenance and operational needs to keep parks in good condition.
Providing exceptional public safety and maintaining the City’s attractive look and feel as one of the safest cities is the goal for this priority. This priority emphasizes that residents and visitors should feel safe and secure in their neighborhoods and surrounding spaces anywhere in the City. Placemaking, or the activation of space for social interaction, has been a proven strategy to have more “eyes on the street”. One of the objectives of this plan is to explore the beautification of the streetscapes in the City’s main transit corridors and gateways. The Parks Master Plan incorporates strategies to incorporate placemaking at parks, trails, gateways, and major corridors to provide safe and access to parks and open space. Strategy 6, Placemaking, also explores the use of public art that captures the City’s characteristics in public plazas for family gatherings, and additional space for social interaction are other important recommendations.
The five key strategies and improvements to satisfy the current and future needs are:
1. Fiscal Related Implications
2. Park Facility Development Implications
3. Recreation, Health, and Fitness Implications
4. Sustainability, Environmental and Park Operation Implications
5. Public Participation and Relations
The 2016 Menifee Trails, Parks, Open Space, Recreation Master Plan provided a guide and implementation tool for the management and development of parks and recreational facilities throughout the City. It gathered feedback from residents and stakeholders using a variety of methods including, stakeholder interviews, community workshops, sports organization questionnaires, an online survey, and a telephone survey. Based on feedback from residents and stakeholders, the plan found a list of the most desired facilities. Those were biking trails, walking and hiking trails, aquatics, soccer fields, baseball fields, and softball fields. Other highly desired facilities include playgrounds/tot lots, community centers/regional multi-use intergenerational center, a sports complex/regional park, artificial turf, a cultural arts center/performing arts center/ theatre, a football field, and lighting at other sports fields. The plan then identified recommendations in a multi-phase approach using short, mid, and longterm goals, including maintenance improvements, park renovations, and new facility and programming opportunities. The plan also identified funding sources for these recommendations.
Some of these recommendations included Joint-use Agreements with school districts and Mt. San Jacinto College. The recommendations also included trails and bike facilities with priority throughout central Menifee, connecting the east and west portions of the City. It also included recommendations to acquire vacant privately owned parcels and convert them into recreational opportunities. The


recommendations also included 21 new parks to be constructed in approved subdivisions and built by developers. The 2016 Master Plan also included a list of improvements to be made to existing parks and recreation centers.
Since the adoption of the 2016 plan, the City has added 15 new parks.
» Hidden Hills Park - 5.19 acres
» Central Park - 4.77 acres
» Talavera Park - 2.7 acres
» Creek View Park - 3.56 acres
» Silver Star Park - 3.42 acres
» Mayfield Park - 3.71 acres
» Centennial Park - 9.96 acres
» Calle Tomas Play Trail - 0.41 acres
» Sunset Park - 1.62 acres
» Remington Park - 4.87 acres
» Underwood Park - 9.16 acres
» Banner Village Park - 5 acres
» The Lakes (Lago Vista Sports Park) (Valley-Wide Park) - 29.06 acres
» Mosaic Park (Valley-Wide Park) - 1.47 acres
» Heritage Lake Sport Park (Valley-Wide Park)19.51 acres
A total of 19 of the 21 improvements to existing parks that were identified in the 2016 plan have been completed. These improvements include:
Audie Murphy Ranch Sports Park
» Soccer field renovation
» Redesign skatepark entry
» Add BBQ to picnic areas
E.L. Pete Petersen Park
» Renovate picnic shelter
» Tree pruning
» Walkway repair
Kay Ceniceros Senior Center
» Interior improvements
La Ladera Park
» Playground surface replacement
» Sports field lighting
Lazy Creek Park and Recreation Center
» Building renovation
» Turf renovation
» Tree pruning
» Parking lot renovation
» Renovate shuffleboard area
Lyle Marsh Park
» Benches and park amenities
» Paint picnic shelter
» New restroom
John V. Denver Park
» Rubber surface
» New restroom
The 2018-2023 Strategic Visioning Plan was originally adopted in 2018 and updated annually until 2023 when the City engaged in a five-year Strategic Planning process. It provides goals and objectives that align with key stakeholder goals that balance the current and future needs of the City with available resources. It is updated each year to ensure it remains relevant to the ever-growing and evolving city. The goals and objectives are categorized into three timeframes: short-term (less than 2 years); medium-range ( three to four years); and long-term (5 plus years). The document helps close the gap between the current and future needs of residents and stakeholders. The four overarching goals include:
1. Safe and attractive community
2. Livable and economically prosperous community
3. Responsive and transparent government
4. Accessible and interconnected community
The 2022 Strategic Plan Update also recognizes the importance of parks and natural spaces through the identification and acquisition of open spaces for parks and trails, and the development of unique park amenities, green spaces, trails, cultural and recreational facilities and programming that serves the diverse needs and desires of the community. Some additional values of the City in relation to parks and recreation include:
» “We value focused growth in particular areas of the City in order to retain our natural open spaces.”
» “We recognize the social and ceremonial importance of a central gathering place where we can interact with neighbors and fellow residents and hold our annual community celebrations.”
» “We value the preservation of the views created by our scenic ridgelines, natural landforms, and rock features that are defining characteristics of our City.”
» “We value the creation of parks that are evenly distributed throughout the City (east and west of the I‐215).”
» “We value that our amenities are accessible by users of all ages.”
» “We value our network of trails and the alternative recreational experience they provide.”
The 2022 Strategic Plan Update has been completed and the City will be applying these goals to ongoing projects.
The Fiscal Year 2022-23 Budget Book provides an overview of the City of Menifee’s Operating and Capital Improvement Budget. This document covers the budget process as well as highlights the individual line items for each department and fund. Existing population, growth, and planned city developments used in this Parks Master Plan were referenced to be consistent with this plan.
The City of Menifee Park Development Design Guidelines were approved in March 2015 and they serve as a standard for consultants to follow when designing a new park in the City. There are four goals that the Community Services Department identified to help ensure the City maintains high quality parks. The design goals include:
1. Aesthetics
2. Function
3. Economics
4. Health and Safety
The Park Development Guidelines are in need of updating and could use the recommendations from this Master Plan for guidance in updating the Park Development Guidelines.
The 2020 Valley-Wide Master Plan updates the previous Valley-Wide Master Plan with goals to maintain, sustain, and improve the existing park system and prepare for future growth and development. The district encompasses several different communities within Riverside County, including Temecula, Hemet, San Jacinto, Beaumont, Menifee east of Interstate 215, and many unincorporated areas of the county. The overall district operates and maintains over 80 parks, 11 community centers, one aquatic center, two dog parks, 61 ballfields, 40 soccer fields, and more. The plan lists several opportunities based on focus groups, community surveys, leadership and stakeholder interviews, community needs assessments, and inventory and LOS needs. Some
of those key opportunities include: Improving marketing, communications, branding, maintaining existing parks and facilities, level of service, and quality, creating new parks with development, maintaining the affordability of services and programs, connecting communities with walking and biking trails, identifying dedicated funding to support operations and growth.
The plan identifies four overarching goals:
1. Continue to improve organizational efficiencies
2. Continue to improve programs and service delivery
3. Improve and expand facilities and amenities
4. Increase financial opportunities
The Valley-Wide Master Plan also provides cost estimates and prioritization for each of the goals and gives them a short, mid, or long-term time frame for completion.
» City of Menifee Active Transportation Plan
» Ordinance No. 2014-146 (Regulations for the use of Public Parks)
» Quimby Mitigation
» Development Impact Fees
» Capital Improvement Plan
» Legado Development Project
» Nexus Study
Valley-Wide Recreation and Park District is a regional park system that owns parks in the eastern portion of Menifee, eastern Temecula, Winchester, Hemet, San Jacinto, French Valley, Beaumont, and unincorporated areas of Riverside County. Valley-Wide owns and operates over 80 parks and facilities with 25 of the parks in the City of Menifee. Valley-Wide’s district population is 234,207 and it is continuing to grow, with projections up to 320,000 by 2032, according to the 2020 Valley-Wide Recreation and Park District Update. The City of Menifee makes up 12 percent of the districts overall population. For the purposes of this report, ValleyWide parks were inventoried using aerial imagery and reviewing the 2020 Valley-Wide Recreation and Park District Master Plan Update. For the 2023 Menifee Parks Master Plan, physical fieldwork was not conducted at Valley-Wide park sites and therefore conditions of Valley-Wide amenities were not reported.

Since Menifee’s incorporation, the City has made an effort to unify all of the public parks in its limits. In 2015, the City of Menifee began the process to seek local oversight of Valley-Wide parks within City limits by expanding park maintenance services into Valley-Wide territory on the east side of Menifee and discontinuing Valley-Wide services. In 2016, the City submitted a detachment application to Riverside LAFCO (Local Agency Formation Commission) to unify of all public parks in the City. In 2017, Riverside LAFCO approved the application if the City conducted a tax assessment vote and paid Valley-Wide $500,000. The City appealed, but LAFCO upheld the decision. The City then filed a lawsuit against LAFCO in hopes of voiding the conditions of approval. In 2021, the Riverside County Superior Court decided that LAFCO was within its authority to impose conditions, and the application for detachment had expired. The decision of the court was a setback for the City in seeking oversight over Valley-Wide parks, but the City will continue to work to expand City services to ValleyWide parks and unify those parks into the City parks system.

The existing land use in Menifee consists of primarily residential land uses, mostly single-family housing in the central portions of Menifee. On the outskirts of the City are large tracts of agricultural land uses and vacant open land. The surrounding land use is rapidly changing and evolving due to population growth in the City.


The City of Menifee has over 45 Home Owners Associations (HOA) communities, ranging in size from 11 acres to over 500 acres. Many of these HOA communities contain their own parks and recreation facilities such as playgrounds, pools, sports courts, trails, and private recreation centers. Figure 2-3 shows where these facilities are located along with the number of facilities. The largest HOA communities are Audie Murphy Ranch, Sun City, Heritage Lakes, The Lakes, Canyon Heights, and Oasis Community. HOA parks and facilities are not counted towards the overall City Level of Service (LOS) in the analysis because they are not open to the public, and generally, only HOA residents are permitted to use these facilities.
One of the challenges posed by HOA facilities is the potential for unequal access to parks in various areas throughout the City. This occurs as HOA facilities provide diverse park amenities exclusively to residents of these HOAs, while the overall City


facilities also offer similar features. Furthermore, community park facilities that may be required to be built by the developer tend to be closely associated with the communities they are developing, limiting this benefit to their development. Although these required parks help to offset the demand for parks, the placement of them may not be beneficial to the overall City, especially in older developed communities, like Sun City or rural areas.
An understanding of the facilities offered by these HOAs helps with the overall planning effort. Recommendations for new community park facilities and locations may help inform planning staff to direct developers on the logical placement of additional community parks to help balance these throughout the City. However, an inventory of the various amenities and assets within these HOA facilities was not within the scope of this Master Plan.


Page intentionally left blank
The City of Menifee operates 19 public parks, one dog park, and two community centers, totaling approximately 83 acres of parkland. Valley-Wide Recreation and Park District owns and operates 25 parks, one dog park, and two community centers within Menfiee city limits. Valley-Wide operated parks reside east of Interstate 215 within the City of Menifee. All of these public parks offer ample opportunities for passive and active recreation within the City.
This chapter will take a closer review into the existing park level of service and how level of service can be analyzed in different manners.
Gaining a clear understanding of the existing and projected demographic character of the City is an important component of the planning process. By analyzing population data, trends emerge that can inform decision making and resource allocation strategies for the provision of public parks, recreation amenities, and open spaces. For example, if the demand for soccer fields was steadily on the rise and existing public recreation amenities for soccer were barely meeting existing user demand, then the City may want to consider targeting investments to meet the increasing needs of this growing segment of the population.
Key areas were analyzed to identify current demographic statistics and trends that can impact the planning and provision of public parks and recreation services in Menifee. Community characteristics analyzed and discussed consist of:
» Existing and projected total population
» Age distribution
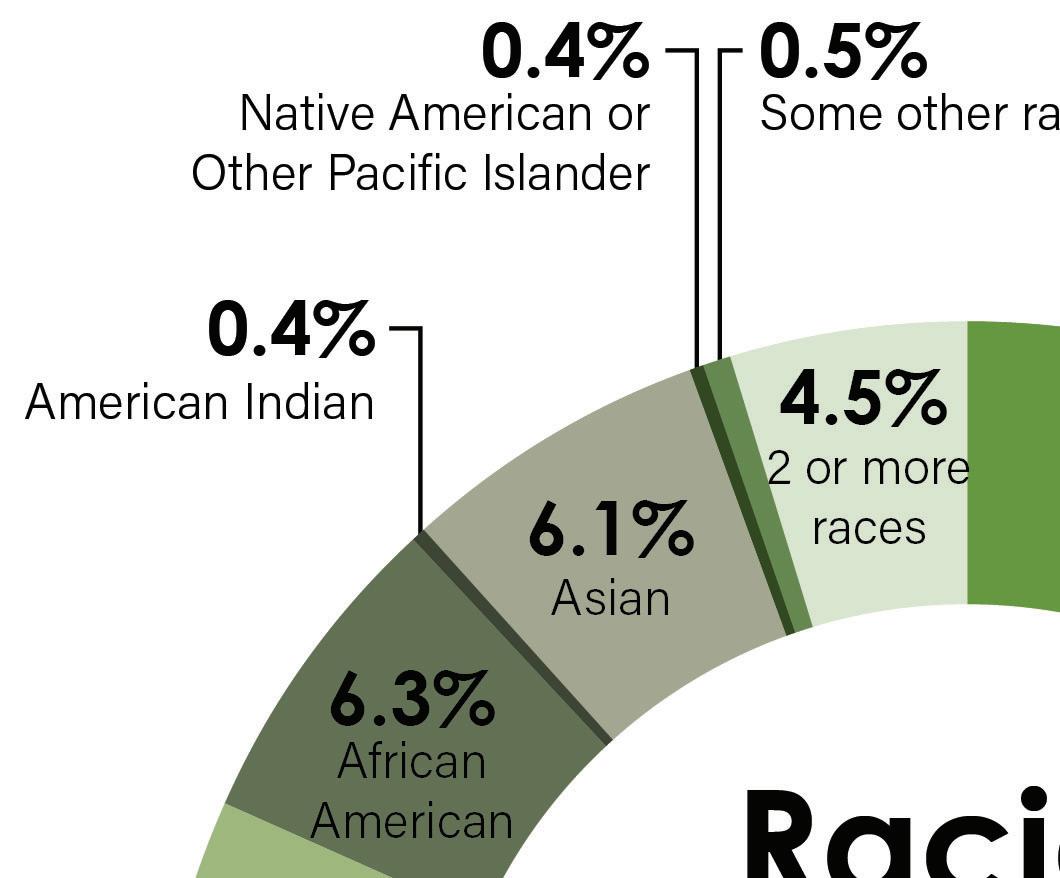
» Racial and ethnic character
» Household information
» Household income


3-2: Demographic Data Summary
106,627 Population
36,526 Housing Units
This demographic profile was completed using the most current data available (as of May 2022) from the U.S. Census Bureau. A summary of demographic highlights is noted in Figure 3-2, followed by a more detailed demographic analysis.
According to the 2020 U.S. Census Bureau latest estimates, the City of Menifee has a total of 106,627 residents and 36,526 housing units. The racial and ethnic make-up in Menifee is 43.9 percent white, 6.1 percent Asian, 6.3 percent Black, 0.4 percent American Indian, 0.4 percent Pacific Islander, 0.5 percent some other race, and 4.5 percent two or more races. About 37.8 percent of the population identifies as Hispanic or Latino.
Key 2022 demographic comparisons with other city, state, and national statistics include:
» The estimated median age of Menifee residents is 36 years, slightly lower than the median age for California (36.5) and lower than the United States (38.5).
» The estimated population under 18 years in Menifee is 26,480 people, which is 24.9 percent of the total population.
» The median household income for Menifee in 2022 is estimated to be $93,000. This is higher than the median household income of $75,235 in California, and much higher than the national median household income of $62,843.
» Menifee’s estimated population was almost evenly split between male (49 percent) and female (51 percent) residents. The populations of California and the United States are also roughly evenly divided between genders.
SCAG projects that from 2020 to 2045, the City’s population will increase by 37.3 percent. But due to all of the new planned development and development under review, the population will likely increase at a much more rapid rate. Taking into account all of the planned development, by 2035 the population is projected to increase to about 124,567.
36.0 Median Age
$93,000 Median Household Income


Source: SCAG Demographic and Growth Forecast, 2020 and Menifee Future Residential Development
Park planning often classifies parks into one of eight possible park types including: Mini Parks, Neighborhood Parks, Community Parks, Recreation Area/Regional Parks, Special Use Facilities, Natural Area/Greenbelts, Linear Parks, and Joint Use Facilities. For this Menifee Parks Master Plan, three grouped existing park types have been used (Table 3-1). The broader park type descriptions have been included to describe a future classification system that can accommodate the plan’s recommendations. Park classifications are generally driven by park use, purpose, and size. The classifications are not grouped by maintenance frequency or the presence of a particular asset. This classification system serves the following purposes:
» It provides a general guideline for future development options. The combination of descriptors for each park type represents what has generally been successful on a certain sized plot of land located in a certain type of physical environment. These guidelines can help to set community expectations for a given site.
» They serve as a basis for policies around appropriate programming in different park types.
» The classifications inform functional planting design standards and other design standards.
The park types should be analyzed both independently and collectively to determine the City’s existing conditions and future requirements.
These are typically small scale developed urban spaces. Usually only a few residential house lots in size or smaller, pocket parks can be tucked into and scattered throughout the urban fabric where they serve the immediate local population. These parks can vary in size and can be slightly larger that two acres. They often offer few amenities including turf, planters, walkways, plazas, play areas for children, and picnic amenities. Pocket Parks typically do not provide restroom facilities or on-site parking. Pocket/Mini Parks generally serve three categories:
1. Downtown destination parks which are signature parks of interest to the broad community.
2. Downtown parks where neighborhood involvement in activities and programming is most appropriate.
3. Small public spaces or beauty spots which are small islands within the urban environment and present opportunities to enhance the City’s character and identity.

Typically these parks serve the surrounding neighborhood for multiple uses. Park development may include play areas, small fields, benches, picnic tables, and improved paths and may include restroom facilities. Geographic range of users is up to one-half-mile.

A Community Park meets the recreational needs of several neighborhoods and may also preserve unique landscapes and open spaces. These parks serve multiple uses and provide recreational amenities and accommodate group activities not provided in neighborhood parks. Community park sites should be accessible by arterial and/or collector streets. The geographic range of users is up to three miles or City-wide if the park contains a recreation complex.

These parks supplement neighborhood and community parks, serving broader City-wide recreation needs. The parks contain various assets, often for active recreation, and are programmed accordingly. Many also have designated natural areas. Restroom facilities and off-street parking are generally provided for users. Geographic range of users is Citywide.
This category refers to stand-alone parks or facilities that are designed to serve one particular use such as a golf course or senior center. These parks may serve a secondary or third use, but the primary use is prioritized with regard to design, maintenance, and funding decisions.

Established for the protection and stewardship of wildlife, habitat, and other natural systems support functions. Some natural areas are accessible for low-impact use. Minimal infrastructure may include access and signage, where it will not adversely impact habitat or natural systems functions. Larger natural areas may have small sections developed to serve a community park function.
Established as an aesthetically-pleasing transportation corridor which includes trails, green streets, and boulevards. Linear parks often provide safe pedestrian routes as well as recreation opportunities. Desired assets include improved path, lighting, and landscaping. Optional assets may include benches, play area, viewpoint, public gathering space, fitness stations/par course and flat grassy area for informal activity.
These parks supplement community parks, serving broader City-wide recreation needs. The parks contain various assets, often for active recreation, and are programmed accordingly. Restroom facilities and parking are generally provided for users. Geographic range of users is City-wide. An additional classification could be considered if the City of Menifee enters into a joint-use agreement with another public agency and funds improvements which allow the City the right to expanded hours of use.
Calle Tomas Play Trail
Sunset Park
Creek View Park
Silver Star Park
La Ladera Park
Spirit Park
E.L. Pete Petersen Park
Mayfield Park
Hidden Hills Park
Lyle Marsh Park
Central Park
Nova Park
John V. Denver Park
Talavera Park
Remington Park
Banner Village Park
Quartz Ranch Park
VALLEY-WIDE RECREATION AND PARK DISTRICT PARKS
Autumn Breeze Park
Brindle Mills Park
Desert Green Park
Grand Vista Park
Pepita Square Park
Menifee South Tot Lot
Mosaic Park
Heritage Heights Park
Discovery Park
El Dorado Park
Eller Park
Heritage Park
Hidden Meadows Park
La Paloma Park
Mahogany Creek Park
McCall Canyon Park
Mira Park
Rolling Hills Park
Lazy Creek Park and Recreation Center
Audie Murphy Ranch
Sports Park
Gale Webb, Kids-R-#1, Action Sports Park
Underwood Park
Centennial Park
Kay Ceniceros Senior Center
Aldergate Park
Heritage Lakes Sports Park
Marion V. Ashley Park and Community Center
Sunrise Park
Lago Vista Sports Park
Wheatfield Park, Menifee Gym and Rec Center
FIGURE 3-4: Existing Park Types and Locations

This map shows the geographic distribution of each park in the City. The parks on the east portion of the city are largely operated by Valley-Wide Recreation and Park District.
The City’s existing park amenities and facilities were inventoried using both data provided by the City and on-site field work. Table 3-2 summarizes these amenities and facilities and compares them with the National Recreation and Park Association (NRPA) guideline service level. The 2020 NRPA Agency Performance Review guidelines were used for this analysis. The numbers are determined by acquiring data from agencies across the country and then averaging them based on population groupings. The calculations are based on the City’s population of 106,627 according to 2022 Census ACS 5-Year Estimates, which places Menifee in the 100,00-250,000 NRPA category.
The NRPA guidelines are advisory, allowing the City to compare itself to others. This also allows the project team to make informed custom decisions that reflect the unique needs of the City in the recommendations section of the Master Plan.
2 Mini Parks 5 Community Parks


Notes: * Parks under construction or under construction at time of fieldwork. Inventory counts based on planned amenities.
** Basketball Courts: one half court = .5, one full court = 1
*** Diamond Fields consists of youth and adult baseball fields, youth and adult softball fields, and multi-use diamond fields.
**** City Multi-purpose fields: soccer fields and football fields Gray lines indicate lighted amenities of the above amenity
Valley-Wide Recreation and Park District’s park amenities and facilities were also inventoried within the City using data provided by the City, aerial imagery, and the 2020 Valley-Wide Recreation and Park District Master Plan Update. Table 3-3 summarizes these amenities and facilities and compares them with the National Recreation and Park Association (NRPA) guideline service level.
Parks within the City of Menifee has:

Each park in the City of Menifee is listed with its existing amenities and their condition. The conditions of each amenity were evaluated using three categories: excellent, good, and poor. Each amenity also has a size associated with it: large, medium, and small. Each amenity was then given a weighted score based on these two factors. All of the amenity scores for each amenity at a park were then added together and then divided by the park acreage to give it an overall rating. This shows what parks may need to add new or updated amenities. For example, even though La Ladera Park has many amenities, some of them scored low due to their condition, reducing the overall score. This shows that some of the amenities at La Ladera Park are
TABLE 3-4: City-wide Park Assessment Scores
in need of upgrades. Generally, the lower the score the more likely the park is in need of updates. The higher the score, the less likely the park amenities will be in need of updates for several years. However, park size does play a factor in the assessment. The overall size of the park can lower the Weighted Per Park Acres and Condition even in a brand new park since most of the acreage is dedicated to larger open spaces such as fields. It is also important to note that the condition of small amenities like benches, bike racks, and trash receptacles although evaluated, are not included in the park amenity tables.
Total # of Amenities ÷ Park Acreage = Amenities per Park Acre
Weighted Amenity Total based on Condition and Size (Condition x Amenity size) ÷ Park Acreage = Weighted per Park Acre and Condition
fieldwork . Inventory
Excellent conditions is assumed at parks under construction.
Calle Tomas Play Trail is a mini-park located within a residential neighborhood off Newport Road, just west of I-215. It is only 0.41 acres and contains just a few amenities of small playground equipment. It is relatively new and therefore received a very high amenity score.

Sunset is a new 1.8 acre mini-park located on the western edge of the City in a neighborhood off Goetz Road. It has a small shaded playground and picnic area.


Creek View Park is a neighborhood park located near Audie Murphy Ranch off Audie Murphy Road. It follows the Salt Creek Trail and contains outdoor fitness equipment. At the very western edge is the Ranch House, the private Audie Murphy Ranch HOA clubhouse, pool, and playground.

Silver Star Park is a small neighborhood park located in the eastern portion of the City within the Audie Murphy Ranch HOA. It has several amenities packed into 3.4 acres. It has a shaded playground, basketball court, picnic shelter, restroom building, a concrete ping pong table, concrete corn hole, two small open fields, and a walking path that connects to the existing HOA paseo network. The paseo has additional outdoor exercise equipment, benches, and picnic tables.


La Ladera Park is located in the western area of the City off La Ladera Road. It has a large unlighted diamond field, four pickleball courts, playground, basketball court, several picnic areas, restroom building, and a walking path with outdoor fitness equipment along the path.

Spirit Park is located on the corner of Newport Road and Berea Road. It is a large neighborhood park with many amenities. It has two basketball courts, three tennis courts, several group picnic shelters, large playground, restrooms, walking path, outdoor fitness equipment, several small open fields and a parking lot.

E.L. Pete Petersen Park is a neighborhood park with several amenities including a basketball court, multi-purpose field, playgrounds, picnic areas, and the only City-owned dog park. It is located on the corner of Murrieta Road and Park City Avenue. The dog park is planned for an update and expansion in the future.


Mayfield Park is located on the corner of Evans Road and Rim Creek Path. It is a neighborhood park with restrooms, a picnic shelter, playground, outdoor fitness equipment, and open field.

Hidden Hills Park is a neighborhood park with several amenities including a multi-purpose field, tennis court, basketball court, picnic areas, playground, and walking paths. The walking paths within the park continue around many different areas of the surrounding residential areas.


Lyle Marsh Park is located off Bradley Road between Newport Road and La Piedra Road, south of Chester W. Morrison Elementary School. It contains a multi-purpose field, inclusive playground, outdoor fitness equipment and several sheltered picnic areas.

Central Park is a neighborhood park with many amenities located near the City-center and is home to numerous city-wide special events with direct access to the Paloma Wash Trail. It has a small amphitheater, a large open field, playground, market kiosks, and a picnic area.


Nova Park is located in the north area of the City, just west of I-215. It has a multi-purpose field where the community can play soccer. It also has a shaded playground and small playground equipment along a walking path.

John V. Denver Park, previously known as Rancho Ramona Park, is a small neighborhood park located near the McCall Boulevard and I-215 interchange. It consists of several amenities including a basketball court, picnic areas, a playground, a horseshoe pit, and a small open field. It is located near a multi-family residential development, providing important access to parks and recreation areas for those households.


Talavera Park is a newly opened small neighborhood park located in the northeast corner of the City off Antelope Road. It has a shaded climbing playground, picnic area, restroom building, small walking loop, and an open field with a baseball backstop.


Remington Park is a newly opened park located in the northeast corner of the City within the new Brookfield neighborhood off Junipero Road, north of Boulder Ridge Elementary. It has many new neighborhood amenities including two pickleball courts, picnic area, large shaded inclusive playground with zip line, concrete corn hole, and outdoor exercise equipment.


Banner Village Park was under construction at the time of this Master Plan but the park amenities will include a splashpad, picnic shelter, basketball court, and parking.


Quartz Ranch Park was under construction at the time of this Master Plan. The amenities at this park will include a lighted multi-purpose field, four pickleball courts, a covered playground, picnic shelter, a restroom, and parking.

Lazy Creek Park is a community park that also has a newly renovated recreation center on site. The park includes two basketball shooting courts, a sand volleyball court, and a playground.

Audie Murphy Ranch Sports Park is located on Newport Road near the Audie Murphy Ranch HOA community in the western portion of the City. It is a community park with many amenities such as a skatepark, a lighted diamond field, a rectangular soccer field, a walking loop, multiple picnic areas, a playground, restrooms, and parking.


Gale Webb, Kids-R-#1, Action Sports Park is one of the newest parks in the City, opened in November 2022. It consists of two pump tracks, a smaller one for beginners and a larger one, as well as three jumplines. It is located in the southern portion of Menifee west of I-215 on the corner of Craig Avenue and Evans Road.


Underwood Park is a new 10-acre community park. It is located on the corner of Rouse Road and Antelope Road in the northeast corner of the City. It has many amenities including a lighted multi-purpose field, shaded all-inclusive playground, exercise areas, basketball court and half court, picnic shelters, walking paths, restrooms, and parking.


Centennial Park is another community park in the City. It contains two lighted diamond fields, a lighted multi-purpose field, basketball courts, playgrounds, and picnic areas. It is located on the corner of Holland Road and Briggs Road. It is the only City-owned park property located in the southeastern part of the City.


Kay Ceniceros Senior Center is centrally located in the same complex as the City of Menifee Community Services Department Headquarters. It also has a small community garden, the only City-owned community garden in the City.

Level of Service (LOS) within the context of park planning is a measurement to evaluate how parks, open spaces, and amenities serve the given community. A LOS analysis is used to benchmark current conditions based on NRPA metrics and other regional metrics for park amenities. LOS is used to help direct future planning efforts based on projected population growth and future park amenities.
LOS describes how a recreation system provides residents access to recreational amenities. It indicates the ability of people to connect with nature and pursue active lifestyles. It can have implications for health and wellness, the local economy, and the quality of life. Furthermore, LOS for a park and recreation system tends to reflect community values. It is often representative of people’s connection to their communities and lifestyles focused on outdoor recreation and healthy living.
TABLE 3-5: Existing Level of Service (2022)
CITY AND VALLEY-WIDE ACTIVE PARKS (MINI + NEIGHBORHOOD + COMMUNITY)
Existing Park Acreage* (Excludes golf courses and HOA parks)
Recommended Adopted Standard per 1,000 Population
Acres per 1,000 Population (2020)2.6
*Golf
and
are private and not open to the general public and therefore not counted towards LOS
A population-based service analysis for Menifee’s park system was performed using NRPA Park Metrics from the 2020 Agency Performance Review Survey. An amenity spreadsheet was produced indicating the amenities that are located in each park. These amenities were then totaled and listed under each park. The Master Plan inventoried the City’s existing recreation amenities and developed a comprehensive matrix. Table 3-6 summarizes these amenities and compares them with the National
Recreation and Park Association (NRPA) guideline service level. It was also based on the recommended Needs Assessment standards for the City of Menifee showing the population per one facility. The calculations are based on the current population level in the City of Menifee of 106,627 according to the 2020 Census American Community Survey (ACS) 5-Year Estimates. This table also shows the existing park and sports amenities available at each park. Because private parks and JUA/MOU may not be available to the public at all times, school and private amenities are not included in LOS analysis. According to the recommended standards, the City currently meets the needs of many amenities including recreation centers, senior centers, basketball courts, diamond fields, playgrounds, and more but is deficient in some of the sports (multi-purpose field, tennis, and volleyball), swimming pools, and community centers.
LOS is an appropriate metric to show of where deficits may be. However, this is not the only measure to determine LOS of park amenities. For instance, The NRPA metrics do not reflect regional and local trends in Southern California such as futsal, handball, pelota mixteca, and other adventure type sports such as obstacle courses, climbing walls, rope courses, bouldering, and adventure playgrounds. As such, an additional metric should be applied to capture the community’s priorities, needs, and impressions on the current park system. This should be used in addition to the population-based level of service analysis that can provide a good indication of the future park needs. The needs will be further discussed in other chapters of the report.
According to the park inventory and the NRPA guidelines (Table 3-6). The City currently meets the LOS needs for the following categories:
» Senior centers
» Performance amphitheaters
» Basketball courts
» Diamond fields and lighted diamond fields
» Dog parks
» Picnic areas
» Playgrounds (both for tot lots and ages 6-12)
» Skate parks/bike parks
» Walking paths
» Exercise areas
» Restroom buildings
Although the following categories are highlighted in red, they are within a small margin and can be considered as meeting the NRPA guidelines:
» Recreation centers
» Community centers
» Teen centers
» Nature centers
» Community gardens
The City does not meet the following categories based on the NRPA guidelines using averages for the city size of Menifee, again these guidelines do not take into account community priorities and local trends:
» Multi-purpose fields and lighted multi-purpose fields
» Swimming pools
» Splashpads/spraygrounds
» Tennis courts
» Pickleball courts and lighted pickleball courts
» Volleyball courts
TABLE 3-6: Level of Service Current Population (NRPA Averages)
* Indicates a shared amenity with seasonal use - point included in single purpose facilities
As a part of the existing conditions analysis, the team performed a comparative analysis of standards from comparable sized Southern California cities. This effort compared the City of Menifee to four other cities population. It compared standards for Menifee to the cities of Murrieta, Perris, Oceanside, and Ontario. Although Oceanside and Ontario have larger populations, they still fall under the NRPA amenity metrics group of cities with 100,000 to 250,000 population. This effort was completed to add additional analysis to the LOS averages provided by NRPA. In doing so, it compares the City on a regional level, rather than a national level. Table 3-7 compares the five cities (at a high level) by looking at population, number of park sites, total park acres, parks per 1,000 population, total number of park amenities, and total number of park amenities per population.
The comparative analysis also looks at the number of existing amenities in other cities and compares them to the NRPA averages to create an overall metric that combines the averages of each city, shown on Table 3-8. This helps to understand where the City of Menifee sits regionally in terms of amenity quantity. For example, the NRPA analysis shows that Menifee is in a deficit of tennis courts, but when you compare it regionally, it is above average by 4.2 courts. Please note that rectangular soccer field’s are included in this table for the other cities although the City of Menifee soccer field’s fall under the multi-purpose field category.

The City of Menifee is above the regional average for several amenities including:
» Recreation centers
» Basketball courts
» Diamond fields
» Dog parks
» Group picnic areas (12+ people)
» Playgrounds
» Tennis courts
» Volleyball courts
The City is below the regional average for the following amenities:
» Community centers
» Community gardens
» Skate parks/bike parks
» Swimming pools
The City of Menifee has many schools within the City. It has two elementary school districts and one high school district. There are 11 elementary schools, four middle schools and two high schools. Menifee has a relatively young population, 26.7 percent of residents are under the age of 20 (Southern California Association of Governments). Schools within close proximity to public parks provide many recreational opportunities to children and teens.
The City of Menifee is also served by Mt. San Jacinto College, Perris Union High School District, and privately operated Santa Rosa Academy, which the City has a facility-use agreement with the school for the use of its amenities and facilities.
The City coordinates with school districts to provide the best use of those public and private resources to meet recreation demands of the community. Currently, the City only has one facility-use agreement in place at Santa Rosa Academy. The City should continue to create partnerships with school districts and other various organizations that lead to agreements to meet the demands of the community.
Current recreation amenities at school sites within the City of Menifee include:
Mt. San Jacinto College—Joint Use Agreement (JUA) (timing is to be determined) will include:
» 5,000-seat stadium
» Parking lot
» Classrooms
» Courtyard
Amenities not a part of future JUA include:
» 1 softball field
» 1 multi-purpose field
» Sand volleyball courts

Perris Union High School District
Heritage High School
» Swimming pool
» 3 softball fields
» 2 baseball fields
» 1 football field—lighted/synthetic
» 3 soccer fields—overlaid on softball/baseball fields
» 6 tennis courts
Paloma Valley High School
» Swimming pool
» 2 softball fields
» 2 baseball fields
» 1 football field—lighted/synthetic
» 8 tennis courts
Liberty High School (Winchester, CA)
» Football/soccer stadium
» Baseball fields
» Softball fields
» Swimming pool
» Tennis courts
» Basketball courts
Romoland School District
Ethan Chase Middle School—Adjacent to Discovery Park
» 1 multi-use field
Santa Rosa Academy—Facility-use Agreement (as needed), includes:
» Gymnasium and indoor facility space
» 1 diamond field
» 1 multi-use field
» 3 outdoor basketball courts

FIGURE 3-6: Menifee Schools

Romoland Elementary
Heritage High Harvest Valley Elementary
Boulder Ridge Elementary Hans Christensen Middle
Ethan A Chase Middle Mesa View Elementary
Quail Valley Elementary Ridgemoor Elementary
Evans Ranch Elementary
Menifee Valley Middle
Chester W. Morrison Elementary Paloma Valley High
Santa Rosa Academy
Bell Mountain Middle Callie Kirk Patrick Elementary Freedom Crest Elementary
Southshore Elementary
Mt. San Jacinto College
High School
Lake Perris is located in Riverside County between the City of Moreno Valley and Perris. It contains over 8,000 acres and includes amenities such as campgrounds, group camp, a hunting zone, picnic areas, two swimming beaches, an Indian museum, an equestrian camp, and equestrian/multi-use trails. It is the southernmost State Water Project Facility and the southern terminus of the California Aqueduct 19 miles from Menifee City Hall.

Diamond Valley Lake is adjacent to the Diamond Valley Reservoir and is run by the Metropolitan Water District. It contains several large sized sport fields, a major aquatic center and one educational based museum. A RV park is also being added in the near future. The area also includes a large number of hiking and equestrian trails open to the public. The lake is open to fishing and boating activities, although swimming in the lake is not allowed.

Lake Elsinore is located south of Menifee on 3,300 acres. It contains the popular Launch Point campgrounds and opportunities for boating, fishing, camping, wakeboarding, windsurfing, and many other water activities. It is also a major center for sky-diving and hang-gliding due to the warm air that blows from the Ortega Mountains just west of the lake 10-miles from Menifee City Hall.

Kabian Park is managed by Riverside County Regional Park and Open-Space District and is located just north of Quail Valley northwest of the City boundary 7.5 miles from Menifee City Hall. It is mainly passive open space with 640 acres of open space, hiking, and equestrian trails. There is a small park area with a picnic shelter and a small playground.

The Salt Creek Trail is a project completed by Riverside County identified in the County’s General plan since the 1990s. The four-mile segment that runs west to east through the City of Menifee was completed in late 2020. It is a 12-foot wide multi-use path. The Salt Creek Trail is an ongoing project and the County hopes to expand the trail to connect other communities in Riverside County.
The Menifee Community Center located at Wheatfield Park is a small and out-dated facility. It offers a limited number of programs including dance, jazzercise, yoga, martial arts, and art classes. Valley-Wide also offers programming based at Wheatfield Park and at the Menifee Gym, the only gym in the City. It is a joint-use facility located at Bell Mountain Middle School. Programming includes open gym, youth volleyball and basketball, men’s softball and tennis lessons at the park.
Marion V. Ashley Community Center is a 25,000 square foot community center. It offers a variety of programs and classes including Zumba, martial arts classes, youth and adult sports classes including basketball, volleyball and soccer clinics, gymnastics, dodgeball, and mom and me classes. It also has rentable space for parties and events. There is a Child Development Center serving children 18 months to 5 years of age. Care is provided for a partial day or full day, and is private and state subsidized.

Drop Zone Water Park opened in 2014 in Perris, CA, a few miles north of the City’s northern boundary. This was a $24 million Riverside County project that is operated privately but the City of Menifee contributed to the development of this waterpark. It is located on 12 acres off Trumble Road and it operates in the summer from mid-May to mid-September. While this facility is not located within the City of Menifee, it helps to fulfill a missing gap in aquatic facilities north of the City.
Amenities at Drop Zone include:
» A 50-meter pool with diving boards
» Two large water slides
» Water play structures for toddlers
» The Meridian Springs Pool, utilized for beginner swim lessons
» A “lazy river”
» Locker rooms
» The “Flow Rider” which allows guests to body surf and stand-up surf
» Beach volleyball
» Snack bar and covered eating area

In 2012, the City of Perris opened the Field of Dreams. The $25 million facility features four major league baseball field replicas of Anaheim Stadium, Dodger Stadium, Fenway Park, and Yankee Stadium. This park also contains an indoor soccer pavilion, restaurant, batting cages, and two playgrounds. It is located directly south of the Drop Zone Water Park, 9 miles from Menifee City Hall.

The City has existing trails and bike facilities as identified in the City of Menifee Active Transportation Plan, completed in December 2020. Some of these include soft surface, paved, or a combination of different surface types. These trails help connect residential areas to parks. Audie Murphy Ranch is a good example of an area that has trails that connect residential areas to Audie Murphy Ranch Park.
The City also has a small number of bicycle facilities throughout the community. Bicycle facilities like multi-use paths (Class I), bike lanes (Class II), and bike routes (Class III) can provide residents with alternative forms of transportation to parks and other facility types. Riding bicycles to parks and providing the option can promote a more active lifestyle.
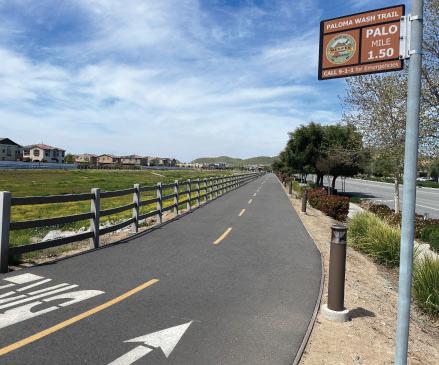
The Salt Creek Trail was described in the previous section. The Salt Creek Trail is a critical trail connection that assists in connecting the City from east to west. This multi-use path provides an alternative form of transportation to parks and provides the City with future pedestrian and bike connections to parks and other facilities. The Paloma Wash Trail is a Class I: multi-use path just west of Interstate 215 that runs north to south for the freeway for approximately one mile on both sides of the wash. This trail currently has a connection to Central Park.
A Geographic Distribution Analysis (GDA) was performed on the community parks, neighborhood parks, and recreation centers. A GDA examines the walktime, biketime, and drivetime to these parks as determined by using a Geographical Information System (GIS) based parkshed analysis. Results from this analysis are displayed in Figure 3-8.
The park’s GDA analysis takes into account the percentage of the population served by neighborhood, community, and regional parks. Instead of using a traditional 1/2-mile circle from parks that only considers a direct distance, the method deployed takes into account actual walking, driving, or biking distances that considers walking, biking and driving routes someone would use to get to these parks. This actual network method is more accurate since it puts attention on the need to improve the local network to enhance access to parks. Standard circles are highly inaccurate in determining access for areas that have significant barriers such as freeways, highways, rivers, rail lines or steep topography. The GDA is important since it can highlight the areas that may have greater park needs.
For each neighborhood park, community park, community center, special use park, and regional park, a GIS analysis was completed that generated polygons representing a 1/2-mile walkshed or 15-minute walkshed, given a walking speed of 2.5 mph (slowed to 2 mph to take into account street crossings, some with signals). The 2-mile driveshed or 5-minute driveshed assumed posted speed limits which tends to average 35 mph with it slowing to 30 mph average with signals, loading, finding parking, and unloading. Resulting walkshed polygons were superimposed on the City base map to see which regions were well covered by park access and to estimate the number of residents served by park type.

There are two main parksheds used to analyze the service area a park provides to the City: walkshed and driveshed. For each park type, a Geographical Information System (GIS) analysis generated a polygon representing a ½-mile walkshed or 15-minute walkshed and a 2-mile driveshed or 5-minute driveshed. The resulting service catchment areas were overlaid on the City base map to see which regions were well covered by park access and to estimate the number of residents served by each park type. Table 3-9 is a summary of the parkshed assumptions. Populations within a ½-mile walkshed (which is equivelant to a 15 minute walk) are typically useful for determining the parkshed for mini parks and neighborhood parks. Whereas, populations within a 2-mile driveshed or 5-minute driveshed are useful for determining the parkshed for community parks/ centers and regional parks. Figure 3-8 displays a 1/2-mile parkshed (15 minute walktime to the parks) and associated residential land use in Menifee to show which areas of Menifee have convenient access to parks.
The series of maps on pages 56-62 show the park travelsheds of parks with selected amenities and census age data. These maps show how certain amenities are distributed throughout the City geographically and associated local select age groups. Relevant age related amenities include playgrounds, sports courts (basketball, tennis, sand volleyball, and pickleball), diamond fields, multi-purpose fields, and community centers.
TABLE 3-9: Categorized Park Level of Service

FIGURE 3-8: 1/2 and 2-Mile Travelsheds with Existing Residential Use

Valley-Wide Parks
Valley-Wide Parks
Areas with major gaps for Playgrounds

This map shows a 1/2-mile walkshed to parks with playgrounds for both city parks (green) and Valley-Wide parks (purple). It also overlays Census tract data to show populations under 18 years of age. There is a large gap of playgrounds in Quail Valley where there is a large population of children under 18.
Valley-Wide Parks
Valley-Wide Parks
Areas with major gaps for sports courts
FIGURE 3-10: Existing Parks with Sport Courts

This map shows a 1/2-mile walkshed to parks with sport courts (Basketball, Tennis, Pickleball, and Volleyball). The overlaid census tract data shows populations under 18 years of age. It is important to note that other age groups utilize sport courts, but under 18 year olds are less likely to have reliable transportation to these facilities like older age groups may have. Making it more critical for them to be within walking distance to these facilities. There are many portions in the city where service is not reached shown in the blue circle gaps.
Areas with major gaps for multi-purpose fields

Valley-Wide Parks
Valley-Wide Parks
This map shows a 1/2-mile walkshed and a 2-mile driveshed to existing multi-purpose fields. Multi-purpose fields are considered a community amenity because they can serve a greater population, therefore a 2-mile driveshed is shown in addition to the 1/2-mile walkshed. Multi-purpose fields are overall well-distributed throughout the city with service not reaching the northwest portion and central portions of the City.
Areas with major gaps for diamond fields
Valley-Wide Parks
Valley-Wide Parks
Valley-Wide Parks
FIGURE 3-12: Existing Diamond Fields

This map shows a 1/2-mile walkshed and a 2-mile driveshed to existing diamond fields. Diamond Fields are considered a community amenity because they can serve a greater population, therefore a 2-mile driveshed is shown in addition to the 1/2-mile walkshed.
Areas with major gaps for community centers

Valley-Wide
Valley-Wide
Valley-Wide
This map shows a 1/2-mile walkshed and a 2-mile driveshed to existing Community and Senior Centers. Lazy Creek Recreation Center and Kay Ceniceros Senior Center provides service to the central portion of Menifee. Wheatfield Park Community Center provides service to the southeast portion of Menifee and Marion V. Ashley Community Center provides service to the north east portions. There are missing gaps in the northwest and southern portions of Menifee.
The City of Menifee currently provides a wide variety of recreation classes and programs through their facilities. The City seeks to make programs available to all age groups throughout the year. Program locations include Lazy Creek Recreation Center, Kay Ceniceros Senior Center, as well as online programs.
“Menifee Matters” is a Community News and Activity Guide that is published quarterly to catalog and communicate classes and programs for the coming months. This magazine also highlights other services and programs offered by the City. This guide provides the following categories for recreational programs:
» Toddlers (Ages 3-5)
» Tiny Tots (Ages 2-5)
» Youth (Ages 6-12)
» Teens (Ages 13-17)
» Adults (Ages 18+)
» 55 and Better
» Facility Rentals (Athletic Fields and Parks)
» Adopt-a-Park/Trail Program (Ranger Services)
The City utilizes “DaySmart” as its registration software for the programs offered in these areas, however, these are then categorized by Location or by League. According to attendance data provided by this system, 941 classes were programmed in the 2021-2022 program year.
In the 2021-2022 program year, the highest programmed classes were (in order of number of classes): Senior Soul Line Dance (997), Taekwondo (787), Texas Holdem (780), Fitness (762), Ballet 6-9 years (732), Rec N Trek - Middle School Lunch Program (648), Tiny Tots and Little Learners (480), Tai’Chi (460), Pinocchole (451), Bidwhist (387), Be Mighty/Mighty Me Program (381), Black Jack (364), Dominoes (349), Bridge (338), and Quilting (312). The large increase in number of registrants from the previous program yearis presumed to be due to the COVID-19 pandemic.
In the 2021-2022, program year, the City of Menifee had:
941
226,035 programs offered
total registered participants (programs, events, and field reservation participants)


According to attendance reports, a total of 941 programs requiring registration were offered by the City and a total of 226,035 registrants in the 20212022 program year. This number includes estimated event attendees, field reservation participants, and program participants from data provided by City staff. The top 15 activities by class number for the 2020-2021 are shown in table 3-10. The top three activities with the highest number of registrants were, Senior Soul Line Dance with 997 registrants, Taekwondo with 787 registrants, and Texas Holdem with 780 registrants. Other classes with high class numbers were Fitness, Ballet 6-9 years, and Rec and Trek - Middle School Lunch Program.
TABLE 3-10: Top Fifteen Activities Totals by Registrant Numbers (2021-2022)
Senior Soul Line Dance997
Taekwondo787
Texas Hold ‘Em780
Ballet 6-9 years732
Rec N Trek - Middle School Lunch Program 648 Tiny Tots and Little Learners480
Attendance data from 2022-2023 programs so far in the program year was also reviewed for activities with the most registrations. The highest attendance-specific programs were Texas Holdem, Fitness, Tiny Tots, and Black Jack. The top fifteen activities by registration count are summarized in table 3-11.
Tables 3-10 and 3-11 do not include major events such as the Christmas Tree Lighting or Fall Festival, as well as excluding the Senior Lunch Program and Senior Food Box Programs, all of which have significant response by residents.
TABLE 3-11: Top Fifteen Programs Totals by Registrant Numbers (2022-2023, as of March 2023)
Texas Hold ‘Em688 Fitness564
Tiny Tots Program561 Black Jack538 Tai Chi524 Movies in the Park (7/22)500 Pinochle416 Flag Football408 Fall Festival Booth400
Taekwondo Jrs365 Youth Basketball342 Samba312
Thanksgiving Meals (11/24)300


A comparative assessment was made of the programs offered by the City of Menifee Community Services Department (Department) against those offered by comparative communities and districts in Southern California. For the purposes of the program offering assessment, the following organizations were utilized as comparatives: Riverside, Murrieta, Lake Elsinore, Valley-Wide Recreation and Park District, Corona, Perris, and Temecula.
In 2022, the NRPA published an agency performance review that documents programming offered by parks and recreation agencies across the country. This chart gives a good benchmark against which to review current programming. The results of the review included determining the percent of agencies that perform specific types of programs, the following were those that were 70 percent or higher:
» Themed special events (offered by 90 percent of agencies)
» Social recreation events (88 percent)
» Team sports (87 percent)
» Fitness enhancement classes (82 percent)
» Health and wellness education (80 percent)
» Individual sports (76 percent)
» Safety training (72 percent)
» Racquet sports (71 percent)
» Aquatics (70 percent)
The only program option listed in these that is not currently offered by the City is aquatic programming. The safety training was included due to the Online Driver’s Ed program currently being offered by Menifee.
The following table represents the top 25 programs based on attendance in the two years’ worth of data provided by the City. These programs are listed based on class registration data. The most programmed classes focus on Horse Riding, Fitness, Foreign Language Arts, Martial Arts, Dance, Art, and Music.
TABLE 3-12: Program Offerings from Southern California Recreation and Parks Organizations
The primary difference between Menifee, NRPA Standards (national averages), and findings from comparative cities is the lack of aquatics programs in Menifee, due to the lack of public aquatic facilities. This is one of the most desired programs identified in the survey. These programs are currently only available through the Valley-Wide Recreation and Park District at their Aquatic Center in Hemet. It was also discussed with City staff that there is a significant desire for these types of programs to be provided in or around the City.
Drop Zone Waterpark in Perris provides recreational amenities for aquatics and was intended to serve Menifee residents as the City contributed funds to the development of the park. The City provides field trips to this facility as a program.
Temecula, Lake Elsinore, and Corona utilize JUA’s and Facility-use Agreements to provide aquatics programming. Lake Elsinore uses the pool at Lakewood High School and Corona partners with the Corona-Norco Family YMCA for aquatics programming. Temecula has one City-owned public pool but they also have a JUA with the local elementary school for their pool to use for swim lessons.
Performing arts programs and theatre troupes are not very prevalent in the area, and those available are typically not publicly programmed. Murrieta is home to a performing arts academy that has theatre programs. In Hemet, a troupe called the Ramona Hillside Players provides theatre programming through a private facility. Temecula has a Community Theatre group that is sponsored by the local government and operates in their theatre building. These programs require an acceptable facility to implement and a theatre with appropriate amenities to showcase performances.

Menifee has budgeted approximately $4.37 million for recreational activities, which translates to $41.08 per capita. The City’s primary source of revenues for Community Services are:
User Fees: These are fees charged by the department for specific classes, programs, camps, and rentals offered within the City. These generally help to fund employees, contract instructors, and basic program materials and supplies.
Impact Fees: These are fees charged to new or major development. It can help pay for parkland acquisition (Quimby Fees) and/or for development of new parks to service new population that is generated by the development.
Developer Agreements: Similar to Impact Fees, the City can work with specific large residential or mixed use developments to identify specific parks needs that can be addressed directly by the developer. The developer would then agree to pay the initial upfront costs for recreation needs, but ongoing operational maintenance would be the responsibility of the City.
CFDs/CSDs: The City has several different Community Facility Districts or Community Service Districts. This is a specialized limited funding source, which helps pay for initial and ongoing costs for recreation needs based upon a specific assessment amount. This funding source is specifically assessed to residents of a specific geographic area and is only applicable on recreation and parks needs within that geographic area.
The City passed a general “Quality of Life” revenue in 2016. The monies from these taxes can be used for general city purposes including Parks and Recreation. These revenues can be used for annual operational expenses, as well as one-time capital needs.
Other Tax Revenue: This refers to property and sales tax revenue (other than Quality of Life”) that is used to supplement funding that is not covered by the items aforementioned. It can be used for operations, staffing, and infrastructure as needed.
Grants, Sponsorships, and Donations: This refers to grant-funding, sponsorships, or direct donations provided to the Department to help fund specific programs or activities. These are not consistent annual streams, but typically more program or activity-generated revenue streams.
Together these revenue streams help fund the overall department. Figure 3-14 shows by major service area the types of revenue streams that can help fund those activities:
FIGURE 3-14: Parks and Programming Revenue Streams
» Classes
PRIMARILY FUNDED BY USER FEES
MIXTURE OF USER FEES, TAXES, AND OTHER SOURCES
» Rentals
» Potential Golf
» Potential Aquatics
PRIMARILY FUNDED BY TAX REVENUES
» Youth programs
» Sports (adult and youth)
» Senior activities
» Childcare/after school
» Park/facility maintenance
» Park/recreation administration
» City-wide indirect support
As figure 3-14 indicates, more specific functional areas such as contracted classes or aquatics can generally be user fee funded, whereas more community service-based programs such as youth activities, senior services, etc. are a mix.
Table 3-14 shows by current programmatic area for fiscal year 2023 for the City, the annual surplus/(deficit) and the resulting cost recovery percentages.
Menifee is generally within the typical cost recovery range for most of its programs, except for classes and rentals. Classes are at a cost recovery of 45 percent (direct only) and rentals are at a cost recovery of 21 percent (direct only) is higher than the typical range of 20 percent.
In addition to user fees, the deficits in these programs are bridged through support from taxes and CSDs/CFDs. However, the funding for CSDs and CFDs can only be utilized within the geographic boundaries of the district.
In addition to annual operating needs, the Community Services Department has a robust capital program, with needs for building new facilities, and expanding/improving existing facilities. These capital needs can be funded through Development Impact Fees, Developer Agreements, and new CFDs/ CSDs. The City’s current Development Impact Fee program is city-wide and not geographic specific. Therefore, new development that pays those fees
can be used to fund projects throughout the City. The City completed a nexus analysis in 2022, for implementation in July 2023. Through this nexus analysis, the City was able to increase its impact fees to help offset the future facility needs for the community.
Unlike the impact fees, the Developer Agreement and CFDs/CSDs are more project or geographic specific. The Developer Agreement may result in a developer opting to create a park or recreational facilities in their development in lieu of paying development impact fees. The developer agreement typically only covers the infrastructure costs, not the ongoing maintenance costs. The Community Facility District (CFD) or Community Service District (CSD) can help pay for both initial infrastructure costs as well as ongoing maintenance and operations of those facilities within the area.
Taxes and grants, along with sponsorships and donations help fund the gaps needed for both operations and capital projects. While tax revenue is typically not restricted, grants and sponsorships, along with donations, can be specific to programs and/or specific activity types.
1 Direct costs refer to budgeted costs for that program.
2 Indirect costs represent City-wide administration support, Recreation Administration, and Park Maintenance support costs.
Since the provision of public parks and recreation services can be influenced by demographic preferences, the Master Plan process identified local and national recreation trends that help define what Menifee residents are seeking. This section reviews local and national recreation trends relative to the City’s demographic and identified interests. The current trends impacting City services include:
» A focus on walking, hiking, and camping in an outdoor setting
» Participation in youth activities and sports teams
» Swimming and aquatic-based activities
» Recreation activities and programs for diverse age-based generations
The City can adapt its park and program requirements by learning from these new shifts in participation in outdoor recreation, sports, and cultural programs.
According to the Sports and Fitness Industry Association (SFIA) FIA 2022 Topline Participation Report, American participation in recreational activities grew significantly in 2021, likely due to the reopening of recreational facilities and programs since the start of the COVID-19 pandemic in early 2020. In 2021 and 2022, inactivity levels declined, decreasing from 0.7 percent from 2020, inactivity is the lowest it has ever been. Activity has increased 7.8 percent since 2016, this is 16.8 million more people participating in recreational activities in a fiveyear period.
Lower activity levels in this time period were largely due to lower participation levels in the younger age groups. The 18-24 and 25-34 age groups have lower activity levels, as well as the youth age groups of 6-12 and 13-17.
Water sports saw the largest increase with participation growing by 2.3 percent, followed by outdoor sports with a 2.2 percent increase. Team sports saw a 1.8 percent increase, but overall participation in team sports is still lower in 2021 than before the start of the pandemic. Pickleball and yoga are among the fastest growing activities in a two year period since the start of the pandemic. Pickleball grew 39 percent and yoga grew by 12.8 percent in the last two years. Table 3-15 shows the 5-year Average Annual Growth of Team Sports nationwide.
TABLE 3-15: Nationwide Team Sport Participation Trends
Source: SFIA 2022 Topline Report
According to the 2022 SFIA Topline Report, team sport participation is continuing to grow following the pandemic. According to the ESRI Business Analyst, it is estimated that 39 percent of all team sport participants in Menifee participate in swimming activities, followed by 17 percent participating in basketball. Figure 3-15 shows estimated team sports participation in the City of Menifee. Swimming is estimated to be the highest participated sport activity in the City. Although the City does not current own a pool facility, residents are likely fulfilling swimming needs at school facilities, private facilities, HOA pools, or outside the City. This data uses national propensities applied to local demographic composition to estimate the relative likelihood of adults in the specified trade area to exhibit certain consumer behavior.
According to the SFIA, Yoga, treadmill use, dance, step, other choreographed exercise, dumbbells/ hand weights, kettlebells, and Pilates training are among the fasting growing recreational activities. All had higher participation numbers compared to 2019.
Team sports participation numbers still are lower than before the start of the pandemic in 2019, but have rebounded slightly since 2020. Participation in fast-pitch softball, swimming on a team, court volleyball, gymnastics, and cheerleading have all increased from 2020. Some team sports are growing in popularity. Basketball, tackle football, outdoor soccer, and swimming on a team had more participation numbers than in 2019.
Nationally, aquatic exercise still has low participation rates compared to 2019 in most age groups. This may be due to temporary fitness and swimming pool closures. The 65+ age group has the highest participation numbers of any other age group.
Figure 3-16 shows recreational activity participation in Menifee from ESRI Business Analyst. There are several differences between national trends in recreation and actual participation in Menifee. Walking is the by far the most popular activity, followed by swimming, hiking, and weight-lifting.
FIGURE 3-15: Estimated Sport Participation in Menifee


Source: ESRI Business Analyst

FIGURE 3-16: Estimated Recreational Activity Participation In Menifee, CA


Source: ESRI Business Analyst
Activity participation and preferences tend to vary based on several demographic factors, but can also differ based on generational preferences. Figure 3-17 explains each generation and page 70 shows each generation’s recreational activity preferences and how it has changed since the pandemic.
Enjoying retirement, they are looking for opportunities in fitness, sports, outdoor activities, cultural events, and other activities that suit their lifestyles. When programming for this age group, a customized experience catering to the need for self fulfilment, healthy pleasure, nostalgic youthfulness, and individual escapes is important.
Tech-savvy, socially conscious, and achievement-driven with more flexible ideas about balancing wealth, work, and play. They generally prefer different park amenities and recreational programs from their counterparts in the Baby Boomer generation.
Children of Millennials will have no fear of technology. Every effort to accommodate this generation with high quality, state of the art technology in facilities and with programs will be necessary to reach this group.
FIGURE 3-17: Generations


Began life in difficult conditions, including the Great Depression, World War II, and economic and political uncertainty. The youngest have reached 75 years of age and can be greatly assisted by the social interaction that takes place at senior centers or within senior programs.
Are in the peak of their careers, raising families, and growing their connections within the community. Programming for this age group may revolve around adult sport leagues and outdoor entertainment such as music and arts events.
As of the 2010 Census, Generation Z forms about a quarter of the U.S. population, nearly half of the youth population is ethnically diverse.
According to the 2022 SFIA Topline Participation Report, fitness sports is the most popular recreational activity category by most generations, with the exception of Generation Z. Gen Z’s most popular recreational category is outdoor sports in 2021 with 60.8 percent participation. Team sports are also very popular among Gen Z with 55.8 percent participation. Individual sports are popular among Gen Z with 44.0 percent participation and Millennial with 41.3 percent participation. Sports categories with the lowest participation are racquet sports, water sports, and winter sports.
Overall participation among the generations in the last three years has change due to the COVID-19 pandemic. But the largest changed was that Boomers have increased their participation in all categories compared to other generations.
Gen X participation decreased across all sport categories likely due to this generation returning back to work as vaccines became widely available and testing for COVID-19 became more accessible.
Millennials largely maintained the same activity levels in 2021, except for winter sport participation declining.


Source: SFIA Topline Participation Report 2022

A major component of the Master Plan is to develop an outreach strategy that is an engaging collaborative process with the community, stakeholders, and City staff. The outreach strategy developed for this project explored various methods to engage the community through a series of workshops, surveys, stakeholder interviews, focus/user groups meetings, and online engagement through the City’s website.
The target audience of the outreach strategy was anyone who lives, works, or plays within the City of Menifee. Additional emphasis was placed on under-served communities that disproportionately lack easy and comfortable access to parks, open space, and other recreation facilities. The team also used the City’s database of previous resident and stakeholder involvement to maximize outreach.
The primary community engagement strategies for this plan were:
» Project branding
» City staff meetings
» Statistically-valid survey
» Ten stakeholder/focus group interviews
» Three community workshops


Total Completed Surveys 353 Invite Surveys Complete

11 Community Workshops Stakeholder/Focus Group Meetings 807
3


293 Open Link Surveys Complete


161 Event Surveys Complete

The Master Plan’s outreach strategy sought to involve a list of key stakeholders and focus groups to gather information from a broad list of community members, including:
» Community Partners
» City Council
» City Department Heads and Directors
» Planning and Recreation Commission
» Senior Advisory Committee
» Sports Users (focus group)
» Quail Valley (focus group)
» Oasis HOA
» Sun City Civic Association
» Youth Leaders of Menifee
Stakeholder and focus group interviews were conducted in-person during the 2022 summer. The goal of these interviews were to gather input on needs and desires of these community groups. This input, in combination with other community input from the survey and workshops, was used to guide recommendations in Chapter 6 of the document.
A series of questions were asked during each of the stakeholder meetings and some of the collective themes and responses included:
Question 1: What are the key recreation values in the community that should be considered while developing the Parks Master Plan?
» A need for multi-generational parks.
» Having amenities and activities for children, teens, adults, and seniors is important.
Question 2: What would be the top three outcomes you would like to see from this planning process?
» Improvements and infill at already existing parks within the City.
» Additional aquatic facilities and programs (outside of HOAs) and better promotion of Drop Zone
» The need for a regional sports park.
Question 3: What do you feel is the role of the City in providing programs in addition to recreation facilities?
» Keeping costs down so they can work with the organizations and paperwork minimized.
Question 4: What should the collective vision of the City be and how can your group help achieve that vision?
Short-term vision (0-5 years):
» Add joint-use agreements (JUA’s) with school districts to allow the community to use school facilities when they are not in use, such as aquatic facilities.
Mid-term vision (5-10 years):
» A new park or recreation facility in Quail Valley and Sun City.
Long-term vision (10+ years):
» The need for a regional trail system and connectivity between parks.
Question 5: What groups in the community are currently receiving the most benefits from Menifee’s recreational programs?
» There are many youth programs but there could be additional programs and facilities to support them like additional lighted-multi-purpose fields and lighted diamond fields.
Question 6: What groups (e.g., age, socioeconomic, sporting focus groups, etc.) could receive more support from the parks master plan?
» City needs have outgrown the capacity of the Kay Ceniceros Senior Center. Kay Ceniceros Senior Center is too small.
» A strong desire for additional indoor facilities like community centers and recreation centers to support programs and events. As well as a need for a teen/youth center and an additional senior center.
Question 7: Should the City continue their pursuit in acquiring, operating, and maintaining all of the Valley-Wide parks that exist within the City of Menifee?
» Keep pursuing bringing Valley-Wide parks into the City park system.
Reoccurring Themes from Stakeholders and Focus Groups:

Desire to combine Valley-Wide into the City park system.
“We need to absorb all of Valley-Wide Parks within the City boundary.” - Parks, Recreation and Trails Commissioner
- Community Partner 1 2 3 4 5
“City parks should be connected and feel like they are part of a combined system.” - Planning Commissioner
Park and field lighting are needed.
“Need more lit sporting fields so that after school programs and team practices can occur more in the evenings when it is dark.” - Parks, Recreation and Trails Commissioner
The City should explore aquatic play elements at various parks.


“Community pool/aquatic Center is also a must for Menifee.” - Parks, Recreation and Trails Commissioner
Should consider multi-generational facilities.
“We need to support all age groups for family values and quality of life” - Parks, Recreation and Trails Commissioner
“‘Parks Make Life Better’ covers the values of physical, mental, and social health and well-being.” - Planning Commissioner

Should look into accessible features at playground and facilities in the City.
“ADA compliance, the whole family should enjoy park amenities.“
- Senior Advisory Committee Member
“Accessibility for Special Needs (walkers, wheelchairs)“
Three samples were collected in the survey effort, the statistically-valid invite sample, the open link sample, and the event sample (administered at public events). Together they provide an excellent source of input from the community on topics addressed through the survey. Survey results are presented in formats that compare responses from each sample, along with an overall response. In general, responses across samples are similar, a positive finding in that it indicates a more general consensus in the community on the various topics and ideas expressed.
These surveys were conducted as a part of the Master Plan. The general purpose was to gather feedback from residents and other park users on City parks, recreation facilities, amenities, future planning, communication, and more. The survey and analysis was designed to assist the City of Menifee in developing a parks and recreation plan that accurately reflects the needs, wants, and desires of the community.
The survey opted to use a traditional method of surveying by mailing surveys to 4,000 households in the City.


Awareness: Awareness of which agency manages local parks is low; 42 percent of the Invite sample is not at all aware of who manages their closest facilities and/ or parks. A total of 21 percent of the invite samples live in an HOA. Of those that do, Oasis, Heritage Lakes, and Tierra Shores were commonly mentioned.
Satisfaction: Respondents show higher levels of satisfaction with the parks, recreation facilities, and services provided by the City of Menifee. Overall, the average ratings for all samples were above 3.5 out of 5, with 5 being “very satisfied.”
Most Visited: The top three most visited parks are Audie Murphy Ranch Sports Park/Skate Park, Spirit Park, and Wheatfield Park. The top parks in need of improvement that respondents suggested are Wheatfield Park and Aldergate Park, both under Valley-Wide authority.
Transportation: Majority of respondents use a motor vehicle to get to parks and recreation facilities. However, over half of the Invite sample (55 percent) said that they walk or run and 19 percent said they bike or skateboard.
Connections: A strong indication that if additional trail connections, paths, walkways, and/or street crossings were developed, respondents would more likely walk or bike to access parks. A total of 38 percent of the invite sample said stronger connections would definitely would encourage them to walk or ride more often.


Trails and pathways: Trails and pathways, amenities at City parks, and open park spaces are rated highest by both samples in terms of importance. Although trails and pathways rated highest in importance, their rating for meeting the needs of the community is lower. However, open spaces and amenities at City parks are currently meeting the needs of the community. Aquatic programs rated the lowest in terms of needs met.


Other Desired Facilities: Other recreational facilities desired by the open link and event respondents are walking trails or interpretive trails and splashpads. Recreational facilities desired by the invite sample are community gardens and dog parks. But the top most desired park amenity in the future is walking trails, both inside and outside parks.
Communication: Respondents overall suggest that there is room for improvement in terms of how news and information is shared with the community about parks and recreation opportunities. The top three preferred forms of communication are Menifee Matters Newsletter, email, and social media.
Safety and Security: All samples indicated that the main purposes of the City of Menifee Parks and Recreation is to provide a high level of safety and security at facilities, and to ensure park and recreation facilities are accessible to all residents.
Spanish-speakers: Approximately 83 percent of respondents indicated that they use Spanish as a second language. Meaning, it would be beneficial to programs, services and communication to be available in Spanish.
FIGURE 4-2: Most Visited Park Facilities

FIGURE 4-3: Visitors likeness to use trails and pedestrian connections if they were developed?

5 - Definitely would
4 - Probably would
3- Neutral / No change
2 - Probably would not
1 - Definitely would not Avg. n=
FIGURE 4-4: The importance of facilitates and services offered by City of Menifee Parks
Trails and pathways
Amenities at City parks (e.g. picnic areas, playgrounds)
Open park spaces
Special events
Youth recreation and sports programs
Athletic courts (e.g, basketball, tennis)
Athletic fields (e.g., baseball, soccer)
Aquatic programs
Community centers
Adult recreation and sports programs
Senior programs
Kids club/camps
ADA-accessible programs

FIGURE 4-5: Facilitates and Services Importance/Needs Met Matrix Summary
High Importance/ Low Needs Met
These are key areas for potential improvements. Improving these facilities/ programs would likely positively affect the degree to which community needs are met overall.
These “niche” facilities/programs have a small but passionate following, so measuring participation when planning for future improvements may prove to be valuable.
Low Importance/ Low Needs Met
High Importance/ High Needs Met
These amenities are important to most respondents and should be maintained in the future but are less of a priority for improvements as needs are currently being adequately met.
Current levels of support appear to be adequate. Future discussions evaluating whether the resources supporting these facilities/programs outweigh the benefits may be constructive.
Low Importance/ High Needs Met
As a summary, the High Importance / Low Needs Met quadrant highlights the results of the survey where trails are important to residents but lacks in amenities.
FIGURE 4-6: Facilities and Services Importance/Needs Met Matrix

The three Community Workshops as a part of the Master Plan took place from July 2022 - December 2022. They enabled community members to participate in the planning process and speak directly to the project team to provide there input about current and future park needs and desires. Some items mentioned by participants in the workshops were not yet heard by other forms of community engagement that the Project Team conducted.


Location: Kay Ceniceros Senior Center
The first workshop was held on July 21, 2022 and it served as an official kick-off to the Master Plan. The planning team presented an overview of the planning process and initial inventory findings. The participants were then broken out into small groups to discuss the following topics:
1. Current usage of parks
2. General conditions of parks used
3. Overall satisfaction with park experience
4. Value you place on parks and park components
5. Your vision of the future park system


Location: Mt. San Jacinto College
The second workshop was held on September 22, 2022 at Mt San Jacinto College to present the existing conditions analysis. The team then held an interactive activity which included asking which amenities residents want to see in the City.
The top four amenities the participants wanted to see are:
1. Aquatic facilities
2. Amphitheater/outdoor stage
3. Walking trails/multi-use paths
4. Playgrounds/other play amenities
Participants were then asked to place on a map where they want to see the top four amenities.
Location: City Hall Council Chambers
The third workshop was held on December 1, 2022. The project team presented draft recommendations to the Park and Recreation Commission in a public workshop setting at the Council Chambers. The team presented the future conditions mapping and findings along with a summary of the second workshop activities and findings. The commissioners gave feedback and suggestions for the recommendations on the project.


Regional Sports Park or Destination Park
Facilities to Support Programs
Aquatic Facilities
Pickleball Courts
Lighted MultiPurpose Fields
Aquatic Facilities
Amenities at City Parks (Playgrounds and Group Picnic Areas)
Trails and Walking/ Running Paths
Adult Recreation and Sport Programs
This chapter analyzes Menifee’s projected 2035 future population and how its existing parks system will serve the future population. Looking at the City’s future projected population is an important part of the planning process because it helps understand how the current and planned park system will serve the rapidly-growing City.
This chapter uses 2035 Southern California Associations of Government (SCAG) population estimates and planned residential housing projects provided by the City to project the future population. This chapter also looks at data derived from the NRPA’s Agency Performance Review resource. While NRPA’s resources are not overarching solutions, they provide insightful metrics that can be useful with the Parks Commission’s aversion to NRPA comparisons. These guidelines are advisory, allowing the City to compare itself to others nationally. Using NRPA metrics and community input allows the project team to make informed and custom decisions that reflect the unique needs of the City in the recommendations section of the Master Plan.
Table 5-1 shows the future level of service for the projected 2035 population provided by the current park system, with the addition of planned future park projects. The acreage of planned park projects totals 68.92 acres. Several of these planned park projects are shown later in this chapter. The additional 68.92 acres will add to the future LOS, but the City will have 376.9 park acres in deficit to reach its five acres per 1,000 population goal by 2035.
As seen in Table 5-2, the future level of service for the 2035 population shows that the City will be lacking in several additional amenities that it was previously meeting according to the NRPA Standards (national averages) for. This includes, but is not limited to, recreation centers, teen centers, nature centers, performance amphitheaters, community gardens, lighted multi-purpose fields, swimming pools, splashpads, tennis courts, and volleyball.
TABLE 5-1: Future Level of Service (2035) Existing and Planned Parks
Although Table 5-2 shows some of these deficits based on the NRPA Standards, the team has further analyzed and adjusted the recommended City standard based on findings from the community needs assessment (Chapter 4), national and local recreation trends, and recreation participation data. CITYWIDE PARKS AND VALLEYWIDE PARKS (WITHOUT HOA FACILITIES)
Est. Pop.)
Notes: * Planned facilities are to be completed in the next 3-5 years. Gray lines indicate lighted amenities of the above amenity

This map shows the existing parks in the City of Menifee and the 1/2 mile walksheds overlaid with the future residential land use. There are several new planned developments that will increase the population and create a need for more park and recreation facilities.

This map shows the existing and future planned parks 1/2 mile walkshed, along with the future land use. There are 8 planned projects, adding an additional 68.92 acres to the existing park system.
Menifee is one of the fastest-growing cities in the State of California due to various newly planned developments in progress. Several of these developers are including parks on their project sites or paying into impact fees for new park development. Below are some of the conceptual park plans included in these new developments and other planned parks.
Developments building parks to meet the parkland dedications requirements will work with City staff to ensure that the park amenities meet the existing and future needs of residents and will be required to provide adequate shading for the park and playground areas to enhance the safety and usability of play structures all year round.
Note: These plans are conceptual and are likely to evolve prior to construction by the developer.
Legado is a large mixed-use planned development currently in the planning process. The development will include 1,022 new residential home lots on 216 total acres. It will also include 20-acres of commercial land uses and a 26 acre detention basin. The southwest section of the development is where the 12.88-acre community park will be located. Below is a conceptual plan of the facilities.
Proposed draft concept of the future park includes:
» Three lighted multi-purpose fields
» Community center
» Playground
» Three mile trail loop around the development

The Cimarron Ridge Specific Plan includes a network of community parks, pocket parks, natural open space areas and water quality basins.
Proposed draft concept of the future community park includes:
» Soccer/multi-purpose fields
» Baseball field
» Restroom facilities
» Playground and tot lots
» Picnic areas
Other Planned Developer Park Projects:
» Menifee Valley Sports Park
» Cantelena Park
» Menifee North Specific Plan Park

As part of the analysis, it is very important to also examine the future projected City demographics, vacant land, and future growth areas within the City. This analysis can help determine the future recreation needs of current and future Menifee residents. This chapter highlights the future growth trends and changes in the City’s residential population. These needs, deficiencies, and population changes should influence the City’s park, recreation, and trail planning through 2035. After 2035, a new park master plan would be needed to accommodate long-term future changes in the City’s demographics.
The City’s growth rate has been on the rise for over a decade and that trend is not expected to slow down in the near future. SCAG provides several resources for population growth projections for jurisdictional planning with the City’s boundary. However, to provide a more accurate future population projection, the City’s actual active residential development projects were reviewed to determine geographically where the future population would be located and how many new residential units will be added to the current population.
Based on the current active residential development projects in Menifee, provided by the City, there are projected to be about 6,000 new units of housing to be built. The average household size in the City, according to the US 2020 Census Bureau, is 2.99 persons per household. This will add an

additional 17,940 people to the current population. The distribution of the new population is shown in Figure 5-3.
The future population will be distributed mainly in currently vacant areas and not much infill residential development is projected to occur. As Figure 5-3 shows, some of the new developments will have new parks within them, but not others. The new population in these previously vacant areas will create a need for increased park acreage in these areas, as neighborhood parks, as well as a need for more community parks.

This map shows the projected population of each planned development in Menifee. It also shows the planned park projects. As the map shows, many of the new developments include a new park, including many of the larger developments. The planned parks will add 68.92 acres to the existing LOS. But, the planned parks still don’t add enough park acreage to offset the population projection.
The future LOS needs analysis is a study to determine which park amenities will have a higher future demand. The analysis provided an adjustment calculator to the NRPA Standards (national averages) to determine a foretasted demand resulting in the “Recommended City Standards” amount in the LOS amenities Table exists in Table 5-3.
The adjustment calculator is based on three overall areas: Trends, User Data, and Recreation Participation. The Trends data came from the following four
reports or analyses: the 2022 Sports, Fitness, and Leisure Activities (SFIA) Topline Participation Report, the 2021 Outdoor Participation Trends Report from Outdoor Foundation, ESRI Business Analyst - Recreations Trends in Menifee, and a comparative analysis of four other Southern California cities. The user data came from the following four inputs, Workshop #1, Workshop #2, Stakeholder input, and survey input. The recreation input was analyzed from the actual recreation program class numbers and registrants numbers provided by the City.
The results of this analysis adjust the needs for each amenity based on these input factors. The results of this adjustment to the LOS amenities Table is shown in Table 5-4.
Notes: * Planned facilities are to be completed in the next 3-5 years. Gray lines indicate lighted amenities of the above amenity
A population-based service analysis was done for future conditions based on future planned residential development provided by the City. Park pressure is defined and a park needs assessment was conducted.
“Park Pressure” is a mapping study that analyzes park size of existing parks in relation to population density and quantifies how population density affects parks by capturing the potential demand. This study assumes that residents are mostly using the park located closest to them, especially in regards to neighborhood parks. This process was done by using the park 1/2 mile walkshed around all public parks and including the residential land uses that fall within the park walkshed and the calculated population. The population of each park walkshed
was calculated to estimate the potential park users within the park walkshed. The acreage of the park was then used to estimate the number of park acres available per 1,000 residents within the park walkshed. The analysis characterizes areas of the City that either meet, failed to meet, or exceed the population LOS.
Existing park pressure in the City is shown in Figure 5-4. The figure shows the areas with the highest concentration of parks have the lowest park pressure and the areas with fewer parks have the most park pressure.
Future park pressure is shown in Figure 5-5. Future park pressure combines the existing and future planned parks with the projected 2035 City population. The future park pressure analysis shows that the areas with new development are going to have increased park pressure, regardless of the new planned parks to be constructed.
1/2 WALKSHED OF EXISTING AND PLANNED PARKS 2035 POPULATION DENSITY


This Future Park Pressure Map shows that many of the areas experiencing new development will have increased pressure, meaning more residents will be using the parks, creating a greater need for more park acres. Adding additional parks in the future would help offset the population growth.
The City has several potential infill areas that could be considered for a new park site. Figure 5-6 shows both City-owned vacant land and privately owned vacant land that City staff helped identify that may be suitable for potential new parks.
Infill site “F” is a former HOA park that could be a key area to help close the park gap in Quail Valley, as identified in the park needs assessment. Site “A” is currently a City-owned parcel and may be suitable for a future neighborhood park. It is a 2.18-acre parcel located off Goetz Road in Quail Valley. Both sites “A” and “F” are key infill areas that can assist in closing the park gap that currently exists in Quail Valley.
Infill site “H” is a 1.6-acre area located behind an existing Church in Sun City, north of Cherry Hills Golf Course. Infill site “C” is a parcel that was formally a part of the Sun City Golf Course. It is a large 13.7-acre parcel that could be a key location for a potential community park to help fill the existing gap in the Sun City area.
Infill site “D” is located just north of Gale Webb, Kids-R-#1, Action Sports Park and west of Paloma Valley High School. It is currently five parcels that equal a total of 24.4 acres. This is another opportunity area for a large community park with community amenities.
Infill Site “B” can be acquired by the City since it is currently on the County’s default property tax list. It is located on a steep hillside and may only be suitable for trail development or natural open space because of the topography. Infill site “E” is a future park site, along with residential units on Murrieta Road and would fill a gap in this north-western part of the City.
An additional community center opportunity includes County owned property next to the Menifee Library (Infill Site “I”).
In addition to the existing partnership with Santa Rosa Academy and MSJC, the City has identified several potential future partnerships with schools and private facilities. The City will continue its jointuse agreement with MSJC to continue allowing public use of its amenities with residents during specific hours during the year. The City will continue its facility-use agreement with Santa Rosa Academy to allow for use of the gymnasium and other facilities for recreational programs provided by the City.

Proposed Menifee Community Center Site

The infill potential map shows existing City-owned vacant properties and several existing privately-owned vacant properties that may be suitable for new park sites. Key infill areas are highlighted where park infill is most critical based on the existing and future park walkshed and current and future park pressure. It is most critical in the future to develop new parks where the existing park walkshed do not reach, like in Quail Valley.
The proposed trails and bike facilities shown in Figure 5-7 are the proposed trails and bike facilities identified in the City of Menifee Active Transportation Plan (ATP) that was completed in December 2020. It includes an extensive bike network that recommends a total of 93 new bike projects which equates to 183.3 miles of new bikeways. Many of these proposed bike facilities connect to existing parks, which provide an alternative form of transportation to parks. Parks and open spaces were criteria in the ATP for connectivity and prioritization. Where feasible, the ATP identified off-street connections to City and the public identified destinations such as schools, parks, open space, retail, and transit.
Previous planning efforts proposed a soft-surface trail that would connect two Valley-Wide parks: Lago Vista Sports Park and Hidden Meadows Park. It would continue south along the eastern side of Bell Mountain and end at the corner of Menifee Road and Garbani Road. There is potential for an additional trail along Menifee Road running north to south across the City. Multi-use trails that can be used for walking, biking, and sometimes equestrians like the Salt Creek and Paloma Wash Trail are

the preferred active transportation connections since they are bicycle and pedestrian-friendly for people of all ages and abilities, especially for transportation-based trips. Soft-surface trails can also be used for transportation such as those at Audie Murphy Ranch. Natural surface trails are primarily found in the City’s open spaces.
Open spaces such as Bell Mountain and Quail Valley open spaces offer hiking through an informal trail system. These informal trails were created by people hiking to reach the peaks, and heavy use formed the trail network over time. A formal trail can be found on Menifee Mountain where the Cross Hike Trail travels to the peak of Menifee Mountain with informal trailheads along Menifee Road at Aldergate Park and one at Simpson Road. While these open spaces are not owned by the City of Menifee, coordination between the City and landowners is key to preserving these open spaces for public use.
For trail planning in these open spaces, specific plans can be developed to help define a trail network, identify sensitive areas, and develop measures to preserve natural resources and habitats. Amenities that could benefit the City and provide education may include interpretive signage, educational kiosks, and formalized trailheads. A defined trail network can help discourage walking or bicycling through sensitive areas and can help preserve these resources. Programs such as interpretive walks and school field trips may also provide additional educational opportunities.

There are existing resources in the Menifee Valley area that are unique and have great expressions of the local geology, landform, and natural open space systems. Most of the areas shown in Figure 5-7 are likely to be under private control. The intent of this planning exercise is not to restrict development or interfere with private property but to understand that large undeveloped parcels are likely to get developed. With potential trail corridors identified in the Park, Recreation and Trails Master Plan, the City could request, through a discretionary process with willing partners, the dedication of a trail easement or construction of a public trail system itself as part of the development.
The location of the trails and possible trailheads shown are based upon existing visible trails or in some cases, new trails needed to create a network with loops and connections to existing trails. A substantial effort will be needed to identify the ownership, development potential, parcel size, and likely zoning or amended zoning requested for development in order to determine the size of the development and the level of the discretionary process needed as well as a local shortage of trails, recreation facilities, and open space. These conceptual
corridors and trailhead locations are a starting point and are based solely on the undeveloped resources that would create a positive and healthy outdoor experience and preserve the heritage, context, and character of Menifee through some preservation, stewardship, and access to these areas. When possible, existing parks and existing trails have been shown as being better connected through these conceptual trail areas. Infill Site B, identified in Figure 5-6, is a great location for a trailhead and trail connection to the North Canyon Hills.
In addition, park and open space connectivity can be even more beneficial when these resources are linked by non-motorized connections. These can be implemented by the use of on-street facilities such as bike lanes, sidewalks, and multi-use paths. While the City’s ATP does recommend citywide connections, exploring trail connections through undeveloped parcels, easements and even reconfiguring on-street improvements for multi-use paths can provide a safe and well-connected trail network. Examples include completing the Salt Creek trail to the City’s eastern boundary and connecting the Paloma Wash Trail to the Salt Creek Trail.


This map shows potential non-vehicular connections between parks, a greenbelt loop, trails, trailheads, and open spaces.
1. The City should take a long-term approach for trail development by identifying possible trail systems that would benefit the public and help to preserve the natural open space of canyons, hillsides, mountains, creeks, and unique geologic areas regardless of current ownership. Attempting to add trail systems in areas other than publicly owned lands or public right-of-ways is always challenging. It is counterproductive to consider public trails on private lands that are already developed or a series of small parcels. Large parcels with development potential that are next to or include open space areas should be conditioned with trail development or recreation in-lieu fees or dedication of easements.
2. Priorities for trails systems should include proximity to parks, adjacency to residential populations and in areas where existing open space with amenities such as rock outcrops, expressive geology, wetlands, creeks, riparian areas, hills, valleys, and peaks with views.
3. Trails should consider overall trail lengths with that include multiple loops and an overall network of options that meet a wide range of abilities. Daily exercise loops and connections of hiking, walking, or jogging that allow a varying range of distances, terrain, and access points.
4. Pre-planning for trails is not an infringement on private property rights if the property is planned for future development, especially if it is a discretionary action and needs to mitigate impacts to the natural community by setting aside or enhancing some portion of the site. Often, developers understand the benefits of trail systems and are often willing to work them into development plans. Lack of planning for trails will result in lost opportunities or disconnected segments of trails and connections.
5. Trail planning should use overall corridors of connection that provide flexibility for the agency or developer needing to decide on the best locations in a development to build trails. Trails should get priority to be provided in areas where natural open spaces occur, connections to developer-built parks, or to other trails, schools, or places of social gatherings.
6. Railroad corridors, excess right-of-way, flood control channels and utility corridors along with linear public right of ways can be used for trails if the responsible agency or utility company can limit risk, agency access and maintenance issues.
7. Trails can be a variety of surfaces such as gravel, natural soil, decomposed granite, asphalt, or concrete. Hiking trails can also vary in width such as single-track open space trails between 1’-3’ wide; shared use open space trails between 2’-4’ wide and multi-use trail for bikes, runners, and hikers between 10’-12’. If surfaces are hard, consider side trails for hiking or running of another 4’ width.
8. There are multiple areas around the City that represent opportunities for combining trails with natural open space, mountains, peaks, vistas, creeks that can connect to parks, residential areas, and other trails. It may take longer to wait for development to occur, but in the case of Menifee, the most feasible method of implementation is associated with development projects. Other public lands and right-of-way are also very feasible, especially with available grant money.
9. Linear trails systems can qualify as linear parks if they include recreational amenities and unique natural characteristics. Exercise courses, adventure facilities, climbing, bouldering, balancing, zip-lines, equestrian uses, mountain biking, BMX, pump tracks or other nature-based activities are amenities that can be included.

The Master Plan process allowed the project team to take a comprehensive look at the existing parks and recreation programs that the City offers. The Park LOS analysis and the needs adjustment LOS analysis, the community engagement process, stakeholder and focus group discussions, the comparative analysis, and the NRPA metrics provided valuable insight into prioritizing city-wide recommendations.
This chapter provides a guide and vision for how Menifee can continue to plan, design, and implement park-related projects and programs. There are a total of seven overall recommendations including:
1. Facilities and Amenities
2. Programs and Services
3. Administrative
4. Financial
5. Trails, Connectivity, and Open Space
6. Placemaking
7. Technology
Each recommendation has a set of distinct action items to help achieve the overarching goals of increasing the LOS, park distribution, amenity distribution, and quality of the park and recreation system. The Master Plan also provides timeframes for each action item. This chapter also provides guidance of infill opportunities in under-utilized areas of several existing parks and the amenities or features that can fit given approximate size requirements. The chapter provides strategies to partner with schools to lower deficiencies and geographic distribution of neighborhood and community parks. Finally, the affordability of recreational programs and services, upgrading programs and service delivery, improving organizational efficiencies, and augmenting financial opportunities will expand and improve efficiencies of the park system. The general recommendations are further described in Appendix C and include capital operational costs, impacts, funding sources, and timelines for completion.


A variety of different facilities and amenities at parks are essential to a person’s experience of a park. Park amenities like sports fields, playgrounds, courts, and picnic areas are typical but important elements for people to seek out. Park assets like benches, trash cans, and picnic tables allow users to engage in a park at a smaller scale. Maintaining the right balance between active and passive park elements is critical for the success of the city’s park system.
a. Explore ways to add facilities at existing City owned properties, focused on improving Level of Service and mitigating park needs in park-poor areas.
b. Reference Appendix B infill opportunity maps for where these opportunity areas exist.
c. Explore the possibility of divesting from properties that may have limited use in the future.
d. Create a phased plan for infill in established parks and create Concept Plans for each infill area.
e. Implement infill projects.
1.2 Include aquatic facilities (i.e., splash/ spray pads)

Potential future parkshed if all recommended infill areas were developed as parks.
a. Find areas within existing parks for splash pads or spray features.
b. Implement agreements with facilities such as the Drop Zone in Perris and increase public awareness in Menifee publications.
c. Consider joint use agreements with schools and other private facilities to help increase aquatic facilities and distribution.
d. Consider a city-owned facility that has aquatic features without duplicating facilities at the nearby Drop Zone.

a. Perform a facility condition assessment to determine necessary maintenance to bring facilities into good condition or to determine capital investment needs.
b. Create and implement a park maintenance schedule based on an asset management system for regularly scheduled maintenance and/or replacement of park amenities.
c. Evaluate the list annually to create priorities to be addressed and incorporate into the capital improvement plan.
d. Consider CAPRA Accreditation to continue to build a comprehensive management system and operational best practices.
e. Consider outsourcing service repairs as needed to meet the demand for deferred maintenance.
f. Maximize energy efficiency and sustainability (ex. recycling bins) in the design and construction of new parks, amenities, and major renovations. Explore the use of green energy such as solar panels in parking lots and buildings.


a. Reference the infill opportunity maps in Appendix C and Infill Recommendations Table 6-2 for areas to address with level of service gaps within the City.
b. Review at the top five priority LOS amenities and implement.
c. Refine the planning process to ensure developer-built parks are where they are needed and include the amenities that are likely needed including local park amenity shortages.
d. Look at shifting developer impact fees into community parks that resolve local deficiencies and improves equitable distribution of parks.
1.5 Explore adding indoor facilities at existing or new recreation/community, teen, and senior centers
a. Find underutilized areas within the key growth areas of the City for additional indoor facilities, that can address indoor recreational programs especially for teens and seniors.
b. Consider joint-use facilities to provide more teen and senior indoor uses.
c. Explore adding recreation facilities in areas within the City that show gaps.
d. Develop guidelines that can help flag opportunities for park amenities and trails for areas not considered parks, but that are public ROW or unimproved public spaces.
e. Review and update park design standards to include best practices for playground safety including appropriate levels of shade covering.

1.6 Develop flexible-use fields
a. Explore areas at existing and future parks for multi-purpose fields and open space.
1.7 Provide multi-purpose courts and combine court standards to accommodate trends that support more variety in court sports
a. Identify existing courts that can be converted to multi-purpose courts with an emphasis on Pickleball.
b. Prioritize multi-purpose courts in areas where LOS is lacking.
c. Explore areas to add multi-purpose courts including line striping for sports that are growing in demand.


a. Explore the development of regional open space park with educational nature center and hiking trails. b. Explore the development of regional sports park with diamond fields and multi-purpose fields.


High quality programs and services within the city’s parks and recreation system is a vital component of the Master Plan. They allow residents of all age groups and abilities to participate in a variety of different programs and activities. A broad range of programs and activities allows the community to stay engaged and keeps the parks activated year-round.
a. Consider expanding youth and teen programs.
b. Expand sports programs to include soccer, baseball, and girls’ softball. Continue to monitor sports program trends and interest.
c. Develop a recreation program plan that includes a service matrix, activity development and selection process, and other requirements found in CAPRA standards.
d. Continue to offer and expand program opportunities for aquatics, indoor fitness, pickleball, and cultural arts.
e. Promote active lifestyles by enhancing and increasing aquatic exercise and fitness programs.
a. Explore classes that use the outdoor fitness and exercise equipment in programmable spaces.
b. Use contracted instructors to offer enhanced fitness programming in parks across the City.
c. Explore cultural arts programs.
d. Include young adults programs.
e. Increase and enhance programs for individuals with disabilities. Consider programmatic ADA inclusion requirements.


a. Offer special events in different areas throughout the City that will contribute to a sense of community and help make each park the hub of each neighborhood.
b. Work with existing community groups for each neighborhood to assist with planning special events in parks.
c. Invest in a formal sponsorship program for events and activities. At a minimum, develop a policy and tools to assist staff with recruiting program sponsors.
d. Enhance and offer special cultural events programs.
e. Explore creating a signature community event that could help develop the City’s unique identity as proposed in the City Council Strategic Visioning Plan.

a. Invest in and develop an automated and real-time sports field reservation system.
b. Develop a joint use agreement with the school districts and ensure the partnership is equitable.
c. Coordinate with local and City sports group recreation providers.
a. Enhance the park ranger program that highlights nature interpretation opportunities (i.e., camp fire programs, nature walks, etc.)
b. Develop partnerships with environmental advocacy groups to offer environmental education programs and camps.
c. Establish educational opportunities in convenient locations to promote gardening and local food production (consider ties with 4-H Youth Development Program).
d. Collaborate with schools and educators to create outdoor “classroom” space in parks near schools.
2.6 Continue to monitor affordability of programs and services
a. Consider scholarship opportunities for students.
b. Evaluate non-resident program participation to ensure non-resident participants are paying appropriate and equitable fees.
c. Develop a resource allocation and cost recovery policy to ensure equitable use of City resources for recreation.
2.7 Expand indoor programs and increase opportunities for seniors, young adults, and teens at community centers
a. Offer additional enrichment classes for seniors, using contract or volunteer instructors to maintain affordability. When a facility is multi-generational, various age groups can interact and help each other (i.e. book reading by seniors for children or technology help from teens for seniors.)
b. Increase and improve Senior Center activities focusing on social services, social activities, transportation and information and referral for healthcare and other services.
c. Enhance and improve enrichment programs that offer development opportunities related to job skills, personal improvement, and academic success.
d. Evaluate parking opportunities at the Senior Center to ensure appropriate spaces are reserved and available during program and event times.
2.8 Continue to evaluate the quality and mix of programs and services
a. Develop a consistent and equitable manner of community member engagement to determine recreation desires and needs.
b. Ensure engagement processes include residents who live in the southern portion of the City.
c. Conduct an annual on-line survey to establish trends in participant satisfaction.
d. Expand patron evaluation process, adult sports and youth sports to include post program surveys and comment cards.
e. Establish customer service response goals to ensure patrons receive timely responses to complaints or suggestions.

2.9 Communicate recreation opportunities to City residents
a. Develop a marketing plan that includes outreach, pricing, promotion, program mix, and social media.
b. Develop a social media plan that aligns with current trends and update continually.
c. Enhance communication with the Youth Leaders of Menifee.
d. Improve existing use of the City’s webpage to assist residents to remain up to date on recreation program opportunities.
e. Continue to use and enhance an equity lens when marketing programs, with specific emphasis on program promotion in cultural events.


Existing and Previous Program and Event Fliers


The administrative elements of a park and recreation system are the “behind the scenes” operations that determine the success of a park, facility, or program. The administrative responsibilities range from how the system operates current lease agreements with other recreational providers or joint-use agreements. Other administrative items include staffing, volunteering, or management items. An understanding of how the City’s administration operates allows for recommendations for improvement.
3.1 Expand potential park amenities owned and operated by the City
a. Continue to explore unifying Valley-Wide Parks into City-wide Park System.
b. Evaluate land for potential purchase and re-purposing as parkland.
3.2 Improve partnerships and joint use agreements
a. Develop a joint use agreement plan with one or more of the school districts within Menifee.
b. Look at strategic partnerships with organizations such as non-profits.
c. Generate partnerships with organizations that can help with park maintenance and clean-up.
3.3 Staff appropriately to meet current demand and maintain established quality service
a. Address the need for additional maintenance staff and resources at additional parks or upgraded facilities.
b. Research additional staff resources and alternatives to the current staffing methods.
c. Create new maintenance positions within the Community Services Department.
d. Encourage staff certification as a Certified Park and Recreational Professional (CRPR) or Certified Park and Recreational Executive (CPRE) through the NRPA.


“We need to unify Valley-Wide Parks and City Parks”


3.4 Explore additional partnerships to assist with funding, volunteering, and marketing
a. Develop relationships with local businesses, clubs, and organizations to seek funding, volunteers, and marketing support to expand programs and facilities.
b. Find volunteers to help operate and run programs.
c. Review current contacts with partners and seek out new public/private partnerships to enhance amenities.
d. Identify partnerships with other organizations that can provide additional programming space.
3.5 Evaluate and address staffing levels
a. Align staffing levels with future park, facility, and programming enhancements.
b. Identify current performance standards.
3.6 Improve internal and external communication about division activities, events and services
a. Utilize a number of marketing tools and strategies to actively promote parks and recreation services.
b. Increase social media presence, school flyers, and hire interns to assist with social media marketing and promotions.
c. Engage all segments of the community in the marketing efforts.
3.7 Explore making the facility and park rental fee easier
a. Review fees annually to ensure they are equitable and the collection of fees is resulting in appropriate cost recovery.


Financial resources are one of the most important parts of having a successful park and recreation system. It is essential to have a healthy and well-balanced financial system in any park and recreation system. This not only includes an understanding of how the park and recreation system runs on a daily basis, but how the city at large operates. A general understanding of other financial externalities helps to complete the picture of how the financial elements of the park system may be improved. The analysis of the current health and operations of the financial system allows for future recommendations on areas of possible savings and where funding may need to be increased.
4.1 Continue the implementation of an asset management system
a. Implement an asset management system to manage and track equipment and inventory to improve budget planning.
b. Create and update a data-driven plan for identifying, evaluating, and managing park assets.
c. Annually, inventory and create a condition assessment for each asset in the parks and recreation system. Establish photo-inventory and GIS mapping. The inventory must include cost, installation year, and a life-cycle for each asset.
d. Complete an annual risk assessment to determine the cost of maintenance and operations, replacement, and consequences if each asset fails. Determine maintenance and operations cost at each year of the asset’s life-cycle (based on the level of service for each asset).
e. Annually, incorporate data from the asset management plan and process into capital and operating budgets.
4.2 Explore additional funding options
a. Consider potential mechanisms to support and pay for operations and maintenance of parks and facilities.
b. Consider the potential support for bond referendum to fund multiple/capital projects.


c. Consider internal budget and opportunities to ask/seek additional funding to support improvements in the maintenance and care of City parks and facilities to improve the standard throughout the community.
d. Evaluate the non-resident fee structure and consider adjusting fees to ensure non-residents are paying the entire cost of programs, rentals, and activities they participate in.
e. Review contracts with partners and seek out new public/private partnerships as a means to enhance the variety of recreational programs available to the community.
f. Explore opportunities to increase Cost Recovery at City facilities. Evaluate current fee structure, ongoing expenses, and options for new revenue streams.
g. Continue to seek alternative funding source that includes donations, grants, and others forms of sponsorship.
h. Communication with current sponsors and donors should be conducted on a regular basis to ensure their continued positive relationships with the City.
i. The Department should use the results of the fee study completed during the master planning process as a guide for exploring new funding opportunities.
j. Seek increased General Fund allocations to address recommendations from the Master Plan.
4.3 Explore opportunities to increase sponsorships
a. Build on existing sponsorships as well as pursue local entities to support events and a scholarship fund.
b. Ensure all existing and future sponsorships are accurately portrayed in a signed sponsorship agreement.
c. Increase community awareness of the existing Adopt-A-Park program.
d. Establish media sponsors and multi-year agreements as priority.
4.4 Track grants and charitable opportunities
a. Consider contracting with a dedicated grant writer to research, submit, and track federal, regional, state, and local grants.
b. Consider utilizing professional grant writing resources to pursue grant opportunities.
c. Continue to research, submit, and track federal, regional, state, and local grants.
d. Continue tracking NRPA, CRNA, OGALS, LWCF, CRPS, American Trails, and Education in Arts webpages for grant resources.
e. Utilize NRPA’s Foundation Center for links to thousands of grant opportunities, grant education and training.


Implementing trail connections between parks and where people live allows residents to easily access parks while providing them with exercise and outdoor experiences. Survey respondents indicated that if there was bike or pedestrian infrastructure to parks, they’d be more willing to walk or bike to parks rather than drive a vehicle.
5.1 Coordinate with Public Works to follow recommendations in the ATP
a. Implement Tier One and Tier Two projects from the ATP for connections to community and neighborhood parks.
b. Implement Safe Routes to School recommendations to provide access to neighborhood and mini parks near schools.
c. Coordinate grant pursuits aimed at Safe Routes to Schools that will benefit access to nearby parks.
5.2 Enhance connections and entries to parks
a. Identify corridors or areas where linear parks, additional traffic calming, and bicycle and pedestrian improvements are needed.
b. Close sidewalk and curb ramp gaps within a quarter mile of parks.
c. Incorporate park access recommendations into the City’s Complete Streets Plan Update.
d. Explore off-street trails and other non-motorized connections between parks and open spaces.
e. Coordinate with developers to integrate trails in future projects, especially if adjacent or near parks, open space, or an existing trail.
f. Develop an established trail system in open spaces for educational and recreational use.
5.3 Develop linear parks
a. Through the Complete Streets Plan Update process, identify corridors or areas where linear parks may occur and can be implemented.
b. Reclaim underutilized streets and/or infrastructure within the City.
5.4 Connect to urban trails outside of the City
a. Complete a feasibility study and implement the Salt Creek Trail east of Antelope Road to the City limits in coordination with Riverside County. This trail is identified as a regional connector by WRCOG.

Sample of a linear park that also provides connection and movement
b. Coordinate the connection to the Salt Creek Trail west of Goetz Road with the City of Canyon Lake. This trail is identified as a regional connector by WRCOG.
c. Implement bike lane projects that connect outside of the City.
d. Expand Paloma Wash Trail to connect to the Salt Creek Trail
5.5 Coordinate with Public Works to provide complete streets that include walkable and bike friendly networks throughout the City, especially those that lead to parks
a. Encourage developers to provide walkable and bikeable infrastructure.
b. Provide more protected bike lanes and bike facilities as recommended by the ATP.
c. Provide more walking trails and close sidewalk gaps.
d. Implement traffic calming elements on streets that connect to parks and schools.
e. Implement enhanced crossing opportunities near parks such as curb extensions or rectangular rapid flashing beacons.
f. Encourage smart growth in areas that have adequate parks. If inadequate parks, encourage parks to be built by the smart growth.
g. Review opportunities to acquire land to develop nature based or natural open space parks.
h. Conserve open space through continued stewardship such as increasing interpretive and educational programming.
a. Identify potential trail systems that would benefit the public and help to preserve the natural open space of canyons, hillsides, mountains, creeks, and unique geologic areas regardless of current ownership.
b. Prioritize and combine the trails system to be in close proximity to parks, adjacent to residential populations, open space, vistas, creeks, mountains, and areas of social gathering.
c. Consider multiple loops and an overall network of options that meet a wide range of abilities when developing trails.
d. Map trail corridors that provide flexibility for the agency or developers needing to decide on the best locations to build trails.
e. Explore railroad corridors, excess right-of-ways, flood control channels and utility corridors along with linear public right-of-ways for trail feasibility.
f. Explore linear parks that may qualify as trails if they include recreational amenities and unique natural characteristics.
g. Develop a dedicated Trails Master Plan.
h. Upon identification of a new project, compare parcels with maps in Appendix E for possible trail development considerations such as construction easements or developer lead implementation.

“City parks should be connected and feel like they are part of a combined system”


Placemaking helps give public places an identity by creating a sense of place for the broader community. It capitalizes on the community’s character to help define a space. It creates opportunities in public spaces to bring people together and engages the community. Placemaking can be achieved in various ways. It is typically derived from the history, culture, and heritage of a place that can be enhanced through art, vegetation, architecture, scale, and others. It is further enhanced through the interaction between people and the park elements. Community engagement and social infrastructure
6.1 Include public art
a. Encourage public art that’s representative of the community.
b. Allocate areas within parks for art opportunities.
6.2 Encourage social interaction
a. Incorporate public plazas and gathering areas within the public realm.
b. Provide areas for family gatherings and events.

c. Continue to create programmed activities that encourage social interaction (i.e., movies in the park, holiday events, etc.)
d. Conduct a Regional Event Assessment and creation of a signature event.
6.3 Increase identity and relation of the local natural context and built environment
a. Identify and bring out the history and culture of the site and City.
b. Include informational signage that identifies the character of the park.
c. Incorporate entry monuments or gateways into parks to aid in park identity.
d. Extend the natural environment into the park and park uses into natural non-sensitive open spaces.
6.4 Enhance character
a. Capture unique characteristics of the City that can be incorporated into each park.
b. Integrate park theme and character into features and buildings. Include placemaking at part of the review of future projects for integration.
c. Look to surrounding context and integrate into the character of the park.


Technology is an integral part of people’s everyday lives. Technology can be used to the advantage of residents and city staff to communicate with the community. For parks, technology should be leveraged in many ways to better the park and recreation system ranging from data collection to program announcements. This includes integrating the technology and recommendation from the City’s Broadband Master Plan.
7.1 Organize digital files and develop a Citywide GIS databases
a. Work on a technology plan that establishes a digital record system for CAD and Building Information Modeling (BIM) files.
b. Continue to build the City’s GIS database for all of the City’s mapped data and build on the mapping from this study.
c. Work with the Menifee Police Department to collect and map crime data to monitor safety and public property damage issues.
7.2 Increase usage of security systems within the park system
a. Develop a technology plan to increase security cameras.
b. Prioritize parks where safety concerns and other major issues are mentioned.
c. Increase the presence of park rangers and staff in parks of concern.
7.3 Update and enhance digital scheduling and facility management tools
a. Research and explore digital scheduling and facility management platforms.
b. Set up a digital workflow for park planning, budgeting and implementation as well as maintenance and replacements.
c. Explore a marketing and communications plan for customer/resident use of the system.
7.4 Include virtual programs, events, and activities
a. Research and explore platforms to host virtual events.
b. Establish working platforms and share events with the community.
c. Work with existing community center classes to incorporate virtual programming.


Figure 6-2 shows the existing amenity gaps in the City and the future potential infill sites for new parks. Showing all the overlapping amenity gaps allows the City to prioritize what new amenities to add at existing park infill areas and key infill sites to prioritize development for new parks. For example, in the northern portion of the City, a major sport court and diamond field gaps is present where an existing park, Nova Park, and a future planned park, Cimarron Ridge Park, are located. To help fill this gap, the City should consider adding sports courts and diamond fields to these parks.
The City can also identify what amenities to prioritize and incorporate at new park opportunity sites. For example, if the key infill sites A and F in Quail Valley were to be developed as new parks it would help to fill a major parkshed gap. The City can use this map to prioritize what amenities to include in these new parks.
Overlapping Amenity Gap Key Legend
PlaygroundsSport Courts Multi-purpose Fields
Diamond Fields Community Centers

This Master Plan incorporates a thorough analysis of infill opportunity areas for each park site throughout the City. These amenity infill opportunities and areas are further analyzed in Appendix B. Figure 6-3 shows an example of Nova Park’s infill opportunity areas and Table 6-1 shows the potential infill amenities that could be suited for the infill areas.
Example Infill Amenity Opportunity
Map and Table from Appendix B
Nova Park
Area 1: 10,007 square feet
Located on the northeast corner of the park’s large open grass central area and playground equipment on the south edge.
Area 2: 5,556 square feet
Located on the southeast corner of the park’s large open grass central area and playground equipment on the north edge.
Area 3: 1,438 square feet
Located on the northwest corner of the park’s large open grass central area with a shrub planter and landscape drainage swale farther west.
Area 4: 897 square feet
Located on the southwest corner of the park’s large open grass central area with a shrub planter and landscape drainage swale farther west.
FIGURE 6-3: Opportunity Areas

TABLE 6-1: Infill Amenities for Nova Park Opportunity Areas
Field40,000-80,000
Dog Park10,000‐75,000
Multi-Purpose Field40,000-80,000
Pickleball2,500‐3,500✓✓
Picnic Areas500‐1,500✓✓✓✓
Playgrounds (ages 2-5 and ages 6-12)4,000‐6,000✓✓
Rectangular Soccer Field4,000‐75,000
Skate Park4,000‐10,000✓✓
Swimming Pool1,000-10,000
Splashpad/Sprayground500-1,500✓✓✓✓
Tennis (60'x120')7,200‐28,000✓
Volleyball (70'x40')4,000‐16,000✓✓
Thorough analysis reviewed various elements and geographic amenity gaps as shown on Figure 6-2, the amenity LOS deficits based on the needs assessment from Table 5-5, and the infill opportunity areas and developed recommendations for park infill within the City. Table 6-2 shows which amenities from the analysis are recommended for infill at City parks.
TABLE 6-2: Infill Recommendations Table
*Note: It is recommended that the water feature at Central Park to be converted into a splashpad. Gray lines indicate lighted amenities of the above amenity
Table 6-3 shows a scenario future level of service amenities table if the infill recommendations on Table 6-1 were executed by 2035. Table 6-3 represents the adjusted recommended standard from Table 5-5 in Chapter 5. By strategically recommending amenities that the city is lacking according to NRPA metrics within areas that have an existing amenity gap, it has the potential to bring the City out of an amenity deficit and provide more access to all amenities throughout the entire City. Suggested infill only takes into account available open space and not current or future planned amenities. In addition, NRPA standards may not reflect local needs.
For example, by recommending implementing a lighted diamond field at Nova Park, the deficit would be reduced based on the needs assessment from -0.8 to 0.2 and it also would fill a missing gap of diamond fields in the northwest of the City shown as in Figure 6-1.
Another example is the suggestion to include splashpads/spraygrounds at the locations shown in Table 6-3. By implementing these in the locations shown throughout the City it would lower the deficit based on the needs assessment from -3.1 to creating a surplus of 0.9.
TABLE 6-3: Future Scenario Amenity Level of Service (2035)
Notes: * Planned facilities are to be completed in the next 3-5 years. ** This number is including the potential future Meni fee Community Center on La Piedra Road and Menifee Road Gray lines indicate lighted amenities of the above amenity


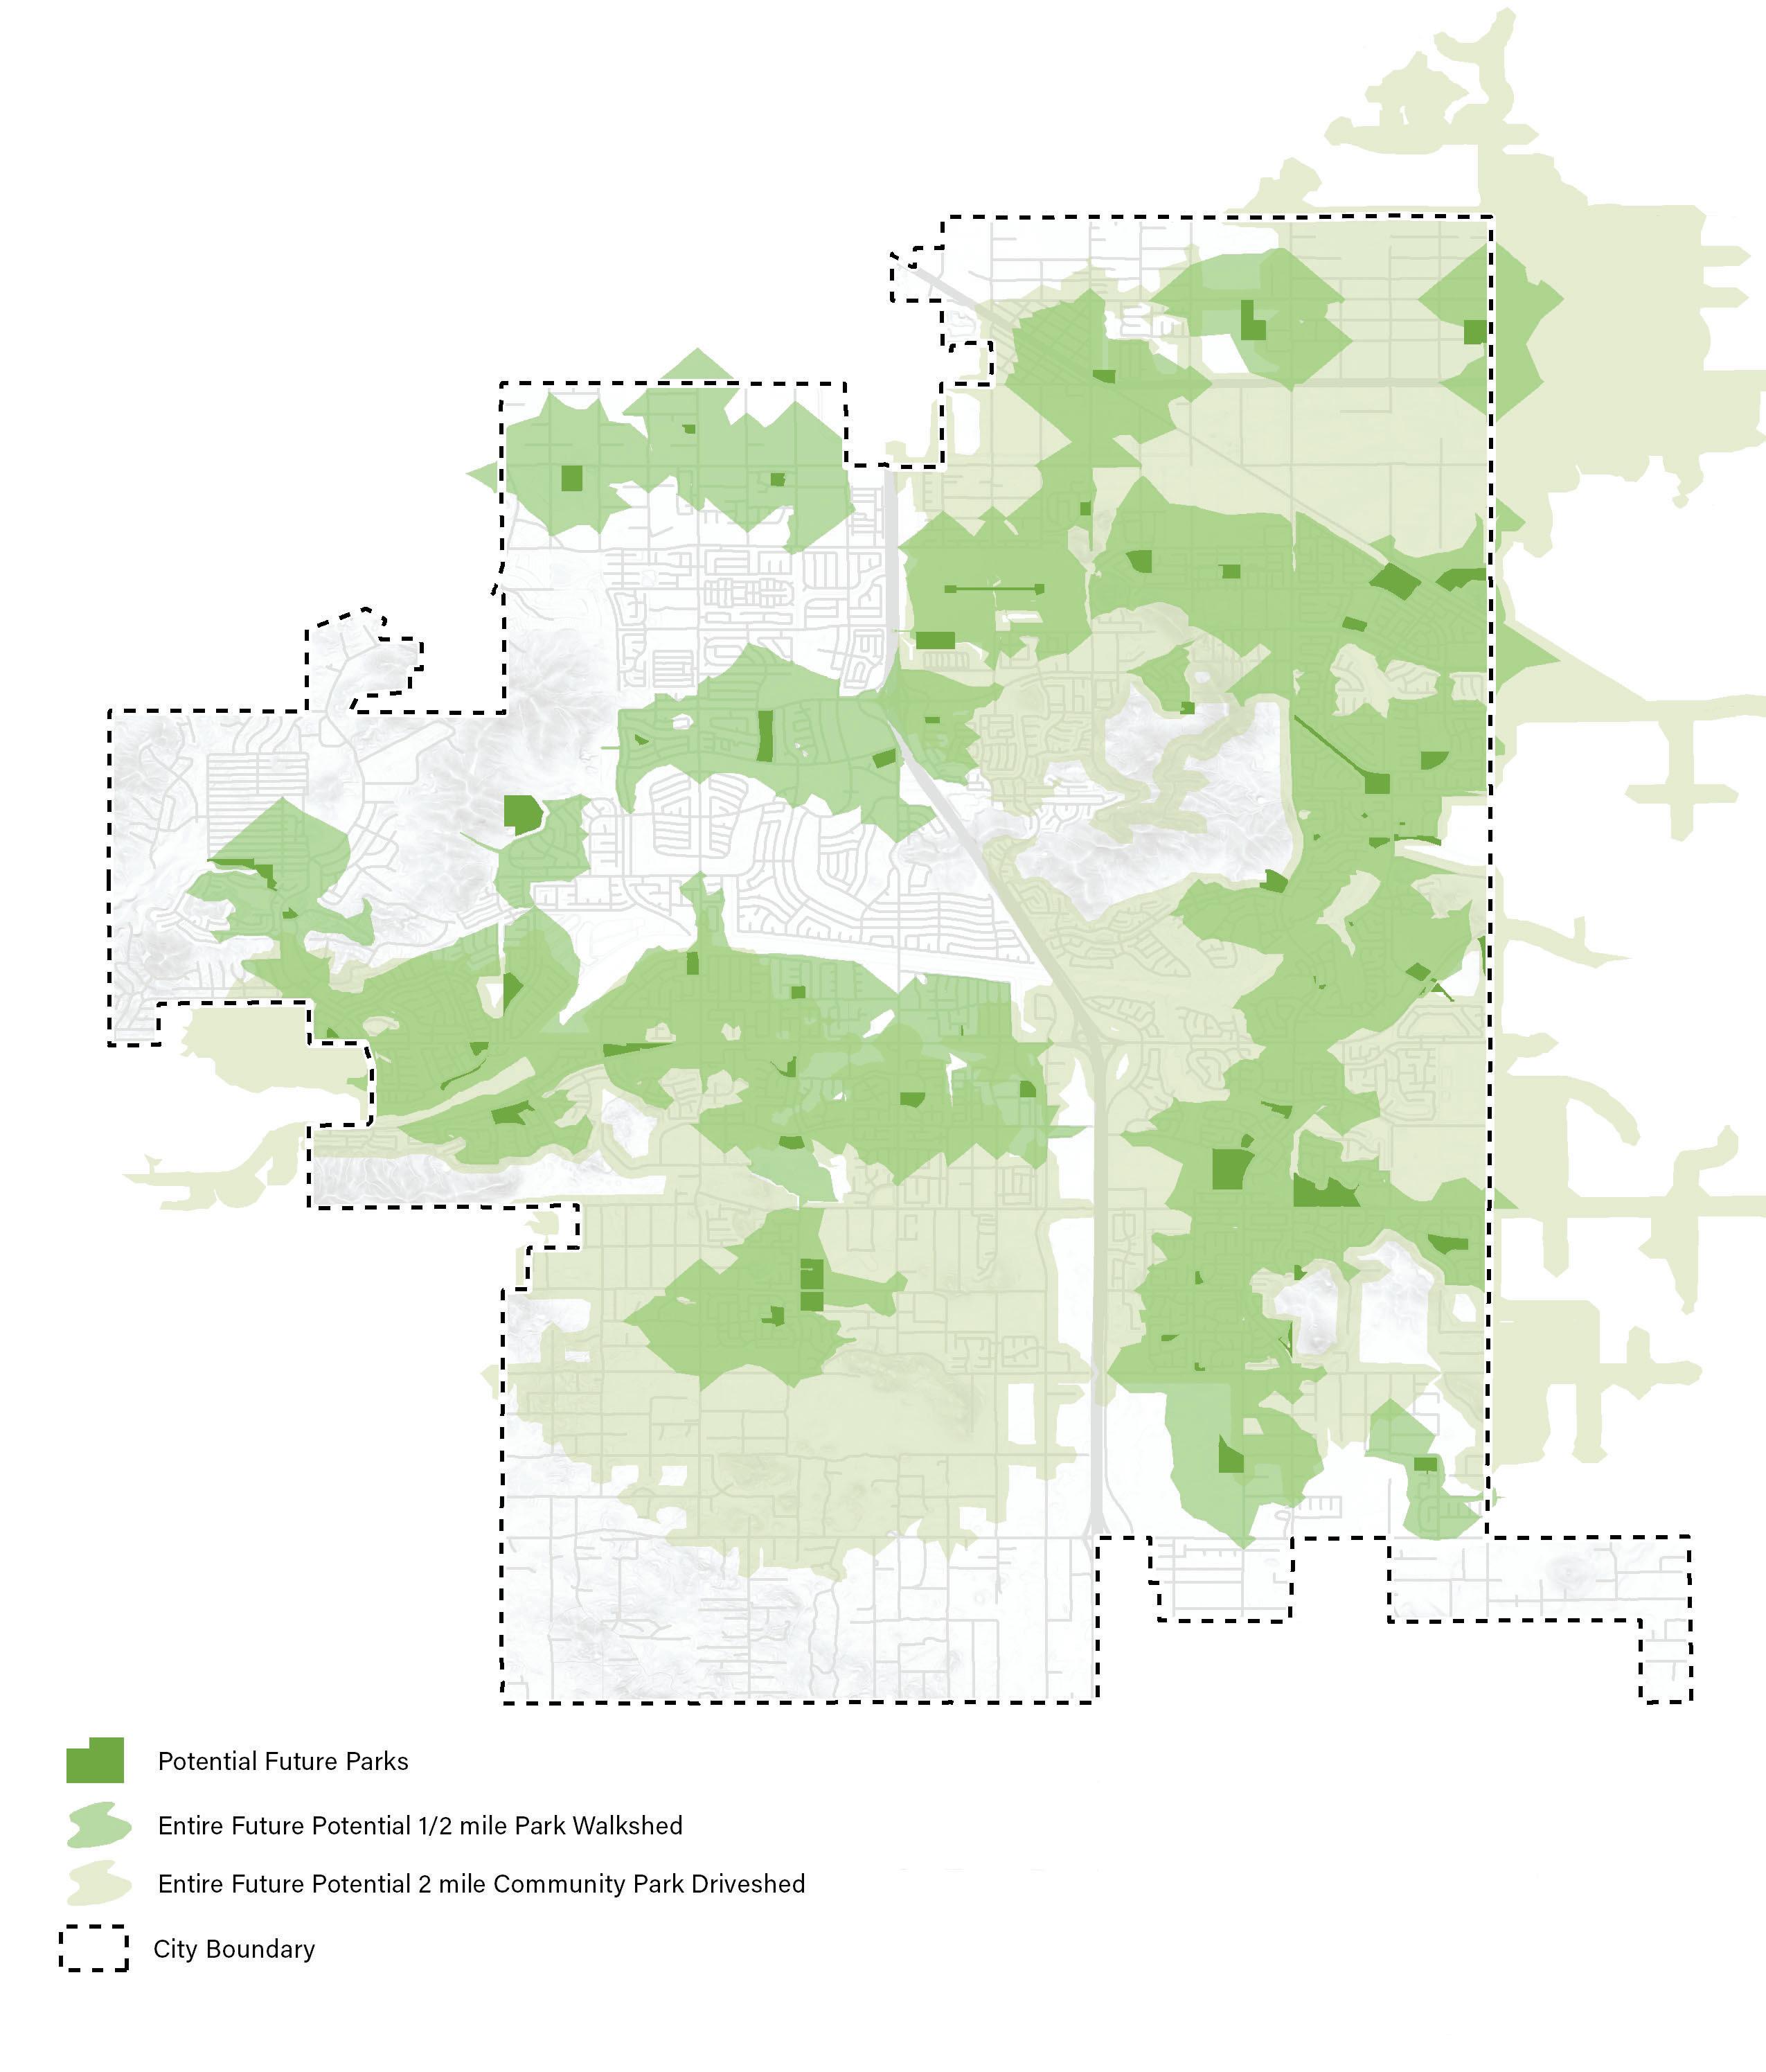

Potential Scenario Parkshed Gaps


The Future LOS Scenario Map shows the gaps in the parkshed that will exist after the recommended infill recommendations. The City should continue to infill parks in the parkshed gaps so every resident in the community has easy access to parks.
Figure 6-4 shows the potential scenario if all of the recommended infill areas were to be incorporated into parks in the future. The parksheds would fill in a greater percentage of the community’s land area; however, there would still be continued parkshed gaps in the southern portion of the City, Quail Valley, and the northwest. This deficit can be used to require greater contributions or construction of parks by developers. Development partnering will be the primary way to close this gap.
Table 6-4 shows the scenario if the recommended infill park sites were developed into parks. In this scenario, the infill sites total 60.49 acres and the City would still be 1.9 park acres short of reaching its goal of 5 park acres per 1,000 residents. The City should continue to look for potential vacant land to develop into parks in these areas to fill in the parkshed gap and come closer to reaching the LOS goal. Furthermore, it’s recommended to consider completing a needs assessment for the park system within the next five through seven years to recalibrate the findings within this report to the aforementioned recommendations.
