City of Montebello First Mile Last Mile Plan


December 2023


December 2023


Alfredo Machuca, Transit Planner, Montebello Bus Lines
Monica Mercado-Rodriguez, Planning Manager
Rita Montalvo, Assistant Director of Public Works
Joe Punsalan, Principal
Tom Bertulis, Senior Associate, Project Manager
Morgen Ruby, Senior Planner, Assistant Project Manager
Darren Jacobsen, Associate

Stephen Fox, Senior Regional Planner
Krista Yost, Assistant Regional Planner
Carlisle Dockery, Director of Planning
Octavio Garcia, Associate Planner
• Adam Mitchell, City of Montebello Police Department
• Adrianna Kendricks, Montebello Bus Lines
• Alex Gillman, Public Affairs and Information Technology
• Alfredo Machuca, Montebello Bus Lines
• Alexis Lucero, City of Montebello Public Works
• Chris Moorman , LA Metro
• David Huang, Metrolink
• Gary Robinson City of Montebello Fire Department
• Krista Yost, SCAG
• Horacio Perez, Vail Continuation High School
• Joe Forgiarini, LA Metro
• Jose Ornelas, Adult School Principal
• Laurie Aguilar, City of Montebello Parks & Recreation
• Leticia Alvidrez, Montebello Unified School District
• Naomi Sotelo, Eastmont Intermediate School
• Paul Parzik, YMCA Metropolitan Los Angeles
• Serena Liu, Caltrans
• Stephanie Hardaway, Applied Technology Center High School
• Stephen Fox, SCAG
• Timothy Greensavitch, Montebello Bus Lines

The Montebello First Mile Last Mile (FMLM) Master Plan is organized in the following chapters:
» Chapter 1: Introduction
» Chapter 2: Existing Conditions
» Chapter 3: Community Outreach
» Chapter 4: Vision and Goals
» Chapter 5: Policy Development
» Chapter 6: Projects
» Chapter 7: Funding
The City of Montebello is part of Los Angeles County, California and located southwest of San Gabriel Valley with a population of about 63,000 (U.S. Census). Montebello is inevitably surrounded by freeways and transit lines as it is within proximity to the City of Los Angeles, known for its traffic and long commute times. The Montebello First Mile Last Mile (FMLM) Master Plan is a long range road map meant to assist City staff as they work towards the betterment of the first and last mile connections to transit of residents and commuters. The bus transit system in Montebello is operated by Montebello Bus Lines (MBL) and it is the third largest municipal transport agency in Los Angeles County. Guided by community feedback and a Vision Zero approach - a traffic safety strategy with the objective of eliminating traffic fatalities and injuries through the pursuit of increasing safer mobility for all people - the Montebello FMLM Master Plan will guide the future infrastructure development and improve the connections to and from transit for all users.
The following are the four goals that were developed throughout the planning process and vetted by the Technical Advisory Committee (TAC):
» Goal 1: Provide Safe and Attractive Bus Stops
» Goal 2: Provide Safe, Comfortable, and Convenient Bicycle, Pedestrian, and Non-motorized Access to Bus Stops and Metrolink Station
» Goal 3: Coordinate Land Use and Transit Planning
» Goal 4: Programs to Encourage Transit Use and Promote Safety, Comfort, and Accessibility
The development of the Montebello FMLM Master Plan began with understanding the existing transit network, pedestrian network, bicycle network, land uses, and other context sensitive information. Data collection was acquired from the Southern California Association of Governments (SCAG) and the Transportation Injury Mapping System (TIMS) and multiple walk and bike audits conducted by the Project Team. Outlined below is a summary of the various methods of data collection used for the development of this document.
Initial maps were created to highlight the areas within the City that have a concentrated number of bus stops within and outside of city limits along with maps showing the amount of boardings and alights. Main transit corridors in the City are the most utilized and therefore exhibit the highest number of bus stops and ridership.
The City of Montebello has an extensive network of sidewalks connecting it to most areas, however, there are numerous obstructions such as poorly placed utilities and pinch points impeding the walkways.

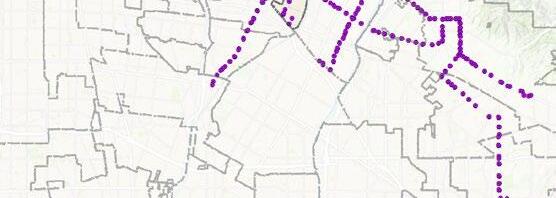

Walk and bike audits were conducted along transit corridors with high ridership volumes or collisions to better understand the pros and cons of the existing pedestrian infrastructure. Findings were then used to inform infrastructure improvement recommendations.
A critical component of the planning process for Montebello’s FMLM Master Plan was community outreach with stakeholders and members of the community who are daily users of the infrastructure that this Plan seeks to address. Engaging with the community was able to bring awareness and educational resources about the FMLM Master Plan to build support and collect valuable feedback that limits first and last mile trips. Physical and digital material presented to the public was made available in different languages (English, Spanish, and Mandarin) and created in a way to be easily understood by all.
The primary community engagement strategies utilized were:
» Six Technical Advisory Committee Meetings
» Three Community Events/ Workshops
» Branding and Social Media
» Physical and Digital Public Survey
The Technical Advisory Committee (TAC) was composed of representative groups identified by the Project Team, the City of Montebello Staff, and SCAG staff. Representative groups included The City of Montebello departments, SCAG, Montebello Unified School District, LA Metro, Metrolink, the YMCA, and more, as listed in Appendix B.
All TAC meetings, except one hybrid, were all held virtually for one hour on a bi-monthly basis. The TAC provided their input and feedback on the different parts of the project such as the engagement, findings, and recommendations.
The TAC meetings took place on the following dates:
» Technical Advisory Committee Meeting #1 –December 5, 2022
» Technical Advisory Committee Meeting #2 –February 7, 2023
» Technical Advisory Committee Meeting #3 –April 4, 2023
» Technical Advisory Committee Meeting #4 –May 23, 2023
» Technical Advisory Committee Meeting #5 –August 8, 2023
» Technical Advisory Committee Meeting #6 –November 14, 2023
Tactical Advisory Committee (TAC) Meetings
Community Events
Branding and Social Media
Survey
In collaboration with the City of Montebello Staff, the Project Team created material and participated in its distribution in three already scheduled citywide in-person events. The events provided the opportunity to set up booths and activities to interact with members of the community regarding pertinent transit and infrastructural issues they face on a regular basis.
The community events/workshops took place on the following dates:
» Community Event #1 Heritage Festival – October 16, 2022
» Community Event #2 Downtown Street Fest –July 29, 2023
» Community Event #3 Heritage Festival – October 7, 2023
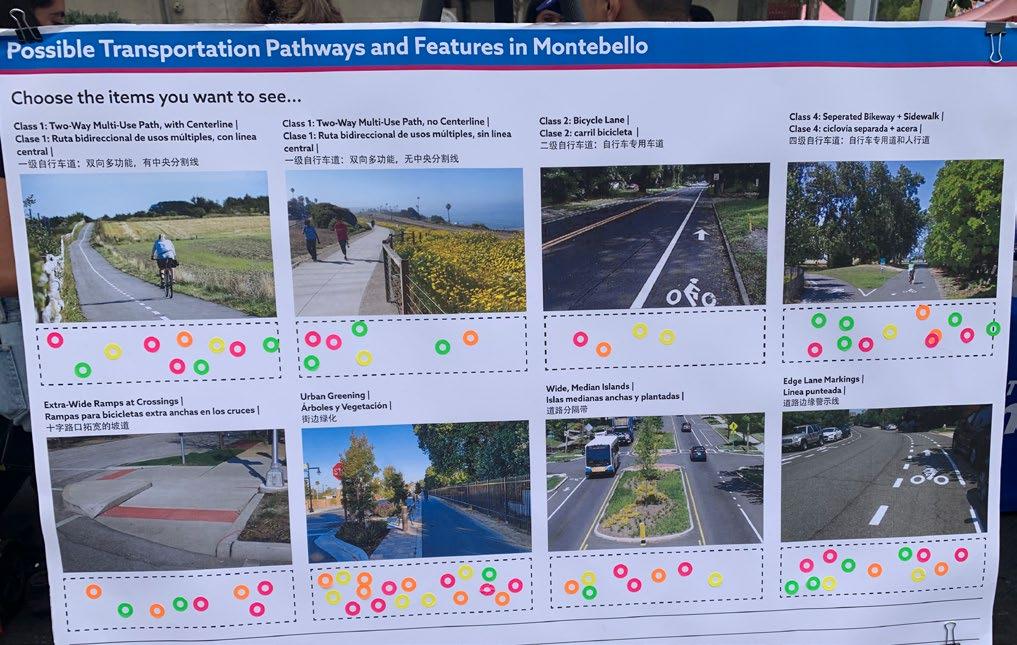
During the first event, the Team was able to gain insight on what the public would like to see installed in the City as participants placed stickers to cast their votes on street treatments they most desired. Results indicated the top five potential transportation treatments that were favored to be: multi-use paths, urban greening, speed cushions, speed humps, and high-visibility crossings.
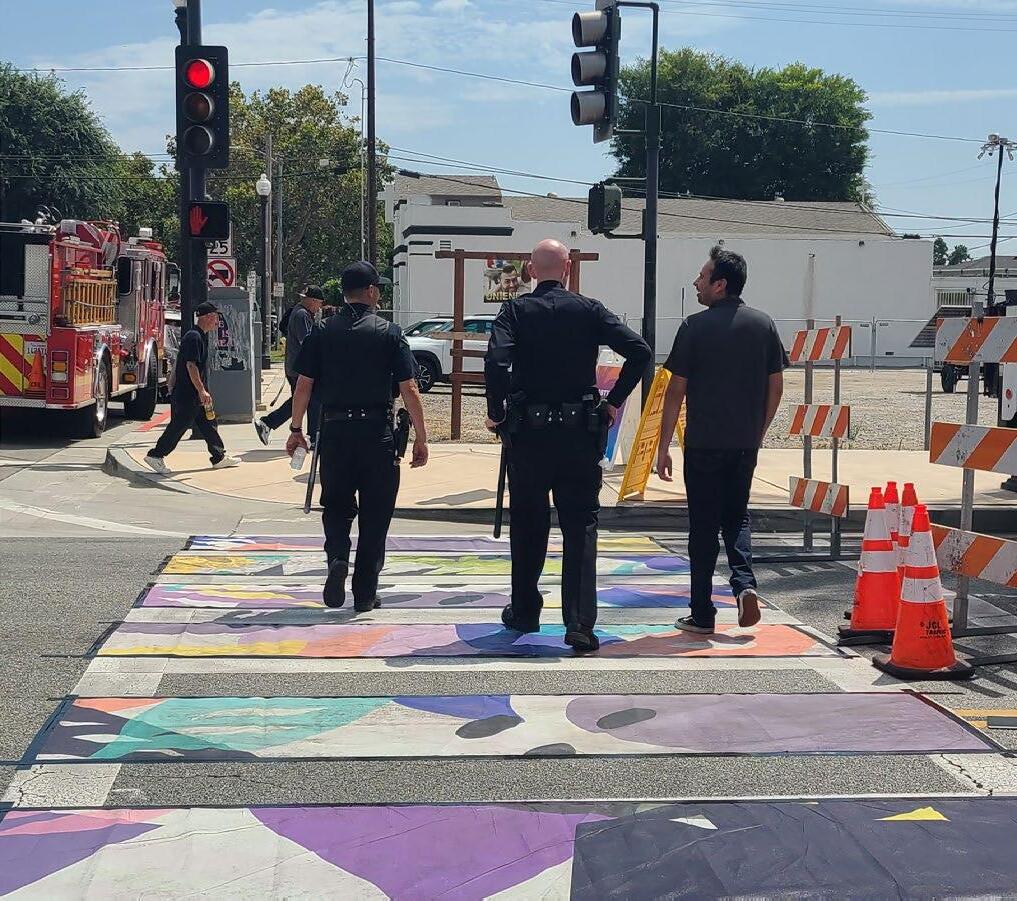
The second event took place during the Heritage Festival and it provided the opportunity to showcase two temporary infrastructure elements - separated bike lane and creative crosswalk - from the SCAG’s Go Human Kit of Parts. Providing the public with a temporary element allowed them to determine whether it was something they would like to be implemented in the future. Votes were casted once more on boards that displayed temporary infrastructure elements. The top five selected were parklets, creative crosswalks, median refuge islands, curb extensions, and separated bike lanes.
The third and final community event, similarly to the first event, allowed the Team along with Montebello staff to host a booth where residents could receive and update on the progress made on the FMLM Plan and five additional input on the project. Boards were once again displayed to collect votes on the intersections and projects that people deemed needed funding prioritization.
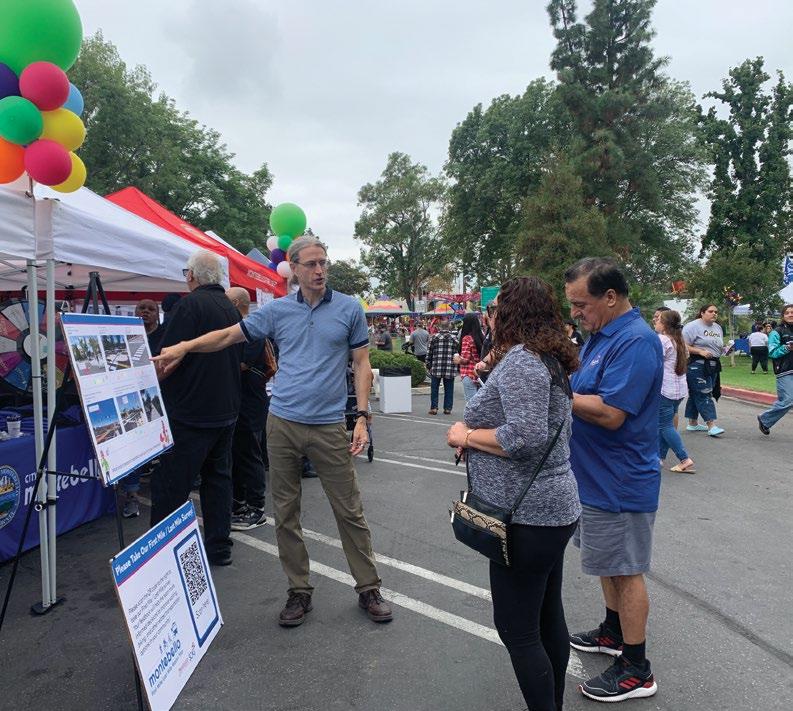

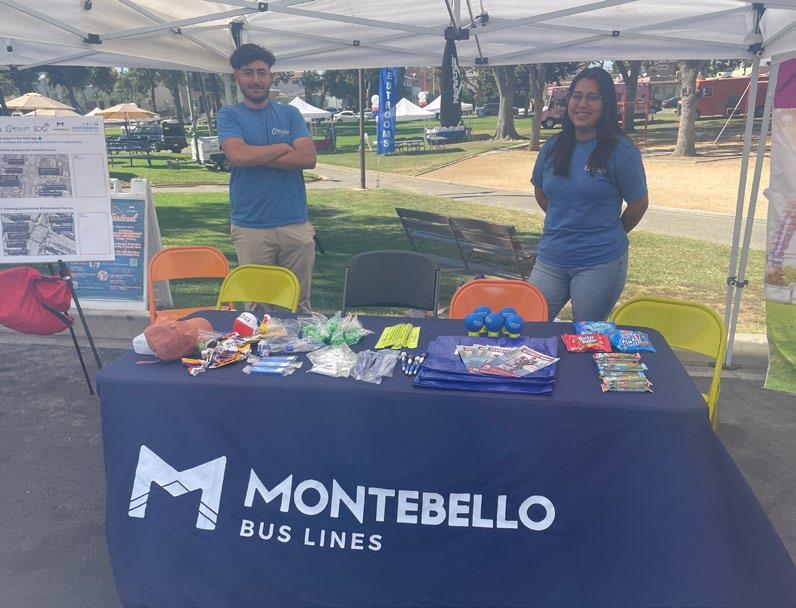
Consistency with the City’s branding and graphic requirements were met throughout the styles used in all outreach material, surveys, and maps.

#10275b
#015aac
#ed8723
Participants
Community input is a key component to the planning process. Therefore, a survey was created to compile the locations and transit routes where the public identifies problem areas throughout the city. The survey was available through the Project Website as well as distributed at pop-up events and available from October 2022 - February 2023. The survey was promoted through flyers and social media (See Appendix D) over several weeks.
A total of 209 people participated in the survey where they expressed the problems and challenges they face when walking, bicycling, or accessing transit in the City. The issues reported by participants ranged from issues of poor connectivity to the lack of parking and pedestrian crossing distances.
Upon an in depth analysis of the data obtained from the planning process, best practice policies recommendations were made to help guide infrastructure improvement. Specific FMLM Action items were created in conjunction with Montebello’s 2023 General Plan:
Policy 1 Support and promote walking, biking, and other non vehicular modes as an alternative to driving within Montebello. (General Plan 4.1)
Policy 2 Provide clean, safe, and comfortable bus stops and bus stop access to encourage transit use.
Policy 3 Provide safety amenities at bus stops.
Policy 4 Utilize complete street strategies to improve bus stop accessibility.
Policy 5 Utilize traffic calming and safety countermeasures to improve accessibility to bus stops and the Metrolink Station.
Policy 6 Develop programs to encourage transit use and safety.
Policy 7 Develop programs to encourage safety at bus stops and the Metrolink Station.
Project recommendations were developed for funding prioritization with feedback from the TAC, the public, the Level of Stress (LOS) analysis, as well as from the existing conditions analysis.
The five prioritized projects identified focus on transit stops with high-volume and high-need. The Plan recommendations can be replicated in other areas where bicycle, pedestrian, and traffic calming treatments are needed for the refinement of transit access.
» Priority Project 1: Beverly Boulevard and Maple Avenue
» Priority Project 2: Whittier Boulevard and Garfield Avenue
» Priority Project 3: Whittier and Montebello Boulevard
» Priority Project 4: Washington Boulevard and Greenwood Avenue
» Priority Project 5: Madison Avenue Neighborway
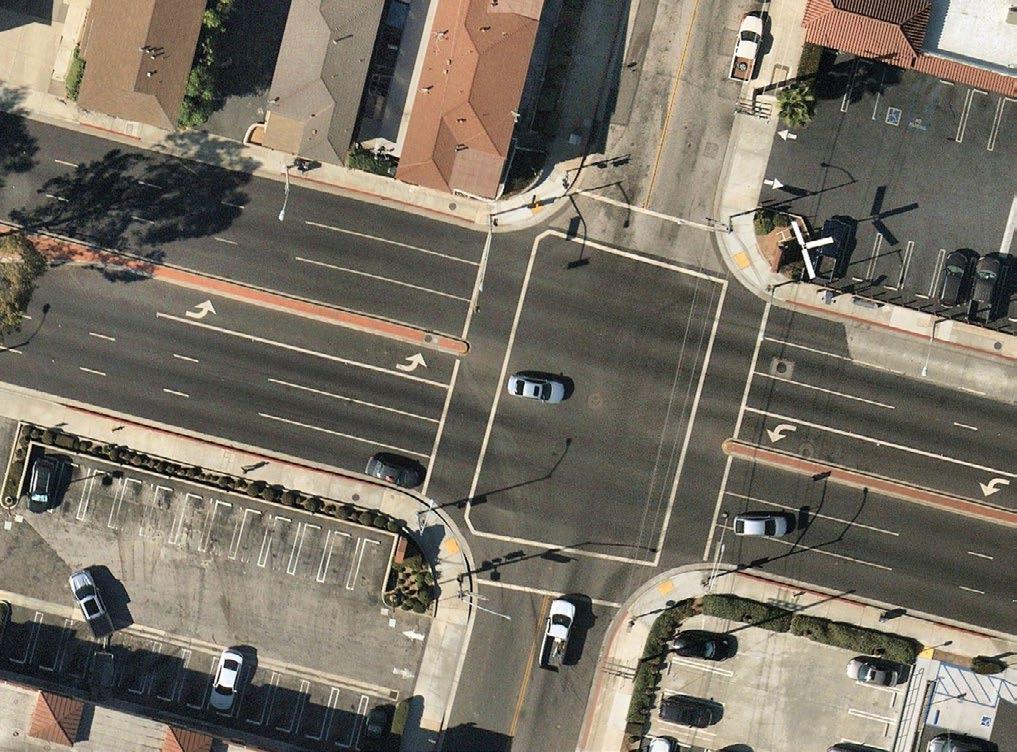

The final chapter of this Plan was developed to serve as a toolkit with the addition of Cost Estimates and Funding Resource Tables to provide guidance to the City of Montebello as they move forward in the planning process and the pursuit for grants and funding to develop the desired changes outlined throughout this Plan. It is important for the City to coordinate efforts with adjacent jurisdictions on projects as it can strengthen applications at the time of applying for funding.

First and last mile is the experience that links people to and from transit and connects their origins and destinations. Public transportation rarely stops directly in front of a passenger’s origin or destination. That’s why transit users often rely on other ways to get to and from their bus stop, like walking or using a wheelchair, riding a bike, using an e-scooter, or other forms of micromobility to access transit. These types of connections are referred to as “first and last mile” methods of travel, although actual distances are of course different for every person.


Oftentimes, there are barriers that make accessing transit less attractive, such as a busy intersection or lack of bike lanes and sidewalks. While there are numerous strategies that can close this first and last mile gap, the emphasis of this Plan is on improving the pedestrian and bicycling environment around bus and transit stations.
Montebello, which is Italian for “Beautiful Mountain,” is a city in Los Angeles County, California. It is located southwest of the San Gabriel Valley, and adjacent to and just east of East Los Angeles. Montebello has an area of 8.4 square miles and a population of 63,000 (U.S. Census).
Because the City of Montebello is located so close to the second largest city in the United States, a city synonymous with excessive congestion, Montebello has found itself surrounded by freeways and crisscrossed by transit lines. The bus system in Montebello is operated by Montebello Bus Lines (MBL), which has grown to be the third largest municipal transport agency in Los Angeles County. Montebello Bus Lines serves 15 communities, providing transport to 3 million passengers on an annual basis.
MBL is continuously looking to expand its customer base by developing first and last mile connections, which results in everything from carbon footprint re-
ductions to health benefits for its users traveling to and from their destinations, usually by foot. The key is determining the exact roadmap, starting with the purpose of the plan.

The purpose of the Montebello First Mile Last Mile (FMLM) Master Plan is to provide City staff with a roadmap to further assist and support residents and daily commuters to travel safely on their first and last mile trips within the service area through a Vision Zero approach. In order to do this, the FMLM analyzed existing conditions at high-volume transit stops, traffic collision data, and community feedback. Potential solutions were evaluated to improve safety for all modes of transportation in these areas, which could then be applied in other locations throughout the MBL service area.
The FMLM is one of the City’s first steps to comprehensively improving the reliability and safety of MBL’s service. This plan:
» Maximizes the Plan impact by prioritizing bus stops more frequently used and located in the most concerning transit corridors
» Produces a prioritized list of active transportation projects adjacent to major bus stops for future rounds of grant funding
» Identifies community-preferred non-infrastructure safety improvements that have proven successful at other agencies and are applicable to the City
» Pairs infrastructure improvements with a robust safety campaign that educates residents on how to reduce risk while using active transportation
» Proposes new metrics to track FMLM progress
Improving access to transit both enhances the experience for existing users and attracts potential new transit users. This can be achieved by identifying real or perceived barriers from residential and commercial areas to transit origins and destinations, and designing cost-effective improvements to reduce or remove these barriers.
Based on public feedback received at outreach events in Montebello, improving both the perceived and actual safety (based on speed and volumes of motor vehicles) at and to bus stops in Montebello is the most critical issue to improving the first/last mile connections. The safety issue is also one of SCAG’s top priorities. SCAG’s commitment begins with understanding existing conditions and asking: What is happening? Where is it happening? When is it happening? Who is it happening to? And, most importantly- Why is it happening? As part of its commitment to improving safety across the regions, SCAG funds safety plans such as this one.
Each February SCAG establishes safety targets for five performance measures:
1. Number of Fatalities
2. Rate of Fatalities per 100 million Vehicle Miles Traveled (VMT)
3. Number of Serious Injuries
4. Rate of Serious Injuries per 100 million VMT
5. Number of Non–motorized Fatalities and Non–motorized Serious Injuries
“Southern California is home to roughly 19 million people, about half the entire state’s population, and 13 million licensed drivers. We rely on our cars, buses, rail lines, bicycles, and feet to get around. And we’re getting around a lot. We travel almost 430 million miles every day. That’s equivalent to 17,911 trips around the world every day. The thing is, we
aren’t going around the world. We’re going to work, the grocery store, to visit our grandma, and to our child’s soccer game. With all that traveling, it’s not surprising that mistakes are getting made. At the wrong moment, we might take a quick glance at a text message, rush to make it through a traffic signal, or forgo the intersection to cross midblock. The consequences of these mistakes can last a lifetime.” - From SCAG’s Regional Transportation Safety Existing Conditions Report
SCAG also developed a high-injury network (HIN) to demonstrate where high concentrations of fatal and serious collisions occur in the region. A HIN, however, is not an assessment of whether a street or location is dangerous. Rather, an HIN suggests corridor characteristics within a transportation network that carry a higher risk of injury. This allows SCAG to help cities to:
» Identify areas of need
» Provide agency staff with more information on where they can focus limited resources
» Provide opportunities to understand how communities of concern or disadvantaged communities are impacted by higher rates of collision and serious injury
» Assist with building greater public and political support.
In addition, SCAG provides additional resources in the form of the Safe and Active Streets Working Group, a Transportation Safety Program and the Go Human Campaign.


Montebello is a city in Los Angeles County, located just east of East Los Angeles and southwest of the San Gabriel Valley. The surrounding cities are Monterey Park, and Rosemead to the north, Commerce to the south, Pico Rivera to the east, and Los Angeles to the west. Understanding the existing roadway conditions and land use as well as other context-sensitive information in Montebello is critical for the first mile/ last mile planning process. This chapter uses various datasets collected from GIS resources such as from SCAG and the Transportation Injury Mapping System (TIMS). Topics discussed in the following sections include Montebello’s land use, bicycle and pedestrian collision history, and boarding and alighting volumes at the bus stops across the City.
Aside from the aforementioned data from SCAG and TIMS that is summarized and analyzed, this section maps out the Existing Transit Network, Existing Pedestrian Network, and the Existing Bicycle Network. It also delves into the numerous walk audits and bicycle audits performed as part of this study.
The datasets in this chapter provide valuable information and help create meaningful discussions on how each of the topics supports or impedes first mile/ last mile planning within the City.
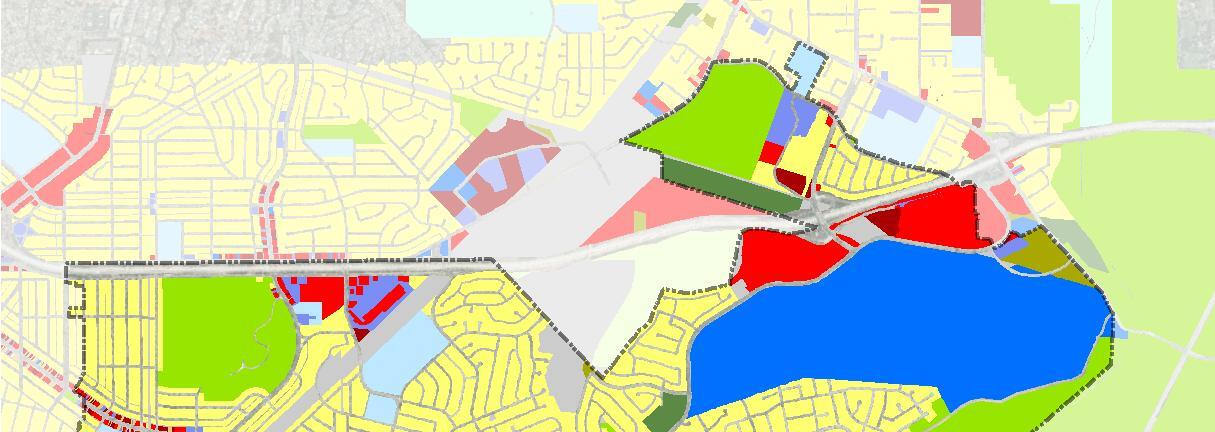
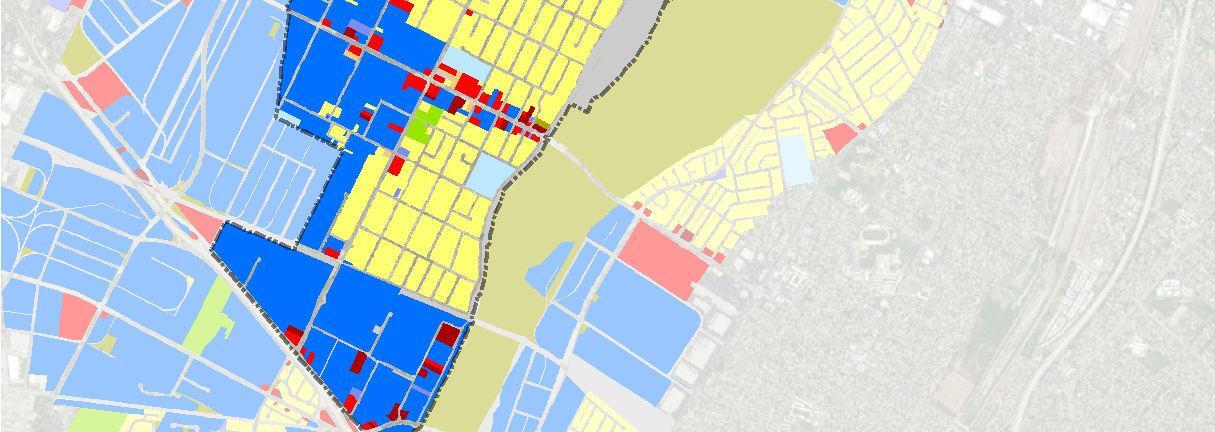
Figure 2-1 shows land uses within the City of Montebello plus some surrounding City land uses for context including the cities of Monterey Park and Rosemead to the north, Commerce, Bell Gardens and Downey to the south, Pico Rivera to the east, and East Los Angeles to the west.
Existing land use patterns in Montebello are typical of many Southern California communities. Commercial land uses primarily occur along major thoroughfares such as Beverly Boulevard and Whittier Boulevard near the middle of the City. Additional commercial and concentrated industrial uses are in the southern end of the City into the adjacent City of Commerce. More recently developed commercial retail centers are located at the north edge of the City off State Route 60. A mix of residential land uses dominate the central portion of the City with a classic grid pattern local road system and more recent meandering road system in the northern quarter of the City. The four maps in the subsequent four pages show the four quadrants of the City with the aforementioned land uses.
There are twenty-eight public elementary, intermediate, and high schools in the Montebello Unified School District, twelve of which reside in Montebello city proper. Most of the schools are located between the Whittier Boulevard and Beverly Boulevard corridors, with several others sprinkled through the City. Most schools within the City are located within a quarter mile, or five-minute walk, of a park. There are seven parks sprinkled throughout the City, not including open space such as the Whittier Narrows Recreation Area outside the northeast edge of Montebello, the Resurrection Cemetery, Rio Hondo Channel and the Montebello Country Club. It is important that the bicycle and pedestrian infrastructure exists to support travel between educational institutions and public parks to better connect people to places.
The City’s Downtown area spans three distinctive walkable neighborhoods along Whittier Boulevard running east to west through the heart of the City. This major commercial and dining destination, alongside the local schools and parks, are key land use areas that draw both residents and visitors. Additional regional retail centers are located at the City’s north edge off State Route 60. With the high quality MBL transit system, plus all future improved active transportation networks, the goal is for all the residents of Montebello to be able to access these destinations safely, comfortably, and efficiently.
To be eligible for State funding to improve the networks, a City’s bicycle and pedestrian plan must address connections between specific activity center types. Identifying these centers, and their appeal for the community, is essential to creating useful bicycle and pedestrian networks, and securing necessary funding for design and construction.


Montebello Bus Lines (MBL) is the third largest municipal bus system in Los Angeles County, with a fleet of 66 buses and provides service to the cities of Alhambra, Bell Gardens, Commerce, La Mirada, Los Angeles, Montebello, Monterey Park, Pico Rivera, Rosemead, San Gabriel, Santa Fe Springs, South Gate, Vernon, Whittier, and portions of Unincorporated Los Angeles County. MBL operates seven local routes, one express route connecting Montebello and Downtown Los Angeles, a semi-fixed-route feeder service, and a Dial-A-Taxi. Serving more than seven million passengers over the past ten years, MBL is committed to providing comprehensive public transportation services and maximizing the comfort and safety of all users.
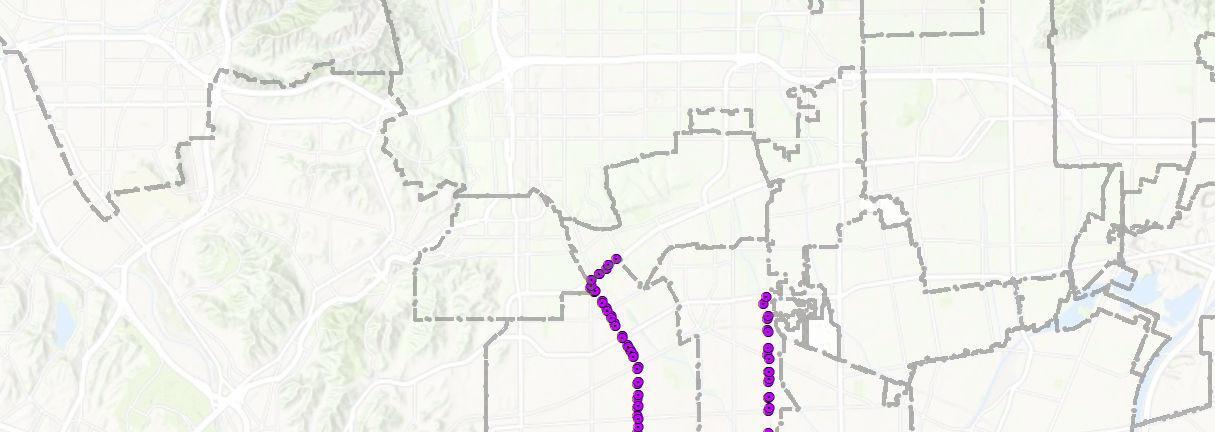
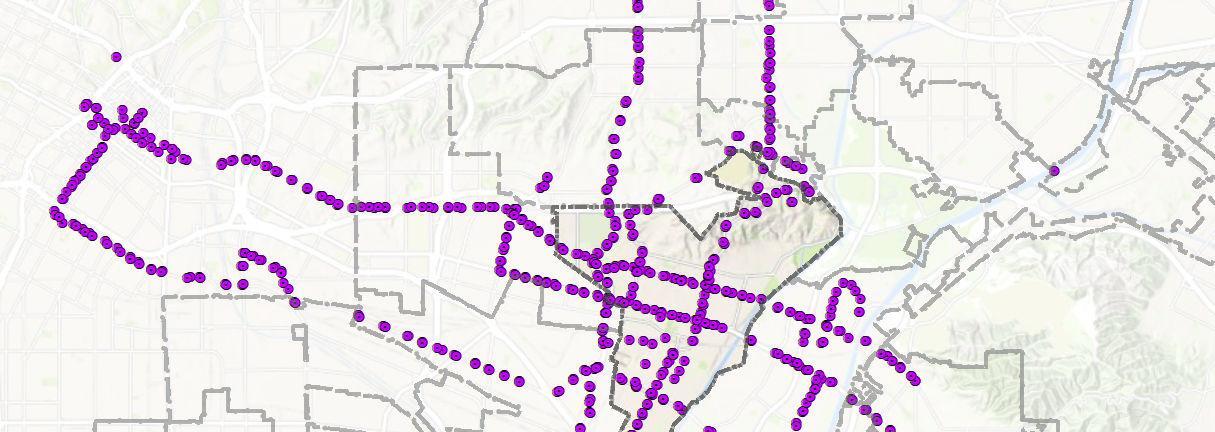
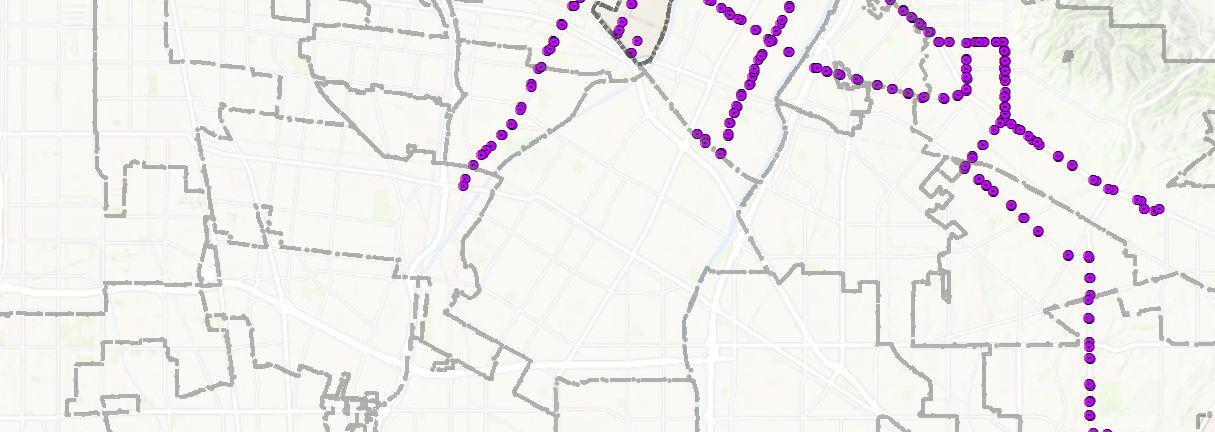
Figure 2-2 shows all 862 MBL bus stops that serve the City of Montebello and adjacent cities.
Within the City of Montebello, there are 189 bus stops, as seen in Figure 2-3. Primary transit corridors in the City of Montebello follow Beverly Boulevard, Whittier Boulevard, Washington Boulevard, Wilcox Avenue, Greenwood Avenue and Montebello Boulevard. Beverly Boulevard, Whittier Boulevard and Washington Boulevard run east-west and the latter three run north-south.
The most heavily utilized bus stops for both boardings and alightings are along Whittier Boulevard, Montebello Boulevard, Beverly Boulevard, and The Shops at Montebello. Additionally, there are high numbers of boardings at Beverly Boulevard and Wilcox Avenue. As Beverly and Whittier Boulevards are the two main east-west commercial corridors and Montebello Boulevard at Greenwood Avenue are the primary north-south corridors, it is expected that they have the heaviest transit use.
Glendale Pas adena
Los Angeles
Sierra Madre Br adbury
Monr ovia Duarte Ar cadia
South Pas adena Temple City San Gabriel
Ir windale San Marino
Alham bra
Rosem ead
Monterey Park
Vernon
Commerc e
Bell May wood
Huntington Park Bell G ardens
Baldw in Park El Monte
South El Monte Indus try La Puente
Uninc or porated
Pic o Riv era
Compton
South Gate
Downey Cudahy
Santa Fe Springs
Norwalk La Mirada
Paramount Bellflow er

Cars on Long Beac h Ar tes ia
0 1 0 5 Miles
Lak ew ood
Hawaiian Gardens
Cerritos
The City of Montebello is considered somewhat walkable with a walk score of 66, according to WalkScore. com. Walk Score determines the central, west portion of the City as the most walkable, which mirrors the locations of some of the busiest transit stops: Whittier Boulevard at Garfield Avenue, Whittier Boulevard at Montebello Boulevard, and Montebello Boulevard at Beverly Boulevard. A strong transit corridor boosts walkability through access, safety, and comfort. City policy recommends safety improvements, where feasible. Recommendations of this report look carefully at improving perceived and actual safety at these high-volume transit stops through the addition of pedestrian amenities such as curb ramps, bus boarding areas, connecting sidewalks, improved sidewalks, lighting, seating, and crossings.
The City of Montebello has an extensive network of sidewalks that connect nearly all areas of the City with the exception of a few relatively small gaps as shown in Figures 2-6 through 2-9. KTUA developed the sidewalk data layer by reviewing high resolution aerial imagery to find gaps in sidewalks, then digitizing a single line approximately at the center of each sidewalk’s width and then lines were drawn for the full length of the existing sidewalk gap. As shown in the following figures, the sidewalk gaps are not at locations with pedestrian collisions suggesting the gaps in sidewalks are not the cause of pedestrian collisions with vehicles. Though not the cause of many collisions, the lack of a continuous sidewalk network inhibits a comfortable walking environment, discourages pedestrian activity, and hinders wheelchair accessibility. Most sidewalk gaps are located at residential front yards except for a few short segments of commercial area on Olympic Boulevard, 4th Street, Greenwood Avenue, near the middle of the City and Vail Avenue, Union Street and Gage Road at the south end of the City. A continuous sidewalk network would not only increase pedestrian activity, but especially enhance the pedestrian experience for persons with disabilities, mobility aids, strollers, and the elderly, who may rely on walking and transit as a primary mode of travel.
Unincorporated
! Bus stops
Sid ewa lk Gaps
Sch oo ls, E ducation
Parks, O pe n Space City B ou ndary
Montebello Commerce
2-7: Sidewalk Gaps, Western Enlargement
Unincorporated
! Bus stops Sid ewa lk Gaps
Sch oo ls, E ducation Parks, O pe n Space City B ou ndary
Unincorporated
! Bus stops
Sid ewa lk Gaps
Sch oo ls, E ducation
Parks, O pe n Space City B ou ndary
The existing bicycle facility network in Montebello is quite limited. A 5.2-mile segment of the Rio Hondo multi-use bike path exists along the Rio Hondo Flood Control Channel, a 2.2-mile segment of Class 2 buffered and standard bike lanes on North Montebello Boulevard, and a 0.8-mile bike lane on Avenida De La Merced. Figures 2-10 through 2-13 show both existing bicycle facilities (marked with a solid line) and proposed bicycle facilities (marked with a dashed line).
The bicycle network was analyzed for connectivity as part of the community and stakeholder engagement process. The engagement process was used to gather additional input on routes people feel are important and should move forward as recommendations. Although the City does not currently have a substantial bicycle facility network, it has an excellent road grid network, showing the future potential for a top-class bicycle network. The SCAG 2020-2045 Regional Transportation Plan/Sustainable Communities Strategy and the City of Montebello General Plan propose additional bike routes to connect people to City destinations and to the surrounding region.
As shown on the detailed bicycle network figures on the following pages, collisions with vehicles occur frequently on streets that are lacking bicycle lanes. A few streets worth noting in terms of missing bicycle lanes and no plans to install new bike lanes are noted below. If a bike lane, especially a separated bike lane, were installed on these noted streets, they would help reduce, ideally eliminate, injury collisions.
» Beverly Boulevard across almost the entire City width
» Wilcox Avenue around Schurr High School
» Via Campo paralleling Highway 60 at the north edge of the City
» Maple Avenue near Washington Elementary and Montebello Middle School
» Cleveland Avenue across the entire City width
» Los Angeles Avenue east of Park Avenue to the east City limit
» South Montebello Boulevard south of Roosevelt Avenue to Washington Boulevard
» Washington Boulevard across the entire City width
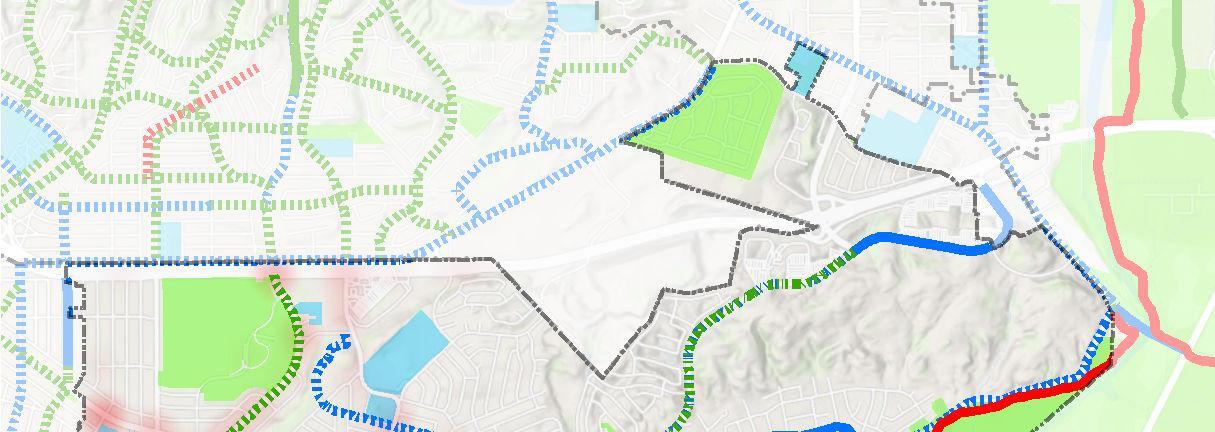

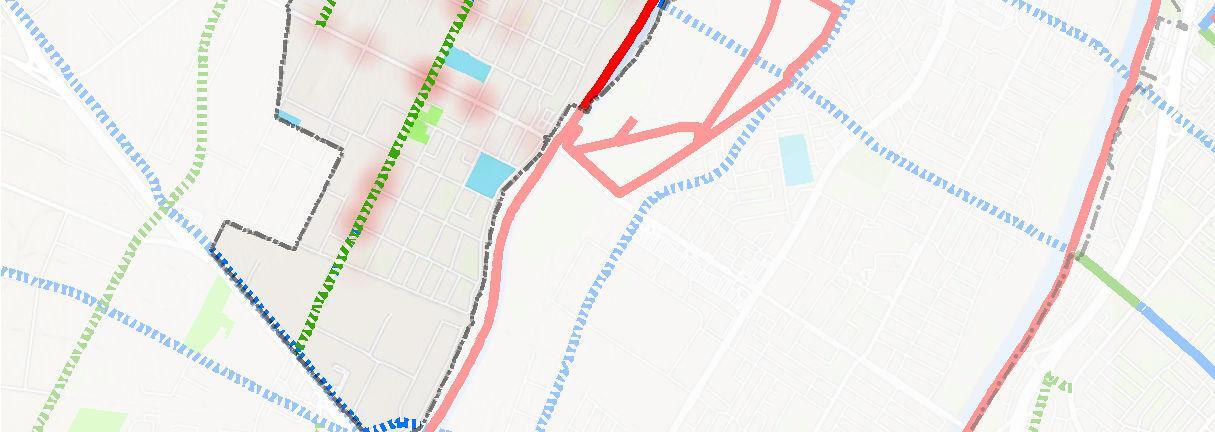

Figure 2-10: Bicycle Facilities
! Bus stops
Unincorporated
Bike Fa cility - Existing
2-B ike L an e Stripe
Bike Fa cility - Proposed
2-B ike L an e Stripe
3-B ike Ro ute Sharrow
Sch oo ls, E ducation
Parks, O pe n Space
City B ou ndary
Bik e & P ed Collision
De nsity 20 11-2021
High
Lo w
! All B ike- Ped Collisions
2-11: Bicycle Facilities, Eastern Enlargement
! .
Bus stops
Bike Fa cility - Existing
Unincorporated
1-Cl ass 1 Bi ke Path/Multiuse Path
2-B ike L an e Stripe
Bike Fa cility - Proposed
2-B ike L an e Stripe
3-B ike Ro ute Sharrow
Sch oo ls, E ducation
Parks, O pe n Space
City B ou ndary
Bik e & P ed Collision
De nsity 20 11-2021
High
Lo w
! All B ike- Ped Collisions
2-12: Bicycle Facilities, Southern Enlargement
Unincorporated
SLAUSON
! Bus stops
Bike Fa cility - Existing
1-Cl ass 1 Bi ke Path/Multiuse Path
Bike Fa cility - Proposed
2-B ike L an e Stripe
3-B ike Ro ute Sharrow
Pico Rivera
Sch oo ls, E ducation
Parks, O pe n Space
City B ou ndary
Bik e & P ed Collision
De nsity 20 11-2021
High
Lo w ! All B ike- Ped Collisions
Micromobility is generally defined as any small, lowspeed, human- or electric-powered transportation device, such as bicycles, scooters, electric-assist bicycles, electric scooters (e-scooters), and other small, lightweight, wheeled devices. Micromobility devices can be individually owned or part of a shared network that includes docking stations and mobile applications. Shared micromobility systems are generally deployed in targeted service areas with the intent to close the “first- and last-mile” connections to complete trips made via other modes, including transit. Micromobility can also provide an alternative form of transportation for those with short trips or commutes to reduce vehicular congestion. Example systems in the region include Lyft Scooters and Veo Micromobility in Santa Monica and Lime Scooter in the City of Los Angeles.
Currently, the City of Montebello does not have an e-scooter or bikeshare program. However, from the General Plan’s Part C, Our Accessible Community chapter, strategies and action items have been developed to improve mobility and first-last mile connections. The implementation of bicycle and pedestrian facilities will be an integral component of the street if micromobility programs are introduced. The following strategies and action items are identified to help the City integrate micromobility and are derived from the Public Transit and Rideshare section of the General Plan, verbatim.
Strategies
» Support rideshare and shared mobility by providing sufficient curb space for passenger loading at key destinations.
» Incorporate micromobility (e.g., bike share and scooter share) into transit and active transportation improvements.
» A4.3a The development and implementation of first-last mile (FLM) improvements could include bikeshare and scootershare stations at key destinations.
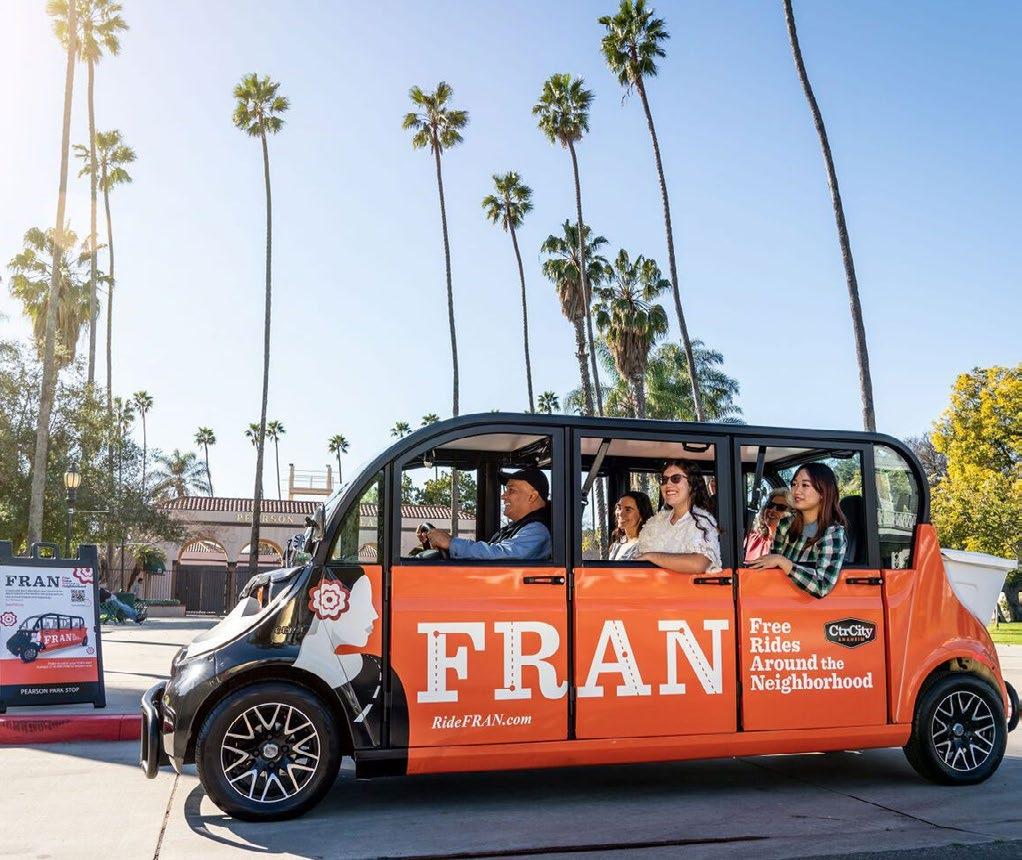
Microtransit refers to pooled rides in shared van shuttles running on fixed or on-demand routes and schedules. An MBL program with similarities is the Metrolink Shuttle which accommodates passengers arriving at the Montebello/Commerce Station to their
desired location. Like buses and ride-hailing services, such as Uber and Lyft, microtransit shuttles can serve unmet mobility needs of underserved populations. Microtransit can benefit many Montebello residents, especially those that live more than a half mile away from the Montebello/Commerce Station or popular destinations within the City. Many low-income transit-dependent households reside where transit service is limited to infrequent circulator buses, limited operating hours, and the need to make multiple transfers to complete trips. Microtransit will make it easier for these underserved residents and those with disabilities to get around.
Fortunately, the General Plan’s Part C, Our Accessible Community chapter, has included strategies to explore microtransit within the City. The following strategies and action items are derived from the Public Transit and Rideshare section of the General Plan, verbatim.
» Study options for supplementing local bus service and improving connections to local destinations and rail stations such as local shuttles, demand responsive services, or microtransit services.
» Improve connectivity within growth neighborhoods, areas of opportunity and for transit-dependent populations to enhance access to local and regional transit services.
» Explore the feasibility of establishing a microtransit or fixed-route shuttle service to provide convenient access between the future Gold Line Greenwood Station and key local destinations such as the Downtown Specific Plan area, City Hall, and the Beverly Boulevard corridor.
A mobility hub consists of a transit station that provides multimodal transportation options to and from the station and surrounding area. They serve an important function in the regional transportation system as an origin, destination, or transfer point for a significant number of trips. Mobility hubs provide connectivity where different modes of transportation, such as micromobility, ride sharing or car sharing, all come together seamlessly. Ideally a concentration of land uses that support work, live and play is adjacent to a mobility hub but that’s not always the case. Mobility hubs can also have additional amenities such as lighting, shelters, bicycle parking and micromobility docking stations.
Mobility hubs may result in a number of benefits:
» Increased first and last mile improvements within the surrounding area
» Increased transportation choices for residents, employees, and visitors
» Increased transportation choices for residents in disadvantaged communities
» Decreased dependence on single occupancy vehicles
» Reduced traffic congestion and vehicle miles traveled
» Reduced transportation costs
Mobility hubs should be explored at the Montebello/ Commerce Metrolink Station, the future Metro light rail Greenwood Station and potentially popular destinations within the City such as the downtown area. The General Plan’s Part C, Our Accessible Community chapter, has included objectives to explore mobility hubs and generally improve the Montebello/ Commerce Station and supporting transit-oriented development within the City. The following strategies and action items are derived from the Public Transit and Rideshare section of the General Plan, verbatim.
Strategies
» Implement small- and large-scale mobility hubs at key multimodal transfer points.
» A4.2d Enhance bus stops in the city incorporating high-quality transit stop design and amenities that create a simple, legible, and pleasant experience at the bus stop.
» A4.2f Coordinate land use and transportation planning efforts to develop transit-supportive land uses near existing and future major transit hubs.
» A4.3c Create small-scale mobility hubs at key multimodal transfer points.
» A4.3d Implement larger-scale mobility hubs along Montebello Boulevard and Greenwood Avenue to facilitate multimodal access to/from the future Gold Line Station.


Objective
Walk and bike audits were conducted along identified corridors in Montebello to better understand existing pedestrian and bicycle infrastructure, or lack thereof, that may limit active transportation trips to and from transit service. Findings will be used to inform recommendations for infrastructure improvements to improve first-last mile connections to transit stops.
Twelve audits were conducted over two days in February 2023. Audit routes were identified along corridors with a higher propensity of pedestrian and bicycle crashes to better understand challenges and opportunities in different parts of Montebello. Collision data, available from the TIMS, between 2011-2021 were used to identify walk and bike audit routes. All the walk and bike audits were open to the public except the four conducted with Montebello High School and Schurr High School. Audit routes are listed below and described in more detail in the subsequent section.
» Walk Audit #1 (Washington Boulevard, Date Street, Montebello Boulevard, and Greenwood Avenue)
» Walk Audit #2 (Whittier Boulevard from Montebello Boulevard to Bluff Road)
» Walk Audit #3 (Greenwood Avenue from Date Street to Elm Street)
» Walk Audit #4 (Beverly Boulevard, Poplar Avenue, Victoria Avenue, and Montebello Boulevard)
» Walk Audit #5 (Beverly Boulevard from 21st Street to Via Val Verde)
» Walk Audit #6 (Beverly Boulevard from Maple Street to Montebello Boulevard)
» Walk Audit #7 (Montebello High School and surrounding area)
» Walk Audit #8 (Montebello High School and surrounding area)
» Walk Audit #9 (Wilcox Avenue, Hay Street, Morris Place, and Lincoln Avenue)
» Walk Audit #10 (Wilcox Avenue, Donta Way, Morris Place, and Hay Street)
» Bike Audit #1 (Olympic Boulevard, Greenwood Avenue, Beach Street, Vail Avenue, Washington Boulevard and Maple Avenue)
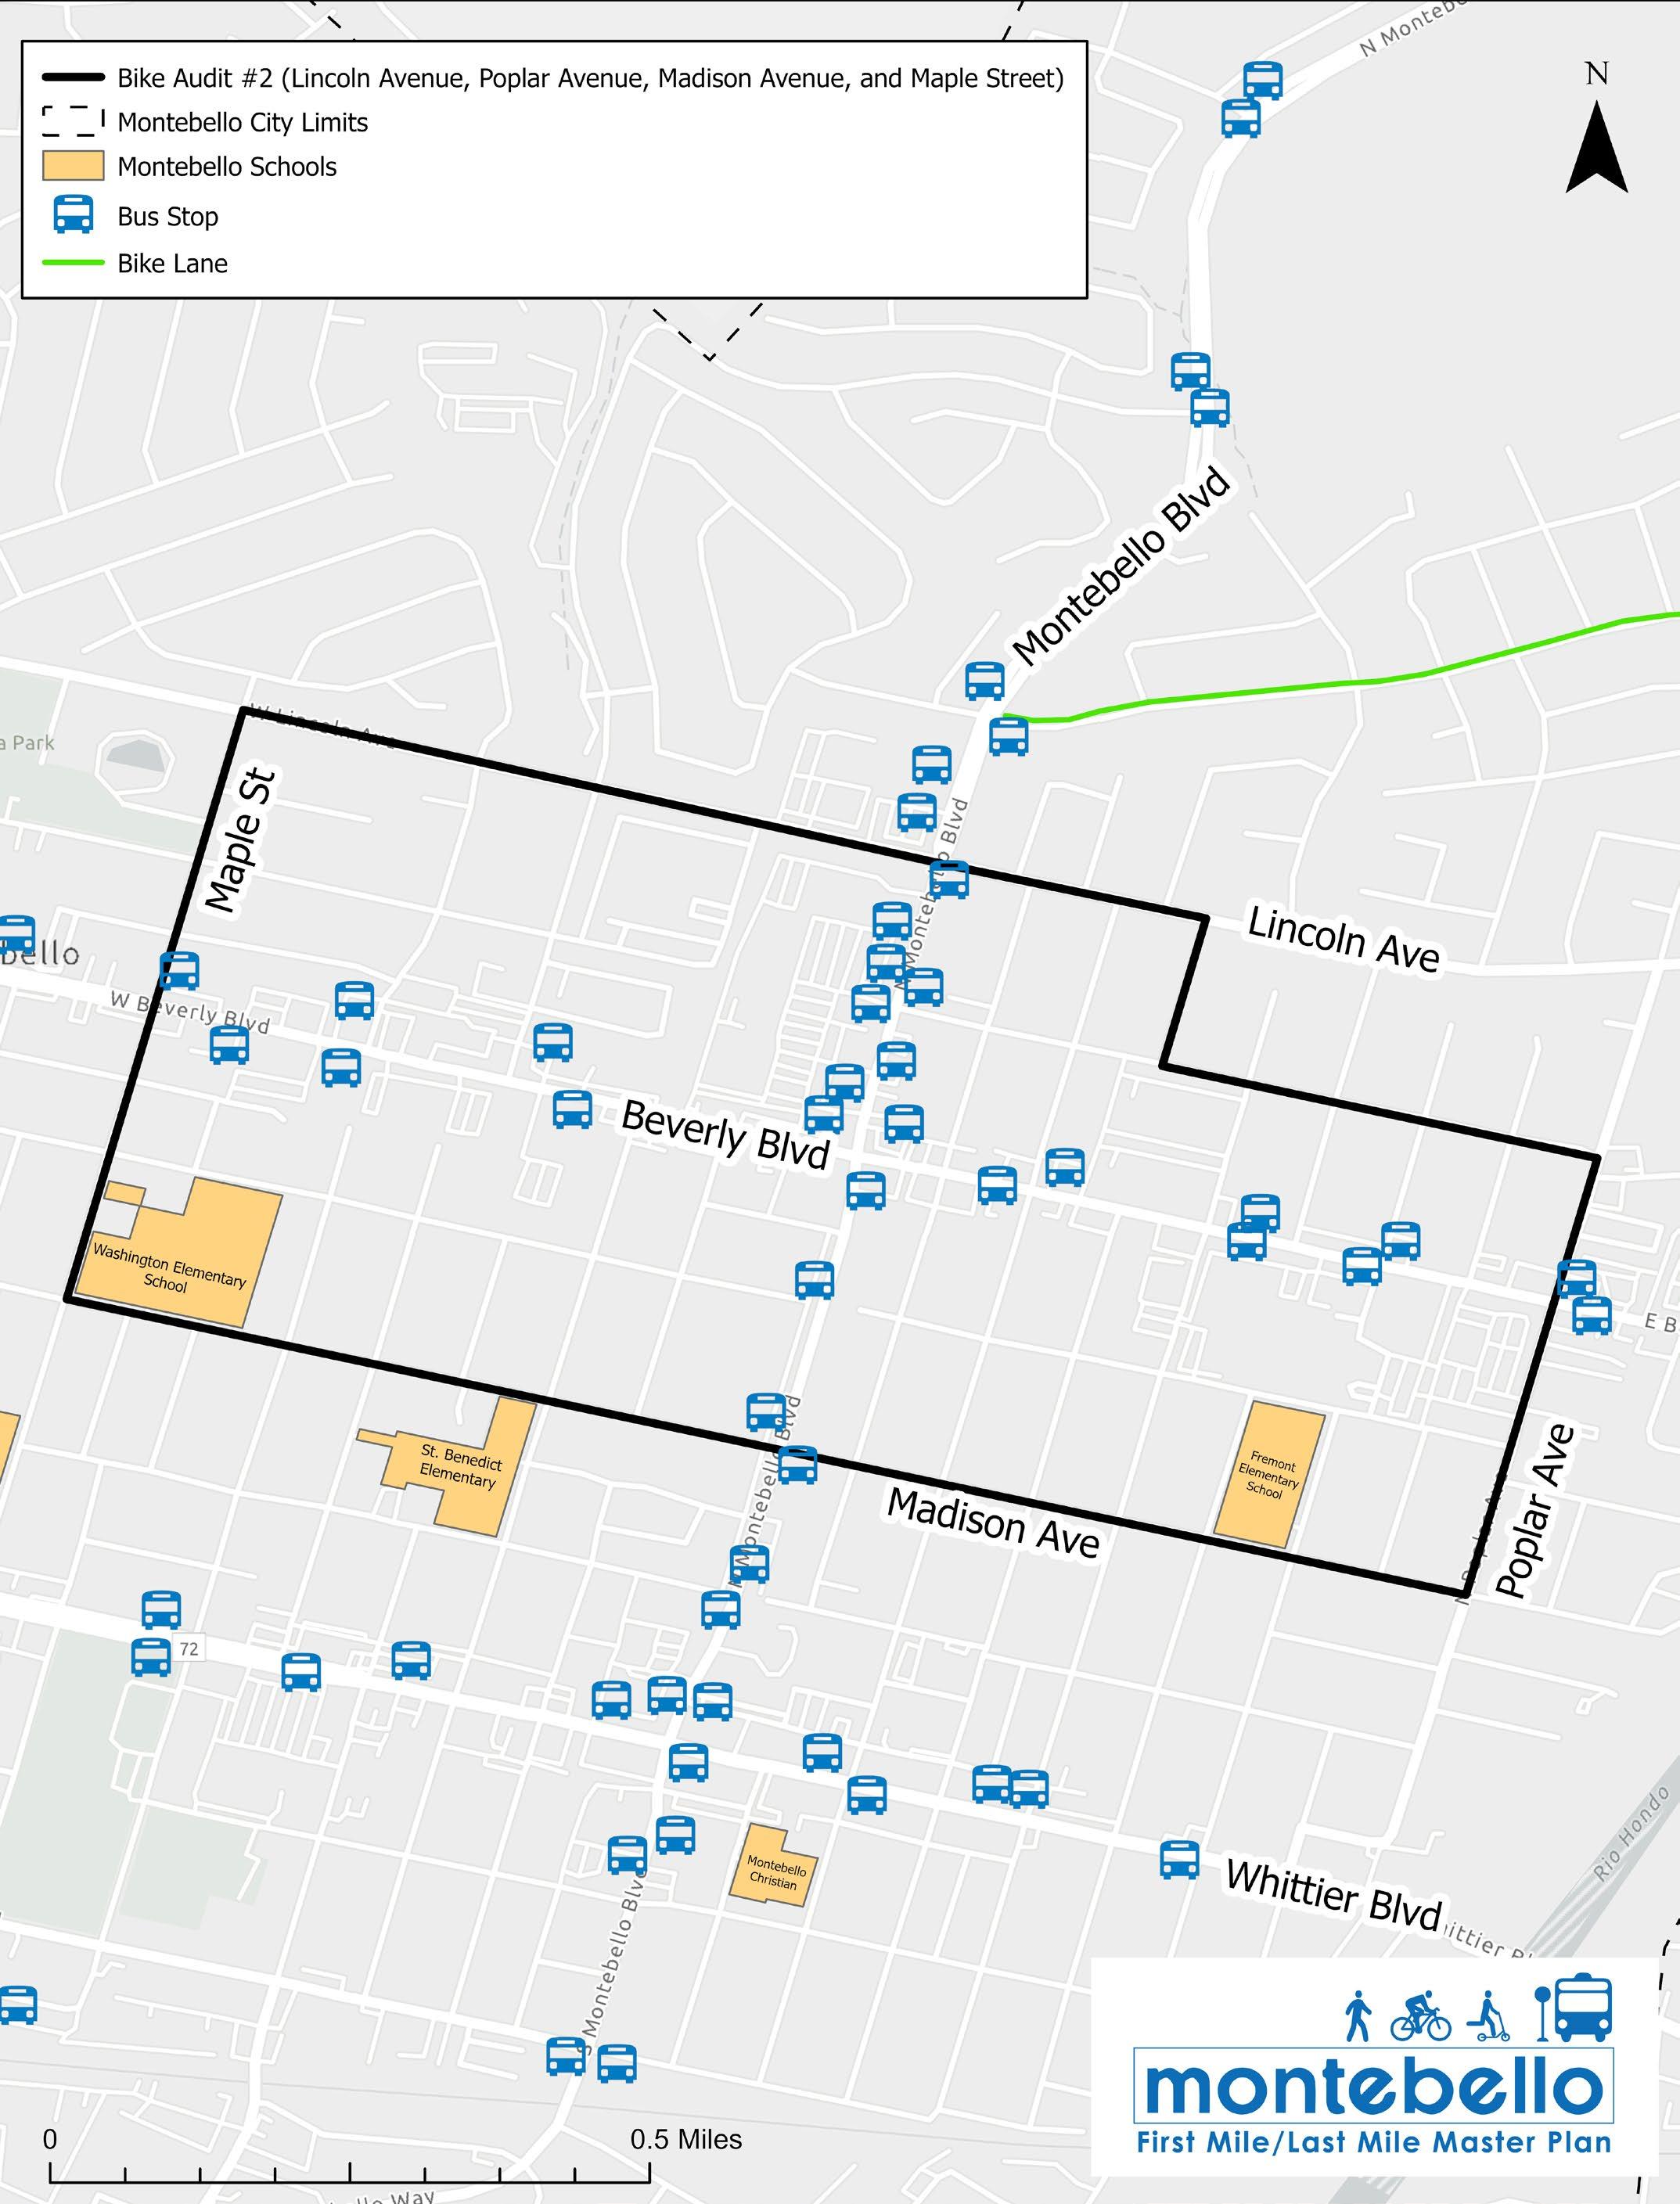
» Bike Audit #2 (Lincoln Avenue, Poplar Avenue, Madison Avenue, and Maple Street)
For each walk and bike audit, a data collection tool was developed. Each tool included a map of the area to be surveyed and a questionnaire to be completed during the audit. The questionnaire asked participants about the condition and usability of the pedestrian or bike network, including safety, comfort, behaviors, and other general questions. Participants were asked to indicate on the map any issues they encountered during the audit using a number that corresponded to that topic in the questionnaire. Discussions and feedback during the walk and bike audits were also recorded and compiled by the project team.
The audits, the exception being the ones conducted with the high school students, were open to the public. A trilingual flyer (English, Spanish, and Mandarin) was created to invite the public to participate. It was posted on Montebello Bus Line buses and in two local libraries, Montebello City Hall, multiple community centers, and high-volume bus stops within Montebello city proper. The flyer was also posted on Montebello social media channels and the project website.
The following pages provide detailed summaries of the existing conditions observed on each walk and bicycle audit. Included are maps of each route, site photos, and an elaborated explanation of the gaps and deficiencies in the pedestrian and bicycle networks, such as substandard sidewalks, insufficient street lighting and/or crosswalks, lack of adequate bicycle infrastructure, and high-volume, high-speed corridors. It also highlights opportunities where improvements or targeted programs could be expected to result in increased pedestrian and bicycle activity.
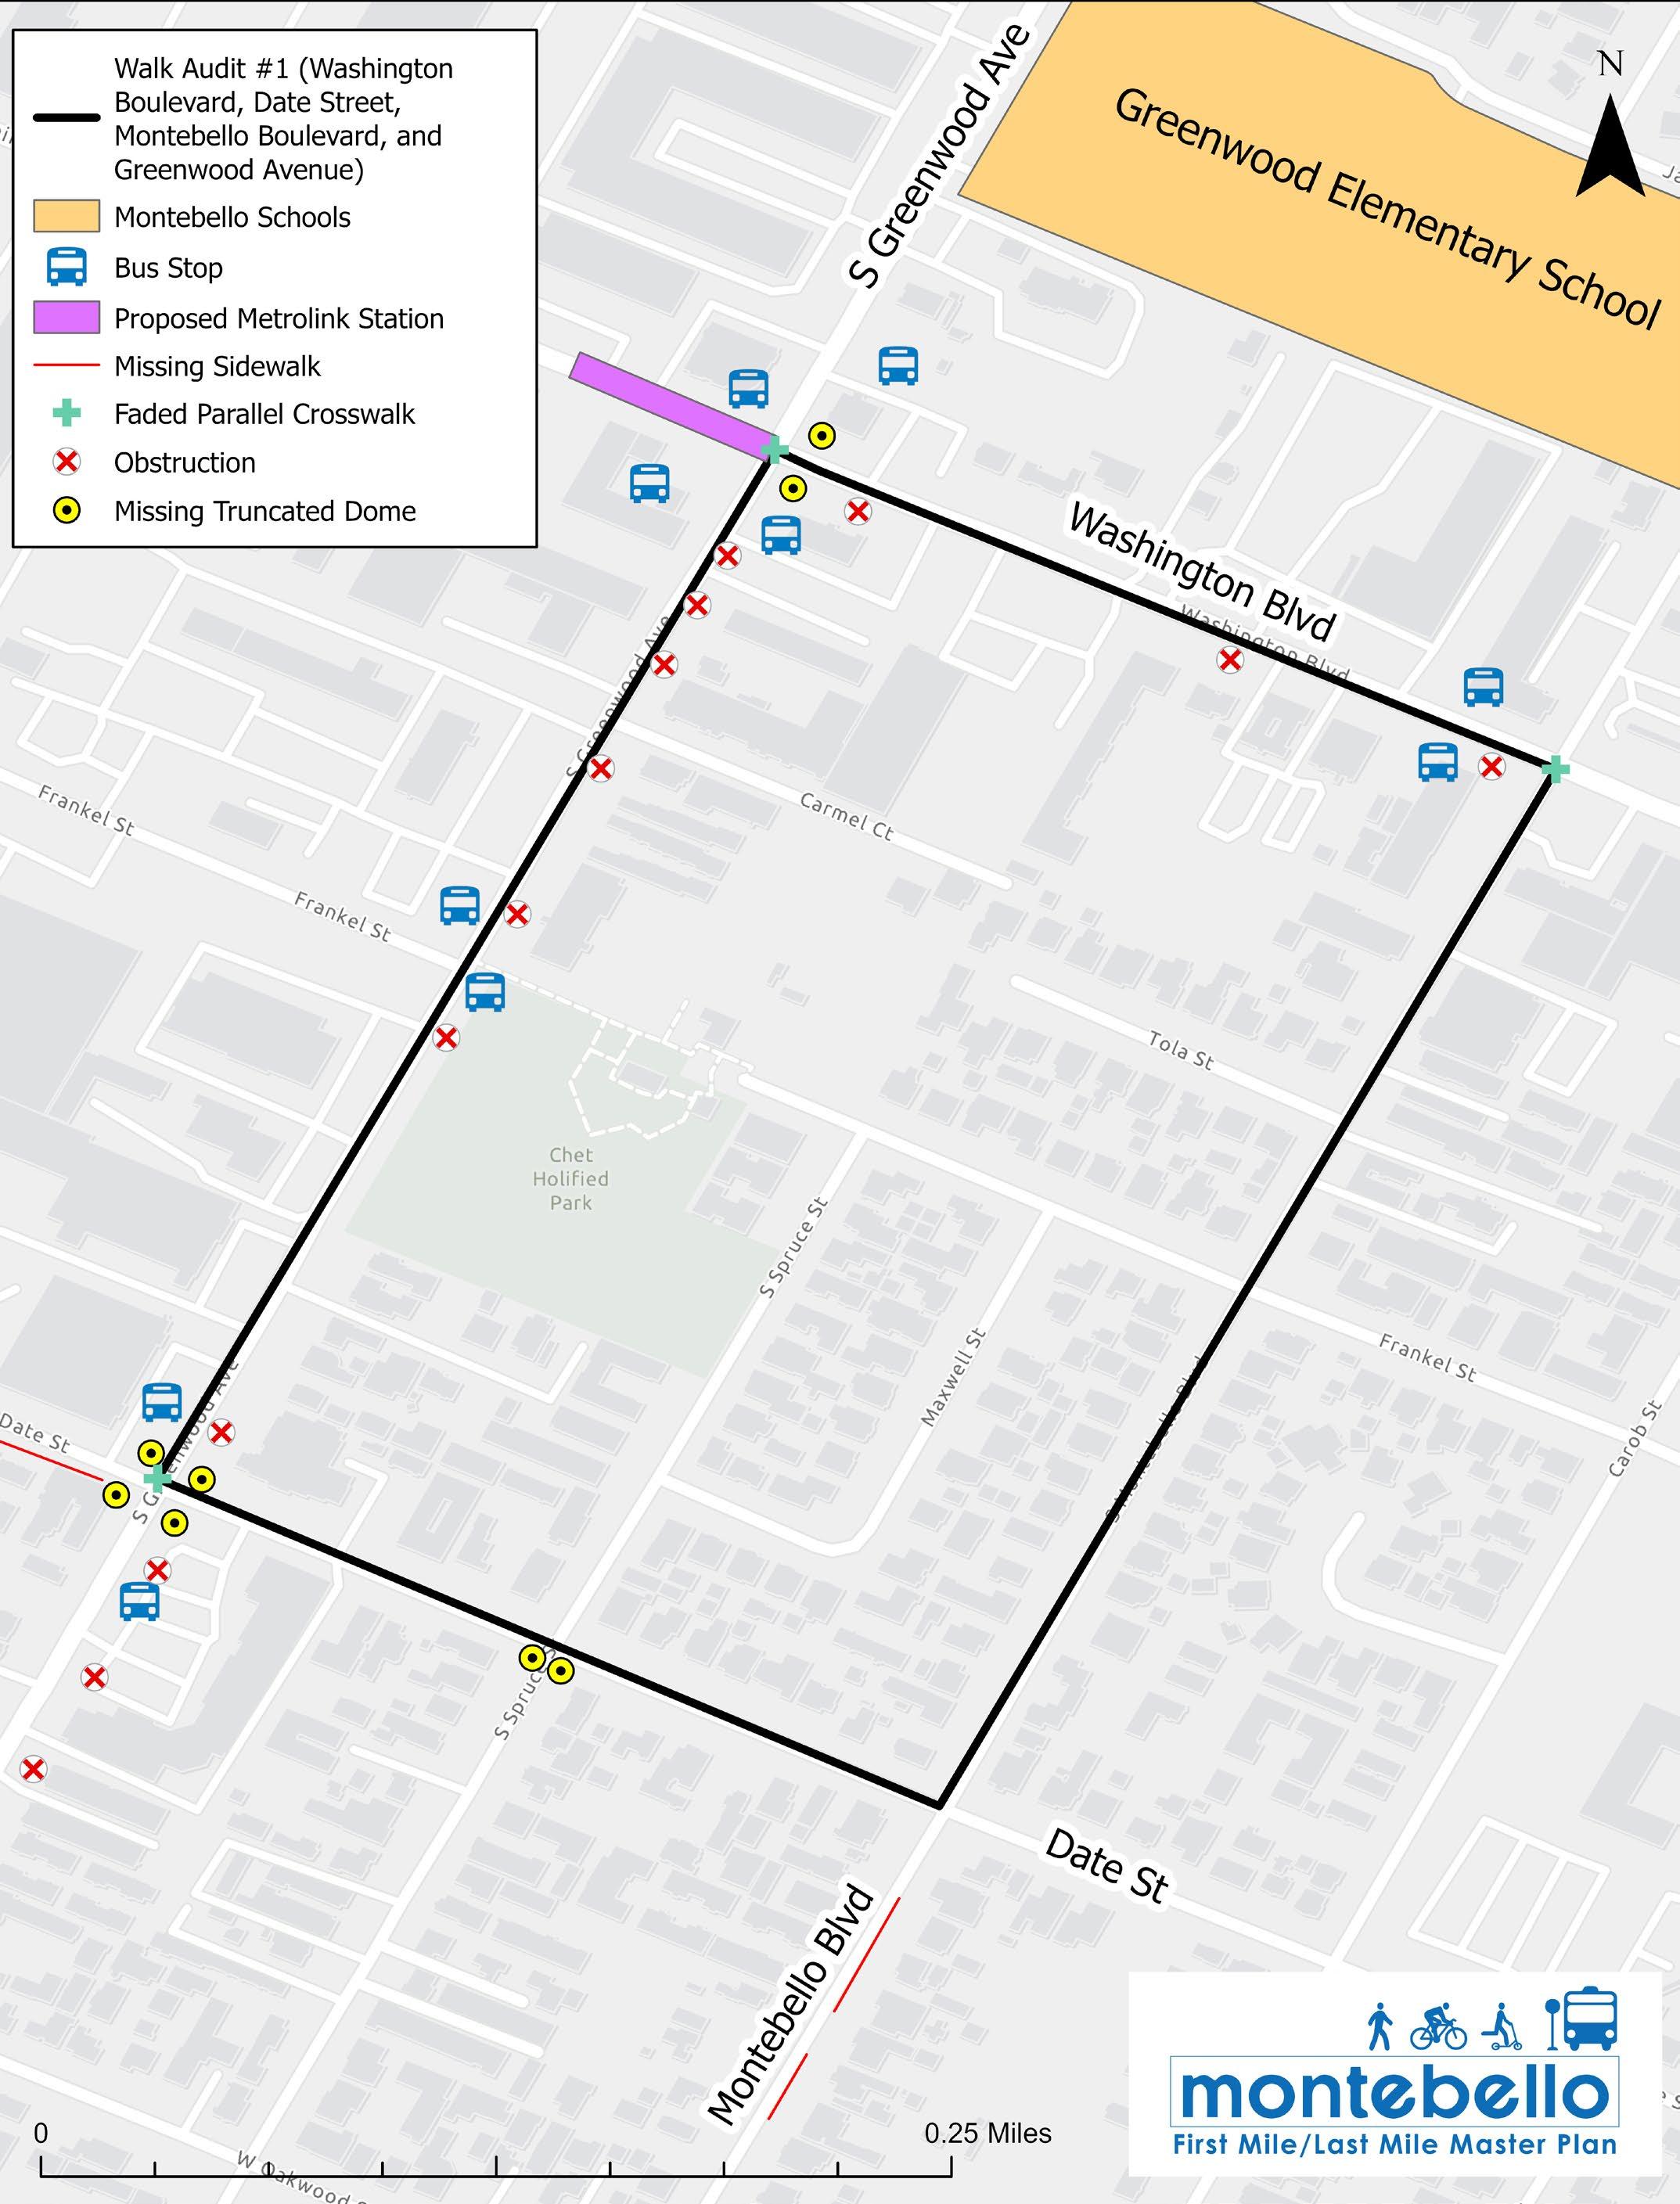
The walk audit route is in the southern region of Montebello, along Washington Boulevard between Greenwood Avenue and Date Street, and adjacent residential streets. Montebello Boulevard has primarily industrial and residential land uses. The area near the intersection of Washington Boulevard and Greenwood Avenue is the site of the proposed Metrolink Gold Line extension stop. Nearby bus routes include Lines 20, 50, and 70.
Throughout the walk audit, there were various features, or lack thereof, that were observed that contribute to real or perceived safety issues and concerns for pedestrians, as demonstrated in Figure 2-14.
Crosswalk markings were observed to be faded, some of the curb ramps were missing truncated domes, and there were a frequent number of obstructions along the sidewalk. These obstructions included utility boxes and light poles. Speeding was also observed along Washington Boulevard and Greenwood Avenue.


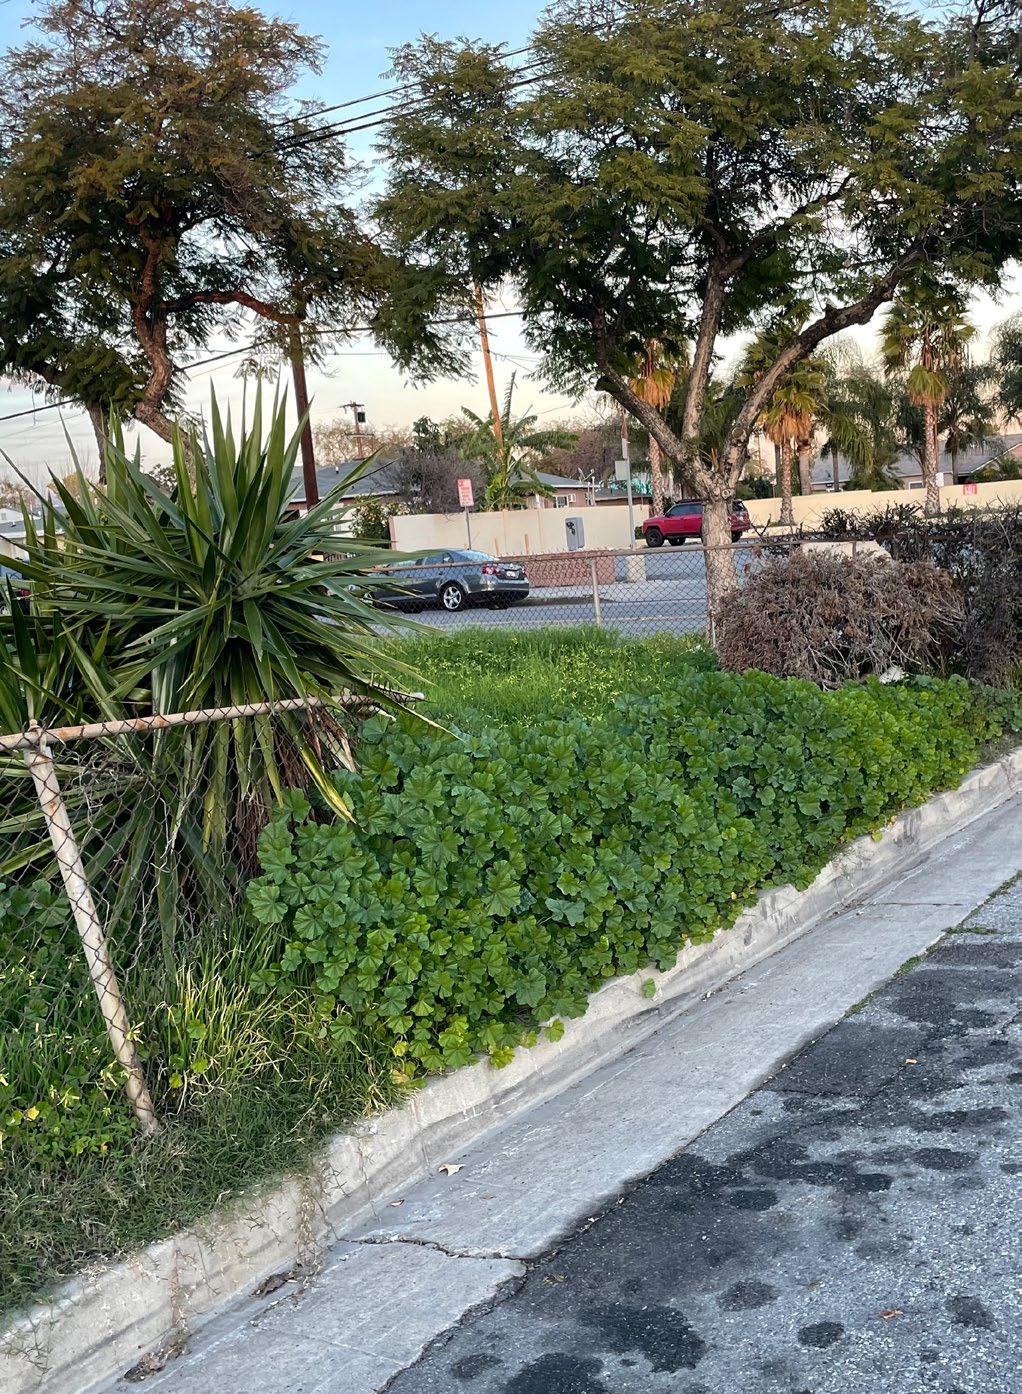
The sidewalks were observed to be in good condition with no major breakages or missing portions along the walk audit route, however the number of obstructions would be difficult for someone with a mobility aid, stroller, or visual impairment. The lack of adequate lighting makes people feel unsafe between dusk and dawn and less inclined to walk, roll, or bicycle if they do not have to.
The walk audit route was conducted during the post-morning hours in Downtown Montebello along Whittier Boulevard between Montebello Boulevard and Bluff Road. The area is a popular pedestrian destination, especially during the night-time, stressing the importance of lighting and safe crossings. Nearby bus routes include Lines 10 and 20.
The project team observed conditions that would contribute to real or perceived safety issues and concerns for pedestrians. Traffic-controlled intersections were missing audible and pedestrian countdown signals and some of the curb ramps were missing truncated domes. Obstructions, such as utility boxes in the middle of the sidewalk, were observed in a few locations but otherwise, the sidewalk is in good condition.
Unlike other parts of the City, this portion of Whittier Boulevard has pedestrian-scale lighting and sidewalks are slightly wider than seen in other parts of the City, which led to a more positive pedestrian experience. Both parallel and high-visibility crosswalks were observed along the walk audit route. The markings in many locations were faded which is primarily true for the parallel crosswalks.
The corridor was equipped with some bicycle parking along the sidewalk . Bicyclists were also observed riding on the sidewalk since there were no low-stress bicycle facilities in the high-speed, high-volume public right-of-way. This can increase potential conflicts with pedestrians and can create a high-stress pedestrian experience.


The walk audit route included the portion of Greenwood Avenue between Date Street and Elm Street. This corridor is adjacent to industrial and residential land uses. Line 20 bus route is nearby, running along Greenwood Avenue.
Figure 2-16 displays a map of the existing conditions observed during the walk. Crosswalk markings were observed to be faded, traffic-controlled intersections were missing audible and/or pedestrian countdown signals, some of the curb ramps were missing truncated domes, and several obstructions along the sidewalk. These obstructions included utility boxes, light poles, fire hydrants and bus benches/shelters.
The sidewalks are in good condition with only one breakage observed along the route. However, the sidewalks are narrow in some locations, which could be challenging for people to walk side by side, for those with strollers, and for those using wheelchairs or other mobility devices. Another perceived issue seemed to be the lack of proper lighting for pedestrians along the roads. Lack of proper lighting for pedestrians leads to uncomfortable walking conditions during the early morning and evening hours.


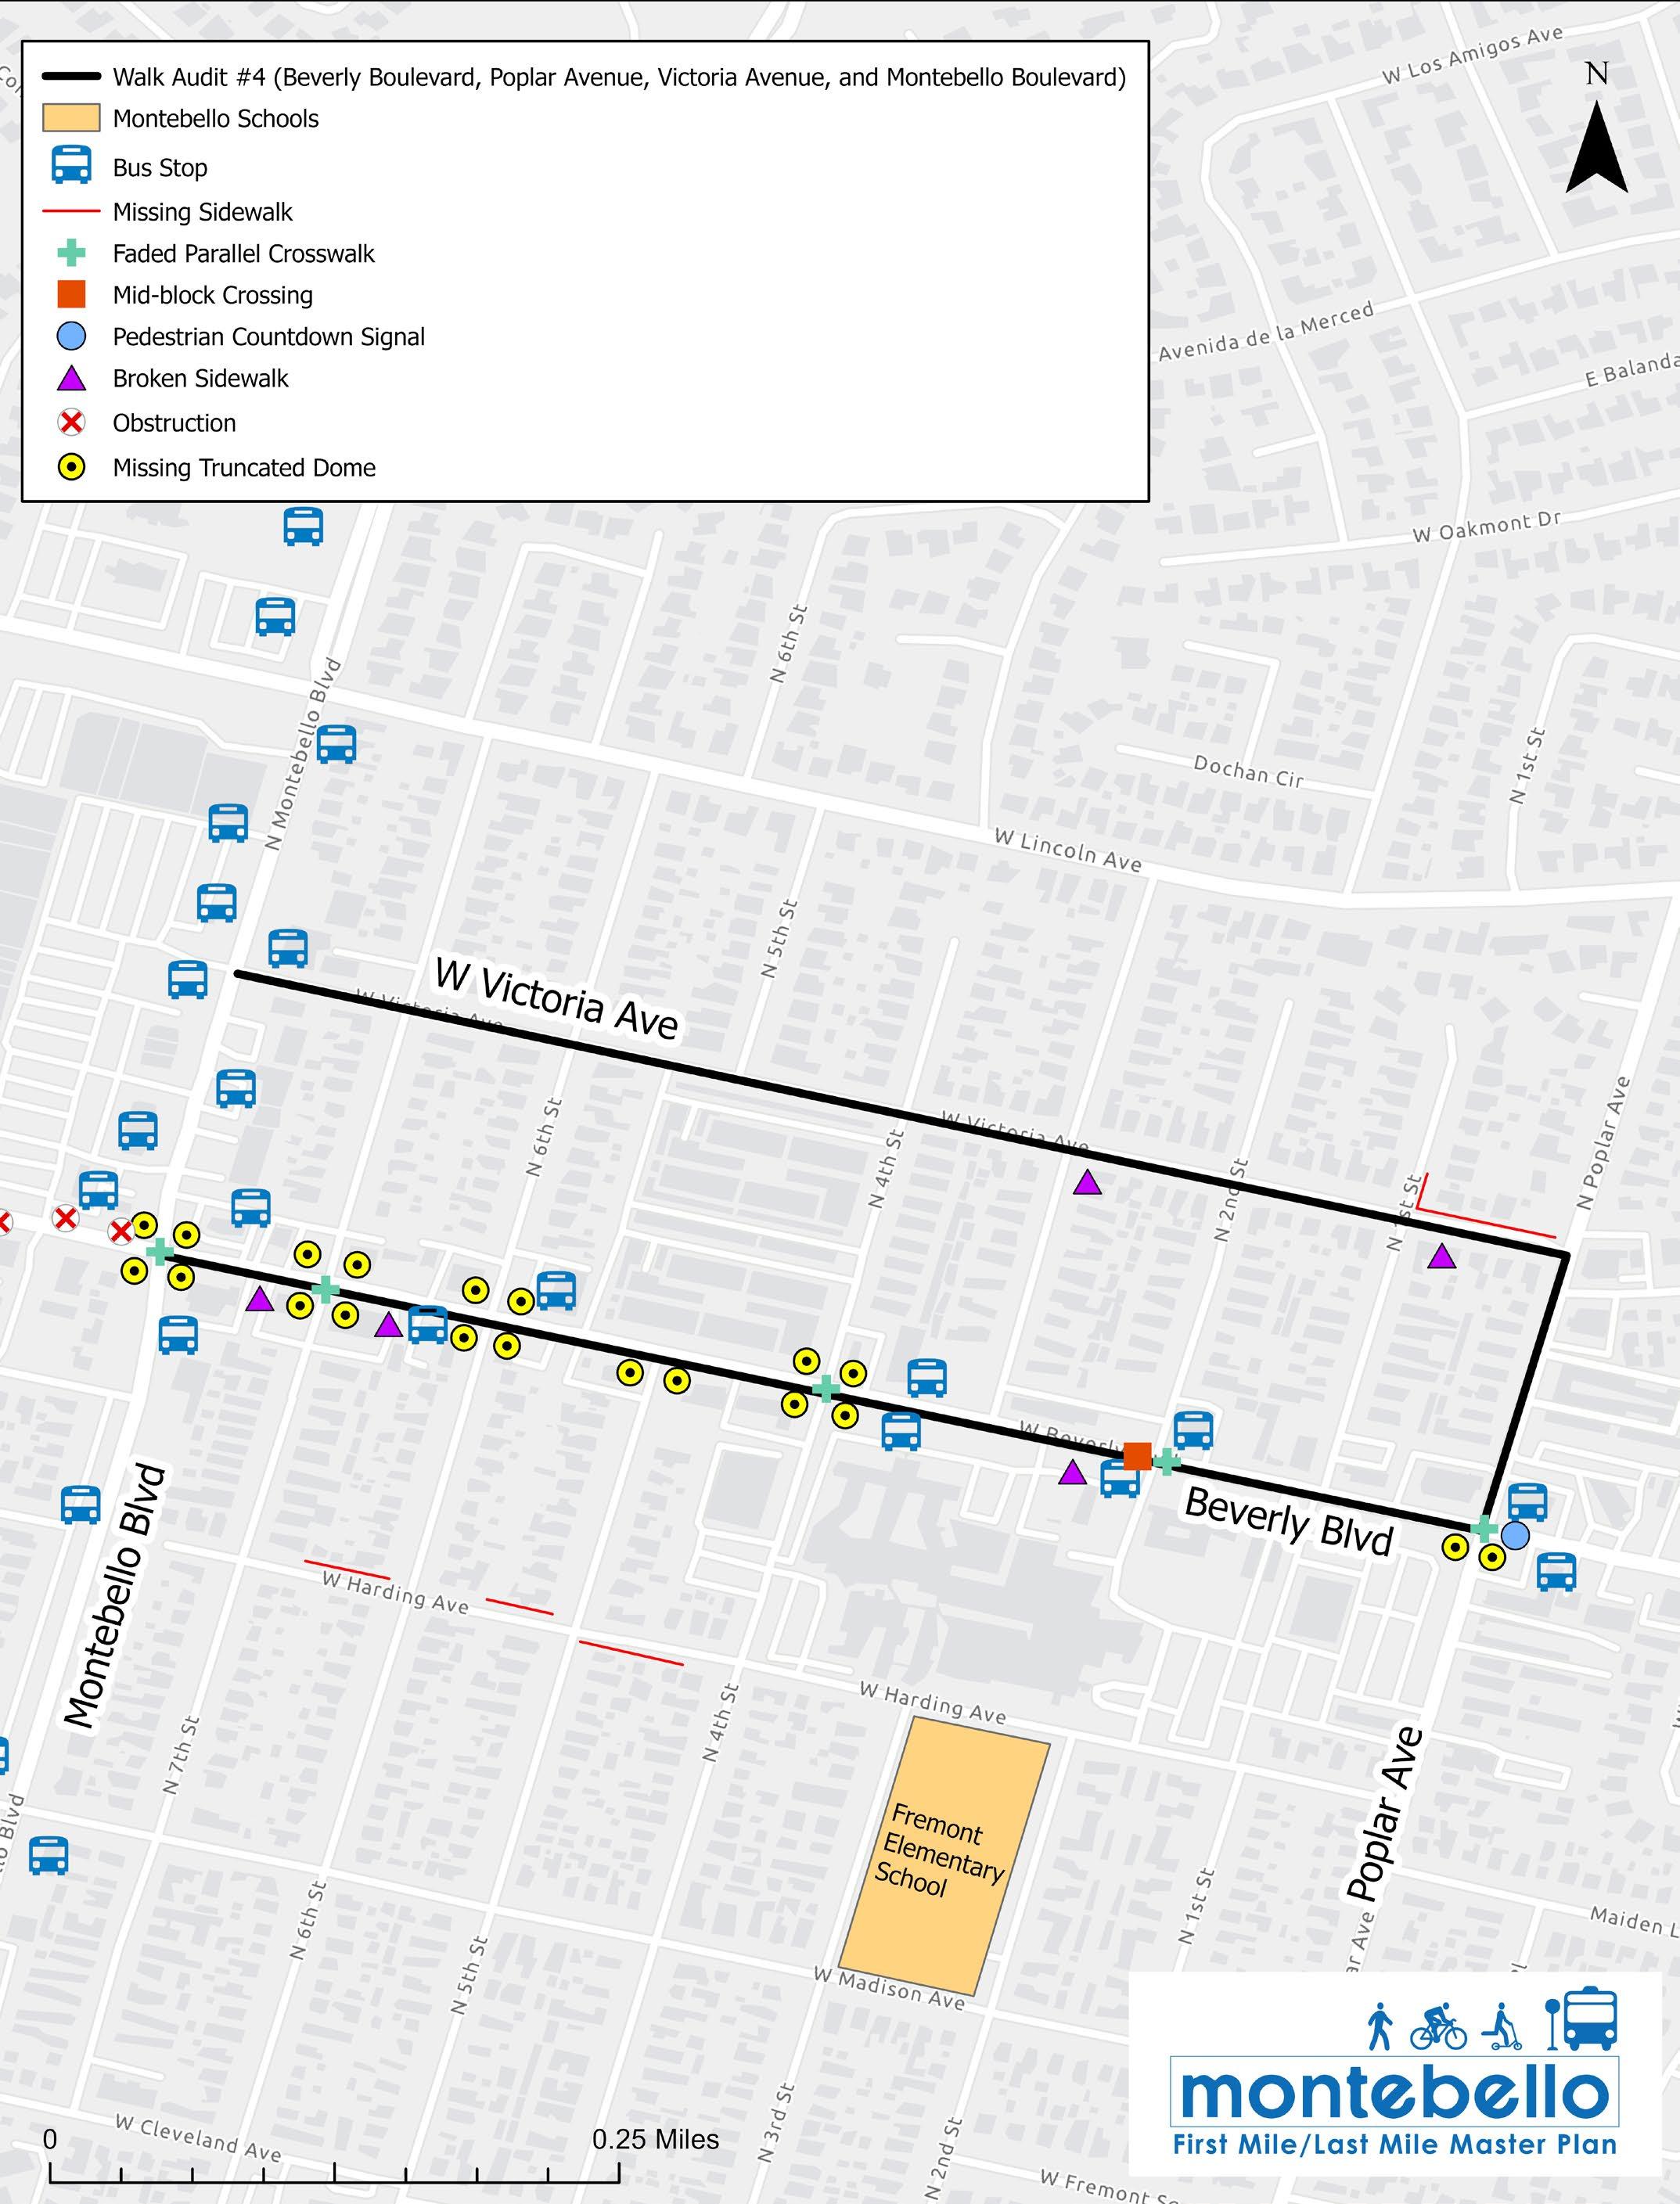
This walk audit route included a portion of the Beverly Boulevard corridor from Montebello Boulevard to Poplar Avenue and a residential corridor in Victoria Avenue. The audit took place in an area that is primarily commercial/residential near the Montebello Civic Center. Nearby bus routes include Lines 20, 40, and 90.
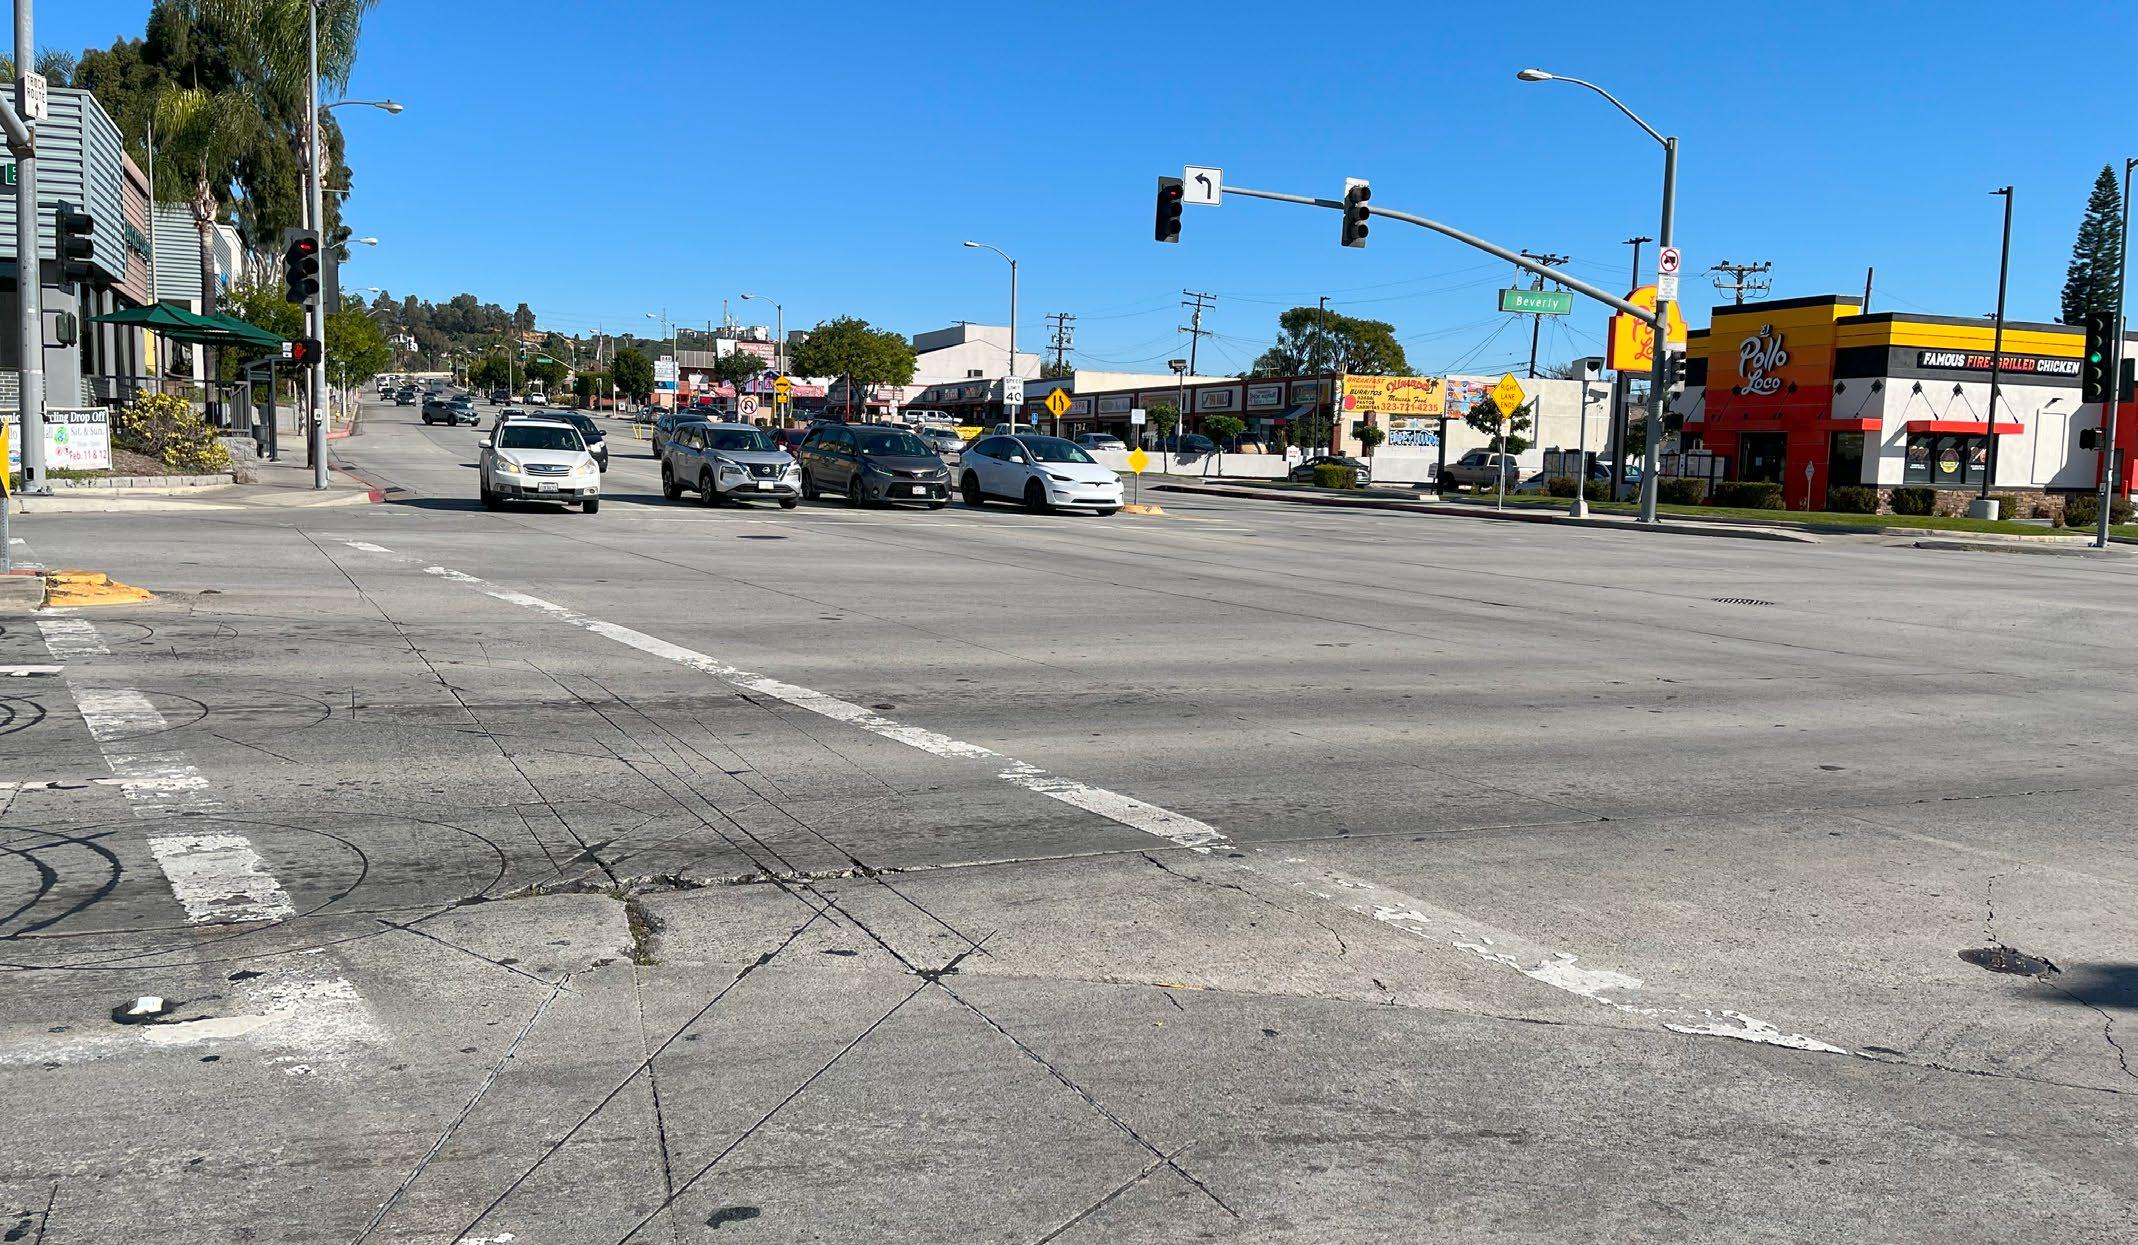
Figure 2-17 displays a map of the existing conditions observed during the walk. Crosswalk markings were observed to be faded, some of the curb ramps were missing truncated domes, and a frequent number of obstructions along the sidewalk, including utility boxes and light poles.
Throughout the audit, the team noticed a few areas of broken sidewalk along the Beverly Boulevard and Victoria Avenue corridors. A pedestrian countdown signal was observed at the intersection of Beverly Boulevard and Poplar Avenue. A mid-block crossing is located at the intersection of 2nd Street and Beverly Boulevard. Although the mid-block crossing exists, vehicles were observed not yielding to pedestrians. Another perceived issue seemed to be the lack of proper lighting for pedestrians along the roads which could lead to unsafe conditions for all users during the early morning and evening hours.
This walk audit took place in the post-morning rush hours in a primarily commercial and residential area along Beverly Boulevard corridor from 21st Street to Via Val Verde. This area is important since it sits between Montebello’s two biggest high schools, Montebello High School and Schurr High School. Student foot traffic is high when students enter and leave the school in the morning and afternoon hours of the day. Nearby bus routes include Lines 40 and 90.
Figure 2-18 displays a map of the existing conditions observed during the walk. Crosswalk markings were observed to be faded, some of the curb ramps were missing truncated domes, and a frequent number of obstructions along the sidewalk. These obstructions included utility boxes, light poles, and bus stop shelters and benches.
During the morning hours, 6:30 am to 9:00 am, this portion of the Beverly Boulevard corridor is equipped with signage not allowing people to park on the street to increase traffic capacity along the roadway. However, during the audit, the project team encountered
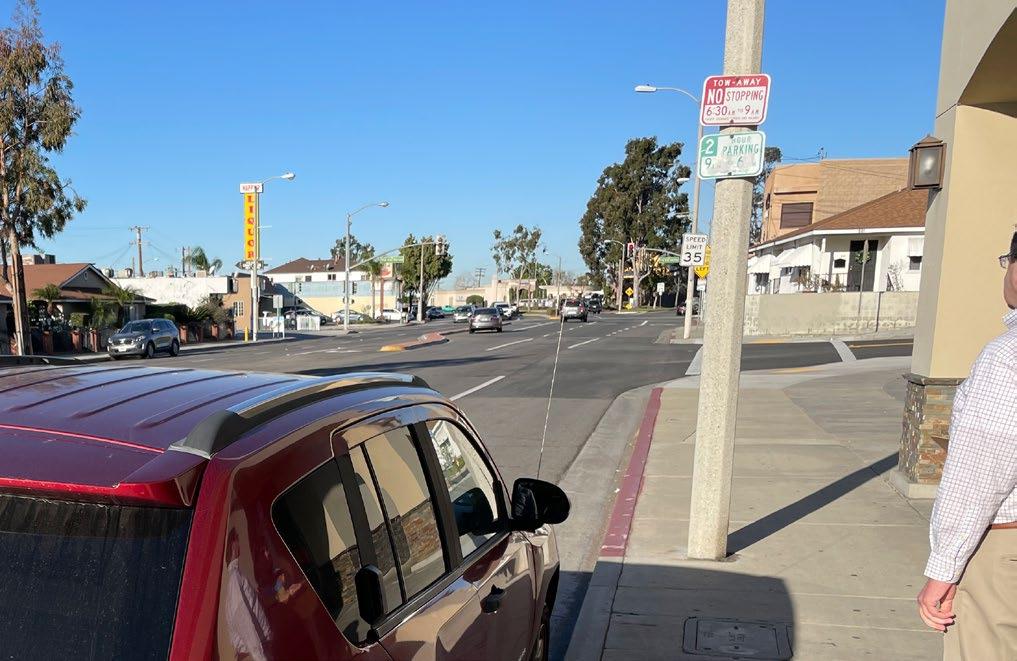
multiple vehicles parked on the road at around 8:00 am. The signs are currently not being enforced and offenders are not being ticketed.
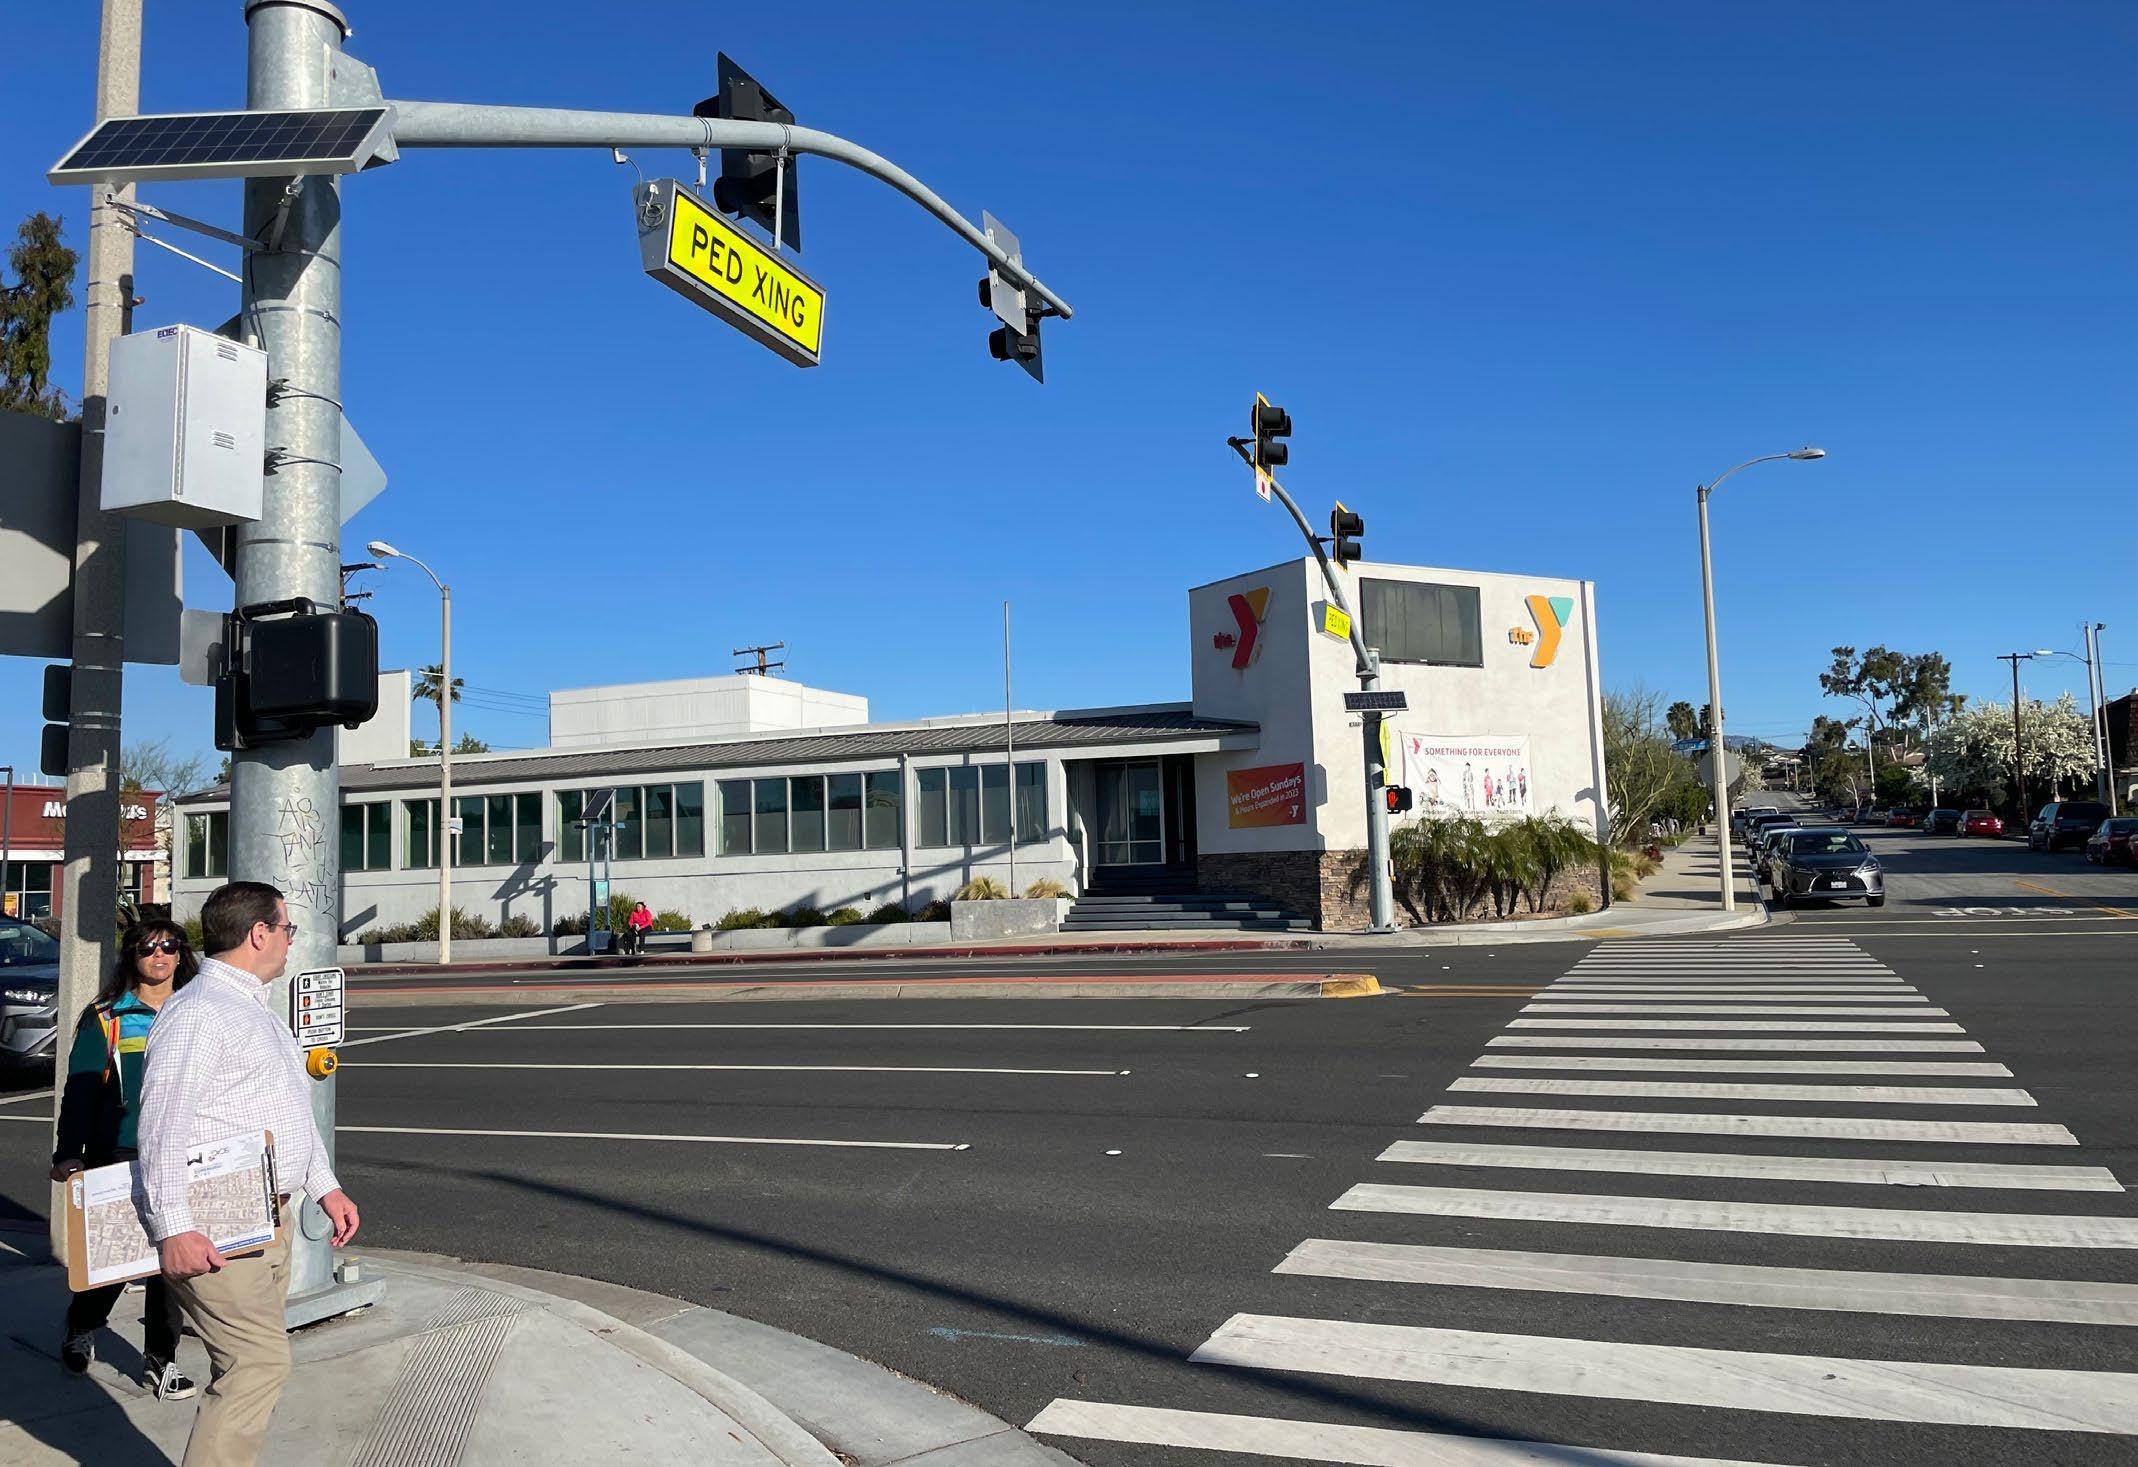
At the intersection of Beverly Boulevard and 20th Street, a High-Intensity Activated Crosswalk (HAWK) is currently installed. This infrastructure allows pedestrians to safely cross the road as vehicles are signaled to stop by allowing pedestrians 25 seconds to cross the road.

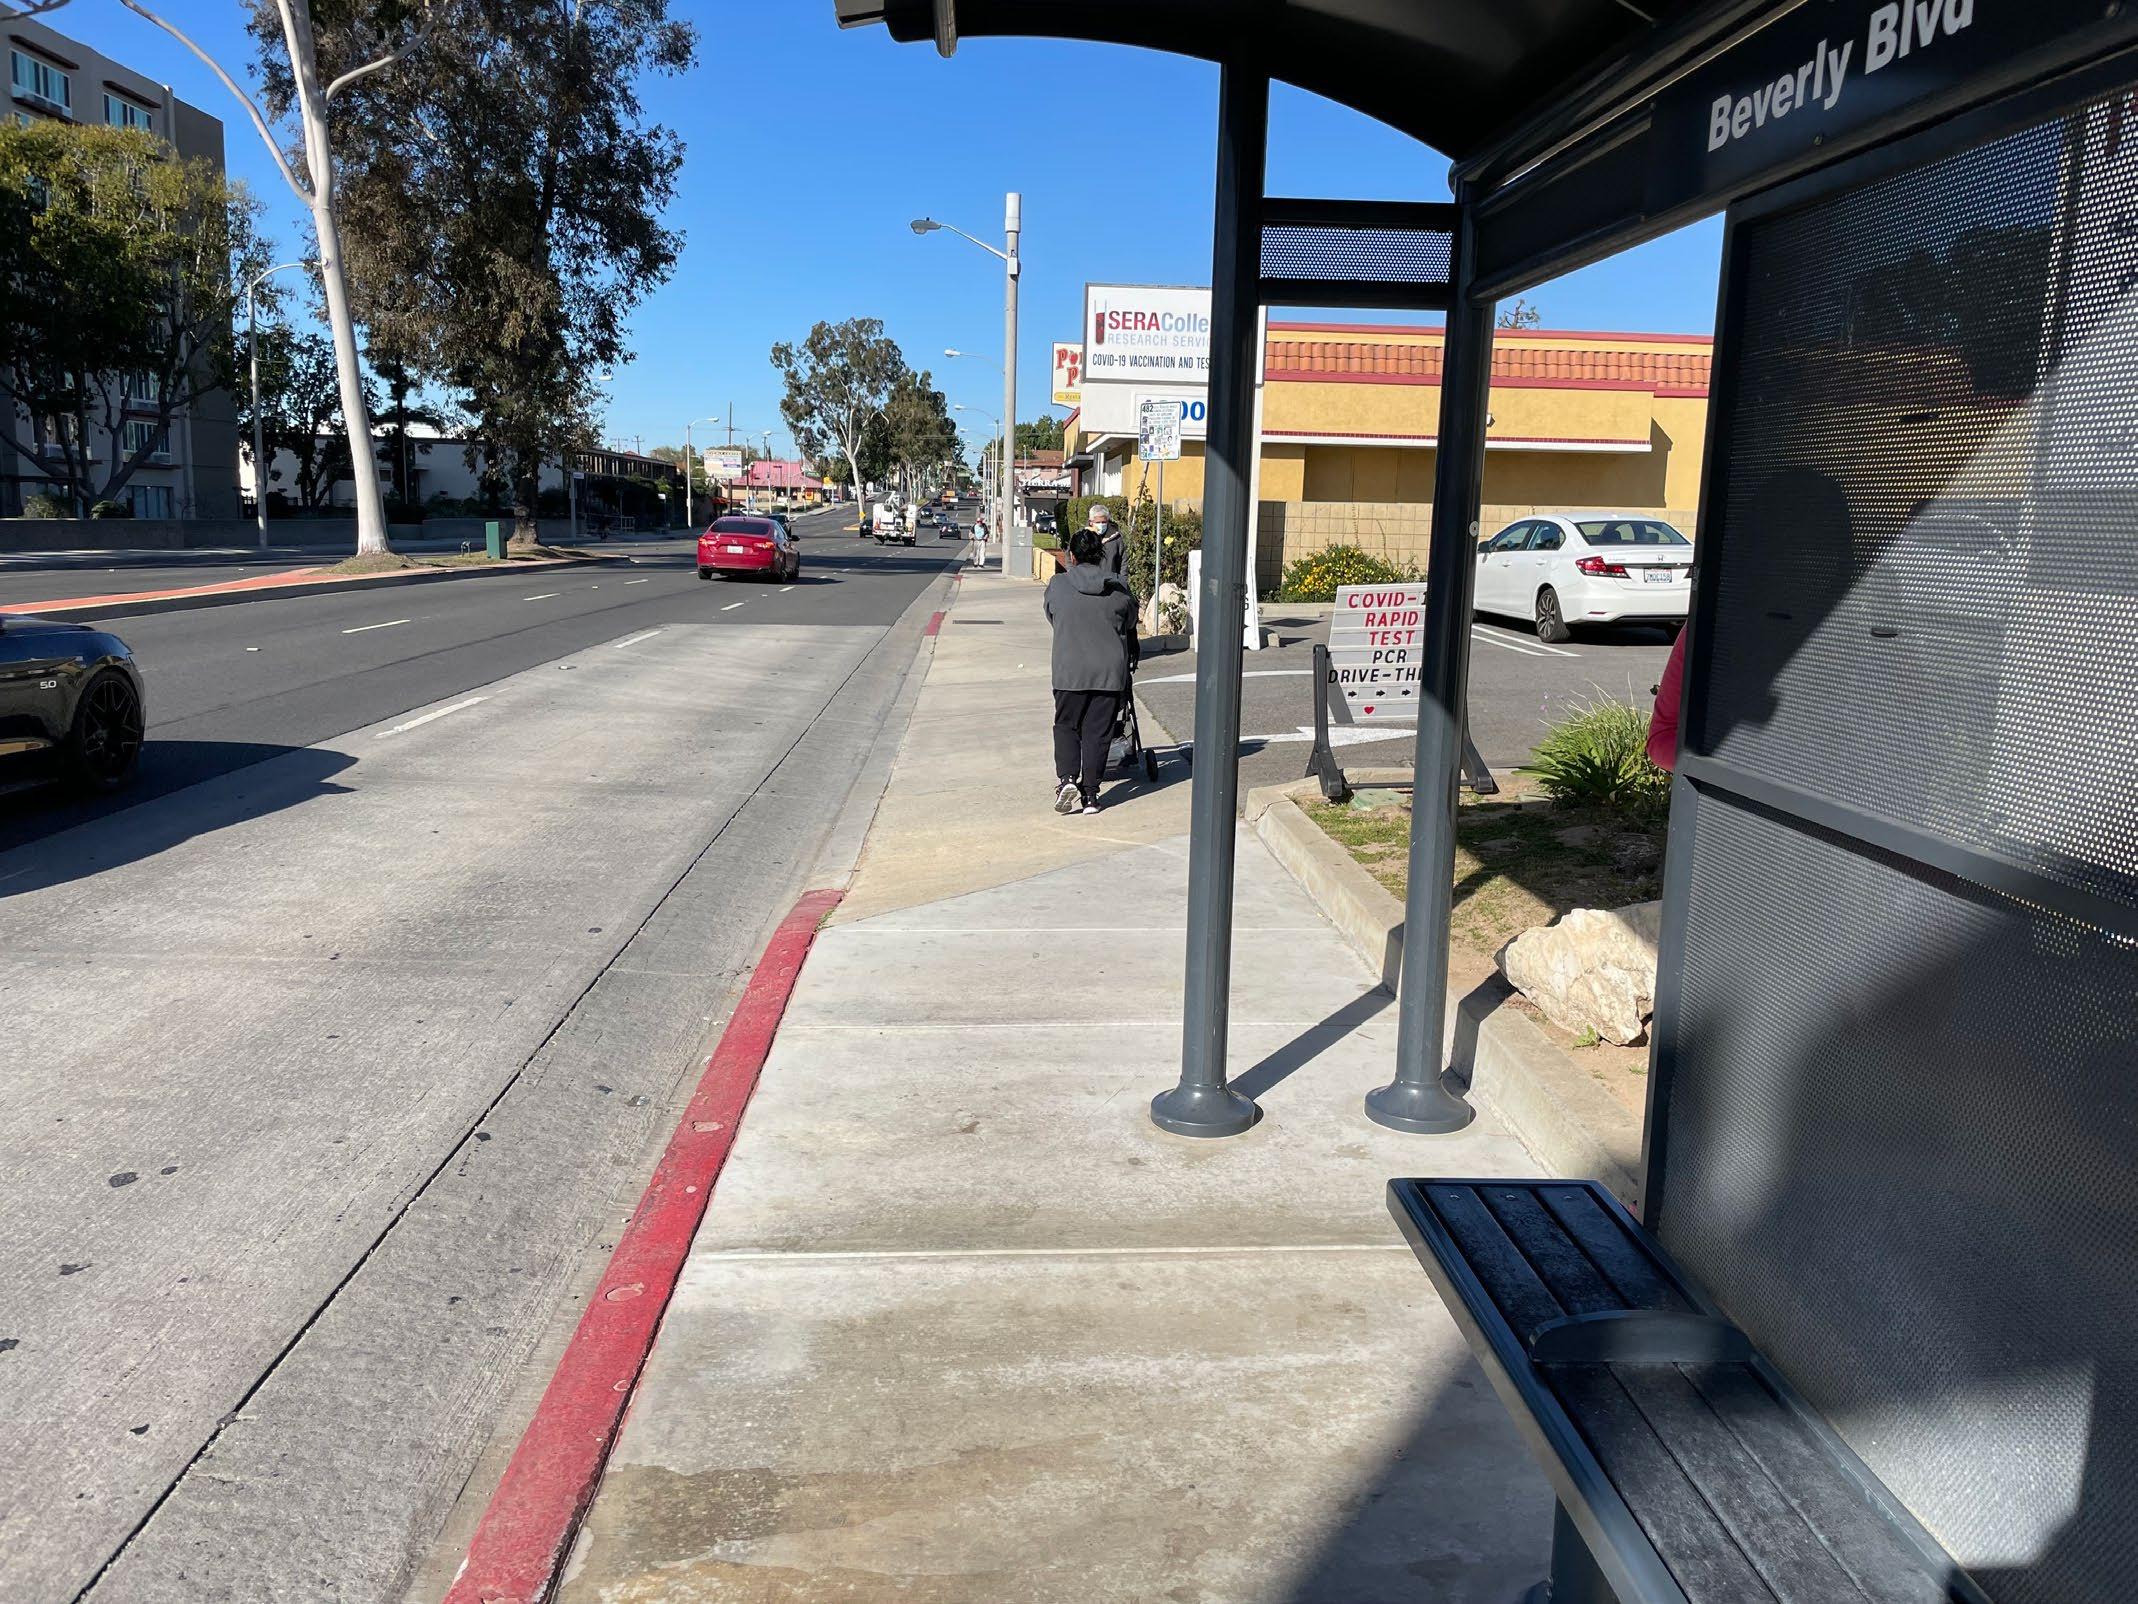
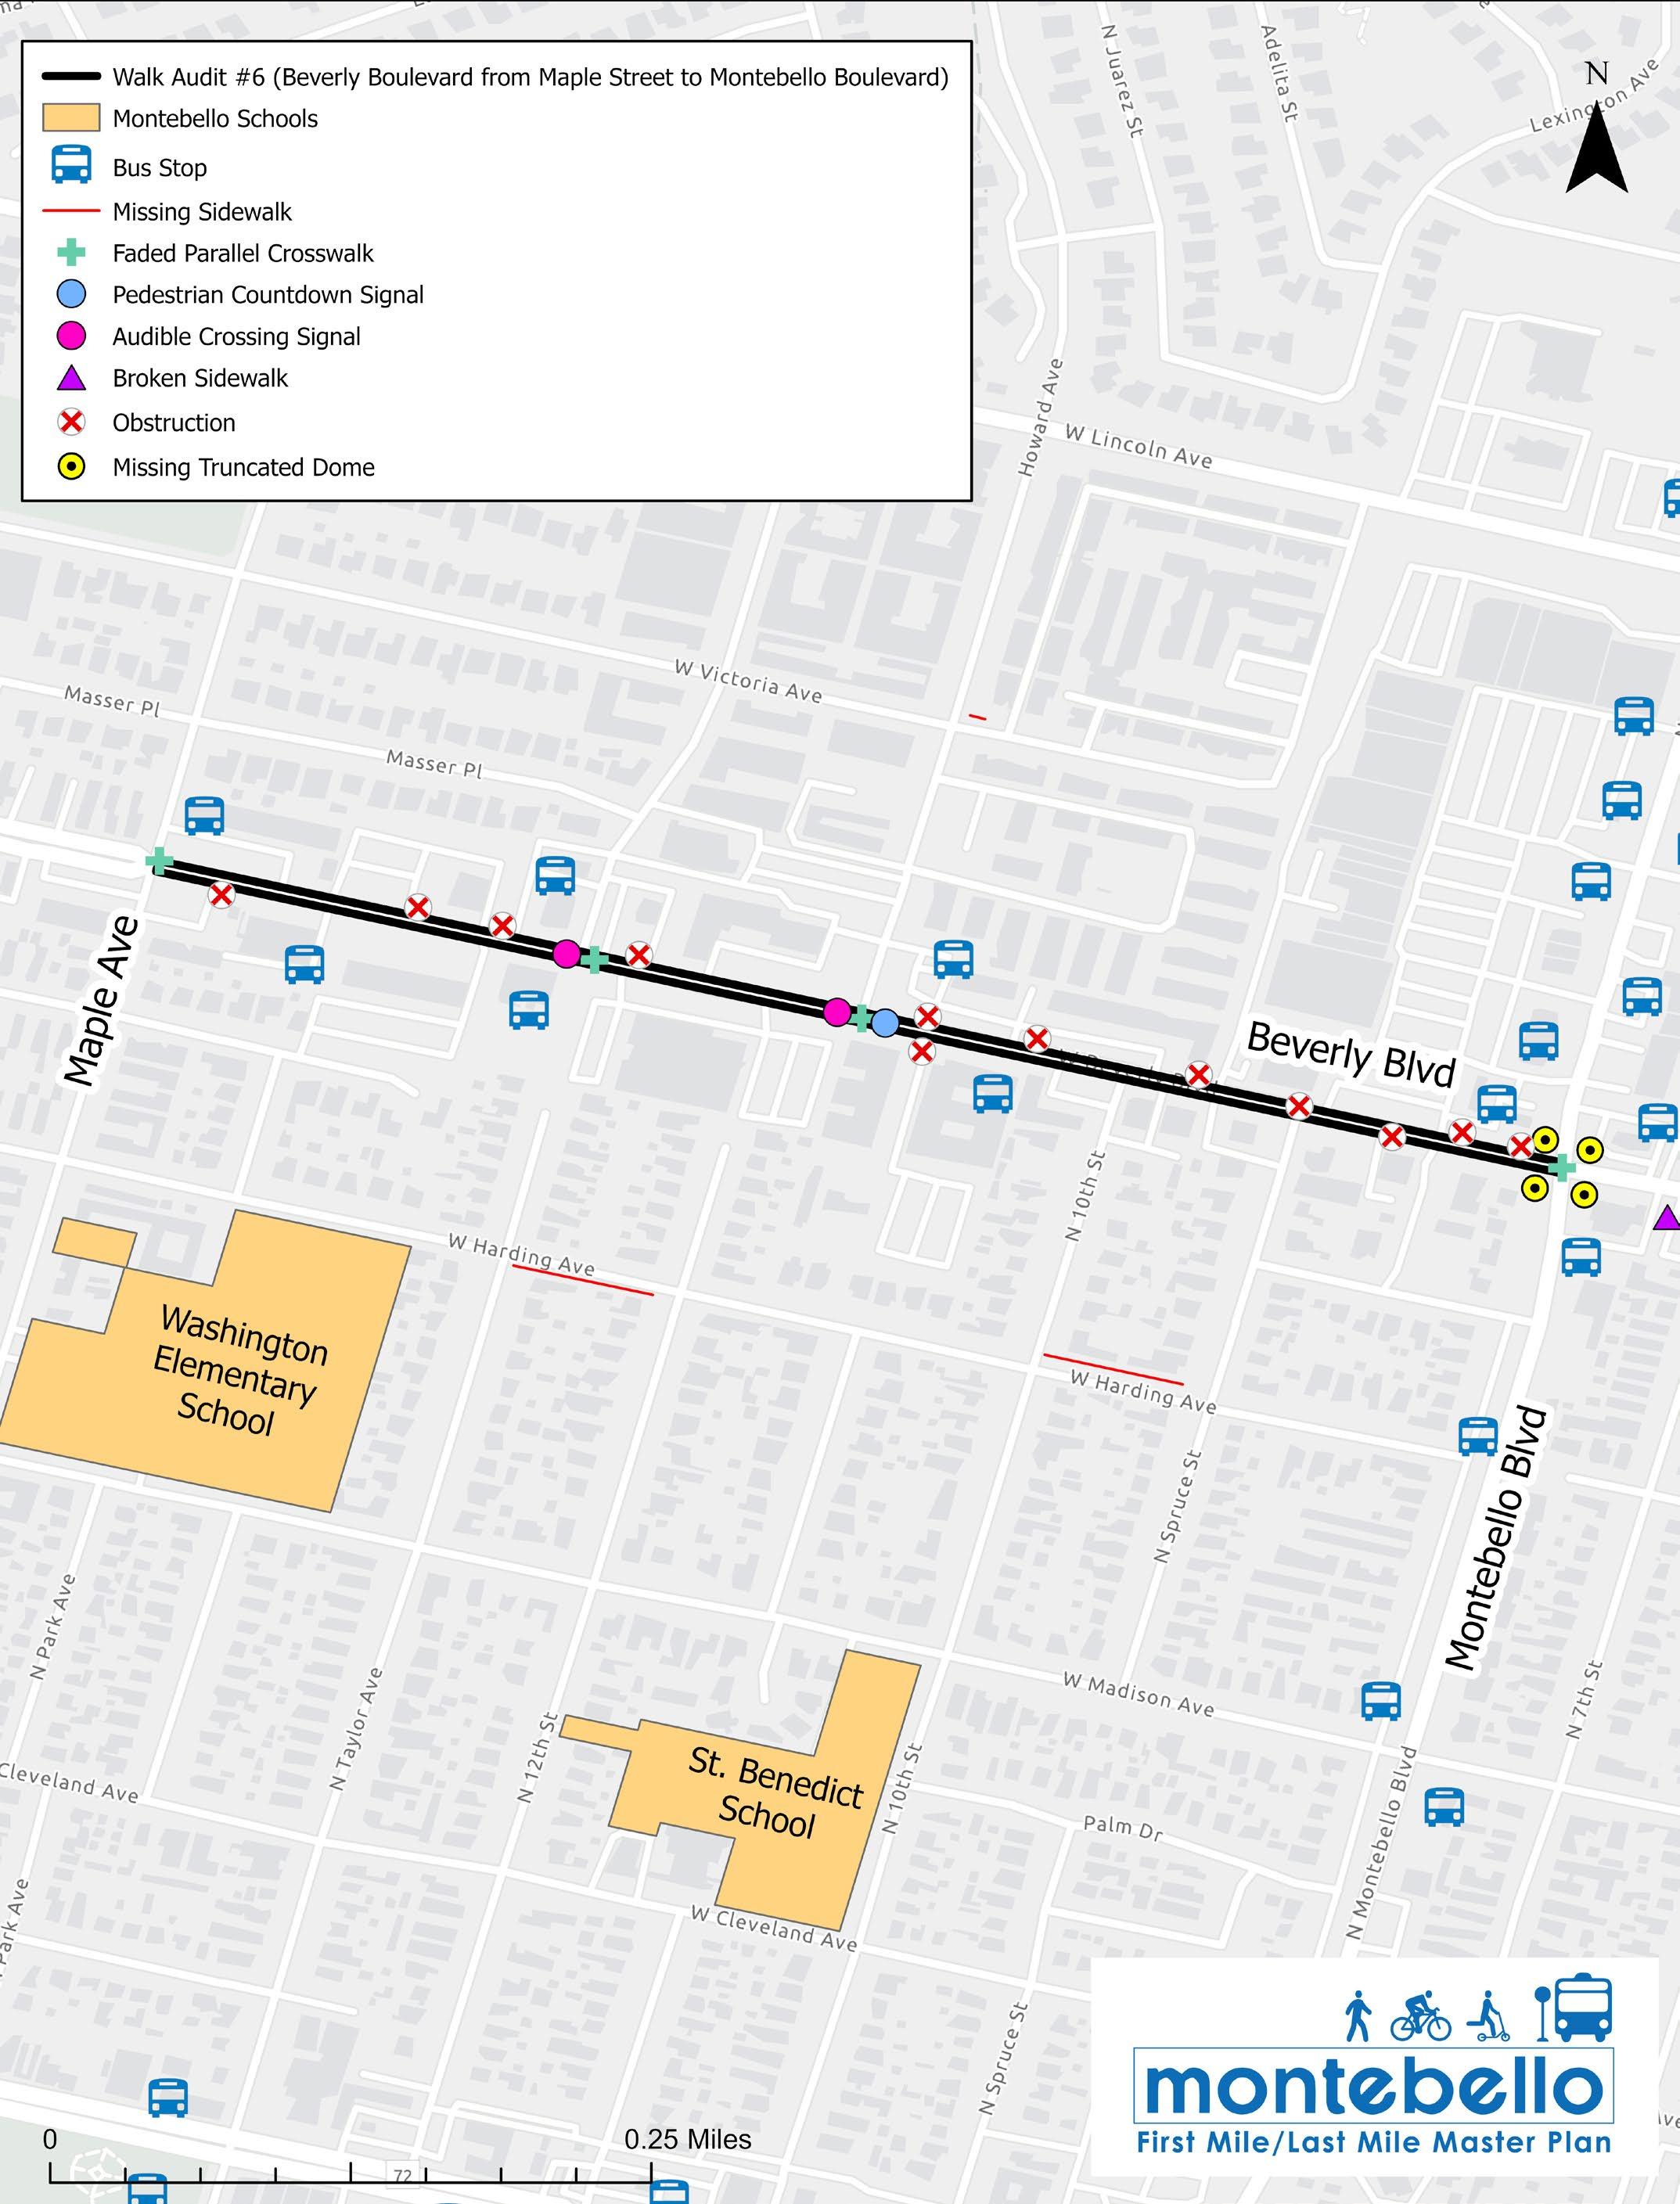
This walk audit route took place in the mid-morning hours before noon in a primarily commercial area along Beverly Boulevard corridor from Maple Avenue to Montebello Boulevard. Nearby bus routes include Lines 20, 40, and 90.
Figure 2-19 displays a map of the existing conditions observed during the walk. Crosswalk markings were observed to be faded, some of the curb ramps were missing truncated domes, and there were a frequent number of obstructions along the sidewalk. These obstructions included utility boxes, light poles, and a bus stop (shelters and benches). Another perceived issue seemed to be the lack of proper lighting for pedestrians along the roads which could lead to unsafe conditions for all users during the early morning and evening hours.
A few of the intersections along the Beverly corridor were equipped with audible crossing signals to accommodate those with visual challenges. Additionally, the intersection of Howard Avenue and Beverly Boulevard had both an audible crossing signal and a pedestrian countdown signal. Pedestrian countdown signals are required by the California Manual on Uniform Traffic Control Devices (CA MUTCD), the state traffic engineering manual.
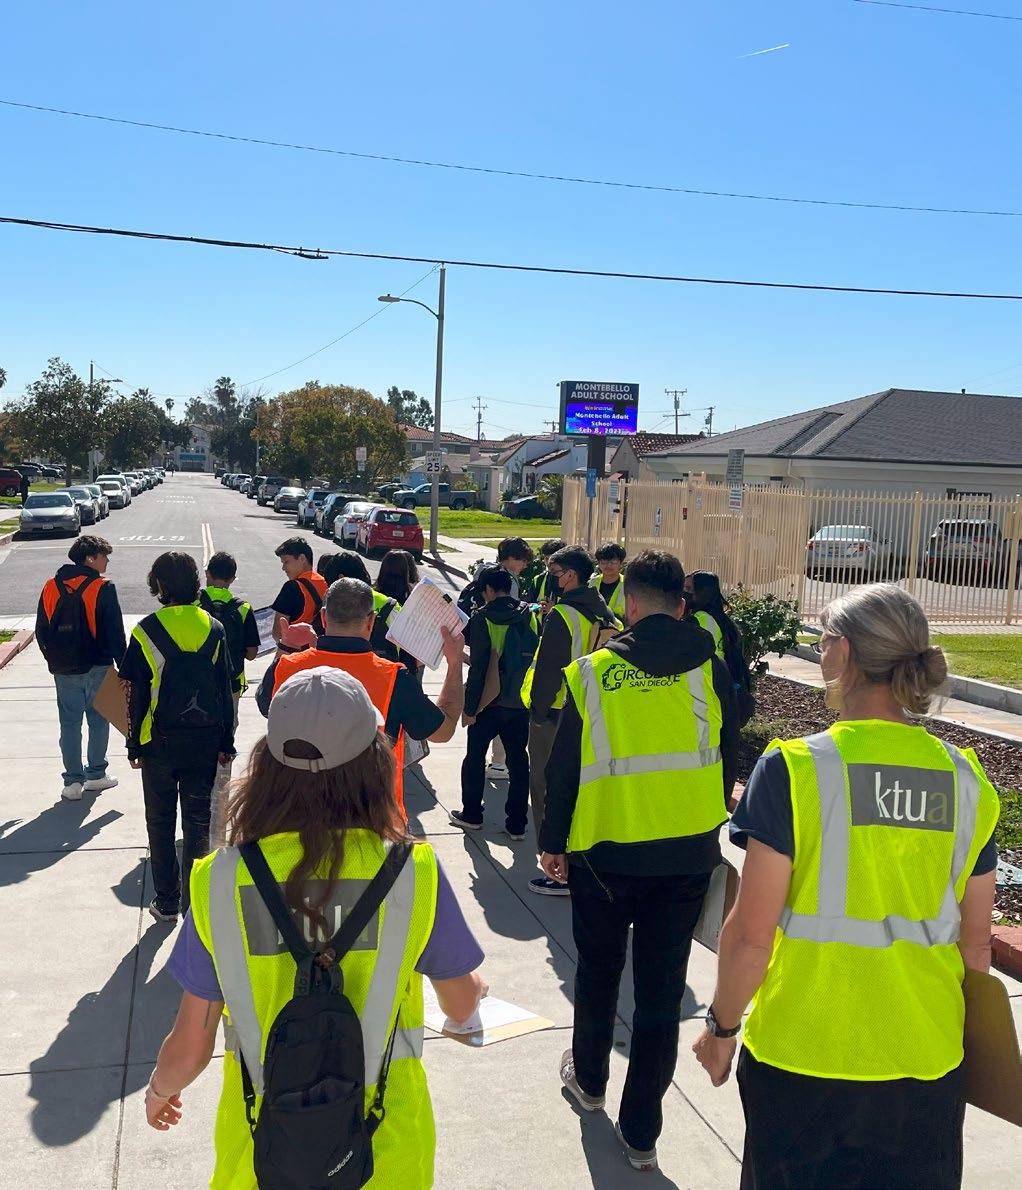
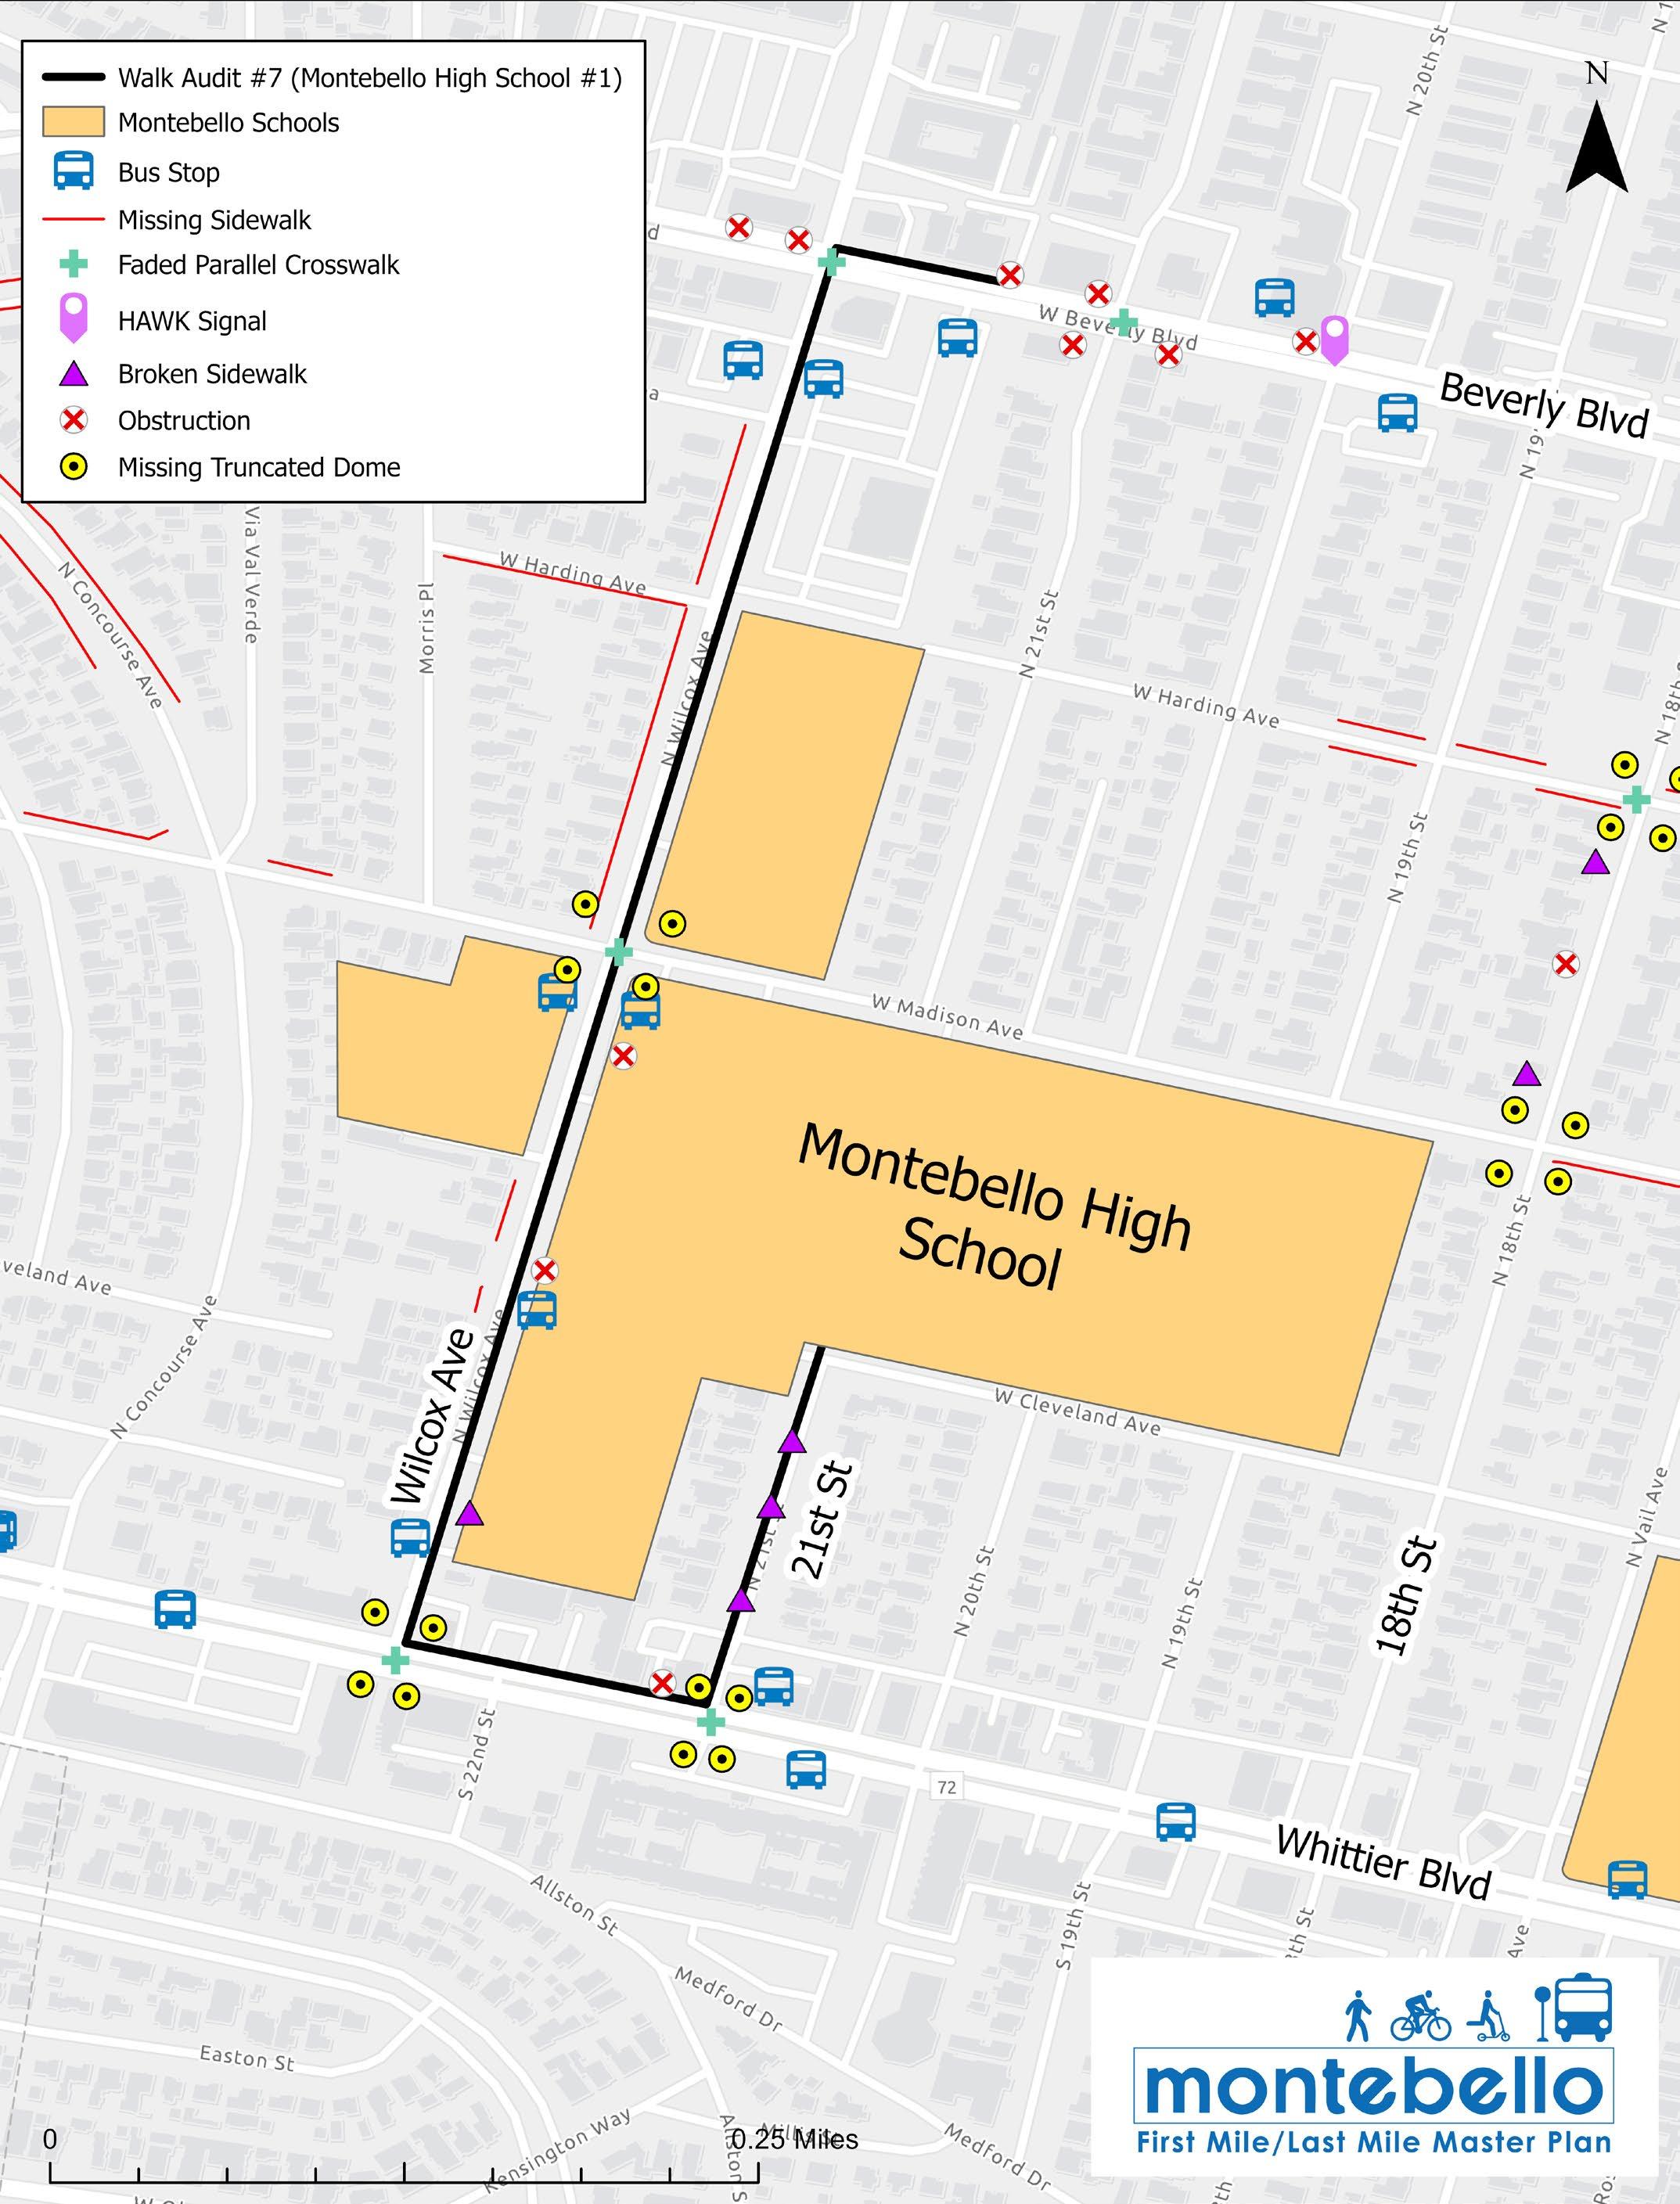
This walk audit focused on the surrounding blocks of Montebello High School with students participating to learn about the planning process and share their personal experiences on how they get to school. The corridors traveled include 21st Street, Whittier Boulevard, Wilcox Avenue, and Beverly Boulevard. Due to the large group of students, the group was split into two where each group walked a different route. The audit took place in the afternoon school hours in an area that is primarily a mix of commercial and residential. Nearby bus routes include Lines 10, 40, 70, and 90.
Many students in the group mentioned that they use transit to get to and from school. The students who ride transit commented that they would like to see every bus stop equipped with benches and shelters. The discomfort from rainy days or the summer heat is undesirable while they wait for the bus.

Figure 2-20 displays a map of the existing conditions observed during the walk. Crosswalk markings were observed to be faded, some of the curb ramps were missing truncated domes, many sections of the sidewalk were broken and, in some cases, missing, and a frequent number of obstructions along the sidewalk. These obstructions included utility boxes and light poles. Many portions of Wilcox Avenue had no sidewalk. Many students mentioned the lack of adequate lighting during the morning and evening hours contributes to unsafe walking conditions.

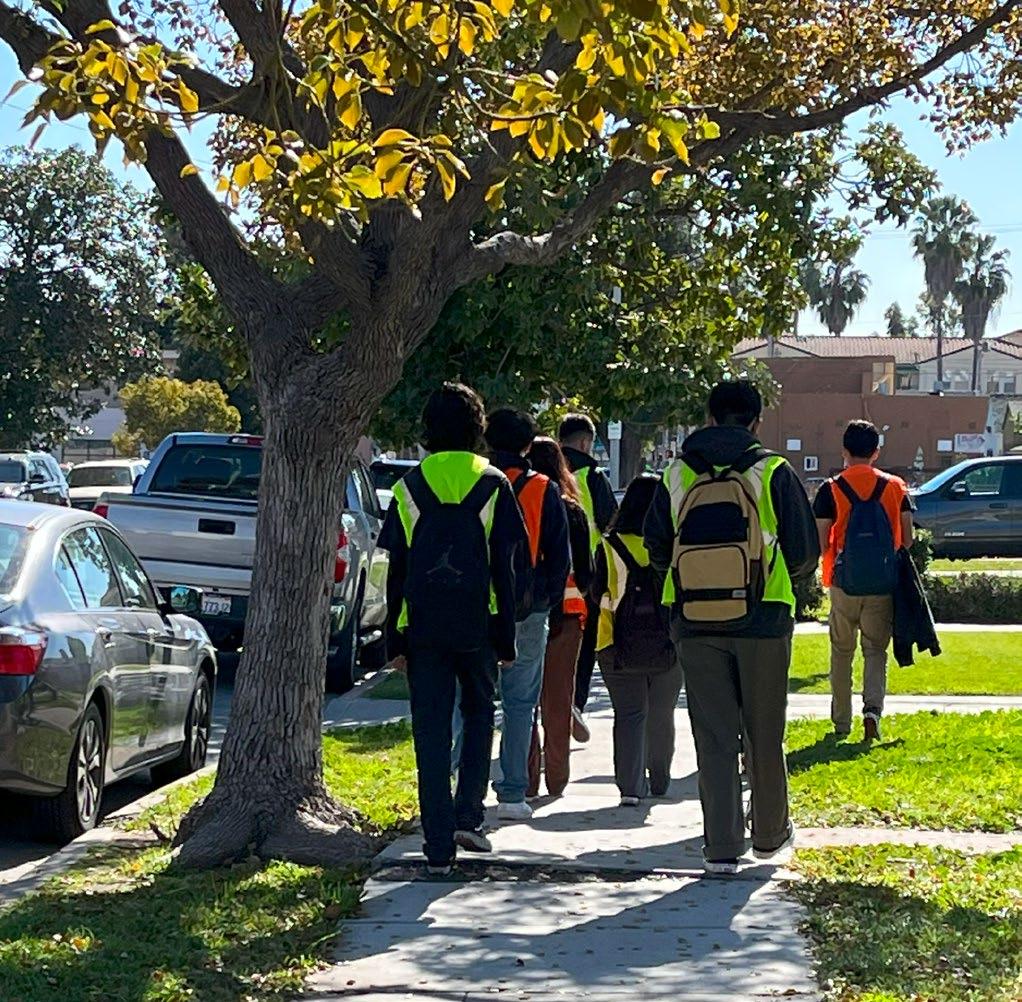
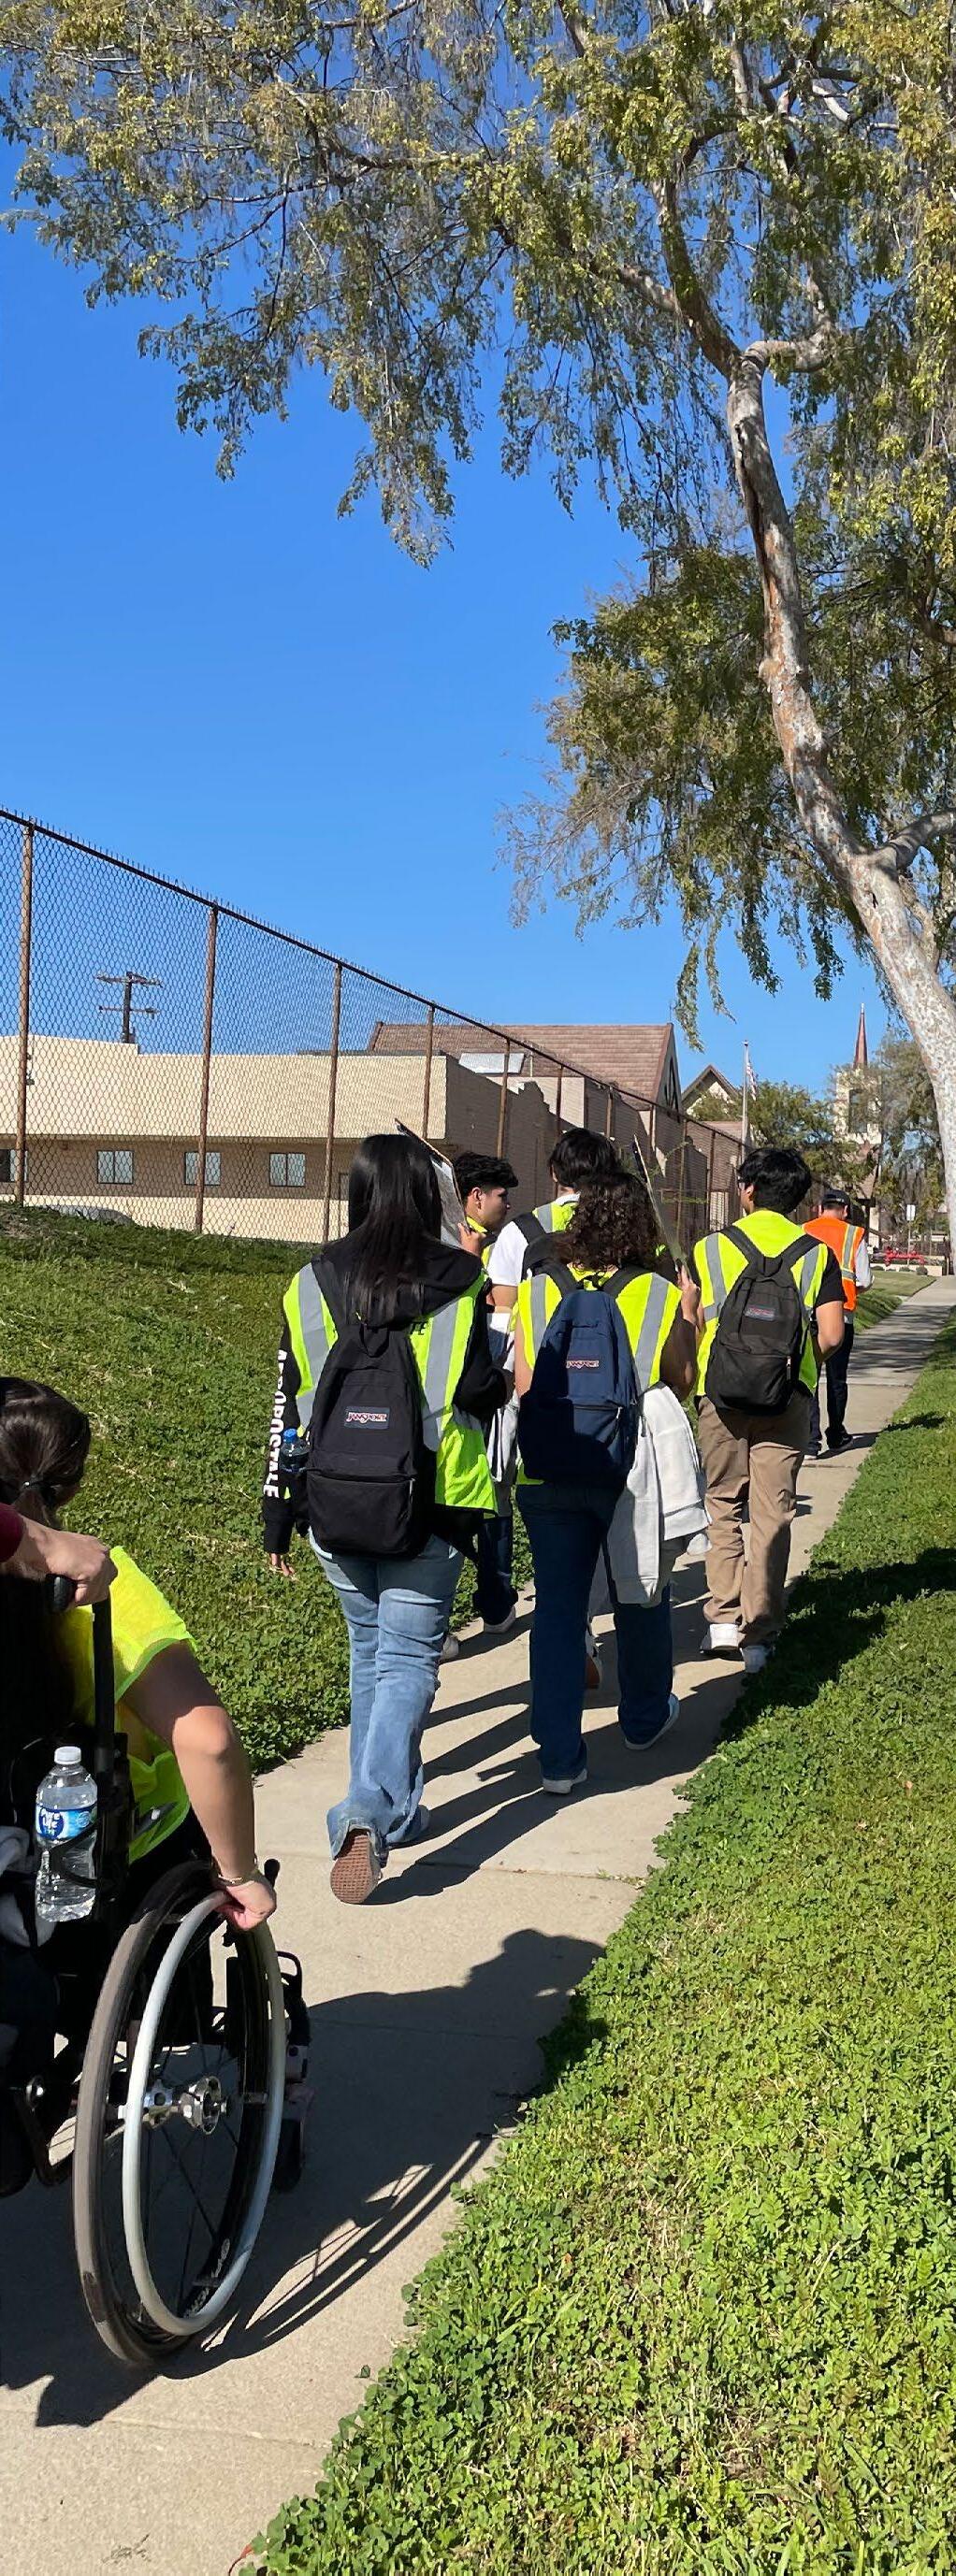
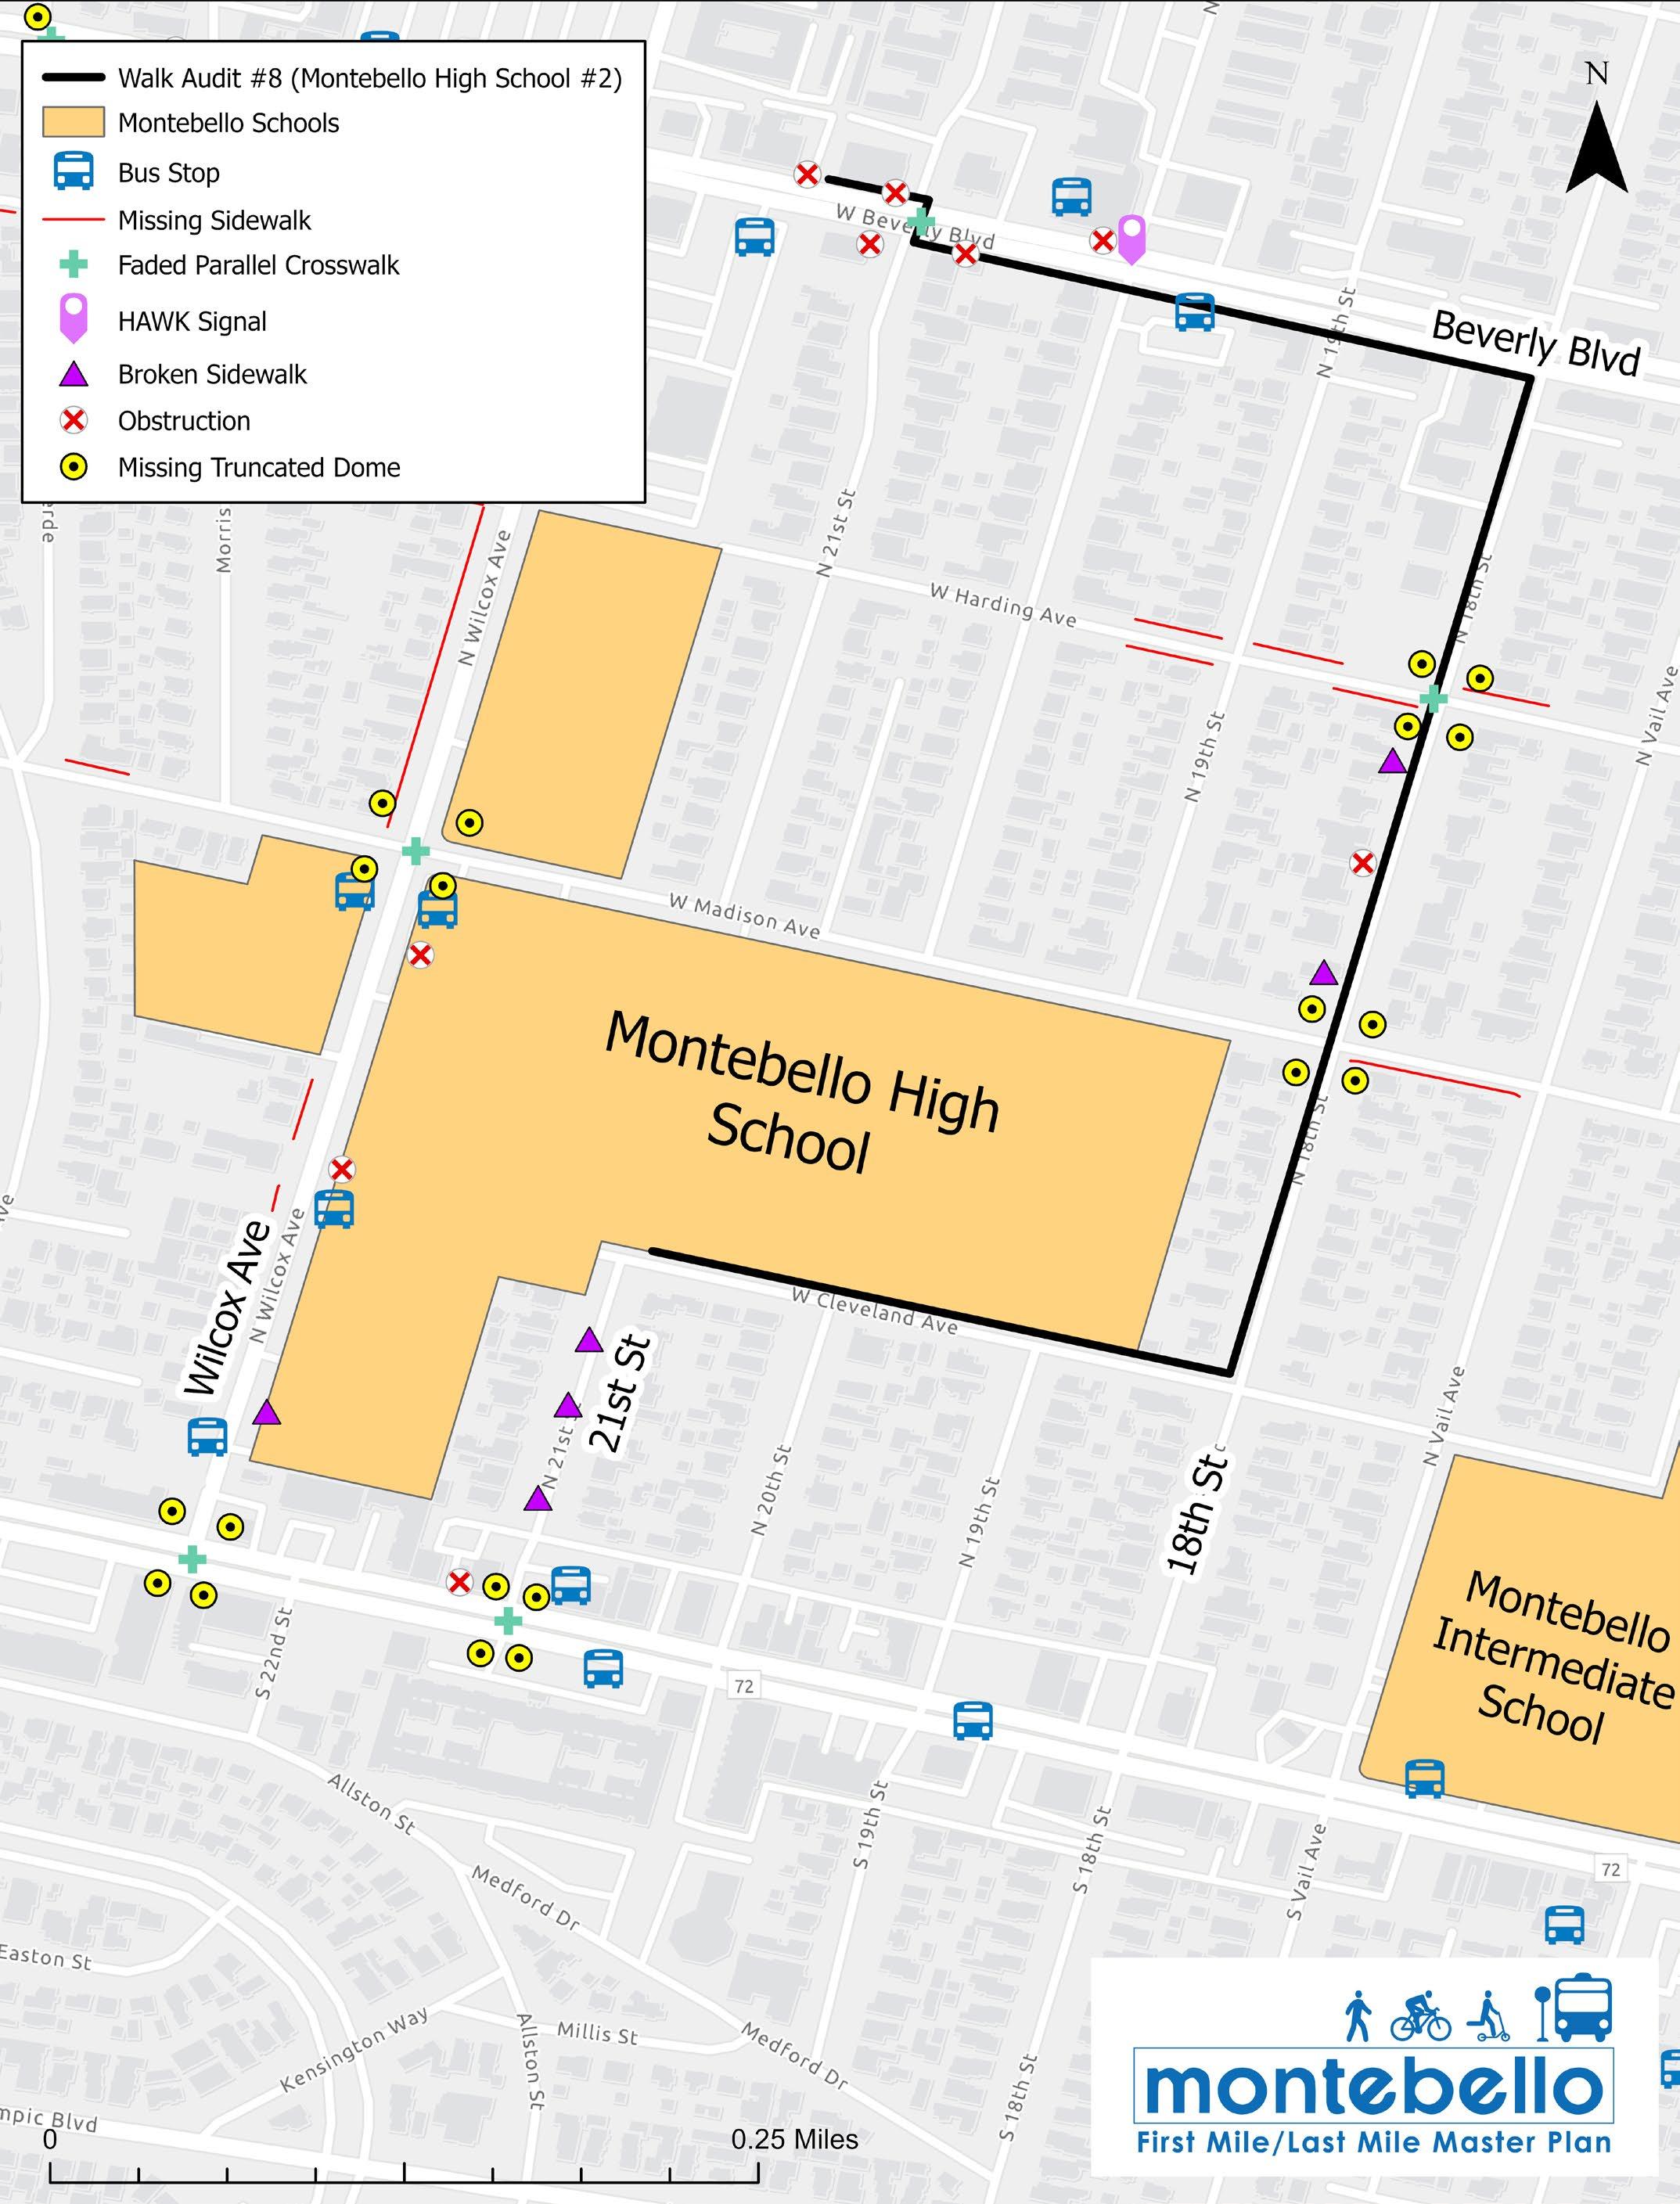
This walk audit around Montebello High School was joined by a high school class, including one student using a wheelchair. They contributed invaluable input on the conditions that may be uncomfortable for persons who are handicapped or using mobility aids. The corridors traveled included Cleveland Street, 18th Street, and Beverly Boulevard. The audit took place in an area that is primarily commercial and residential. Nearby bus routes include Lines 10, 40, 70, and 90.
Figure 2-21 displays a map of the existing conditions observed during the walk. Crosswalk markings were observed to be faded, some of the curb ramps were missing truncated domes, many sections of the sidewalk were broken and, in some cases, missing, and a frequent number of obstructions along the sidewalk. These obstructions included utility boxes and light poles. Harding Avenue and Madison Avenue had portions of missing sidewalk. Many students mentioned the lack of adequate lighting during the morning and evening hours contributes to unsafe conditions.
During the audit, many students pointed out the fact that the sidewalks felt narrow to them. The sidewalk is missing in some areas or too narrow to allow passing which pushes pedestrians into the landscaped areas or the road, which is especially unsafe for those with mobility aids, disabilities, and the elderly. The summer months in Montebello are hot and students noted their discomfort during that time and mentioned they would like to see more street trees for shade and for reducing the urban heat island effect.
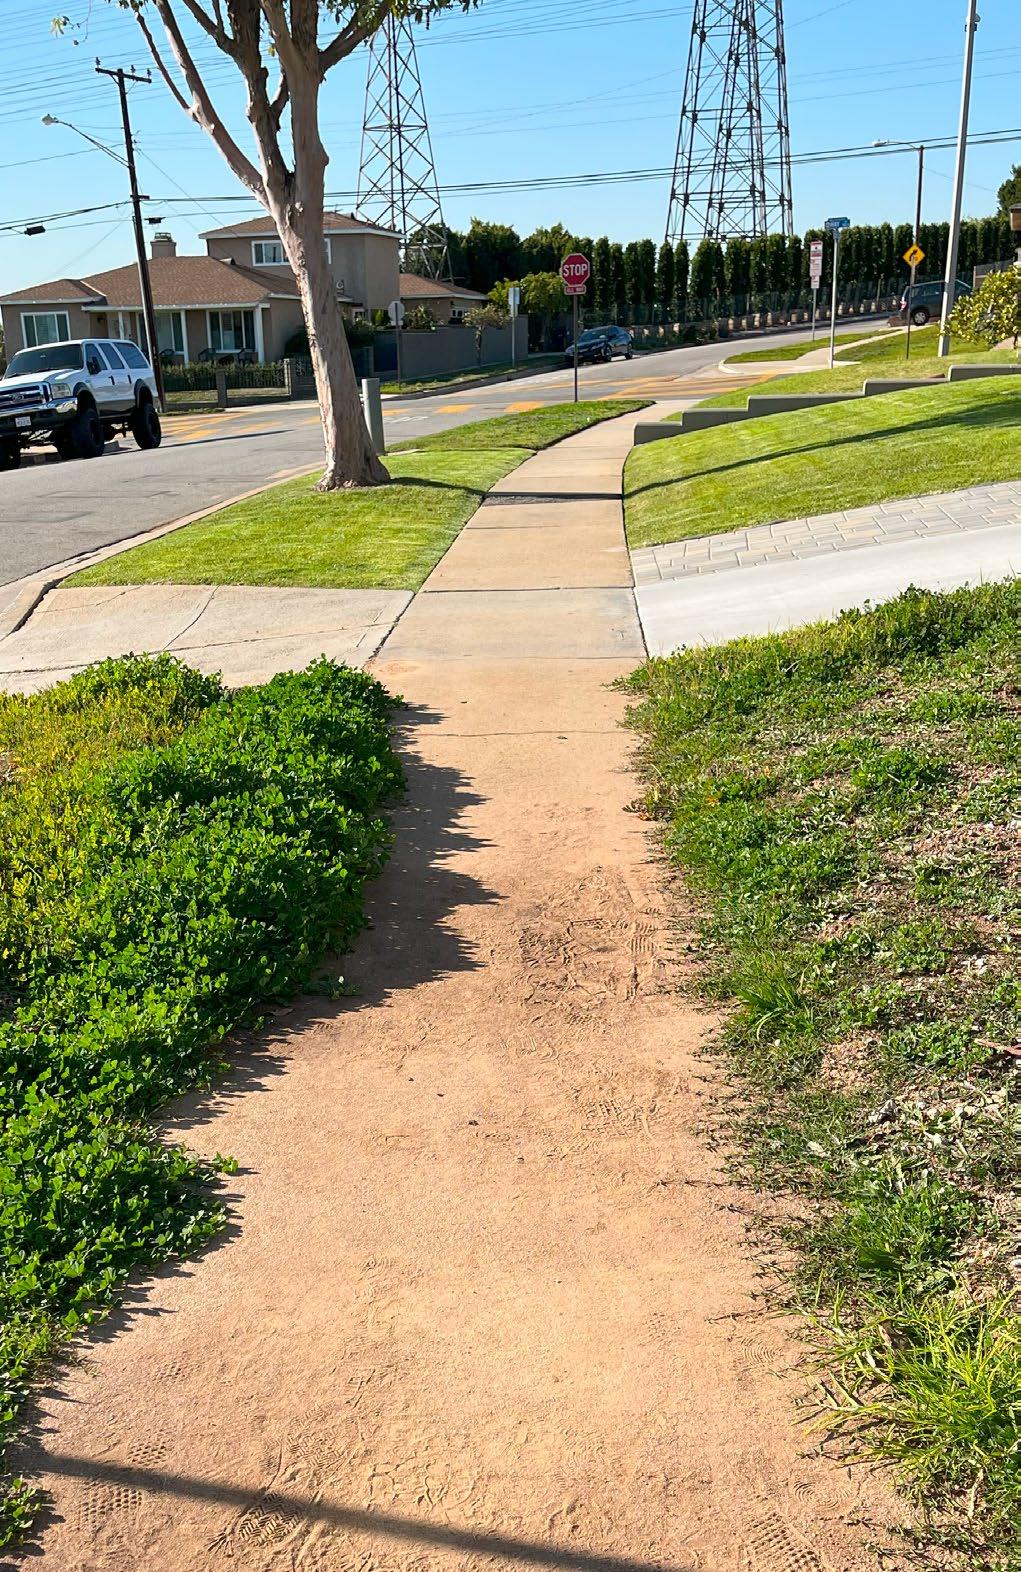
This walk audit route included a portion of the surrounding area around Schurr High School. The corridors traveled include Hay Street, Lincoln Avenue, and Morris Place. The audit took place in an area that is primarily residential. Students from the high school were allowed to join the project team on the audit and provide valuable input regarding first-mile/lastmile connections. Nearby bus routes include Lines 30 and 70.
Figure 2-22 displays a map of the existing conditions observed during the walk. Crosswalk markings were observed to be faded, a radar speed sign display was observed to be malfunctioning, and a utility box was obstructing the sidewalk on the intersection of Wilcox Avenue and Hay Street. A section of broken sidewalk was observed near the intersection of Lincoln Avenue and Via Val Verde. Many students mentioned the lack of adequate lighting during the morning and evening hours contributes to unsafe walking conditions.
Principal McKiernan mentioned that many students take transit to get to and from school. During the morning and afternoon hours when students are arriving or departing, the sidewalks on Wilcox Avenue and Hay Street are typically filled with students. Multiple students are often seen waiting at bus stops. Students reported that cars do not stop for crossing students on Hay Street during drop off and pickup.

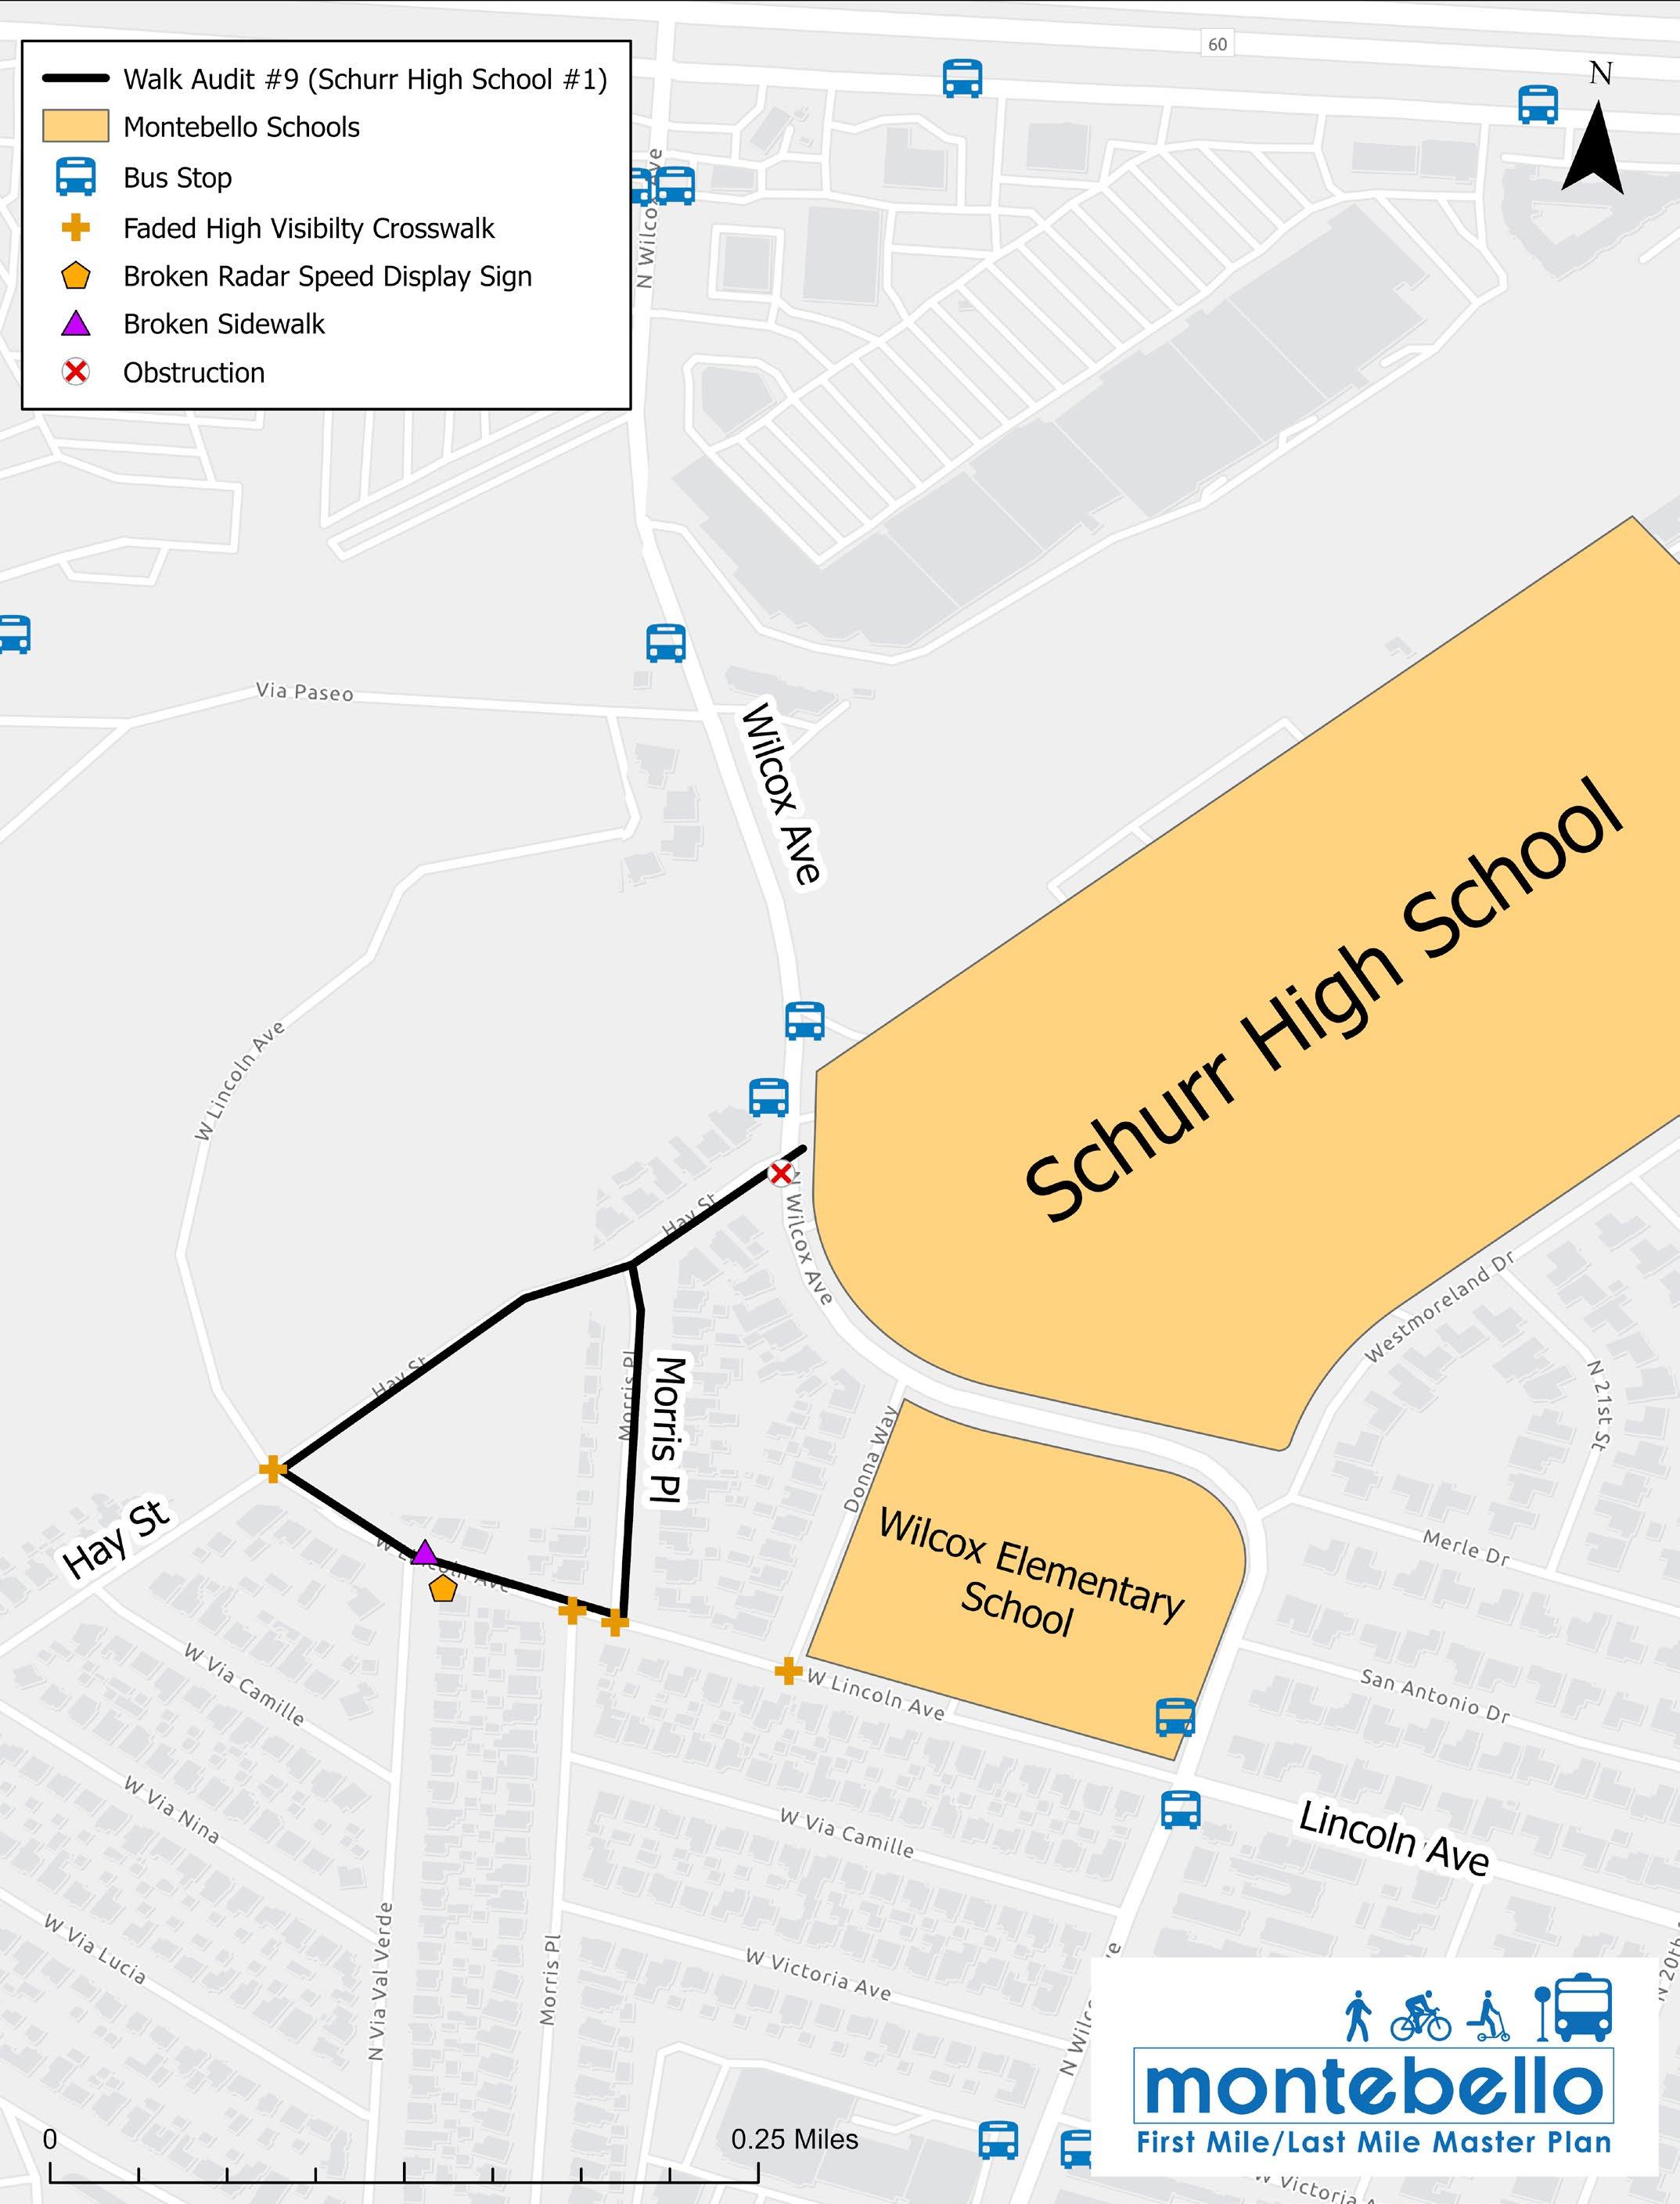
The Schurr High School walk audit with students was split into two groups to cover more ground. The second group’s route included Hay Street, Lincoln Avenue, and Morris Place. Nearby bus routes include Lines 30 and 70.
Figure 2-23 displays a map of the existing conditions observed during the walk. Crosswalk markings were observed to be faded and a utility box was obstructing the sidewalk on the intersection of Wilcox Avenue and Hay Street. Many students mentioned the lack of adequate lighting during the morning and evening hours contributes to unsafe conditions as well as lack of shade in the hot months.
During Schurr High School’s after school hours, the project team observed conditions from students as they departed campus. Students would move in large groups crossing the intersection at Wilcox Avenue and Hay Street and then disperse into the neighborhood or wait at nearby bus stops. Due to the large volume of students, vehicle traffic moving through the intersection is impacted. Police members are on standby to help ensure the safety of students departing the campus.


This bike audit occurred during rush hour in the morning hours and traveled through the southern half of the City, passing by several mobile home parks, residential neighborhoods, industrial places of work, and the Montebello/Commerce Metrolink station. In addition to the rail line, other first-mile/last-mile transit connections follow Lines 20, 50, and 70.
There are no bicycle facilities along the audit route and riders typically either ride alongside moving vehicles or on the sidewalk. The industrial and residential streets had lighter traffic, but the major arterials, such as Greenwood Avenue and Washington Avenue, had larger volumes of high-speed motor vehicles, creating uncomfortable conditions for non-motorized road users.
There are no bicycle facilities on these streets which adds to the level of stress, especially when sharing the road with trucks.

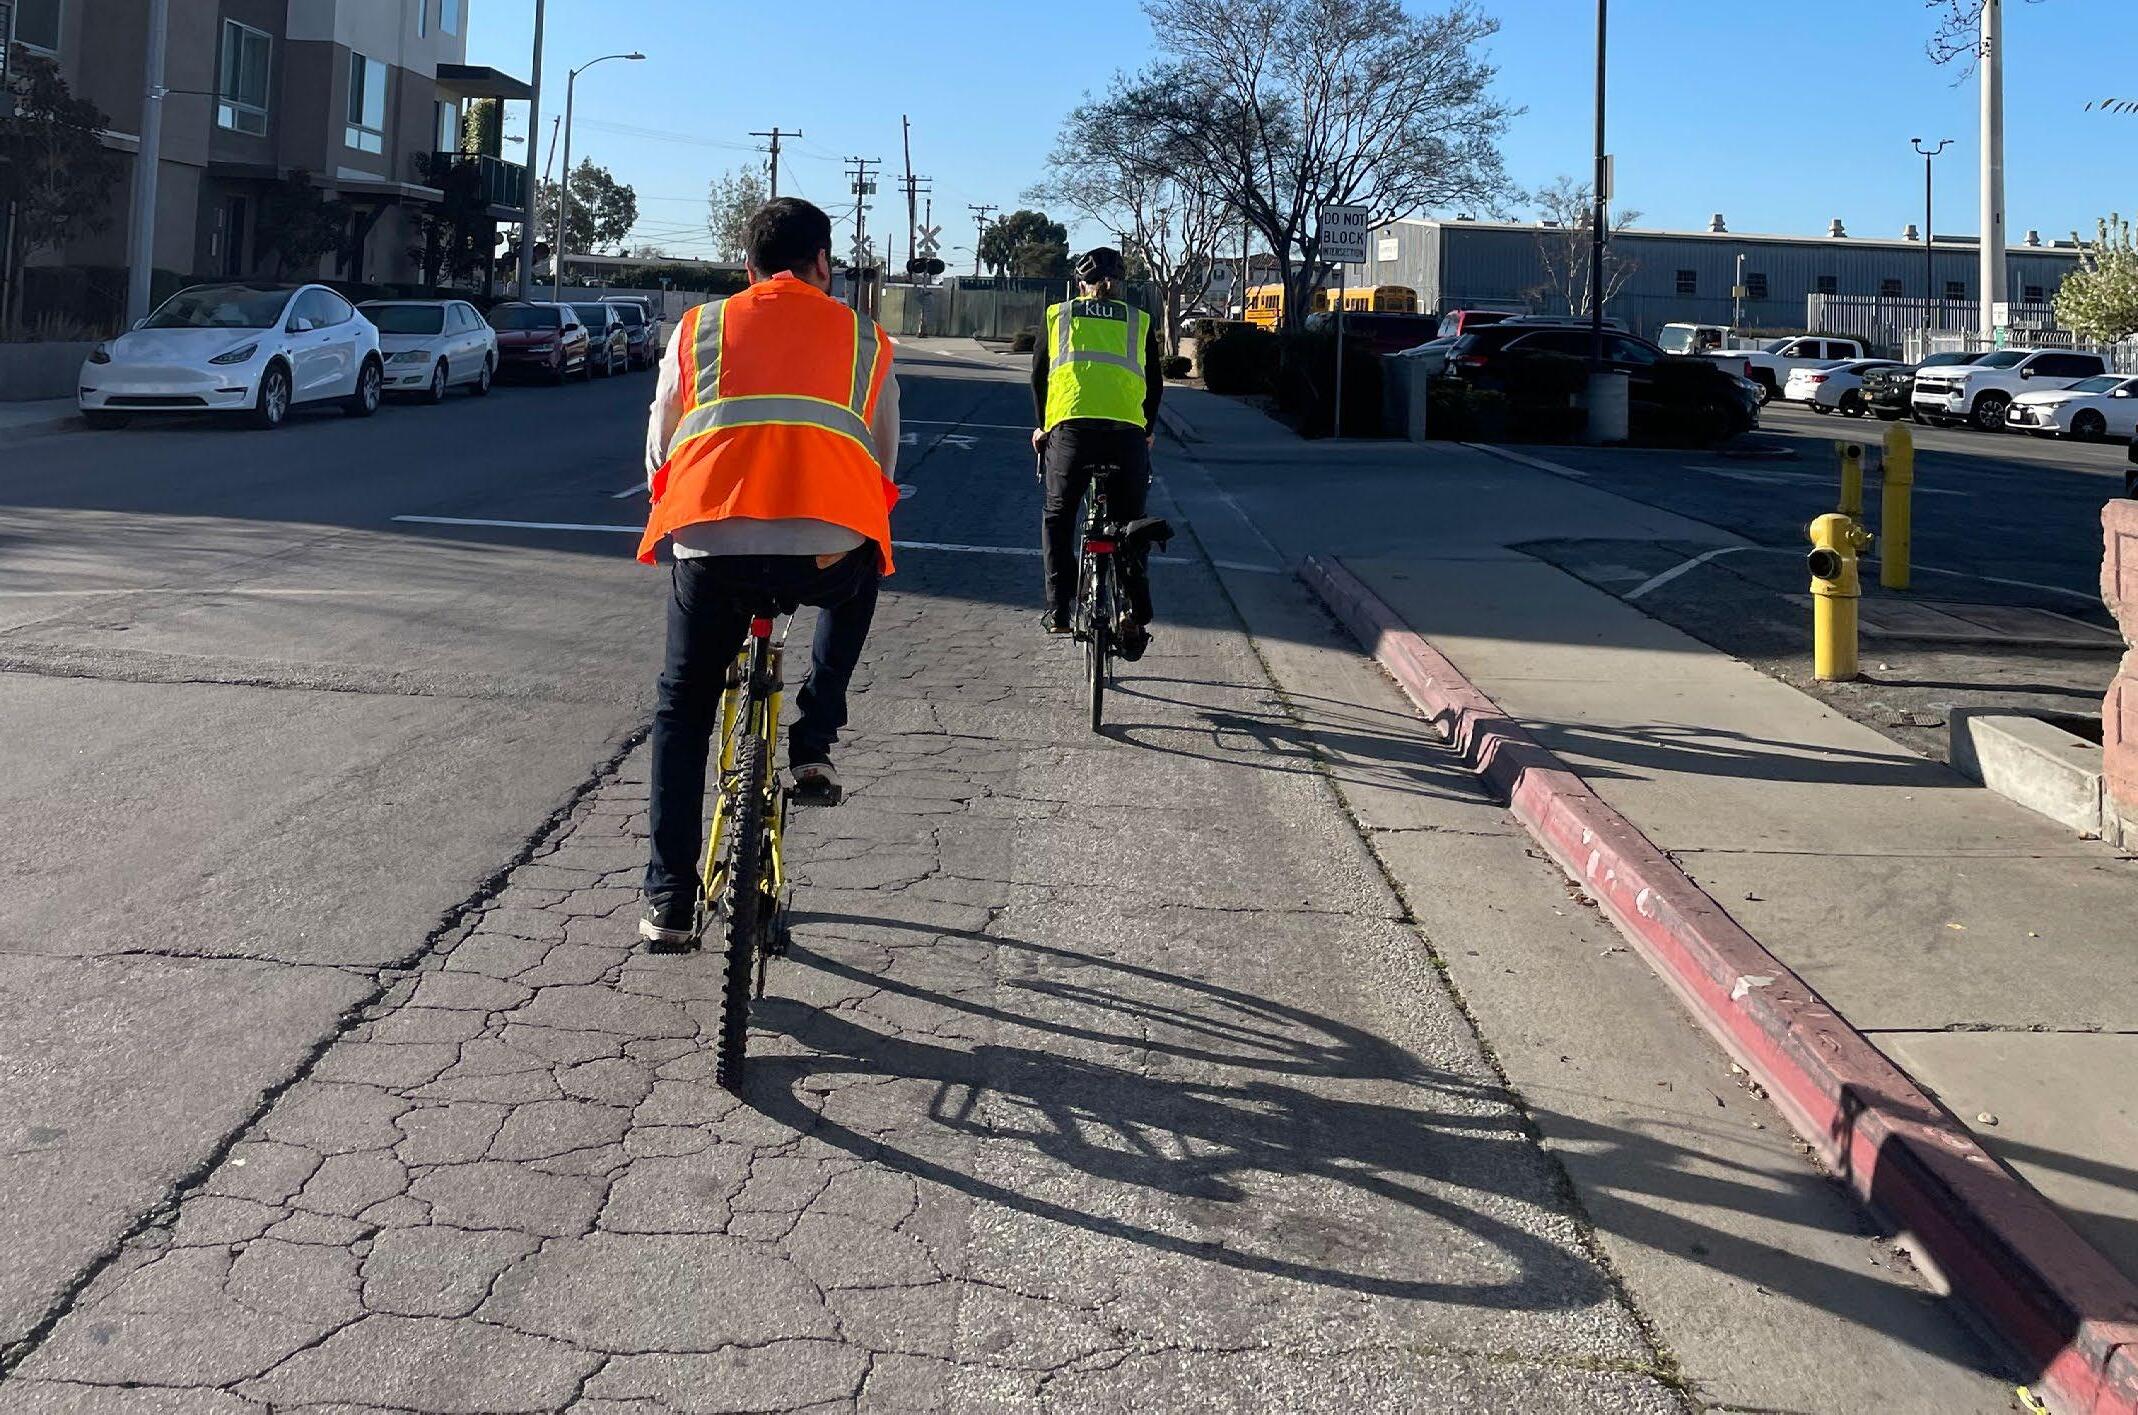

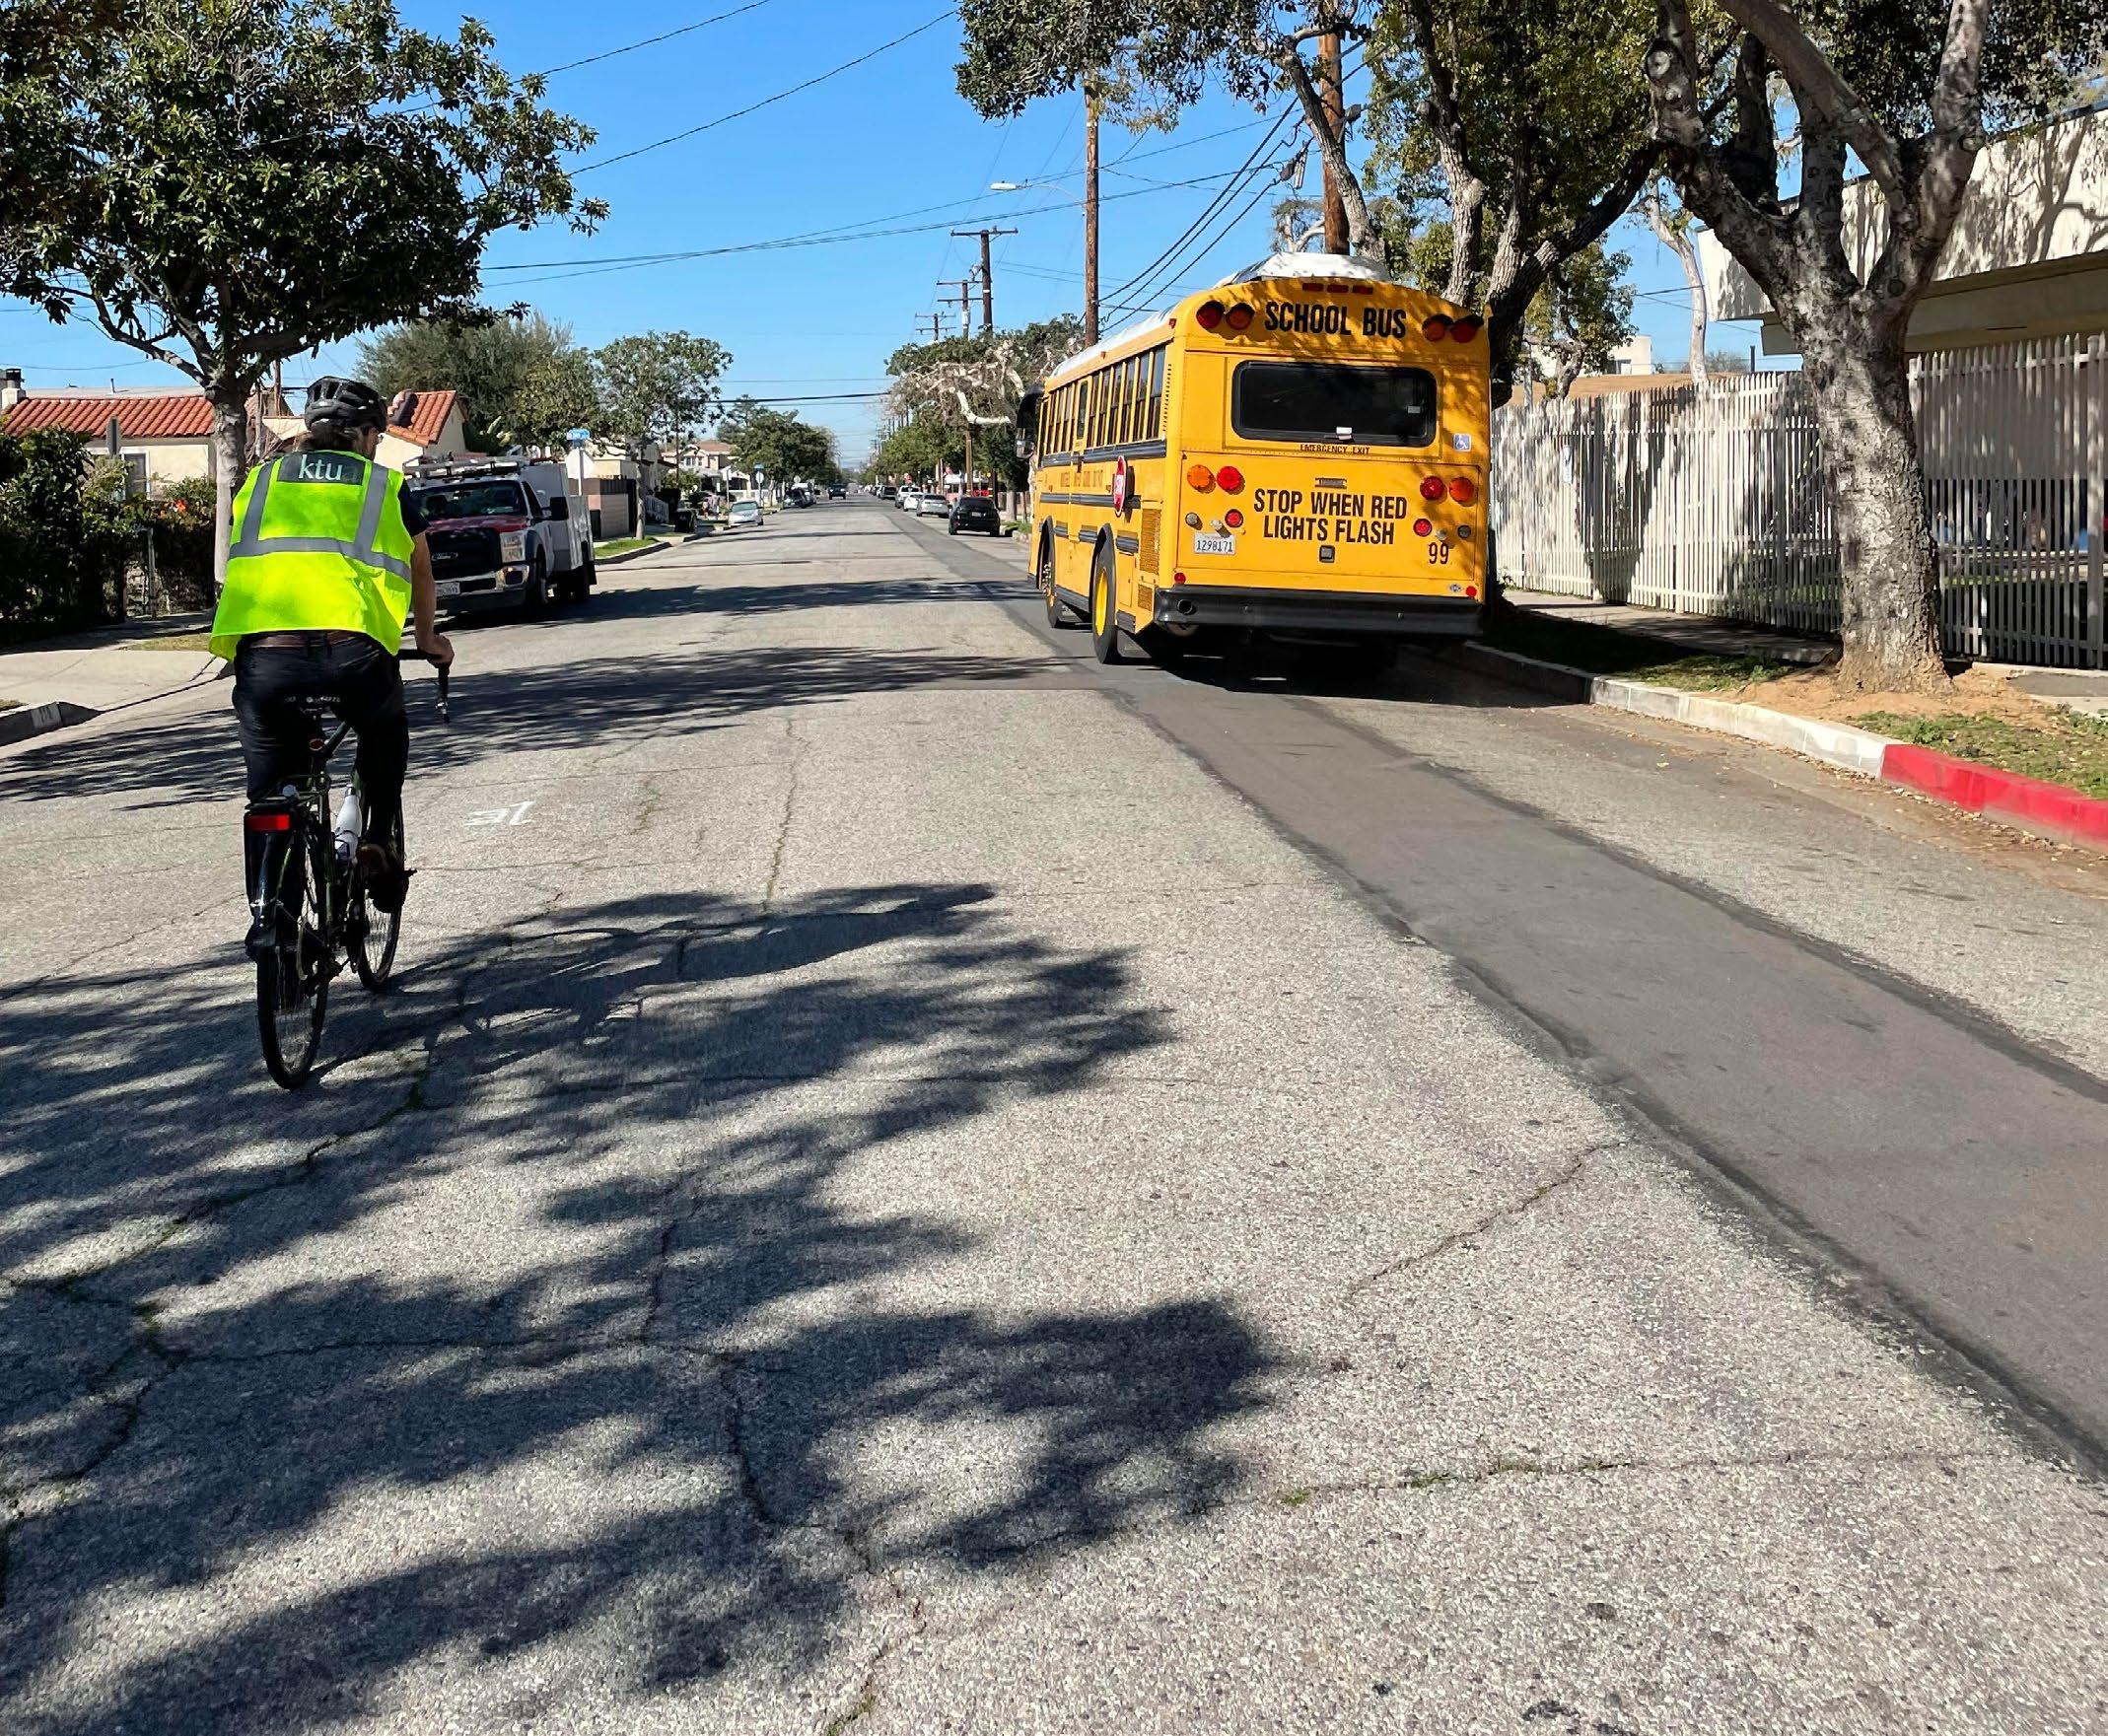
This bike audit was done in the post-morning rush hours in a rectangular route down Lincoln Avenue, Poplar Avenue, Madison Avenue, and up Maple Avenue before connecting back to Lincoln Avenue. The route passed Beverly Hospital, Washington Elementary School, Acuna Park, shopping centers, and other destinations. Nearby bus routes include Lines 20, 40, and 90.
While many key destinations were along the route or nearby, the corridors consisted of shaded residential streets. Vehicle traffic is mostly slow, and safe for bicyclists to share the road. Lincoln Avenue is a wide street that has plenty of room for bicycle infrastructure. Cars traveled the fastest along this route due to the street width and hills, which is where bicyclists are the most exposed along this route.
Existing conditions analysis started with reviewing and mapping data and reports of pedestrian and bicyclist collisions, existing bus stop locations, adjacent land uses, bicycle and pedestrian infrastructure, and City policies. The goal of existing conditions analysis is to show context and help identify projects and priorities to improve accessibility and safety at and around transit stops. Separate analysis sections for each topic are provided below.
Geographic Information System (GIS) mapping and supporting tabular data used in this report are based primarily on data provided by the City of Montebello in September 2022. Additional data layers include SCAG and Environmental System Research Institute (ESRI) data layers. Collision data was downloaded from TIMS. MBL provided transit data such as boarding, alighting, bus routes, and bus stops.
Additional GIS data source pages reviewed for data not available from the City of Montebello include the Los Angeles County Open Source Data (LACOSD) web page and SCAG’s Regional Data Platform. The mapping data source table noted above indicates layers that were downloaded from either of these data sources and where no layer was available for potentially useful data. The LACOSD is a County data source of unincorporated jurisdictions, so it does not include data layers at the Montebello specific level. The SCAG data source page had a variety of useful layers that are used in the mapping as noted in the data source table.
Collision analysis in this report is based on 2011 to 2021 pedestrian and bicycle collision data downloaded from the TIMS data source which is based on the Statewide Integrated Traffic Records System (SWITRS). Note that TIMS data includes fatalities and injury related collisions only and does not include property damage only collisions.
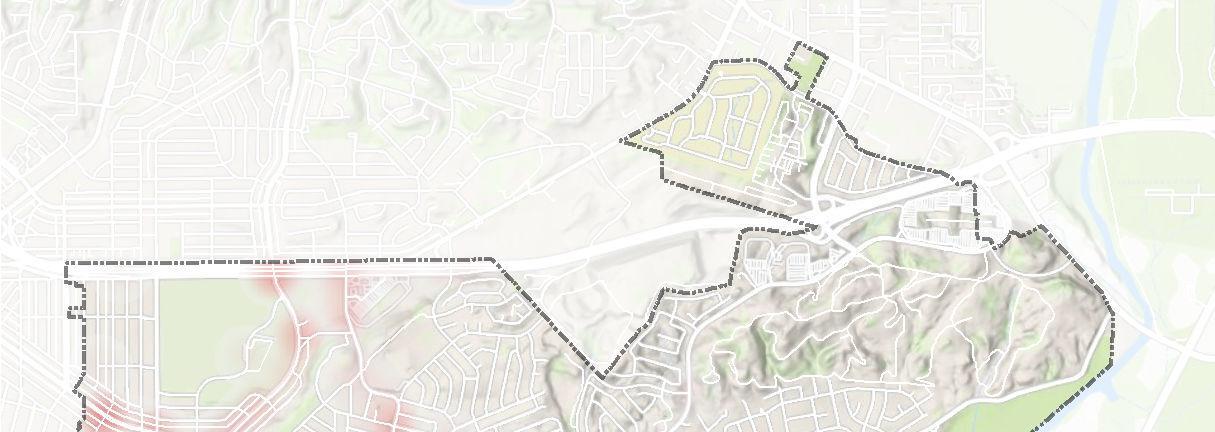
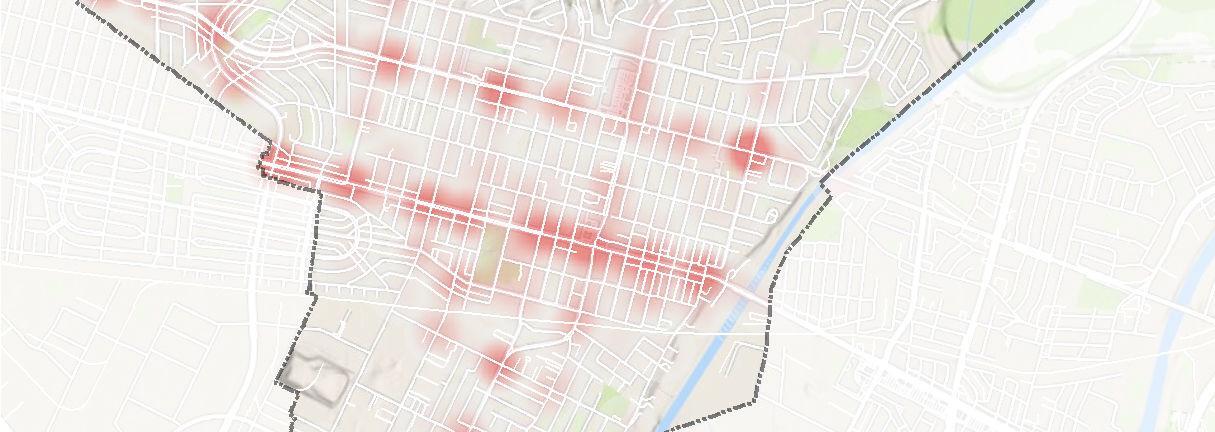
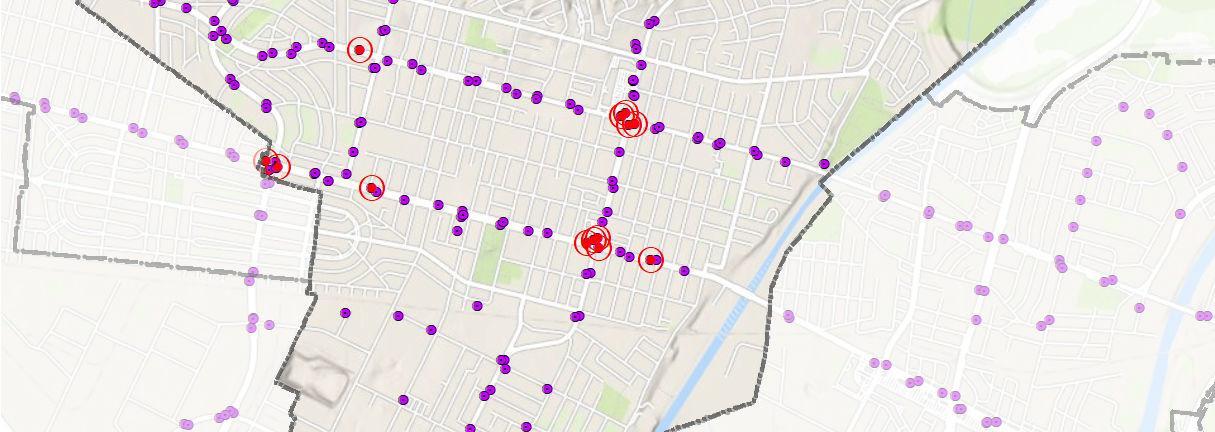
Figure 2-26 shows all bike injury collisions and Figure 2-27 shows all pedestrian injury collisions that occurred between 2011 and 2021. Each map has the collisions “heat map” with shaded red “hot spots” where the highest density of collisions has occurred between 2011 to 2021. As shown in the figures, both bicycle and pedestrian collisions follow a simi-
lar pattern in the street grid with the highest density of injury related collisions occurring on the following corridors/streets:
» Beverly Boulevard
» Whittier Boulevard
» Garfield Avenue
» Montebello Boulevard
» Greenwood Avenue
» Washington Boulevard


Census tract attributes are incorporated to provide additional demographic and socio-economic information that can be used to help prioritize future projects. As shown in Figure 2-28 on the following page, the City of Montebello includes thirteen census tracts and a small corner of a census tract that is mostly in the City of Commerce. Due to the small proportion of this census tract within the City boundary, it is not included in further analysis.
One challenge with using census tracts to quantify high numbers of pedestrian and bicycle collisions within the City of Montebello, is the location of census tract edges that coincide with roads, many of which are also MBL bus routes. Whereas collision data points have latitude and longitude coordinates, they may not have exact location accuracy and collisions near census tract edges may get counted in one tract over the other potentially increasing one census tract count slightly over another adjacent census tract. Because this potential data accuracy issue cannot be resolved within the existing data, the quantities shown in the following tables are based on the collision point data using the x-y coordinate of the collision data and the census tract containing it.
Of the thirteen Montebello census tracts, nine have existing bus lines running along their edges, and coincidentally have the highest levels of pedestrian and bicycle collisions in the City highlighted by the “Heat Map” red shading. Darker shades of red circles on the figures indicate high quantities of collisions at a location, and lighter red circles indicate lower quantities of collisions. The nine census tracts associated with bus routes and high numbers of collisions, as shown in Figure 2-29 will be focused on to identify proposed projects.
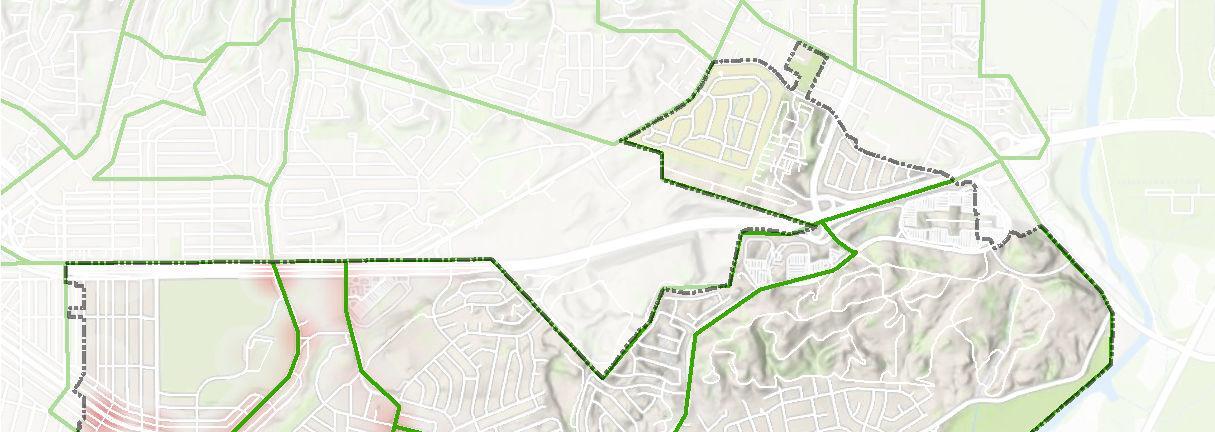

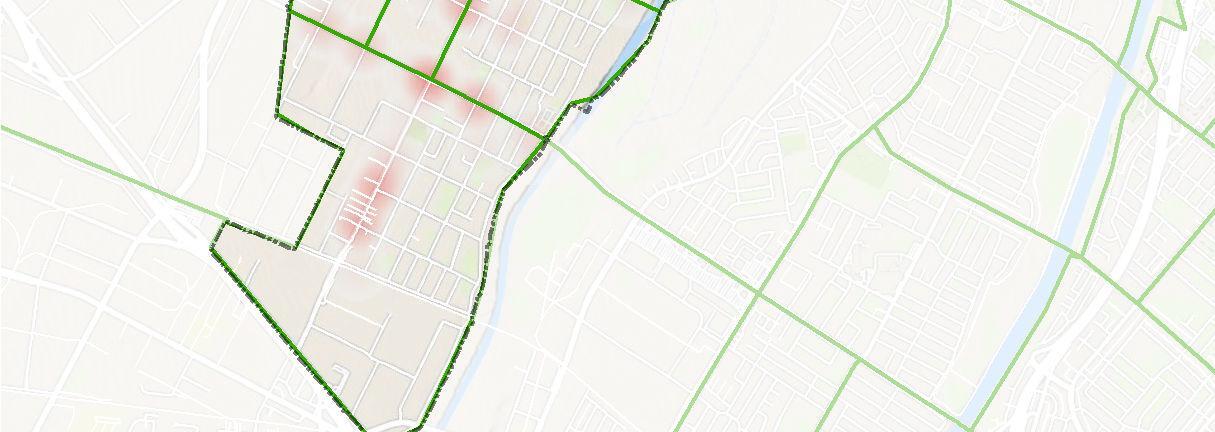

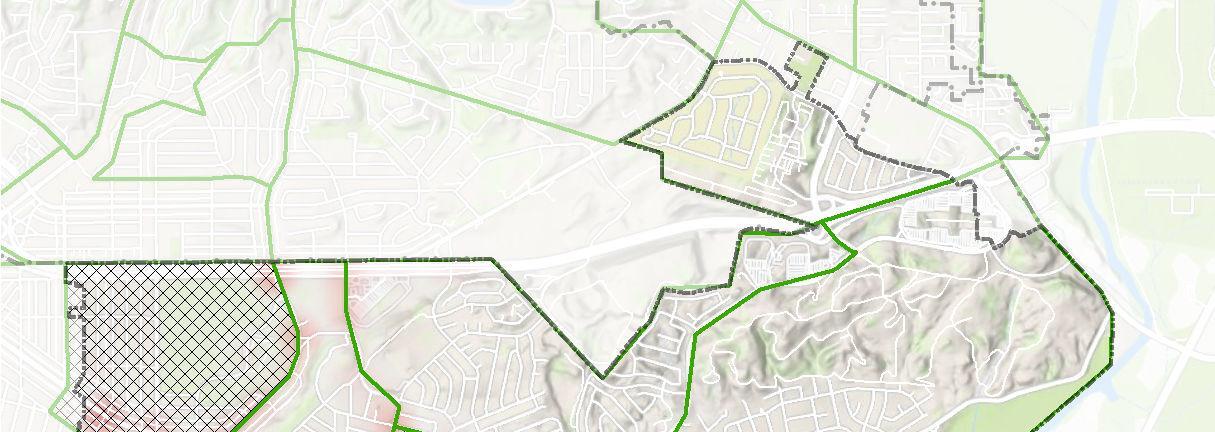


Table 2-1 shows all pedestrian and bicycle injury collisions grouped by the thirteen census tracts in Montebello and counted by severity of injury. The underlying “Heat Map” red zones shown on the previous maps highlight areas of highest number of pedestrian and bicycle collisions within Montebello. Census Tract 530102, where Montebello High School and Wash-
ington Elementary School are located, has the highest number of bicycle and pedestrian collisions of degree of injury at 79 crashes between the years 2011 and 2021. Census tract 530202 in the northwestern most part of the City as well as tract 532200, in the southern most part of the City, both have the greatest concentration of fatal and severe injury collisions.
Table 2-1: Bike and Pedestrian Collision Severity by Census Tract
Table 2-2 groups all collisions for all thirteen census tracts by year to see if collisions increase or decrease by year. Whereas a clear pattern of increase or decrease is not obvious, the two tracts showing the greatest increase of collisions over time include tract 530006, where the Mart of Montebello is located, and tract 532200, the southern most portion of the City.
Table 2-2: Collision Density per Year per Census Tract
Table 2-3 provides a comparison of Primary Collision Factors for the nine selected census tracts, previously highlighted in Figure 2-29. Violating a pedestrian’s right-of-way may entail a vehicle proceeding into the crosswalk with pedestrians present or crossing the street at intersections. Violating traffic signals and signs may entail a vehicle not conforming to the present signage, signals, or proceeding into the crosswalk with people walking present. Bicyclists riding on the wrong side of the road are likely due to the lack of adequate bike facilities to meet desire lines which, for example, a two-way cycle track would mitigate.
Reported pedestrian violations frequently include crossing a street outside of a designated crosswalk or crossing against a red signal, which may be a result of reporting bias. Research published in the Journal for Transport and Land Use notes that a deceased pedestrian or bicyclist is not able to give their perspective on the collision and the person reporting the collision usually has the perspective of a motorist. These points tend to skew data resulting in pedestrians and cyclists being blamed for a disproportionate number of crashes. This should be considered when developing traffic safety countermeasures.
Table 2-4 provides a summary of corridors with the highest collisions, the primary collision factor, and existing infrastructure that may be contributing to collisions. As noted in the table, and figures throughout this section, most collisions occur on multi-lane collector roads with high volumes of traffic and higher speed limits.
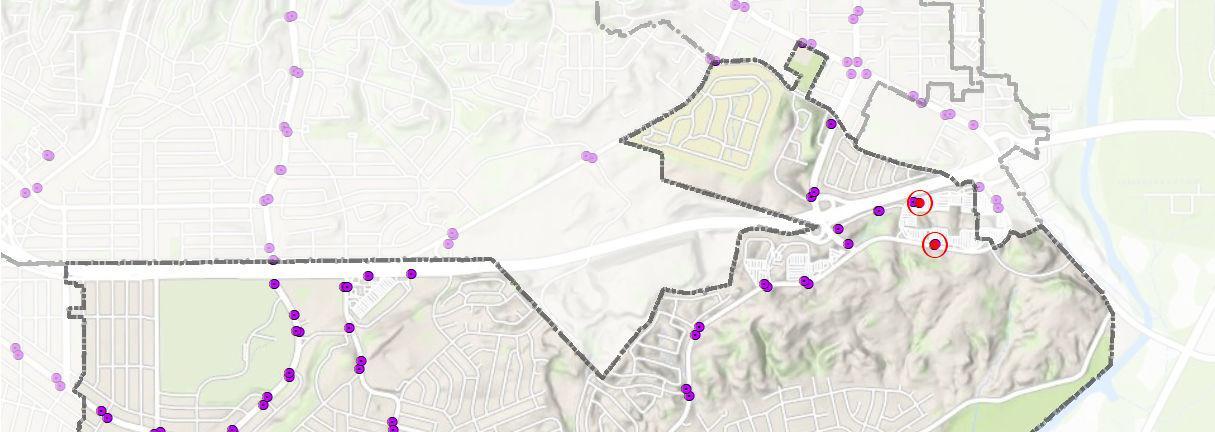
Of the 189 bus stops, the 15 highest ridership bus stops are shown in Table 2-5 and Figure 2-30. The highest ridership stop is Whittier Boulevard and Montebello Boulevard with over 140,000 boardings and alightings for a two-year period. The next highest stop is the adjacent bus stop, also at Whittier Boulevard and Montebello Boulevard. Similarly, Whittier Boulevard and Garfield Avenue have two adjacent bus stops with very high ridership levels totaling over 150,000 boarding and alightings. To further assist the decision-making process regarding priority bus stop locations for future projects, Figures 2-31 and 2-32 overlay high density collision areas as red shaded ‘heat’ zones along with the bus stop boarding and alighting volumes to see if high collision rates are occurring at high ridership bus stops. As may be expected, the highest collision rates occur along prima-
ry corridors which are also where nearly all bus stops are located, including the highest ridership stops noted previously.
Table 2-5 on the following page shows bus stops with the highest ridership volumes. Ridership volume is one of the criteria in determining which projects this plan will focus on, as well as number of collisions and input from stakeholders and transit users. Figures 2-30 through 2-32 on subsequent pages show the bus stops with the top ridership levels as well as the volumes of boardings and alightings in the various bus stops. The highest numbers of bicycle and pedestrian crashes in the City are aligned with the bus routes in the City.
Highest Collision Corridors -Beverly Blvd. -Beverly Blvd. -Whittier Blvd. -Whittier Blvd. -Beverly Blvd. -Garfield Ave. -Whittier Blvd. -Garfield Ave. -Whittier Blvd. -Whittier Blvd. -Greenwood Ave. -Whittier Blvd. -Greenwood Ave. -Greenwood Ave.
Pedestrian Collisions
1 -Violating pedestrian ROW 2 -Pedestrian violations 1 -Violating pedestrian ROW 2 -Pedestrian violations 3 -Improper turning 1 -Violating pedestrian ROW 2 -Pedestrian violations 3 -Unsafe starting or backing
-Violating pedestrian ROW
-Pedestrian
3 -Unsafe speed
-Pedestrian violations 2 -Unknown or Not Stated cause 1 -Pedestrian violations 2 -Traffic signals and signs 3 -Violating automobile ROW 4 -Unsafe starting and backing 1 -Violating pedestrian ROW 2 -Pedestrian violations 3 -Unsafe starting or backing 4 -Violating automobile ROW 1 -Pedestrian violations 2 -Violating pedestrian ROW 1 -Violating pedestrian ROW 2 -Pedestrian violations
3 -Unknown or Not Stated cause
Existing Pedestrian Infrastructure
-Numerous driveways cross sidewalks -Local road intersections lack signals and crosswalks -Numerous driveways cross sidewalks -Local road intersections lack signals and crosswalks -Numerous driveways cross sidewalks -Local road intersections lack signals and crosswalks -Numerous driveways cross sidewalks -Local road intersections lack signals and crosswalks -Numerous driveways cross sidewalks -Local road intersections lack signals and crosswalks -Numerous driveways cross sidewalks -Local road intersections lack signals and crosswalks -Numerous driveways cross sidewalks -Local road intersections lack signals and crosswalks
1 -Bicyclist on wrong side of road
-Numerous driveways cross sidewalks -Local road intersections lack signals and crosswalks -Numerous driveways cross sidewalks -On street parking blocks view to see pedestrians Bike Collisions
2 - Traffic signals and signs 1 -Bicyclist on wrong side of road 2 - Other hazardous violation 3 - Traffic signals and signs 1 -Bicyclist on wrong side of road 2 - Violating automobile ROW
and
on
side of
and
on
of
-Violating automobile ROW
2 -Bicyclist on wrong side of road
3 - Improper turning 1 -Bicyclist on wrong side of road 2 - Violating automobile ROW 3 - Traffic signals and signs
1 -Bicyclist on wrong side of road
2 - Traffic signals and signs
3 - Other hazardous violation
Existing Bicycle Infrastructure -Lack of bike lanes on both sides of road -Lack of bike lanes on both sides of road -Lack of bike lanes on both sides of road -Lack of bike lanes on both sides of road -Lack of bike lanes on both sides of road -Lack of bike lanes on both sides of road -Lack of bike lanes on both sides of road -Lack of bike lanes on both sides of road
1 -Bicyclist on wrong side of road
2 - Violating automobile ROW
3 - Traffic signals and signs 4 - Improper
-Lack of bike lanes on both sides of road
Table 2-5: Bus Stop Boardings and Alightings


The FMLM Plan can enhance the safety, access, and comfort for first mile/last mile connections by adopting policies, programs, and practices of other successful plans to encourage new transit riders as well as enhance the experience for existing users through implementing infrastructure, amenities, and programs.
This section outlines key local and regional preceding planning documents from the City of Montebello, SCAG, LA Metro, Caltrans, and Riverside Transit Agency (RTA) to enhance efforts at and around bus stops. Assessing existing planning documents helps to inform the policy development of the FMLM Plan, see Chapter 5 Policy Development. For each document, relevant policies, programs, and practices are provided in Appendix A.
Table 2-6: Planning Assessment for Local Planning Documents
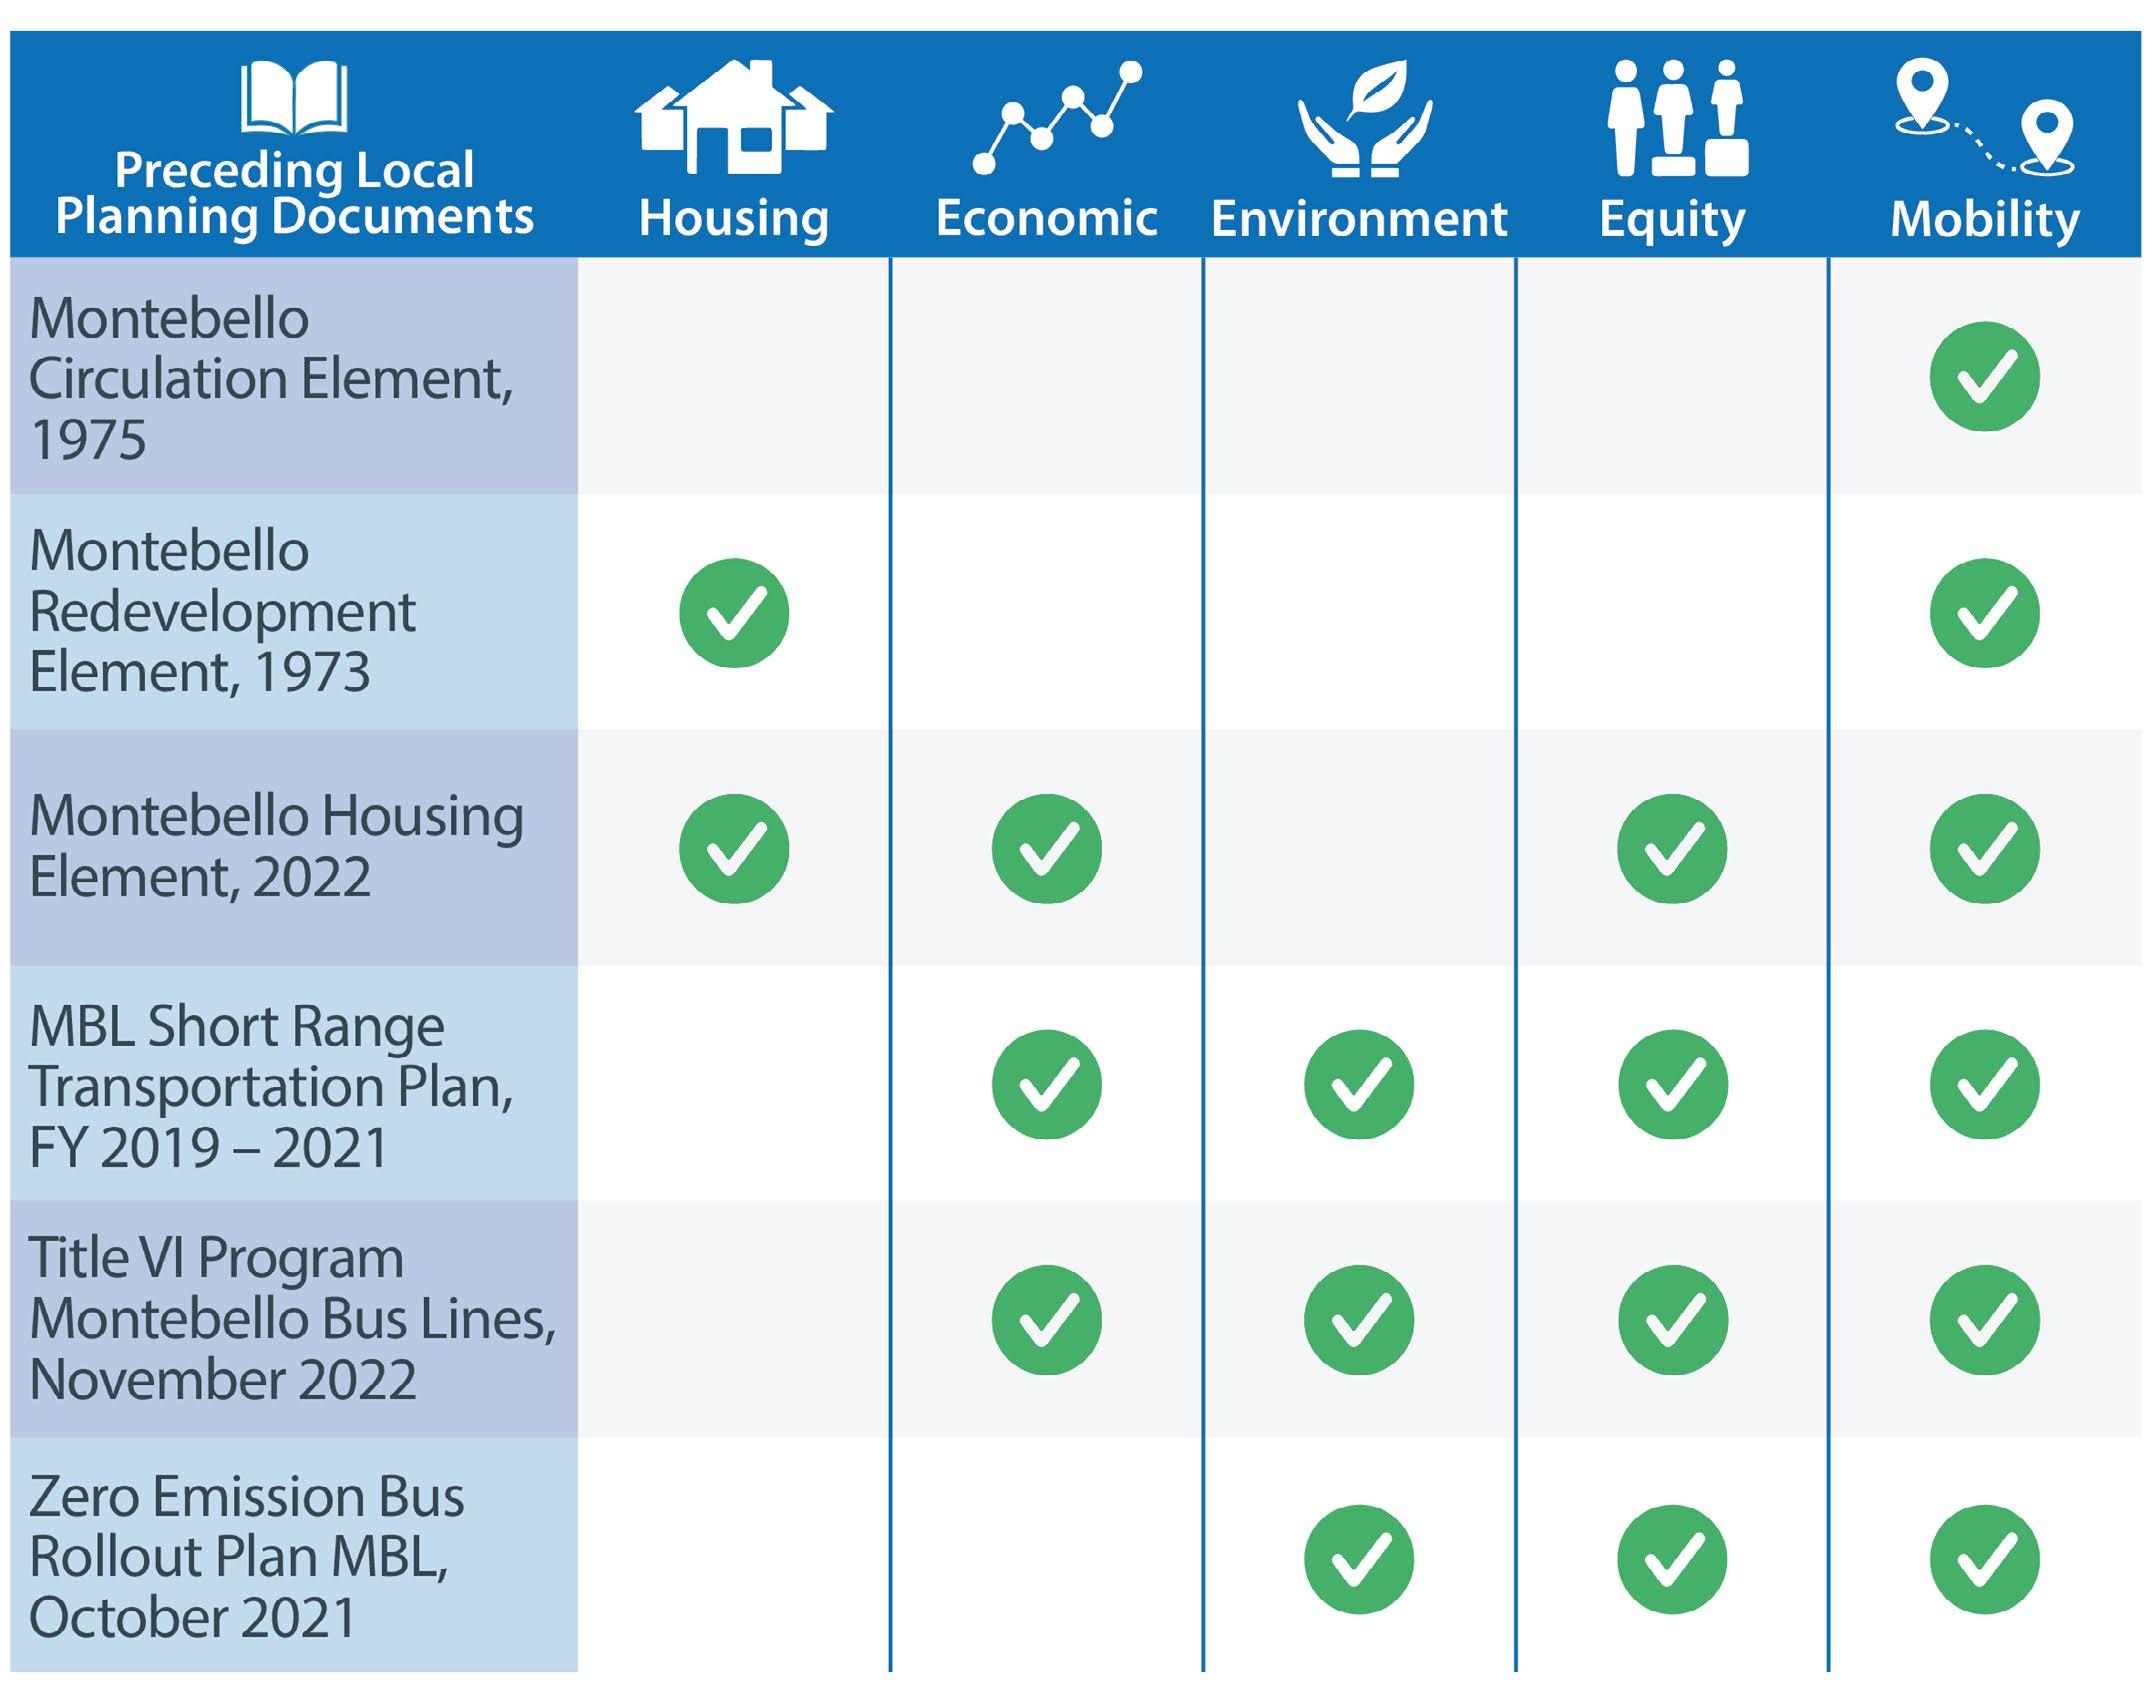
Table 2-7: Planning Assessment for Regional Planning Documents

This page is left intentionally blank.


The overall objectives of the community engagement were to identify a range of strategies to reach and engage an appropriately diverse group of residents and representative stakeholders, to build awareness of and support for the FMLM Master Plan, and to collect feedback about existing conditions of the pedestrian and bicycle network that limit such trips. This provided opportunities to introduce improvements that would support an increase in walking, biking, and rolling trips. Special attention was focused on strategies to engage the most vulnerable users of the public right-of-way (e.g., people aged 60 or older, children, people of color and other minorities, low-income individuals, and those with mobility challenges). These populations are the most impacted by transportation planning and policy and have traditionally not been well represented in the decision-making process.
Focus on vulnerable users of the public right-ofway. Children, older adults, those with disabilities, and non-vehicle owners make up the largest percentage of traffic fatalities and serious injuries. People biking and walking, in particular, make up a disproportionate percentage of traffic fatalities and serious injuries. The KTUA Team ensured these populations were a part of the discussion to push for further mobility equity in Montebello.
Communicate in a way that residents will understand. This begun with conducting outreach in the language spoken by residents (primarily English, Spanish, and Mandarin in this instance) and in a manner that was easy for people to understand. This included creating graphics for complex and technical topics, avoiding acronyms and too much transportation jargon, and being mindful to explain the various stages of the planning process.
use a variety of engagement strategies to reach out to as many groups of the population as possible. The KTUA Team participated in Montebello and SCAG approved citywide events that attracted significant participation from diverse user groups. The KTUA team also provided information to the City for the project website, various social media platforms, and in print for those with limited digital access or personal preference.
The City’s social media platforms were used to cast a wide net for potential engagement and were used throughout the planning process to showcase the development of the FMLM Master Plan. All community
engagement efforts were conducted in person at City events. These information booths were interactive and properly staffed with project team members. To help further extend reach of project-specific messaging, a short 2-minute video was developed to introduce people to the FMLM Master Plan and opportunities to participate in the planning process.
Collect feedback on key components of the FMlM Master Plan. One of the primary goals of the outreach events was to collect resident and stakeholder feedback on various aspects of the FMLM Master Plan. The KTUA Team participated in three (3) community workshops and provided a number of other opportunities for the public to provide input. There was one (1) demonstration event, organized in collaboration with SCAG’s Go Human Campaign, that introduced potential treatments and asked participants to choose which they would prefer in specific locations.
Surveys were used during the project’s onset to solicit feedback. The first survey asked participants about the physical barriers limiting access to transit service and potential solutions. This was available on the project website and in person during the first community engagement event.
The project team designed, administered, and hosted a variety of tools and techniques to engage stakeholders and the public to increase awareness of and solicit feedback for the FMLM Master Plan. Educational outreach was a critical component to the plan’s success and focused on engaging the City’s most vulnerable roadway users.
The three primary community engagement strategies that were utilized for the ATP were:
» Technical Advisory Committee (TAC)
» Community events and pop-ups
» Survey (hard copy and online) and a project website.
As part of the Montebello FMLM, participation from stakeholders throughout the planning process was essential. Meetings were timed to help inform project goals and public outreach strategies and activities,
solicit feedback, and recommendations and will coincide with other activities for which feedback is being sought in order to solicit feedback on the same concepts to the extent feasible and appropriate.
The KTUA Team worked with the City of Montebello and SCAG staff to identify an appropriately diverse and representative group of partners to comprise the Technical Advisory Committee (TAC). The list included representatives from various City departments, including Public Works, Parks and Recreation, Montebello Unified School District, LA Metro, Metrolink, YMCA and SCAG. A complete list of the participants can be found in Appendix B.
The KTUA Team developed content for, facilitated, and memorialized six (6) TAC meetings throughout the planning process. TAC meetings had a duration of one (1) hour and were held virtually. TAC meeting #2 was held in a hybrid capacity. The TAC met on a bi-monthly basis and was tasked with providing feedback on engagement plans and findings, promoting engagement opportunities to their networks, and giving input on Plan needs and recommendations.
Technical Advisory Committee Meeting #1 –December 5, 2022
» Focus on the project overview and what community engagement efforts were being made
» Discussion of mobility challenges in the City of Montebello
Technical Advisory Committee Meeting #2 –February 7, 2023
» Discussion of existing conditions with an overview of existing pedestrian and bicycle networks, including crash data
» Preview and discussion of the walk and bike audits
Technical Advisory Committee Meeting #3 –April 4, 2023
» Discussion of the project survey results
» Focus on choosing locations for FMLM plan projects
» Overview of future engagement
Technical Advisory Committee Meeting #4 –May 23, 2023
» Discussion of upcoming engagement and project video
» Overview of Collision Analysis results (20112021)
» Discussion of projects within the FMLM
Technical Advisory Committee Meeting #5 –August 8, 2023
» Discussion of previous and upcoming community engagement
» Overview of potential treatments that are being recommended on the FMLM
» Overview of the specific projects and their development
Technical Advisory Committee Meeting #6 –November 14, 2023
» Discussion of the previous community engagement
» Overview of the draft FMLM masterplan
The KTUA team, in collaboration with Montebello staff, designed materials for and participated in a series of in-person events to promote the Montebello FMLM and solicited feedback from the community. In order to have maximum reach, the project team used already scheduled citywide events to set up booths and interactive activities to collect community feedback. Engagement activities included interactive boards where participants could provide opinions regarding existing and future infrastructure within the City of Montebello. A summary of these events and feedback received are summarized on the following pages.
The KTUA team, in collaboration with Montebello staff, hosted a booth at the annual Heritage Festival on October 16, 2022. The pop-up served as an ideal opportunity to speak with the community about the Montebello FMLM project and collect input about what infrastructure types the public would like to see installed around the City. The KTUA team distributed surveys, snacks, and giveaway items for those who participated.
The team interacted with hundreds of event participants and gained valuable insights regarding what infrastructures the public would like to see installed around the City of Montebello. Participants were asked to place stickers on any street treatments they would like to see in the City. These boards were available in English, Spanish, and Mandarin.
At the conclusion of the event, the boards displayed a distribution of votes across the various street treatments. Results of the boards are found in table 3-1.
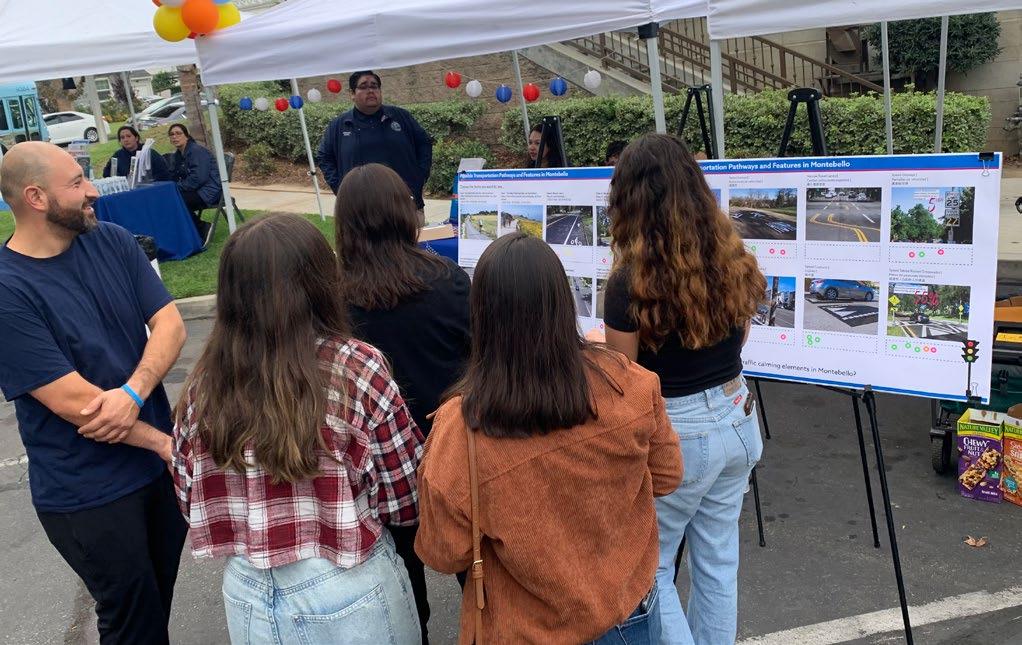
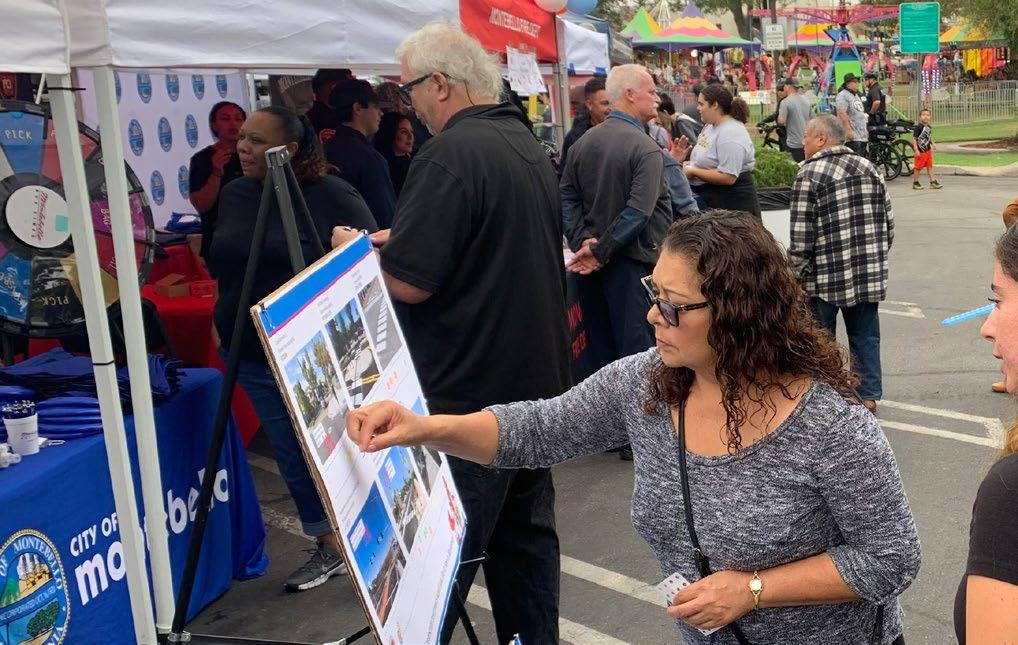
Table 3-1: Heritage Festival Input Summary
The KTUA team, in collaboration with Montebello staff, hosted a booth at the annual Downtown Street Fest on July 29, 2023. The pop-up served as an ideal opportunity to speak with the community about the Montebello FMLM project and collect input about what infrastructure types the public would like to see installed around the City. As part of the booth, the KTUA team showcased two temporary infrastructure elements from the SCAG Kit of Parts. These temporary elements included:
» Separated bike lane
» Creative crosswalk
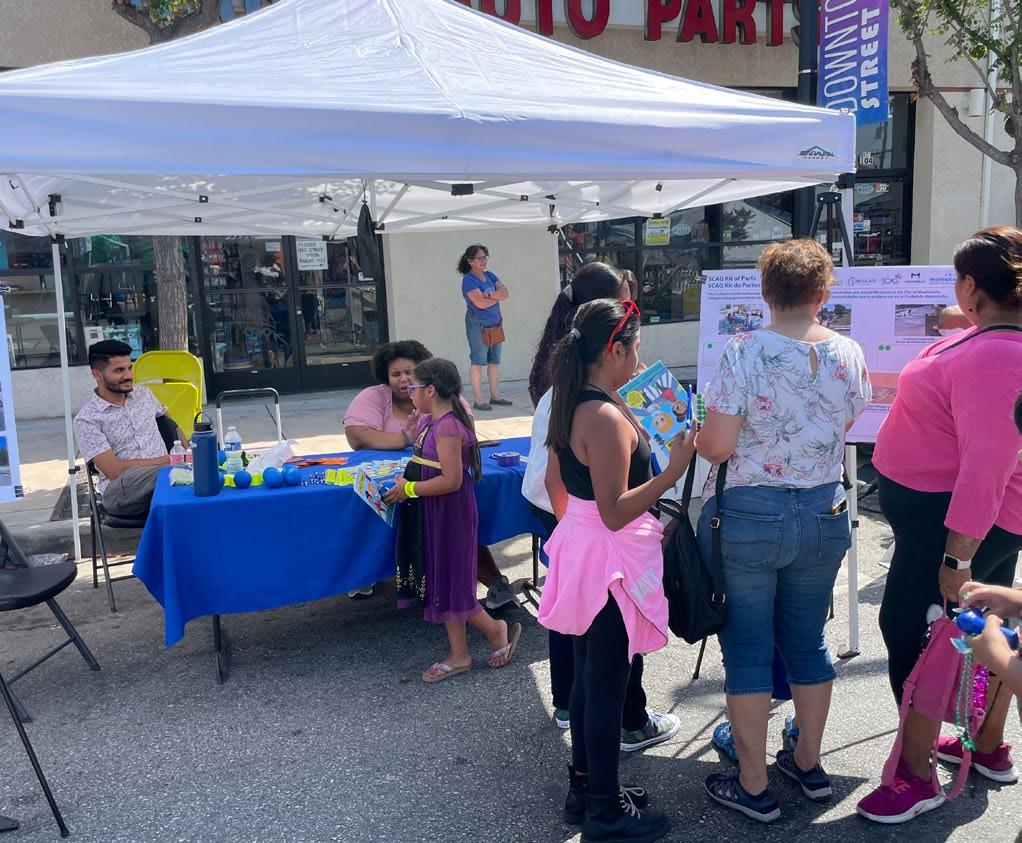
Montebello residents were able to physically interact with these temporary infrastructures and provide input about what they thought about them. Using stickers, residents indicated which of the temporary infrastructures they liked the most. The parklet received 21 votes, the creative crosswalk received 16 votes, the separated bike lane received 13 votes, the curb extension received 8 votes, and the median refuge island received 8 votes, as shown in Figure 3-1.
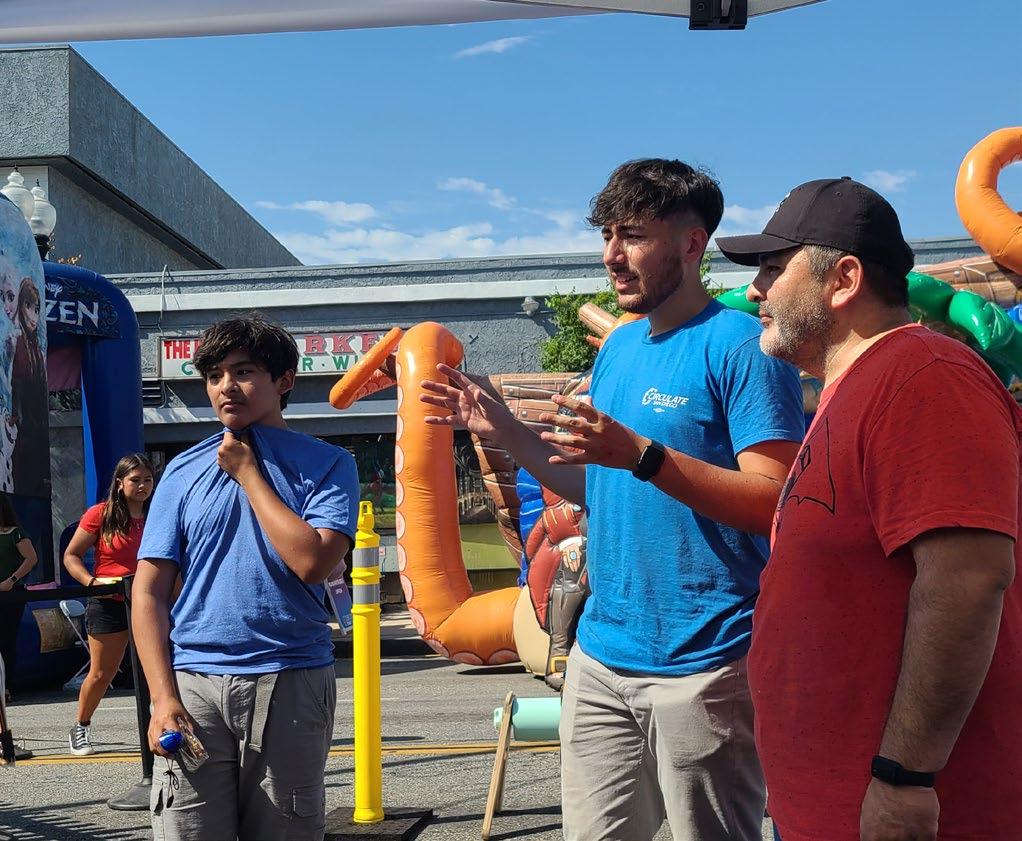
The KTUA team, in collaboration with Montebello staff, hosted a booth at the annual Heritage Festival on October 7, 2023. This is the same event that the KTUA team previously participated in 2022. Due to the success of the previous event, the team decided to pursue the event once again. The pop-up served as a way to update residents on the progress of the FMLM and gain input on some of the current projects that the team has developed over the previous months. The KTUA team distributed snacks and giveaway items for those who participated.

The team interacted with hundreds of event participants and gained valuable insights regarding what projects the public would like to receive funding priority around the City of Montebello. Participants were asked to place stickers on any intersection or priority project they would prioritize funding for. At the conclusion of the event, the boards displayed a distribution of votes across the various proposed projects, as shown in Figure 3-2.

In order to be consistent with the City’s branding and graphic requirements, a similar type of branding style was used for this Active Transportation Plan (ATP). The project’s branding was used in all outreach materials, including flyers, surveys, maps, and outreach materials.
The City’s social media was used to share updates and events such as the project survey and an educational video about how to participate and give feedback in the FMLM. The City of Montebello also created a landing page on their website for the project to post project information, upcoming outreach efforts, and the project survey.
A survey was created and administered by the project team to allow public input and to help identify barriers that affect access to and from public transit. Findings will be used to inform recommendations for infrastructure improvements to improve first / last mile connections to transit stops.
The survey was open to the public for a series of five months (October 2022-February 2023). Respondents were asked to identify any specific barriers or challenges that they have encountered while accessing public transit in the City of Montebello. Additionally, respondents were asked to provide locations and transit route information to accurately pin where these problems exist. A trilingual flyer (English, Spanish, and Mandarin) was created to distribute the survey to residents around the City. It was posted in local libraries, Montebello City Hall, and multiple community centers and is shared in Appendix C.
Additionally, the project team targeted Montebello Unified School district and school principals to help distribute the survey to families. The flyer was also posted on Montebello social media channels and on the project website. Two sets of social media graphics were used to consistently promote the flyer over a series of weeks. The flyer and the social media graphics used is shown in Appendix D.

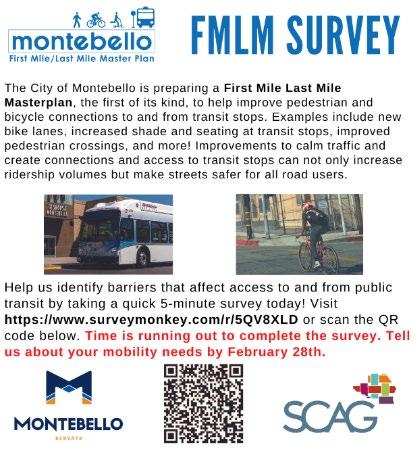

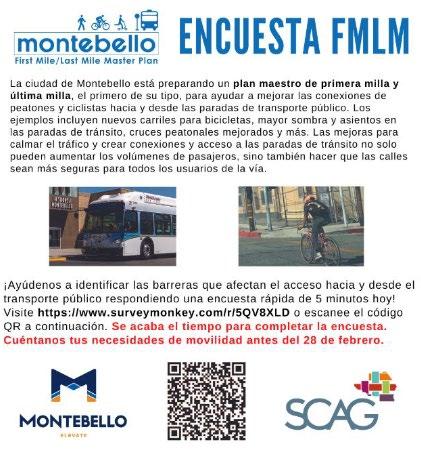
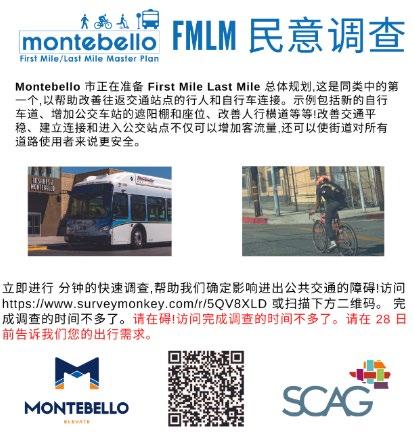
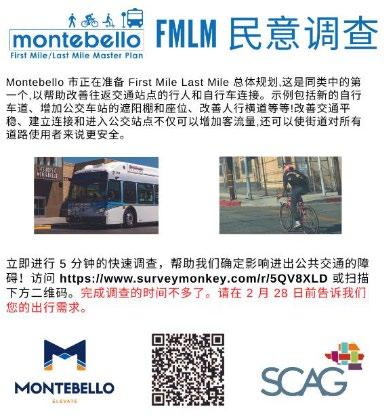
Question 1: Do you experience any problems walking, cycling or accessing transit at a particular location or along a particular route?
Question 4: Is there ANOTHER location where you experience problems walking, cycling or accessing transit? If not, and you would like to finish the survey, click NO.
No
Question 2: Please provide location and route information (where you’ve experienced problems walking, cycling or accessing transit) in the fields below.
The three most common corridors mentioned were Beverly Boulevard, Whittier Boulevard, and Washington Boulevard. These are some of the important thoroughfares that go through the City of Montebello. The most common bus routes that were mentioned were the 10, 20, and 40 routes.
Question 3: Please note problems associated with the previously mentioned location. Please check ALL that apply.
No
Lack of car parking at parks / rides
Long distance / poor connectivity
Lack of matching bus stop
Question 5: Please provide location and route information (where you’ve experienced problems walking, cycling or accessing transit) in the fields below.
The three most common corridors mentioned were Garfield Avenue, Whittier Boulevard, and Montebello Boulevard. These are some of the important thoroughfares that go through the City of Montebello.
Question 6: Please note problems associated with the previously mentioned location. Please check ALL that apply.
68.7% Lack of bicycle routes & parking
43.7% Automobile traffic
43.7% Personal safety
43.7% Difficult intersection / street crossing
12.5% Walking impediments
25.0% Missing sidewalks
0.0% Missing curb ramps
12.5% Lack of car parking at parks / rides
12.5% Long distance / poor connectivity
6.2% Lack of matching bus stop
Question 7: Is there ANOTHER location where you experience problems walking, cycling or accessing transit? If not, and you would like to finish the survey, click NO.
Question 8: Please provide location and route information (where you’ve experienced problems walking, cycling or accessing transit) in the fields below.
The three most common corridors mentioned were Whittier Boulevard, Montebello Boulevard, and Wilcox Ave.
Question 9: Please note problems associated with the previously mentioned location. Please check ALL that apply.
Question 10: Is there ANOTHER location where you experience problems walking, cycling or accessing transit? If not, and you would like to finish the survey, click NO.
66.6% Lack of bicycle routes & parking
50.0% Automobile traffic
33.3% Personal safety
50.0% Difficult intersection / street crossing
33.3% Walking impediments
16.67% Missing sidewalks
8.3% Missing curb ramps
0.0% Lack of car parking at parks / rides
0.0% Long distance / poor connectivity
8.3% Lack of matching bus stop
Question 11: Please provide location and route information (where you’ve experienced problems walking, cycling or accessing transit) in the fields below.
The three most common corridors mentioned were Beverly Boulevard, Whittier Boulevard, and Montebello Boulevard.
Question 12: Please note problems associated with the previously mentioned location. Please check ALL that apply.
Question 13: Is there ANOTHER location where you experience problems walking, cycling or accessing transit? If not, and you would like to finish the survey, click NO.
80.0% Lack of bicycle routes & parking
40.0% Automobile traffic
30.0% Personal safety
60.0% Difficult intersection / street crossing
20.0% Walking impediments
10.0% Missing sidewalks
20.0% Missing curb ramps
0.0% Lack of car parking at parks / rides
30.0% Long distance / poor connectivity
10.0% Lack of matching bus stop
Yes No
Question 14: Please provide location and route information (where you’ve experienced problems walking, cycling or accessing transit) in the fields below.
The three most common corridors mentioned were Whittier Boulevard, Montebello Boulevard, and Garfield Avenue,
Question 15: Please note problems associated with the previously mentioned location. Please check ALL that apply.
Question 16: Is there ANOTHER location where you experience problems walking, cycling or accessing transit? If not, and you would like to finish the survey, click NO.
66.6% Lack of bicycle routes & parking
66.6% Automobile traffic
44.4% Personal safety
55.5% Difficult intersection / street crossing
22.2% Walking impediments
0.0% Missing sidewalks
0.0% Missing curb ramps
0.0% Lack of car parking at parks / rides
22.2% Long distance / poor connectivity
11.1% Lack of matching bus stop
Question 17: Do you have other ideas for improving access to transit services? If so, please provide them in the text box below.

At the end of the survey period, a total of 209 responses were collected. Respondents were asked if they have experienced any problems with walking, cycling, or accessing transit at any specific locations.
Respondents reporting experiencing an array of issues from poor connectivity, personal safety, sidewalk gaps, broken infrastructure, and lack of parking at park and rides. Long crossing distances and difficult intersections were also a commonly noted concern.
Recommendations ranged of the addition of bike lanes (especially on major corridors like Beverly Boulevard, Whittier Boulevard, and Montebello Boulevard), the addition of benches and shelters at bus stops throughout Montebello, and the widening of existing sidewalks. Along with the widening of sidewalks, the request for sidewalks where they are missing was also suggested.


This FMLM Plan will guide the development of first last mile infrastructure to improve connections to and from transit user’s origins and destinations. Through data analysis and stakeholder engagement, the following vision statement and goals were shaped with supporting implementation strategies that serve as action items to help achieve the overarching vision and work towards implementation of recommended solutions.
To enhance the commuter experience for existing transit users while attracting new riders through safe, convenient, and comfortable bus stop amenities and first last mile infrastructure.
Goals
To realize this vision, it was necessary to develop goals, representing ideal outcomes that encourage high performance.
Objectives
In support of each goal are objectives, or clear and measurable targets representing a step toward achieving a goal.
Strategies
Each objective is supported with strategies that represent a tangible activity working towards attaining an objective; whether it be through policy development, infrastructure treatments, programmatic implementation, or technology.
Objective 1.1: Understand the needs and concerns of transit users.
» Strategy 1.1.1: Develop an annual satisfaction survey and conduct surveys to gather feedback on bus service, bus stops and the Metrolink Station. Provide QR codes at bus stops and transit centers to direct users to the MBL website to take surveys to obtain regular feedback. (MBL)
Objective 1.2: Identify improvement needs at bus stops and the Montebello/Commerce Metrolink Station.
» Strategy 1.2.1: Develop a bus stop assessment checklist to assess the condition of high use and/ or high complaint bus stops. (MBL)
» Strategy 1.2.2: Conduct annual bus stop assessments to prioritize bus stops in need of maintenance. (MBL)
» Strategy 1.2.3: Coordinate assessment of needs and maintenance with the City of Commerce and LA Metro on the Montebello/Commerce Metrolink Station. (MBL)
» Strategy 1.2.4: Regularly update GIS data with amenities. (MBL)
» Strategy 1.2.5: Coordinate with Public Works on corridor improvement projects that may assist with installing bus shelters and improving access to transit. (MBL and Public Works)
» Strategy 1.2.6: Ensure equitable distribution of transit amenities across MBL’s system where they have the decision-making authority and are within their jurisdiction to do so. (MBL)
» Strategy 1.3.1: Streetscapes should be utilized to provide visually attractive and physically comfortable environments that are integrated with similar environments of adjacent private property. Cultural, environmental, and historical considerations should be acknowledged when developing a streetscape. (Public Works)
» Strategy 1.3.2: Utilize the streetscape to establish a character or theme for special areas, historic districts, activity centers, neighborhoods, or scenic drives and gateways. Refer to Montebello Municipal Code1993 on landscape requirements. (Public Works)
Objective 1.4: Make bus stops a secure environment for customers, both from a traffic safety and from a personal safety perspective.
» Strategy 1.4.1: Maintain visible level of systemwide security presence and surveillance coverage which may include unarmed security and
activating spaces. (Police Department and Public Works)
» Strategy 1.4.2: Maintain and provide direct access to Metrolink shuttles, Dial-A-Taxi, buses and transit facilities. Avoid blind spots such as landscaping, fencing and/or structures blocking surroundings to ensure overall visibility of the bus stop from the street and surrounding areas. (MBL and Public Works)
» Strategy 1.4.3: Maintain/provide additional lighting at all bus stops. Continue to install solar lights at bus stops throughout the MBL system. (MBL)
» Strategy 1.4.4: Support long-term storage/parking for bicycles and micromobility options at transit stations or options for safely bringing devices on-board. (MBL and LA Metro)
Objective 2.1: Conduct annual bicycle and pedestrian safety assessments.
» Strategy 2.1.1: Annually review pedestrian collision data within a one half-mile and bicycle collision with three-miles of bus stops and Metrolink Station using data such as the SWITRS or Transportation Injury Mapping System (TIMS). (MBL and Public Works)
» Strategy 2.2.2: Analyze the collected bicycle and pedestrian collision data to identify hot spot locations and trends to develop countermeasures to mitigate the causes of collisions. The safety approach will not be limited to hotspot mitigation. Refer to this First Mile-Last Mile Plan for example countermeasures and recommendations. (MBL and Public Works)
» Strategy 2.2.3: Refer to the City’s Local Road Safety Plan (LRSP) to identify high-injury corridors and make recommendations. Pursue funding through the federal Highway Safety Improvement Program (HSIP) or SS4A Grant Program to further implement safety countermeasures. (MBL and Public Works)
Objective 2.2: Provide a connected, comfortable, and safe pedestrian and bicycle network.
» Strategy 2.2.1: Develop an Active Transportation Plan to build upon First Mile-Last Mile Plan components. (MBL and Public Works)
» Strategy 2.2.2: Develop a bus stop access assessment checklist to assist in assessing non-motorized access to bus stops to complete station area pedestrian, bicycle and micromobility improvements to improve transit access and safety. (MBL)
» Strategy 2.2.3: Prioritize underserved neighborhoods where walking, bicycling, and using the bus is the primary mode of transportation. (MBL and Public Works)
» Strategy 2.2.4: Build upon the First Mile-Last Mile Plan and analyze the number of missing sidewalks and crossing locations within one quarter mile of new bus stops, high ridership bus stops and Metrolink Station to identify likely paths of travel to bus stops that connect neighborhoods and destinations. (MBL and Public Works)
» Strategy 2.2.5: Improve pedestrian linkages between residential, commercial, and community facilities and schools to bus stops by providing direct and continuous access. (MBL and Public Works)
» Strategy 2.2.6: Implement well defined crosswalks at intersections, and mid-block crossings to increase safe access to bus stops and local destinations. (Public Works)
» Strategy 2.2.7: Pursue funds to implement active transportation improvements through grants programs such as the Caltrans Active Transportation Program, Safe Streets and Roads for All and Prop 68 Urban Greening Program. (MBL and Public Works)
Objective 2.3: Implement Complete Streets projects to provide multi-modal access to bus stops and the Metrolink Station.
» Strategy 2.3.1: Develop a Complete Streets Corridor Plan with first and last mile to transit components for high need, high collision rate corridors. (MBL and Public Works)
» Strategy 2.3.2: Identify improvements aimed at enhancing the safety of existing roadway us-
ers (e.g. traffic signal coordination, traffic circles, roundabouts, bicycle facilities, etc.). (MBL and Public Works)
» Strategy 2.3.3: Utilize minimum turning radii and/ or curb extensions as a traffic calming technique at locations that street character, as defined by land use and street classification, calls for slower speeds and enhanced pedestrian environments. Traffic calming measures should:
1. Promote safe and attractive conditions for motorists, bicyclists, pedestrians, and residents on neighborhood streets;
2. Mitigate the impact of vehicular traffic, including excessive speed and collisions.
3. Discourage cut-through traffic in residential areas
4. Provide a visually attractive environment for those who use the bus or travel by active transportation modes through an area by increasing landscaping and gateway opportunities. (Public Works)
» Strategy 2.3.4: Expand the Capital Improvements Program to includes numerous other programs and projects like the Associated Capital Maintenance Program, Bus Stop Improvement Project, CAD/AVL Passenger Information System Project (PISP), Enterprise Asset Management System, Facility Improvements, Hybrid Bus Repower, Pico Rivera Transit Center, Support Vehicles, Technology and Equipment Support, Transit Coach Tires, Universal Fare System, Vehicle Replacement Project. (MBL and Public Works)
Explore Transportation Network Companies (TNCs) and micromobility options to access bus stops and the Metrolink Station.
» Strategy 2.4.1: Work with ride sharing / ride hailing private companies such as Uber and Lyft to provide valuable and discounted on-demand first and last mile connection to the Metrolink Station. Explore equitable or discounted fees for the underserved. (MBL)
» Strategy 2.4.2: Integrate micromobility parking at high-use bus stops and the Metrolink Station for the expanding use of scooters and bike share. Explore equitable or discounted fees for the underserved. (MBL)
» Strategy 2.4.3: Plan and design mobility hubs at civic centers, regional shopping centers, schools and other areas where needed. (MBL and Planning & Community Development)
promote active transportation and bus use.
» Strategy 3.1.1: Utilize a collaborative planning process such as project Technical Advisory Committees and Development Review Committees to encourage the integration of non-motorized transportation modes in new and redevelopment projects and corridor studies with existing and future bus routes. As part of these discussions, encourage designing safe and pleasant bus stops near activated locations to provide more visibility around the bus stops. (MBL)
» Strategy 3.1.2: Continue coordination between LA Metro, SCAG, and neighboring cities on future Transit-Oriented Development (TOD) hubs to be included in future planning. (MBL and Planning & Community Development)
» Strategy 3.1.3: Plan and install bus stops to coordinate with the community and regional multi-modal transportation system and support existing land uses such as mixed-use development and high density housing. Providing bus stops in activated locations provides additional visibility and lighting around bus stops. (MBL)
» Strategy 3.1.4: Locate and concentrate land uses and urban design to promote and facilitate safe pedestrian and bicycle access to public transportation and installation of new bus stops or improving existing ones. Design adjacent bus stops to provide increased bus stop access and safety while providing additional safety features at the bus stop itself such as shelters and additional lighting. (MBL and Planning & Community Development)
» Strategy 3.1.5: Coordinate the development of land use, transit and active transportation strategies in areas expecting growth. (MBL and Planning & Community Development)
Objective 3.2: Improve the street-land use relationship to provide additional visibility and amenities for bus stops.
» Strategy 3.2.1: Along bus routes, locate new buildings within a reasonable walking distance from the right of way line to allow easy access for bus and Metrolink users. In placing buildings along arterial or major collector streets, accommodate for the required space for bus shelters with adequate sidewalk and parkway widths. (MBL and Planning & Community Development)
» Strategy 3.2.2: Minimize parking and maximize land-use density within close proximity to bus facilities to provide additional visibility around the bus stop. (MBL and Planning & Community Development)
» Strategy 3.2.3: Minimize walking distances between developments and bus stops, especially those with walls or gates, to provide better access to transit. Where applicable, provide additional safety measures such as additional lighting and aesthetics such as an improved streetscape. (MBL and Planning & Community Development)
Objective 4.1: Continue to improve public awareness of safety practices.
» Strategy 4.1.1: Foster a culture of traffic safety by developing and conducting annual public outreach events to encourage and educate on safely accessing bus stops and bus stop safety. (MBL)
» Strategy 4.1.2: Partner on regional safety campaigns to improve driver awareness of the needs and rights of vulnerable road users. (MBL)
» Strategy 4.1.3: Pair major infrastructure changes and enforcement activities with messaging to communicate to community members the importance of traffic safety. (MBL and Public Works)
Objective 4.2: Advocate public transportation and enhance the image of MBL.
» Strategy 4.2.1: Continue the ongoing campaign to promote the sale of Transit Access Pass (TAP) and MBL Bus Tokens. (MBL)
» Strategy 4.2.2: Continue the partnership with local business through a MBL Day Pass Program to jointly promote transit and local businesses. (MBL)
» Strategy 4.2.3: Coordinate with multiple school districts to promote transit services and the benefits of student monthly passes; as well as a partnership with the Montebello Unified School District Parent Teacher Association to promote the Student Monthly Pass. (MBL)
» Strategy 4.2.4: Continue partnership with The Shops at Montebello. (MBL)
» Strategy 4.2.5: Participate in the (LIFE) Low income Fare is Easy Program led by Metro. This program provides fare subsidies that allow low-income patrons to redeem toward transit passes for eligible riders including adult regular fare, Senior/ Disabled/Medicare, K-12, and college/vocational students who meet the criteria. (MBL)
» Strategy 4.2.6: Continue ongoing meetings with the Transportation Citizen Advisory Committee to receive input from patrons of Montebello Bus Lines and the Dial-A-Taxi services. (MBL)
» Strategy 4.2.7: Work with the City’s Council Ad Hoc Committee for future programming efforts. (MBL)
» Strategy 4.2.8: Continue to grow and expand MBL’s social media outreach program (Facebook & Instagram) and in bus marketing to promote ridership. (MBL) Goal 4: Programs to Encourage Transit Use and Promote Safety, Comfort, and Accessibility
The project team interviewed six various transit agencies or municipal jurisdictions. The purpose of this exercise was to uncover lessons learned and best practices that can be applied to this Plan through policy development and design. The interview questions can be found in Appendix E.
June 22nd at 2:30pm
Interviewed: Malva Slachowitz, Senior Transportation Planner, Bike & Walk Program
King County Metro (Metro) serves the County as a transit agency but does not have control of the rights-
of-ways (ROW), which are overseen primarily by municipalities. Advantages of Metro is their focus on equitable mobility and therefore is in a position to develop ways to evolve and experiment with its service models and capital investments. Disadvantages include no control of the ROW, funding limitations, and expectations for parking. On-demand services have challenges for outsourcing, labor relations, technology, and equitable access. A key takeaway is that a bus stop warrants a shelter when there are 50 boardings per day in Seattle or 25 per day outside of Seattle.
July 11, 2023 at 1:45pm
Interviewed: Jacob Lieb, Senior Director and Chris Moorman, Senior Transportation Planner
LA Metro’s First/Last Mile Planning Division (Metro) has a team of five people and only two which focus on securing funding. Metro has a strong suit in community engagement, with strong standing relationships for Community Based Organizations. Challenges Metro faces are blurred responsibilities between other agencies such as on the design and maintenance of streets. Metro has programs to evaluate passenger safety and comforters well as safe access to and from bus stops. Metro shared valuable resources such as their Metro Strategic Plan, their project prioritization methodology, Bike/Bus Interface Study to use as reference in the development of the City of Montebello’s First Mile Last Mile Master Plan.
July 11, 2023 at 4:00pm
Interviewed: Jessica Cignarella - Manager of Transit Service Planning; Marisol Barajas - Manager of Government Relations
Long Beach Transit (LBT) does not have any staff dedicated to secure first last mile project funding. A challenge for LBT is integrating schedules of different service providers, meaning riders may have a long wait during transfers. Another challenge is there is a lot of grandfathered-in infrastructure leading to inconsistent ADA compliance across cities. They are currently working on how to prioritize bus stops that are ADA non-compliant as well as SCAG’s High Quality Transit Areas. LBT has introduced GoPASS for K-12 students and select universities which has resulted in an increased youth/student ridership.
July 13, 2023 at 2:30pm
Interviewed: Josh Landis, Planning Manager
Foothill Transit (FT) has a dedicated grant coordinator who secures first last mile and active transportation funding. Challenges the agency faces is limited bus access to neighborhoods with narrow streets for the 40’ long buses. FT has 100% ADA compliance and has removed all non-compliant stops or made improvements to make them compliant. This both minimizes lawsuits as well as guarantees ADA compliance for riders. Stop Diets have also increased convenience for riders by limiting one bus stop per quarter mile except in downtowns and commercial centers to shorten commute times. Bus stop prioritization typically comes from customer requests and ADA compliance is always the first factor considered. FT has good relationships with each jurisdiction which streamlines coordination system-wide.
August 9, 2023 at 9:30am
Interviewed: Eric Anderson, Principal Transportation Planner
When it comes to implementing countermeasures, Berkeley looks to their Vision Zero Action Plan. Rather than focusing on hot spots after they become a problem area, they take a proactive approach and view vision zero as a systemic issue. They implement countermeasures with similar roadway or bus stop characteristics as the existing problem areas to prevent serious injuries or fatalities. For larger infrastructure such as bus shelters with real time display, this is handled by the bus agency, ACT with JPA. The City helps with smaller amenities such as bus benches, trash receptacles, and streetscape elements.
August 18, 2023 at 1:00pm
Interviewed: Anna Jaiswal, Development Planning Manager
The greatest concern for Omnitrans is the safety of riders, especially while waiting at bus stops. Similar to other transit agencies interviewed, Omnitrans does not have control of the ROW which limits involvement of first last mile improvements, especially for ADA compliance, which is another big challenge for the agency. Omnitrans maintains the immediate station area but everything else is the City’s responsibility. Coordination between all 16 jurisdictions is
challenging and requires a lot of permitting. Bikeshare and scootershares have been discussed but deemed too challenging with the inter-jurisdictional coordination. Omnitrans does have a Bus Stop Improvement Plan and Connect Transit Plan to prioritize amenities and projects, highest ridership receiving the largest priority.
Transit agencies do not typically have control of rightof-ways which significantly limits their involvement on first last mile infrastructure projects. Across the agencies we interviewed, each has different ways of prioritizing projects and transit stops from ridership volumes, ADA compliance, and MPO guidance. Multi-jurisdictional agencies typically have more difficult times implementing systemwide changes and good relationships and regular communication is recommended to help streamline improvements.
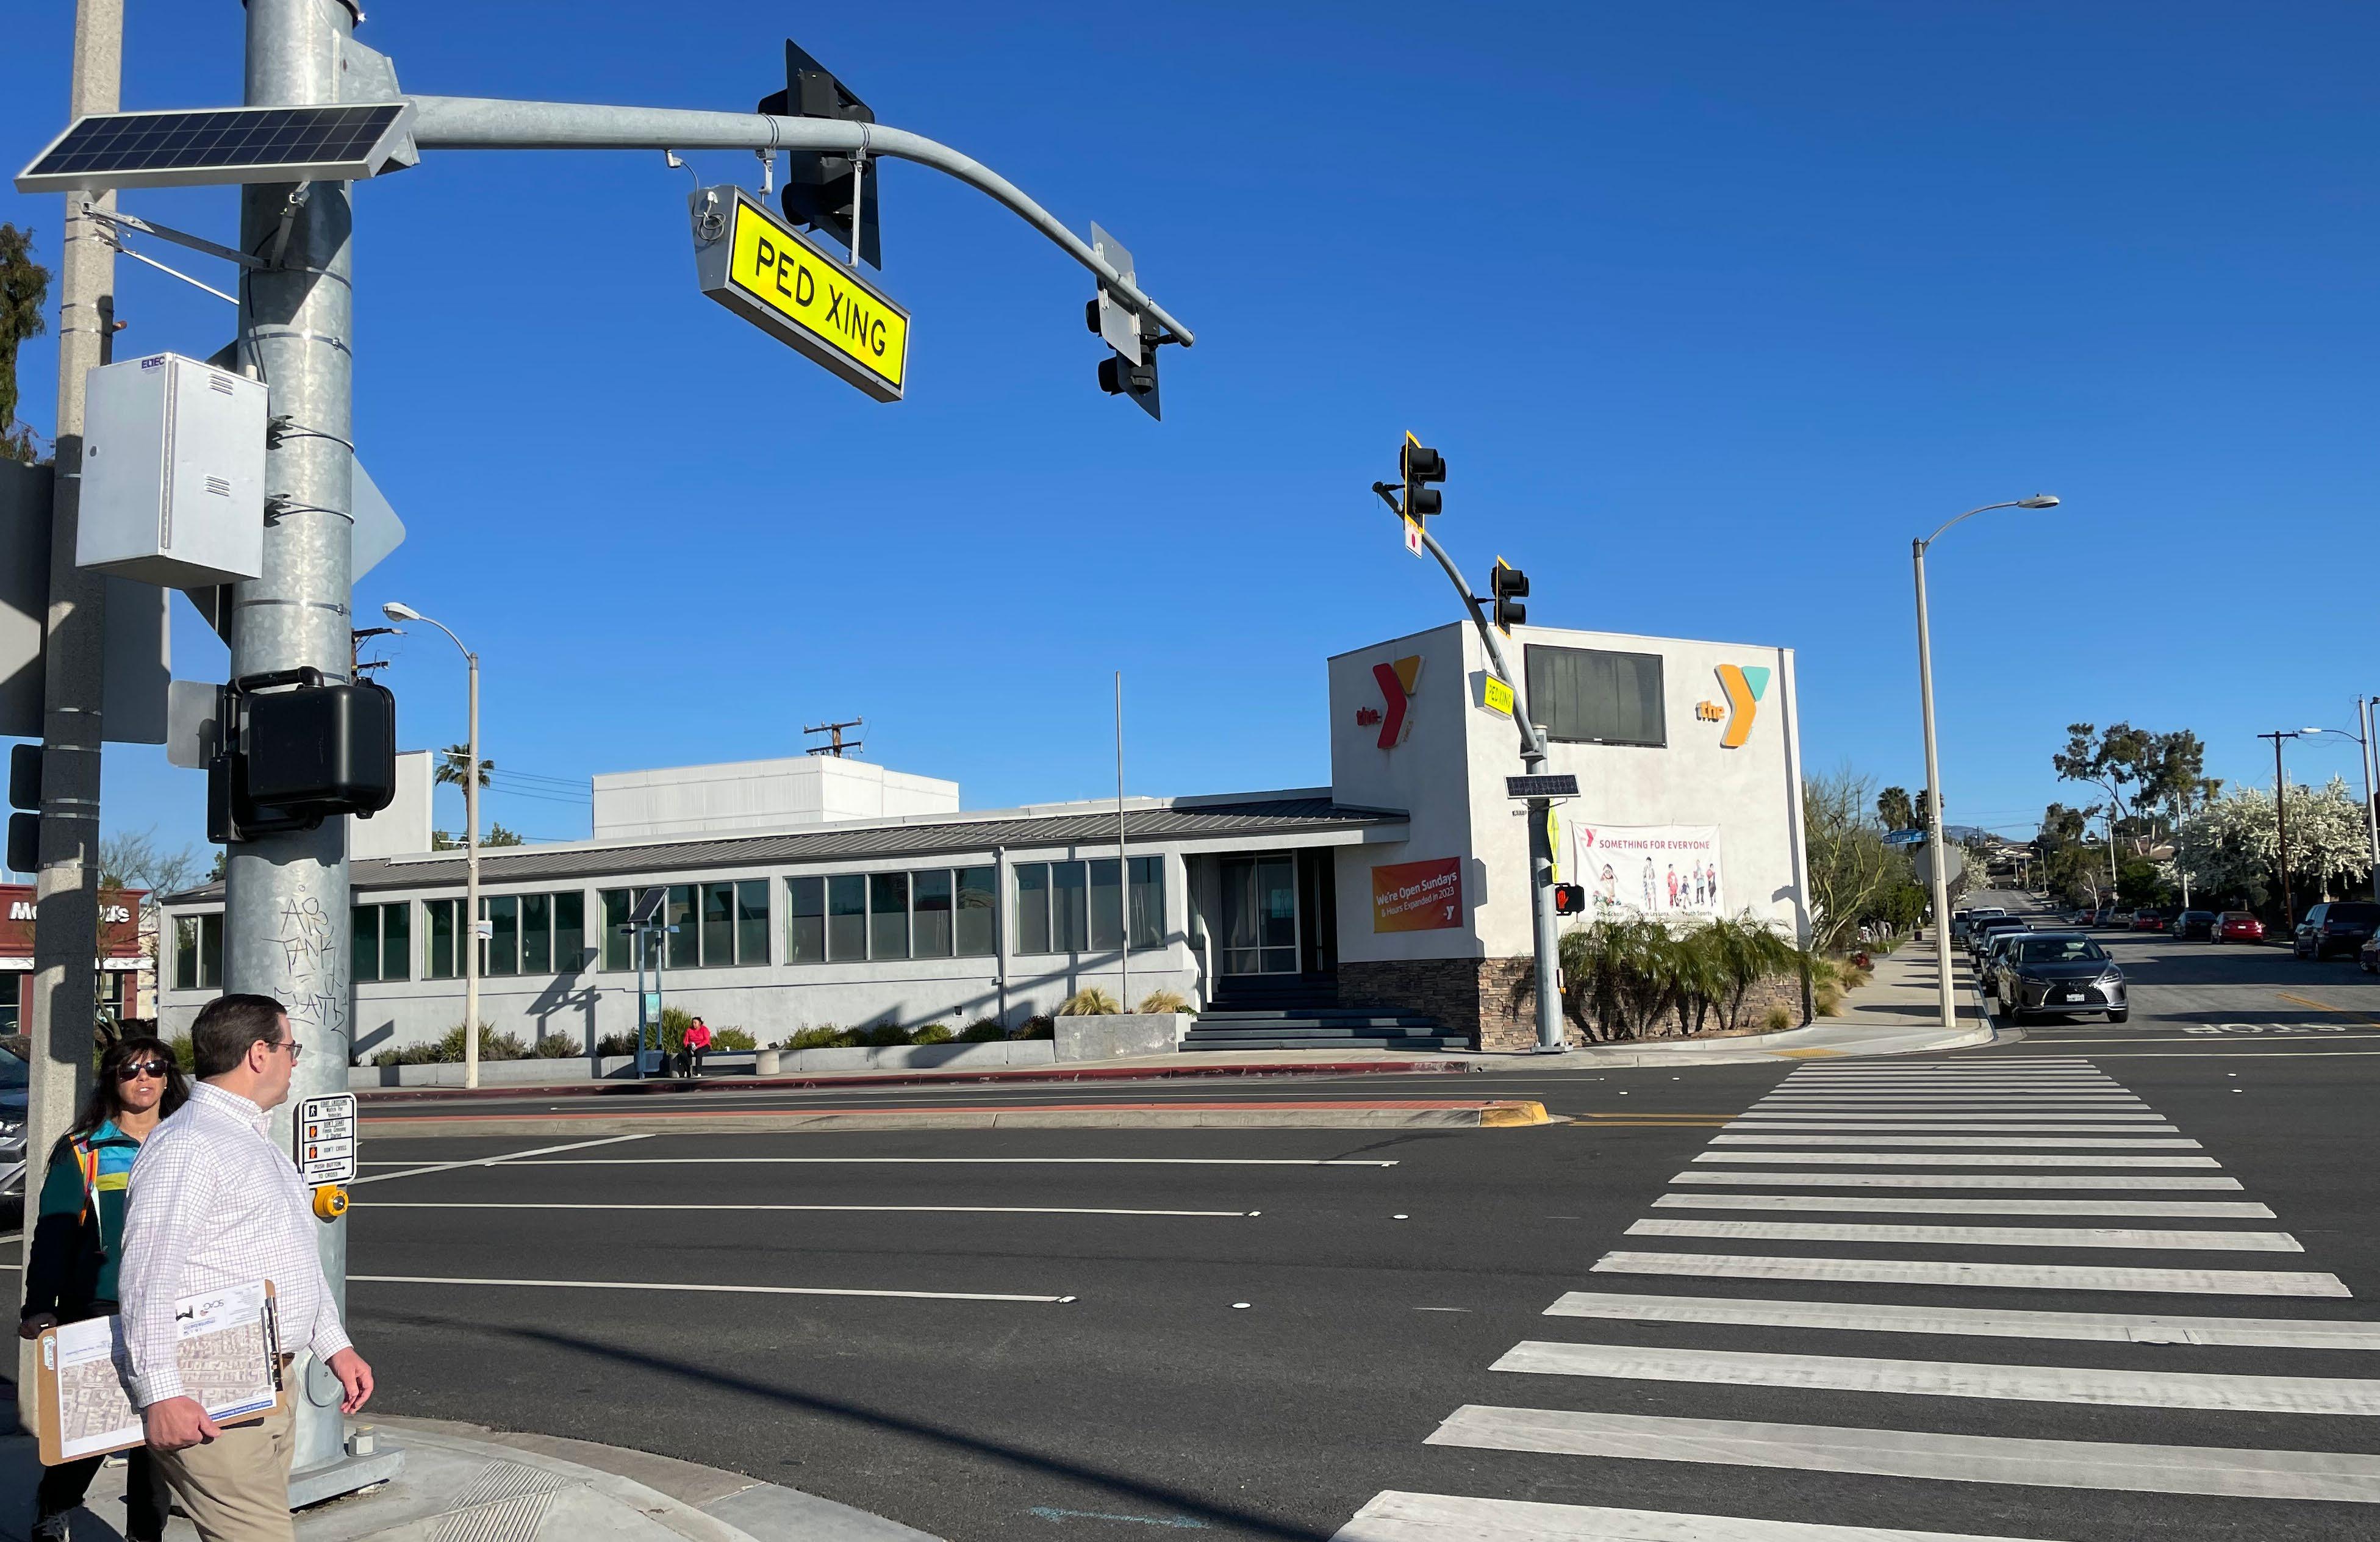

This section focuses on the best practice first-last mile policies to improve access and safety to bus stops, improve safety and amenities at bus stops and develop complete streets to encourage transit use. This section summarizes key regional and local planning policies, the programs, and practices necessary to improve safety for all roadway users, with a focus on those walking, bicycling and taking transit. The best practice policy examples and actions are aimed to instill collaboration between the various City departments, community partners, and regional agencies. These best practice policies help to implement infrastructure, amenities, strategies, and programs to encourage travel by walking, bicycling, transit, and integrate many policies from the City’s latest 2023 Draft General Plan.
The best practice policies recommended for Montebello, as shown in the subsequent pages, were determined by analyzing policies, goals, objectives, and recommendations from other jurisdictions, stakeholders and community feedback. These recommendations are meant to further guide improving the infrastructure around bus stops to better serve MBL’s riders. The actions items are a combination of first-last mile specific action items, along with actions items from the 2023 General Plan.
To understand the action items, those that begin with “GP” are action items directly pulled from the 2023 General Plan that relate to the policy. These provide a strong framework and consistency with the General Plan. The “FLM Action” represents action items specific to this plan, or first-last mile recommendations, to strengthen the policies. There are numerous other policies and action items related to Complete Streets, transit, active transportation, transit oriented development, and location specific policies in the General Plan for more information.
other
This first policy is directly pulled from the 2023 General Plan and provides the guidance to promote non-vehicular modes throughout the City. These action items facilitate walking, bicycling and transit use as key mobility options to improve accessibility and overall quality of life.
GP A4.1a: Prepare and adopt an active transportation plan (ATP) with bicycle and pedestrian improvements built upon the San Gabriel Valley Council of Governments (SGVCOG) recommendations.
GP A4.1b: Balance the provision of on-street bike lanes and regional bikeways along arterial roads with on-street bike routes/boulevards and local-serving bikeways along residential streets.
GP A4.1c: Coordinate with adjacent jurisdictions to ensure that the City’s bikeways are connected and consistent with existing and planned bikeways at the City limits.
GP A4.1d: Facilitate non-motorized connectivity to key destinations in the city through bicycle and pedestrian-oriented wayfinding signage.
» Coordinate to provide the opportunity for wayfinding customization, themes, and consistent design quality to promote connectivity to bus stops, the Montebello Metrolink Station, park and ride lots, and other local and regional activity centers.
GP A4.1e: Improve access to the Rio Hondo River Trail by opening additional access points and positioning wayfinding between the trail and key destinations in Montebello.
GP A4.1f: Require new development projects to provide adequate bicycle and pedestrian access, plus the provision of safe and secure bicycle parking.
GP A4.1g: Enhance the pedestrian and bicycle experience in the Downtown Specific Plan area and other key destinations through amenities such as wide sidewalks, low-stress bikeways, landscaping, pedestrian-oriented lighting, high-visibility crosswalks, and other improvements.
GP A4.1h: Establish citywide mode split goals and Vehicle Miles Traveled (VMT) threshold targets as a means to reduce traffic congestion, support healthy communities, and improve accessibility by transit-dependent populations.
Policy 2. Provide clean, safe, and comfortable bus stops and bus stop access to encourage transit use.
Passenger comfort, safety, and convenience are all impacted by bus stop features that are located off the street or roadway, commonly referred to as curbside improvements. This section provides policy guidance on how the City can provide the appropriate bus stop amenities to make transit use safe and comfortable.
For any transit system, expanded amenities beyond the standard bench or shelter are typically warranted. According to the City’s latest General Plan, one of the key findings related to transit conditions was that the city could benefit from improved passenger amenities at bus stops outside the downtown area. Challenges may include having adequate sidewalk space to install shelters. The following best practice policies are aimed to help Montebello Bus Lines on how to create attractive bus stops that are safe and comfortable places to board and alight.
GP A4.2d: Enhance bus stops in the city incorporating high-quality transit stop design and amenities that create a simple, legible, and pleasant experience at the bus stop.
» Provision of comfortable shelter and seating can significantly improve perception of wait time and rider satisfaction. Ensure the waiting passengers can be seen from outside by using glass or open design for the back wall. Include lighting in the shelter, or locate shelters in a well-lit area. Signs at bus stops must indicate critical information including the stop name, route number, stop number, direction or destination, and system logo.
GP A4.2e: Coordinate with Metrolink to enhance the Montebello/Commerce Station’s passenger amenities, bus transfer facilities, parking facilities, and other elements to encourage rail ridership in the City.
GP A4.2h: Improve connectivity within growth neighborhoods, areas of opportunity and for transit-dependent populations to enhance access to local and regional transit services.
GP A4.3c: Create small-scale mobility hubs at key multimodal transfer points.
» Mobility Hubs can serve as focal points for local micromobility and wayfinding networks, with amenities such as: transit and bike route information; bike repair stations; shade; and pedestrian-scaled lighting and wayfinding.
FLM Action 2.1: Provide or encourage clean, lighted, and convenient bus shelters that are within walking and biking distance of major activity areas, residential neighborhoods, and arterial roadways.
FLM Action 2.2: This Plan recommends installing shelters and benches where they are missing. If resources are limited then develop a ranking methodology to prioritize bus shelter locations. Criteria might include the following, but not limited to:
» Passenger volume
» Traffic volume and circulation
» Demographic analysis such as areas in low-income neighborhoods, minority populations, transit dependent neighborhoods with low vehicle ownership in accordance with SCAG’s definition of Disadvantaged Communities
FLM Action 2.3: The City and private developers should provide and maintain street trees and other landscape treatments along corridors near bus stops within the public right-of-way to provide sufficient shade canopy and promote pedestrian comfort without impeding bus access or opportunities to install shelters.
FLM Action 2.4: Encourage the development of adjacent businesses near major bus stops to activate the space and make these facilities safer and more pleasant. The City can offer incentives to new development projects and existing businesses.
FLM Action 2.5: Coordinate with other agencies, not-for-profit organizations, and community groups to improve the physical and built environment around bus stops. Examples of improvements include universal design, gardens, green space and open space, and access to parks and recreation amenities.
PLM Action 2.6: Partner with local public art programs and artists to create artwork that is visually connected to the historical, environmental, or cultural aspects of the site.
Bus stops are critical connection points between modes of transportation. Bus stops should be comfortable, safe, convenient, and designed for the local context. They should complement the larger transportation network and provide a sense of safety at all times of the day. There are several strategies that can be explored to activate the space around bus stops that experience crime, have high ridership, or experience regular complaints.
Bus stops with elements such as shelters, benches, and in-shelter lighting increase the comfort, convenience, and visibility of patrons and the stop itself. This investment in infrastructure can raise the overall attractiveness of bus service and help meet MBL’s targets for ridership growth.
GP A2.3b: Prioritize placemaking.
» Create a plaza at the future Greenwood Avenue Station that features a variety of public amenities that will increase the attractiveness of the station and catalyze mixed-use development activity on adjacent land. This new station would extend the L Line east from its terminus at the Pomona/ Atlantic Station. Establishing an Enhanced Infrastructure Financing District (EIFD) in the area could also help capture increased value that comes along with TOD adjacencies as well help fund infrastructure needed for placemaking.
FLM Action 3.1: Encourage the provision of amenities such as seating, lighting, and signage (including real-time arrival information), and bicycle parking areas at bus stops, shuttle stops, and the Metrolink Station to increase rider comfort, safety, convenience and future light rail station.
FLM Action 3.2: Install additional lighting at bus stops (solar preferred) and cameras at high stops where high incidents of crime of complaints have occurred. Explore the installation of blue light emergency phones as additional safety amenities. Coordinate with the Police Department on monitoring and maintaining surveillance cameras and blue light emergency phones.
FLM Action 3.3: Work with local businesses and property owners that are adjacent to the stops with high complaints to develop viable solutions such as providing security cameras or additional lighting. Bus stop relocation or shelter removal is a last resort be-
cause it inconveniences customers, and a new location may not be viable.
Interconnected pedestrian and bicycle infrastructure with transit provides viable transportation choices for everyone and this contributes to the health, equity, and quality of life of Montebello residents. It was noted in the General Plan that walking and biking connectivity to the Metrolink Station should be improved. Embracing Complete Streets strategies into redevelopment and roadway improvements go a long way toward achieving a truly Complete Street.
GP A4.5a: Develop and formally adopt a citywide Complete Streets Ordinance.
GP A4.5b: Utilize a Complete Streets approach that acknowledges all users when improving existing transportation facilities or designing new transportation facilities in the city.
FLM Action 4.1: Use a Complete Streets approach that is best suited to meet the goals of the corridor or area to maximize the number of people walking or biking to transit. Improve bicycle transportation infrastructure and conditions along preferred corridors three miles from a transit station or bus stop and halfmile for pedestrian infrastructure.
» A Complete Street may include, but not be limited to, sidewalks, bike lanes (or wide paved shoulders), special bus lanes, bus turnouts, comfortable, safe, and accessible public transportation stops, frequent and safe crossing opportunities, median islands, accessible pedestrian signals, curb extensions, narrower travel lanes, and roundabouts.
FLM Action 4.2: Utilize Complete Streets concepts to accommodate and optimize new technologies and micromobility devices, first-last mile connections to transit, and curbside management strategies, to provide safe and accessible choices to increase active transportation and transit use.
FLM Action 4.3: Dedicate funding to implement improvements related to Complete Streets policies and implementation.
FLM Action 4.4: Prioritize a network of Complete Streets designed for users of all ages and abilities to
access bus stops and the Metrolink Station and future light rail station. Focus the designs first and foremost on critical areas, which are usually the intersections, before expanding it to the entire network.
FLM Action 4.5: When redesigning roadways, prioritize safety over motor vehicle capacity. All streets should be designed to be accessible for walking, biking, and accessing bus stops and Metrolink Station.
FLM Action 4.6: Test bold, creative approaches to safer street design. Improving street design is neither an insurmountable nor expensive challenge. Coordinate with SCAG on their Go Human campaign to test low-cost, short-term interventions to create safer streets. When a solution is implemented, measure the results to gauge the impact of their projects to work toward permanent solutions.
FLM Action 4.7: Explore policies that prohibit street widening projects that negatively impact pedestrians, bicyclists and transit users’ level of service.
to bus stops and the Metrolink Station.
This policy explores the principle of traffic calming to provide a full range of treatments to slow vehicles as they move through commercial corridors and residential neighborhoods. The benefit for pedestrians and bicyclists is that vehicles drive at speeds that are safer and more compatible with walking, biking, and accessing bus stops. Traffic calming can take on many forms and costs, such as paint and bollards to traffic circles and roundabouts. It will be key to integrate bus stop access into traffic calming projects to provide the transit users with safe access to their destinations.
GP A4.6e: Monitor residential streets and implement traffic calming as needed to discourage cut-through traffic, developing strategies in conjunction with the neighborhood at large.
GP A4.7b: Explore opportunities to provide grade-separated bicycle and pedestrian crossings at locations where railroad tracks serve as a barrier to direct walking and bicycling connectivity, such as residential streets cut off by railroad tracks.
FLM Action 5.1: Provide pedestrian-friendly safety improvements, such as crosswalks and pedestrian signals near bus stops and the Metrolink Station.
FLM Action 5.2: Where feasible, implement proven traffic calming measures, such as speed humps, speed tables, curb extensions, roundabouts, and traffic circles, to slow vehicular speeds and improve bicycle and pedestrian safety.
FLM Action 5.3: Implement floating bus stops to facilitate buses moving in and out of traffic and to reduce bus travel time, increasing convenience and attractiveness of transit use.
FLM Action 5.4: Where feasible, implement full street improvements, including paving, curbs, gutters, and sidewalks are to be encouraged where necessary for public health, safety, and welfare.
FLM Action 5.5: Where feasible, separate pedestrian and bicycle traffic from vehicular traffic on major roadways to protect the safety of roadway users. Driveways and minor roads should have raised bicycle and pedestrian crossings and intersections should be protected to mitigate right hook conflicts.
Shifting the daily commute from cars to sustainable transport modes, like public transportation, walking, and biking, incorporates physical activity into everyday commuting and can improve health and happiness. Programs should be explored with local and regional employers to encourage transit use by providing incentives and education on the benefits of alternative transportation.
GP A1.5a: Develop incentives and adopt regulatory standards to reduce transportation emissions. In addition to reducing the number of miles driven, the fuel efficiency and emissions standards of vehicles must also improve. Working in collaboration with local, regional, and state agencies, Montebello will seek to increase use of clean fuels in public and private automobile fleets, consider new legislation, and implement educational programs.
GP A1.5b: Promote use of alternate modes of transportation in the City of Montebello, including pedestrian, bicycling, public transportation, car sharing programs and emerging technologies.
GP A1.5e: Require and incentivize projects to incorporate Transportation Demand Management (TDM) techniques.
» Encourage major employers to reduce vehicular
trips by offering incentives such as, but not limited to, free or reduced-fare transit passes, transit stipends, and company-wide contests and events.
GP A4.4d: Update the City’s parking code to allow shared parking arrangements, flexible parking standards such as unbundled parking and parking inlieu fees in mixed-use areas and/or in proximity of high-quality transit.
GP A4.5i: Utilize educational strategies to improve awareness of safe walking, biking, and driving habits. Work with community-based organizations to develop and implement these strategies.
GP A4.8e: Monitor and evaluate the development of new mobility technologies.
FLM Action 6.1: Collaborate to develop back-toschool marketing campaigns to promote bus, carpool, walking, and biking to school. The marketing campaign can include suggested route maps, safety education materials, volunteer opportunities, event calendars, and traffic safety enforcement notices.
FLM Action 6.2: Avoid high intensity uses in locations with minimal transit service.
Safety features at bus stops are the highest priority to improve transit rider safety, such as additional lighting, activating the space around the bus stops, and providing shelter from environmental elements. As part of encouraging the use of transit and the safety issues at some bus stops, programs are an important part to help mitigate some of those concerns. This section summarizes some of the best practices that are being employed regionally and statewide that can be explored.
FLM Action 7.1: Develop a safety awareness campaign to include short instructional videos, newspaper ads, social media, and community engagement. Engage local community-based organizations to plan and develop these campaigns.
FLM Action 7.2: Support Neighborhood Watch programs. Members should all be given training to ensure that racial bias is not used during neighborhood watch activities.
FLM Action 7.3: Continue to provide community pro -
grams that develop positive relationships between the Montebello Police Department and community members to provide a safe and secure environment for bus and transit users.
FLM Action 7.4: Establish a uniformed and unarmed security presence on buses and at bus stops such as a “Transit Ambassador’’ program used by LA Metro in the Los Angeles region.
» This program is believed to have helped to significantly improve security where it has been employed. These ambassadors receive additional de-escalation and anti-bias training before being deployed. These ambassadors will be dedicated to riding transit which in turn helps represent a new shift in the deployment strategies of Metro armed security agents. Across the country, these approaches are helping transit agencies provide additional passenger security and comfort, while allowing sworn, armed police officers to focus their efforts on more serious criminal activity. Prior to implementing a full-scale deployment, a pilot program should be considered to evaluate and refine the program.
FLM Action 7.5: Prioritize stops that routinely draw complaints of illicit or unwanted activity for Transit Ambassadors to regularly monitor to deter illicit behavior.
FLM Action 7.6: Install surveillance cameras at some of the higher ridership bus stops and bus stops with the most complaints.
This page is left intentionally blank.


This chapter focuses on the key outcomes of the Plan: the recommendations and initial project implementation to support first-last mile connections in Montebello. Section 6.2 showcases a toolbox of first last mile treatments to increase safety, comfort, and access at transit stops for people using transit. Some of these treatments are applied to the priority projects and others can be used as a guide for additional enhancement projects. Section 6.3 covers what criteria guided the selection of the priority projects and lists additional corridors recommended for study in the future. Section 6.4 includes the specific intersection designs and corresponding cut sheets that show initial project recommendations and what measures should be implemented at each location. The callouts on the aerial photos are intended to be used to pursue grant funding for implementation. Section 6.5 discusses the benefits of implementing the proposed first last mile treatments. Finally, section 6.6 includes metrics to be used to measure progress of implementation of first-last mile treatments in Montebello.
This chapter includes project recommendations meant to improve bicycle and pedestrian safety at and around bus stops. The recommendations are designed to help the City of Montebello allocate funds as they become available and compete for grant funds as opportunities arise. The chapter begins with an overview of the different types of built infrastructure that have been designed throughout California. This “Street Toolkit” includes active transportation recommendations for bicycle, pedestrian, and traffic calming treatments.
Class I multi-use paths (frequently referred to as “bi cycle paths”) are physically separated from motor ve hicle travel routes, with exclusive rights-of-way for non-motorized users like bicyclists and pedestrians. They require physical buffers to ensure safety and comfort of the user.
Bicycle lanes are one-way facilities that carry bicycle traffic in the same direction as the adjacent motor ve
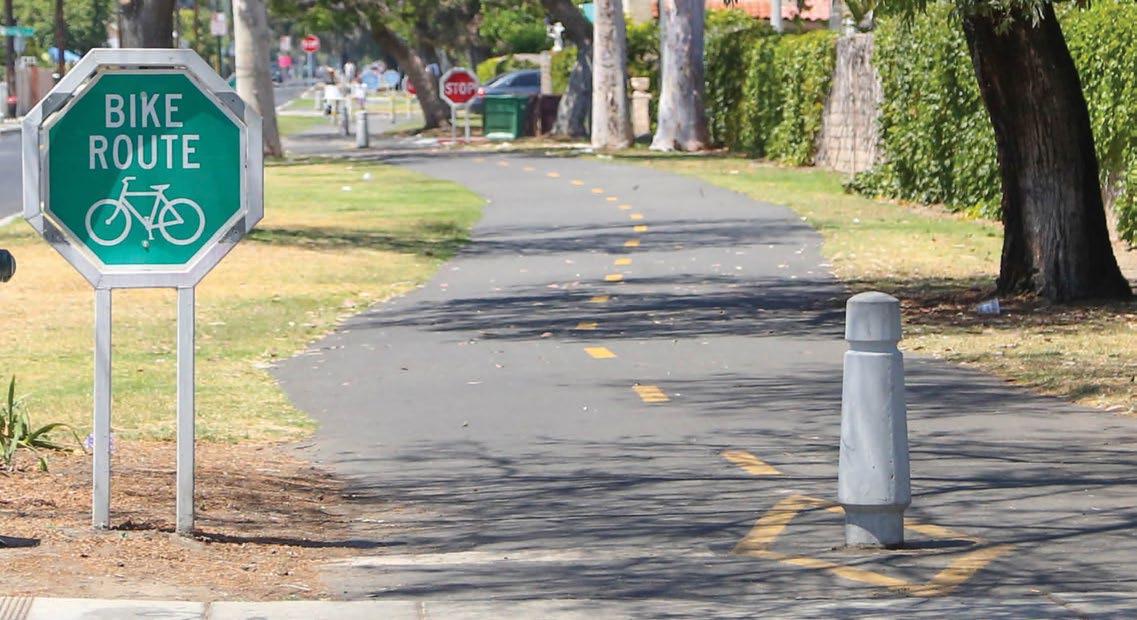
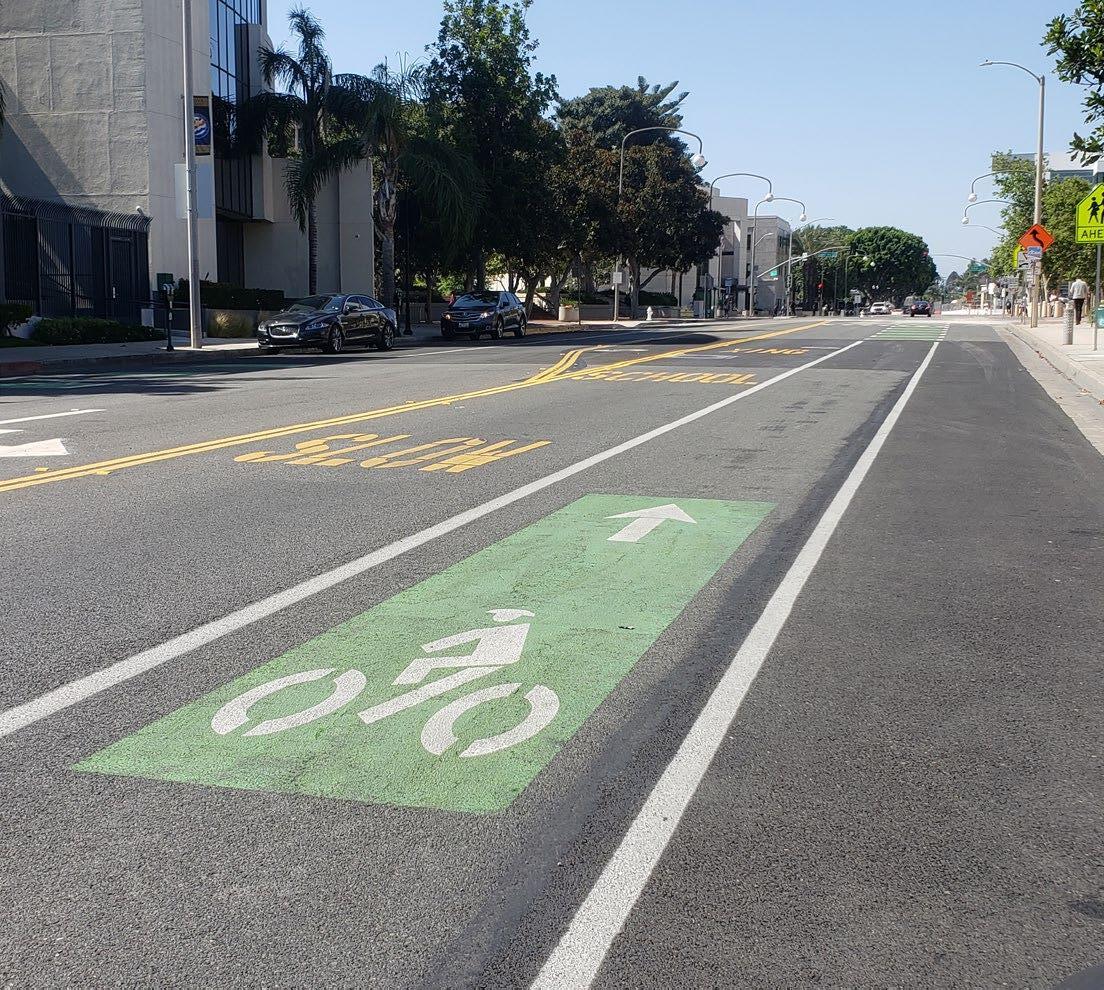
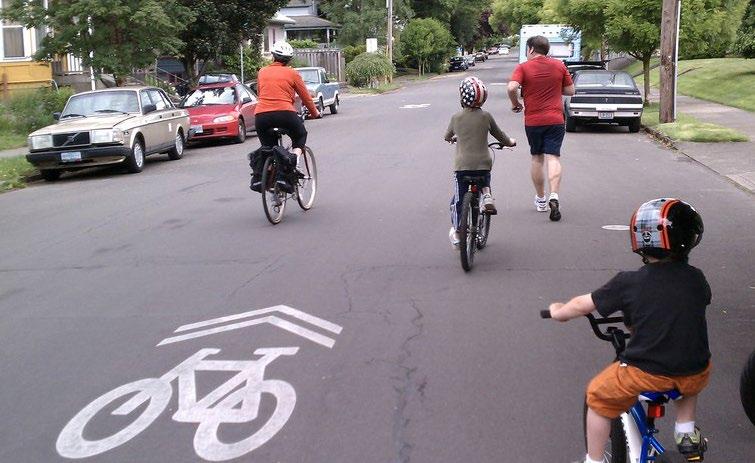

hicle traffic. They are typically located along the right side of the street (although can be on the left side) and are between the adjacent travel lane and curb, road edge, or parking lane. They are not physically separated from motor vehicle traffic.
A bicycle route is a suggested bicycle corridor marked by signs designating a preferred street between desti nations. They are recommended where traffic volumes and roadway speeds are 35 mph or less.
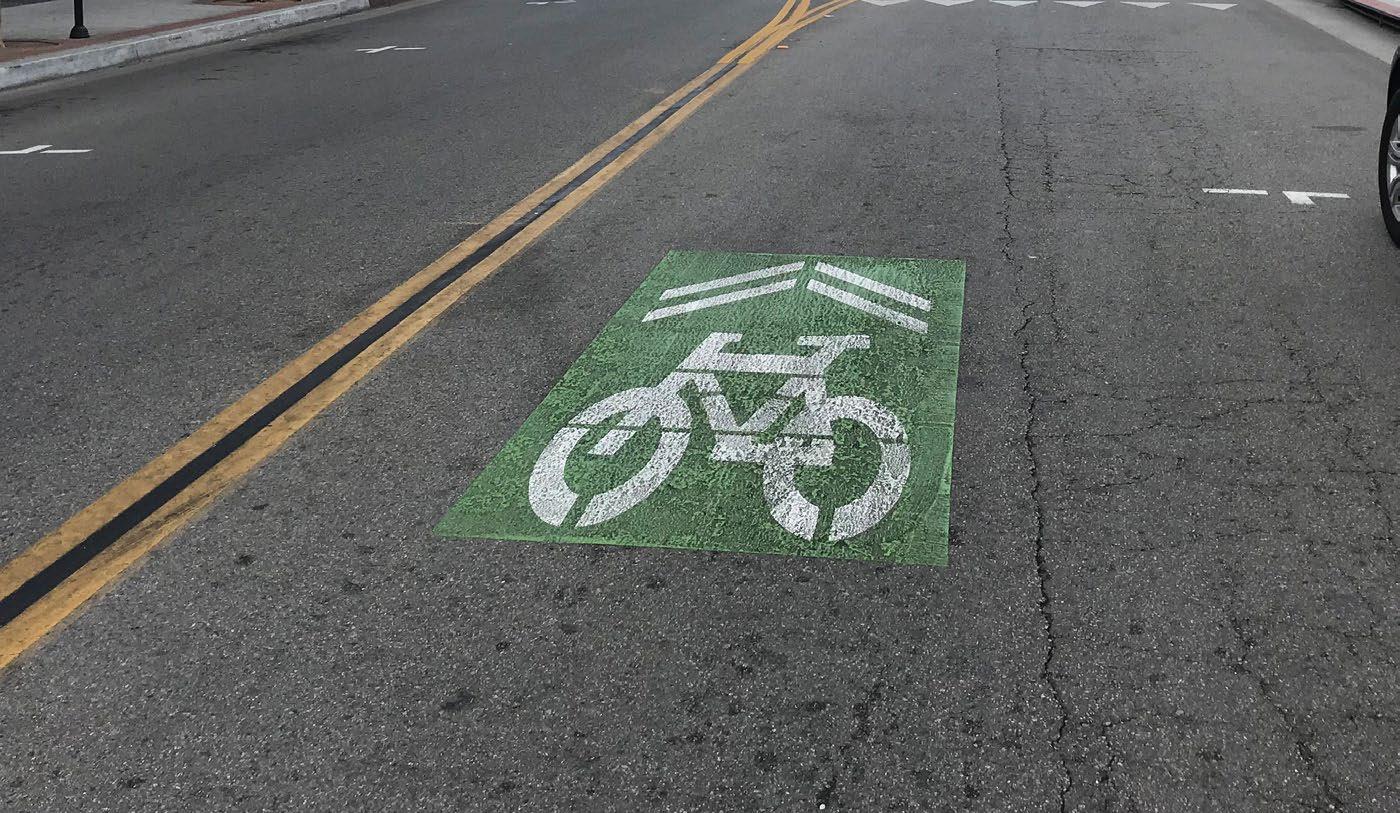
Separated Bikeways, sometimes called cycle tracks, are on-street bicycle facilities with a physical separation between the bikeway and vehicle travel lanes usually with flexible posts, planters, or poured concrete. Often times, Class IV bikeways are parking-protected, where parked cars offer a buffer from traveling cars. Typologies for designing Class IV Separated Bikeways at bus stops can be found in Appendix G.
The shared lane marking is commonly used where parking is allowed adjacent to the travel lane. It is now common practice to center them within the typ ical vehicular travel route in the rightmost travel lane to ensure adequate separation between bicyclists and parked vehicles. Many cities install sharrows over a green background to enhance visibility.
A neighborway, sometimes called a bicycle boule vard, is an approach to reduce traffic, slow car speed, and improve safety for those biking, walking, and rolling on quiet residential streets. They are typical ly located on more narrow, slow speed streets and combined with other traffic calming infrastructure like speed tables.
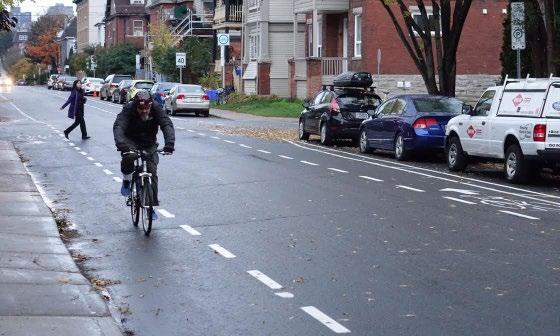
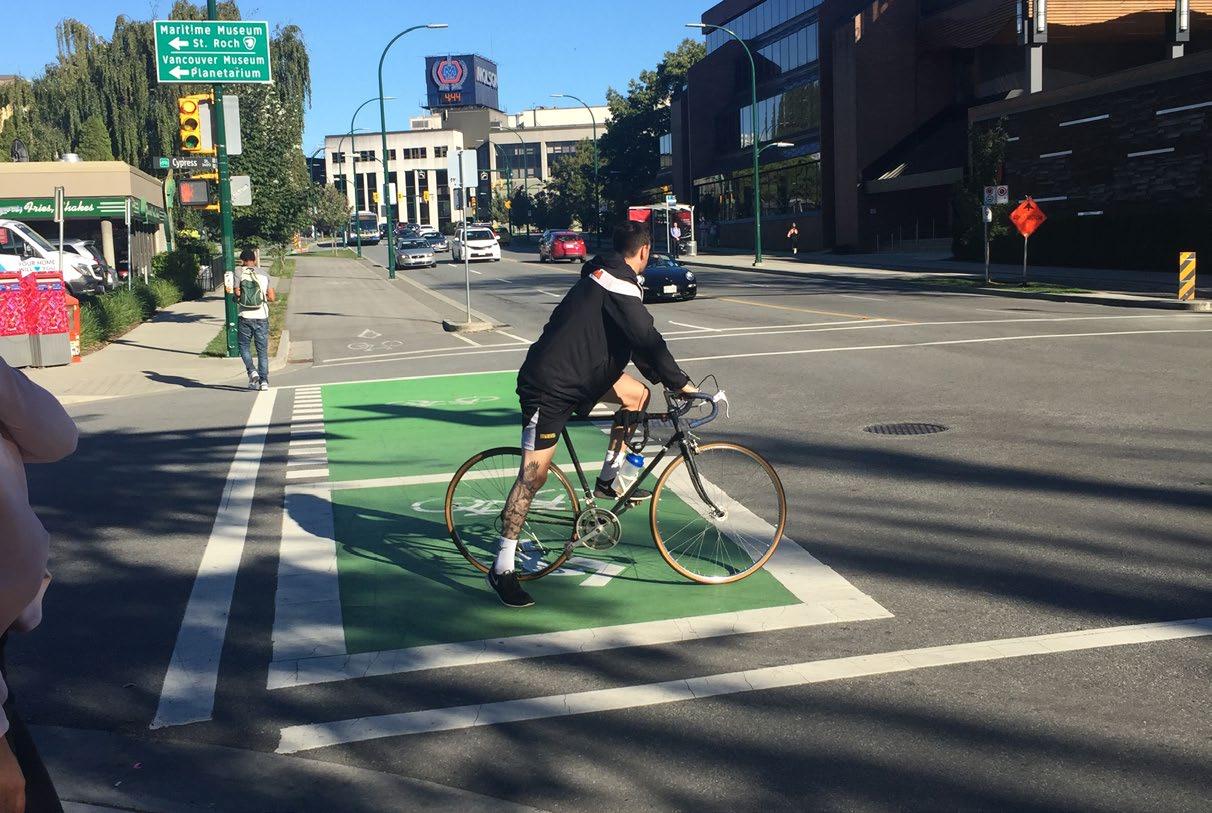
Intersection or mid-block crossing markings indicate the intended path of bicyclists. Colored striping can be used to highlight conflict areas between bicyclists and vehicles, such as where bicycle lanes merge across motor vehicle turn lanes.
An edge lane road is a preferred space for bicyclists and motorists to operate on narrow streets that would otherwise be a shared roadway. Roads with

advisory bike lanes accommodate low to moderate volumes of two-way motor vehicle traffic and provide a safer space for bicyclists with little or no widening of the paved roadway surface. Due to their reduced cross section requirements, advisory bike lanes have the potential to open up more roadways to accommodate comfortable bicycle travel.
A bike box is a designated area at the head of a traffic lane at a signalized intersection that provides bicyclists a safe and visible way to wait ahead of queuing traffic during the red signal phase. This positioning helps encourage bicyclists traveling straight through not to wait against the curb for the signal change.

Signage and wayfinding on all streets and bicycle routes are intended to identify routes to both bicyclists and drivers, provide destination information and branding, and to inform all users of changes in roadway conditions.
Traffic calming involves changes in street alignment, installation of barriers, and other physical measures to reduce traffic speeds and/or cut-through motor vehicle traffic volumes. The intent of traffic calming is to alter driver behavior and to improve street safety, livability, and other public purposes. Other techniques consist of operational measures such as police enforcement and speed displays. More information from the Montebello Fire Department on their priority corridors where vertical traffic calming should be avoided can be found in Appendix H.
A roundabout is a circular intersection with yield control at its entry that allows a driver to proceed at controlled speeds in a counter-clockwise direction around a central island. Roundabouts are designed to maximize motorized and non-motorized traffic through their innovative design that includes reconfigured sidewalks, bikeway bypasses, high-visibility crosswalks, pedestrian flashing beacons, and other traffic measures. Roundabouts can be implemented on most streets but may require additional right-of-way.
A traffic circle is a small-scale traffic calming measure commonly applied at uncontrolled intersections on low volume, local residential streets. They lower traffic speeds on each approach and typically avoid or reduce right-
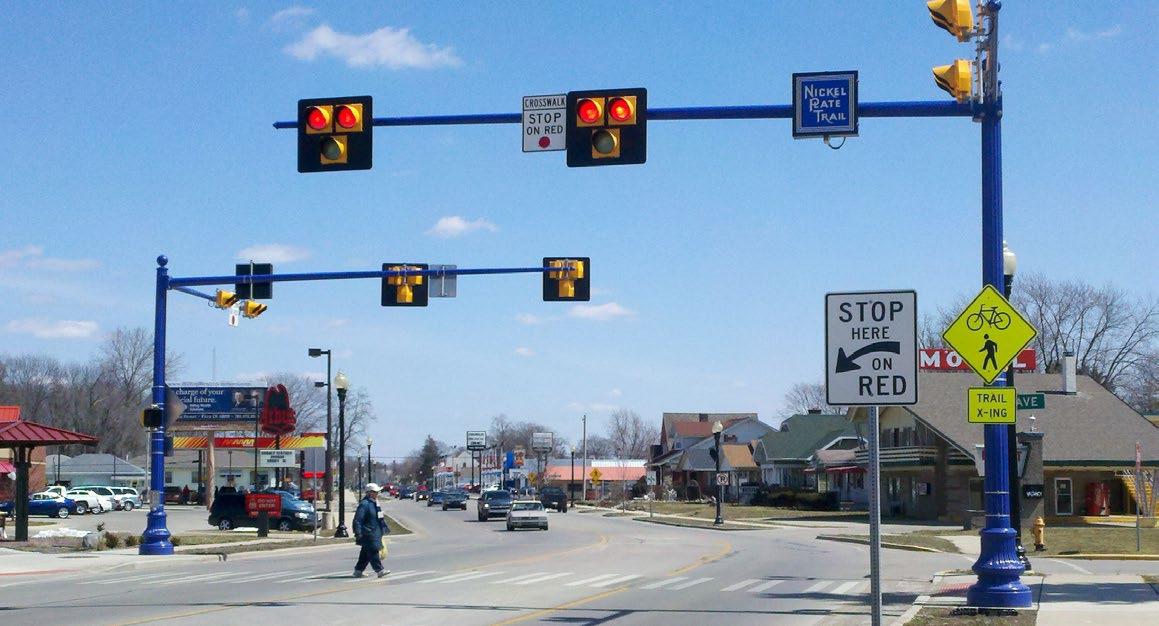
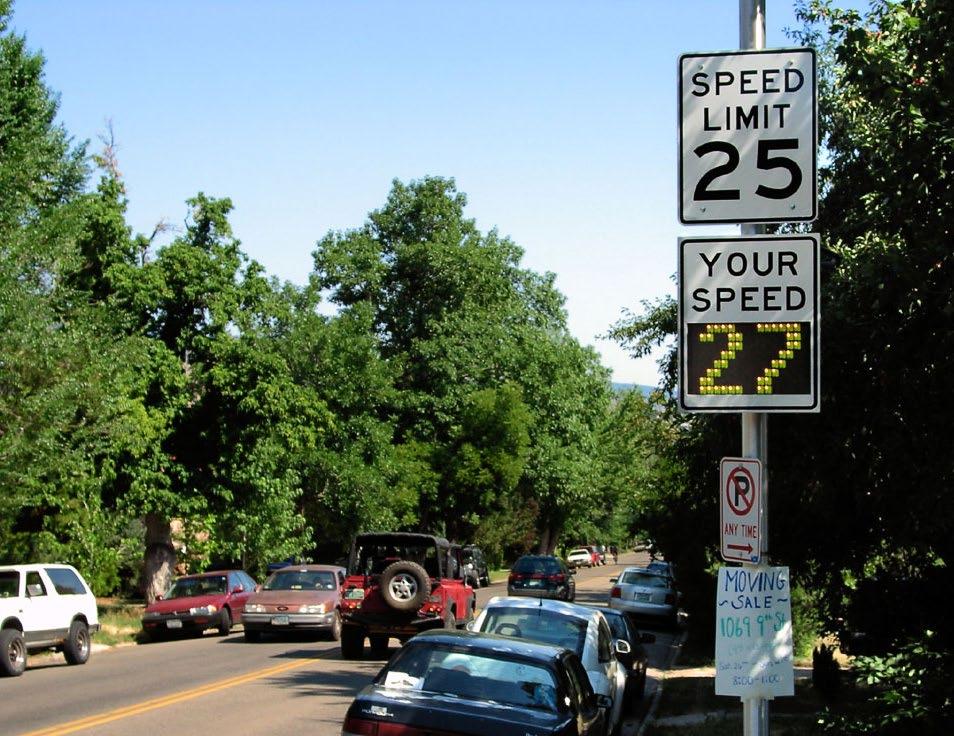

of-way conflicts because the overall footprint is smaller compared to roundabouts. Traffic circles may be installed using simple markings or raised islands but are best accompanied with drought-tolerant landscaping or other attractive vertical elements.
Traditional pedestrian signals with countdown timers remain the gold standard for high quality pedestrian crossings, although some cases warrant new signal technologies. Pedestrian Hybrid Beacons (PHBs) and Rectangular Rapid Flashing Beacons (RRFBs) are special signals used to warn and control traffic at unsignalized locations to assist pedestrians in crossing a street via a marked crosswalk. PHBs include a “red phase” requiring vehicles to come to a full stop while RRFBs are yield stops. Either of these devices should be installed at locations that have pedestrian desire lines and that connect people to popular destinations such as schools, parks, and retail. Research has shown that PHBs tend to have a 90 percent motorist compliance rate versus RRFBs, which tend to have an 80 percent motorist compliance rate. Traditional pedestrian signals with countdown timers at signalized intersections tend to have a near 100 percent compliance rate. Signals and warning devices should be paired with additional pedestrian improvements where appropriate, to mitigate multiple threat crashes on multi-lane roadways.
LPIS give pedestrians about 3-7 seconds of a head start to enter the crosswalk at an intersection before vehicles get a green light.
Speed displays measure the speed of approaching vehicles by radar and inform drivers of their speeds using an LED display. Speed displays contribute to increased traffic safety because they are particularly effective in getting drivers traveling ten or more miles per hour over the speed limit to reduce their speed.
A traffic diverter is a roadway design feature placed in a roadway to prohibit vehicular traffic from entering into or exiting from the street, or both.
Chicanes are a series of narrowings or curb extensions that alternate from one side of the street to the
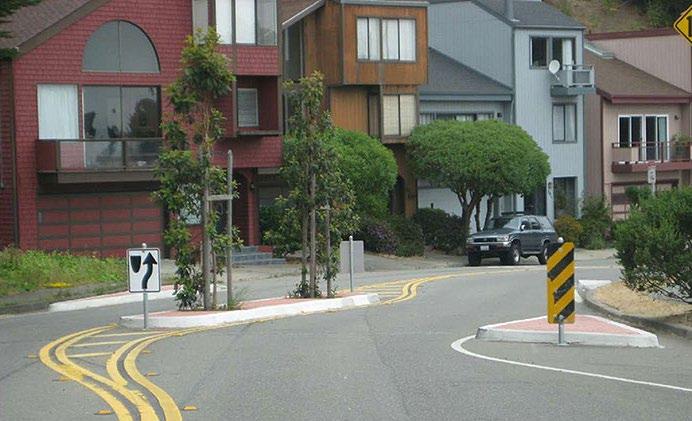


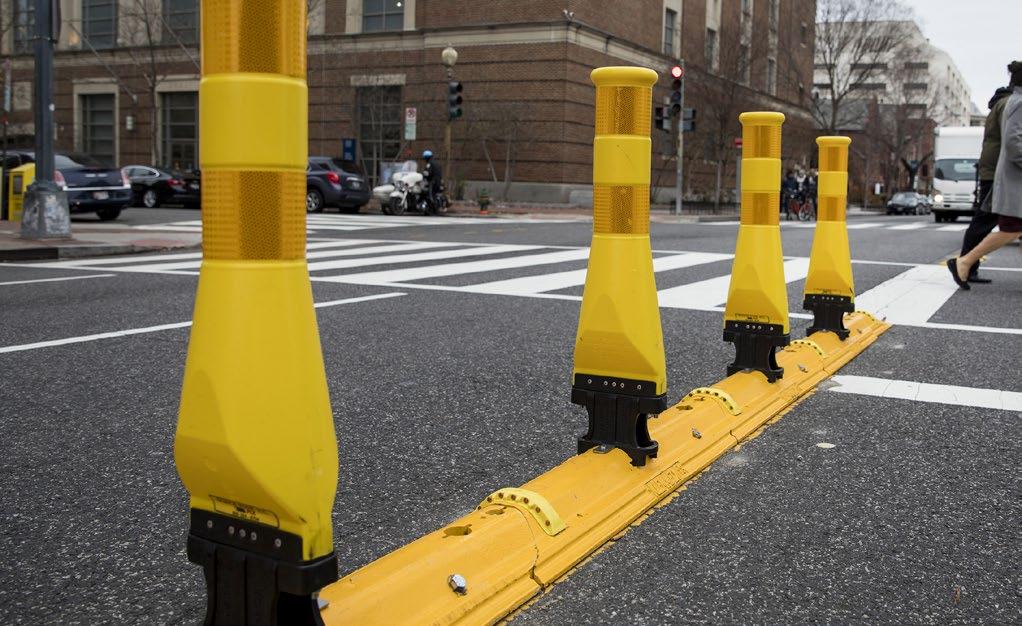
other forming an S-shaped path. Chicanes reduce drivers’ speeds by causing them to shift their horizontal path of travel.
Speed tables are flat-topped road humps, often constructed with textured surfacing on the flat section. Speed tables and raised crosswalks help to reduce vehicle speeds and enhance pedestrian safety.
Truck aprons allow large vehicles, such as: trucks, buses, and recreational vehicles, to turn without striking people walking, rolling, or bicycling, or fixed objects. They are located between the road surface and the sidewalk, or inner circle of a roundabout. The pavement is raised slightly to encourage light vehicles on the main road surface.
Reflective borders on signal heads improves visibility of signal heads with a backplate and is made even more conspicuous by framing it with a yellow retroreflective border. These are more visible in both daytime and nighttime conditions.
Hardened centerlines are small rubber barriers next to crosswalks that require people driving to make slower, squarer left-hand turns. This small change has been proven to significantly slow down vehicle speeds at crosswalks and improve safety for people in the crosswalk.
Neckdowns narrow a street by extending the sidewalk or widening the landscape area to give the perception that speeds should be reduced.
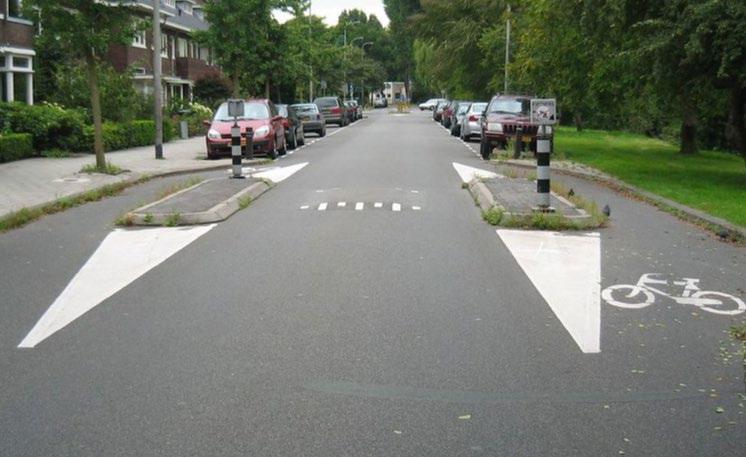
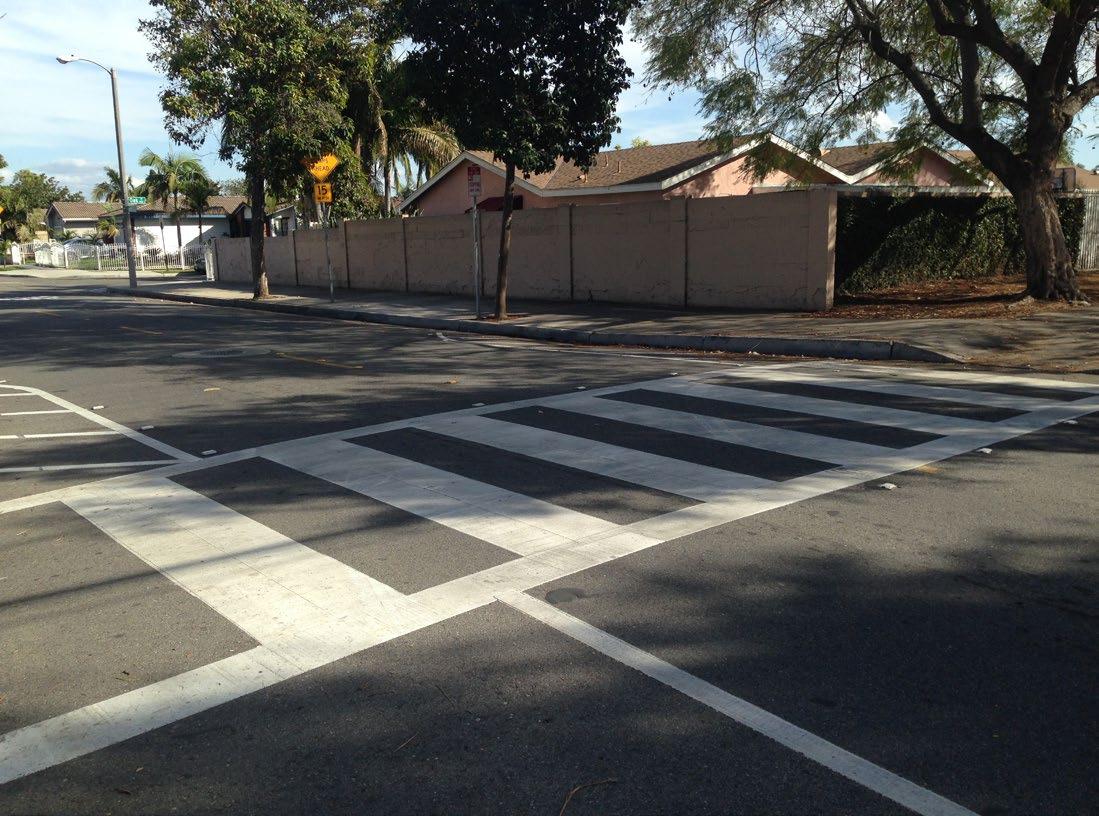
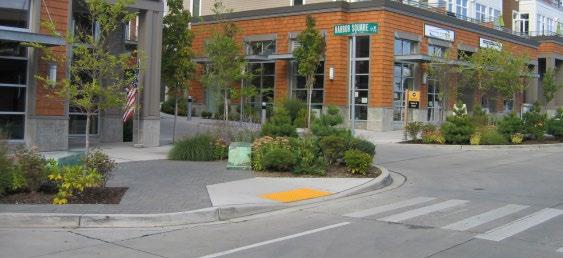
Enhanced crosswalk markings are designed to both guide pedestrians and to alert drivers of a crossing location. The bold pattern is intended to enhance visual awareness. Cities in Southern California often install “Continental” style or “Ladder” style markings due to their higher contrast on a roadway.

Curb extensions extend the curb line outward into the travel way, reducing the pedestrian crossing distance. Typically occurring at intersections, they increase pedestrian visibility, reduce the distance a pedestrian must cross, and reduce vehicular delay. Curb extensions must be installed in locations where they will not interfere with bicycle lanes or separated bikeways. If both treatments are needed, additional design features such as ramps, or half-sized curb extensions should be considered. For snow maintenance, curb extensions can be designed with tapered front ends and vertical delineators to allow snow plows to clear and move over the curbs.
Refuge islands provide pedestrians and bicyclists a relatively safe place within an intersection and midblock crossing to pause and observe before crossing the next lane of traffic.
Mid-block crossings provide convenient locations for pedestrians and bicyclists to cross thoroughfares in areas with infrequent intersection crossings or where the nearest intersection creates substantial out-of-direction travel. Mid-block crossings should be paired with additional traffic-control devices such as traditional Pedestrian Signals, PHBs, RRFBs, LED enhanced flashing signs, and/or refuge islands.
Designated senior zones can be enhanced with street signage, increased crossing times at traffic signals, benches, bus stops with shelters, and pedestrian lighting.
Transit stop amenities such as shelters with overhead protection, seating, trash receptacles, and lighting are essential for encouraging people to use public transit.
Special intersection paving and crosswalk art provide unique opportunities at intersections to highlight crossings or key civic or commercial locations, while breaking the visual monotony of asphalt. Intersection paving treatments and crosswalk art can integrate context-sensitive colors, textures, and scoring patterns.

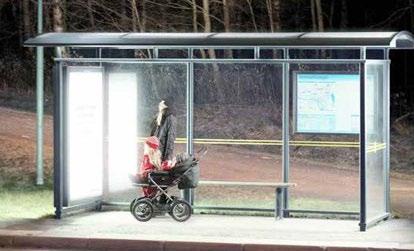
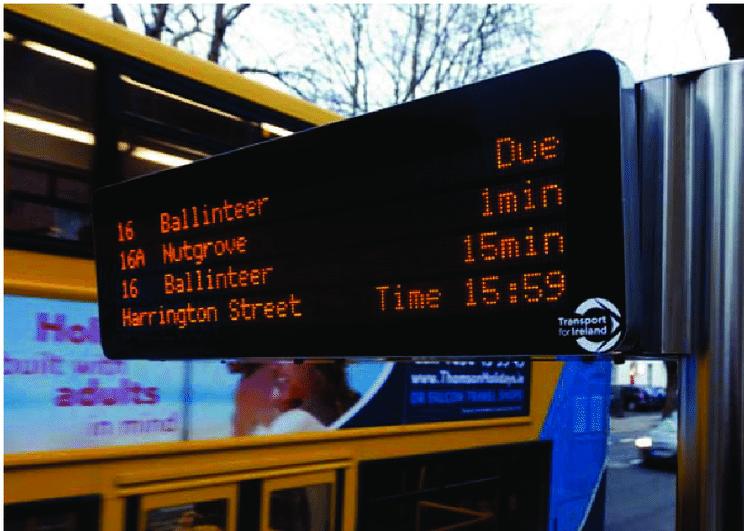
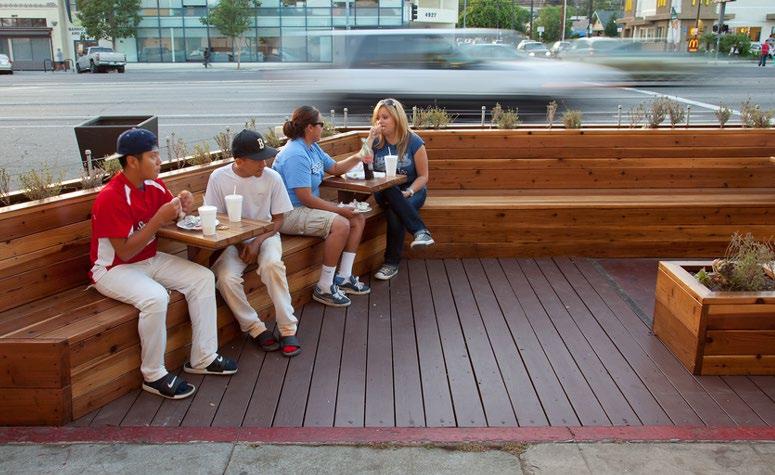
Paving treatments and crosswalk art do not define a crosswalk and should not be seen as a safety measure. Standard transverse or longitudinal high visibility crosswalk markings are still required.
Pedestrian-scale lighting provides many practical and safety benefits, such as illuminating the path and making crossing walkers and bicyclists more visible to drivers. Lighting can also be designed to be fun, artistic, and interactive.
Transit stop amenities such as shelters with overhead protection, seating, trash receptacles, and lighting are essential for encouraging people to make use of public transit.
Real-time bus information allows riders to predict their journey and manage their time more effectively. This increases the convenience of transit for riders by providing accurate, updated location of their bus.
Parklets are made by converting one or two parking stalls into spaces for outdoor seating, public art, or other outdoor amenities that improve the streetscape experience.
Displaying community art is a great way to engage the Reservation. Community art projects can include wall murals, intersection murals, creative crosswalk art, sidewalk chalk art, or sculptures.
Transit shelters, bicycle racks, seating, and public art provide important amenities for functionality, design, and vitality of the urban environment. They announce that the street is a safe and comfortable place to be and provide visual detail and interest.
Wayfinding signage is a fundamental element of a comprehensive bicycling, walking, and trail network. Effective wayfinding systems communicate designated corridors, destinations, and other points of interest

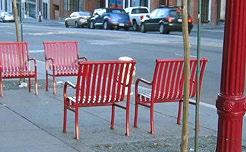

throughout a community. Wayfinding signage should be designed with local design aesthetics in mind.
Monument signs can serve as powerful tools that welcome people to visit, engage, and enjoy a space or area in a unique way. These signs often reflect the character or personality of the culture and are usually located near popular points of interest or at intermediary gathering spaces along a corridor.
Community outreach initiatives should start by listening to residents, families, business owners, local leaders, and working with existing community organizations. These critical relationships should allow for purposeful, ongoing engagement opportunities.
Distribution of an online newsletter is a great way to engage the public. Distribution should be researched and considered prior to utilizing this outreach method. This form of media can be used to display project and contact information as well as ways for readers to get involved.
A hotline is a great way for community members to call in, leave comments, or talk to someone directly about the project or program. A hotline should be considered as a support tool of an overall community engagement strategy. In order to guarantee a hotline’s success, it should be staffed and have the right person at the receiving end. Depending on the target audience, it may be necessary to have a multi-lingual person staffing the hotline. A hotline number is relatively low cost and requires little effort to maintain.
Surveys and questionnaires can also be created to identify the needs and views of a large number of people. Surveys are effective when a limited number of short and concise questions are used to gather information and feedback.
Collaboration with the community is an integral part of the planning process. Individuals, especially those belonging to traditionally underserved communities,
need to be empowered to participate in the transportation planning processes and have their needs heard.
Agencies can aim to implement improvements in areas that are disproportionally affected by health and safety burdens, acknowledging that policies and designs that improve conditions for vulnerable groups can benefit everyone in the community.
Recognize the importance of addressing the barriers that prevent trips from being safe, especially for the younger and underserved populations who cannot afford, operate, or choose not to drive vehicles.
Existing practices and policies may have unintended consequences when it comes to transportation equity. A systematic review of its practices should be performed to identify potential equity issues and opportunities.
A variety of engineering tools can be used to make sure that the roadways are safe for people walking, bicycling, and accessing transit. These tools include street design techniques that are intended to decrease vehicular speeds and others to enhance pedestrian and bicycle safety and comfort. Some examples are traffic control signs, parking controls, and traffic safety monitoring.
Vehicle usage can be decreased in part by actively encouraging residents and visitors to bike, walk, and ride transit for a variety of trips and purposes. Encouragement is all about making bicycling, walking, and transit more fun, healthy, and easy to do. To achieve this, the City, along with Montebello Bus Lines and other local organizations, can organize a series of activities and events that promote alternate modes of transportation and healthier lifestyles.
Provide employees with a temporary transit pass, for at least one-month, to test out transit in a trial period
to get familiar with their route and encourage commitment to using transit.
Encourage residents to take transit by offering an annual Free Ride Day. This can be held in conjunction with California’s Clean Air Day, to emphasize the benefit of replacing car trips and improving air quality. The City, along with Montebello Bus Lines and other local organizations, can organize pop-up events to provide transit information and encourage riders.
Open streets events are a citywide event that closes a street completely to cars. They provide residents an opportunity to walk, bike, skateboard, or roller skate own streets in their city free of cars.
During the month of May, cities across the country organize events and campaigns to educate people about biking and to encourage them to bike more to their destinations. Activities such as Bike Week, Bike to Work, and Bike Fridays can be organized and promoted to encourage first last mile transportation options.
Over the past decade Tactical Urbanism or “Demonstration Projects” has become an international movement, bringing about a shift in how communities think about project development and delivery. These demonstration projects include low-cost, temporary changes to the built environment intended to improve local neighborhoods and gathering places. In Southern California, these projects have loosely emulated a planned and designed project to allow residents to experience what the project may look like and how it affects traffic, active transportation modes and transit. These events are aimed to educate and gain support from the community to move towards implementation. The City of Montebello can utilize SCAG’s GoHuman campaign to facilitate these demonstration projects as needed. Items such as the protected bike lane or curb extensions promote a more comfortable and safe experience for non-motorists.
Safety assemblies can be organized as interactive
gatherings or festivals that consist of various stations throughout a school gymnasium or park. Each station can have a bicycle, pedestrian, and teen driver safety component that allows students to participate in various activities while learning the basics of “on the road” safety.
A class intended to build habits and cover essential skill for bike commuters. This class will cover what to wear, how to pack, and how to use transit with a bike.
An active transportation evaluator position would assist the City’s current active transportation coordinator in reviewing project plans and built projects as well as ensuring consistency and cooperation between city departments. The evaluator would also assist with completing grant applications, maintaining a prioritized list of improvements, researching appropriate funding sources, and updating cost estimates. This investment in staff is often returned since this position is usually responsible for securing State and federal funding.
The City can explore creating an First Mile Last Mile Advisory Committee that can provide oversight. Many municipalities have developed bicycle and pedestrian, or active transportation advisory committees to address issues and opportunities related to walking, bicycling, and transit. This group can act as a community liaison and support City staff, volunteers, and advocate efforts to address issues and help evaluate the progress of improvements in this Plan.
Conduct regular bicyclist and pedestrian counts throughout the City to determine baseline mode share and subsequent changes. Conducting counts would allow the City to collect information on where the most bicycling and walking occur. This assists in prioritizing and justifying projects when funding is solicited and received. Counts can also be used to study bicycling and walking trends throughout the City and overlaid with boarding and alighting data.
Five projects have been recommended for first last mile funding. To determine the top 5 projects, the team considered boardings and alightings, equitable access and connections to key destinations, feedback from the Technical Advisory Committee (TAC), community input, bicycle and pedestrian Level of Stress (LOS), crash history, and professional judgment. Section 6.4 details why each location was selected.
Through the community engagement process, stakeholder input, and data analysis, five priority projects have been identified with recommendations for bicycle, pedestrian and traffic calming treatments to improve transit access to and from the selected bus stops. These five projects are focused at high-volume and high-need transit stops which can be replicated at other locations.
Boardings & Alightings Key Destinations SAG Feedback Community Input Professional Judgement LOS Analysis Crash Analysis
The following pages show the five priority projects for Montebello First Mile Last Mile projects, their recommendations, and expected cost. A breakdown of the costs can be found in Appendix F.

COST ESTIMATE: $149,700
There is currently one bus stop at the northeast corner at the intersection of Beverly Boulevard and Maple Avenue. The 40 bus travels southeast-northwest along the Beverly Boulevard corridor connecting residents of Montebello and Whittier to Downtown Los Angeles. There are several key destinations within a short walk of this bus stop, such as Maple Avenue School, Washington Elementary School, Montebello Library, City Hall, Acuna Park, and businesses.
The boarding and alighting total for each stop at this intersection makes up 0.3% of all Montebello transit ridership. While only less than 1% of City ridership, this bus stop was selected as a priority project because of a pedestrian fatality and its proximity to schools and key destinations. With first last mile improvements, this location may experience an increase in ridership.
Figure 6-1 depicts the types of crashes that occur at this intersection between the years 2011-2021.
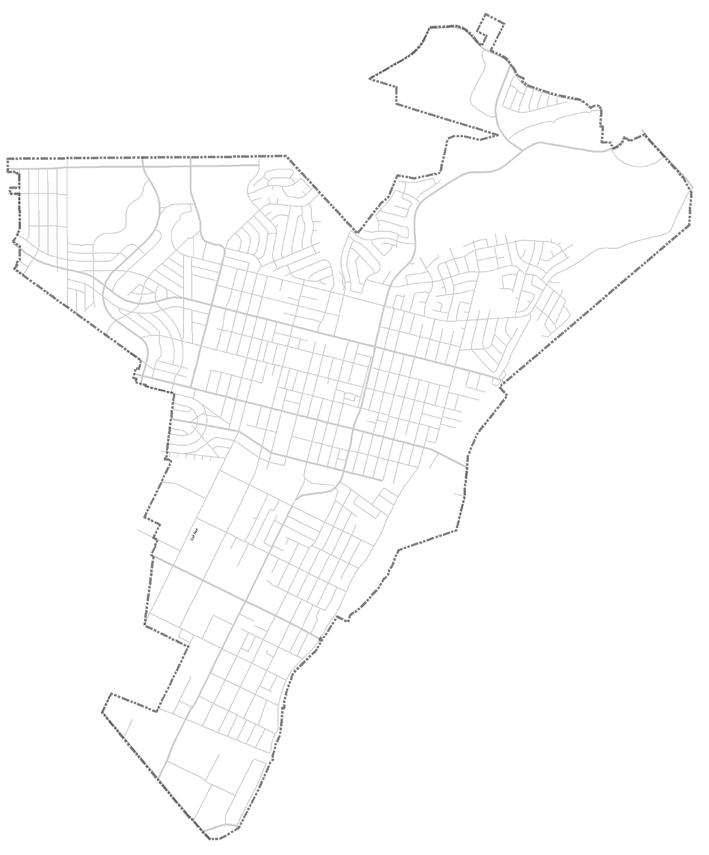
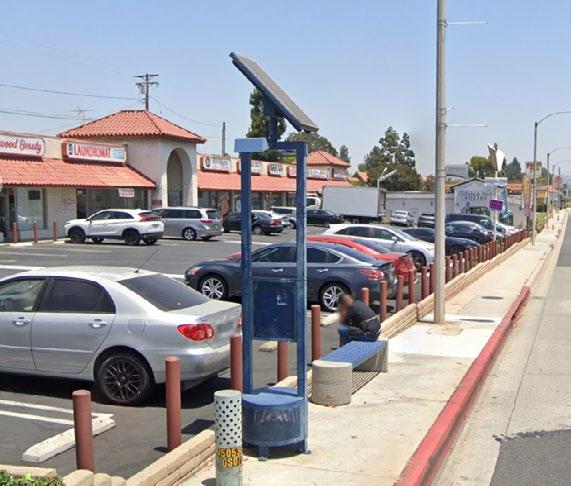
There has been one pedestrian fatality just west of the intersection from a vehicle traveling straight down Beverly. Additional pedestrian injury crashes include two from right turning vehicles, one from a left turning vehicle and one from a vehicle traveling straight. Bicycle injury crashes include two from left turning vehicles and two from vehicles traveling straight. Beverly


Figure 6-2: Beverly Boulevard and Maple Avenue Recommendations
To increase connections to the bus stop at Beverly Boulevard & Maple Avenue, the following recommendations are proposed.
• High-visibility crosswalks
• Pedestrian nose at medians
• Truck aprons
• Bicycle and pedestrian-friendly signal timing
• Reflective border on signal heads
• Lighting, trash cans, public art, and mobility parking options, where space permits.
Figure 6-2 illustrates where at the intersection the treatments are proposed to improve safe and convenient access to transit for people walking and rolling, bicycling, and using micromobility for all ages and abilities.


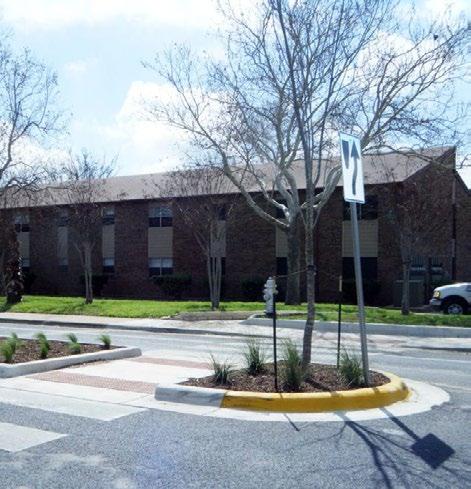


COST ESTIMATE: $157,700
There are four bus stops at the intersection of Whittier Boulevard and Garfield Avenue. The 10, 18, 30, and 70 routes connect users north to Alhambra and San Gabriel, south to South Gate and southern portion of Montebello, east to Whittier, and west to Downtown Los Angeles and Koreatown. Within a short walk of this intersection are key destinations such as Cantwell-Sacred Heart of Mary High School, Montebello High School, Saybrook Park, and shops.
The boarding and alighting total for each stop combined at this intersection makes up 7.4% of all transit ridership in Montebello. This bus stop was selected as a priority project because of its high number of collisions, ridership volumes, and proximity to key destinations.
Figure 6-3 depicts the types of crashes that occur at this intersection between the years 2011-2021. It has two fatal pedestrian crashes from vehicles traveling straight down Whittier Blvd, one at the intersection,

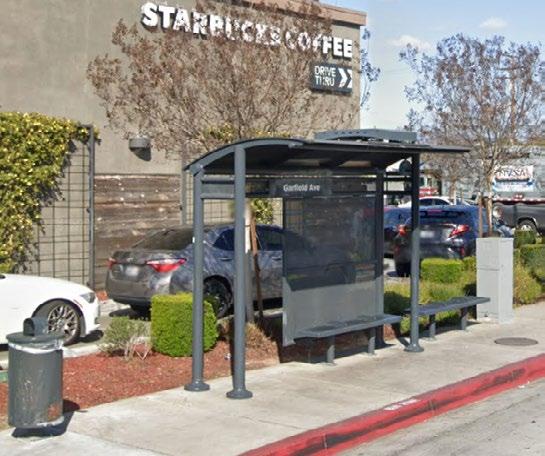
and the other farther east where the raised median is missing. Additional pedestrian injury crashes include two from right turning vehicles, two from left turning vehicles and five from vehicles traveling straight. Bicycle injury crashes include two from left turning vehicles and two from vehicles traveling straight and one from a bicyclist colliding with a stopped vehicle.

Add high visibility crosswalks to all four sides

Add “Pedestrian Nose” at median refuge islands to two sides
Where space permits, provide Enhanced Bus Facilities: seating options, shade shelters, lighting, trash cans, mobility parking options, real-time transit and wayfinding signage, route maps, pushto-talk assistance button and public art
Include bicycle/pedestrian friendly signal timing
Add reflective border on signal heads to all four sides
6-4: Whittier Boulevard and Garfield Avenue Recommendations
To increase connections to the bus stop at Whittier Boulevard and Garfield Avenue, the following recommendations are proposed.
• High-visibility crosswalks
• Pedestrian nose at medians
• Truck aprons
• Bicycle and pedestrian-friendly signal timing
• Reflective border on signal heads
• Lighting, trash cans, public art, and mobility parking options, where space permits.
Figure 6-4 illustrates where at the intersection the treatments are proposed to improve safe and convenient access to transit for people walking and rolling, bicycling, and using micromobility for all ages and abilities.


COST ESTIMATE: $139,700
There are four bus stops at the intersection of Whittier Boulevard and Montebello Boulevard. The 10 route runs east-west along Whittier Boulevard, connecting Whittier to Monterey Park. The 20 route runs north-south along Montebello Boulevard, connecting San Gabriel and Rosemead to the southern edge of Montebello. This central intersection is located next to major shopping centers with CVS, medical centers, and the west end of Downtown.
The boarding and alighting total for each stop combined at this intersection makes up 7.5% of all Montebello transit ridership. This bus stop was selected as a priority project because it is the highest-volume intersection for transit use, its location at the edge of the Downtown Montebello corridor, and high number of bicycle and pedestrian collisions.
Collision injuries near the intersection of Whittier Blvd and Montebello Blvd include one fatal pedestrian crash from a vehicle traveling straight down Whit-

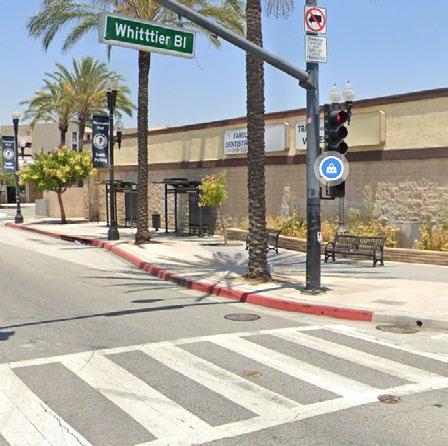
tier Blvd near the Spruce St intersection. Additional pedestrian injury crashes include one from right turning vehicles and four from vehicles traveling straight. Bicycle injury crashes include three from right turning vehicles and three from vehicles traveling straight and one from a bicyclist colliding with a stopped vehicle.

Whittier Boulevard
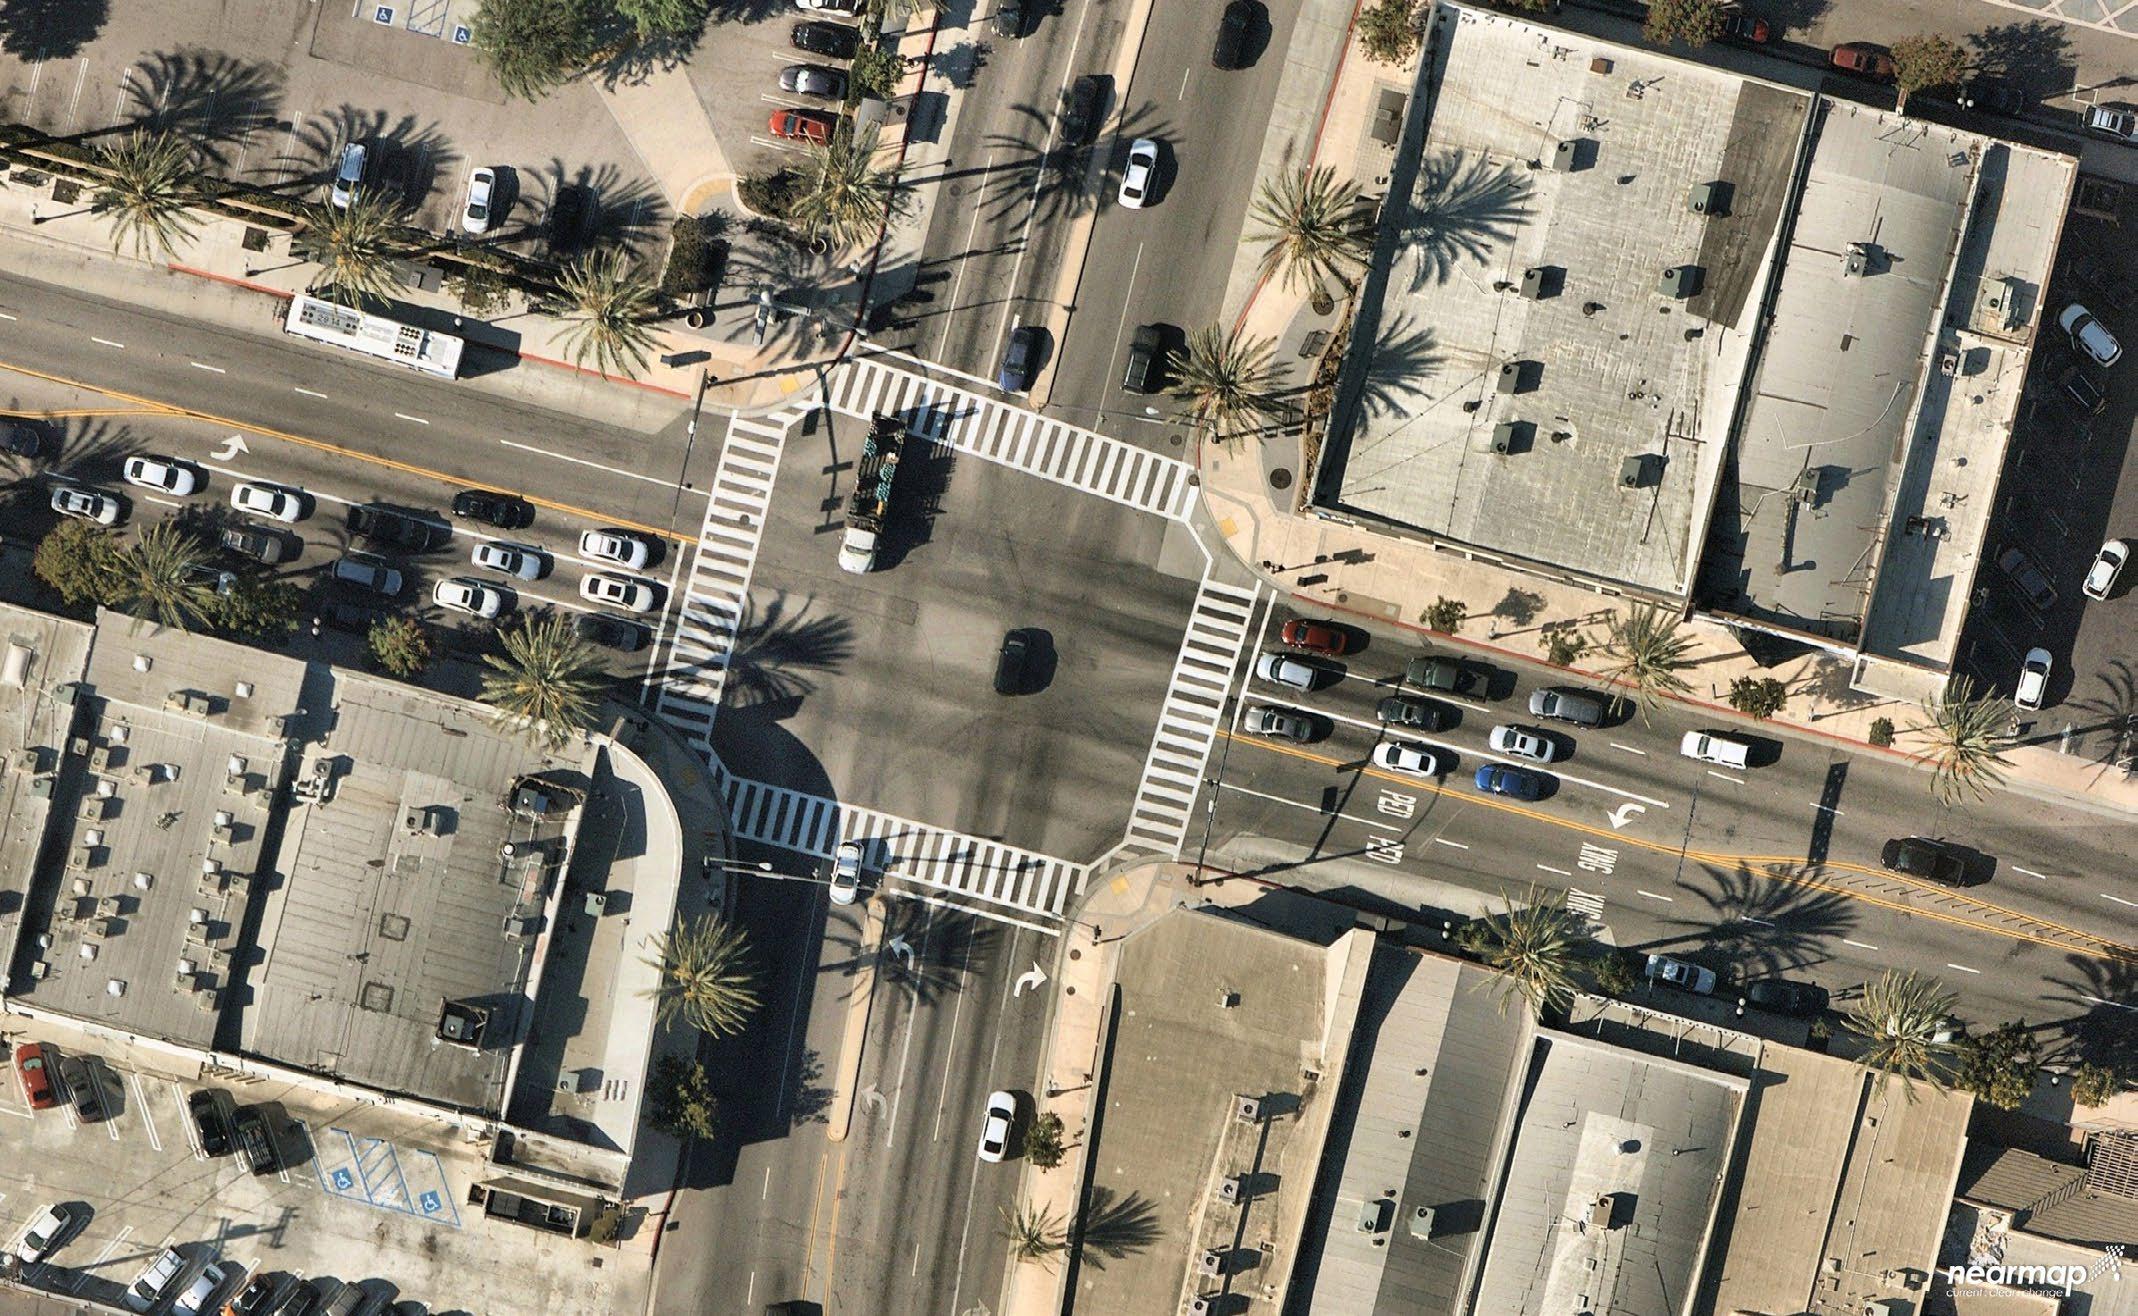
Where space permits, provide Enhanced Bus Facilities: seating options, shade shelters, lighting, trash cans, mobility parking options, real-time transit and wayfinding signage, route maps, pushto-talk assistance button and public art
Add “Pedestrian Nose” at median refuge islands to two sides
Add reflective border on signal heads to all four sides
Include bicycle/pedestrian friendly signal timing
6-6: Whittier Boulevard and Montebello Boulevard Recommendations
To increase connections to the bus stop at Whittier Boulevard and Montebello Boulevard, the following recommendations are proposed.
• Hardened centerlines
• Pedestrian nose at medians
• Truck aprons
• Bicycle and pedestrian-friendly signal timing
• Reflective border on signal heads
• Lighting, trash cans, public art, and mobility parking options, where space permits.
Figure 6-6 illustrates where at the intersection the treatments are proposed to improve safe and convenient access to transit for people walking and rolling, bicycling, and using micromobility for all ages and abilities.

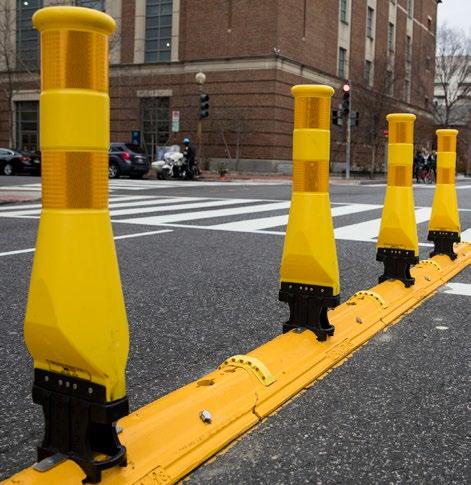


COST ESTIMATE: $174,900
There are four bus stops at the intersection of Washington Boulevard and Greenwood Avenue. The 50 route stretching far west to Downtown Los Angeles and far east to La Mirada provides an east-west route through southern Montebello. The 20 route stretches north to San Gabriel and south to the southern edge of Montebello. The 70 route zigzags north-south along the eastern edges of Montebello. From this intersection, Greenwood Elementary School is a short walk, numerous small businesses, and the Chet Holifield Library and Park.
The boarding and alighting total for each stop combined at this intersection makes up 3.6% of all Montebello transit ridership. This bus stop was selected as a priority project because it is adjacent to the proposed Metro E Line station on the southwest corner. Upon implementation of the Metro Rail extension, this intersection will become a hub for transit transfers and first last mile connections.

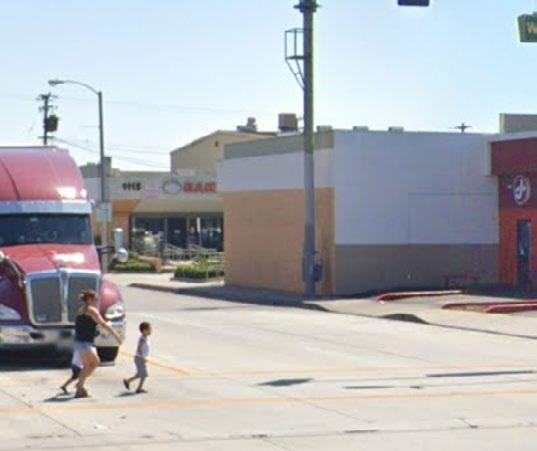
This location has seen two fatal pedestrian crashes: one from a vehicle turning right at the intersection and another vehicle traveling straight down Washington where the raised median is missing. Bicycle injury crashes include three from vehicles traveling straight and one from a bicyclist colliding with a stopped vehicle.


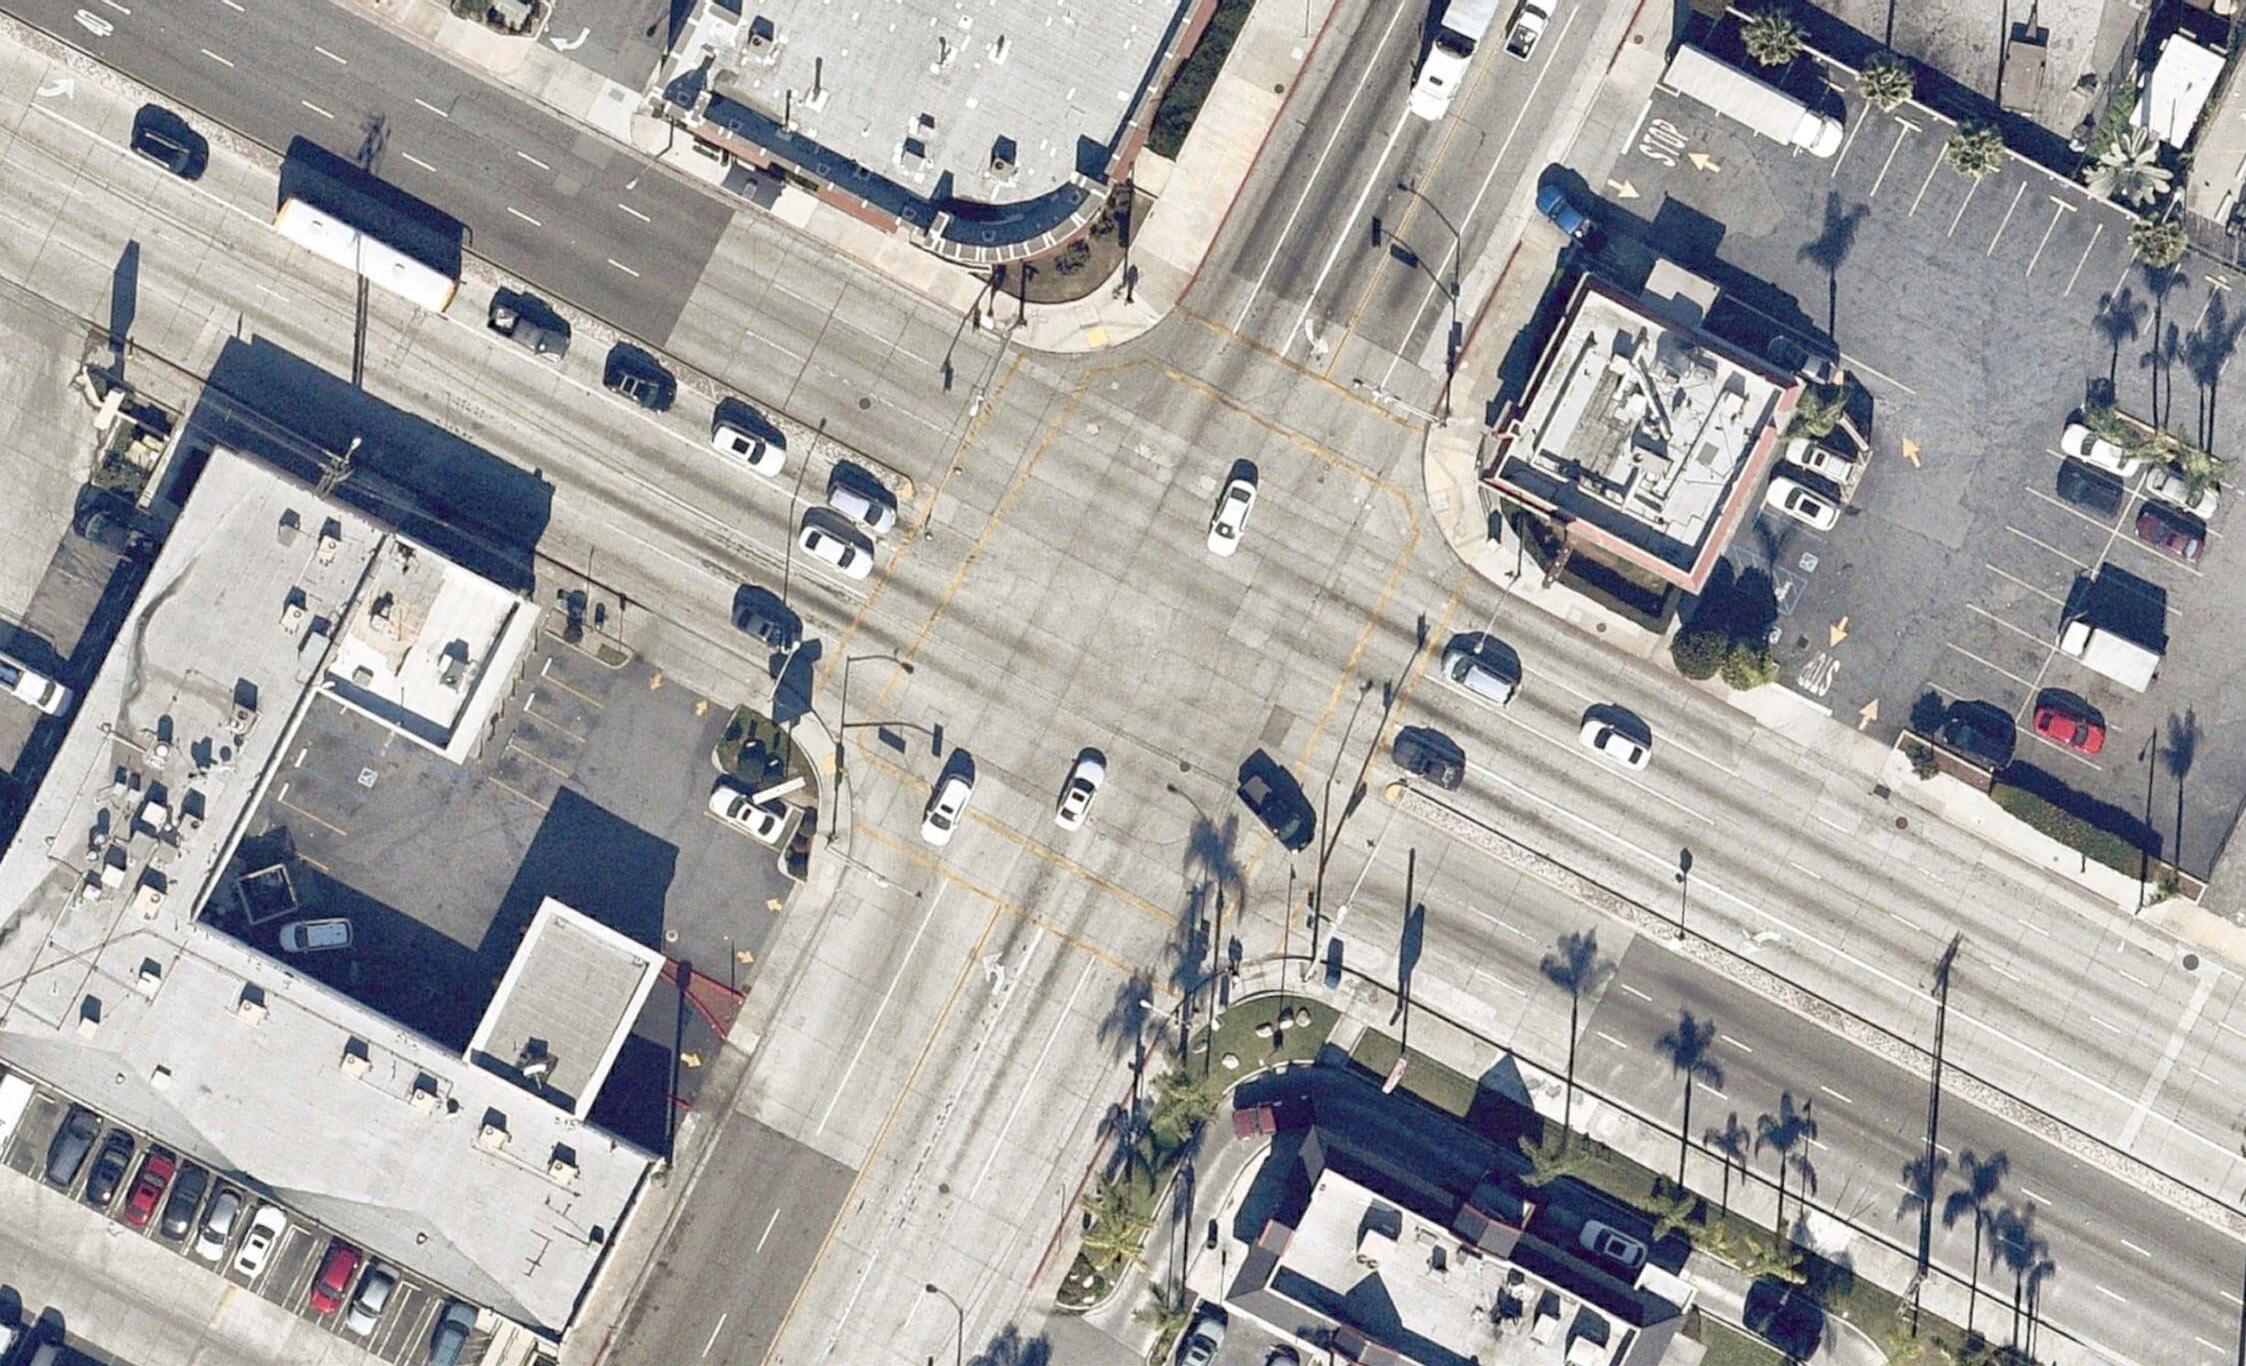
“Pedestrian Nose”
6-8: Washington Boulevard and Greenwood Avenue Recommendations
Recommendations
To increase connections to the bus stop at Washington Boulevard and Greenwood Avenue, the following recommendations are proposed.
• Hardened centerlines
• Pedestrian nose at medians
• Truck aprons
• Bicycle and pedestrian-friendly signal timing
• Reflective border on signal heads
• Lighting, trash cans, public art, and mobility parking options, where space permits.
Figure 6-8. illustrates where at the intersection the treatments are proposed to improve safe and convenient access to transit for people walking and rolling, bicycling, and using micromobility for all ages and abilities.


COST ESTIMATE: $332,000
A neighborway is an approach to reduce traffic, slow car speed, and improve safety for those biking, walking, and rolling on quiet residential streets.
This priority project prioritizes bicycle connections between the Rio Hondo Bike Path to across north Montebello and passes schools, shopping centers, and is nearby Montebello City Park and Beverly Hospital.
The neighborway runs on parallel streets to the 10, 20, 40, 70, and 90 bus lines to provide a lower stress route while maintaining transit access by bike.
The proposed recommendations along this neighborway include speed cushions to slow down automobile traffic, edge lane roads that prioritize bicyclists over cars, and wayfinding signage to keep cyclists on the pathway and point out key destinations.
Figure 6-9 illustrates where at the intersection the treatments are proposed to improve safe and convenient access to transit for people walking and rolling, bicycling, and using micromobility for all ages and abilities.
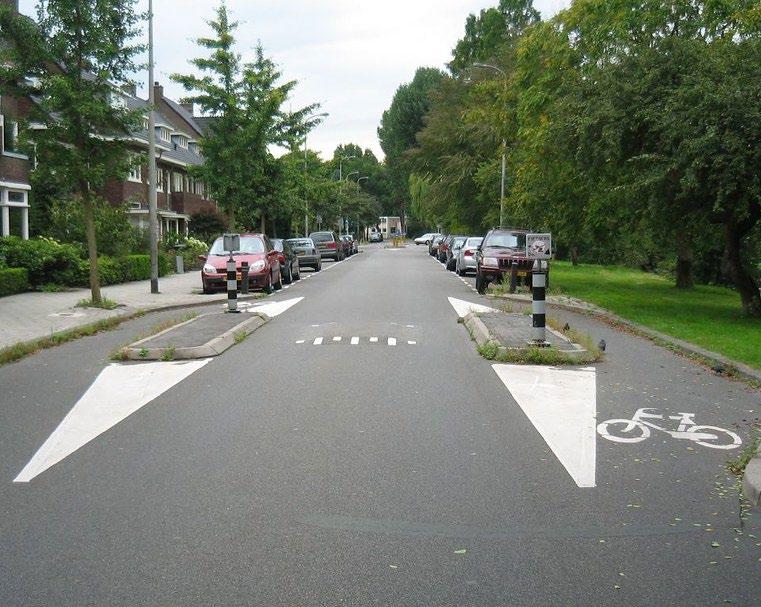
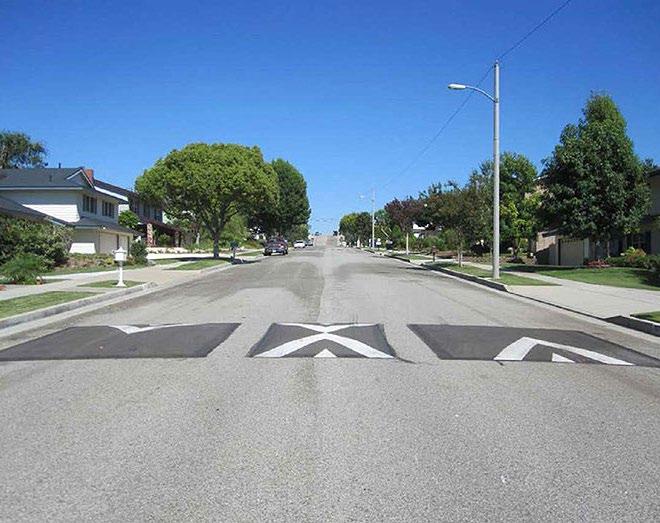
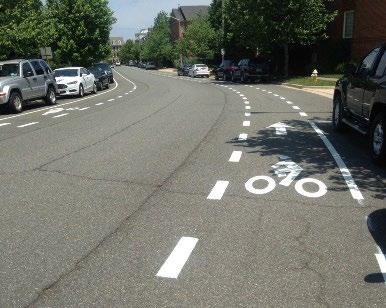
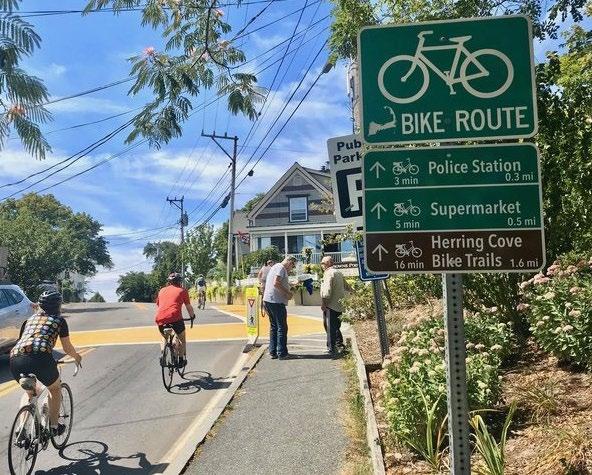

The five priority projects are geographically dispersed across Montebello. These recommendations can be replicated at additional transit stops for a systemic impact.
Benefits as a result of this plan may include:
» Increased perception of comfort and safety amongst transit riders
» Level of equitable first mile/last mile access to bus stops and nearby destinations
» Expected reduction in pedestrian and bicycle fatalities and serious injuries within 1/4 mile of enhanced intersections.
» Expected health benefits from increased activity levels and reduction in greenhouse gasses as a result of vehicle miles replaced.
» Expected economic development benefits from increased foot traffic near transit stops
» Increased transit ridership
The following are best practice performance measures, each of which are meant to quantify the impact and effectiveness of First Last Mile projects and programs with a Vision Zero lens. Identifying and employing several strategies will help the City update the public on progress and advance efforts for the upcoming year. The City must decide on the metrics that it deems the most important to allocate limited resources towards to improve first last mile connections to bus stops as well as reduce fatalities and serious injuries amongst bicyclists and pedestrians.
The principles articulated through the “Six Es”, developed by the Safe Routes Partnership (Engagement, Equity, Engineering, Encouragement, Education, and Evaluation), can help create and sustain successful programs throughout Montebello.
It is recommended that the City tracks the following data points annually. Below are examples the City can use to assist with developing performance measures, organized by the Six Es.
» Number of students taught about bus safety
» Number of people reached from an educational campaign on how to ride the bus, take a bicycle on a bus, and the significance of replacing car trips
» Percentage of mode split for transit
» Number of events to promote quick-build installations at or near transit stops
» Number of people reached in a marketing campaign
» Percentage of students or school staff who take transit to and from school
» Percentage of transit stops that meet ADA compliance
» Number of grants funded per year that address equity-related access issues
» Percentage of schools, parks, and medical buildings that are within 1/2 mile of a transit stop
» Number of improved pedestrian infrastructure projects installed within 1/2 mile of a transit stop
» Number of intersections where signals have been optimized for people with disabilities and active transportation within 1/2 mile of a transit stop
» Total number of pedestrian collisions, fatalities, and serious injuries within 1/2 mile of a transit stop
» Total number of bicycle collisions, fatalities, and serious injuries within 1/2 mile of a transit stop
» Reduction of fatalities or serious injuries caused by collisions involving people walking and bicycling within 1/2 mile of a transit stop
» Percentage of new street projects that are multi-modal within 1/2 mile of a transit stop
» Number of Boardings and Alightings with City limits
» Number of vehicles ticketed for parking in a bus loading zone
» Number of vehicles ticketing for parking in bicycle lanes within 1/2 mile of a transit stop
» Percentage of streets where speed surveys have been conducted within 1/2 mile of a transit stop
» Number of sting operations conducted to enforce yielding to pedestrians in crosswalks within 1/2 mile of a transit stop
» Number of sting operations conducted to enforce motorists complying with No Right Turn On Red within 1/2 mile of a transit stop
» Number of quick-build installations at or near bus stops
» Percent of total citywide street mileage dedicated to active transportation facilities (such as bicycle parking, street closures, Class I, II, & IV bicycle facilities, and complete sidewalk networks)
» Percent of sidewalk and bicycle network gaps closed
» Number of CIP projects funded per year that address bicycle and pedestrian access to bus stops or ADA compliance
» Percent of bicycle and sidewalk repairs completed, focusing on areas within 1/2 mile of a transit stop
» Percent of streets and intersections with traffic calming measures installed within 1/2 mile of a transit stop
» Percent of streets where posted speed limits have been reduced, focusing around transit stops, schools, and parks
» Total miles of on-street bicycle facilities defined by streets with clearly marked or signed bicycle accommodations
» Total miles of streets with pedestrian accommodations
» Number of missing or non-compliant curb ramps along City Streets


Federal, state and local government agencies invest billions of dollars every year in the nation’s transportation system. Only a fraction of that funding is used to develop policies, plans and projects to improve conditions for bicyclists and pedestrians. Even though appropriate funds are available, they are limited and often hard to find. Desirable projects sometimes go unfunded because communities may be unaware of a fund’s existence or may apply for the wrong type of grant. In addition, there is competition between municipalities for the limited available funds.
Whenever federal funds are used for bicycle and pedestrian projects, a certain level of state and/or local matching funding is generally required. State funds are often available to local governments on similar terms. Almost every implemented active transportation or complete street program and facility in the United States has had more than one funding source and it often takes a good deal of coordination to pull the various sources together.
According to the publication by the Federal Highway Administration (FHWA), AnAnalysisofCurrent FundingMechanismsforBicycleandPedestrianPrograms at the Federal, State and Local Levels , where successful local bicycle facility programs exist, there is usually an active transportation coordinator with extensive understanding of funding sources. Cities such as Seattle, Portland, and Tucson are prime examples. City staff are often in a position to develop a competitive project and detailed proposal that can be used to improve conditions for cyclists within their jurisdictions. Some of the following information on federal and state funding sources was derived from the previously mentioned FHWA publication.
Table 7-1 identifies potential funding opportunities that may be used from design to maintenance phases of projects. Due to trends in Low Impact Development (LID) and stormwater retention street designs, funding sources for these improvements not only increase the chances for first and last mile improvements, but can also be incorporated into streetscape and development projects. The sources are arranged by federal, state, local, and private, and the uses that the funds may address.
Federal Funding Sources
Land and Water Conservation Fund (LCWF)
Urban and Community Forestry Program
Transportation Alternatives (TA)
U.S. National Park Service/ California Dept. of Parks and Recreation x x
U.S. Forest Service x
Federal Highway Administration (FHWA)
Recreational Trains Program (RTP) Non-motorized
Highway Safety Improvement Program (HSIP)
EPA Brownfields Program
Community Development Block Grants
Choice Neighborhoods Planning Grants
Safe Streets and Road for All
Federal Highway Administration (FHWA) x
Federal Highway Administration (FHWA)
U.S. Environmental Protection Agency x
U.S. Department of Housing and Urban Development (HUD) x
U.S. Department of Housing and Urban Development (HUD) x
U.S. Department of Transportation x x
• Recreational fields and park amenities
• Construction of new trails and off-street ADA compliant parking
• Landscaping/ irrigation
• Supports urban tree-planting, urban forest planning and management, and related activities, particularly in disadvantaged communities.
• Pedestrian and bicycle facilities
• Construction of turnouts, overlooks, and viewing areas
• Community improvements such as historic preservation and vegetation management
• Environmental mitigation related to stormwater and habitat connectivity
• Recreational trails
• Safe routes to school projects
• Vulnerable road user safety assessments
• Construction of Class I trails to close gaps
• New hiking trails, drainage crossings, retaining walls, fencing, and signage, landscaping
• Safety improvements at signalized and non-signalized intersections
• Pedestrian, bike, and roadway safety improvements
• Brownfield cleanup
• Construction of public facilities and improvements, such as water and sewer facilities, streets, neighborhood centers, and the conversion of school buildings for eligible purposes
• Develop community driven plans to revitalize HUDassisted housing, increase investment in the surrounding neighborhood, and increase opportunities for all residents
• Development of a comprehensive safety action plan (Action Plan)
• Implement projects and strategies identified in Action Plan to address a roadway safety problem
Reconnecting Communities and Neighborhoods Grant Program (RCN)
U.S. Department of Transportation/ Caltrans x
• Prioritizing disadvantaged communities
• Aiming to improve access to daily needs such as jobs, education, healthcare, food, and recreation
• Fostering equitable development and restoration
• Reconnecting communities by removing, retrofitting, or mitigating highways or other transportation facilities that create barriers to community connectivity, including to mobility, access, or economic development
Funding Source Funding Origin Active Transportation
Inf. NI Plan
Urbanized Area
Formial Grants Federal Transit Administration (FTA) x x x
Bus and Bus Facilities Formula Grants Federal Transit Administration (FTA) x x
Formula Grants for Rural Areas Federal Transit Administration (FTA) x
TOD Planning Pilot Program Federal Transit Administration (FTA) x
State Funding Sources
Sustainable Communities Planning Grants
Caltrans Division of Transportation Planning
Affordable Housing and Sustainable Communities Program (AHSC) Strategic Growth Council and Department of Housing and Community Development x x
Project Examples
• Eligible activities include: planning, engineering, design and evaluation of transit projects and other technical transportation-related studies
• Capital investments in bus and bus-related activities such as replacement, overhaul and rebuilding of buses, crime prevention and security equipment and construction of maintenance and passenger facilities
• Capital investments in new and existing fixed guideway systems including rolling stock, overhaul and rebuilding of vehicles, station infrastructure, track, signals, communications, and computer hardware and software
• In addition, associated transit improvements, workforce development activities, and certain expenses associated with mobility management programs are eligible under the program
• All preventive maintenance and some Americans with Disabilities Act complementary paratransit service costs are considered capital costs.
• Capital projects to replace, rehabilitate and purchase buses, vans, and related equipment, and to construct bus-related facilities, including technological changes or innovations to modify low or no emission vehicles or facilities.
• Workforce development training
• Eligible activities include planning, capital, operating, job access and reverse commute projects, and the acquisition of public transportation services
• Planning or studies for transit-oriented development
• Encourages housing and mixed-us development near existing or proposed transit
• Safe Routes to School Plan
• Active Transportation Plan
• Bike/ped Trail/Path Feasibility Study
• Complete Streets Plan
• Sustainable Communities Plan
• Transit-Oriented Development Plan
• First/Last Mile Connectivity Plan
• Class I, II, III, & IV bike lanes
• Active transportation projects to encourage connectivity to transit networks
• Bikeways and sidewalks to affordable housing and transit center
• Install dedicated bicycle facilities
• Pedestrian facilities such as bulb-outs
Funding Source Funding Origin Active Transportation
Inf. NI Plan
Urban Greening
California Natural Resources Agency x
Transformative Climate Communities (TCC)
Office of Traffic Safety Grant Program
Strategic Growth Council and Department of Conservation x
CA Office of Traffic Safety x
Clean Mobility Options Air Resources Board x
Sustainable Transportation Equity Project (STEP)
Air Resources Board x x x
Transit and Intercity Rail Capital Program (TIRCP)
CalSTA and Caltrans Division of Rail and Mass Transportation x x x
Local Partnership Program (LPP)
Local Streets and Roads Program (LSRP)
Solutions for Congested Corridors (SCCP)
California Transportation Commission x
California Transportation Commission x
California Transportation Commission x
Project Examples
• Non-motorized urban trails that provide safe routes for both recreation and travel between residences, workplaces, commercial centers, and schools
• Projects that expand or improve the usability of existing active transportation routes (e.g., walking or bicycle paths) or create new active transportation routes that are publicly accessible by walking
• Complete Green Streets
• Bike share program
• Creating and considering active transportation corridors for better non-motorized connections
• Multi-use paths
• Urban greening for pedestrian facilities
• Safety education and encouragement
• Campaigns to promote safety
• SRTS safety programs
• Bikeshare programs
• “Quick build” right-of-way safety improvements for bicycles and scooters
• New bike routes (Class I, Class II, or Class IV) and supporting infrastructure
• Publicly-accessible bike parking, storage, and repair infrastructure (e.g., bike racks, bike lockers, bike repair kiosks)
• New walkways that improve mobility/access/safety of pedestrians (non-motorized users)
• Street crossing enhancements, including accessible pedestrian signals
• Plans
• Pedestrian and bike trail
• First/last mile connections via bike lanes and separated paths
• Bike share programs
• Bike parking facilities
• Plans
• Close sidewalk gap, install class II bike lanes and cycle track, curb extensions, pedestrian enhancements, improvements to lighting and signage
• Construct 4 single-lane and 1 multi-lane roundabouts, and improvements to street, pedestrian and bicycle facilities
• Expressway pedestrian overcrossing
• Implement enhanced crosswalk signing and striping
• Create safety separation between motorists, bicyclists and pedestrians
• Design and construction of school access and safety improvements to six schools (SRTS)
• Construct Class I and Class II bikeways
• Pedestrian improvements and plaza at a transit station
• Intersection improvements
Funding Source Funding Origin Active Transportation
Project Examples Inf. NI Plan
Highway Safety Improvement Program (HSIP)
State Highway Operations and Protection Program (SHOPP)
State Transportation Improvement Program (STIP)
Congestion Mitigation and Air Quality Improvement (CMAQ) Program
Active Transportation Program (ATP)
Affordable Housing and Sustainable Communities (AHSC)
Caltrans Local Assistance/ FHWA x x
Caltrans Office of SHOPP Management x
California Transportation Commission x
FWHA x
Caltrans x x x
California Cap-andTrade Emissions Reduction Program / Department of Housing and Community Development x
• Install hybrid pedestrian signals
• Improve pedestrian and bicycle safety at locations with uncontrolled crossings
• Plans
• Upgrade sidewalks to ADA compliance
• Reconstruct damaged pavement
• Add bike lanes to updated corridors
• Upgrade pedestrian push buttons, refresh striping, and improve pedestrian and bicycle access
• Bike/ped Overcrossing and Access Improvements and bicycle and pedestrian bridge
• Class I, II, III, & IV bike lanes
• Multi-Use paths
• Complete Streets improvements
• Travel Demand Management to promote clean commutes
• Public Education and Outreach
• Bicycle amenities; Class I, II, III, & IV bike lanes
• Safe Routes to School Plan
• Transportation Alternatives Program
• Bicycle Transportation Account
• Affordable housing developments (new construction or renovation) and transportation infrastructure. This may include
• Sustainable transportation infrastructure, such as new transit vehicles, sidewalks, and bikeways
• Transportation-related amenities, such as bus shelters, benches, or shade trees
• Programs that encourage residents to walk, bike, and use public transit.
Inf - Infrastructure | NI - Non Infrastructure | Plan - Planning & Design
This page is left intentionally blank.


The Circulation element designates the location and extent of existing and proposed major thoroughfares and transportation routes by classifying street typologies and mapping their extents. The policies, practices, and programs related to first last mile include:
» The City should upgrade and improve Greenwood Avenue and Montebello Boulevard as the community’s major north-south connector.
» Improvement of Greenwood Avenue and Montebello Boulevard should include widening, grade separation structures and signalization.
» The City should seek to provide an adequate circulation system in the hills which services major regional traffic generators, yet preserves areas which are attractive for residential, open space or recreational development.
» Through-traffic in residential areas should be discouraged.
» The City of Montebello should not be bisected by a new freeway route.
» The City’s existing municipal bus lines should be improved to accommodate and service new development, as proposed in the land use element.
» Improvement in the bus system should include the development of two new terminals along Montebello Boulevard, one northeast of the intersection with Victoria Avenue, the other either within or adjacent to the regional town center.
» With the development of the regional town center, an extension of the Montebello/Northridge route through Monterey Park and a new route from the town center along Paramount Boulevard to Pico Rivera should also be considered.
Policy 1. Through Inclusionary Housing requirements and Density Bonus incentive, the City will facilitate development of affordable housing within high resources areas.
Policy 2. Through General Plan update, development of Downtown Montebello Specific Plan, and Parks Master Plan, the City will expand transit, parks and open spaces, public facilities, and jobs to underserved areas of the City so existing and new housing units in these areas will also have access to higher degree of resources.
Policy 3. The City will avoid displacement of low-income households and where necessary, ensure that it is carried out in an equitable manner.
» U-Pass Program - MBL has been partnered with Rio Hondo Community College since 2007. Since then the City of Montebello and other participating transit agencies joined the U-Pass program. This fare subsidy program allows full-time Rio Hondo students unlimited rides on LACMTA, the Whittier Sunshine Shuttle, Norwalk Transit, Foothill Transit, and MBL throughout the entire semester. MBL is reimbursed $0.75 per rider from TAP for each boarding throughout the semester.
» MBL Bus Tokens - In April 2010, MBL reintroduced bus tokens as an alternative to paying cash. Tokens are sold for $1.00 each, offering a $0.10 discount to MBL patrons. One token is worth a one-way fare ($1.10) and is only accepted on MBL. The agency continues to partner with third-party vendors to promote the MBL tokens.
» Transit Access Pass (TAP) Program - In August of 2008, MBL joined the Los Angeles County Municipal Operator’s TAP program and replaced the fare boxes onboard the MBL fleet with fare media designed with the TAP technology. In 2020 MBL
is upgrading its farebox technology with Cubic Systems to promote a new fare methodology that is more convenient to MBL patrons. TAP allows patrons to load cash value or a fare product on a chip enabled smart card. Each time patrons board and tap their card on the farebox; the correct fare is deducted or recorded as payment.
» Other Media - MBL also sells and accepts the EZ transit pass, a regional pass that allows patrons unlimited travel on participating agencies (16 regional municipal bus operators in Los Angeles County). MBL is reimbursed an average cash fare of $0.81 for each passenger that uses their EZ transit pass to board its buses. In addition, MBL also accepts Access Services cards as fare media and receives reimbursement of $0.50 per ride.
» Proposition C 40% Discretionary – Forty percent of the Proposition C Revenue is used to improve and expand rail and bus transit services in Los Angeles County. These monies are distributed by LACMTA and are composed of Foothill Transit Mitigation, Transit Service Expansion, Bus Service Improvement Program for overcrowding, and the Municipal Operator Service Improvement Program (MOSIP). Funds are allocated by formula for each respective program.
» Low Carbon Transit Operations Program (LCTOP) – LCTOP is funded by the State of California with the goal of reducing greenhouse gas emissions and achievement of other benefits. The program is funded by auction proceeds from the California Air Resource Board’s Cap-and-Trade Program, with proceeds deposited into the Greenhouse Gas Reduction Fund.
» Maintain zero tolerance graffiti abatement program on fleet and upgrade bus stops within the City of Montebello.
» Public Outreach Programs – MBL has continued to advocate public transportation and enhance the image of MBL through the following:
• Ongoing campaign to promote the sale of TAP and MBL tokens.
• Partnership with local business through a MBL Day Pass Program to jointly promote transit and local businesses.
• Coordination with multiple school districts to promote transit services and the benefits of student monthly passes; as well as a partner-
ship with the Montebello Unified School District Parent Teacher Association to promote the Student Monthly Pass.
• Continued partnership with The Shops at Montebello.
• Participation in the (LIFE) Low-income Fare is Easy Program led by Metro. This program provides fare subsidies that allow low-income patrons to redeem toward transit passes for eligible riders including adult regular fare, Senior/Disabled/Medicare, K-12, and college/ vocational students who meet the criteria.
• Ongoing meetings with the Transportation Citizen Advisory Committee to receive input from patrons of Montebello Bus Lines and the Dial-A-Taxi services.
• Council Ad Hoc Committee
• Social media outreach program (Facebook & Instagram)
• In Bus marketing to promote ridership
» Capital Improvements Program that includes numerous other programs and projects like the Associated Capital Maintenance Program, Bus Stop Improvement Project, CAD/AVL Passenger Information System Project (PISP), Enterprise Asset Management System, Facility Improvements, Hybrid Bus Repower, Pico Rivera Transit Center, Support Vehicles, Technology and Equipment Support, Transit Coach Tires, Universal Fare System, Vehicle Replacement Project.
Title VI regulations assure equal access to transit services regardless of race, ethnicity, gender, or income. Montebello Bus Lines adopted the Title VI requirements into its programs, activities, and services.
» Transit Amenities. MBL has set a service policy to ensure equitable distribution of transit amenities across the system for all patrons.
» Vehicle Assignment. MBL’s service policies for vehicle assignment are based on several factors, including but not limited to the age, size, and type of the vehicle. As a general service policy MBL aims to assign vehicles with more capacity to routes with higher ridership and/or during peak
periods, this includes assigning higher capacity vehicles to MBL’s Major Local Service and Express Services lines.
» Disparate Impact Policy. The purpose of this policy is to establish a threshold which identifies when adverse effects of a major service or fare change are borne disproportionately by minority populations. For this policy, a minority population is defined as any readily identifiable group of minority persons who live in geographical proximity, and if circumstances warrant, geographically dispersed/transient populations (such as migrant workers.
» Disproportionate Burden Policy. This policy is to establish a threshold which identifies when adverse effects of a major service or fare change are born disproportionately by low-income populations. Low-income population is defined as any readily identifiable group or households who are at or below 150 percent of the U.S. Department of Health and Human Services Poverty Guidelines in the table below.
The goal of the Zero Emission Bus (ZEB) Plan is to transition to zero-emission technologies by 2040. MBL will begin purchasing ZEBs in the first quarter of 2023 through 2040 and will not purchase non-ZEBs after 2023. This purchasing strategy will coincide with the disposition of conventional transit buses at the end of their lifecycle expectancy.
MBL currently receives funding for the procurement and maintenance of its fleet from the following federal grant programs: the Federal Transit Administration’s (FTA) Urbanized Area Formula, discretionary grant programs such as the Bus and Bus Facilities (B&BF) program, and Low or No Emission Vehicle Deployment Program (LoNo). To secure funds for future fleet procurement processes, MBL will seek additional funding from state resources through grant opportunities such as Senate Bill 1 – State of Good Repair (SGR) and the Low Carbon Transit Operations Program (LCTOP).
» SCAG’s Regional Transportation Plan, titled, Connect SoCal, has a vision to locate housing, jobs, and transit closer together; increase investment in transit and complete streets; and increase mobility options to achieve a more sustainable growth pattern. The policies, practices, and programs related to first last mile include:
» Affordable Housing Sustainable Communities Program. This funding supports construction of affordable housing and supporting infrastructure in areas that are well served by transit and offer opportunities for neighborhood scale mobility.
» Metro Joint Development Program. LA Metro collaborates with developers to build affordable, transit-oriented housing on Metro-owned properties.
» SCAG Mobility Go Zone & Pricing Feasibility Study. This practice evaluates congestion pricing and the range of impacts on traffic volumes, transit ridership, air quality and availability of funds for transportation programs to reduce Vehicle Miles Traveled.
» Regional Transit Agency Electric Buses. Purchase hydrogen and battery electric buses.
» TAP Card Integration. Introduce one way to pay for all regional transit systems, bikeshares, and carshares.
» Micromobility Pilot Projects. Test on-demand transit across the region.
» Sustainable Communities Strategy. Several actionable strategies employ GHG reductions and broader goals of Connect SoCal including focusing growth near destinations and mobility options, promote diverse housing choices, leverage technology innovations, implementation of sustainability policies to name a few.
» Livable Corridors. Plan and Zone for increased density, redevelop single-story under-performing retail with high-density, mixed-use centers. Include transit improvements, active transportation improvements, and land use policies.
» Transportation Demand Management. Reduce vehicle miles traveled through ridesharing and
providing first/last mile services. Redistribute or eliminate vehicle trips during peak demand periods by supporting telecommuting and alternative work schedules. Reduce single occupancy vehicle trips through use of other modes such as transit, rail, bicycling, walking, and micromobility modes.
» Dedicated Transit Lanes or Transit Right of Way. Planning for future implementation of dedicated transit infrastructure requires several steps to address appropriate ROW and determine transportation use.
» Transit Vehicle Access to Curbside Bus Stops. Implement bus bulbouts, transit boarding islands, and full-size curbside bus stops for safe boarding and alighting.
» Bus Stop Location. Cities to plan and work with transit agencies for new bus stops.
» City Involvement in Re-Siting an Existing Bus Stop. Cities to work with transit agencies on the relocation of an existing bus stop.
» Intersection and Traffic Signal Treatments. Reduce delays to transit vehicles, improve travel time, and schedule maintenance through transit signal priority, queue jump lanes, and transit-oriented traffic signal coordination.
» Bus Layover Area. Layover spaces provide a place for parked buses and operator breaks with access to a restroom on either public or private property.
» Passenger Waiting Areas at Transit Stops on City Sidewalks. City maintenance of bus stop amenities, planning for improvement of passenger waiting areas, ADA improvements at passenger waiting areas all enhance the passenger waiting experience.
» Passenger Access to Transit Stops and Stations. Transit stops are major generators of walking and bike trips. The provision, design and maintenance of existing infrastructure, and planning for new infrastructure, can improve bicycle and pedestrian access to transit stops and stations, including sidewalks, bicycle parking, and lighting to name a few.
» Traffic Impact Studies Consideration of Transit. Best practice is for the City to have traffic impact
study (TIS) guidelines that require the following assessments of public transit as part of the TIS of a land development project or roadway changes and for Transit Agency staff to be involved in the Traffic Impact Study. Project mitigation measures are recommended to reduce vehicles’ adverse impacts on transit operations.
» Site Plan Review Including Special Events. Best practice is for Transit Agency staff to be involved in the site plan review process and that the project is responsible for addressing impacts to transit stops and service.
» Developer Condition of Approvals/Project Mitigation. Cities can enact and enforce developer conditions including improvement of transit stops and stations serving a project site, improved walking and bike access between project site and transit stops, transit service to a project, requiring TDM plan, and construction impacts to transit stops and bicycle routes.
» Transit-Specific Activities by the City. Best Practice is for at least one city staff to have some level of transit responsibilities. Best practice is to codify or institutionalize staff duties, follow transit-specific planning activities such as bus stop evaluations, and adopt short and long-range transit plans.
» Routine Transportation Planning Activities. Develop long-range transportation planning practices and documents like corridor plans and traffic impact studies, integrate roadway and transit planning such as a Complete Streets policy, include transit-related improvements in the scope of work of all roadway reconstruction projects, introduce transit ridership encouragement programs, and participate in public outreach efforts.
» Integration of Land Use Planning, Built Environment and Transit Planning. Given the connection between land use and transportation, good practice is to consider the existing and future transit network in land use and zoning decisions. This typically applies to medium and large cities with rapid transit, high-capacity transit service such as rail, or locations that can otherwise be considered transit dense.
» Funding. Improve local contribution to fund public transit from general fund to development fees to ensure that transit agencies receive the financial support they need to provide excellent service.
» Establish a permanent funding source for the Vision Zero program.
» Evaluate the County Master Plan of Highways, and the development and roadway design standards stipulated in the Los Angeles County Code to ensure consistency with Vision Zero goals.
» Update the Public Works’ Highway Design Manual to consider available tools and design standards, including those recommended by the Los Angeles County Model Design Manual for Living Streets, National Association of City and Transportation Officials (NACTO) Guides, and other best practices to enhance safety for both motorized and non-motorized users.
» Finalize the Livable Communities Design Guidelines, which incorporate multi-modal safety design measures, and hold training to educate staff and the public.
» Implement traffic safety enhancements to reduce fatal and severe injury collisions involving pedestrians and bicyclists like high visibility crosswalks or curb extensions.
» Implement training on traffic calming features training to promote culture change among County staff and the public.
» Conduct regular data analysis on motor vehicle collision injuries and deaths to identify populations impacted and trends.
» Conduct routine evaluation, research, and analysis to understand traffic safety trends and impacts to Vision Zero projects.
» Identify items on the city’s CIP list that can incorporate recommended first and last mile improvements.
» Integrate the first and last mile recommendations into all applicable grant applications.
» Analyze if an environmental review is needed for each project to determine the level of impact.
» Identify alternate sources of funding and include additional assessment districts who will benefit from the increased first and last mile improvements, like Business Improvement Districts.
» Identify opportunities to incorporate first and last mile recommendations into proposed redevelopment projects.
» Increase the average speed of active transportation users by decreasing wait times at intersections and increasing speed and capacity along pedestrian routes.
» Decrease point to point distances with diagonal routes, midblock crossings, and other strategic short-cuts.
» Support multimodal transfer activity by providing easily identifiable safe and efficient access routes between modes.
Adam Mitchell
Adrianna Kendricks
City of Montebello Police Department
Montebello Bus Lines
Alex Gillman Public Affairs and Information Technology
Alfredo Machuca Montebello Bus Lines
Alexis Lucero
City of Montebello Public Works
Chris Moorman LA Metro
David Huang Metrolink
Gary Robinson
City of Montebello Fire Department
Krista Yost SCAG
Horacio Perez
Vail Continuation High School
Joe Forgiarini LA Metro
Jose Ornelas
Laurie Aguilar
Leticia Alvidrez
Naomi Sotelo
Paul Parzik
Adult School Principal
City of Montebello Parks & Recreation
Montebello Unified School District
Eastmont Intermediate School
YMCA Metropolitan Los Angeles
Serena Liu Caltrans
Stephanie Hardaway
Applied Technology Center High School
Stephen Fox SCAG
Timothy Greensavitch
Montebello Bus Lines



The survey is online at: https://www. surveymonkey. com/r/5QV8XLD

Welcome to the City of Montebello First and Last Mile Survey! The purpose of this survey is to help identify physical barriers, such as those shown in the photos and maps below, that affect access to and from public transit. Thank you for helping us with this important study.
1. Do you experience any problems walking, cycling or accessing transit at a particular location or along a particular route? Yes ____ No ____
2. Please provide locations and route information (where you’ve experienced problems walking, cycling or accessing transit) in the fields below.
Locations (Street/Cross Street) _____________________________________________________________________________ City __________________________________________________________________________________________________
Transit Routes Used _____________________________________________________________________________________
3. Please note problems associated with the previously mentioned location. Please check ALL that apply.
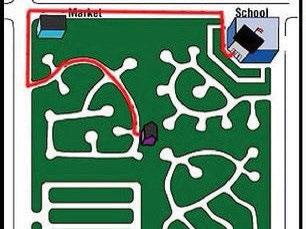

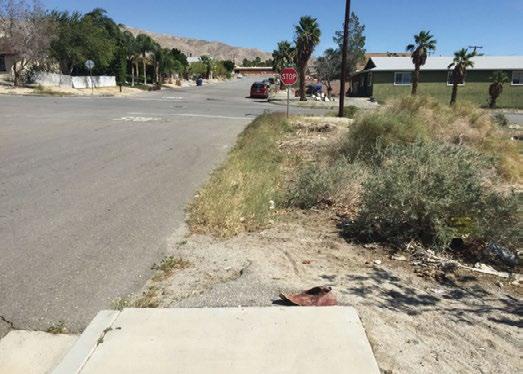

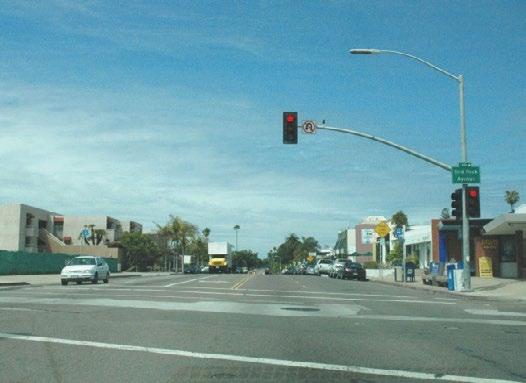
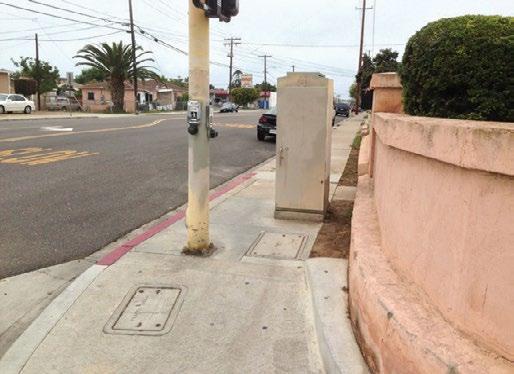
on back)



(continued from front)
The survey is online at: https://www. surveymonkey. com/r/5QV8XLD
3. Please note problems associated with the previously mentioned location. Please check ALL that apply.

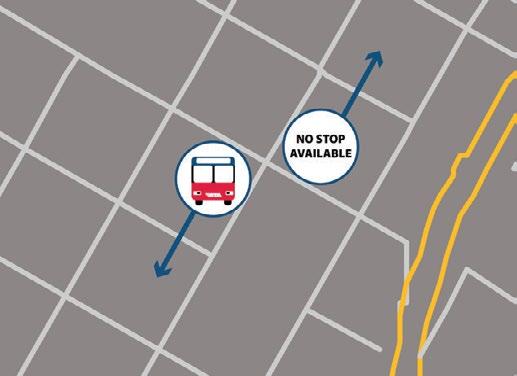


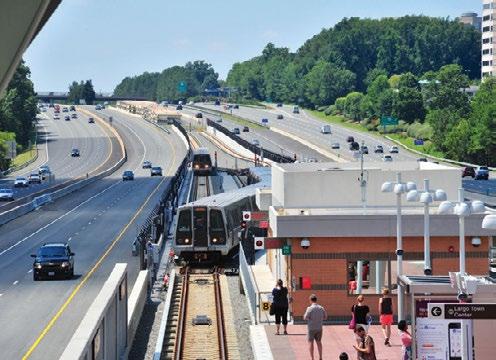


4. Do you have other ideas for improving access to transit services? If so, please provide them on the line below.
(Please note: this study is about biking, walking and other modes to transit services, not transit operations.)
5. Please provide your name and contact information below. This is for survery follow-up and if you want to be on an e-distribution list.
First Name
Phone Number and/or
Email Address
Thank you for your participation!

1 Does your organization have dedicated staff that is focused on securing funds/grants for FMLM related projects and programs? If so, how many dedicated staff do you have?
2. What FLM aspects and issues are most important or perhaps challenging for a transit agency?
3 What are advantages and disadvantages for a transit agency to implement FLM, or work with a city within its service area to implement FLM?
4 Do you have a prioritized list of recommended project types (countermeasures) with the greatest effect on increased safety and participation with transit locations?
a. If not raised by this open-ended question, the interviewers asked about the following topics:
i Programs to evaluate and implement safe access to and from bus stops, e g , well-placed crosswalks, traffic signals or other measures to help passengers cross the street, and well-lit sidewalks to access the bus stops
ii Programs to evaluate and improve passenger safety and comfort at bus stops on City sidewalks, and practices to work proactively with the transit agency to provide amenities such as bus shelters and benches
iii. Other traffic engineering treatments
5 Are there specific policies or strategies that have been successful in implementing FLM?
6 Do you have a (prioritized) list of recommended program types (Federal to community) that have a notable increase in safety and participation rates with transit locations?
7 Have you had luck with fire departments allowing speed cushions - if the cushions are designed to allow fire trucks to pass without reducing speed?
8 How does the City handle conflicts between bike needs and bus needs? Is this an issue? Do bike lanes trump bus lanes for example?
9 Do you have a list of funding sources (Caltrans ATP, FHWA HSIP etc ) that have helped with projects or programs for transit safety and participation rates? Which funding source(s) have you received funding from?
10 What elements of bus stop design and maintenance are within City/local government purview?
Pavement Markings
Removal of yellow center line, addition of Edge Lane Road markings along this route
This is the most common type of bike facility at a bus stop, where buses and people biking share space at a bus stop. It is where a Class II bicycle facility exists between the curb and a general traffic lane, or in some cases there is just a shared lane marking (“Sharrow”) on the roadway. The shared bus-bike area is illustrated with green dashed conflict striping instead of solid green markings. The bus will encroach into the shared zone to board and alight passengers. Some places, like in Montreal, Canada, there are two sets of sharrows, allowing cyclists to either continue straight through the conflict zone or go left around a stopped bus. This is typically used when there is limited right of way available and if the preferred treatment is a bike lane or a shared lane.
Where either a Class II bicycle facility or a Class IV bicycle facility exists, and there is not sufficient space to include a Floating Bus Island (FBI). It is a constrained bus stop adjacent to a bike lane or separated bike lane where the bike lane is elevated to sidewalk height at the FBI. The bike lane is crossed by people walking to access the bus, and it does not have parallel parking on the street. The raised area reduces conflict with vehicle traffic, and there is a bicycle ramp to elevate bicyclists to sidewalk height. This typology provides a designated pedestrian crossing zone and bicycle yield area across the bicycle facility to reduce conflict with passengers boarding and alighting. This is typically used when there is limited right of way available and the preferred treatment is a separated bike lane.
This typology has some similarities with Typologies #1 and #2, with the key difference being that it has a FBI and there is parking on-street adjacent to the curb with a tapered bike lane between the parking and the general purpose lane. The bike lane jogs behind the floating bus stop and then jogs again at the on-street parallel parking. This is typically used when there is a Class II bike facility instead of a Class IV bike facility.
With similar conditions to Typology #3, the key difference is that it has a buffered bike lane and there is no onstreet parking in this typology. As in the previous typology, the bike lane jogs behind the FBI. This is typically used when there is plenty of right of way available and the preferred treatment is a buffered bike lane.
With similar conditions as Typology #3, the key difference for this typology is that it's for a Class IV bike facility rather than a Class II bike facility. It also has on-street parking that provides a physical separation to the bicycle facility. The separated bike lane runs straight behind the FBI. This is considered the “best practice typology” for when conditions are ideal. The FBI can be permanent, typically made out of concrete, or it can be temporary, typically made out of plastic, which is popular in Oakland, California, and several other cities.
With the same conditions as Typology #5, this typology also has a Class IV elevated bicycle facility that exists between the curb and the FBI. It also runs straight and there is parallel on-street parking that provides a physical separation to the bike facility. The main difference is that Typology #6 is for a two-way separated bike lane while Typology #5 is for a one-way separated bike lane. Two-way separated bike lanes have some benefits over oneway separated bike lanes, such as increased comfort and lower space requirements, but one-way separated bike lanes are more common. Two-way separated bike lanes include only about a third of the separated bike lanes in the United States.
This typology has more similarities with Typologies 1 & 2 than with the other typologies. It is for constrained environments where there is still sufficient space on the sidewalk to have a sidewalk-level bikeway next to ADA-accessible sidewalk space. This typology does not have a FBI and there is no on-street parking next to the bike facility. Instead, the bus island is connected to the sidewalk and the bikeway goes from street level up to sidewalk level and then around and behind the bus island before ramping back down to street level. The bikeway is typically either Class II or Class IV or in rare cases it consists of shared lane markings. This is not considered ideal but it is considered the most ideal of the three constrained typologies. That is because it removes the stress of the cyclist interacting with a bus stopped at the bus stop. Moreover, it also minimizes the interaction between people walking and people biking because, in theory, people waiting for the bus will already be on the street-side of the bicycle facility.

Intersection and Streets to Avoid for Vertical Traffic Calming
(That may Affect Response Time for the Fire Department)


Roosevelt
Beach


Poplar Ave
Poplar Way


Maple


Vail Rd.
4Th St., 5th St,


6th th Street the Most Important)
