
25 minute read
Baking line audit: Metrology on baking and freezing lines
from f2m Automation Book
by landmagd
Metrology on baking and freezing lines
The audit of a baking and freezing line is an important step towards the continuous improvement of production tools.
+Improvements may address issues of product quality, productivity and energy consumption, all of which are often interrelated. Other issues may relate to specific risks such as the presence of acrylamide, a chemical contaminant resulting from reactions occurring at high temperatures and involving ingredients contained in the product recipe. This contribution provides a review of the issues encountered in the context of applications in the cooking and then in the refrigeration and freezing processes. The last section focuses on the challenges addressed by energy audits.
Baking processes
The baking of cereal products under industrial conditions takes place in batch ovens with automated loading or in conveyor ovens. Baking involves high-temperature levels (150/250°C) or even much higher for certain specialties such as flatbreads (up to 600°C) with humidity control in the ovens playing a key role in the final quality of the products; a bakery oven should be considered as much as a drying device as a baking device and many of the elements mentioned in this section can be applied to the case of product drying.
Air humidity can be expressed in different ways. The most common is the concept of relative humidity, which expresses, at a given temperature, the ratio between the partial pressure of water vapor and the saturation pressure of water vapor. This concept is poorly adapted to the context of a bakery oven because of the low values reached. Another quantity used is absolute humidity, which expresses the mass of water per mass of dry air. It is sometimes confused with the specific humidity (water mass per humid air mass) often used in climatology. In general, it is necessary to watch the units because confusions are frequent and are linked to the English and French definitions which use close adjectives (confusion between absolute and specific for example); it is thus advisable to be careful about the units of these quantities. Absolute humidity (expressed in mass of water per mass of dry air for the following) is a relevant quantity for monitoring the hygrometry of a kiln because it expresses a quantity related to a mass of dry air which is a conservative quantity in the sense that the mass of dry air entering is equal to the mass of dry air leaving. The dew point or dew point temperature is also a relevant quantity that expresses the temperature from which the humidity of the air will condense on the products placed in a given environment; this quantity is usually expressed in degrees Celsius and it is easy to link this temperature to the air humidity.
The absolute humidity in an oven varies greatly during the baking process. In general, high humidity is sought at the beginning of baking in order to ensure condensation on the surface of the products; this condensation will ensure the plasticization of the envelope of the dough that
enters baking and which will be the future crust of the products. It also plays an important role in the phenomenon of sprouting in the oven (expansion at the beginning of baking which occurs during the first few minutes of baking) and in the structure of the crust. AltamiranoFortoul (2012) has shown that excessive humidity leads to an excessively colored crust, a lack of crispness, and ultimately a non-conforming product. As mentioned by Le-Bail et al. (2010), too high a moisture content will lead to a product with a large volume but not necessarily compliant due to gelatinization and dextrinization of the starch, which can lead to an increased presence of acrylamide (Dessev et al., 2020).
Cooking technologies can also influence the humidity during cooking. Ovens are most often equipped with gas burners, especially in industrial conditions where high power is required. Combustion can be indirect or direct. In indirect combustion, the heat available in the burner (thermal radiation) and in the combustion fumes is transferred indirectly through a heat exchanger tube. In direct combustion, the burner is located inside the kiln; usually supplied with methane, the combustion products (nitrogen, CO2 and water vapor) are brought into direct contact with the product. In this type of kiln, the temperature control is adjusted based on the relative humidity of the air in the kiln, which indirectly adjusts the excess air supplied to the combustion. These furnaces have very poor efficiency with excess air of up to 4 to 6 (up to 6 times more air is injected than necessary for complete combustion, which lowers the temperature of the smoke and therefore the firing temperature to 180°C to 200°C. These ovens are used for baking specialty pastries, biscuits or hamburger buns. The following sections present the measurement technologies and associated problems for measuring temperature, humidity and heat flow.
Ambient and product temperature metrology
This type of on-board metrology is now commonplace and there is a wide range of equipment available, including in microwave environments. The issues to be addressed are heat shields (insulating enclosure protecting the recorders) and time-temperature resistance. In the case of microwave environments, a suitable metal shield is required with electrical continuity to be ensured to avoid any antenna effect and the risk of electric arcing that could damage sensors or electronics (accumulation of charges). The quality of the construction of the heat shields is important, particularly pertaining to the tightness against the penetration of hot air and the quality of the insulating materials used. While measuring the temperature of a product does not pose any major problem apart from the fixing of the sensor, measuring the temperature of the air in a kiln may be disturbed by the heat radiation transmitted by the burners; a sensor equipped with a thermal shield can correct this problem.
Metrology for measuring humidity
There are various pieces of equipment on the market that operate essentially on two measurement principles. Wet oxygen technology consists of the dissociation of water molecules present in the atmosphere of the furnace; a comparison between ‘atmospheric’ oxygen and ‘wet oxygen’ makes it possible to determine the humidity of the air. This type of sensor has a low response time (less than one minute) and can be used over a wide temperature range up to 300°C. A circulation of humid air around the sensor must be ensured, whatever the technology, which can modulate the response time and lead to fouling problems. The second technology uses substrates whose electrical properties (capacity, inductance, resistance, etc.) depend on the ambient humidity. This technology has a response time that is sometimes slightly higher than that of wet oxygen sensors. The maximum operating temperatures are comparable and reach 250°C to 300°C. The calibration of these sensors can be carried out in an environment with stable hygrometry, possibly at a lower temperature than the maximum temperature. The humidity value of the air can be measured by a mirror hygrometer; by sampling the air and cooling it while remaining above the dew point, it is possible to perform a calibration (also with a conventional sensor).
On-board humidity metrology is rarer, and to our knowledge there are only two companies that offer stand-alone on-board equipment that can be used for conveying in bakery ovens. Static metrology is also a solution to be considered as it is more economical; mirror hygrometers are the most accurate and allow direct determination of the dew point temperature. The maximum operating temperature of static sensors is often limiting. However, the air humidity in the cooking process in the food industry is often quite low, so that by sampling the air in the atmosphere of an oven or in the chimneys and by cooling it to a temperature higher than the dew point temperature, it is possible to use ‘low temperature’ sensors that are much less costly and often sufficiently accurate.
Static metrology (from gas sampling instead of conveying sensors) is also a solution to consider as it is more economical; mirror hygrometers are the most accurate and allow direct determination of the dew point temperature. The maximum operating temperature of static sensors is often limiting. However, the relative humidity of the air in baking processes in the food industry is often quite low, so that by sampling the air in the atmosphere of an oven or in the stacks and cooling it to a temperature above the dew point temperature, it is possible to use ‘low temperature’ sensors that are much less expensive and often sufficiently accurate.
Measurement in the exhaust chimney and overall balance of a baking line
Measuring the humidity in the extraction stacks can provide interesting information, particularly in the case of a complete energy and drying balance of a product being baked. However, it is necessary to carry out a prior calibration to obtain the velocity in the duct as a function of the opening angle of the butterfly valve. An exploration of the speed in the section of the pipe carried out upstream makes it possible after integration to obtain a global flow in m3/s. The knowledge of the static pressure and the hygrometry of the air makes it possible to go back to the density of the air and the mass flow rate of wet air and dry air circulating in the pipe.
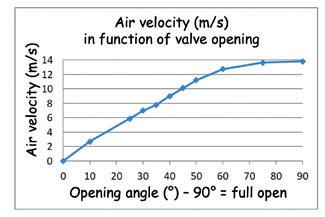
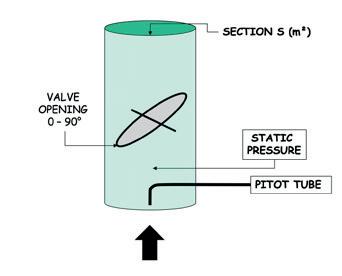
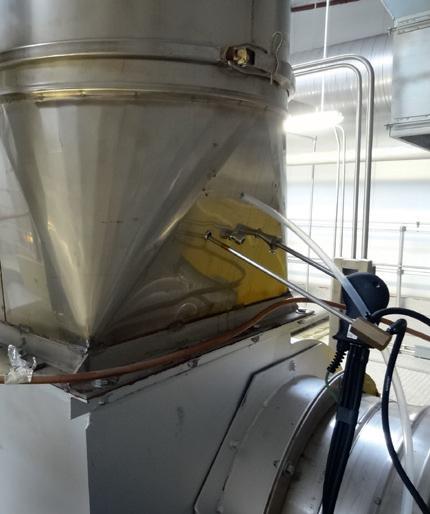
© ONIRIS-GEPEA Figure 1: Example of the link between valve opening and flow velocity (from ONIRIS data)
INTERVIEW METROLOGY ON BAKING AND FREEZING LINES
Measurement of the heat flux received by the products
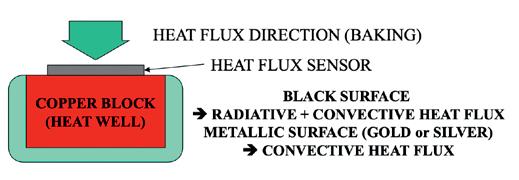
The measurement of the heat flux received by the products is a key point in understanding certain operating anomalies in baking ovens. This information can also be used to facilitate the transfer of production to a new furnace or to define the specifications of a new furnace. The received heat flux is divided into two main components, the convective flux related to the circulation of air in the kiln and the radiative flux received from the burners and the kiln walls. The heat flux sensors consist of multiple thermocouples screens printed on either side of a thin plastic film. The whole assembly is integrated into a sensor shaped like a plate of various geometries (most often square, e.g. 3cm x 3cm, sometimes rectangular or circular) of about 1mm thickness. Sensors measuring convective flux are coated with a thin sheet of gold or silver, a metal with a very high radiation reflection capacity. The ‘total’ sensors measuring radiative and convective flux are coated with a high-temperature resistant black paint. These sensors are also equipped with a built-in temperature sensor to monitor their temperature. When a heat flow passes through the sensor, a voltage is delivered by the thermocouples in series. A prior calibration allows the heat flux density (W/m²) to be related to the voltage delivered.
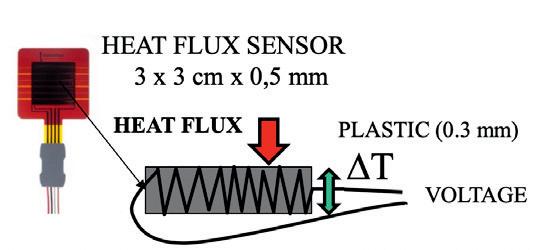
This type of heat flux sensor should be applied to a heat sink as shown in Figure 2 that can absorb the heat passing through the collector. One can imagine a fluid flow system on a static mounting. In the case of a conveying system, the sensor is most often bonded to a copper block, as copper is an affordable metal with the highest specific mass x heat product. When recording, the exposure time of the sensor to the heat flow is a critical point. This exposure time is determined by the maximum temperature of the sensor and is, in fact, a function of the ability of the copper block to absorb the heat received. Commercial devices exist on the market but it is also quite easy to design your own device. A flow sensor can also be placed on the product or glued to a mold. A second type of commercially available device consists of a metal paddle (e.g., 3cm x 3cm in size) coated with gold plating or black high-temperature paint (for convective flow or total flow respectively) connected to a heat sink by a metal bar. This rod is connected to a heat sink and the measurement of the temperature difference between the vane and the heat sink provides a signal proportional to the heat flux received by the vane. The two types of devices are equivalent, with a shorter response time for the device using a heat flux sensor, and a more ‘average’ device for the paddle device. An important point concerning these two types of sensors is that they must be preheated above the dew point temperature to prevent the moisture contained in the furnace air from condensing on them; in the event of condensation, an endothermic phenomenon occurs leading to an overestimation of the actual flux.
© ONIRIS-GEPEA
Figure 2: Heat flow sensor. Thermocouples placed on either side of the plastic film amplify the temperature difference that appears on the film when a heat flow passes through the sensor. This type of sensor is placed on a heat sink (copper block) which absorbs the heat received from the outside environment. The measurement is possible as long as the sensor is kept at a compatible temperature. By measuring the ambient temperature and the surface temperature of the sensor (thermocouple inserted in the sensor), the convection coefficient h in W.m-2.K-1 can be determined. h = Heat flux density (W/m²)/(TAMBIENT – T SENSOR SURFACE)
Metrology under freezing conditions
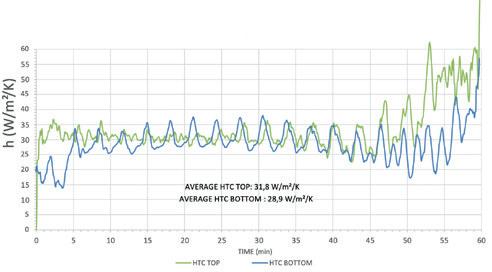
The metrology mentioned for ovens can generally be used to evaluate the performance of freezing tunnels. In addition to measuring the temperature of the products, which is a relatively easy measurement, it is most often a question of measuring a convective exchange coefficient between a product and its environment. This coefficient is the result of the air flow in the tunnel, which is often very variable depending on the orientation of the air flow and its level of turbulence in particular. The flow sensor heat flow measuring device can be successfully used by preheating the recorder and its insulating screen as well as the heat flow sensor. When passing through the tunnel, the heat sink acts as a heat source and the limitation will be that the heat flow will cease as the heat sink (copper block) reaches the ambient air temperature. The convective exchange coefficient is calculated from the heat flux value divided by the temperature difference between the collector surface temperature and the ambient air. A metalized collector is a priori recommended. The contribution of heat radiation is very small in freezing conditions due to the low temperature level. An example of a reading taken in a spiral freezer is shown in the graph below. It is possible to detect the passages in front of the fans that propel the air over the conveying device consisting of a plastic belt that winds up in a spiral. The knowledge of the convective exchange coefficient makes it possible to estimate the duration of freezing and also to qualify and optimize the air flow conditions within industrial freezers. The passage of the selfpowered conveying sensor also makes it possible to highlight the reduction of the convection coefficient during production due to the accumulation of frost on the walls of the cold battery and consequently of the air speed. This problem of frosting of exchangers in freezing installations is a major issue in the food industry; a review paper proposed by Badri et al. (2021) proposes an overview on this topic. ONIRIS-GEPEA is supervising the ongoing FOODEFREEZE project (Funded by the French Environment and Energy Management Agency – ADEME), dealing with energy and frosting in freezing equipment of the food industry. Frosting and icing of the evaporators in freezing equipment yields an increase in the required product freezing time and ultimately in non-compliance (insufficiently frozen products) if the line’s output is maintained.
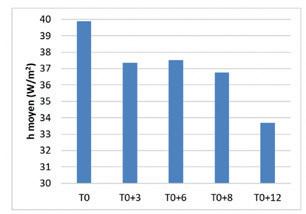
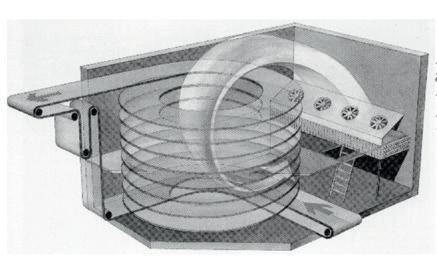
Figure 3: Top left Spiral freezer (Doc. Heinen). A Top right, an example of a convection coefficient reading in an industrial freezer using a heat flow measuring device. Bottom, average values of the convection coefficient at different times during production, T0 defrosted installation and follow-up at +3, +6, +8 and +12 hours during production (ONIRIS internal data)
© ONIRIS-GEPEA
INTERVIEW METROLOGY ON BAKING AND FREEZING LINES
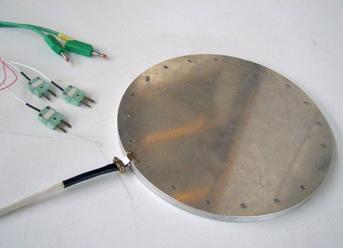
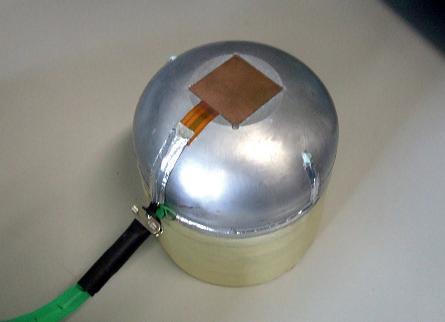
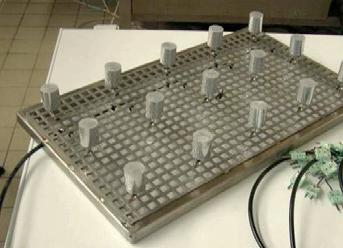
Figure 4: Aluminum shapes for the measurement of convective exchange coefficients in freezers; various shapes reproduced by machining (pizza, bun, cylinders) and possibly equipped with internal heaters and temperature sensors (surface and ambient temperature) made it possible to determine the convective exchange coefficient by taking into account the real geometry of the food products. (ref. Gibeaud et al., 2010/Pictures and production ONIRIS-GEPEA, L. Guihard, O. Rouaud, A. Le-Bail)
An alternative way of measuring the convective exchange coefficients in situ is to apply the heat fluxmeter to an aluminum form equipped with an internal heater. Such devices are shown in Figure 4 below with a pizza-like plate on the left and a bun in the center (ref. Gibeaud et al., 2010). This type of system has the advantage of being able to operate in a steady-state over a long period of time (several hours) and also of realistically mimicking the air flow conditions (geometry identical to the food product). The main disadvantage is the long stabilization time of up to 30 to 60 minutes; this type of device is, therefore, more suitable for ‘static’ freezing equipment. Another alternative is the use of small aluminum studs of a given geometry. An example is shown in Figure 4 below (right). The dots were drilled and placed on a needle equipped with a thermocouple to record the temperature as a function of time. This device was used to dynamically analyze the local convection coefficient in a conveying tunnel with liquid nitrogen cryogenic fluid. A thermal model with a low Biot number was used (transient heat transfer, lumped analysis model) to determine the convection coefficient (see Gibeaud et al., 2010).
There has been increasing interest in measuring the degree of freezing of products. The degree of freezing can be determined from the amount of freezable water actually frozen in the product. The resulting function can be obtained from the knowledge of the starting freezing temperature (from the temperature plateau observed at the beginning of freezing), the ending freezing temperature (from a calorimetric reading) and the amount of freezable water (obtained by calorimetry). Le-Bail (2017) presents these different elements and the figure below shows a function of the amount of freezable water frozen from this reference.
This type of function makes it possible to give a freezing tunnel exit target linked to the freezing rate associated with the average temperature of a product. If the French regulation describing the ‘surgélation’ process (deep freezing) indicates that
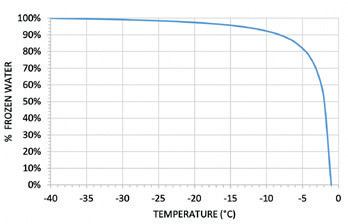
Figure 5: Function describing the evolution of the quantity of freezable water frozen as a function of temperature for a product starting to freeze at -1°C and ending to freeze at -40°C. It can be seen that at -18°C, the quantity of frozen water is 96.9%; the product is therefore not completely frozen at this temperature, which has been adopted as the world standard, as it corresponds to 0°Farenheit

© ONIRIS-GEPEA
Figure 6: Example of a calorimetric-isothermal system for obtaining the average temperature of a non-isothermal product at the end of the process. Two or more products coming out of a freezer are placed in an insulated container. After thermal equilibration (the products being colder at the surface than in the core), an average temperature of the product is reached at thermal equilibrium (Chapleau et al., 2005)
a ‘deep frozen product’ must be cooled “as quickly as possible” to -18°C (MAP-1964, MAP-2011), the interpretation of this regulation addresses issues in the industrial field. ONIRIS-GEPEA has therefore worked with many food companies to assist them in their exchanges with regulatory authorities and control services. The recommendations of the International Institute of Refrigeration (www.iir-iif.org) are that a product is considered as ‘frozen’ when its temperature reaches -10°C or when at least 80% of the freezable water is frozen. A concrete example is presented in the article by Chapleau et al (2005), in the context of a collaboration with the company MARIE-SURGELE (France), showing that, in the case of a model system (pie type), 80% of freezable water being frozen was reached at a temperature of -9.8°C. in such conditions, the target temperature to consider the food as ‘frozen’ according to the IIR criteria was -10°C. One of the difficulties involved in measuring the average temperature of products (pizza, quiches, etc.) at the end of the freezer, which could be achieved using an isothermal calorimetric technique as described below. Indeed, a temperature gradient is present in a product and by grouping several products around a temperature sensor, it is possible to obtain an average temperature of the products after equilibration.
An alternative touchless method has been developed by the company in partnership with AQUANTIS company (Nouhin et al., 2020). It is based on a sensor developed by the company AQUANTIS (Belgium) working in the terahertz domain. The sensor consists of two high-frequency (HF) measuring units (an HF transmitter and an HF receiver) and a computing unit. The two measuring units are aligned and face each other on opposite sides of a non-metallic conveyor belt on which the food products travel. The freezing degree sensor consists of two high-frequency (HF) measuring units (an HF transmitter and an HF receiver) and a computing unit. The two measuring units are aligned and face each other on opposite sides of a non-metallic conveyor belt on which the food products travel. The distance between the measuring units is usually kept as small as possible while ensuring that there is no contact with the product under test. For measurements on individual products (frozen), focusing means are added to the transmitter unit to confine the electromagnetic radiation to a spot size significantly smaller than the characteristic lateral dimension of the product under test. In the latter case, the emitter-product distance is determined by the focal length of the focusing means. A laser-based product thickness sensor is placed next to the HF transmitter and is oriented to measure the product thickness (layer) at the position of the HF measurement axis. Products passing the sensor are exposed to low-power electromagnetic radiation in the millimeter wave range. The wavelength applied can vary depending on the application. It is chosen according to several parameters such as product (layer) thickness, product (layer) density, water content, scattering properties, etc. The electromagnetic radiation
incident on the test product is partially reflected, scattered and absorbed by the food product. A transmission measurement allows the overall electromagnetic loss induced by the test product to be measured and traced back to the amount of frozen water in the product and thus the degree of freezing.
Low-temperature hygrometry and icing of freezing lines
A simple solution to know the hygrometry of the air inside a freezer is to take it with a pump and then recondition it (heated) in order to measure the hygrometry with conventional capacitive sensors at room temperature. The adjustment of the sampling temperature plays a key role here to be able to use inexpensive commercial sensors; a reverse path had been discussed in the case of cooking ovens where the air sampled is cooled in the exhaust stacks.
Energy and mass balance
The audit of the energy consumption on a baking line or on a freezing line requires the gathering of a large number of factors and parameters. A mass balance is also needed to be able to determine the moisture lost during baking and ideally all along the baking line (conveying oven) by sampling products at different locations. Very often, for dry cereal products such as rusks or crackers, the oven embeds a gas-powered section for the baking stage and an electric section for the final drying stage. For dry cereal products, the measurement of the moisture content reaches very low values (below 5%) and in such conditions, the moisture must be determined with the Karl Fisher technic; the drying cabinet test is, by far, very imprecise. Overall, the mass balance must be done on a dry basis to have a clear scheme of water loss during the process.
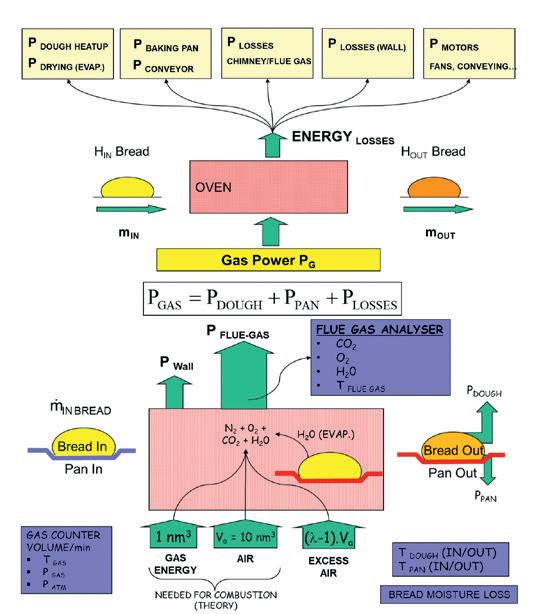
The gas energy counting requires a correction to obtain values of volumic flow rate in Normal cubic meters (at 0°C, Normal atmospheric pressure), in order to determine the gas power. A gas analyzer is needed to assess the excess air of the combustion; this is very important to assess the efficiency of the gas combustion. In the case of a direct oven, the moisture from the product is mixed with the moisture released by the combustion, making the situation very complex. A precise knowledge of the water loss of the product is the key to unravel such a situation. An alternative or complementary approach is to measure the air flow injected into the burner. The schemes below show all parameters to look at; this has to be done for each section of the baking oven.
In the case of freezing lines, the electrical energy is the main information to log in addition to moisture losses. However, a refrigeration unit is most of the time feeding several freezers in parallel, making the situation very often extremely complex. Mass flow rate measurement at each evaporator would then be needed to carry out a
© ONIRIS-GEPEA
Figure 7: Schematic representation of the information to consider to establish an energy balance for a baking oven (top). H is the enthalpy of the bread and should be considered ideally on a dry basis. Bottom, case of a baking oven with direct combustion. In such a case, the combustion fumes are mixed with the moisture losses from the bread. A precise knowledge of the moisture loss of the bread is needed to unravel the situation. Lambda is the excess air coefficient.
precise evaluation of the energy consumption in addition to pressure and temperature levels of the refrigeration fluid and parameters in the freezing area. The energy consumption of the fans is a crucial point since it can make up to 50% of the overall freezing energy in the case of bread freezing. The energy associated to the frosting of the evaporators can also represent a large share of the overall energy consumption; a precise knowledge of the moisture loss of the products is needed to unravel the situation in order to be able to establish a precise pie chart of the energy share. Once again, a balance done on a dry basis of product is of great support for the computations. Numbers can easily be converted on a humid basis of product entering the line once the computations are done.
Conclusion
This article illustrates, through various configurations, the importance of temperature measurement or measurement systems based on temperature difference measurements, such as flux meters. The measurement of air humidity is also discussed; this physical quantity is difficult to measure and is of great importance, both in cooking and in the case of freezing processes. The development of on-board systems should continue by integrating connected sensors offering real-time monitoring. In addition, at-line or in-line software sensor systems offer interesting solutions for the supervision of production lines and the detection of operating anomalies such as heat exchanger icing or a steam injection fault at the entrance to a baking oven. +++
Authors
Alain Le-Bail, Luc Guihard, Anthony Oge, Michel Havet, Jean-Yves Monteau, Olivier Rouaud, Cyril Toublanc
ONIRIS, Université de Nantes, CNRS, GEPEA, UMR 6144, F-44000 France
Contacts
alain.lebail@oniris-nantes.fr luc.guihard@oniris-nantes.fr anthony.oge@oniris-nantes.fr michel.havet@oniris-nantes.fr jean-yves.monteau@oniris-nantes.fr olivier.rouaud@oniris-nantes.fr cyril.toublanc@oniris-nantes.fr
References
Altamirano-Fortoul, R., A. Le-Bail, S. Chevallier and C.M. Rosell, (2012), Effect of the amount of steam during baking on bread crust features and water diffusion Journal of
Food Engineering, 2012, 108 (1), p. 128–134. Badri, D., Toublanc, C., Rouaud, O., Havet, M., (2021), Review on frosting, defrosting and frost management techniques in industrial food freezers Renewable and Sustainable
Energy Reviews 151 (2021) 111545 Chapleau, N., A. Le-Bail, M. Anon-De Lamballerie and M.
Vignolle, (2005), Application de la réglementation des produits surgelés à des produits hétérogènes (plats cuisinés). Revue Générale du Froid, 2005. 1053: p. 41-45. Dessev, T., V. Lalanne, J. Keramat, V. Jury, C. Prost, A. Le-Bail, (2020), Influence of Baking Conditions on Bread Characteristics and Acrylamide Concentration, J Food Sci Nutr
Res 2020; 3 (4): 291-310 DOI: 10.26502/jfsnr.2642-11000056 Gibeaud, A., O. Rouaud, A. Le Bail, R. De Pellegrin ‘Étude comparative des performances de deux tunnels de surgélation à l'azote liquide', Revue Générale du Froid & du conditionnement d'air, N° 1107, octobre 2010, pp 43-49. Le-Bail, A., T. Dessev, D. Leray, T. Lucas, S. Mariani, G. Mottollese and V. Jury (2011), Influence of the amount of steaming during baking on the kinetic of heating and on selected quality attributes of bread. Journal of Food
Engineering, 2011. Vol. 105 p. 379-385. Le-Bail, A., Procédés de congélation, de surgélation et procédés émergeants ; vers une évolution de la réglementation ?,
RGF – Revue Générale du Froid, Sept-Nov. 2017 MAP-1964, Gouvernement Français, Décret n° 64-949 du 9 septembre 1964 modifié portant application de l'article
L.214-1 du code de la consommation pour les produits surgelés. MAP-2011, NOTE DE SERVICE DGAL/SDSSA/N2011-8117 – Date: 23 mai 2011. Nouhin, M., Vandermeiren ,W., Le-Bail, A., (2020), CALLIFREEZE.
Inline measurement of the degree of freezing of food products, 6th IIR Conference on Sustainability and the
Cold Chain. April 15-17, 2020. Nantes, France, Manuscript
ID: 296887, DOI: 10.18462/iir.iccc.2020.2968 87


