14 minute read
The Effect of 125 Years of X-rays on Materials Science
Source: Dr Cameron Chai
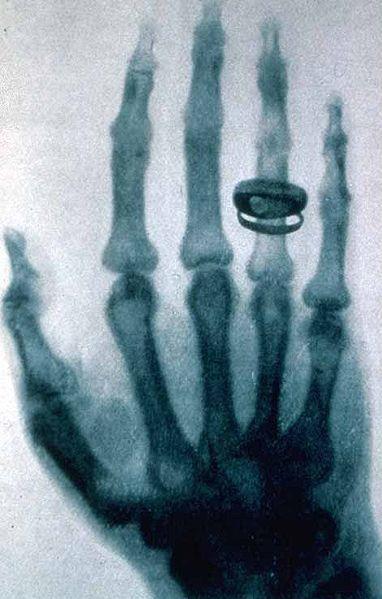
It has been 125 years since the German mechanical engineer and physicist Wilhelm Conrad Röntgen first discovered X-rays. From his first observations on November 8, to his first provisional communication submission, “On a New Kind of Rays”, on December 28, to his first public lecture and demonstration in January 1896, the path was extremely rapid. His discovery was so significant that, X-rays were being used in clinical applications as soon as February 1896.
Röntgen was awarded the first Nobel Prize for physics in 1901 for his discovery. Interestingly, he never patented anything to do with X-rays, preferring to make his discoveries freely available for the world to benefit from. He even donated the Nobel Prize money to the University of Würzburg where he worked. While X-rays had an immediate effect in the field of medicine, they have gone on to have a profound effect on the materials industry in both imaging and analysis. Now they are used in a wide variety of modes with instruments ranging from small handheld devices, all the way up to synchrotrons, which can be larger than a football field.
How X-rays are Generated
What is an X-ray
X-rays are a form of electromagnetic radiation just like visible light. With wavelength ranging from 10 picometres to 10 nanometres. This puts them between ultraviolet (UV) radiation at the lower end and gamma rays at the upper end. X-rays exhibit dual wave-particle characteristics. As a wave, X-rays exhibit diffraction phenomena and as a particle, they have energy inversely proportional to their wavelength.
Since Röntgen’s original observations using Crookes tubes, which were superseded by Coolidge’s more reliable hot cathode design developed in 1913, the way in which X-rays have been generated has remained fairly consistent. In these designs, electrons from a cathode are accelerated towards an anode or target using a high voltage. A characteristic X-ray is produced when the incident electrons dislodge electrons from the anode. When an electron falls from another shell to fill the vacancy, an X-ray is produced of a wavelength specific to the anode material. The process described above takes place inside in an evacuated glass tube, with all components being stationary. The process itself generates a lot of heat at the anode, where the electrons strike the anode. A variation on the stationary tube involves having a rotating anode, whereby the electrons effectively impinge upon a much greater area. This design, first commercialised in 1929, has been used to great success by Rigaku in their powder, thin-film, single crystal and protein crystallography XRD systems to generate high X-ray fluxes. There have also been a number of other X-ray source technologies developed in the last 20 years. The MetalJet is a variation on the conventional X-ray tube, except that it uses a jet of liquid metal e.g. gallium for the anode. The US company Tribogenics used the phenomenon of triboluminescence for their cartridgebased X-ray sources (~2007). Another US-based company, Sigray have pioneered a totally new concept. Known as FAAST™ or Fine Anode Array Source Technology. These microfocus x-ray sources feature an x-ray target comprised of fine metal microstructures encapsulated in a diamond substrate. This design is capable of producing a “higher brightness” X-ray source as the limitation on power density before the solid metal anode melts has been overcome.

All of these X-ray generation sources are suitable for use in a typical laboratory. At the other end of the scale is the MacDaddy of X-ray sources, the synchrotron. Synchrotrons can be as large as a football field. These annular-shaped facilities are capable of producing the most brilliant source of X-rays. While it is impossible to have a synchrotron in every facility, it is feasible to have a Lyncean Compact Light Source, effectively a room-sized synchrotron, which also produces a synchrotron beamline for home laboratory applications.
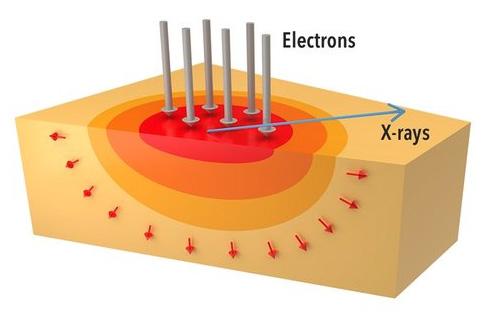
Heat distribution in a conventional X-ray target. Melting of the solid metal target limits power loading and source brightness.
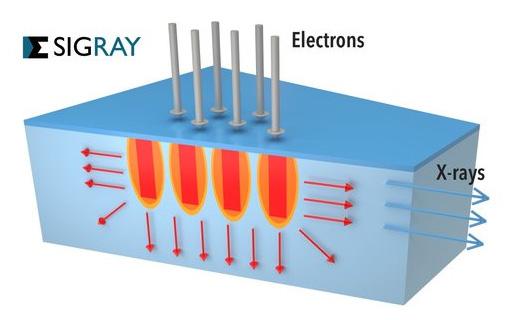
Heat distribution in the FAAST Microstructured Target. Small structures enable rapid thermal dissipation for higher power loading.
X-Ray Diffraction (XRD)
German physicist Max von Laue is credited for discovering X-rays are diffracted by crystalline materials. He first published his findings in 1912 and 2 years later received a Nobel Prize in Physics. His work also paved the way for the father and son team of Sir William and Sir Lawrence Bragg (born in Adelaide) to formulate Bragg’s Law (nλ=2d.sinθ) which relates
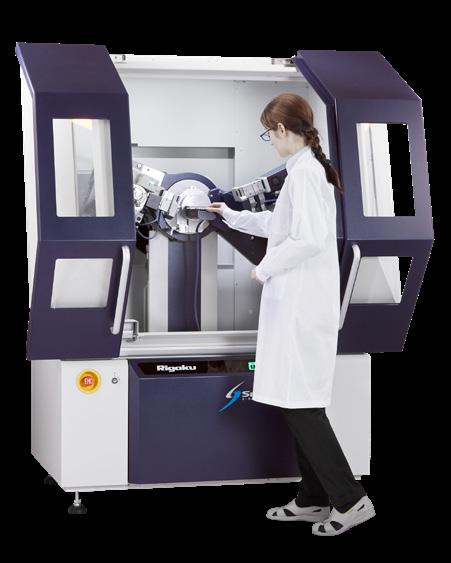
the wavelength of the X-rays (λ) and their angle of incidence (λ) to the distance between atomic layers (d) in a crystal, enabling them to solve the first crystal structure. XRD is now a universally used analytical technique in materials science for identifying the phases present in crystalline materials and can be used to determine the composition of unknown materials ranging from advanced materials to minerals and pharmaceuticals with every compound having unique crystal size. XRDs can be found in any university as well as many commercial testing labs. Systems range in size from small benchtop units to large floor standing systems. Despite their size, benchtop systems like the MiniFlex are still more than capable of producing publication quality data and are starting to be used more for teaching. Systems range in size from portable and benchtop through to high throughput floor standing systems with X-ray fluxes up to 9kW. 9kW X-ray sources produce more than 6 times more X-ray flux than more conventional sealed beam sources, which, while rated to 3kW, but normally operate at 1.6kW (40kV and 40mA). Benchtop and floors taking systems can be configured to perform a range of different experiments e.g. monitoring crystallographic changes at low or elevated temperatures, thin film analysis, analysis of battery materials, concurrently with DSC (Differential Scanning Calorimetry) and even residual stress measurements. One of the most significant developments in recent times for XRD is the development of HPC or Hybrid Photon Counting. These supersede the original 0D scintillation counters and 1D silicon strip detectors. These next generation semiconductor 2D detectors directly measure almost all photons generated by the sample. They are what is called an event driven device, which means they only count individual photons and do not accumulate noise. Combined with zero dead time and next to no noise, they are also much faster, making them the ideal partner for high-flux XRDs. Furthermore, when equipped with energy discrimination that prevents possible charge sharing between pixels, HPAD detectors produce the best quality data.
X-Ray Fluorescence (XRF)
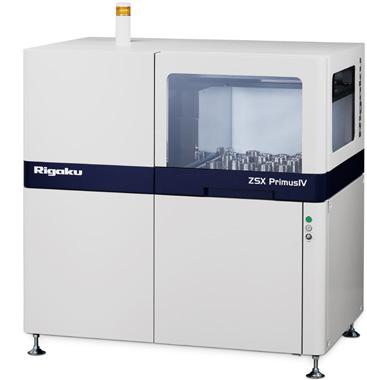
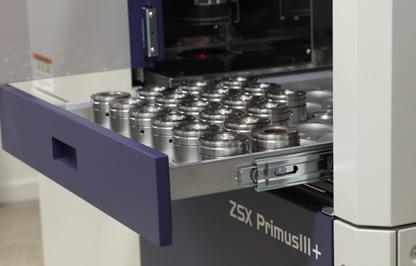
XRF analysis is based on Charles Barkla’s discovery that each element emits a characteristic spectrum of X-rays. This resulted in him being awarded a Nobel Prize in Physics 1917. Within XRF there are two variants, Energy Dispersive (EDXRF) and Wavelength Dispersive (WDXRF). The principle difference lies in WDXRF’s higher achievable spectral or energy resolution, making it the technique of choice where higher levels of accuracy are required. This does however come at the expense of speed, where EDXRF scans elements simultaneously and WDXRF sequentially (generally). Most WDXRF spectrometers are designed for high throughput with large sample loading trays to queue many samples. The main differences between systems from different manufacturers are tube below and tube above optical configurations, with the latter being beneficial for any application where dust or particles might fall off the sample and onto the detector (e.g. pressed powder samples) and the crystals used to disperse the fluorescence spectrum into individual wavelengths. XRF spectrometers come in a range of sizes. Small benchtop (EDXRF) systems are available, typically for quality control, while larger, high throughput floor standing (WDXRF) systems with large sample loading trays are also commonly found in university and commercial testing labs. The most notable development in recent times has been the miniaturisation of EDXRF’s resulting in portable or handheld XRFs, the first of which became available in 1994. Since this time many different companies have introduced systems. They have evolved over time, with advances in detectors, electronics and battery technologies, with systems now weighing less than 1.4kg and able to accurately identify materials in just a few seconds including aluminium alloys, matching them to large-onboard databases. The area where pXRFs have made the greatest impact is in PMI (Positive Materials Identification) where technicians can quickly identify alloys in the field, typically able to measure hundreds of samples in a shift if required, without the timeconsuming task of having to take a sample back to the lab. Furthermore, with the addition of a stand, portable XRFs can be used as an alternative to small benchtop systems. While mainly used for bulk analysis, some WDXRF systems do cater for XRF mapping or spot analysis which can be useful for analysis of inclusions or other inhomogenities. These systems generally only boast a resolution of the order of 0.5mm. There have emerged some dedicated micro-XRF systems. At the top end in terms of performance is the Sigray AttoMap which combines a high brightness X-ray source with a sub-12μm spot size,
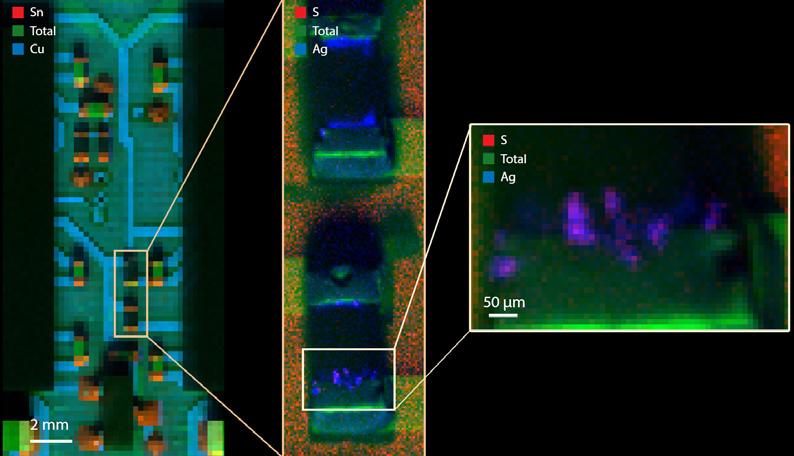
sub-femtogram sensitivity, high-speed scanning (as fast as 5ms/pt), the ability to cater for a range of sample sizes with additional X-ray microscopy capabilities. XRD and XRF are also highly complimentary techniques, with data from XRF able to be used to more accurately determine phase assemblage from XRD.
X-Ray Microanalysis
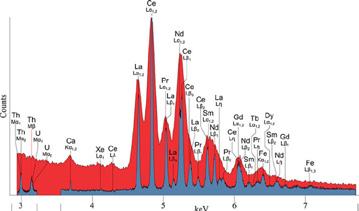
X-ray microanalysis differs from other techniques described in the article in that it does not involve irradiation by X-rays. Rather, it involves electron interactions with a sample within an electron microscope (EM) which themselves generate X-rays. Also, as the name suggest, analysis takes place at the micro level, enabling analysis of individual grains or features, while XRD and XRF are typically bulk analytical techniques. With X-ray emissions being unique to each element, techniques like Energy Dispersive Spectroscopy (EDS, also known as EDX, Energy-Dispersive X-ray analysis) and Wavelength-Dispersive Spectroscopy (WDS) are able to determine the chemical composition of materials, similar to XRF, with chemical data able to be correlated with images from the electron microscope. Similarly, EBSD (Electron Backscatter Electron Diffraction) produces data similar to XRD that can be related back to specific sites, as opposed to XRD which is also a bulk characterisation technique. EBSD data can also be correlated with EM images providing researchers with valuable microstructural information.
X-Ray Photoelectric Spectroscopy
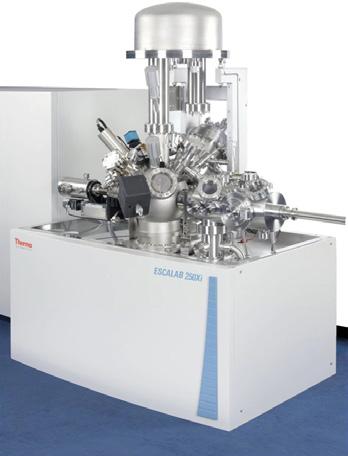
While some of the groundwork may have been laid beforehand (Heinrich Hertz 1887, Wilhem Rontgen 1895 and even Albert Einstein 1905), the Swedish physicist, Kai Siegbahn, has been credited for his work in developing the technique Electron Spectroscopy for Chemical Analysis (ESCA), now known as XPS. His contributions were recognised in 1981 with a Nobel Prize in Physics. With the increasing popularity of surface modification technologies and the need to know more about the areas that actually interact with their surroundings, i.e. the outermost surface of materials, surface science has grown in popularity. Aided by more user-friendly instruments, XPS has been the real winner, and it is the most broadly used surface characterisation technique today. Based on the photoelectric effect, XPS is a highly surface sensitive, powerful technique, able to determine elemental composition and chemical state. This enables the chemical structure to be deduced, while surface mapping is also possible, revealing changes in composition and concentration. Depth profiling is also possible. Using an ion source to etch away the surface, thin layers of material can be removed and XPS scans taken of the newly revealed surface. By repeating this process many times over, a 3D chemical analysis can be created. XPS data can be complemented by other techniques such as Ion Scattering Spectroscopy (ISS), Ultraviolet Photoelectron Spectroscopy (UPS), Reflected Electron Energy Loss Spectroscopy (REELS) and Raman to provide a more comprehensive surface analysis.
X-Ray Absorption Spectroscopy
X-ray Absorption Spectroscopy (XAS) probes how x-rays are absorbed from core electrons of atoms. As such it can reveal critical information on oxidation states, bond lengths and interatomic distances, electron symmetry and more. It incorporates X-ray Absorption NearEdge Spectroscopy (XANES) and Extended X-ray Absorption Fine Structure (EXAFS) Spectroscopy and had traditionally been restricted to the synchrotron. Recent developments in X-ray sources have seen laboratory systems materialise, with the Sigray QuantumLeap being the first system in the world capable if both XANES and EXAFS.
Radiography
Radiography is a Non-Destructive Testing (NDT) technique. While the first use of radiography in materials science is not clear, the technique has been in use for around 100 years. It works on exactly the same principal as medical X-rays, exposing the sample to an X-ray source and using X-ray film
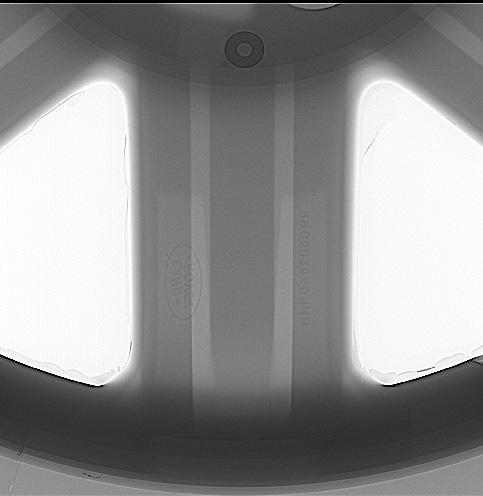
or a digital detector on the other side to capture an image. In doing so, the technician can see features beneath the surface that would otherwise be invisible. The primary differences to medical systems are the need for higher power sources and portability for in situ measurements. Higher power is required as X-ray attenuation is a function of density and depth, with most radiography being performed on steels and alloys. The main differences between radiographic generator sets, often called tube heads are the way in which they delivery X-rays and their area of effect. Some systems deliver X-rays in a series of pulses (pulse-powered), while others offer continuous bursts (constant potential). The latter results in shorter exposure times, but this usually comes at a higher initial cost. Tube heads are also directional (fire X-rays in only one direction from a point source) or panoramic (X-rays fired radially in a circle). Directional systems are the most commonly used for examining specific sites of interest, while panoramic systems are used to test pipelines with the tube head driven along the inside. The main applications of radiography in materials science are, weld assessment, quality control and asset management in industries such as oil and gas and aerospace where structures and components are checked for flaws, cracks, pores and other defects that could lead to failure.
Computed Tomography
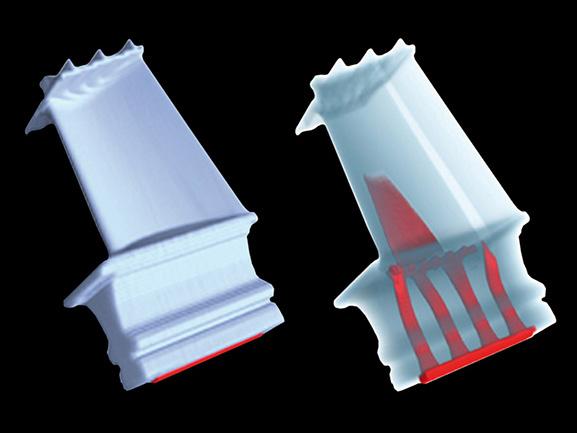
Computed Tomography (CT) is like the 3-dimensional extension of radiography and depending on its spatial resolution, can also be referred to as micro-CT or even nano-CT. Either way, this technique is analogous to medical CT. Also known as a CAT scan, CT was first introduced in 1972 for medical applications. The evolution of CT in the materials field initially used medical systems. Now, several companies manufacture CT systems for materials and NDT inspection applications. Aided by powerful software, it also has the ability to provide quantitative analysis of the microstructure based on density e.g. per cent porosity. X-ray microscopy (XRM) is a very similar technique that combines microscope technology that results in higher spatial resolution. The process involves taking many 2D scans from several angles and using complex algorithms to stitch them together to produce a 3D reconstruction. Sophisticated software packages allow users to rotate, disassemble and examine the reconstructions enabling them to see non-destructively deep beneath the surface. Examining structures in this way can reveal pores, cracks, voids and other defects, making CT an excellent technique for process refinement and quality control. The 3D non-destructive nature of the technique, with its ability to accurately visualise internal structures makes it suitable not just for quality control, but also metrology applications and even reverse engineering components. Driven by developments such as more powerful computers, faster detectors and better ways to quality check components, especially critical components produced by additive manufacturing, CT is becoming more and more widespread in the materials industry. Systems now range in size from small benchtop units, through to much larger systems suited for inspection of industrial-scale components. CT is possibly the most rapidly evolving technology in materials at the current time. Some very recent developments include: • 4D Tomography - Systems that combine high spatial and temporal resolutions capable of performing truly dynamic CT experiments with continuous scanning • Multimodal imaging - The ability to simultaneously acquire darkfield, quantitative phase and absorption imaging images that can be correlated if required, revealing defects and features that might otherwise remain invisible to traditional CT imaging approaches • Ultra-High Flux & Contrast - X-ray
Microscopy ideal for low contrast materials using dual target rotating anode sources and ultra-sensitive
X-ray optics deliver stunning results for biological samples in practical timeframes
• Highly Automated High kV CT - Systems operating up to 600kV, capable of imaging almost anything, while still providing micron-scale resolution for samples in the 1m range
Summary
The discovery of X-rays by Röntgen 125 years ago has most notably benefitted the field of medicine. However, stemming from his work, numerous significant discoveries have paved the way for X-ray-based analytical and imaging techniques that have had a significant and lasting effect on the materials industry. Even though many of these X-ray-based techniques have been around for many years, they still remain extremely relevant and new innovations and technologies see them continuing to evolve with some systems now being available in very small configurations, and in some cases, synchrotron-like performance is now available in the laboratory environment.
