7 minute read
4 Data collection and review


4.1 Water level and rainfall data
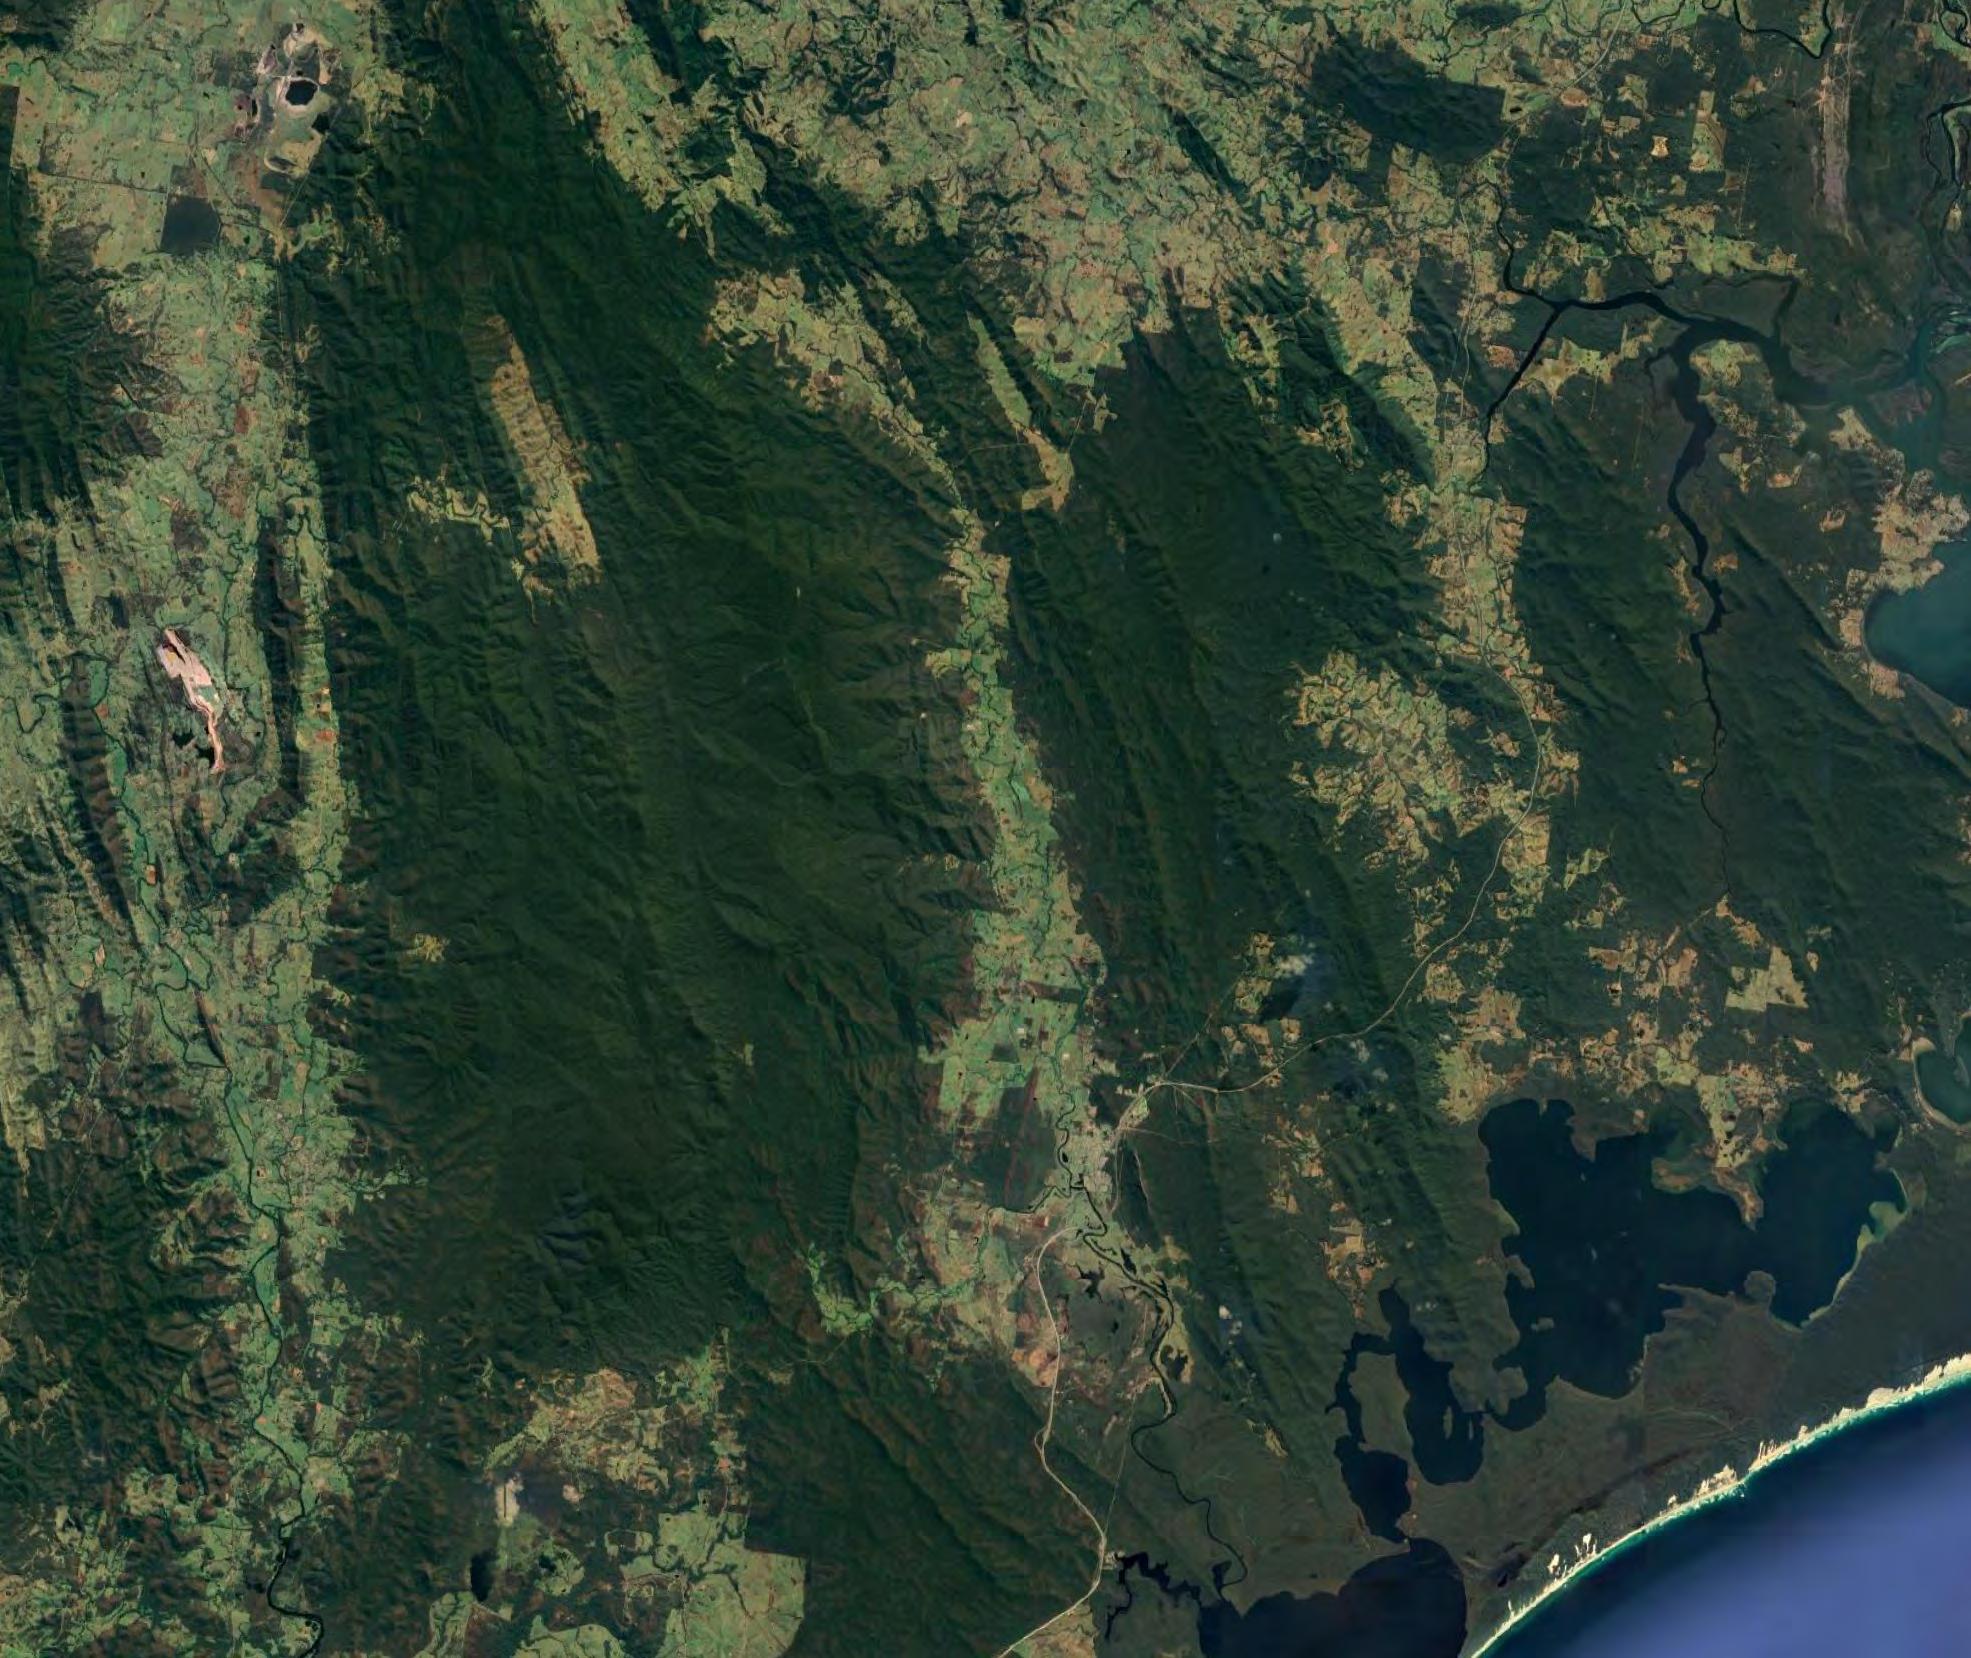
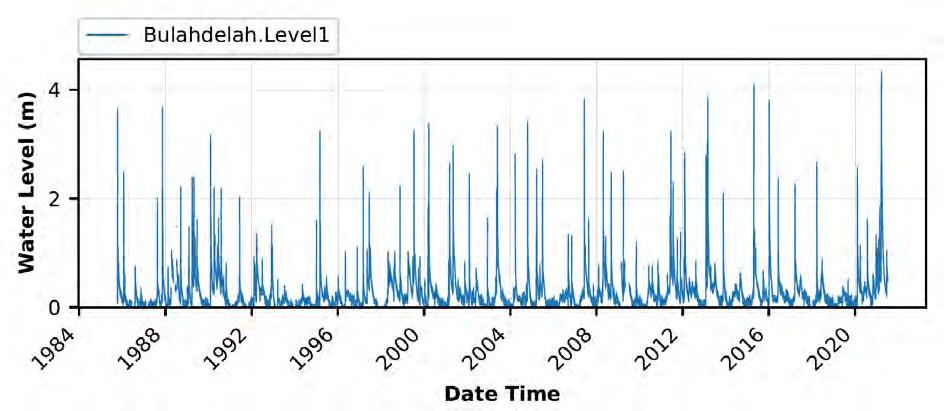
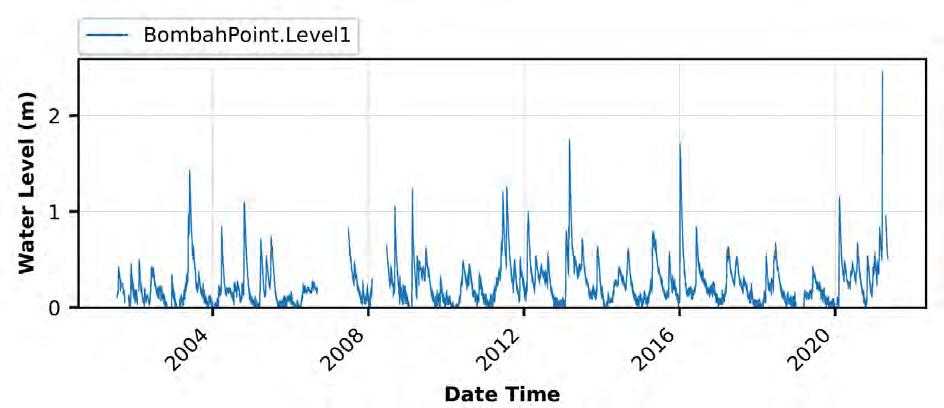
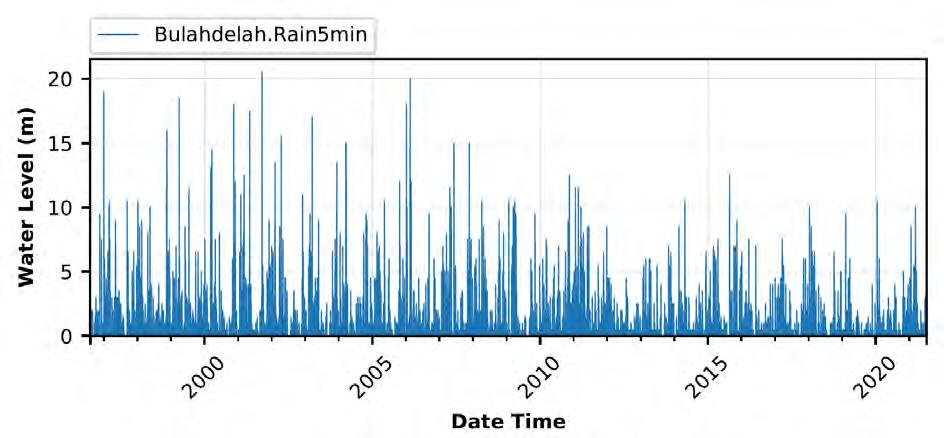
MHL manages a number of water level and near-real-time rainfall recording stations within or in the vicinity of the study area. These gauges are tabulated in Table 4.1 and their locations are illustrated in Figure 4.1. This figure also displays the locations of a number of points at which rainfall data were extracted from the radar data from TheWeatherChaser.com for the various calibration/validation events. The nearest daily rainfall monitoring locations are the gauges maintained by the Bureau of Meteorology (BoM) tabulated in Table 4.1 Recorded water level data at Bulahdelah and Bombah Point stations are presented in Figure 4.2 and Figure 4.3 Rainfall data is presented in Figure 4.4
© Crown 2021
Classification: Release by consent
4.2 Site inspection
A site inspection was carried out by the MHL project team on 1st of October 2020. The purpose of this inspection was to gain an overall appreciation of the relevant characteristics of the area and to identify areas that either contributed to flood risk or that were subject to the greatest flood risk. The site visit was undertaken with MidCoast Council Staff. A preliminary 1% AEP flooding event was run prior to the site inspection to understand the main flow paths within the study area. A number of pipes and culverts were then inspected along the main flow paths to determine if the size of the barrels as provided within the Council’s GIS layers was correct. Figure 4.5 presents the various locations that have been inspected during the site inspection. The majority of the culverts and pipes inspected appeared to be of a correct dimension but a number of discrepancies were observed as highlighted by the ten items numbered on Figure 4.5 and these discrepancies are listed below:
• No pipes were going down River Street (item 1), Myall Street (item 2) and Edgar Street (item 3) but instead there is a small dish drain.
• The pipe across Richmond Street near Edgar Street (item 4) appeared to be 450 mm instead of 375 mm.
• A small pipe across Richmond Street near Prince Street appeared to be 375 mm instead of 300 mm and another pipe across Prince Street near Richmond Street (item 5) was found to have two 900 mm cells instead of one.
• The culvert across Richmond Street halfwaybetween Prince Street and Alexandra Street (item 6) appeared to be 2 × 1250mm × 650 mm instead of 2 × 650mm × 375 mm.
• The culvert across Bulahdelah Way near Richmond Street (item 7) appeared to be a 3 × 1250 mm × 1250 mm instead of a single 375 mm pipe.
• The culvert across Bulahdelah Way halfway between Blanch and Stuart Streets (item 8) appeared to be a 2 × 1500 mm × 1250 mm instead of a single 375 mm pipe.
• The culvert across Bulahdelah Way near Rosewood Street (item 9) appeared to be 2400 mm × 900 mm instead of 2400 mm × 1200 mm.
Discussion with a few local community members highlighted some local flooding issues:
• Along Lee Street near the recently constructed roundabout with Stroud St.
• Along Jackson Street near Alexandra Street in the recent year possibly due to vegetation growing in the flow path.
Siteinspection
summary
Legend
Cadastre
Locationanddirectionof photographstakenduring siteinspection
MainFlowPaths
Pipes/CulvertsfromCouncil
ObservedDiscrepancy
ReportMHL2789
ReviewofBulahdelah
FloodplainRisk
ManagementStudy&Plan
4.3 Topographic data
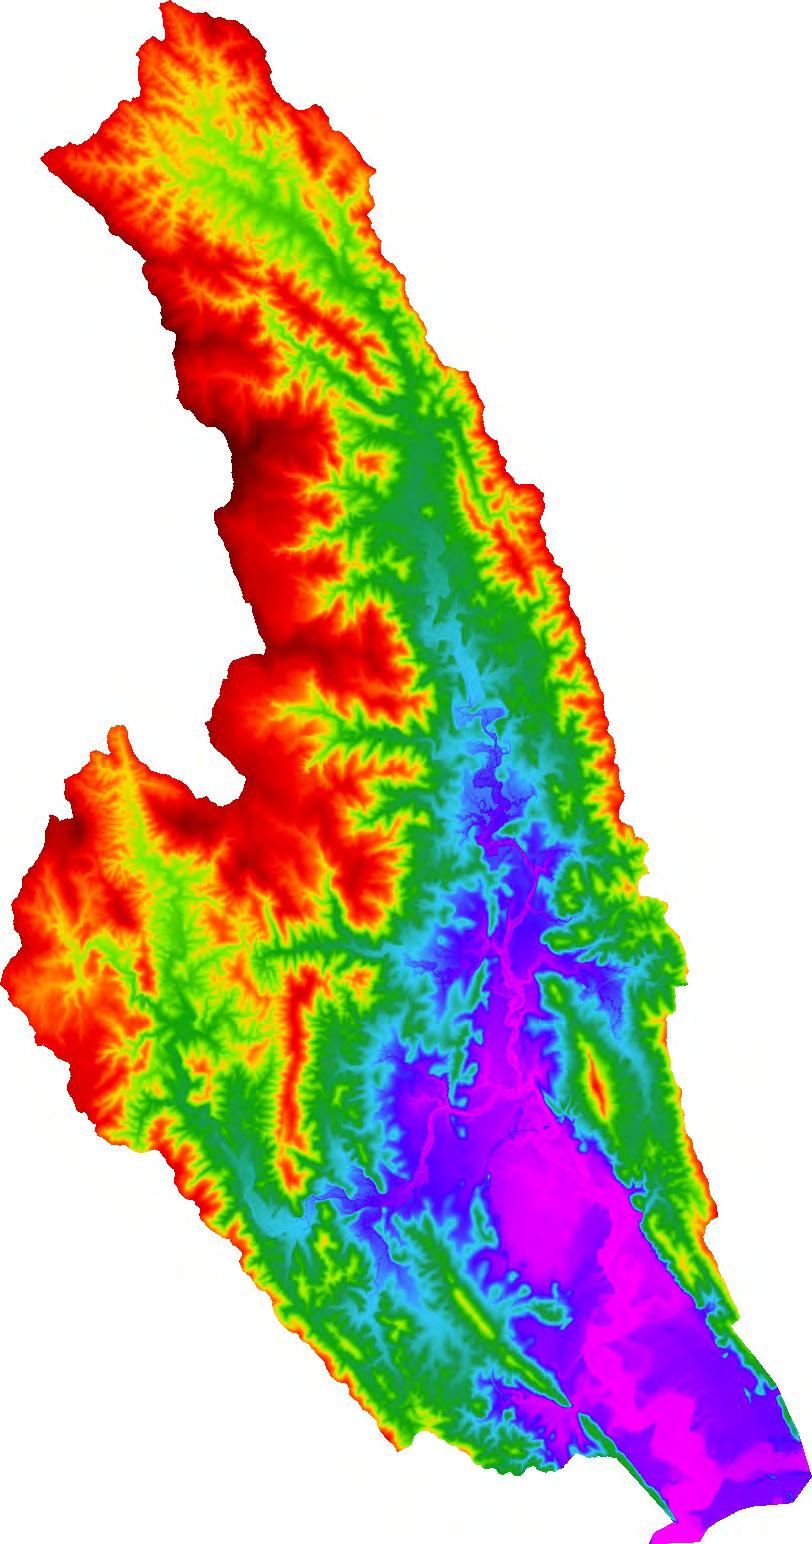
Light Detection and Ranging (LiDAR) survey of the study area and its immediate surroundings was obtained for the study from ELVIS (https://elevation.fsdf.org.au/). 1 m resolution LiDAR data from the ‘Bulahdelah’ dataset (NSW Spatial Services August 2012, June 2013, January 2016 and January 2018) was used in the present study. The accuracy of the ground information obtained from LiDAR survey can be adversely affected by the nature and density of vegetation, the presence of varying terrain, the vicinity of buildings and/or the presence of water. The horizontal accuracy of the data is 0.8 m at 95% confidence interval, while the vertical accuracy is 0.3 m at 95% confidence interval The terrain topography is illustrated in Figure 4.6
Nearly several hundreds of survey marks were available from the Survey Control Information Management System (SCIMS) database developed by the NSW Government’s Spatial Services. The elevations of the survey marks extracted from the SCIMS online database were used to check the accuracy of the LiDAR data. The numerous survey marks were sorted to remove:
• Survey marks that were either damaged or not found
• Survey marks that had no elevation or only had round number value as they appeared to have been rounded to the nearest ten (e.g. 10 m, 30 m, etc.)
• One outlier with over 30 m level difference
Details of the survey marks including name, coordinates, elevation from SCIMS database, elevation measured from LiDAR data and difference in levels are provided in Appendix A
The survey marks locations and difference between SCIMS and LiDAR elevation are also illustrated in Figure 4 6 It can be noted that the survey marks with the largest differences are typically outside of the Bulahdelah township and located along steep surfaces. The LiDAR appears therefore adequate for the study.
4.4 Aerial photography
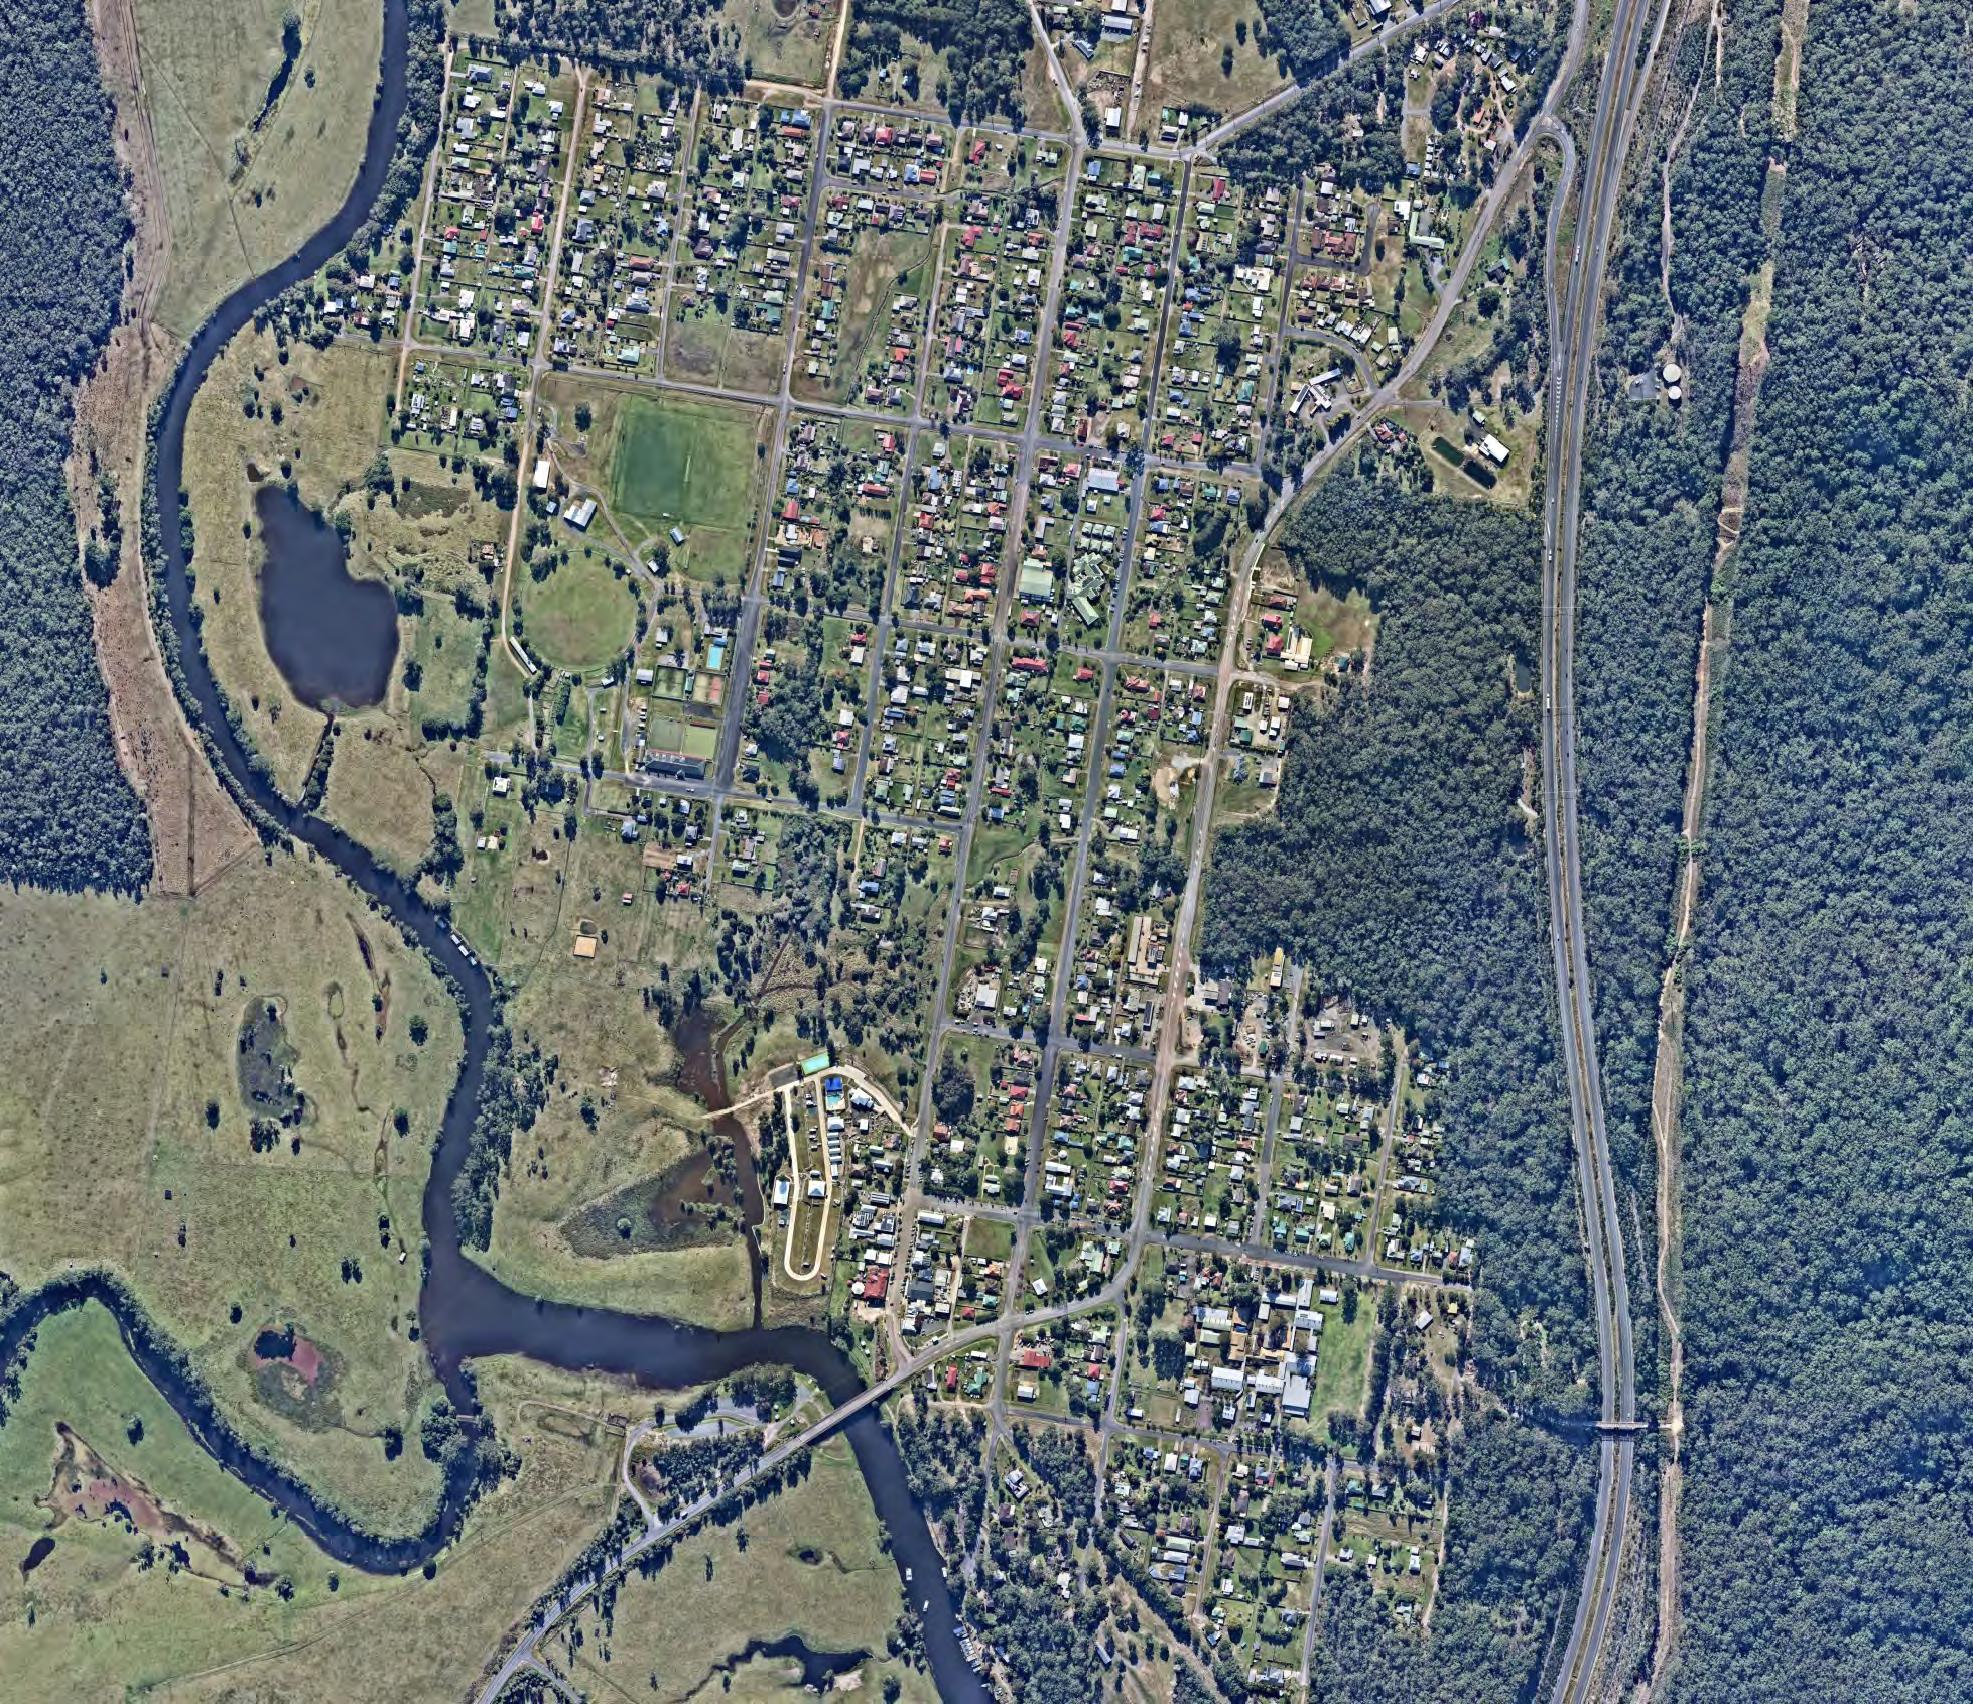
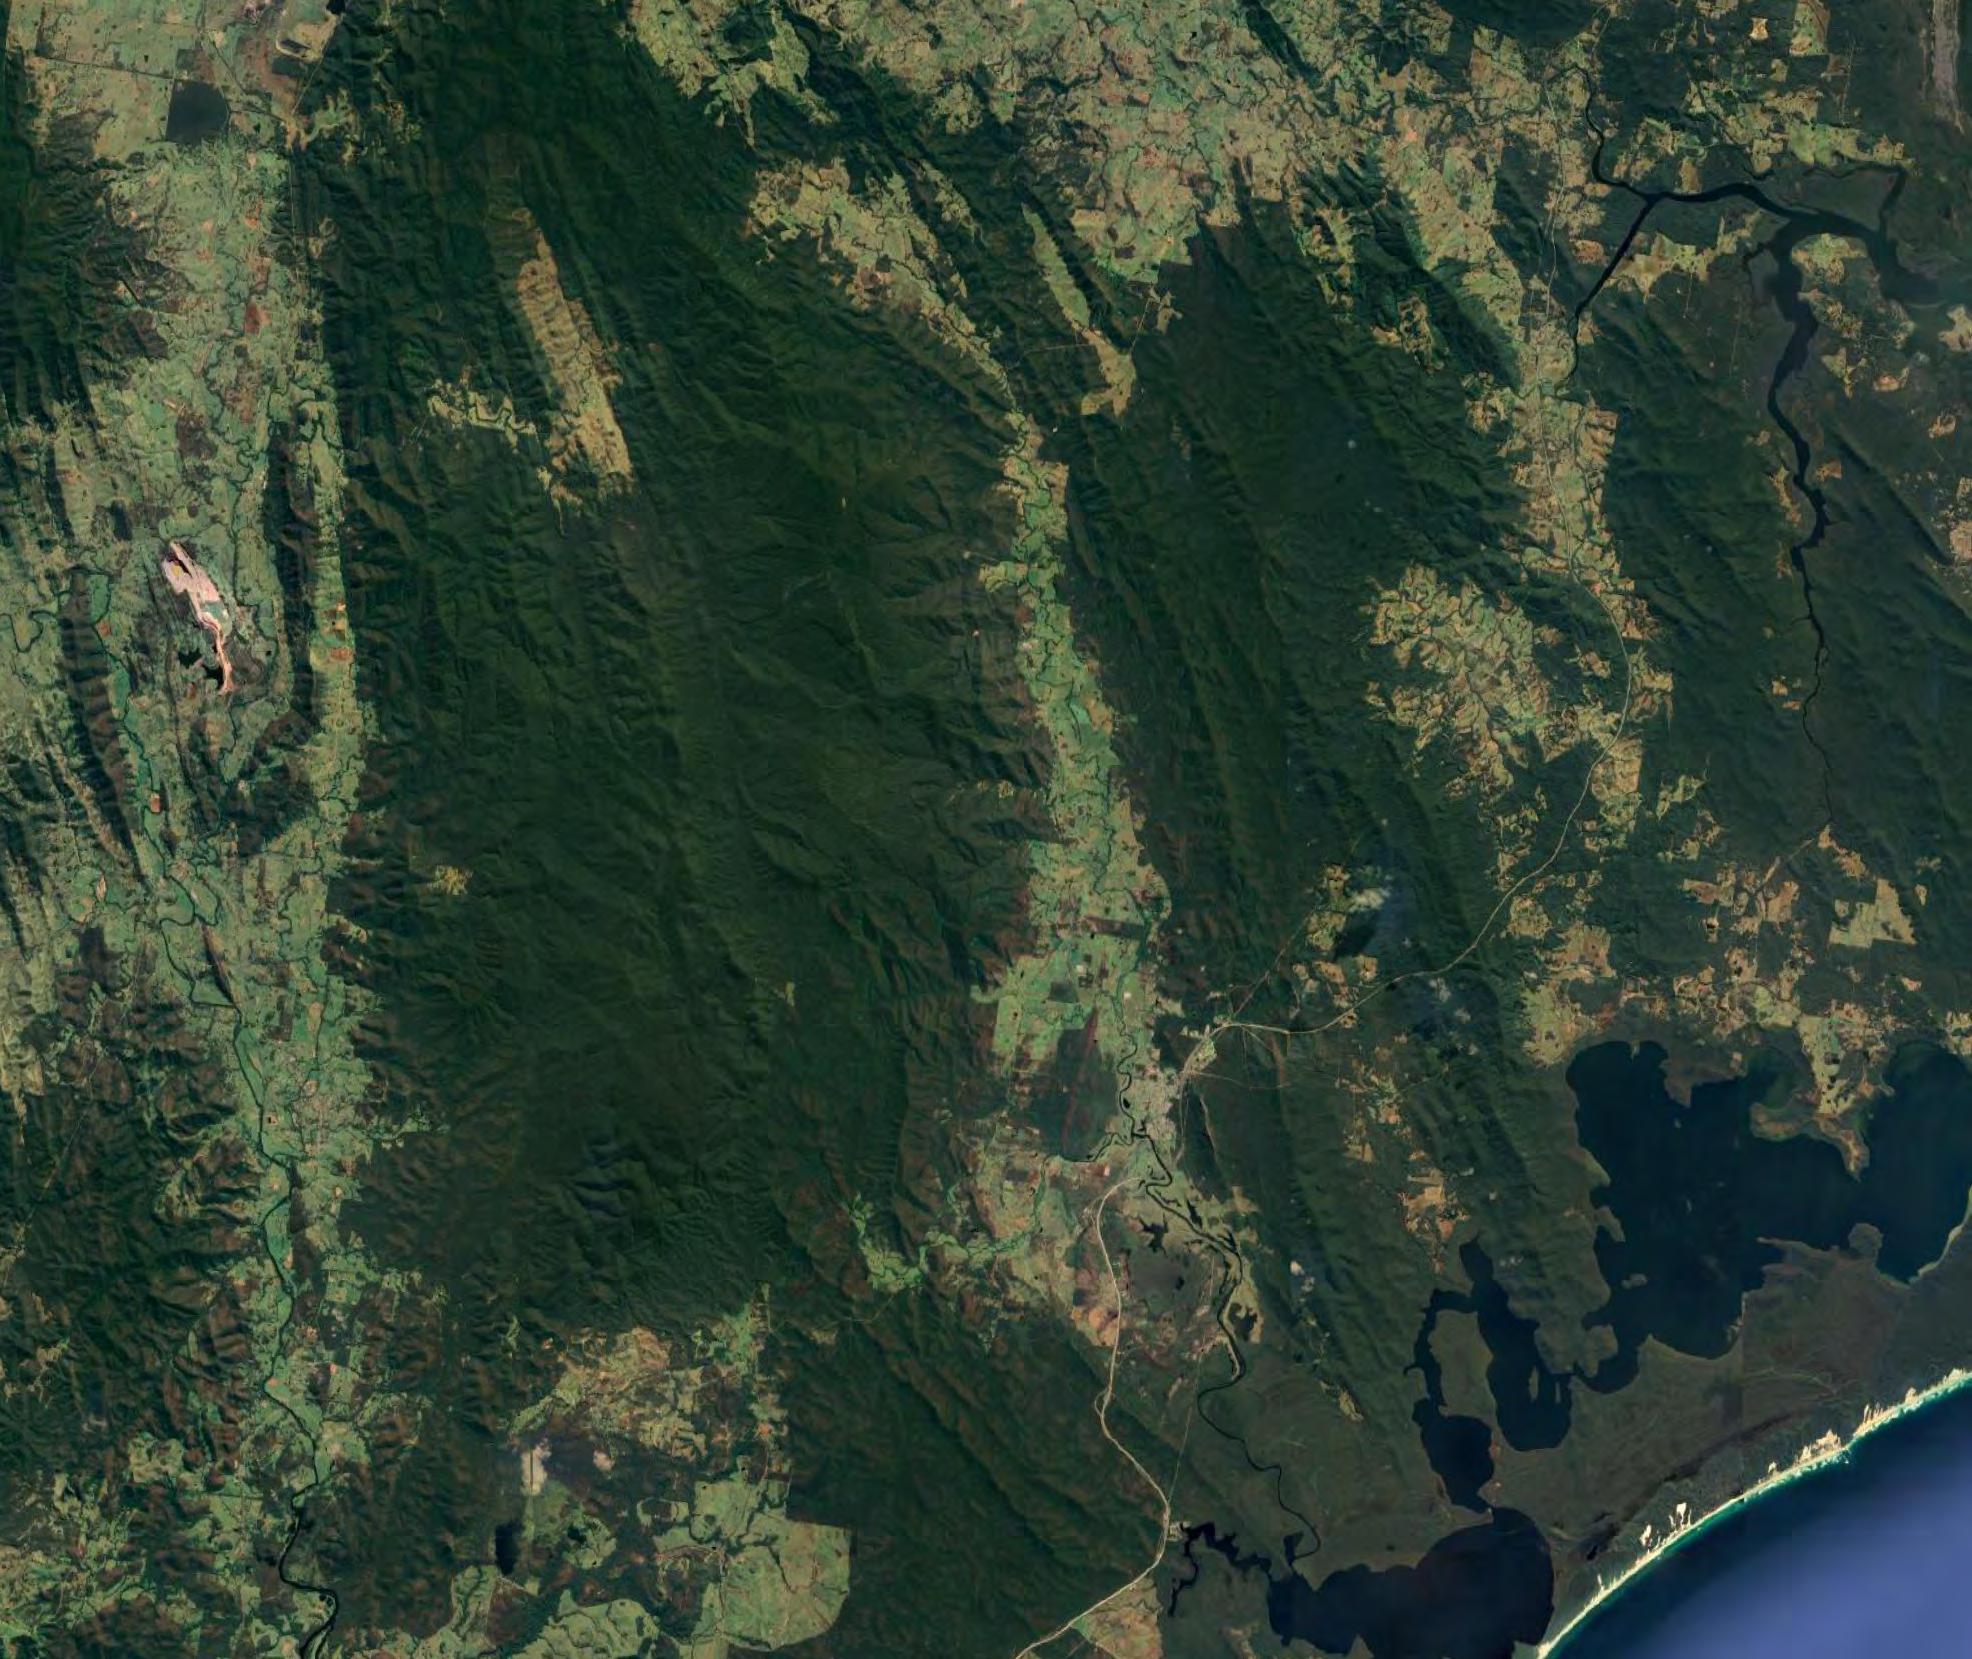
The most recent available aerial imagery was obtained from Google Earth (www.googleearth.com), captured in 2020 to observe current features within the study area. Some high resolution aerial imagery from 24 June 2020 was also available from Nearmap for the township of Bulahdelah.
4.5 Crawford River weir
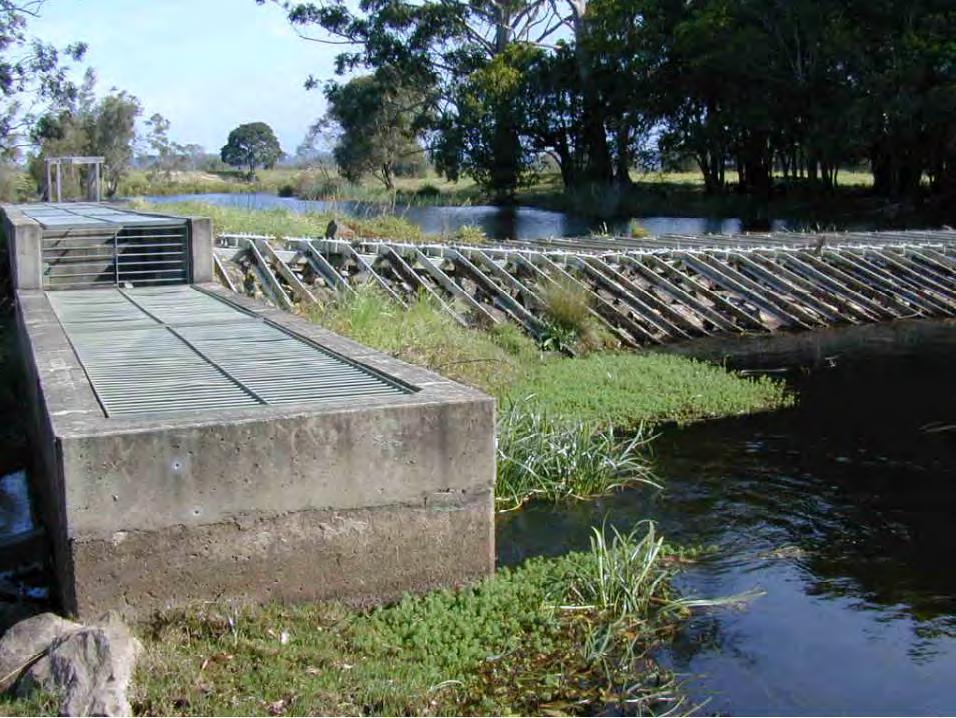
A small weir is located on the Crawford River approximately 75 m upstream from the junction with the Myall River. The weir is a sheetpile structure reinforced with rock-fill and steel bracing and was constructed in 1964. The structure includes a fishway and is part of Bulahdelah water supply system. The crest of this weir is at approximately 0.75 m AHD and is visible in the LiDAR data. Photographs of the weir and fishway are provided in Figure 4.7.
4.6 Bridges
Council’s bridges drawings and GIS layer provided as a single point along Markwell Road, Markwell Back Road, Wootton Way and Old Pacific Highway were reviewed for completeness and quality for flood modelling purposes. The provided data includes:
• Nan Syron Bridge drawing including deck and underside levels, length, width, railing height, location and width of piers.

• Battles Bridge drawing including deck and underside levels, length, width, railing height, location and width of piers.
• Frys Creek Bridge provided as a single point including approximate deck underside level, length, width.
• Markwell Back Road Bridge provided as a single point including approximate deck underside level, length, width.
• Wootton Way Bridge provided as a single point including approximate deck underside level, length, width.
MHL assumed the approximate deck underside level, length and width for the three doubleroad bridges along Pacific Highway based on the available topographic data and aerial photography.
4.7 Pits and pipe network
Council’s pit and pipe drawings were reviewed for completenessand quality for flood modelling purposes. The review identified some missing data required for modelling the storm-water network as follows:
• Pipe data including approximate locations and pipe sizing were available for the majority of the catchment.
• Minimum pipe size of 0.15 m was included in the hydraulic model located at the intersection of Crawford Street and Blanch Street, as well as at the intersection of Alexandra Street and Jackson Street.
• Information for several pipes was provided as a single point along Bombah Point Road, Markwell Rd, Markwell Back Rd, Suncrest Cl and Frys Creek Rd. Pipe alignment was therefore assumed and based on the available local topographic data.
• Pipesand culverts acrossPacific Highwayand Bulahdelah Way outside of the township were added to the model based on available Work-As-Executed drawings of the Bulahdelah Bypass developed by SMEC in November 2013 and from the Bulahdelah Upgrading the Pacific Highway Environmental Impact Statement Technical Paper 8 Water (RTA, 2004). A number of culverts were described as “Constructed by others” but the original dimensions from the drawing were assumed in the absence of further information. Only culverts and pipes crossing the highways were added to the model as they would have the largest impact on the flood modelling.
• Locations of pits were mostly available; however, invert level and pit sizing were not always present in the data provided.
MHL assumed a minimum cover depth of 100 mm to 700 mm for all provided pits using standard pipe grading as a guide to ensure hydraulic continuity. The inlets and outlets of the drainage system were checked to ensure that they are lining up with the available elevation data and aerial imagery (e.g. ensuring that headwalls are not located just outside of a dish drain).
All kerb-type pits were assumed to be 1800 mm wide and 200 mm high. A number of discrepancies in pipe sizes were highlighted during the site inspection as described in Section 4.2 The listed discrepancies were corrected prior to including the information into the flood model.
4.8 Floor level and post-event survey
MHL project team visited the Bulahdelah township between 30 March and 1 April 2021. This site inspection occurred after the 18-24 March large rainfall event that generated the largest water level recorded by the Bulahdelah gauge since its installation in late 1985. This site inspection had two main purposes:
• Measuring potential flood marks observed around the township
• Complete a visible survey of the floor level for the entire township of Bulahdelah
4.8.1 Post-event survey
A number of flood marks were measured during this site inspection including seven locations within Bulahdelah Township and one location upstream of Markwell Bridge. These flood marks were captured using a real-time kinematic GPS device (RTK) and are further discussed in the model calibration and validation section (Section 8.4).
4.8.2 Floor level survey
A total of 564 properties were surveyed for floor levels. The survey consisted of collecting the following information:
• Number of steps between the ground level and the floor level (assuming a 0.15 m step)
• Property type (e.g. residential, commercial, industrial, etc.)
• Construction type (e.g. slab-on-ground/low-set, high-set)
• Wall type (e.g. fibro, brick, timber, etc.)
• Number of storeys
• Photograph of the property
Results of the floor level survey are presented in Appendix B
4.8.3 Additional ground survey
During the same site visit, the project teams contacted the owner of the River Myall Holiday Resort and obtained permission to take a few survey points around the property to improve representation of the local topography into the hydraulic model since the existing LiDAR information was captured prior to the development of the property and changes in the local ground surface. These additional survey points were included into the model prior to running the design events.


