16 minute read
8 Model calibration and validation


8.1 Methodology
Model calibration is an essential step in the flood modelling process to confirm that the model can adequately simulate historical flood events. In order to carry out model calibration, it is necessary to have available suitable recorded data sets against which to evaluate model results. The selection of appropriate historical events for model calibration is, therefore, largely dependent on the availability of relevant flood data.
The most reliable recorded flood data available in the study area are the Bulahdelah and the Crawford River water level records. Although recorded depth and flow data are not available higher in the catchment, calibration against the Bulahdelah and Crawford River water level gauges would indicate that the overall model performance within the Myall River catchment is reliable, and provides confidence in the model parameters and data being adopted throughout the study area.
The Bulahdelah and Crawford River water level records, together with recorded rainfall data, therefore, act as the primary basis for model calibration, with anecdotal flood depth data collected through community consultation also utilised.
8.2 Event selection
Suitable historical calibration and validation events were determined through considering the following criteria:
• the availability of Bulahdelah and Crawford River water level and continuous rainfall data
• the historical significance of recorded rainfall;
• the influence of recorded rainfall on the Myall River water levels;
• the availability of flood depth data collected through community consultation; and
• the representation of the development in the catchment (i.e. events post-construction of the Bulahdelah Bypass were preferred).
A review of the available historical information highlighted the 1-4 March 2013 event as the most suitable event for model calibration because it was the second most significant rainfall event recorded since installation of the Bulahdelah water level gauge in 1985, it was postconstruction of the Bulahdelah Bypass, and the rainfall pattern appeared relatively consistent throughout the catchment
The 21-22 April 2015 event was selected for model validation as this was the most significant rainfall event with Bulahdelah water levels available at the commencement of the study (i.e. prior to the March 2021 event), that occurred after the construction of the Bulahdelah Bypass, and a number of photographs were provided by the community for this event.
Given that the 18-24 March 2021 flood event was the most recent event as it occurred during the development of the flood study and recorded the highest flood level captured by the Bulahdelah gauge since its installation in late 1985, this flood event was used as a secondary validation event.
8.3 Model calibration – 1 to 4 March 2013
8.3.1 1-4 March 2013 event
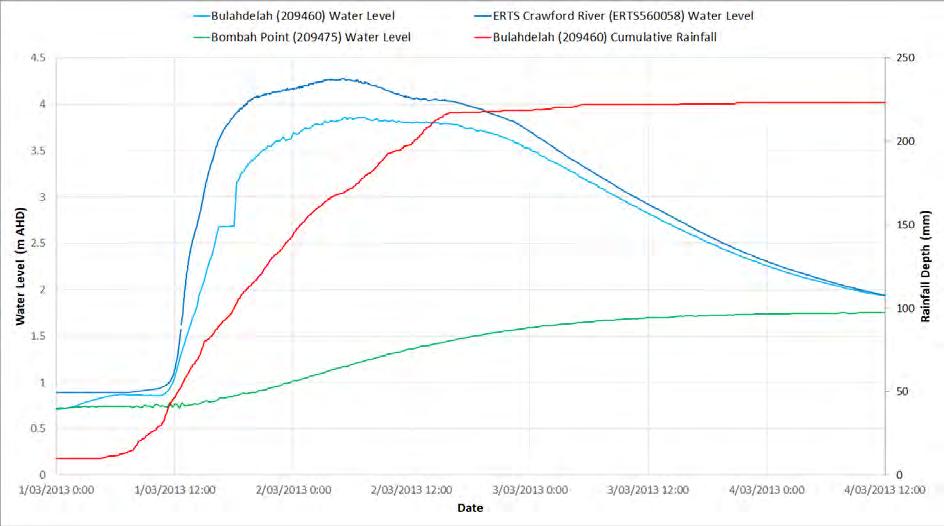
Rainfall in the study area on 1-4 March 2013 fell primarily over a duration of approximately 24 hours, with a relatively consistent rainfall intensity. This led to an elevated flood level above 3.5 m AHD in the Myall River and at Bulahdelah lasting for over a day. A time-series plot of water level and rainfall data recorded during the event is presented in Figure 8.1.
8.3.2 Rainfall data
Only the Bulahdelah continuous rainfall gauge was active within the study area on 1-4 March 2013. However, a number of neighbouring daily gauges were available around Bulahdelah including the Crawford River and The Cabbage Tree Mountain gauges. These daily gauges showed very similar total rainfall depth during the event and the Bulahdelah Rainfall pattern was therefore adopted for the entire catchment The Crawford River rain gauge was represented by scaling the total daily rainfall measured during this event at this gauge using the Bulahdelah gauge rainfall pattern
Rainfall data converted from radar data was obtained from TheWeatherChaser.com, however, a significant portion of the rainfall event was missing from the radar data and this information was therefore not usable for this event.
8.3.3 Intensity-Frequency-Duration analysis
In order to provide relative context to the intensity of the 1-4 March 2013 rainfall event, the maximum rainfall depth recorded over a given duration has been compared with design Intensity-Frequency-Duration (IFD) data for Bulahdelah, as shown in Figure 8.2.
Based on the Bulahdelah gauge, the 1-4 March 2013 event was found to represent an event equivalent to a 10-20% AEP design rainfall for durations of 30 to 36 hours
8.2 IFD Comparison 1-4 March 2013

8.3.4 Rainfall loss parameters
The translation of rainfall into runoff is directly influenced by the antecedent soil moisture conditions throughout the catchment. Rainfall losses are applied in hydrologic modelling to represent the amount of rainfall that does not contribute to runoff, primarily as a result of infiltration processes. The initial loss-continuing loss approach is widely accepted and was adopted in this study.
It should be noted that the initial loss-continuing loss model has been developed for use in traditional hydrologic models, which do not consider losses associated with topographic features, for example depression storage. The direct rainfall approach used in this study applies rainfall directly to each model cell and generally results in initial losses associated with small ‘pits’ in the DEM. Research has shown that such losses can be of the same order as traditionally adopted initial loss values (Taaffe et al. 2011).
There have been regular small rainfall events prior to this event and initial losses of 0 mm were applied in the WBNM and TUFLOW model for this event. A continuing loss value of 0.5mm/hr was adopted for pervious areas as previously used in the Lower Myall River and Myall Lake Flood Study It is noted that a 2.5 mm/hr continuing loss was previously used in the past Bulahdelah flood study, however this value appeared to be underestimating the peak of the flood. No losses were applied to impervious or permanently wet areas.
8.3.5 Upstream boundary condition
The flows resulting from the WBNM for the wider catchment were applied at key locations at the upstream end of the TUFLOW model as described in Section 7.2.4.
8.3.6 Downstream boundary condition
The Bombah Point water level gauge recorded data was used as downstream boundary condition for this event.
8.3.7 Rain radar observations
Newcastle rainfall radarobservationsasobtained from TheWeatherChaser.com website which provides access to the Bureau of Meteorology rain radar archives are summarised in
Appendix E. This website allows the extraction of marker intensity timeseries at selected locations as illustrated in Figure E.1 and the progression of the rainfall radar at regular (1hour) intervals as shown in Figure E.4 The marker intensity timeseries present the rainfall intensity between two dates in a colour bar format. The markers were extracted at three locations: the Bulahdelah Bridge Gauge (BBG), in the Upper Myall River Catchment (UMR) and in the Upper Crawford Catchment (UCR) The three markers were aligned to compare the intensity over time at the three locations. It is noted that the Bulahdelah Bridge gauge is slightly more intense at the start of the storm and less intense at the end of the storm when compared to the Upper Crawford River catchment. The Upper Myall Catchment is not severely impacted by this storm.
8.3.8 Model calibration results
A comparison of recorded and simulated water levels at the Bulahdelah and Crawford River gauges for the 1-4 March 2013 event is shown in Figure 8.3. A strong correlation between simulated and recorded water levels has been achieved in terms of:
• Peak water levels at Bulahdelah gauge – peak flood levels show a fair agreement for this event. The modelled level at peak is within 0.08 m of the maximum recorded level.
• Peak water levels at Crawford River gauge – peak flood levels show a good agreement for this event. The modelled level at peak is within 0.03m of the maximum recorded level.
• Catchment runoff response – the relative timing of the recorded and simulated water levels also shows a strong agreement on the rising limb of the flood. The slight difference in the falling-limb may be related to the Bulahdelah temporal pattern being the only temporal pattern available and being applied for the entire catchment. This can be seen on the marker intensity timeseries in Figure E.1 in Appendix E The Bulahdelah Bridge marker shows a more intense rainfall at the start of the storm and less intense at the end of the storm in comparison to the Upper Crawford River marker. This explains the slightly peakier hydrograph and faster tailing limb, and why the modelled Crawford River gauge responds slightly faster at the start of the storm.
The results of the 1-4 March 2013 event provide confidence in the ability of the developed TUFLOW model to simulate actual catchment flood behaviour.


8.4 Model validation – 21 to 22 April 2015
8.4.1 21-22 April 2015 event
The rainfall leading to flooding in Bulahdelah on 21-22 April 2015 fell primarily over a duration of 3 to 6 hours, leading to a relatively short spike in water level in the Myall River. A time-series plot of water level and rainfall data recorded during the event is presented in Figure 8.8.


8.4.2 Rainfall data
Only the Bulahdelah continuous rainfall gauge was active within the study area on 21-22 April 2015. However, a number of neighbouring daily gauges were available around Bulahdelah including the Crawford River, Wootton and the Cabbage Tree Mountain gauges. These three gauges were applied the same temporal pattern as Bulahdelah and used as input for the modelling to consider the spatial distribution of the rainfall event. Cumulative rainfalls recorded at these gauges for the event (based on the total daily rainfall and the Bulahdelah Rainfall gauge temporal pattern) are shown in Figure 8.9.
Differences are evident in the rainfall records at each site. While these differences are likely to be the result of real spatial rainfall variability, it is notable that the Crawford River gauge recorded higher totals during the validation rainfall event. The majority of recorded rainfall fell over a period of approximately 6 hours from 18:00 on 20 April 2015 to 0:00 on 21 April 2015.
Rainfall data were extracted from the radar data and obtained from TheWeatherChaser.com at 10 locations around the catchment illustrated in Figure 4 1. This data was compared to the available rainfall data captured at the various gauges around the catchment It was found that while the actual rainfall depth extracted from the radar wasmuch lower than the recorded value at the gauges within the catchment, the general temporal pattern was fairly consistent with the recorded data. Therefore, the data from the variouspoints wasused to provide a local temporal pattern, and the rainfall depth was scaled based on the Bulahdelah gauge. This rainfall data was then adopted for modelling of this validation event as it provided a better resolution of the temporal pattern over such a large catchment.
8.4.3 Intensity-Frequency-Duration analysis
In order to provide relative context to the intensity of the April 2015 rainfall event, the maximum rainfall depth recorded over a given duration has been compared with design IntensityFrequency-Duration (IFD) data for Bulahdelah, as shown in Figure 8.10

Figure 8 6 IFD Comparison 21-22 April 2015
Based on the Bulahdelah gauge, the 21-22 April 2015 event was found to represent an event equivalent to a 10 to 20% AEP design rainfall for durations of 180 to 360 minutes. It is noted however that the daily rainfall measured at Crawford River gauge was about 2.5 times the depth of rainfall as Bulahdelah recorded on the same day and the AEP of this event is, therefore, likely to be greater.
8.4.4 Rainfall loss parameters
As shown in Figure 8.9, between 100 mm and 260 mm of rain had fallen over the study area in approximately 12 hours leading to the event. Considering the dry antecedent conditions and the heavily vegetated upstream catchment, a 20 mm initial loss was applied in the TUFLOW model for this event. A continuing loss value of 0.5 mm/hr was adopted for pervious areas as per the March 2013 flood event. No losses were applied to impervious or permanently wet areas (i.e. road, concrete channel, creek and estuary zones).
8.4.5 Upstream boundary condition
The flows resulting from the WBNM for the wider catchment were applied at key locations at the upstream end of the TUFLOW model as described in Section 7.2.4.
8.4.6 Downstream boundary condition
The Bombah Point water level gauge recorded data was used as downstream boundary condition for the validation event.
8.4.7 Rain radar observations
Newcastle rainfall radarobservationsasobtained from TheWeatherChaser.com website which provides access to the Bureau of Meteorology rain radar archives are summarised in Appendix E. This website allows the extraction of marker intensity timeseries at selected locations as illustrated in Figure E.2 and the progression of the rainfall radar at regular (30minute) intervals as shown in Figure E.5. The marker intensity timeseries present the rainfall intensity between two dates in a colour bar format. The markers were extracted at three locations: the Bulahdelah Bridge Gauge (BBG), in the Upper Myall River Catchment (UMR) and in the Upper Crawford Catchment (UCR). The three markers were aligned to compare the intensity over time at the three locations. It can be observed that the Bulahdelah Bridge gauge was subject to a front loaded storm while the Upper Crawford River catchment is subject to a back loaded storm.
8.4.8 Model validation results Comparison with Recorded Water Level
A comparison of recorded and simulated water levels at the Bulahdelah and Crawford River gauges for the 21-22 April 2015 event is shown in Figure 8.7. This figure also presents the tailwater boundary condition calculated at the downstream end of the model. A strong correlation between simulated and recorded water levels has been achieved in terms of:
• Peak water levels at Bulahdelah gauge – peak flood levels show a fair agreement for this event. The modelled level at peak is within 0.13 m of the maximum recorded level.
• Peak water levels at the Crawford River gauge – peak flood levels show a relatively poor agreement for this event. The modelled level at peak is about 0.33 m lower than the maximum recorded level. This difference in peak is due to the limited rainfall data available across such a large catchment aswellas limited bathymetric information along the Crawford River
• Catchment runoff response – the relative timing and behaviour of the recorded and simulated water levels as well as the overall volume also show a general agreement on both the rising limb and the falling limb of the flood for both the Bulahdelah and the Crawford River gauges
The results of the 21-22 April 2015 event therefore provide confidence in the ability of the developed TUFLOW model to simulate actual catchment flood behaviour at Bulahdelah.
Comparison with flood photographs of the event
A number of photographs of the April 2015 flood event were provided highlighting flooding in Bulahdelah and the results of the calibration were compared to these photographs. The comparison is provided in Table E.1 of Appendix E. The model appears to reasonably represent the flowpaths and inundation extents highlighted by the provided photographs.


8.5 Model validation – 18 to 24 March 2021
8.5.1 18-24 March 2021 event
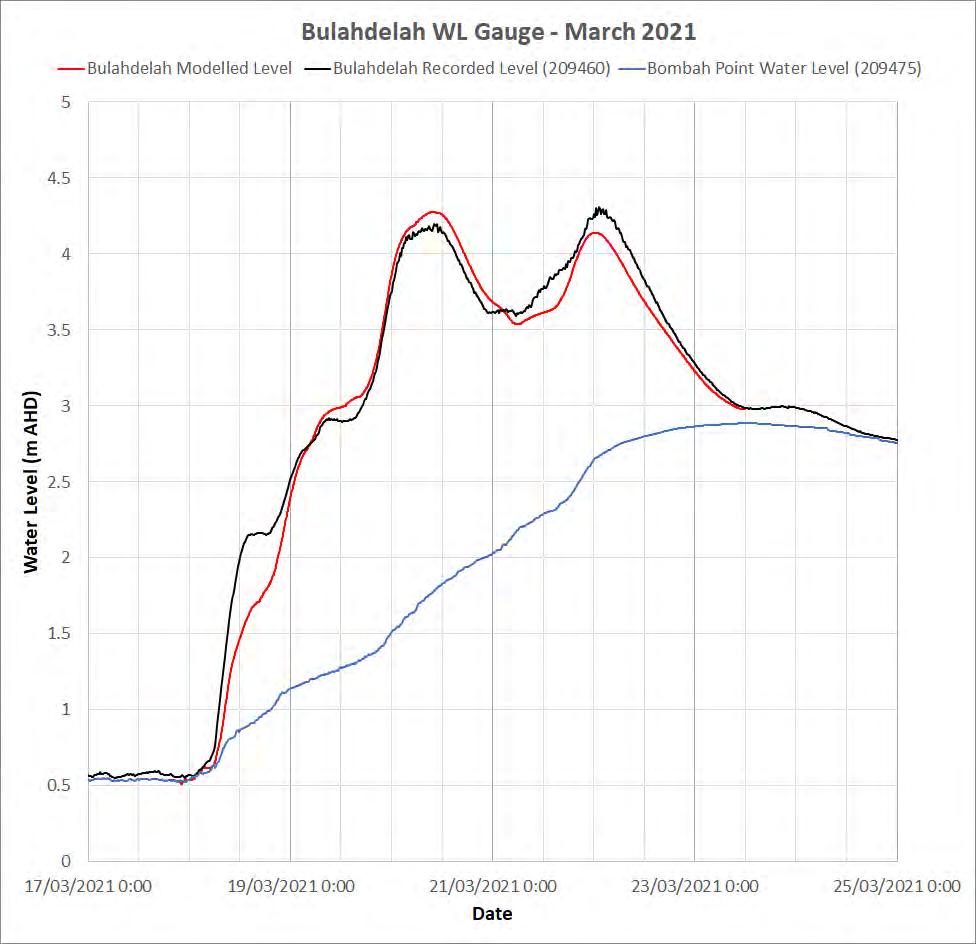
The rainfall leading to flooding in Bulahdelah on 18-24 March 2021 fell primarily over a duration of 4 days, leading to the largest water level recorded by the Bulahdelah gauge since its installation on the Myall River in 1985. A time-series plot of water level and rainfall data recorded during the event is presented in Figure 8.8 It can be noted that the event includes two peaks: a first peak occurred in the morning of Saturday 20 March and a second peak of similar amplitude occurred in the middle of the night from Sunday to Monday 21-22 March.

Event Time-Series
N.B.:ItisnotedthatBombahPointgaugewasfloodedduringthiseventanddatabetween6pmon21/3/2021and8pm on24/03/2021wereestimatedbasedontheavailabledataandtherecordedpeaklevelof2.89mAHD
8.5.2 Rainfall data
Only the Bulahdelah and Markwell continuous rainfall gauges were active within the study area on 18-24 March 2021. However, a number of neighbouring daily gauges were available around Bulahdelah including the Crawford River and the Cabbage Tree Mountain gauges.
Rainfall data was extracted from the radar data and obtained from TheWeatherChaser.com at 10 locations around the catchment illustrated in Figure 4.1. This data was compared to the available rainfall data captured at the various gauges around the catchment. It was found that while the actual rainfall depth extracted from the radar wasmuch lower than the recorded value at the gauges within the catchment, the general temporal pattern was fairly consistent with the recorded data. Therefore, the data from the various points were used to provide a local temporalpattern and the rainfall depth wasscaledbased on the Bulahdelah gauge. This rainfall data was then adopted for modelling of this validation event as it provided a good resolution of the temporal pattern over such a large catchment.
Cumulative rainfall recorded at these gauges for the event (based on the total daily rainfall and scaling of the rainfall radar information) is shown in Figure 8.9
Differences are evident in the rainfall records at each site. While these differences are likely to be the result of real spatial rainfall variability, it is notable that the Cabbage Tree Mountain gauge recorded higher totals during this rainfall event.
The majority of recorded rainfall fell between 18 March and 22 March 2021.
8.5.3
Intensity-Frequency-Duration analysis
In order to provide relative context to the intensity of the March 2021 rainfall event, the maximum rainfall depth recorded over a given duration has been compared with design Intensity-Frequency-Duration (IFD) data for Bulahdelah, as shown in Figure 8 10
Based on the Bulahdelah gauge, the 18-24 March 2021 event was found to represent an event larger than a 5% AEP design rainfall for durations of 4 to 7 days, and about 20% for the critical duration of the catchment of 18 hours. It is noted however that the daily rainfall measured at the Cabbage Tree Mountain gauge was about 2.5 times the depth of rainfall as Bulahdelah recorded on the same day; the AEP of this event is,therefore, likely to be greater. Furthermore, the very long duration led to significant flooding of the Bombah Broadwater, which reached a level of 2.89 m AHD and contributed to some backwater effect at Bulahdelah.


8.5.4
Rainfall loss parameters
As shown in Figure 8.9, between 420 and 770 mm of rain had fallen over the study area in approximately 4 days leading to the event. Considering the wet antecedent conditions, a 0 mm initial loss was applied in the TUFLOW model for this event. A continuing loss value of 0.5 mm/hr was adopted for pervious areas. No losses were applied to impervious or permanently wet areas (i.e. road, concrete channel, creek and estuary zones).
8.5.5
Upstream boundary condition
The flows resulting from the WBNM for the wider catchment upstream of the TUFLOW model were applied at key locations at the upstream end of the TUFLOW model as described in Section 7.2.4
8.5.6 Downstream boundary condition
The Bombah Point water level gauge recorded data was used as downstream boundary condition for the validation event. It is noted that the Bombah Point gauge was flooded during this event and data between 6 pm on 21/3/2021 and 8 pm on 24/03/2021 were estimated based on the available data and the recorded peak level of 2.89 m AHD.
8.5.7
Rain radar observations
Newcastle rainfall radarobservationsasobtained from TheWeatherChaser.com website which provides access to the Bureau of Meteorology rain radar archives are summarised in Appendix E. This website allows the extraction of marker intensity timeseries at selected locations as illustrated in Figure E.3 and the progression of the rainfall radar at regular (2hour) interval as shown in Figure E.6. The marker intensity timeseries present the rainfall intensity between two dates in a colour bar format. The markers were extracted at three locations: Bulahdelah Bridge Gauge (BBG), in the Upper Myall River Catchment (UMR) and in the Upper Crawford Catchment (UCR). The three were aligned to compare the intensity over time at the three locations. It can be observed that some parts of the catchment are impacted at different times and the rainfall can sometimes fall on localised parts of the catchment (e.g. upstream only or downstream only)
8.5.8 Model validation results Comparison with Recorded Water Level
A comparison of recorded and simulated water levels at the Bulahdelah and Crawford River gauges for the 18-24 March 2021 event is shown in Figure 8.7. A fair correlation between simulated and recorded water levels has been achieved in terms of:
• Peak water levels at Bulahdelah gauge – peak flood levels show a fair agreement for this event. The modelled level at peak is approximately 0.08 m lower and 0.17 m higher than the recorded levels for the first and second peaks respectively
• Peak water levels at the Crawford River gauge – peak flood levels show a relatively poor agreement for this event. The modelled level at peak is about 0.27-0.30 m lower than the maximum recorded level for the two peaks This difference in peak is due to the limited rainfall data available across such a large catchment as well as limited bathymetric information along the Crawford River
• Catchment runoff response – the relative timing of the recorded and simulated water levels also shows a fair agreement in the overall volume and the behaviour of the storm
The results of the 18-24 March 2021 event therefore provide further confidence in the ability of the developed TUFLOW model to simulate actual catchment flood behaviour at Bulahdelah. Comparison with flood mark levels measured following the event
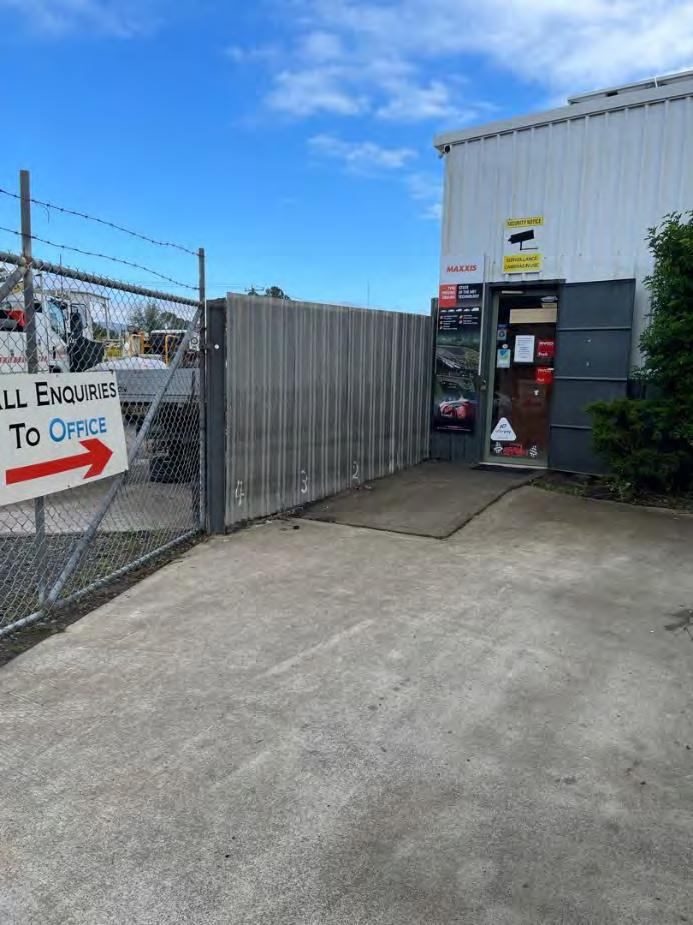
A number of flood marks were collected by MHL’s project team following the flood event. The results of the calibration were compared to the levels measured during the site visit. The comparison is provided in Figure E.7 of Appendix E. The model appears to reasonably represent the peak flood levels measured around Bulahdelah with level differences ranging between 0.04 and 0.23 m There are some larger differences near Markwell Bridge with difference of about 0.35-0.44 m.It is noted that while some of the flood marks in the Bulahdelah township showed clear lines along fences highlighting the peak flood level (Figure 8.12a&b), other flood marks where estimated based on visible stains and debris and may have a lower level of accuracy (Figure 8 12c&d).


8.6 Discussion of Model Calibration and Validation
Despite some differences in observed and simulated peak water levels, the developed TUFLOW flood model appears to have performed reasonably well. This is supported by good comparisons between simulated and recorded water levels for both the calibration and validation events at Bulahdelah and Crawford River water level gauges, and agreement on catchment runoff response shown by flow hydrographs computed by TUFLOW and WBNM.
Some discrepancies between simulated and recorded water levels in Crawford River appear to be related primarily to limited availability of accurate rainfall information to determine the rainfall distribution over such a large catchment area. However, the use of rain radar information allowed the model to reproduce an overall good match in shape and volume of the various flood events and reasonable results were obtained when comparing the results to available flood marks and flood photographs.
To further assess the sensitivity of the flows from the Crawford catchment, additional model runs were undertaken by increasing the 5% AEP and 1% AEP flows from the Crawford catchment by 30%. It was found that this increase in flow generated an increase in flood level of approximately 0.11 m and 0.19 m at Bulahdelah and 0.21 m and 0.23 m at the Crawford gauge for the 5% AEP and 1% AEP, respectively. This is within the 500mm freeboard used for future planning purposes
Based on the results of the calibration and validation events, the model was therefore considered appropriate for the flood modelling.


