Paz no trânsito começa por você.

EntregaValor + + Volkswagen Caminhões
para o seu negócio.
Acesse nosso QR Code e conheça a Linha de Caminhões que entrega mais valor para o seu negócio.
Volkswagen Caminhões e Ônibus @vwcaminhoes
Volkswagen Caminhões e Ônibus
+ + + +
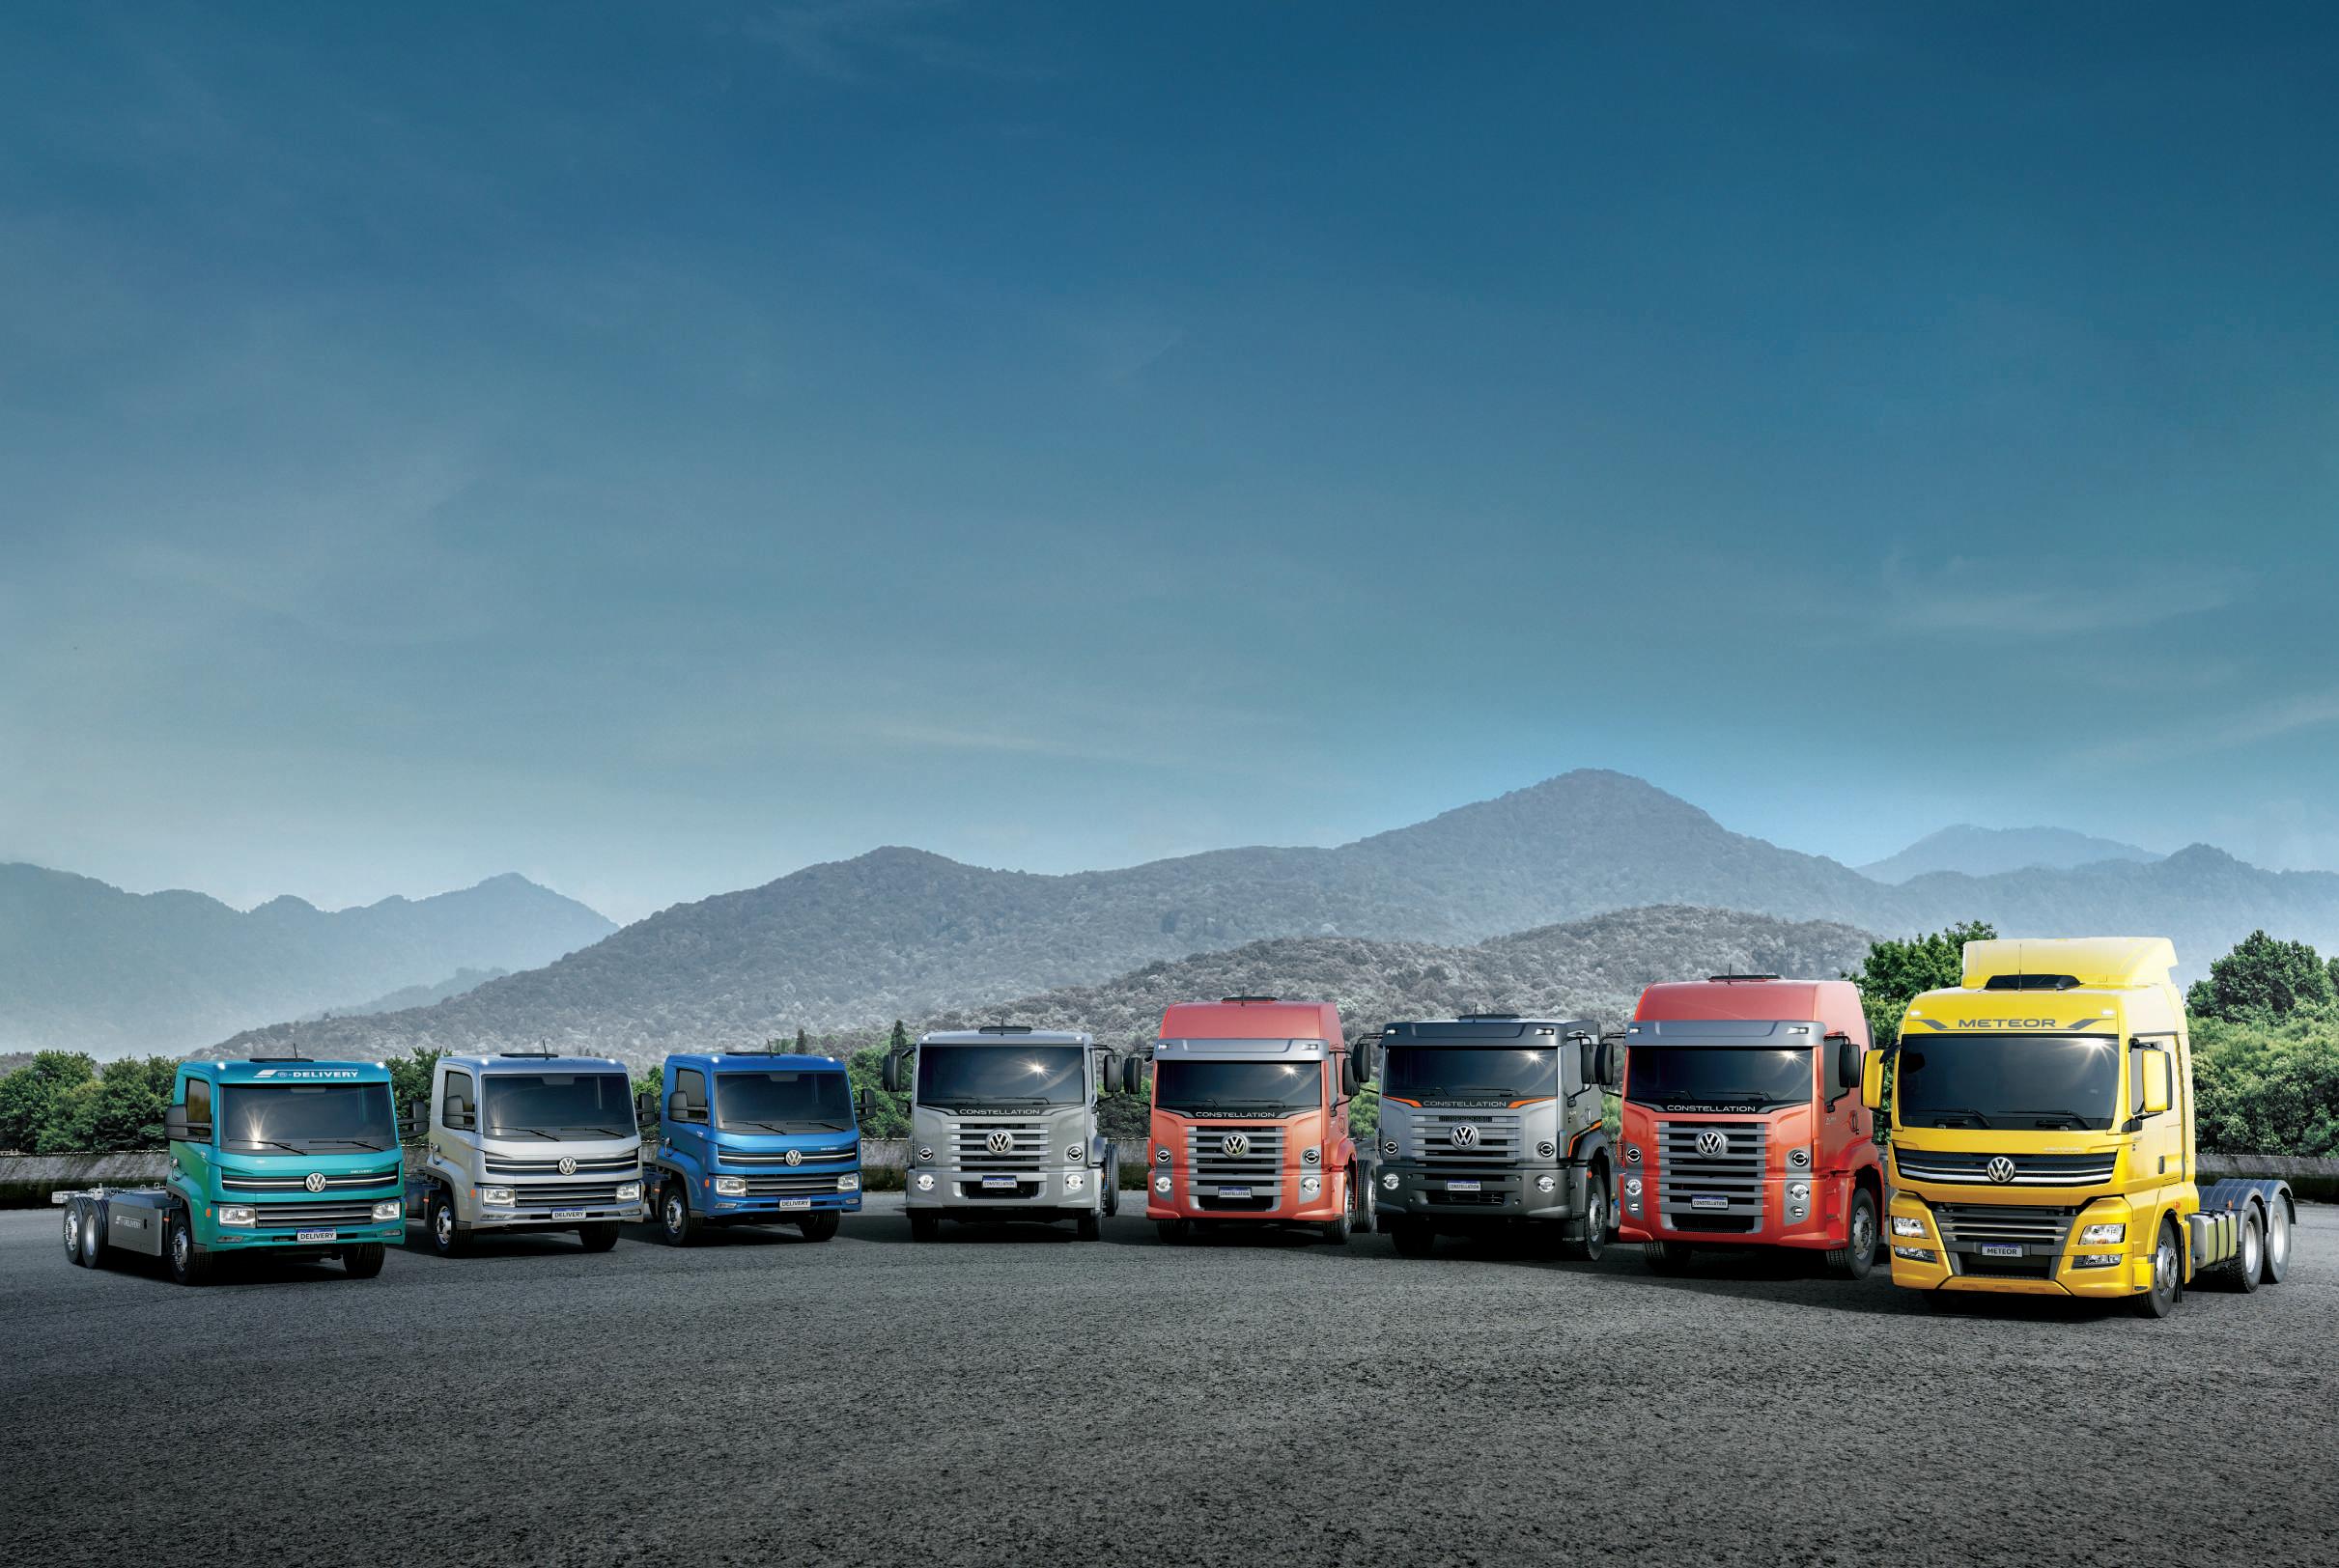
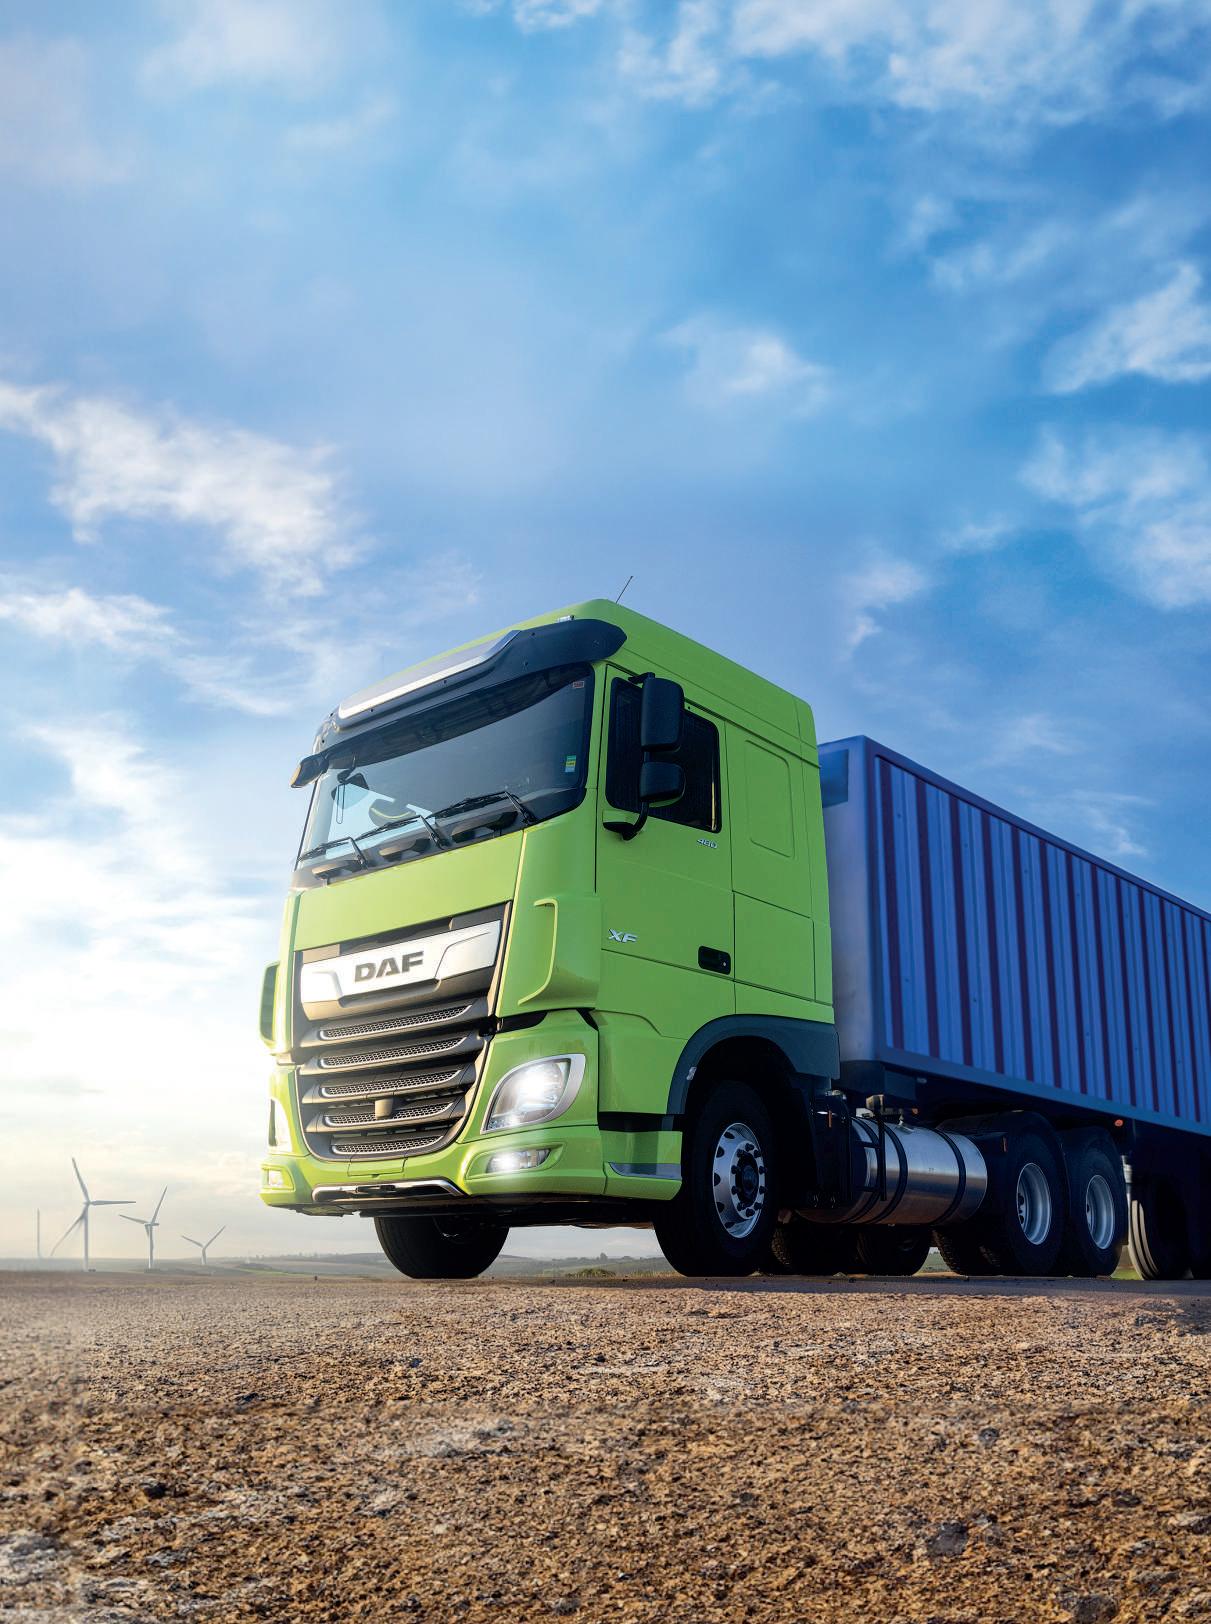
O que você espera de um caminhão? Que ele faça mais entregas, certo? Até descobrir que ele pode ir além, que ele pode entregar ainda mais. É por isso que um Caminhão Volkswagen Euro 6 não é um caminhão qualquer: só ele é sob medida e só ele entrega mais.
Entrega mais eficiência, com novos motores mais potentes e com até 8% de redução no consumo. Ou seja, melhora seu custo operacional e entrega mais lucratividade para o seu negócio.
Entrega mais conforto, oferecendo cabines com excelente espaço interno, banco de couro sintético premium e ar-condicionado de série.
Entrega mais segurança, prioridade da Volkswagen Caminhões e Ônibus, em que todos os modelos vêm com assistente de partida em rampa automático, controle de tração e controle de estabilidade de série. Porque nosso compromisso é entregar segurança no seu dia a dia.
E entrega mais tecnologia. Os novos modelos possuem um moderno painel de instrumentos, com mais de 70 funções, que auxiliam o motorista em uma condução mais econômica, indicando o melhor momento para troca de marcha. Além disso, você conta com a conectividade RIO para melhor gestão da sua frota e com nova identidade visual: os caminhões trazem luz de condução diurna em LED. Tudo para melhorar a performance e o rendimento.
Percebeu? Quanto mais nosso caminhão entrega, mais entregas você faz e mais sua empresa cresce. Mais que carregar, levar e transportar cargas, isso é agregar valor ao seu negócio.
Volkswagen Caminhões e Ônibus.
Sob medida para conectar você ao futuro e entregar mais valor no presente.

Diretoria da ANFAVEA/SINFAVEA - 2022/2025
ANFAVEA/SINFAVEA Board of Directors - 2022/2025
2024
Presidente
Márcio de Lima Leite
Vice-Presidente Tesoureira
Gleide Mércia Souza Patrizi
Vice-Presidentes
Adriano Leite de Barros
Alexandre Bernardes de Miranda
Alexandre Parker Machado
Ana Helena Correa de Andrade
Andrea Zámolyi Park
Antonio Sérgio Martins Mello
Dirlei Dias
Edson Ares Sixto Martins
Eduardo Freitas
Fabio Rua
Fernando Flórido
Fernando Mallmann
Francisco Nelson Satkunas
Jeferson Olivete Biaggi
Diretor Executivo
Igor Calvet
Diretor de Relações Governamentais
Mauro Borges de Castro


ASSOCIAÇÃO NACIONAL DOS FABRICANTES DE VEÍCULOS AUTOMOTORES
ANUÁRIO DA INDÚSTRIA AUTOMOBILÍSTICA BRASILEIRA
Brazilian Automotive Industry Yearbook
1º Vice-Presidente
Gustavo Rodrigo Bonini
Vice-Presidente Secretário
Antônio Cândido Prataviera Calcagnotto
João Alecrim Pereira
João Irineu Medeiros
Luiz Carlos Moraes
Luiz Henrique Maia Bezerra
Luiz Ricardo de Medeiros Santiago
Marcelo de Oliveira Elias
Marco Saltini
Marcus Vinicius Aguiar
Otávio Mizikami
Rafael Ceconello
Ricardo Augusto Martins
Roberto Mario Martini
Roberto Matarazzo Braun
Ulisses Lyrio Chaves
Diretor
Aurélio Santana
Diretor de Comunicação
André Jalonetsky
Diretor Técnico
Henry Joseph Junior
Diretor Adjunto
Vinicius Rena Pereira
2 | Anuário da Indústria Automobilística Brasileira | Brazilian Automotive Industry Yearbook | 2024
www.anfavea.com.br anfavea anfavea @anfavea_oficial
Liolgar Costa Presidente da Rodeiro Transportes


Estou com a Volvo rumo ao Zero Acidentes.
O Zero Acidentes é um ideal de futuro da Volvo. Para isso, além de alta tecnologia de segurança nos caminhões, é importante uma gestão de transportes focada em mapear e diminuir riscos na operação. Faça como a Rodeiro Transportes: abrace essa causa e junte-se a nós nessa jornada.
volvo.com.br
Paz no trânsito começa por você.
Indústria automobilística brasileira
Brazilian automotive industry

Empresas - Companies
Autoveículos e máquinas agrícolas e rodoviárias / Companies of vehicles and agricultural and highway machinery Fabricantes / Manufactures
Autopeças (empresas associadas ao Sindipeças - dezembro 2023) Autoparts (associated companies Sindipeças - december 2023) 491
Concessionárias de autoveículos (2023) Car dealerships (2023) 4.122
Concessionárias de máquinas agrícolas e rodoviárias (2020) Dealers of agricultural and road machinery (2020) 964


Comércio exterior 2023
International business - 2023
(Inclui autopeças / Autoparts are included)
Exportação / Exports

Fábricas Factories
/

Emprego - 2020
Employment - 2020
Direto + indireto / Direct + indirect 1,2 milhão de pessoas million people

Capacidade instalada de produção
Production capacity
Autoveículos / Vehicles 4,5 milhões / million
Máquinas agrícolas e rodoviárias (2018)
Agricultural and highway machinery (2018) .......... 125 mil / thousand


Participação no PIB* - 2019
Participation at gross internal product - 2019
Indústria de transformação / Industry of transformation ......... 20%

Autoveículos
Geração de tributos diretos 2022
Vehicles - Direct tax generation 2022
(IPI, PIS/COFINS, ICMS, IPVA) R$ 93 bilhões / billion

Produção acumulada
Autoveículos / Vechicles 1957 - 2023
milhões (montados) million (assembled)
Máquinas agrícolas e rodoviárias / Agricultural and highway machinery 1960 - 2020 2,81 milhões / million
Autoveículos - Ranking mundial 2022 Vehicles - World ranking 2022
6 | Anuário da Indústria Automobilística Brasileira | Brazilian Automotive Industry Yearbook | 2024
26
Unidades industriais
Industrial units 52 Estados / States 9
37
Municípios / Cities
Accumulated production
93,4
8º
6º mercado interno
produtor / 8 th producer
/ 6 th domestic market
US$
billion Importação
US$ 27,6 bilhões / billion Saldo
Balance -US$ 6,3 bilhões
billion
21,3 bilhões /
/ Imports
/
/
Total
Total ................................................................................... 2,5% Faturamento Revenue 2022 US$ 69,8
billion
/
bilhões /
* A base primária para cálculos é do IBGE - Instituto Brasileiro de Geografia e Estatística. *The primary basis for calculations is from the IBGE - Brazilian Institute of Geography and Statistics FONTES / SOURCES: ANFAVEA, SECEX / MDIC, SINDIPEÇAS, OICA


CAPÍTULO 1 / CHAPTER 1
e rodoviárias
8 | Anuário da Indústria Automobilística Brasileira | Brazilian Automotive Industry Yearbook | 2024 Sumário Summary SUMÁRIO / SUMMARY Diretoria da ANFAVEA | SINFAVEA / Bord of directors 02 Sobre a indústria automobilística brasileira / Brazilian Automotive Industry 06 Palavra do Presidente / From the President 16 Empresas associadas à ANFAVEA / ANFAVEA Member companies 24
INDÚSTRIA AUTOMOBILÍSTICA BRASILEIRA BRAZILIAN AUTOMOTIVE INDUSTRY 1.1 Empresas associadas à ANFAVEA - Dados gerais - 2023 1.1 ANFAVEA member companies - General date - 2023 28
Empresas associadas à ANFAVEA - Unidades industriais e outras - 2023 1.2 ANFAVEA member companies - Plants and other facilities - 2023 30 1.3 Empresas associadas à ANFAVEA - Unidades industriais - Distribuição geográfica 1.3 ANFAVEA member companies - Plants - Geographic distribution 33 1.4 Concessionárias de autoveículos por empresa e unidade da federação - 2023 1.4 Vehicle dealer network by company and by state - 2023 ......................................................................................................... 34
por empresa e unidade da federação - 2020 1.5 Agricultural and highway construction machinery dealer network by company and by state - 2020............................................ 36 1.6 Faturamento líquido por setor - 1966/2022 1.6 The automotive industry’s net revenue by sector - 1966/2022 38 1.7 Faturamento e investimento da indústria de autopeças - 2016/2022 1.7 The autoparts industry’s total revenues and investment - 2016/2022 40 1.8 Emprego por setor - 1957/2023 / 1.8 Employment by sector - 1957/2023 42 1.9 Balança comercial da indústria automotiva (autoveículos, autopeças, máquinas agrícolas, máquinas rodoviárias, outros) - 2001/2023 / 1.9 Brazilian automotive industry trade balance (vehicles, autoparts, agricultural machinery, high way construction equipament and others) - 2001/2023 44 1.10 Tributos - Autoveículos / 1.10 Taxes - Vehicles ........................................................................................................................ 52 1.11 Estimativa da frota de autoveículos - 2000/2023 1.11Vehicle fleet estimate - 2000/2023 ...................................................................................................................................... 54
1.2
1.5 Concessionárias de máquinas agrícolas
CAPÍTULO 2 / CHAPTER 2
AUTOVEÍCULOS: PRODUÇÃO, VENDAS INTERNAS E EXPORTAÇÕES
VEHICLES: PRODUCTION, DOMESTIC SALES AND EXPORTS
2.1 Produção de autoveículos montados - 1957/2023
2.2 Produção total de autoveículos - 1957/2023
2.2 Total production of vehicles - 1957/2023
2.3 Licenciamento de autoveículos novos - nacionais e importados - 1957/2023
2.3
2.4 Licenciamento de autoveículos novos por unidade da federação - nacionais e importados - 2022/2023 2.4 Registration of new vehicles per state - local and imported - 2022/2023 .................................................................................
2.5 Licenciamento de autoveículos novos por combustível - 1957/2023
2.6 Licenciamento de autoveículos novos nacionais - 1957/2023
2.6
2.7 Licenciamento de autoveículos novos importados - 1990/2023
Registration of imported new vehicles - 1990/2023
2.8
2.9 Vendas internas no atacado de importados procedentes do Mercosul - 1991/2023 2.9 Domestic wholesales of imported products from Mercosur - 1991/2023
2.10 Licenciamento de automóveis novos de 1.000 cm3 - 1990/2023 2.10
2.12 Exportações de autoveículos montados - 1961/2023
2.12 Exports of assembled vehicles - 1961/2023 ........................................................................................................................
2.13 Exportações totais de autoveículos - 1961/2023
2.13
2024 | Anuário da Indústria Automobilística Brasileira | Brazilian Automotive Industry Yearbook | 9 2024 ANUÁRIO DA INDÚSTRIA AUTOMOBILÍSTICA BRASILEIRA Brazilian Automotive Industry Yearbook
2.1
assembled vehicles
..................................................................................................................... 56
Production of
- 1957/2023
57
Registration of new vehicles - local and imported
1957/2023 58
-
60
2.5 Registration of new vehicles by fuel type
1957/2023 62
-
Registration
manufactures new vehicles
66
of nationally
- 1957/2023
67
2.7
Licenciamento de autoveículos novos importados por país de origem
2022/2023 2.8 Registration of imported new vehicles per country of origin - 2022/2023 ................................................................................. 68
69
-
Registration of cars with 1.000 cm3 engines - 1990/2023 70
de caminhões por
2002/2023
Registration of trucks by type
2002/2023 .......................................................................................................................... 70
2.11 Licenciamento
categoria -
2.11
-
71
Total exports of assembled vehicles
1961/2023 72
-
10 | Anuário da Indústria Automobilística Brasileira | Brazilian Automotive Industry Yearbook | 2024 Sumário Summary 2.14 Informações por empresa / 2.14 Information per company Agrale S.A. 74 Audi do Brasil Indústria e Comércio de Veículos Ltda. 76 BMW do Brasil Ltda 77 CAOA Montadora de Veículos Ltda. . 78 DAF Caminhões Brasil Indústria Ltda. 79 FCA Fiat Chrysler Automóveis do Brasil Ltda. 80 Ford Motor Company Brasil Ltda. . 83 General Motors do Brasil Ltda. 86 Honda Automóveis do Brasil Ltda. 89 HPE Automotores do Brasil Ltda. 91 Hyundai Motor Brasil Montadora de Automóveis Ltda. 93 Jaguar e Land Rover Brasil Indústria e Comércio de Veículos Ltda. 94 Mercedes-Benz Cars & Vans Brasil – Indústria e Comércio de Veículos Ltda. 95 Mercedes-Benz do Brasil Ltda. . 96 Nissan do Brasil Automóveis Ltda. 98 On-Highway Brasil Ltda. 100 Peugeot Citroën do Brasil Automóveis Ltda. 102 Renault do Brasil S.A. 104 Scania Latin America Ltda. 106 Toyota do Brasil Ltda. 108 Volkswagen do Brasil Indústria de Veículos Automotores Ltda. 111 Volkswagen Truck & Bus Indústria e Comércio de Veículos Ltda. . 114 Volvo do Brasil Veículos Ltda. 116 2.15 Licenciamento de autoveículos por empresa e tipo - 2022/2023 2.15 Registration of new vehicles per company and type - 2022/2023 118 CAPÍTULO 3 / CHAPTER 3 MÁQUINAS AGRÍCOLAS E RODOVIÁRIAS: PRODUÇÃO, VENDAS INTERNAS E EXPORTAÇÕES AGRICULTURAL AND HIGHWAY CONSTRUCTION MACHINERY: PRODUCTION, DOMESTIC SALES AND EXPORTS 3.1 Produção - 1960/2020 / 3.1 Production - 1960/2020 .................................................................................................................... 120 3.2 Vendas internas no atacado - 1960/2020 / 3.2 Domestic wholesales - 1960/2020 121
CAPÍTULO 4 / CHAPTER 4
CAPÍTULO 5 / CHAPTER 5
/
2024 | Anuário da Indústria Automobilística Brasileira | Brazilian Automotive Industry Yearbook | 11 2024 ANUÁRIO DA INDÚSTRIA AUTOMOBILÍSTICA BRASILEIRA Brazilian Automotive Industry Yearbook ANUÁRIO DA INDÚSTRIA AUTOMOBILÍSTICA BRASILEIRA • Brazilian Automotive Industry Yearbook 3.3 Vendas internas no atacado por origem do produto - 1994/2020 3.3 Domestic Wholesales by Product Origin - 1994 / 2020 ............................................................................................................... 122 3.4 Vendas internas no atacado por unidade da federação - 2019/2020 / 3.4 Domestic wholesales per state - 2019/2020 123 3.5 Exportações - 1964/2020/ 3.5 Exports - 1964/2020 ..................................................................................................................... 124 3.6 Informações por empresa / 3.6 Information per company 125 AGCO do Brasil Soluções Agrícolas Ltda. - Massey Ferguson 125 AGCO do Brasil Soluções Agrícolas Ltda. - Valtra ................................................................................................................................ 127 Agrale S.A. 129 CNH Industrial Brasil Ltda. – CASE 130 CNH Industrial Brasil Ltda. – New Holland 132
REFERÊNCIAS INTERNACIONAIS / INTERNATIONAL DATA 4.1 Frota e habitantes por autoveículo em alguns países - 2015 e 2020 / 4.1 Vehicle fleet and inhabitants per vehicle in selected countries - 2015 and 2020 134 4.2 Produção de autoveículos - 2013/2022 / 4.2 Worldwide vehicle production - 2013/2022 135 4.3 Licenciamento de autoveículos novos - 2013/2022 / 4.3 Registration of new vehicles - 2013/2022 ........................................... 136 4.4 América Latina - Dados automotivos - países selecionados / 4.4 Latin America - Automotive data - selected countries ............. 137 4.5 Mercosul - Dados automotivos - 2021/2022 / 4.5 Mercosur - Automotive data - 2021/2022 138
ENTIDADES
ORGANIZATIONS 5.1 Entidades da indústria de autoveículos – Internacionais / 5.1 Motor vehicle organizations – International.................................. 140 5.2 Entidades da indústria de autoveículos – Nacionais / 5.2 Motor vehicle organizations – Nationally 142

Indústria automobilística brasileira
Brazilian automotive industry
ASSOCIAÇÃO NACIONAL DOS FABRICANTES DE VEÍCULOS AUTOMOTORES
ANUÁRIO DA INDÚSTRIA AUTOMOBILÍSTICA BRASILEIRA
Brazilian Automotive Industry Yearbook
ANUÁRIO DA INDÚSTRIA AUTOMOBILÍSTICA BRASILEIRA 2024
BRAZILIAN AUTOMOTIVE INDUSTRY YEARBOOK 2024
Publicação da Associação Nacional dos Fabricantes de Veículos Automotores – ANFAVEA
Published by Brazilian Automotive Industry Association – ANFAVEA
Escritório em São Paulo - Avenida Engenheiro Luís Carlos Berrini, 105 - 4º andar / São Paulo / SP / Brasil / 04571-010 / Tel.: +55 11 2193-7800 www.anfavea.com.br / anfavea@anfavea.com.br
Escritório em Brasília – Distrito Federal – DF / Brasilia Office SHIS QI 9, Conjunto 9, Casa 23, Lago Sul / Brasília / DF / 71625090 / Tel. +55 61 2191-1400
ESTATÍSTICO RESPONSÁVEL | STATISTICS ADVISOR
Sérgio Yukio Sawada – CONRE 3ª Região nº 5.612-A – Brasil
INFORMAÇÕES ESTATÍSTICAS | STATISTICS INFORMATION
Sérgio Yukio Sawada, Eduardo Lopez, Flávio Patez
DIREÇÃO E PRODUÇÃO EDITORIAL | DIRECTION AND EDITORIAL PRODUCTION
André Jalonetsky, Glauco Lucena, Marianna Zavisch, Clara Fernandes e Patricia Geller
EDIÇÃO E COMERCIALIZAÇÃO / EDITION AND COMMERCIALIZATION Motor Mídia Editora Ltda.
Empresa de conteúdos, soluções digitais e eventos / Content company, digital solutions and events Diretora geral / General Director: Isabel Reis Editora de arte / Art Editor: Leda Silva
Equipe comercial / Sales team: Venício Zambeli (coordenação / coordination), Marcelo Cervantes (executivo de negócio / business executive)
Marketing publicitário e produção gráfica / Advertising marketing and graphic production: Thomas Bento – Hellow Eventos
REVISÃO / REVIEW OK Linguística
IMPRESSÃO / PRINTING
Hawaii Gráfica e Editora Ltda – www.hawaiigrafica.com.br
O Anuário é disponibilizado em versões impressa e digital. A digital pode ser encontrada em www.anfavea.com.br / The Yearbook is available in print and digital versions. The digital one can be found at www.anfavea.com.br
Todos os direitos reservados. Permitida a livre reprodução desde que citada a fonte. / All rights reserved. This publication may be reproduced. Kindly mention the source.
São Paulo, fevereiro de 2024 / February 2024
14 | Anuário da Indústria Automobilística Brasileira | Brazilian Automotive Industry Yearbook | 2024
2024
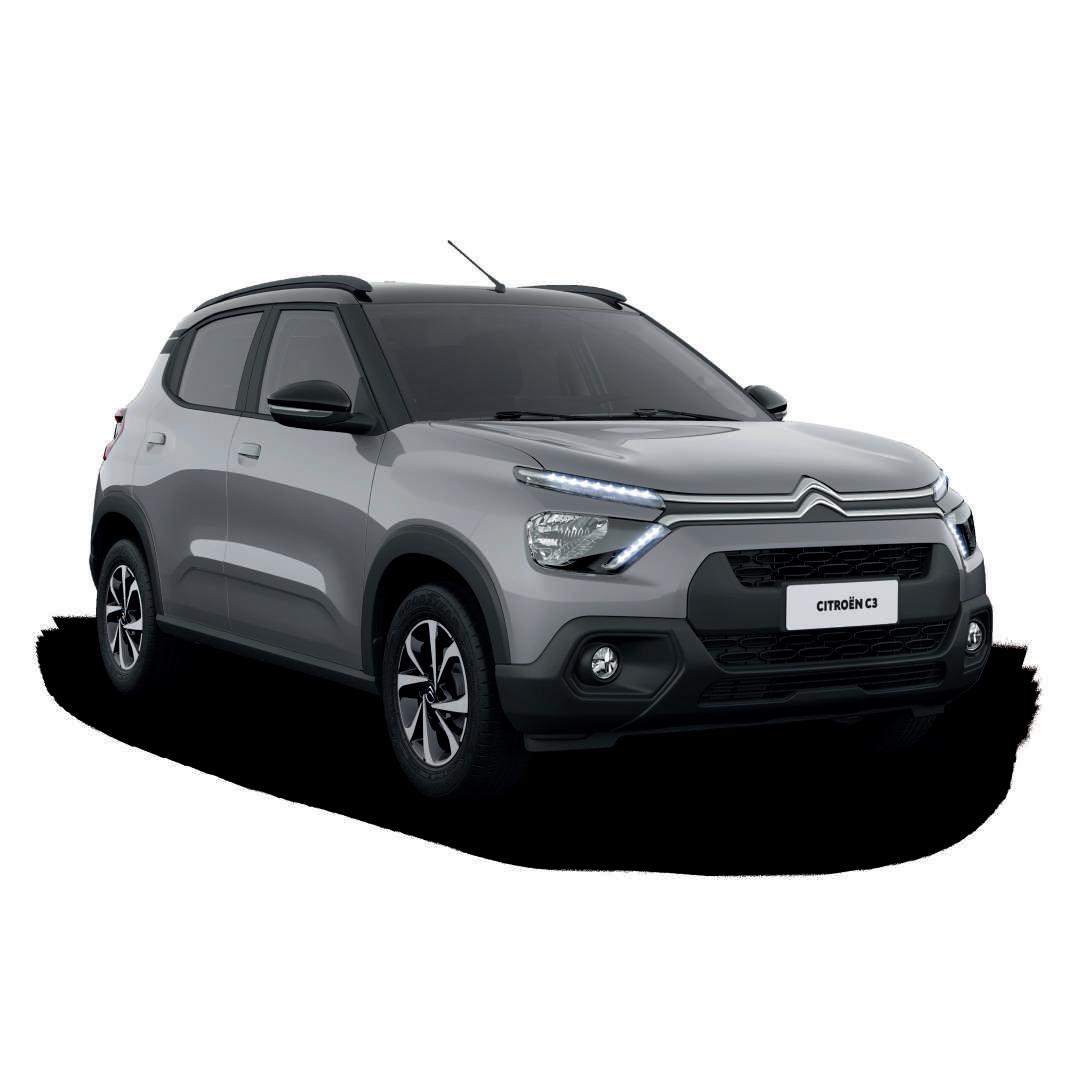
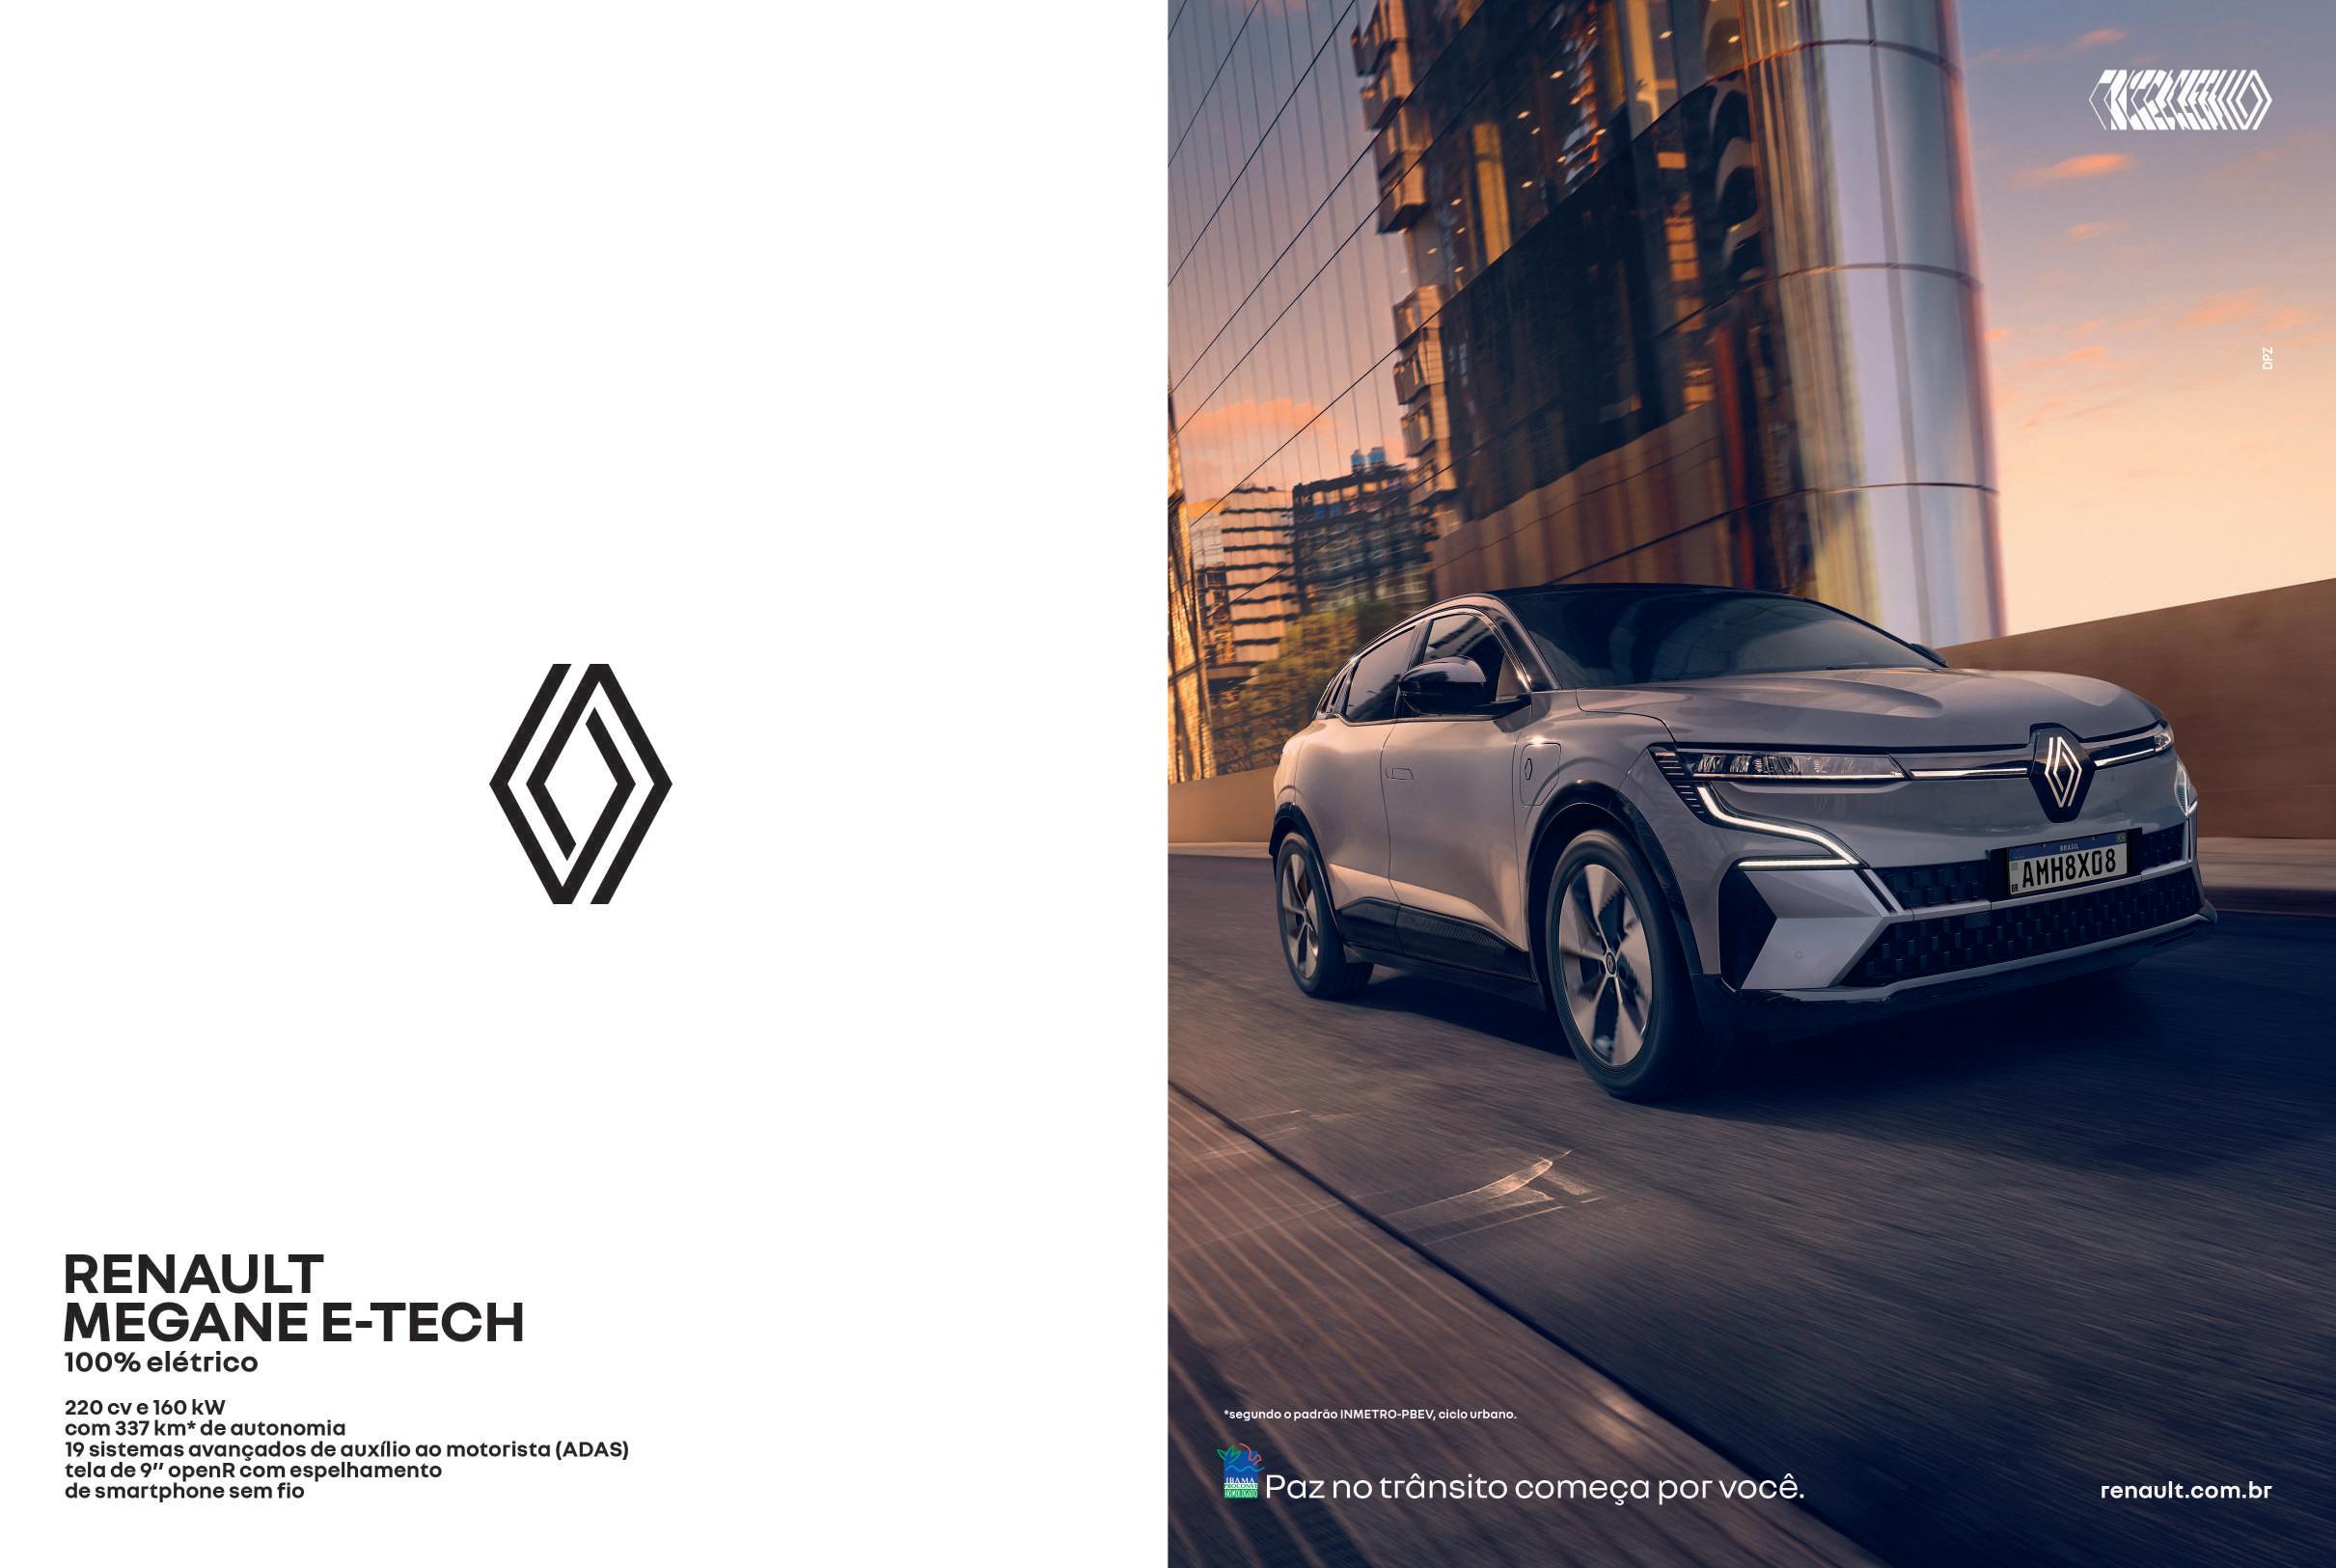
CITROËN C3
O compacto gigante.
PAZ
NO TRÂNSITO COMEÇA POR VOCÊ.
Palavra do Presidente
From the President

16 | Anuário da Indústria Automobilística Brasileira | Brazilian Automotive Industry Yearbook | 2024
AS RAZÕES QUE LEVAM O SETOR AUTOMOTIVO BRASILEIRO AO MAIOR CICLO DE INVESTIMENTOS DA HISTÓRIA
Como é de costume entre quem respira o setor automotivo, gosto muito de esportes motorizados em geral, em especial a Fórmula 1. Se pudesse comparar este início de 2024 ao mu n do das pistas, diria que o ano começou como a largada de um grande prêmio, tal a velocidade e a quantidade das notícias que foram se sucedendo nos primeiros dias, felizmente todas positivas.
Sem dúvida a mais importante é que o setor automotivo brasileiro está ingressando no maior ciclo de investimentos de sua história, o que é motivo de muita satisfação para a ANFAVEA. São aportes da ordem de R$ 100 bilhões no atual ciclo. Esse montante, que deve crescer em breve com novos anúncios, leva em conta investimentos em curso de montadoras instaladas no país, de novos entrantes e do setor de autopeças. Todos esses movimentos confirmam a atratividade do Brasil como polo produtor e exportador dos mais variados tipos de autoveículos, máquinas autopropulsadas e componentes, além de tecnologias e soluções de mobilidade.
Muitos podem não entender os motivos que têm levado a essa onda impressionante de investimentos, num momento em que há ociosidade em fábricas de veículos de todo o mundo, o Brasil incluso. Porém, basta uma análise conjuntural e estratégica para ver como essa aposta de várias empresas no Brasil faz todo o sentido.
A atração de investimentos está vinculada ao programa de neoindustrialização anunciado pelo governo, que define políticas industriais e entrega previsibilidade, assim como a credibilidade gerada por medidas estruturantes como a recentemente aprovada Reforma Tributária e o Marco das Garantias. O cenário econômico brasileiro também proporciona confiança aos investidores, com crescimento do PIB, inflação controlada, câmbio estável e queda contínua da taxa de juros.
Entre todas essas conquistas, aquela que mais devemos celebrar é a previsibilidade proporcionada pelo programa MOVER – Mobilidade Verde e Inovação –, que foi publicado como Medida Provisória na virada do ano e já começa a moldar os passos de todas as empresas ligadas à cadeia automotiva. O MOVER veio no bojo de uma nova política industrial anunciada pelo governo federal, batizada de Nova Indústria Brasil, que finalmente valoriza as empresas de ponta instaladas no país, sinalizando um profundo e fundamental processo de reindustrialização e neoindustrialização. O primeiro focado na recuperação de algumas áreas do nosso parque industrial, e o segundo visando um salto tecnológico da nossa indústria.
Por Márcio de Lima Leite Presidente da ANFAVEA
O MOVER é uma excelente notícia, pois dá continuidade a dois programas bem-sucedidos, o InovarAuto de 2012 e o Rota 2030 de 2018. Ambos, a seu tempo, estabeleceram políticas públicas para o setor, trazendo obrigações para a nossa indústria e proporcionando previsibilidade para as empresas investirem em pesquisa, desenvolvimento e inovação local.
2024 | Anuário da Indústria Automobilística Brasileira | Brazilian Automotive Industry Yearbook | 17 2024 ANUÁRIO DA INDÚSTRIA AUTOMOBILÍSTICA BRASILEIRA Brazilian Automotive Industry Yearbook ANUÁRIO DA INDÚSTRIA AUTOMOBILÍSTICA BRASILEIRA • Brazilian Automotive Industry Yearbook
▲
Palavra do Presidente
From the President

Graças à continuidade desses programas, os veículos produzidos hoje no Brasil estão entre os mais econômicos, ambientalmente responsáveis e seguros do mundo. Nesta etapa, o MOVER tem os seguintes objetivos: garantir previsibilidade e segurança aos investimentos; alinhamento entre governo, academia, fabricantes e fornecedores; regulamentar o incremento da eficiência energética e da segurança veicular; induzir investimentos em P&D (dos fabricantes, fornecedores, academia e startups ); estimular novas tecnologias com foco ambiental; promover os biocombustíveis e novas formas de propulsão; valorizar a matriz energética brasileira de baixo carbono, a capacitação técnica e a qualificação profissional. Nos próximos meses, o Poder Executivo irá detalhar a regulamentação do novo programa. Mas já podemos comemorar inovações do programa, como a reciclabilidade e o uso do conceito do “poço à roda”, e não o convencional “tanque à roda”. Ou seja, não basta medir as emissões dos veículos apenas pelo escapamento, mas sim levando-se em conta a pegada de carbono gerada na produção e disponibilização do combustível ou da energia que movimenta o veículo. Os mecanismos de atração de investimentos em P&D também ficaram muito mais dinâmicos e transparentes.
Além do MOVER, tivemos ainda a recomposição do Imposto de Importação para automóveis elétricos e híbridos, de forma gradual e com previsibilidade a partir de janeiro, num movimento que revela a intenção de atrair pesados investimentos para a produção desses veículos eletrificados em nosso país, sem os quais não seria possível cogitar uma nova fase de nossa indústria.
São tantas novidades que até parece que 2023 ficou num passado distante. Mas os dados do ano passado são a razão de ser deste tradicional anuário, que
18 | Anuário da Indústria Automobilística Brasileira | Brazilian Automotive Industry Yearbook | 2024
2024
chega às suas mãos em formato impresso e digital. Resumindo em poucas palavras, 2023 foi um ano de transição. Superamos a escassez de componentes que afetava nossa produção e oferta. Os juros de financiamento começaram a cair no segundo semestre e o mercado interno de autoveículos reagiu com um crescimento de quase 10%.
A produção se manteve estável em 2023, em virtude da retração de 16% nas exportações e da relevante alta de 29% nas importações. Mas a mensagem é que estamos caminhando para níveis de mercado e de produção de antes da pandemia, com nível de empregos mantido e com nossas associadas mostrando disposição para novos investimentos e ganhos de volume.
Nossas projeções para 2024 apontam para crescimento acima de 6%, tanto para produção como para emplacamentos, com ambos os indicadores próximos de 2,5 milhões de unidades, além de uma alta de 0,7% para as exportações. Poderíamos até superar essas metas com a adoção de um programa nacional de inspeção veicular que, além de contribuir com a descarbonização e com a segurança, também estimularia a renovação da frota.
Olhando ainda mais adiante, imaginar como será a indústria automobilística nas próximas décadas é um exercício que praticamos com frequência, especialmente nesse momento de mudanças tão profundas. Além da inadiável corrida pela descarbonização, tanto pelas várias modalidades de eletrificação como pelo uso dos biocombustíveis, o setor automotivo será ainda mais impactado por fenômenos já em curso, como a conectividade, que irá intensificar a troca de informações entre veículos e com o ambiente; o aumento do grau da automação; e os serviços de compartilhamento que irão se moldar a novos perfis de clientes.
A chegada do 5G irá acelerar todos esses processos em uma velocidade jamais vista, beneficiando não só os automóveis e comerciais leves, mas principalmente os caminhões, ônibus e máquinas autopropulsadas, que cada vez mais dependem da conectividade para aumentar sua produtividade.
Como Presidente da ANFAVEA, o que mais me instiga é o que estará reservado ao Brasil. Qual será o papel da indústria nacional nesses cenários de médio e longo prazo? Como as montadoras e o setor de autopeças farão essa longa travessia para um novo modo de enxergar a mobilidade urbana, o transporte e os serviços?
Acredito que o futuro próximo definirá o destino do ecossistema industrial automotivo. As tecnologias avançadas, a corrida da descarbonização e a reorganização das cadeias de suprimentos, que acontecem globalmente, são movimentos que exigem visão e atitude por parte de entes públicos e privados.
Nosso país é rico em recursos naturais, minérios importantes para a produção de baterias, energia limpa e recursos humanos. Mas isso não é suficiente; não queremos ser meros exportadores de matérias-primas. Por isso a urgência em forta lecer nossa histórica vocação industrial com um olhar estratégico para o futuro.
O que me deixa mais otimista é que o MOVER está inserido em uma ampla política industrial, que abrange vários setores fundamentais para ampliar o papel do Brasil na economia global, com benefícios diretos e indiretos para toda a sociedade.
“O PROGRAMA MOVER PROPORCIONA A PREVISIBILIDADE QUE A INDÚSTRIA PRECISA PARA CONTINUAR CRIANDO SOLUÇÕES INOVADORAS DE MOBILIDADE LIMPA, EFICIENTE E SEGURA”
O plano Nova Indústria Brasil será crucial para que tenhamos um setor industrial com a mesma pujança e geração de divisas do setor agropecuário. Com ele e com os esforços do setor privado, teremos uma indústria ainda mais forte e tecnológica no Brasil, apoiada em sustentabilidade, descarbonização, pesquisa, desenvolvimento e abertura de empregos de alta qualificação. É disso que nós precisamos: um país que seja também voltado para sua indústria e para sua exportação. Se o poder público nos entregou um cenário favorável e políticas de incentivo muito bem articuladas, agora a bola está conosco, com toda a cadeia automotiva. Nós temos desafios em fazer o Brasil voltar a crescer, atrair investimentos, e a expectativa é muito positiva. Esperamos que este ano seja um divisor de águas, o início de uma transformação, não apenas industrial, mas também social, com a geração de empregos, inteligência e riqueza para o país. ■
2024 | Anuário da Indústria Automobilística Brasileira | Brazilian Automotive Industry Yearbook | 19
ANUÁRIO DA INDÚSTRIA AUTOMOBILÍSTICA BRASILEIRA Brazilian Automotive Industry Yearbook
Palavra do Presidente
From the President
THE REASONS BEHIND THE LARGEST INVESTMENT CYCLE EVER IN THE BRAZILIAN AUTOMOTIVE INDUSTRY
As is common among those who live and breathe the automotive industry, I really like motorsports in general, especially Formula One. Drawing an analogy between the first days of 2024 and the world of racetracks, I would say such a flurry of news–fortunately, all of it good–came so quickly in early January that the year began like the start of a Grand Prix.
Without a doubt, the most important news was that the Brazilian automotive industry is entering its largest investment cycle ever, a source of great satisfaction for ANFAVEA. Indeed, investments will total about R$100 billion in the current cycle. That amount, which should increase soon as new announcements are made, encompasses current investments from automakers operating in Brazil, market entrants and the auto parts segment. All those developments show Brazil is an attractive production and export hub for a vast range of auto vehicles, self-propelled machines and parts, as well as mobility technologies and solutions.
Many may not understand the reasons behind that impressive wave of investments given the idleness rate in vehicle plants worldwide, Brazil included. However, a quick look into the current situation and strategies can clearly show why that bet by different companies in Brazil makes perfect sense.
The new investments are connected with the industry upgrade plan unveiled by the Brazilian Federal government, which introduces industrial policies and provides predictability, as well as with the credibility brought by structuring measures such as the recently approved Tax Reform and the Guarantees Framework. In addition, the Brazilian economic situation–with GDP growth, inflation under control, stable exchange rates and falling interest rates–boosts investor confidence.
Nevertheless, the achievement that calls for the greatest celebration is the predictability provided by the MOVER [Mobilidade Verde e Inovação, or Green Mobility and Innovation] program, which was launched through a Provisional Measure at the turn of the year and has already started to define the steps of all the companies in the au-
tomotive chain. The MOVER program is at the heart of a new industrial policy announced by the Federal government and called Nova Indústria Brasil [New Industry Brazil], which favors cutting-edge companies present in Brazil–at long last, signaling a far-reaching new industrial boom entirely based on innovative technologies. In other words, the new policy is designed to revitalize some segments of Brazil’s industrial base, as well as promote a technological leap.
MOVER is excellent news as it continues two successful programs: InovarAuto in 2012 and Rota 2030 in 2018. The previous programs, each at its own time, introduced public policies imposing duties for our industry and providing predictability for companies to invest in research, development and innovation in Brazil.
Thanks to that unbroken sequence of programs, motor vehicles made in Brazil are now among the safest, most economical and environmentally responsible worldwide. At this stage, MOVER has the following goals: to ensure predictability, safety and security for investors; bring alignment among the government, academics, manufacturers and suppliers; set out rules to increase energy efficiency and vehicle safety; spur investments in R&D (in manufacturers, suppliers, universities and start-ups); foster the development of eco-friendly technologies; promote the use of biofuels and new forms of propulsion; and favor low-carbon energy sources, job training and professional skills-building in Brazil.
The Executive Branch is going to announce detailed rules for the new program in coming months. In any case, we can already celebrate the innovations brought by MOVER, such as recyclability and the use of the wellto-wheel method instead of the conventional tank-towheel method. In other words, it is not enough to measure vehicle emissions based only on the amount of exhaust gases released, but it is crucial to consider the entire carbon footprint, from the production and delivery of the fuel or energy used by a vehicle. The strategies to attract investments in R&D have also become much more dynamic and transparent.
20 | Anuário da Indústria Automobilística Brasileira | Brazilian Automotive Industry Yearbook | 2024


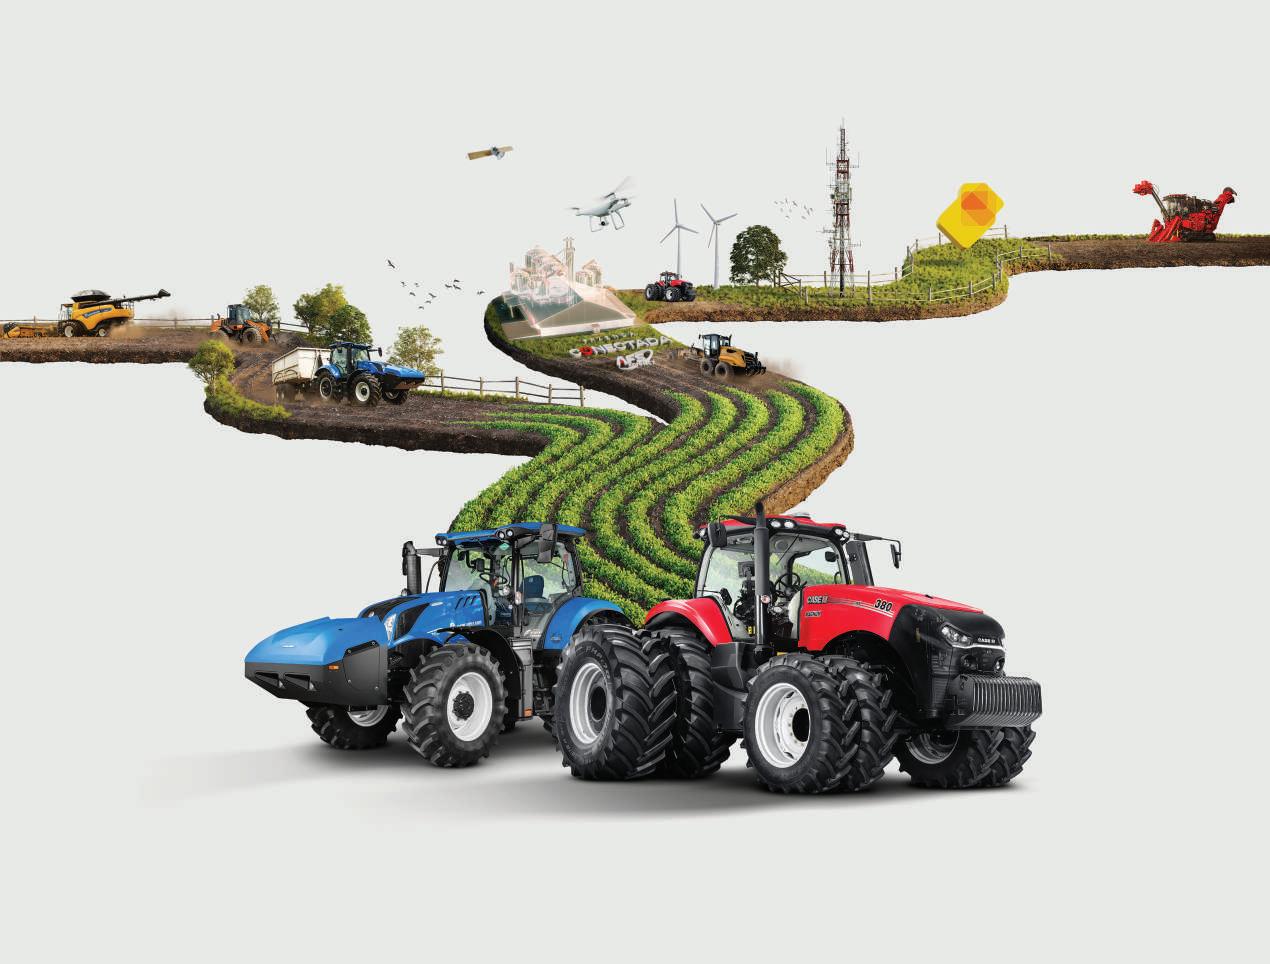


Austoft Série 9000. Colhedora 100% conectada. CNH A empresa privada que mais depositou patentes no Brasil.
CR IntelliSense. Colheitadeira com inteligência artificial.
RG200B.
Magnum AFS Connect Tecnologia e conectividade em tempo real. Maior
tecnológico da
Latina.
os campos brasileiros
Motoniveladora
Entrega modernidade em múltiplas tarefas.
HUB
América
Conectividade para
Ecossistema completo de agricultura digital.
Retroescavadeira acessível para pessoas com mobilidade reduzida.
sustentabilidade
10º lugar 10 mais inovadoras CNH INDUSTRIAL Pá carregadeira: eficiência e produtividade. Grãos viram ativos digitais Central de conectividade Axial-Flow série 250 Automation. Inteligência artificial, automação real.
CNH Uma das 10+ inovadoras do país e a primeira do setor. É INOVAÇÃO. Agro e Construção. Abrindo caminhos do desenvolvimento. Não é acaso.
Trator movido a biometano:
com redução das emissões.
Novo conceito de concessionárias multifuncionais.
Palavra do Presidente
From the President

“THE MOVER PROGRAM PROVIDES THE PREDICTABILITY THAT THE INDUSTRY NEEDS TO CONTINUE CREATING INNOVATIVE CLEAN, EFFICIENT AND SAFE MOBILITY SOLUTIONS”
In addition to MOVER, import duties on electric and hybrid cars started rising gradually and predictably again in January, which shows the Federal government intends to attract substantial investments so those vehicles can be produced in Brazil, a key step in the new phase of Brazilian industry.
There have been so many developments lately that it seems as if 2023 was in the distant past. However, this traditional yearbook, which comes to you in digital and printed formats, focuses primarily on last year’s data. In a nutshell, 2023 was a year of transition. The shortage of components that affected our production and supply came to an end. Interest rates on car loans started falling in the second half of the year; as a result, the domestic motor vehicle market grew by almost 10%.
Production flattened out in 2023 due to a 16% drop in exports and a significant 29% upturn in imports. However, the key message is that we are returning to the market and production levels recorded before the pandemic, with stable employment levels. Moreover, our member companies are willing to invest and boost volumes.
Our projections indicate both production and registrations will total about 2.5 million units in 2024, both rising by over 6%, in addition to a 0.7% increase in exports. The adoption of a nationwide vehicle inspection program could allow us to exceed those projections, as well as help boost decarbonization, improve vehicle safety and encourage the renewal of the fleet.
Looking further ahead, we often try to envision what the automotive industry will be like in the following decades, especially at a time of major changes like this. In addition to the urgent race for decarbonization through the use of different electrification technologies or biofuels, the automotive industry will be further impacted by other current trends such as connectivity, which will increase and speed up the exchange of information between vehicles and the environment; the advance of automation; and sharing services adapted to new user profiles.
With the advent of 5G, all those processes will accelerate as never before and benefit not only cars and light commercial vehicles, but mainly trucks, buses and self-propelled machines, which increasingly depend on connectivity to gain productivity.
What most excites me as President of ANFAVEA is what lies in store for Brazil. What role will the Brazilian industry be playing in those medium and long-term scenarios? How will automakers and the auto parts segment be making this long transition to a new perspective on urban mobility, transportation and services?
I believe the fate of the automotive industrial ecosystem will take shape soon. With the development of advanced technologies, the race for decarbonization and the reorganization of supply chains, all of which are occurring simultaneously worldwide, public and private entities must have vision and act firmly.
Granted, Brazil is rich in natural resources, ores essential for battery production, clean energy sources and human resources, but that is not enough. We do not want to be mere exporters of raw materials. That is why we must strengthen our historical inclination for industrial activity with a strategic view of the future.
What makes me more optimistic is that MOVER is part of a broad industrial policy covering several key segments and designed to expand Brazil’s role in the global economy, with direct and indirect benefits for society as a whole.
The Nova Indústria Brasil plan will be crucial for the Brazilian manufacturing industry to be as strong as Brazilian agribusiness and bring in as much foreign exchange. Combined with the efforts of the private sector, it will give rise to an even stronger and more technologically advanced industrial base, supported by sustainability, low-carbon technologies, research, development and the creation of high-skilled jobs. That is what we need: a country that is also focused on its industry and exports.
Public authorities have created a favorable situation and adopted well-coordinated incentive policies, so now the ball is in our court, with the entire automotive chain. We have a twofold challenge: to make Brazil grow again and attract investments, and our prospects are exceptionally good. We hope this year will be a watershed, the beginning of a major industrial and social change, with the creation of jobs, knowledge and wealth for Brazil.■
22 | Anuário da Indústria Automobilística Brasileira | Brazilian Automotive Industry Yearbook | 2024
Empresas associadas à ANFAVEA
ANFAVEA member companies


AGCO DO BRASIL SOLUÇÕES AGRÍCOLAS LTDA.
Rua Capitão Francisco de Almeida, 695 08740-300 - Mogi das Cruzes - SP
Tel. +55 51 98122-1707 | www.agco.com.br
AGRALE S.A.
Rodovia BR 116, Km 145, nº 15.104 95059-520 - Caxias do Sul - RS
Tel. +55 54 3238-8000 | www.agrale.com.br
AUDI DO BRASIL INDÚSTRIA E COMÉRCIO DE VEÍCULOS LTDA.
Av. das Nações Unidas, 14261 - 14º Andar - Torre A 04794-000 - São Paulo - SP
Tel. + 55 11 3041-2834 | www.audi.com.br
BMW DO BRASIL LTDA.
Av. Dr. Chucri Zaidan, 1.240, 23º andar - Ed. Golden Tower, Morumbi Corporate 04711-130 - São Paulo - SP
Tel. +55 11 5186-0400 | www.bmw.com.br
CAOA MONTADORA DE VEÍCULOS LTDA.
Rua R11, SN, Faz Barreiro do Meio, DAIA 75113-590 - Anápolis - GO
Tel. +55 11 5538-1000 | www.caoa.com.br
CATERPILLAR BRASIL LTDA.
Rodovia Luiz de Queiroz S/N, km 157 - Distrito Industrial Unileste 13400-780 - Piracicaba - SP
Tel. +55 19 2106-2147 | www.caterpillar.com/pt
CNH INDUSTRIAL BRASIL LTDa.
Av. Juscelino Kubitschek De Oliveira, 11825 - Cidade Industrial 81860-220 - Curitiba – PR Tel. +55 31 2104 3908/3392 | www.cnhindustrial.com
DAF CAMINHÕES BRASIL INDÚSTRIA LTDA.
Avenida Senador Flávio Carvalho Guimarães, 6000 - Boa Vista 84072-190 - Ponta Grossa - PR
Tel. +55 42 3122-8400 | www.dafcaminhoes.com.br
FORD MOTOR COMPANY BRASIL LTDA.
Av. Dr. Cardoso do Melo, 1.336 04548-004 - São Paulo - SP
Tel. 0800 703 3673 | www.ford.com.br
24 | Anuário da Indústria Automobilística Brasileira | Brazilian Automotive Industry Yearbook | 2024
2024
ANUÁRIO DA INDÚSTRIA AUTOMOBILÍSTICA BRASILEIRA • Brazilian Automotive Industry Yearbook


GENERAL MOTORS DO BRASIL LTDA.
Avenida Goiás, 1.805 - Santa Paula 09550-050 - São Caetano do Sul - SP
Tel. (11) 4234-5090 / (11) 4239-6082 | www.chevrolet.com.br
HONDA AUTOMÓVEIS DO BRASIL LTDA.
Estrada Municipal Valêncio Calegari, 777 13181-903 - Sumaré - SP
Tel. +55 19 3864-7400 | www.honda.com.br
HPE AUTOMOTORES DO BRASIL LTDA.
Av. Doutor Gastão Vidigal, 1305 - 1° andar 05314-000 - São Paulo - SP Tel. +55 11 5694-2700 | https://hpeautos.com.br/

HYUNDAI MOTOR BRASIL MONTADORA DE AUTOMÓVEIS LTDA.
Avenida das Nações Unidas, 14.171, 21º andar, Torre Crystal 04794-000 - São Paulo - SP
Tel. +55 11 5186-7500 | www.hyundai.com.br


ON-HIGHWAY BRASIL LTDA.
Rodovia MG 238, km 73,5 – Jardim Primavera II 35703-106 - Sete Lagoas - MG Tel. +55 31 2107-2215 | www.iveco.com/brasil
JAGUAR E LAND ROVER BRASIL INDÚSTRIA E COMÉRCIO DE VEÍCULOS LTDA.
Avenida Ibirapuera, 2.332, 10º andar - Moema 04028-002 - São Paulo - SP Tel. +55 11 4210-1161 | www.jaguarbrasil.com.br | www.landrover.com.br
KOMATSU DO BRASIL LTDA.
Rodovia Índio Tibiriçá, 2.000 08655-000 - Suzano - SP Tel. +55 11 4745-7000 | www.komatsu.com.br
MERCEDES-BENZ CARS & VANS BRASIL LTDA.
Avenida do Café, 277 - Torre A, 6° andar - Vila Guarani 04311-900 - São Paulo - SP www.mercedes-benz.com.br
MERCEDES-BENZ DO BRASIL LTDA.
Avenida Alfred Jurzykowski, 562 09680-900 - São Bernardo do Campo - SP Tel. +55 11 4173-6611 | www.mercedes-benz-trucks.com.br
2024 | Anuário da Indústria Automobilística Brasileira | Brazilian Automotive Industry Yearbook | 25
ANUÁRIO
INDÚSTRIA AUTOMOBILÍSTICA BRASILEIRA Brazilian Automotive Industry Yearbook
DA
Empresas associadas à ANFAVEA
ANFAVEA member companies


NISSAN DO BRASIL AUTOMÓVEIS LTDA.
Avenida Barão de Tefé, 27, sala 701 - Saúde 20220-460 - Rio de Janeiro - RJ Tel +55 24 99983-2984 | www.nissan.com.br
RENAULT DO BRASIL S.A.
Avenida Renault, 1.300 83070-900 - São José dos Pinhais - PR Tel 0800 055 56 15 | www.renault.com.br
SCANIA LATIN AMERICA LTDA.
Avenida José Odorizzi, 151
09810-902 - São Bernardo do Campo - SP Tel +55 11 4344-9333 | www.scania.com.br Atendimento ao cliente: (11) 4090-2960 / faleconosco@scania.com
STELLANTIS
Avenida do Contorno, 3.455 | Bairro Paulo Camilo CEP 32669-900 - Betim - MG Tel: +55 31 2123 2408 | https://www.stellantis.com/
TOYOTA DO BRASIL LTDA.
Av. Toyota, 9005 - Itavuvu 18079-755 - Sorocaba - SP Tel. 0800 703 02 06 | www.toyota.com.br
VOLKSWAGEN DO BRASIL INDÚSTRIA DE VEÍCULOS AUTOMOTORES LTDA. Via Anchieta, km 23,5 - Demarchi 09823-901 - São Bernardo do Campo - SP Tel +55 11 98798-1722 | www.vw.com.br
VOLKSWAGEN TRUCK & BUS INDÚSTRIA E COMÉRCIO DE VEÍCULOS LTDA. Rua Volkswagen, 100 27537-803 - Resende - RJ Tel: +55 11 5582-5660 | www.vwco.com.br
VOLVO DO BRASIL VEÍCULOS LTDA.
Avenida Juscelino Kubitschek de Oliveira, 2.600 81260-900 - Curitiba - PR Tel. +55 41 3317-8111 | www.volvo.com.br
26 | Anuário da Indústria Automobilística Brasileira | Brazilian Automotive Industry Yearbook | 2024
CAPÍTULO 1
Indústria automobilística brasileira
CHAPTER 1 Brazilian automotive industry

ASSOCIAÇÃO NACIONAL DOS FABRICANTES DE VEÍCULOS AUTOMOTORES
1
1.1 Empresas associadas à ANFAVEA - Dados gerais - 2023
1.1 ANFAVEA member companies - General data - 2023
EMPRESAS FABRICANTES DE AUTOVEÍCULOS - VEHICLES MANUFACTURES
EMPRESAS FABRICANTES DE MÁQUINAS AGRÍCOLAS E RODOVIÁRIAS


Brazilian
28 | Anuário da Indústria Automobilística Brasileira | Brazilian Automotive Industry Yearbook | 2024
AUTOMÓVEIS Cars COMERCIAIS LEVES Light commercials CAMINHÕES Trucks ÔNIBUS Buses AGRALE AUDI BMW CAOA DAF GM Honda HPE Hyundai Iveco JLR Mercedes-Benz Nissan Renault Scania Stellantis Toyota VW Volkswagen Caminhões e Ônibus Volvo
Indústria automobilística brasileira
automotive industry
EMPRESAS Companies
AGRICULTURAL
AND HIGHWAY CONSTRUCTION MACHINERY MANUFACTURES
Companies TRATORES DE RODAS Wheel tractors TRATORES DE ESTEIRAS Crawler tractors COLHEITADEIRAS DE GRÃOS Grain combines COLHEDORAS DE CANA Sugarcane combines RETROESCAVADEIRAS Loaders & backhoes AGCO Agrale Caterpillar
Industrial (Case, New Holland) Komatsu
EMPRESAS
CNH
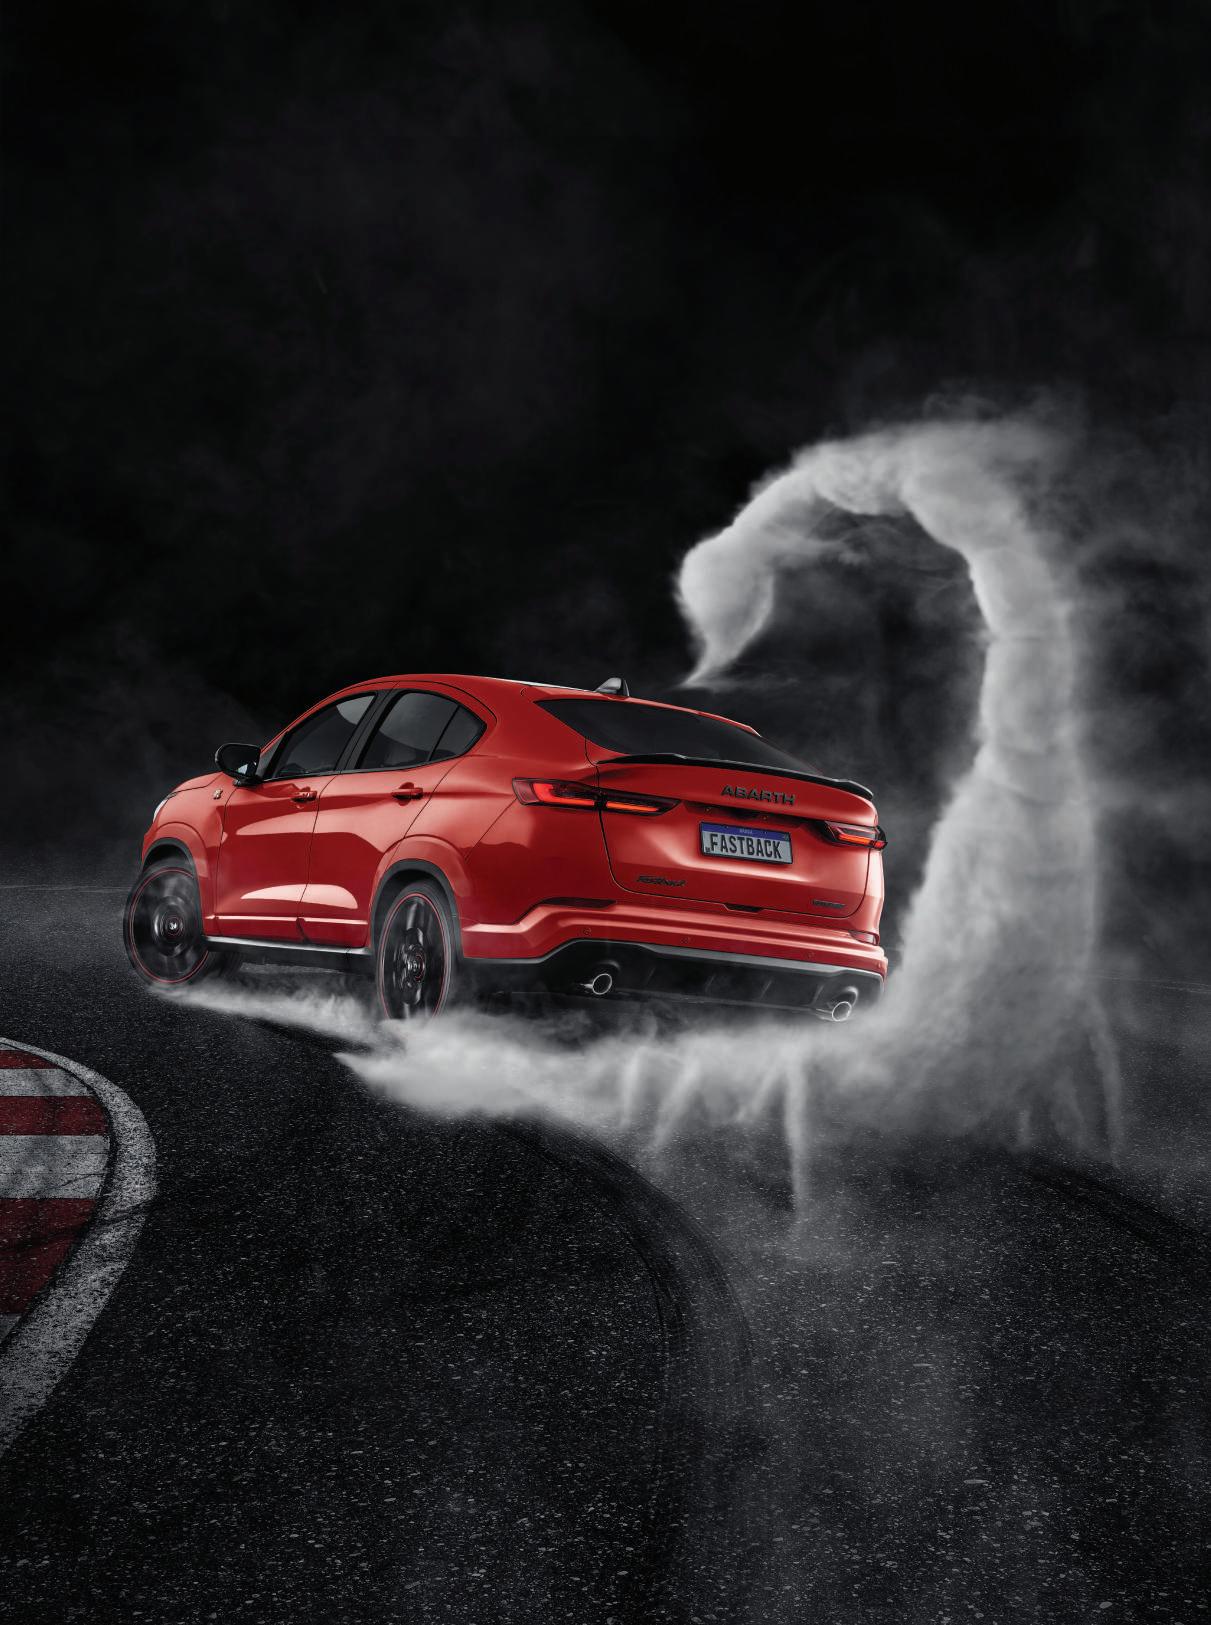

NOVO LIBERTE O VENENO QUE VIVE EM VOCÊ. ABARTH.FIAT.COM.BR Leo Burnett TM PAZ NO TRÂNSITO COMEÇA POR VOCÊ.
Indústria automobilística brasileira
Brazilian automotive industry
1.2 Empresas associadas à ANFAVEA - Unidades industriais e outras - 2023
ANFAVEA member companies - Plants and other facilities - 2023
EMPRESAS Companies UNIDADES INDUSTRIAIS / OUTRAS Plants / Others
Canoas - RS (Massey Ferguson, Valtra)
Santa Rosa - RS (Fendt, Massey Ferguson, Valtra)
Ibirubá - RS (Fendt, Massey Ferguson, Valtra, Precision Planting)
Campinas - SP (Fendt, Massey Ferguson, Valtra, Precision Planting)
AGCO
AGRALE
Jundiaí - SP (Fendt, Massey Ferguson, Valtra, Precision Planting)
Mogi das Cruzes - SP (Massey Ferguson, Valtra e Fendt)
Marau - RS (GSI)
Passo Fundo - RS (GSI)
Caxias do Sul - RS (Unidade 1)
Caxias do Sul - RS (Unidade 2)
Caxias do Sul - RS (Unidade 3)
São Mateus - ES (Unidade 4)
AUDI São José dos Pinhais - PR
BMW Araquari - SC
Anápolis - GO
CAOA
Jacareí - SP
Piracicaba - SP
Caterpillar
Campo Largo - PR
CNH Industrial
PRODUTOS / SERVIÇOS
/ SERVICES
Tratores Tractors
Colheitadeiras, plataformas Combine harvesters, headers
Plantadeiras, semeadeiras, distribuidores, carregadores frontais Planters, seeders, spreaders, front loaders
Centro de treinamento Training center
Central de distribuição de peças, Escritório Central AGCO América Latina Parts distribution center, headquarter latin america
Tratores, motores, grupo geradores, laboratório de controle de emissões, pulverizadores
Tractors, engines, power generation, emission control laboratory, sprayers
Equipamentos para proteína animal Animal protein equipments
Armazenamento de grãos Grain storage
Tratores de rodas, motores, componentes Wheel tractors, engines and component
Comerciais leves, caminhões leves e médios, chassis para ônibus
Light commercial vehicles, lighet and medium trucks, bus chassis
Componentes de veículos e tratores e cabines Vehicle and tractor components and cabins
Chassis para ônibus Buses chassis
Automóveis Cars
Automóveis Cars
Automóveis, comerciais leves, caminhões Cars, light commercial vehicles, trucks
Automóveis Cars
Motoniveladoras, escavadeiras, carregadeiras, tratores de esteiras, compactadores, geradores de energia elétrica, mangueiras hidráulicas, remanufaturados e Centro de Distribuição de Peças
Carregadeiras de rodas, retroescavadeiras, miniescavadeiras e minicarregadeiras
Motor graders, excavators, loaders, crawler tractors, compactors, electric power generators, hydraulic hoses, remanufactured products, and parts distribution center
Wheel loaders, backhoe loaders, mini excavators, and skid steer loaders
Curitiba - PR Motores Engines
Macaé - RJ Turbinas e compressores Turbines and compressors
Curitiba - PR (Case IH, New Holland Agriculture)
Piracicaba - SP (Case IH, New Holland Agriculture)
Contagem - MG (Case Construction Equipment, New Holland Construction)
Sorocaba - SP (Case IH, New Holland Agriculture)
Tratores de rodas, plataformas e colheitadeiras de grãos Wheel tractors, platforms and grain combines
Colheitadeiras de café, colhedoras de cana, plantadeiras, pulverizadores
Tratores de esteiras, retroescavadeiras, pás-carregadeiras, motoniveladoras, escavadeiras hidráulicas
Coffee combines, sugar cane combines, tillers, sprayers
Track-type tractors, backhoes, loaders, motorgraders, hydraulic excavators
Colheitadeiras de grãos, centro de distribuição Grain combines, parts distribution center
DAF
Ponta Grossa - PR
Caminhões e distribuição de peças Trucks and parts distribution center
30 | Anuário da Indústria Automobilística Brasileira | Brazilian Automotive Industry Yearbook | 2024
1.2
PRODUCTS
2024
EMPRESAS Companies UNIDADES INDUSTRIAIS / OUTRAS Plants / Others
Ford
Tatuí - SP
Salvador - BA
Barueri - SP
Cajamar - SP
São Paulo - SP
DA INDÚSTRIA AUTOMOBILÍSTICA BRASILEIRA
Automotive Industry Yearbook ANUÁRIO DA INDÚSTRIA AUTOMOBILÍSTICA BRASILEIRA
• Brazilian Automotive Industry Yearbook
PRODUTOS / SERVIÇOS
PRODUCTS / SERVICES
Campo de provas e desenvolvimento de veículos Proving grounds and development of vehicles
Centro de desenvolvimento do produto e engenharia Product development center and engineering
Centro de distribuição de peças Parts distribution center
Centro de distribuição de peças Parts distribution center
Centro de Desenvolvimento e Treinamento de Recursos Humanos Ford Academy Development center and human resources training
GM São Caetano do Sul - SP Automóveis Cars
Mogi das Cruzes - SP Fábrica de componentes Components
Indaiatuba - SP
Sorocaba - SP
São José dos Campos - SP
Gravataí - RS
Joinville - SC
Sumaré - SP
Honda
HPE
Itirapina - SP
Catalão - GO
São Paulo - SP
Hyundai Piracicaba - SP
Iveco Sete Lagoas - MG
Jaguar Land Rover
Itatiaia - RJ
Suzano - SP
Arujá - SP
São Paulo - SP
Pinhais - PR
Lagoa Santa - MG
Parauapebas - PA
Campo de provas Proving grounds
Centro de distribuição de peças Parts distribution center
Automóveis Cars
Automóveis Cars
Fábrica de motores e cabeçotes Engines and cylinder head
Motores e cabeçotes Engines and cilynder head
Automóveis Cars
Automóveis, comerciais leves Cars, light commercial vehicles
Escritório de serviços Service office
Automóveis Cars
Veículos comerciais, veículos para transporte de passageiros e veículos de defesa
Commercial vehicles, passangers transportation vehicles, defense vehicle
Automóveis e clínica de restauração Cars and restoration clinic
Tratores de esteiras, escavadeiras hidráulicas, páscarregadeiras, motoniveladoras
Track-type tractors, hydraulic excavators, loaders & backhoes, motorgraders
Cabines, tanques, caçambas Cabins, tanks, buckets and other products
Escritório de serviços de vendas e marketing para equipamentos de construção
Sales and marketing office for construction equipment
Máquinas florestais Forest machinery - harvester, forwarders
Escritório de serviços de vendas e marketing para equipamentos de mineração, centro de distrubuição de peças
Escritório de serviços de vendas e marketing para equipamentos de mineração, centro de distrubuição de peças
Sales and marketing office for mining equipment, parts distribution center
Sales and marketing office for mining equipment, parts distribution center
2024 | Anuário da Indústria Automobilística Brasileira | Brazilian Automotive Industry Yearbook | 31
ANUÁRIO
Brazilian
Komatsu
Indústria automobilística brasileira
Brazilian automotive industry
1.2 Empresas associadas à ANFAVEA - Unidades industriais e outras - 2023
1.2 ANFAVEA member companies - Plants and other facilities - 2023
EMPRESAS Companies UNIDADES INDUSTRIAIS / OUTRAS Plants / Others
São Paulo - SP
Limeira - SP
Mercedes-Benz Cars & Vans
Cariacica - ES
São Bernardo do Campo - SP
Mercedes-Benz
Campinas - SP
PRODUTOS / SERVIÇOS PRODUCTS / SERVICES
Escritório e matriz no Brasil para automóveis e vans Central office for cars and vans
Centro logístico e centro de treinamento Parts logistics center and training for cars and vans
Centro de preparação automóveis e vans Car and van preparation center
Caminhões, chassis para ônibus, motores, eixos e transmissões, centro de desenvolvimento tecnológico, administração e Regional Center Daimler Latina
Peças e serviços ao cliente, logística de peças de reposição, centro de treinamento, centro de competência técnica, peças remanufaturadas, alliance truck parts e central de relacionamento com o cliente
Trucks and buses chassis, engines, axles and transmissions, technological development center, headquarter and latin daimler regional center
Aftersale services, parts logistics center, training center, remanufactured parts and client service. Parts and services to clients, parts logistics centers, training center, technical competence center, remanufactured parts, alliance truck parts and clients relation center
Juiz de Fora - MG Cabinas de caminhões Trucks cabins
Nissan Resende - RJ Automóveis Cars
Renault
São José dos Pinhais - PR (Fábrica Curitiba veículos de passeio)
São José dos Pinhais - PR (Fábrica Curitiba veículos utilitários)
Scania São Bernardo do Campo - SP
Betim - MG
Goiana - PE
Stellantis
Automóveis Cars
Comerciais leves Light commercial vehicles
Caminhões, chassis de ônibus, motores Trucks, bus chassis, engines
Automóveis, comerciais leves, motores, transmissões Cars, light commercial vehicles, engines, transmissions
Automóveis, comerciais leves Cars, light commercial vehicles
Porto Real - RJ Automóveis Cars
Porto Real - RJ Motores, usinagem de blocos e cabeçotes e armazém de peças Engines, block and cilynder head machining and part warehouse
Indaiatuba - SP
Toyota
Sorocaba - SP
Automóveis Cars
Automóveis, sede administrativa, centro de treinamento e centro de visitas Cars, headquarter, training center and visitor center
Porto Feliz - SP Motores Engines
São Bernardo do Campo - SP
Volkswagen
Volkswagen
Caminhões e Ônibus
Automóveis, comerciais leves Cars, light commercial vehicles
Taubaté - SP Automóveis Cars
Vinhedo - SP Centro de distribuição Distribution center
São José dos Pinhais - PR Automóveis Cars
Resende - RJ
Volvo Curitiba - PR
Caminhões e chassis para ônibus Trucks and bus chassis
Caminhões, chassis para ônibus, cabines, motores, transmissões Trucks, bus chassis, cabins, engines and transmission
32 | Anuário da Indústria Automobilística Brasileira | Brazilian Automotive Industry Yearbook | 2024
1.3 Empresas associadas à ANFAVEA - Unidades industriais - Distribuição geográfica
1.3 ANFAVEA member companies - Plants - Geographic distribution
Autoveículos, máquinas agrícolas e rodoviárias, motores e componentes / Vehicles, agricultural and higway construction machinery, engines and autoparts
TOTAL BRASIL / TOTAL BRAZIL
Unidades industriais
Industrial units
COMPLEXO INDUSTRIAL
As 26 empresas associadas à ANFAVEA reúnem 52 unidades industriais (autoveículos, máquinas agrícolas e rodoviárias, motores, componentes e outros produtos). As fábricas estão sediadas em nove estados (Rio Grande do Sul, Santa Catarina, Paraná, São Paulo, Rio de Janeiro, Minas Gerais, Espírito Santo, Goiás, Pernambuco) e 37 municípios.
INDUSTRIAL COMPLEX
The 26 companies associated to ANFAVEA have 52 industrial units (vehicles, agricultural and highway construction machinery, engines and components). The plants are located in 9 states and 37 cities.
2024 | Anuário da Indústria Automobilística Brasileira | Brazilian Automotive Industry Yearbook | 33 2024 ANUÁRIO DA INDÚSTRIA AUTOMOBILÍSTICA BRASILEIRA Brazilian Automotive Industry Yearbook
NORTHEAST Pernambuco ................................... 1 TOTAL .............................................. 1 CENTRO - OESTE / MIDWEST Goiás 2 TOTAL 2 SUL / SOUTH Paraná ........................................... 10 Rio Grande do Sul ........................... 7 Santa Catarina ............................... 2 TOTAL ............................................ 19 SUDESTE / SOUTHEAST Espírito Santo 1 Minas Gerais 4 Rio de Janeiro 5 São Paulo 20 TOTAL 30
NORDESTE /
52
1.4 Concessionárias de autoveículos por empresa e unidade da federação - 2023
1.4 Vehicle dealer network by company and by state - 2023
EMPRESAS / COMPANIES
REGIÕES
UNIDADES DA FEDERAÇÃO Regions - States


automobilística brasileira Brazilian automotive industry 34 | Anuário da Indústria Automobilística Brasileira | Brazilian Automotive Industry Yearbook | 2024
Indústria
AGRALE AUDI CAOA 2 DAF FCA 3 FORD G.M.B. HPE 4 NORTE / NORTH 7 2 3 12 5 41 13 19 12 16 17 AMAZONAS 1 1 1 3 1 4 1 3 1 1 2 PARÁ 3 1 1 5 2 14 2 7 3 7 7 RONDÔNIA 2 - 1 1 1 11 5 3 4 3 3 ACRE 1 - - - - 3 1 1 1 1 1 AMAPÁ - - - 1 - 2 1 1 1 1 1 RORAIMA - - - 1 - 2 1 1 1 1 1 TOCANTINS - - - 1 1 5 2 3 1 2 2 NORDESTE / NORTHEAST 6 9 8 23 10 128 16 56 31 25 37 MARANHÃO 2 1 1 2 - 13 2 5 2 2 3 PIAUÍ - 1 1 1 1 10 1 3 1 2 3 CEARÁ - 1 1 3 1 15 2 9 4 4 5 RIO GRANDE DO NORTE - 1 1 2 1 8 1 3 2 2 3 PARAÍBA - 1 1 3 1 9 1 7 3 2 3 PERNAMBUCO - 1 1 3 2 23 2 10 6 5 7 ALAGOAS - 1 1 2 1 9 1 3 2 2 3 SERGIPE 1 1 - 1 1 4 1 2 2 1 2 BAHIA 3 1 1 6 2 37 5 14 9 5 8 SUDESTE / SOUTHEAST 10 17 27 65 15 307 37 183 104 48 112 MINAS GERAIS 2 3 4 13 6 75 7 38 17 13 23 ESPÍRITO SANTO 1 1 1 3 1 20 3 7 5 2 6 RIO DE JANEIRO - 1 2 10 1 52 3 28 15 10 18 SÃO PAULO 7 12 20 39 7 160 24 110 67 23 65 SUL / SOUTH 13 10 15 26 12 166 29 77 43 32 46 PARANÁ 2 4 4 7 4 54 11 26 14 9 15 SANTA CATARINA 5 4 7 10 3 48 11 20 15 11 16 RIO GRANDE DO SUL 6 2 4 9 5 64 7 31 14 12 15 CENTRO-OESTE / MIDWEST 4 4 5 12 8 75 18 30 18 12 23 MATO GROSSO 2 1 1 3 3 13 4 6 4 3 5 MATO GROSSO DO SUL 1 1 2 2 2 13 4 6 4 3 4 GOIÁS - 1 1 5 2 32 7 11 6 4 9 DISTRITO FEDERAL 1 1 1 2 1 17 3 7 4 2 5 TOTAL 40 42 58 138 50 717 113 365 208 133 235 (1) Inclui rede Mini / Includes Mini network (2) Inclui rede Hyundai, Subaru e Chery / Includes Hyundai, Subaru and Chery network (3) Inclui rede Chrysler / Includes Chrysler network (4) Inclui rede Mitsubishi e Suzuki / Includes Mitsubishi and Suzuki network (5) Inclui rede Peugeot e Citroën / Includes Peugeot and Citroën network (2) (1) (3) (4)


EMPRESAS / COMPANIES


FONTE / SOURCE: ANFAVEA.
NOTAS / NOTES:
1. Referem-se a concessionários plenos (vendas de veículos e pós-vendas). Não inclui postos autorizados de serviços. / 1. Refers to full dealers (vehicle sales and after-sales). It does not include authorized service stations.
2. Posicão em dezembro de 2023, exceto FCA, Ford e Nissan sobre as quais as informações referem-se a dezembro/2022.
2. Position in December 2023, except FCA, Ford and Nissan for which the information refers to December/2022.
2024 | Anuário da Indústria Automobilística Brasileira | Brazilian Automotive Industry Yearbook | 35 2024 ANUÁRIO DA INDÚSTRIA AUTOMOBILÍSTICA BRASILEIRA Brazilian Automotive Industry Yearbook
TOTAL Total JAGUAR / Land Rover MERCEDES-BENZ IVECO RENAULT SCANIA VOLKS/ caminhões e VOLVO 9 3 11 11 24 14 9 14 25 13 11 291 1 1 1 1 2 1 1 1 2 1 1 32 1 1 3 4 6 5 3 5 10 4 4 98 1 - 2 1 10 3 3 3 6 2 2 67 1 - 1 1 - 1 - 1 2 1 - 17 1 - 1 1 2 1 - 1 1 1 1 18 1 - 1 1 2 1 - 1 1 1 - 17 3 1 2 2 2 2 2 2 3 3 3 42 15 7 23 30 57 47 14 38 73 29 16 699 2 1 2 2 4 3 2 4 5 3 3 64 1 1 2 2 4 3 1 4 4 1 1 48 2 1 2 5 8 5 1 5 9 3 1 87 1 1 1 2 4 3 1 2 5 3 1 48 1 1 2 2 4 6 1 3 6 2 1 60 1 1 4 7 11 10 1 5 13 6 1 121 2 - 2 2 4 2 1 2 6 2 1 49 1 - 1 1 4 1 - 1 4 1 1 31 4 1 7 7 14 14 6 12 21 8 6 191 27 17 58 87 167 110 25 94 188 58 31 1.787 7 2 19 16 31 20 7 21 48 18 9 398 2 1 1 4 8 6 1 6 8 3 2 92 4 2 6 15 24 18 1 16 27 5 3 261 14 12 32 52 104 66 16 51 105 32 17 1.036 20 7 34 38 79 77 25 34 102 35 35 957 8 2 12 11 24 17 8 14 31 11 13 301 8 4 11 13 26 31 10 10 34 15 14 326 4 1 11 14 29 29 7 10 37 9 8 330 9 4 14 15 29 20 8 21 34 11 13 388 3 1 4 4 5 4 3 6 7 3 3 90 1 1 3 2 4 3 2 4 7 3 4 76 4 1 6 5 12 7 2 6 11 4 5 141 1 1 1 4 8 6 1 5 9 1 1 81 80 38 140 181 356 268 81 201 422 146 106 4.122
(
5 )
Indústria automobilística brasileira
1.5 Concessionárias de máquinas agrícolas e rodoviárias por empresa e unidade da federação - 2020 1.5 Agricultural and highway construction machinery dealer network by company and by state - 2020


FONTE / SOURCE: ANFAVEA. * Dados referentes a 2020.
Brazilian automotive industry 36 | Anuário da Indústria Automobilística Brasileira | Brazilian Automotive Industry Yearbook | 2024
REGIÕES UNIDADES DA FEDERAÇÃO Regions - States EMPRESAS / COMPANIES TOTAL TOTAL AGRALE CATERPILLAR CNH KOMATSU NORTE / NORTH 20 4 12 42 6 84 AMAZONAS 1 - 1 2 1 5 PARÁ 7 2 8 9 3 29 RONDÔNIA 5 1 1 10 1 18 ACRE 1 1 1 4 - 7 AMAPÁ 1 - - 1 - 2 RORAIMA 5 - - 4 - 9 TOCANTINS - 1 12 1 14 NORDESTE / NORTHEAST 33 4 11 44 4 96 MARANHÃO 4 1 2 7 1 15 PIAUÍ - - 1 9 - 10 CEARÁ 2 1 1 3 1 8 RIO GRANDE DO NORTE 2 - 1 2 - 5 PARAÍBA 2 - 1 2 - 5 PERNAMBUCO 3 1 1 3 1 9 ALAGOAS 2 - 1 2 - 5 SERGIPE 2 - 1 4 - 7 BAHIA 16 1 2 12 1 32 SUDESTE / SOUTHEAST 120 14 19 108 8 269 MINAS GERAIS 45 6 6 39 4 100 ESPÍRITO SANTO 4 2 1 6 1 14 RIO DE JANEIRO 5 1 2 3 1 12 SÃO PAULO 66 5 10 60 2 143 SUL / SOUTH 137 23 9 145 6 320 PARANÁ 45 3 5 58 3 114 SANTA CATARINA 23 9 3 25 2 62 RIO GRANDE DO SUL 69 11 1 62 1 144 CENTRO-OESTE / MIDWEST 61 14 7 108 5 195 MATO GROSSO 24 8 2 50 1 85 MATO GROSSO DO SUL 17 2 2 26 1 48 GOIÁS 19 4 2 30 2 57 DISTRITO FEDERAL 1 - 1 2 1 5 T O T A L 371 59 58 447 29 964
*

Indústria automobilística brasileira
1.6 Faturamento líquido por setor - 1966/2022 (Milhões US$)
1.6 The automotive industry’s net revenue by sector - 1966/2022 (US$ millions)
Brazilian automotive industry 38 | Anuário da Indústria Automobilística Brasileira | Brazilian Automotive Industry Yearbook | 2024
ANO Year AUTOVEÍCULOS Vehicles MÁQUINAS AGRÍCOLAS E RODOVIÁRIAS Agricultural and highway construction machinery TOTAL Total 1966 861 48 909 1967 935 39 974 1968 1.117 59 1.177 1969 1.332 67 1.399 1970 1.562 80 1.642 1971 1.908 130 2.038 1972 2.330 214 2.544 1973 3.030 489 3.518 1974 4.053 723 4.776 1975 4.856 1.074 5.929 1976 5.181 1.079 6.260 1977 5.558 1.020 6.578 1978 6.628 815 7.443 1979 6.335 1.062 7.397 1980 6.081 1.159 7.240 1981 5.532 1.262 6.794 1982 6.417 1.227 7.643 1983 4.806 807 5.613 1984 4.776 1.145 5.921 1985 5.848 1.299 7.147 1986 6.189 1.344 7.533 1987 7.466 1.933 9.399 1988 9.843 2.046 11.888 1989 12.160 2.695 14.855 1990 10.708 1.942 12.650 1991 9.421 1.500 10.921 1992 11.482 1.602 13.084 1993 14.784 1.741 16.525 1994 20.001 2.754 22.755 1995 22.582 1.573 24.155 1996 24.743 1.461 26.203 1997 27.282 1.816 29.097 1998 25.254 2.295 27.549 1999 14.936 1.429 16.365 2000 18.366 1.705 20.071 2001 16.029 1.683 17.711 2002 13.831 1.890 15.721 2003 15.698 2.388 18.086 2004 22.306 3.862 26.168 2005 30.663 3.519 34.182 2006 37.344 3.784 41.128 2007 52.316 5.884 58.201 2008 65.599 7.920 73.519 2009 62.366 5.953 68.319 2010 83.116 9.386 92.502 2011 93.566 11.835 105.401 2012 83.633 10.296 93.929 2013 87.294 11.587 98.881 2014 75.038 9.863 84.901 2015 45.665 5.130 50.794 2016 41.336 5.598 46.934 2017 52.220 7.027 59.247 2018 54.055 7.798 61.853 2019 52.020 7.182 59.202 2020 34.079 5.555 39.634 2021 47 413 6 182 53 595 2022 60.478 9.344 69.822 Milhões US$ / US$ millions FONTE / SOURCE: ANFAVEA NOTAS / NOTES: 1 Faturamento sem impostos. / Tax free revenue 2 Valores convertidos em dólar pela taxa média de cada ano / Real prices converted into dollars using the average exchange rate of each year. Autoveículos vehicles Máquinas agrícolas e rodoviárias Agricultural and highway construction machinery US$ bilhões / billion 0 20 60 40 120 100 80 1966 1970 1975 1980 1985 1990 1991 1992 1993 1994 1995 1996 1997 1998 1999 2000 2001 2002 2003 2004 2005 2006 2007 2008 2009 2010 2011 2012 2013 2014 2015 2016 2017 2018 2019 2020 2021 2022
ESCREVENDO O FUTURO A PARTIR DO ZERO.
Zero acidente.
Zero emissão.
Zero congestionamento.
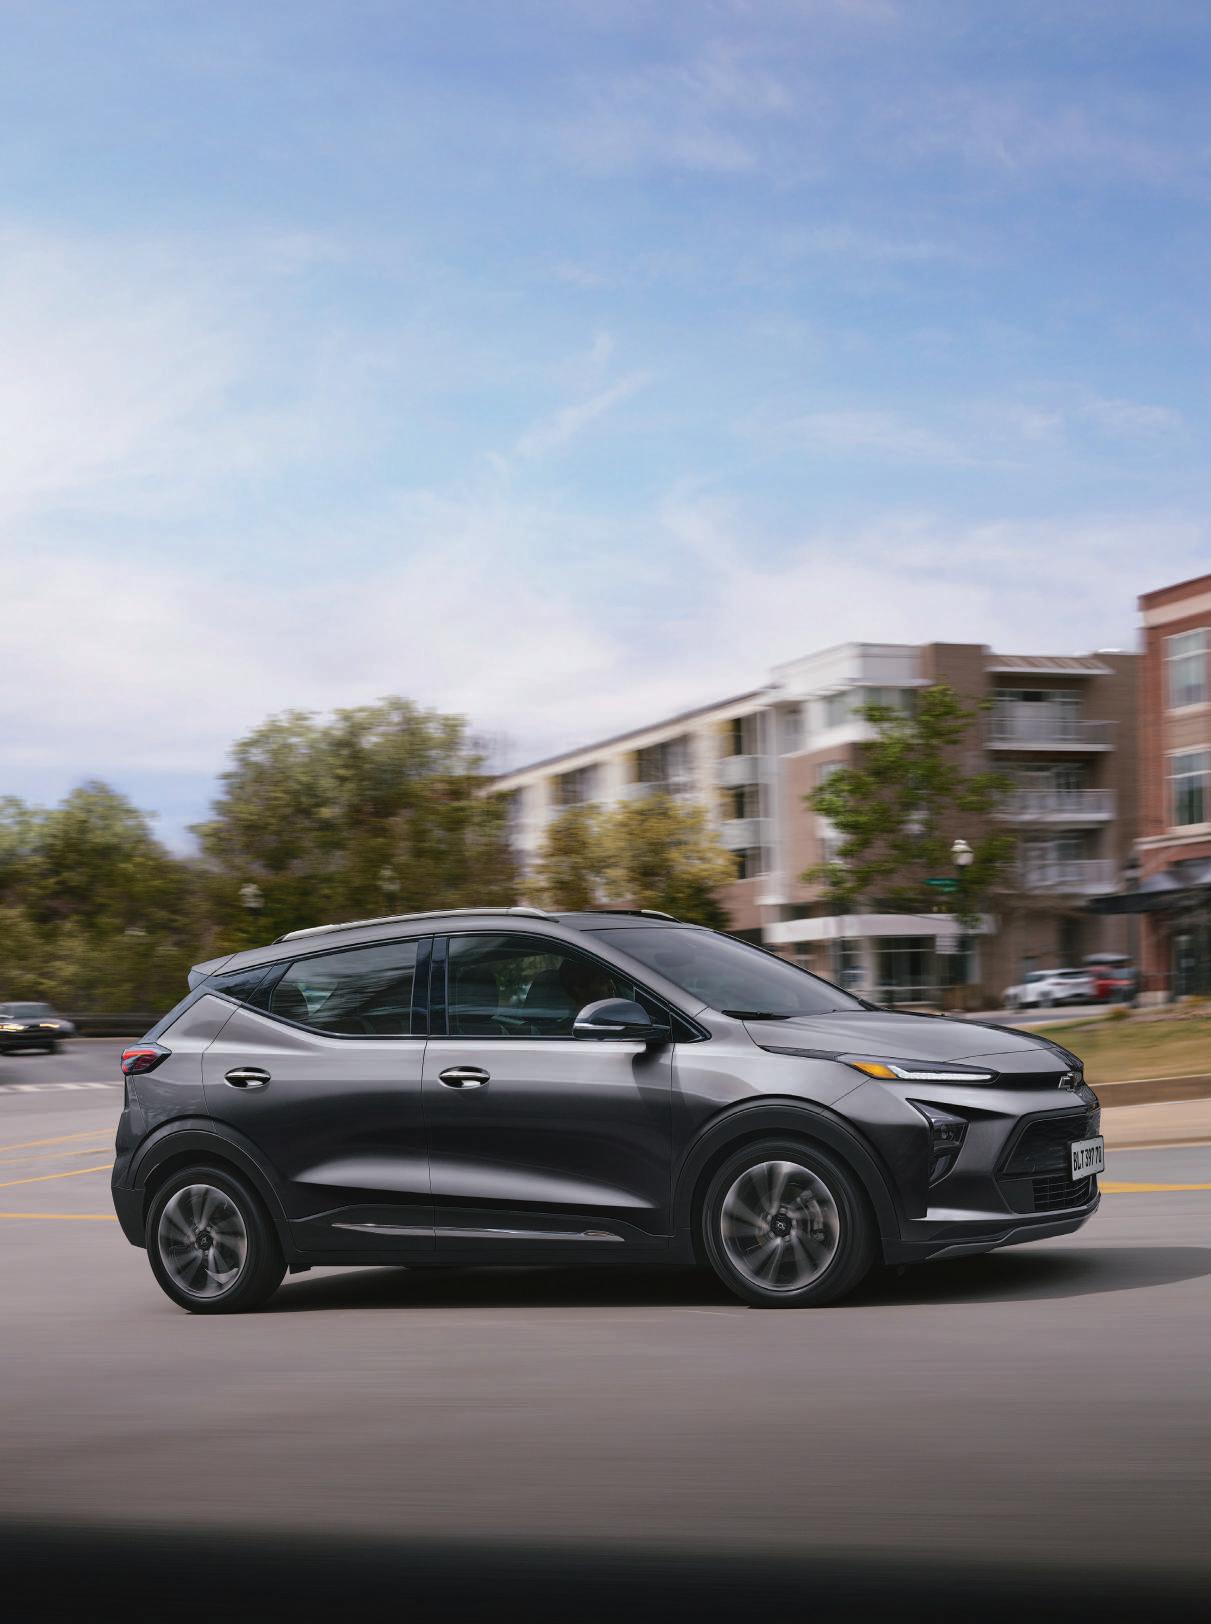
A GM compartilha a visão de um futuro com zero acidente, zero emissão e zero congestionamento. Assumimos o compromisso da neutralidade em emissões de carbono até 2040. Estamos investindo 35 bilhões de dólares até 2025 para lançar 30 modelos 100% elétricos em todo o mundo. No Brasil, já anunciamos novos modelos da Chevrolet que, junto ao Bolt EUV, vão complementar o portfólio zero emissão no país.
Os veículos Chevrolet estão em conformidade com o Proconve - Programa de Controle da Poluição do Ar por Veículos Automotores. SAC: 0800 702 4200.
Paz no trânsito começa por você.
automotive industry
1.7 Faturamento e investimento da indústria de autopeças - 2016/2022 (Bilhões US$)
1.7 The autoparts industry’s total revenues and investment - 2016/2022 (US$ billions)
FONTE / SOURCE: Sindipeças
(e) Estimativa / Estimated NOTAS / NOTES:
1) Faturamento das empresas associadas ao Sindipeças. / Invoicing of companies associated with Sindipeças.
2) Faturamento convertido em dólar pela taxa média de cada ano. / Invoicing converted into dollars at the average rate for each year.
DE AUTOPEÇAS POR DESTINO - 2016 E 2022
THE AUTOPARTS INDUSTRY’S TOTAL REVENUES PER DESTINATION - 2016 E 2022

Indústria automobilística brasileira Brazilian
40 | Anuário da Indústria Automobilística Brasileira | Brazilian Automotive Industry Yearbook | 2024
ANO Year FATURAMENTO / REVENUE INVESTIMENTO INVESTMENT TOTAL Total DISTRIBUIÇÃO PERCENTUAL POR DESTINO PERCENTAGE DISTRIBUTION BY DESTINATION TOTAL Total MONTADORAS Assemblers REPOSIÇÃO Replacement EXPORTAÇÕES Exports INTRASSETORIAL Intrasectorial 2016 20,04 61,8 18,2 14,2 5,9 1,00 2017 26,07 62,8 18,1 12,8 6,3 1,40 2018 29,45 61,1 17,7 15,3 6,0 1,45 2019 28,35 64,4 17,1 13,2 5,3 1,42 2020 19,99 62,1 19,4 13,1 5,4 1,04 2021 27,71 63,4 18,6 12,9 5,1 1,14 2022e 31,41 64,2 19,0 11,9 4,9 1,29
DA
FATURAMENTO
INDÚSTRIA
Bilhões de US$ US$ billions Bilhões de US$ US$ billions Indústria automobilística / Auto Industry Exportações / Exports Intrassetorial / Intrasectorial Mercado de reposição / Afthermarket 4,9 % 11,9% 19,0% 64,2% 2016 2022 5,9 % 14,2% 18,2% 61,8%
Indústria automobilística brasileira
1.8 Emprego por setor - 1957/2023 (pessoas) 1.8 Employment by sector - 1957/2023 (people)
Posição em 31 de dezembro de cada ano. / Position as of December 31 of each year.
FONTE / SOURCE: ANFAVEA.
NOTA / NOTE: A partir de 1997, esta tabela diz respeito a pessoas com contratos de trabalho firmados com as empresas associadas à ANFAVEA nas formas admitidas pela Consolidação das Leis de Trabalho (CLT). / After 1997, this table refers to individuals with employment contracts established with ANFAVEA members companies in accordance with current laws.
Brazilian automotive industry 42 | Anuário da Indústria Automobilística Brasileira | Brazilian Automotive Industry Yearbook | 2024
ANO Year AUTOVEÍCULOS Vehicles MÁQUINAS AGRÍCOLAS E RODOVIÁRIAS Agricultural and highway construction machinery TOTAL Total 1957 9.773 0 9.773 1958 19.248 0 19.248 1959 29.323 0 29.323 1960 38.410 60 38.470 1961 37.404 349 37.753 1962 48.523 1.267 49.790 1963 43.994 1.610 45.604 1964 44.414 1.882 46.296 1965 49.456 2.591 52.047 1966 50.662 2.431 53.093 1967 46.396 2.139 48.535 1968 60.437 2.516 62.953 1969 61.059 3.208 64.267 1970 65.902 4.140 70.042 1971 71.406 5.274 76.680 1972 80.430 7.852 88.282 1973 96.099 10.328 106.427 1974 104.072 13.323 117.395 1975 104.556 15.088 119.644 1976 112.429 16.428 128.857 1977 111.514 18.784 130.298 1978 123.974 18.679 142.653 1979 127.081 19.895 146.976 1980 133.683 20.256 153.939 1981 103.992 17.606 121.598 1982 107.137 17.835 124.972 1983 101.087 17.991 119.078 1984 107.447 22.609 130.056 1985 122.217 23.548 145.765 1986 129.232 28.436 157.668 1987 113.474 27.934 141.408 1988 112.985 25.661 138.646 1989 118.369 25.242 143.611 1990 117.396 20.978 138.374 1991 109.428 15.431 124.859 ANO Year AUTOVEÍCULOS Vehicles MÁQUINAS AGRÍCOLAS E RODOVIÁRIAS Agricultural and highway construction machinery TOTAL Total 1992 105.664 13.628 119.292 1993 106.738 13.897 120.635 1994 107.134 15.019 122.153 1995 104.614 10.598 115.212 1996 101.857 9.603 111.460 1997 104.941 10.408 115.349 1998 83.049 10.086 93.135 1999 85.100 9.372 94.472 2000 89.134 9.480 98.614 2001 84.834 9.221 94.055 2002 81.737 9.796 91.533 2003 79.047 11.650 90.697 2004 88.783 13.299 102.082 2005 94.206 13.202 107.408 2006 93.193 13.136 106.329 2007 104.274 16.064 120.338 2008 109.848 16.929 126.777 2009 109.043 15.435 124.478 2010 117.654 18.470 136.124 2011 124.647 19.987 144.634 2012 132.096 19.560 151.656 2013 135.343 21.627 156.970 2014 125.977 18.531 144.508 2015 117.660 15.440 133.100 2016 109.530 16.766 126.296 2017 109.910 18.365 128.275 2018 111.043 19.408 130.451 2019 106.705 18.891 125.596 2020 101.223 19.315 120.538 2021 101.050 -2022 101.889 -2023 98.933 - -
Pessoas / People
Pessoas / People
Indústria automobilística brasileira
1.9 Balança comercial da indústria automotiva (autoveículos, autopeças, máquinas agrícolas, máquinas rodoviárias, outros) - 2001/2023 (Milhões de US$)
1.9 Brazilian automotive industry trade balance (vehicles, autoparts, agricultural machinery, high way construction equipament and others) - 2001/2023 (US$ millions)
BRASIL • PAÍSES SELECIONADOS / BRAZIL • SELECTED COUNTRIES
Brasil • Argentina / Brazil • Argentina
44 | Anuário da Indústria Automobilística Brasileira | Brazilian Automotive Industry Yearbook | 2024 ANO Year AUTOVEÍCULOS Vehicles AUTOPEÇAS (1) Autoparts (1) MÁQUINAS AGRÍCOLAS Agricultural machinery MÁQUINAS RODOVIÁRIAS Highway machinery OUTRAS (2) Others (2) TOTAL Total Exportação Export Importação Import Exportação Export Importação Import Exportação Export Importação Import Exportação Export Importação Import Exportação Export Importação Import Exportação Export Importação Import 2001 2.640,1 2.017,0 3.910,7 4.416,5 167,2 30,7 315,3 94,6 428,4 84,6 7.461,7 6.643,4 2002 2.633,4 1.093,5 4.163,0 4.147,3 263,8 12,1 352,2 93,0 379,4 16,5 7.791,8 5.362,4 2003 3.566,5 828,0 5.137,3 4.503,9 502,2 13,5 467,9 166,9 482,0 5,1 10.155,9 5.517,4 2004 4.950,7 880,4 6.431,5 5.824,8 810,7 65,2 954,5 149,1 648,8 21,2 13.796,2 6.940,7 2005 7.076,8 1.350,6 7.855,0 7.070,2 827,0 38,0 1.320,9 302,9 993,8 73,8 18.073,6 8.835,5 2006 7.320,7 2.633,6 9.314,6 7.236,8 701,7 35,0 1.540,4 502,5 1.129,7 28,1 20.007,1 10.436,0 2007 7.800,3 4.083,5 9.939,8 9.772,2 1.018,2 103,1 1.646,2 362,1 1.257,8 68,8 21.662,3 14.389,7 2008 8.409,6 6.865,3 10.880,5 13.557,9 1.369,6 195,6 1.870,1 931,6 1.483,8 38,4 24.013,6 21.588,8 2009 4.621,1 6.971,1 7.071,7 9.508,1 654,2 136,3 618,1 861,5 788,4 46,6 13.753,5 17.523,6 2010 6.909,6 10.869,5 10.691,7 14.855,3 948,7 177,9 1.384,6 1.144,8 1.050,7 116,5 20.985,3 27.164,0 2011 7.656,8 14.709,4 12.537,5 17.999,3 1.048,5 280,8 2.215,1 1.507,4 1.323,6 166,9 24.781,4 34.663,8 2012 6.784,6 12.701,3 11.625,5 18.129,0 906,0 483,8 2.258,2 1.658,5 1.155,4 196,2 22.729,7 33.168,9 2013 8.739,5 12.622,1 10.748,4 21.347,0 912,3 228,4 1.864,8 1.258,9 1.162,9 128,9 23.427,9 35.585,4 2014 5.531,7 10.931,3 9.185,0 19.386,8 764,3 219,2 1.956,9 907,5 1.036,5 134,9 18.474,4 31.579,7 2015 5.822,2 7.059,2 8.222,6 14.601,1 500,4 108,2 1.401,6 548,7 924,4 92,2 16.871,1 22.409,3 2016 7.639,1 4.408,2 6.321,7 13.745,9 483,8 77,6 1.432,8 244,9 985,1 107,1 16.862,4 18.583,7 2017 10.715,7 4.945,3 7.043,1 13.210,4 322,7 50,2 2.362,1 177,7 1.146,0 96,7 21.589,5 18.480,2 2018 8.817,9 6.966,4 7.506,1 14.024,9 320,2 154,2 2.698,1 296,8 963,9 119,3 20.306,1 21.561,6 2019 5.774,1 6.165,1 6.611,5 11.904,9 237,9 187,0 2.333,2 365,1 924,0 153,5 15.880,7 18.775,6 2020 4.354,2 3.397,2 5.265,7 8.679,6 192,1 83,6 1.460,2 415,4 656,2 36,4 11.928 , 5 12.612,2 2021 5.485,1 5.289,4 6.635,4 17.871,2 236,6 66,9 2.421,4 747,8 591,1 66,0 15 369,7 24.041,3 2022 6.593,5 6.145,9 8.007,4 20 319,8 377,8 224,2 3.012,5 899,8 1.051,0 104,3 19.042,2 27.694,0 2023 6.435,8 6.675,9 9.302,2 19.554,7 419,8 301,4 4 180,3 974,3 1.010,2 118,1 21.348,3 27.624,4 ANO Year AUTOVEÍCULOS Vehicles AUTOPEÇAS (1) Autoparts (1) MÁQUINAS AGRÍCOLAS Agricultural machinery MÁQUINAS RODOVIÁRIAS Highway machinery OUTRAS (2) Others (2) TOTAL Total Exportação Export Importação Import Exportação Export Importação Import Exportação Export Importação Import Exportação Export Importação Import Exportação Export Importação Import Exportação Export Importação Import 2001 408,7 1.304,8 672,2 476,0 43,5 0,4 16,0 0,1 38,4 2,0 1.178,8 1.783,3 2002 167,1 646,0 364,7 403,5 19,5 1,2 0,2 - 4,0 3,4 555,5 1.054,1 2003 680,3 427,3 553,1 420,4 193,2 0,2 15,8 0,0 35,2 0,3 1.477,5 848,2 2004 1.493,1 495,4 876,5 642,7 291,8 0,1 61,6 0,1 84,2 8,1 2.807,2 1.146,4 2005 2.060,4 798,9 1.210,3 790,7 258,2 0,3 95,6 - 131,1 15,1 3.755,5 1.605,0 2006 2.316,8 1.510,7 1.776,1 865,4 223,3 0,1 130,0 0,0 179,8 10,8 4.626,0 2.387,0 2007 2.817,7 2.399,2 2.330,0 1.703,1 333,8 1,7 139,2 0,8 202,5 40,7 5.823,2 4.145,5 2008 3.791,9 3.522,4 3.088,2 1.390,9 405,1 7,3 106,9 2,1 217,8 18,4 7.609,9 4.941,1 2009 2.235,7 3.735,2 2.372,7 1.123,1 68,5 2,2 47,3 - 86,8 28,8 4.811,0 4.889,3 2010 3.986,9 5.404,9 3.915,8 1.459,6 262,4 1,0 132,2 0,0 261,9 68,1 8.559,2 6.933,5 2011 5.403,5 6.142,2 4.819,6 1.479,3 205,2 3,3 213,2 - 237,0 104,4 10.878,4 7.729,2 2012 4.531,0 6.459,3 4.112,4 1.526,8 187,9 2,5 102,6 0,3 169,6 94,7 9.103,5 8.083,6 2013 6.658,8 7.077,8 4.027,4 1.754,3 208,9 0,6 107,4 0,0 197,2 34,7 11.199,7 8.867,5 2014 3.629,9 5.868,4 3.037,3 1.464,2 78,1 0,3 78,2 - 109,2 13,6 6.932,7 7.346,5 2015 3.684,8 3.862,3 2.714,4 936,7 27,4 0,6 93,3 - 178,3 12,3 6.698,2 4.811,9 2016 4.960,4 2.928,9 1.843,7 747,9 107,2 0,5 176,7 - 206,0 1,9 7.294,0 3.679,3 2017 7.163,2 3.263,0 2.254,6 849,9 153,8 - 362,3 - 192,3 1,0 10.126,2 4.113,8 2018 5.288,2 4.400,2 2.030,4 835,7 118,3 - 154,3 - 111,1 1,6 7.702,2 5.237,5 2019 2.406,8 4.124,9 1.432,9 773,4 58,3 - 46,4 0,7 70,0 0,6 4.014,4 4.899,6 2020 2.061,7 2.317,7 1.177,8 522,2 63,2 - 38,0 - 119,7 0,2 3.460,5 2.840,1 2021 1.822,3 3.866,0 2.044,6 869,3 25,4 - 137,9 0,1 170,9 0,0 4.201,1 4 735, 4 2022 1.867,8 4.652,6 2 904,1 1.048,2 30,9 - 265,4 - 227,9 0,8 5.296,1 5.701,7 2023 1.732,6 4.793,5 3.394,1 886,2 7,5 - 112,2 - 241,1 0,0 5.487,5 5.679,7
Brazilian automotive industry
Milhões de US$ / US$ millions BRASIL
MUNDO
WORLD Milhões de US$ / US$ millions
•
/ BRAZIL •
Indústria automobilística brasileira
1.9 Balança comercial da indústria automotiva (autoveículos, autopeças, máquinas agrícolas, máquinas rodoviárias, outros) - 2001/2023 (Milhões de US$)
1.9 Brazilian automotive industry trade balance (vehicles, autoparts, agricultural machinery, high way construction equipament and others) - 2001/2023 (US$ millions)
Continuação da página 44 / Continuation from page 44
Brasil • Estados Unidos / Brazil • USA
46 | Anuário da Indústria Automobilística Brasileira | Brazilian Automotive Industry Yearbook | 2024 ANO Year AUTOVEÍCULOS Vehicles AUTOPEÇAS (1) Autoparts (1) MÁQUINAS AGRÍCOLAS Agricultural machinery MÁQUINAS RODOVIÁRIAS Highway machinery OUTRAS (2) Others (2) TOTAL Total Exportação Export Importação Import Exportação Export Importação Import Exportação Export Importação Import Exportação Export Importação Import Exportação Export Importação Import Exportação Export Importação Import 2001 618,2 82,6 331,9 120,1 10,9 0,2 32,1 0,0 117,0 0,3 1.110,1 203,2 2002 880,7 54,8 358,4 116,2 12,2 - 18,2 0,0 81,9 0,1 1.351,4 171,1 2003 1.193,5 30,9 355,8 119,0 14,9 - 41,6 0,0 65,3 - 1.671,1 149,9 2004 1.402,5 11,8 518,5 134,3 29,2 0,0 102,1 0,0 81,1 - 2.133,4 146,1 2005 1.456,8 43,7 662,4 147,4 49,5 - 104,6 0,0 114,0 - 2.387,3 191,1 2006 1.531,2 337,7 723,6 129,0 46,4 - 127,8 0,1 102,3 0,5 2.531,3 467,3 2007 1.087,5 548,2 769,1 185,5 81,1 - 106,3 0,1 96,7 0,1 2.140,7 733,9 2008 818,7 1.038,5 878,9 241,0 110,7 - 203,6 0,1 110,1 0,4 2.122,0 1.280,0 2009 533,4 947,5 537,8 196,6 60,6 3,8 13,6 2,6 23,9 - 1.169,3 1.150,5 2010 736,5 1.261,0 929,8 314,0 32,6 8,4 116,8 13,0 24,0 4,3 1.839,7 1.600,5 2011 526,0 2.072,1 1.115,5 421,7 39,1 12,7 129,0 11,4 33,9 0,0 1.843,4 2.517,9 2012 434,1 2.629,0 1.123,3 592,3 27,5 37,4 159,3 33,1 7,7 0,1 1.752,0 3.291,9 2013 456,7 1.978,1 957,6 855,5 24,0 0,0 173,9 21,9 64,0 - 1.676,2 2.855,5 2014 350,4 1.686,3 817,7 1.002,5 25,8 - 174,0 2,9 99,1 0,5 1.467,0 2.692,2 2015 545,8 1.004,2 776,8 943,7 28,5 - 89,2 0,3 88,9 6,4 1.529,1 1.954,5 2016 552,6 615,4 599,4 940,8 45,8 - 72,7 0,1 107,9 8,7 1.378,4 1.565,1 2017 734,9 772,5 616,4 1.197,5 5,2 - 86,7 0,1 86,7 1,0 1.529,9 1.971,1 2018 433,6 1.301,1 967,8 1.259,9 5,7 - 115,0 0,1 39,3 - 1.561,4 2.561,0 2019 656,3 979,9 902,8 943,4 10,9 - 98,4 0,1 35,9 - 1.704,3 1.923,4 2020 562,9 388,0 703,5 652,6 2,5 - 32,5 0,0 19,5 0,2 1 321,0 1 040, 8 2021 641,7 544,5 717,1 1.140,3 4,0 - 86,6 - 21,2 0,1 1 470,6 1.685,0 2022 974,6 513,7 755,9 1.366,3 6,3 - 171,3 - 51,2 - 1.959, 3 1.880,0 2023 1.686,4 909,8 957,9 1.380,4 17,1 - 247,0 - 127,3 - 3.035,7 2 . 290, 2
Brazilian automotive industry
ANO Year AUTOVEÍCULOS Vehicles AUTOPEÇAS (1) Autoparts (1) MÁQUINAS AGRÍCOLAS Agricultural machinery MÁQUINAS RODOVIÁRIAS Highway machinery OUTRAS (2) Others (2) TOTAL Total Exportação Export Importação Import Exportação Export Importação Import Exportação Export Importação Import Exportação Export Importação Import Exportação Export Importação Import Exportação Export Importação Import 2001 592,7 40,4 1.197,7 799,2 31,0 21,1 69,6 62,0 0,2 2,4 1.891,2 925,1 2002 651,8 11,3 1.532,9 763,1 34,6 4,2 104,2 55,1 0,3 2,5 2.323,8 836,2 2003 550,2 13,9 1.708,9 767,7 38,2 9,8 150,4 117,0 0,3 1,2 2.448,0 909,6 2004 217,9 18,5 2.046,3 915,3 65,8 60,4 358,5 105,3 0,7 1,8 2.689,2 1.101,3 2005 266,8 25,0 2.496,2 994,1 90,1 26,6 508,4 213,3 0,8 0,1 3.362,3 1.259,1 2006 228,1 36,7 2.757,6 1.025,1 39,5 17,2 506,6 359,2 1,8 0,7 3.533,6 1.438,9 2007 53,1 51,9 2.292,1 1.308,5 45,4 68,3 425,8 138,6 0,9 0,2 2.817,3 1.567,5 2008 6,5 115,4 2.087,2 1.622,6 37,5 98,5 348,4 366,4 1,2 1,4 2.480,8 2.204,3 2009 4,8 95,6 1.096,4 1.078,7 21,2 75,7 102,1 409,6 0,3 6,0 1.224,8 1.665,6 2010 5,8 144,4 1.678,8 1.887,0 33,1 117,8 256,8 485,8 1,1 4,8 1.975,6 2.639,9 2011 2,4 198,9 1.932,3 2.236,6 44,6 204,8 473,6 583,2 0,1 7,5 2.453,1 3.231,0 2012 1,8 115,5 1.817,0 2.019,8 25,3 334,8 498,3 683,5 1,0 7,8 2.343,4 3.161,4 2013 9,8 208,3 1.513,9 2.387,6 11,3 122,9 387,8 669,3 1,6 5,0 1.924,4 3.393,1 2014 11,0 254,6 1.468,4 2.348,0 8,7 143,3 622,3 507,4 0,7 12,2 2.111,1 3.265,5 2015 15,0 203,6 1.375,0 1.933,7 10,4 45,7 436,8 384,9 1,6 4,5 1.838,7 2.572,4 2016 249,2 71,3 1.057,1 2.004,9 9,4 29,8 436,7 147,2 0,1 4,7 1.752,6 2.257,9 2017 190,2 57,6 1.162,6 1.552,1 10,3 18,9 825,7 85,2 0,3 5,9 2.189,1 1.719,7 2018 19,0 123,1 1.439,9 1.602,8 11,2 126,2 1.150,6 145,5 0,7 4,9 2.621,4 2.002,6 2019 4,6 105,1 1.412,0 1.203,7 9,3 151,0 1.180,4 152,5 0,8 6,0 2.607,1 1.618,3 2020 5,3 48,2 1.010,3 928,1 12,5 50,7 676,1 265,1 0,8 3,8 1.704,9 1.295,9 2021 7,8 94,3 1.231,8 2.085,8 13,3 25,7 985,1 410,1 0,9 5,0 2.238,7 2.620,9 2022 10,2 149,2 1.385,9 2.577,2 31,6 141,9 1.217,9 182,8 10,1 5,8 2 .655,8 3 .056,7 2023 11,6 168,6 1 495,5 2.543,4 42,7 184,2 2.168,6 271,2 43,5 10,4 3.761,8 3 .177,9
Brasil • México / Brazil • Mexico
Milhões de US$ / US$ millions Milhões de US$ / US$ millions


Indústria automobilística brasileira
1.9 Balança comercial da indústria automotiva (autoveículos, autopeças, máquinas agrícolas, máquinas rodoviárias, outros) - 2001/2023 (Milhões de US$)
1.9 Brazilian automotive industry trade balance (vehicles, autoparts, agricultural machinery, high way construction equipament and others) - 2001/2023 (US$ millions)
Continuação da página 46 / Continuation from page 46
Brasil • União Europeia / Brazil • European Union
Brasil • China / Brazil • China
Brazilian automotive
48 | Anuário da Indústria Automobilística Brasileira | Brazilian Automotive Industry Yearbook | 2024 ANO Year AUTOVEÍCULOS Vehicles AUTOPEÇAS (1) Autoparts (1) MÁQUINAS AGRÍCOLAS Agricultural machinery MÁQUINAS RODOVIÁRIAS Highway machinery OUTRAS (2) Others (2) TOTAL Total Exportação Export Importação Import Exportação Export Importação Import Exportação Export Importação Import Exportação Export Importação Import Exportação Export Importação Import Exportação Export Importação Import 2006 11,1 0,7 199,8 433,5 0,7 1,7 6,3 4,9 - 0,0 218,0 440,7 2007 13,9 6,6 151,9 473,7 1,3 6,5 3,0 4,7 1,1 0,0 171,2 491,5 2008 0,7 117,6 164,2 874,1 1,1 12,8 4,9 42,8 5,8 0,7 176,8 1.048,0 2009 - 85,4 57,1 567,1 0,8 7,1 7,9 73,5 - 0,3 65,7 733,4 2010 0,1 215,5 134,0 1.218,5 3,3 8,7 2,4 160,5 0,0 3,4 139,9 1.606,5 2011 0,1 761,6 147,2 1.750,4 4,7 9,7 4,1 268,0 0,2 7,7 156,3 2.797,4 2012 0,0 181,5 155,9 1.752,7 2,1 12,6 15,1 251,8 1,8 3,7 174,9 2.202,3 2013 0,3 224,2 129,0 2.073,1 4,2 14,4 2,7 191,3 0,5 5,5 136,7 2.508,5 2014 0,7 156,9 116,0 2.067,3 7,2 11,3 7,5 161,8 0,7 9,1 132,1 2.406,4 2015 0,1 50,0 99,3 1.713,0 0,3 8,0 0,5 37,1 1,8 11,6 102,1 1.819,7 2016 0,2 24,6 89,9 1.986,5 2,8 2,8 0,4 43,0 5,0 4,0 98,2 2.060,9 2017 0,0 34,0 103,1 1.617,8 4,5 2,0 0,2 44,6 0,6 9,8 108,4 1.708,3 2018 0,0 54,6 94,5 1.855,7 2,1 2,1 - 49,1 0,0 21,8 96,7 1.983,3 2019 0,2 70,6 75,9 1.762,3 3,1 2,1 0,6 108,1 0,1 21,3 80,0 1.964,4 2020 0,1 70,1 65,8 1.557,3 1,7 1,2 0,0 69,5 0,0 5,1 67,7 1.703,2 2021 0,1 106,4 95,8 2.856,2 5,4 1,1 0,2 156,6 - 12,6 101,5 3.132,8 2022 0,0 79,3 88,4 3.314,9 9,4 6,1 - 495,1 0,0 21,9 97,9 3.917,3 2023 0,5 33,2 98,0 3.145,6 7,5 8,0 - 380,3 - 29,6 105,9 3.596,6 ANO Year AUTOVEÍCULOS Vehicles AUTOPEÇAS (1) Autoparts (1) MÁQUINAS AGRÍCOLAS Agricultural machinery MÁQUINAS RODOVIÁRIAS Highway machinery OUTRAS (2) Others (2) TOTAL Total Exportação Export Importação Import Exportação Export Importação Import Exportação Export Importação Import Exportação Export Importação Import Exportação Export Importação Import Exportação Export Importação Import 2001 147.7 215,9 820,7 2.101,1 3,1 6,4 37,0 24,3 9,3 23,0 1.017,8 2.370,7 2002 96,3 191,9 938,0 2.033,7 11,8 3,1 38,5 20,3 13,1 6,3 1.097,7 2.255,3 2003 120,2 232,3 1.220,3 2.210,7 17,4 3,5 49,9 28,6 22,8 3,4 1.430,6 2.478,5 2004 157,9 171,3 1.510,6 2.745,7 16,5 4,1 68,3 20,5 7,6 9,4 1.760,9 2.951,0 2005 844,2 278,2 1.752,7 3.389,6 26,9 7,4 73,8 36,7 23,5 56,0 2.721,1 3.768,0 2006 767,4 517,3 1.925,4 3.198,0 18,3 10,8 100,8 117,4 8,2 12,6 2.820,1 3.856,1 2007 898,7 489,5 2.168,8 4.384,6 22,2 15,3 131,6 74,1 20,8 12,5 3.242,1 4.976,0 2008 1.257,5 818,9 2.345,0 5.933,2 14,6 44,5 137,6 184,4 36,4 13,4 3.791,1 6.994,4 2009 724,1 740,6 1.347,9 3.539,1 7,9 26,3 23,1 128,5 2,8 9,2 2.105,8 4.443,7 2010 562,2 1.397,0 1.935,6 5.689,0 8,0 32,1 73,7 213,5 2,8 27,3 2.582,4 7.359,0 2011 123,8 2.074,7 2.101,9 6.844,8 19,4 35,4 152,5 292,6 5,3 39,9 2.402,9 9.287,3 2012 35,5 1.387,0 1.880,8 6.392,1 14,0 60,2 111,9 341,0 4,9 63,5 2.047,0 8.243,8 2013 63,8 1.759,5 1.947,4 7.738,8 4,1 64,6 59,4 213,5 4,5 73,7 2.079,1 9.850,1 2014 25,5 1.678,6 1.718,1 6.590,7 3,5 45,2 117,0 161,5 3,9 77,6 1.868,0 8.553,6 2015 8,6 1.073,0 1.589,5 4.444,7 1,6 32,9 32,2 53,8 4,1 39,1 1.636,1 5.643,5 2016 29,1 457,9 1.542,3 4.277,6 2,9 36,2 57,6 23,7 27,3 66,2 1.659,2 4.861,6 2017 19,1 425,6 1.531,7 3.855,5 3,3 18,3 225,5 29,5 42,3 44,2 1.821,8 4.373,0 2018 25,1 523,5 1.510,2 4.115,5 1,9 16,6 317,3 67,0 12,9 61,7 1.867,5 4.784,1 2019 26,0 423,4 1.413,5 3.361,2 1,6 25,5 162,6 48,7 2,4 98,9 1.606,1 3.957,7 2020 18,6 266,6 1.285,5 2.287,7 3,8 18,7 127,2 47,4 0,9 14,4 1.435,9 2.634,9 2021 29,6 376,0 1.142,8 5.734,4 6,6 28,8 145,5 97,9 2,3 8,2 1.327,0 6.245,3 2022 41,1 354,6 1.125,5 6 178,1 9,7 59,9 125,5 111,6 1,7 25,4 1. 303,6 6.729,5 2023 65,6 419,6 1.359,9 6 130,9 11,4 89,2 177,5 170,9 15,1 12,6 1.629,4 6 823,1
industry
Milhões de US$ / US$ millions Milhões de US$ / US$ millions


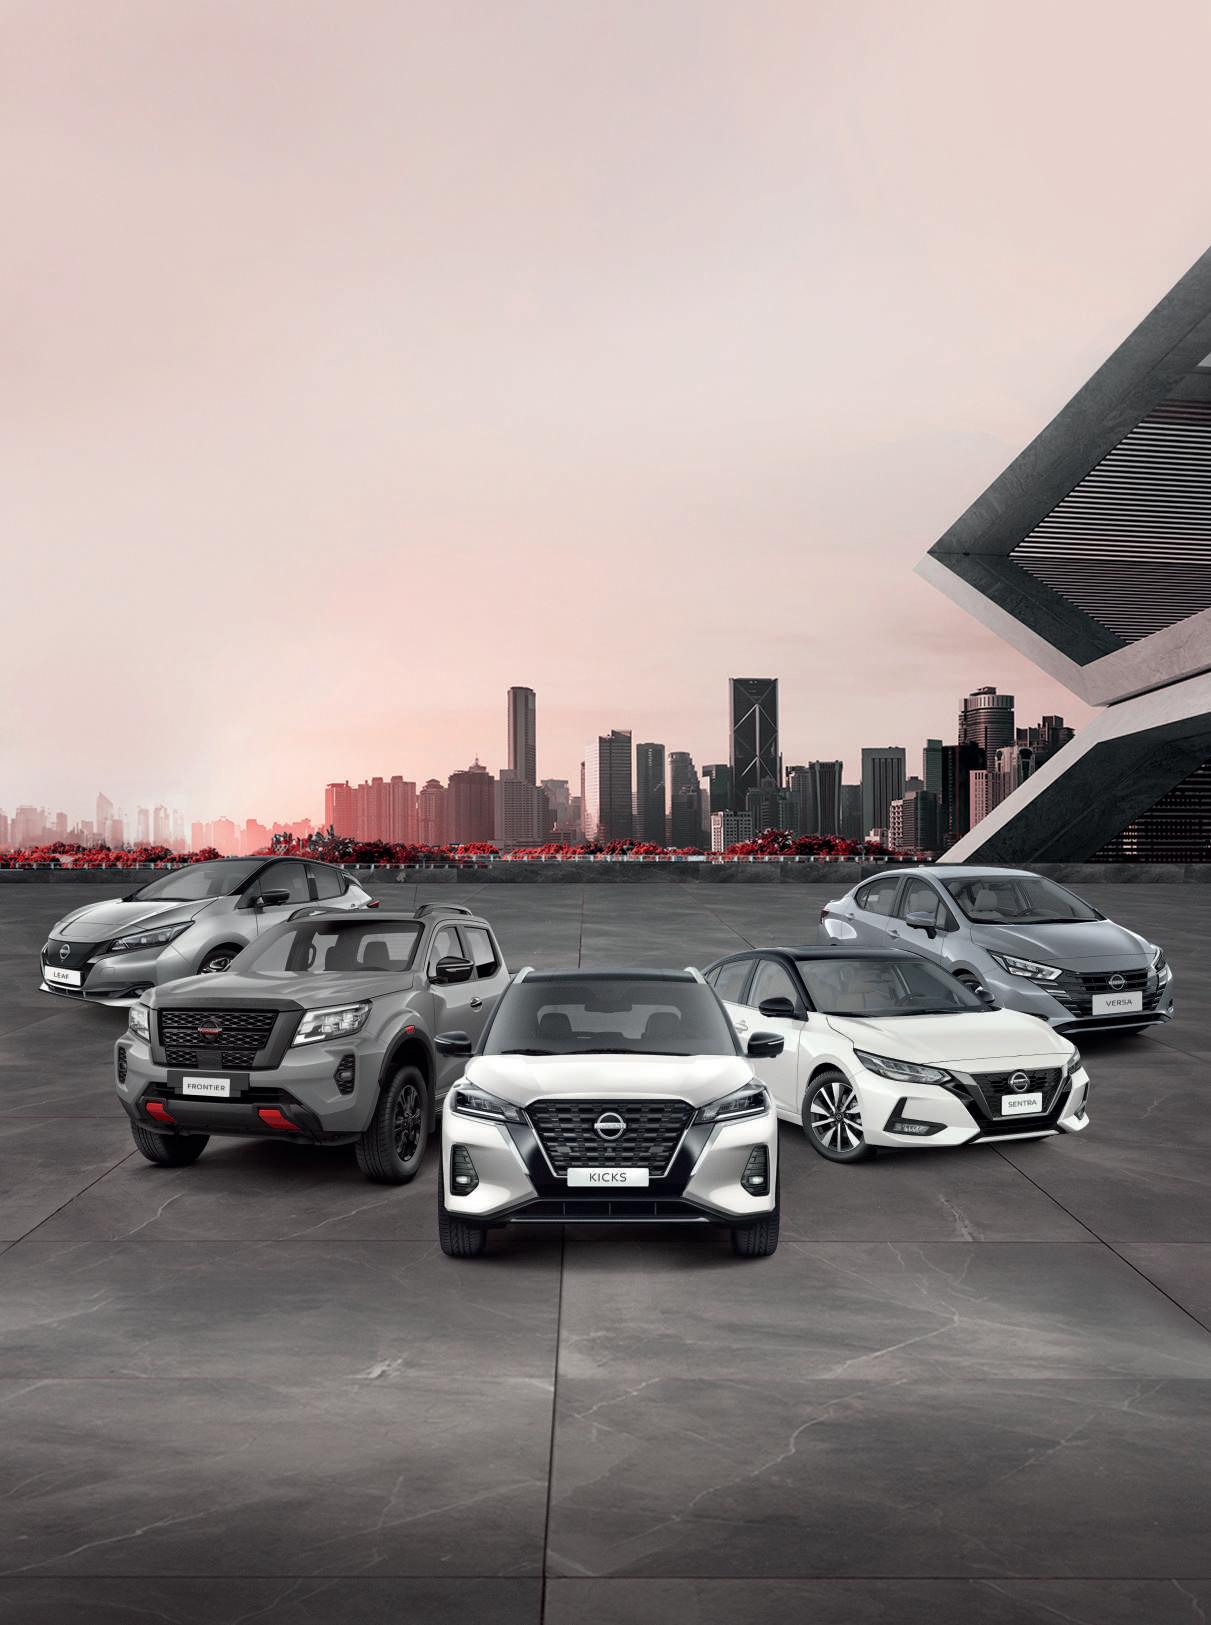
Saiba mais em: www.nissan.com.br Imagem meramente ilustrativa. Consulte versões, configurações e acessórios disponíveis no site. /nissanbrasil Paz no trânsito começa por você. O melhor do DNA japonês e a excelência do melhor pós-venda do Brasil você só encontra aqui, na Nissan.
Indústria automobilística brasileira
Brazilian automotive industry
1.9 Balança comercial da indústria automotiva (autoveículos, autopeças, máquinas agrícolas, máquinas rodoviárias, outros) - 2001/2023 (Milhões de US$)
1.9 Brazilian automotive industry trade balance (vehicles, autoparts, agricultural machinery, high way construction equipament and others) - 2001/2023 (US$ millions)
Continuação da página 48 / Continuation from page 48
• Coreia do Sul / Brazil • South Korea
Brasil • Japão / Brazil • Japan
50 | Anuário da Indústria Automobilística Brasileira | Brazilian Automotive Industry Yearbook | 2024
ANO Year AUTOVEÍCULOS Vehicles AUTOPEÇAS (1) Autoparts (1) MÁQUINAS AGRÍCOLAS Agricultural machinery MÁQUINAS RODOVIÁRIAS Highway machinery OUTRAS (2) Others (2) TOTAL Total Exportação Export Importação Import Exportação Export Importação Import Exportação Export Importação Import Exportação Export Importação Import Exportação Export Importação Import Exportação Export Importação Import 2006 62,2 99,3 16,8 74,0 0,2 - 0,1 23,5 - - 79,3 196,8 2007 10,0 349,5 10,4 116,0 - - - 67,1 0,0 0,1 20,5 532,7 2008 - 816,2 11,3 204,7 - - - 178,3 - - 11,3 1.199,2 2009 0,1 1.057,9 4,8 181,0 0,0 - 1,6 83,3 - - 6,4 1.322,2 2010 0,0 1.912,7 13,8 495,0 0,0 0,5 1,1 198,6 - 0,2 14,9 2.607,0 2011 0,1 2.436,6 20,3 854,4 - 1,5 1,5 216,5 - 1,0 21,9 3.509,9 2012 0,2 1.196,1 10,3 1.254,1 - 0,9 1,3 243,1 - 0,1 11,9 2.694,3 2013 0,2 665,6 9,5 1.797,2 0,1 5,5 2,5 101,8 - 0,1 12,3 2.570,2 2014 0,4 548,6 10,6 1.633,8 - 6,2 0,4 31,8 0,0 8,1 11,5 2.228,5 2015 0,5 264,5 15,2 1.271,3 0,1 1,1 0,0 12,6 0,0 8,8 15,7 1.558,3 2016 0,4 118,7 16,2 1.050,7 - 0,1 0,1 3,8 - 6,1 16,6 1.179,4 2017 0,1 104,7 14,6 1.155,7 - - - 10,7 0,1 15,0 14,7 1.286,1 2018 0,1 145,4 19,0 1.005,3 - - 0,7 11,3 - 11,7 19,9 1.173,8 2019 0,2 69,9 14,7 928,4 - - 0,5 21,2 0,0 11,7 15,4 1.031,2 2020 0,4 28,0 12,5 475,2 - - 0,2 4,1 0,0 6,4 13,0 513,7 2021 0,8 21,6 15,9 856,0 - - 0,8 20,8 0,1 3,8 17,6 902,2 2022 1, 2 7,7 25,4 1.018,5 - - - 26,1 - 8,9 26,6 1.061,4 2023 0,5 0, 2 24,7 900,5 - - 6,8 12,8 0,3 11,1 32,3 924 ,6
ANO Year AUTOVEÍCULOS Vehicles AUTOPEÇAS (1) Autoparts (1) MÁQUINAS AGRÍCOLAS Agricultural machinery MÁQUINAS RODOVIÁRIAS Highway machinery OUTRAS (2) Others (2) TOTAL Total Exportação Export Importação Import Exportação Export Importação Import Exportação Export Importação Import Exportação Export Importação Import Exportação Export Importação Import Exportação Export Importação Import 2006 1,9 118,8 30,3 1.022,8 0,3 - 17,2 51,6 0,0 1,2 49,7 1.194,4 2007 1,4 184,3 44,2 1.264,6 0,2 - 25,0 59,5 - 0,0 70,7 1.508,5 2008 5,8 329,8 54,8 1.901,5 - 0,3 19,6 122,3 0,1 0,0 80,3 2.354,0 2009 1,6 207,4 10,7 1.599,2 0,7 0,1 7,1 78,9 - - 20,2 1.885,6 2010 1,2 338,7 57,3 1.965,4 0,4 0,7 7,4 57,2 0,0 0,3 66,4 2.362,3 2011 2,0 647,9 72,0 1.974,0 0,0 0,3 13,9 95,5 0,1 0,0 87,9 2.717,7 2012 2,0 536,3 54,2 2.051,5 0,3 0,7 26,4 70,8 0,0 0,0 82,9 2.659,4 2013 3,4 419,8 61,3 2.041,9 0,0 0,6 46,8 39,6 0,5 0,5 112,0 2.502,4 2014 3,9 417,9 50,0 1.668,6 0,1 0,5 77,2 21,6 0,1 0,1 131,3 2.108,7 2015 1,2 325,8 29,9 1.373,4 0,0 0,8 59,0 25,5 0,1 0,3 90,2 1.725,8 2016 3,1 130,1 25,3 981,1 0,1 0,7 38,5 9,3 0,2 0,0 67,1 1.121,2 2017 1,1 125,6 44,0 1.064,1 0,2 0,0 28,3 3,9 0,0 0,0 73,7 1.193,6 2018 1,6 176,7 49,5 1.219,9 0,0 0,1 31,6 6,1 0,1 0,2 82,8 1.403,1 2019 0,9 98,3 40,7 1.014,1 - - 52,5 13,7 0,0 0,1 94,2 1.126,2 2020 0,5 64,1 23,4 774,3 0,0 - 37,6 13,9 0,0 0,2 61,6 852,5 2021 2,7 35,0 38,7 1.555,2 0,1 - 24,2 18,6 0,2 0,1 65,9 1.608,9 2022 2,3 14,6 48,6 1.720,8 0,1 - 29,1 36,9 0,1 - 80,2 1.772,3 2023 0,5 15,0 41,8 1.644,1 0,4 - 84,7 52,8 - 0,0 127,4 1.711,9
Brasil
FONTES /SOURCES: SECEX/SDP/MDIC - (1) Inclui pneumáticos até 2015. / Pneumatics are included until 2015. - (2) Inclui chassis, carrocerias, cabines, reboques e semirreboques / (2) Chassis, bodies, cabines, tablets, trailers, semi-trailers are included.
de US$ / US$ millions Milhões de US$ / US$ millions
Milhões
1.9 Balança comercial da indústria automotiva (autoveículos, autopeças, máquinas agrícolas, máquinas rodoviárias, outros) - 2001/2023 (Milhões de US$ )
1.9 Brazilian automotive industry trade balance (vehicles, autoparts, agricultural machinery, high way construction equipament and others) - 2001/2023 (US$ millions)
Continuação da página anterior / Continuation from last page
EXPORTAÇÕES AUTOMOTIVAS - PRINCIPAIS DESTINOS - 2006 E 2023
AUTOMOTIVES EXPORTS - MAJOR DESTINATIONS - 2006 AND 2023

IMPORTAÇÕES
AUTOMOTIVAS - PRINCIPAIS ORIGENS - 2006 E 2023 AUTOMOTIVE
- MAJOR
- 2006 AND 2023
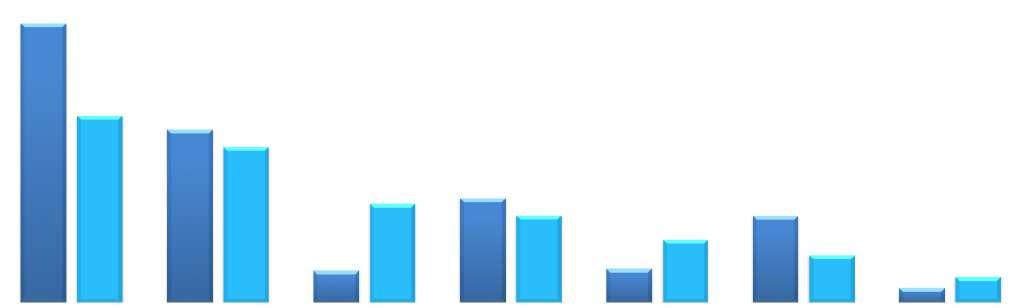
2024 | Anuário da Indústria Automobilística Brasileira | Brazilian Automotive Industry Yearbook | 51
ANUÁRIO DA INDÚSTRIA AUTOMOBILÍSTICA BRASILEIRA Brazilian Automotive Industry Yearbook
2024
IMPORTS
ORIGINS
2006 2023 Argentina Estados Unidos México União Europeia Argentina United States Mexico European Union 23,1% 25,7% 17,6% 17,6% 12,7% 14,2% 14,1% 7,6% 2006 2023 Argentina China Estados Unidos União Europeia México Japão Coreia do Sul Argentina China United States European Union Mexico Japan South Korea 36,9% 24,7% 22,9% 20,6% 4,2% 13,0% 13,8% 11,5% 8,3% 1,9% 3,3% 6,2% 4,5% 11,4%
Indústria automobilística brasileira
Brazilian automotive industry
1.10 Tributos - Autoveículos ( Porcentagem ) / 1.10
Taxes - Vehicles (Percentage)
FONTE / SOURCE: ANFAVEA.
(1) Exclusão de ICMS da base de cálculo do PIS/COFINS. / (1) Exclusion of ICMS from the PIS/COFINS calculation base.
(2) Exceção do estado de São Paulo, que a partir de 01/04/2021, alíquota de 14,5%, menos caminhões e ônibus (13,3% apartir de 15/01/2021). A partir de 16/01/2023, a alíquota retorna a 12% /
(2) Exception for the state of São Paulo, which as of 04/01/2021, tax rate of 14.5%, less trucks and buses (13.3% as of 01/15/2021). From 01/16/2023, the rate returns to 12%.(3) Redução de
(Decreto Nº
/ (3) IPI reduction (Decree No. 11.158, of July 29, 2022).
52 | Anuário da Indústria Automobilística Brasileira | Brazilian Automotive Industry Yearbook | 2024
11.158,
2022).
ANO Year TRIBUTOS Taxes AUTOMÓVEIS / CARS COMERCIAIS LEVES Light commercials CAMINHÕES / TRUCKS ÔNIBUS Buses 1 000 cm3 1 000 cm3 + de 1 000 cm3 até 2 000 cm3 more than 1 000 cm3 to 2 000 cm3 + de 2 000 cm3 + de 2 000 cm3 Chassi Trucks Trator Tractors Gas / Etanol / Flex fuel Gas / Ethanol / Flex fuel Gasolina Gasoline Etanol / Flex fuel Ethanol / Flex fuel Gasolina Gasoline Etanol / Flex fuel Ethanol / Flex fuel 2004 a 2007 2004 to 2007 IPI 7,0 13,0 11,0 25,0 18,0 8,0 5,0 5,0 0,0 ICMS 12,0 12,0 12,0 12,0 12,0 12,0 12,0 12,0 12,0 PIS / COFINS 11,6 11,6 11,6 11,6 11,6 11,6 8,10 6,02 6,02 Participação tot al no preço Total participation in the price 27,1 30,4 29, 2 36,4 33,1 27,3 22, 2 20,6 16,9 2008 a partir de 12/12 2008 from 12 December IPI 0,0 6,5 5,5 25,0 18,0 1,0 0,0 0,0 0,0 ICMS 12,0 12,0 12,0 12,0 12,0 12,0 12,0 12,0 12,0 PIS / COFINS 11,6 11,6 11,6 11,6 11,6 11,6 8,10 6,02 6,02 Participação tot al no preço Total participation in the price 22, 2 26,4 25,8 36,4 33,1 22,6 18,7 16,9 16,9 2009 IPI 5,0 / 3,0 11,0 7, 5 25,0 18,0 1,0 0,0 0,0 0,0 ICMS 12,0 12,0 12,0 12,0 12,0 12,0 12,0 12,0 12,0 PIS / COFINS 11,6 11,6 11,6 11,6 11,6 11,6 8,10 6,02 6,02 Participação tot al no preço Total participation in the price 25,7 / 24,4 29, 2 27,1 36,4 33,1 22,6 18,7 16,9 16,9 2010 de 31/01 a 31/03 2010 from January 31st to March 31st IPI 7,0 / 3,0 13,0 7,5 25,0 18,0 4,0 0,0 0,0 0,0 ICMS 12,0 12,0 12,0 12,0 12,0 12,0 12,0 12,0 12,0 PIS / COFINS 11,6 11,6 11,6 11,6 11,6 11,6 8,10 6,02 6,02 Participação tot al no preço Total participation in the price 27,1 / 24,4 30,4 27,1 36,4 33,1 24,7 18,7 16,9 16,9 2010
2010
IPI 7,0 13,0 11,0 25,0 18,0 4,0 0,0 0,0 0,0 ICMS 12,0 12,0 12,0 12,0 12,0 12,0 12,0 12,0 12,0 PIS / COFINS 11,6 11,6 11,6 11,6 11,6 11,6 8,10 6,02 6,02 Participação tot al no preço Total participation in the price 27,1 30,4 29, 2 36,4 33,1 24,7 18,7 16,9 16,9 2011 IPI 7,0 13,0 11,0 25,0 18,0 4,0 0,0 0,0 0,0 ICMS 12,0 12,0 12,0 12,0 12,0 12,0 12,0 12,0 12,0 PIS / COFINS 11,6 11,6 11,6 11,6 11,6 11,6 8,10 6,02 6,02 Participação tot al no preço Total participation in the price 27,1 30,4 29, 2 36,4 33,1 24,7 18,7 16,9 16,9 2012 de 23/05 a 31/12 2012-May 23 to December 31 IPI 0,0 6,5 5,5 25,0 18,0 1,0 0,0 0,0 0,0 ICMS 12,0 12,0 12,0 12,0 12,0 12,0 12,0 12,0 12,0 PIS / COFINS 11,6 11,6 11,6 11,6 11,6 11,6 8,10 6,02 6,02 Participação tot al no preço Total participation in the price 22, 2 26,4 25,8 36,4 33,1 22,6 18,7 16,9 16,9 2013 IPI 2,0 8,0 7,0 25,0 18,0 2,0 0,0 0,0 0,0 ICMS 12,0 12,0 12,0 12,0 12,0 12,0 12,0 12,0 12,0 PIS / COFINS 11,6 11,6 11,6 11,6 11,6 11,6 8,10 6,02 6,02 Participação tot al no preço Total participation in the price 23,6 27,4 26,8 36,4 33,1 23,3 18,7 16,9 16,9 2014 IPI 3,0 10,0 9,0 25,0 18,0 3,0 0,0 0,0 0,0 ICMS 12,0 12,0 12,0 12,0 12,0 12,0 12,0 12,0 12,0 PIS / COFINS 11,6 11,6 11,6 11,6 11,6 11,6 8,10 6,02 6,02 Participação tot al no preço Total participation in the price 24,4 28,6 28,0 36,4 33,1 24,0 18,7 16,9 16,9 2015 a 20 2 0 2015 to 2020 IPI 7,0 13,0 11,0 25,0 18,0 8,0 0,0 0,0 0,0 ICMS 12,0 12,0 12,0 12,0 12,0 12,0 12,0 12,0 12,0 PIS / COFINS 11,6 11,6 11,6 11,6 11,6 11,6 8,10 6,02 6,02 Participação tot al no preço Total participation in the price 27,1 30,4 29,2 36,4 33,1 27,3 18,7 16,9 16,9 2021(1) a partir de 14 de maio 2021(1) from 14 May IPI 7.0 13.0 11.0 25.0 18.0 8.0 0.0 0.0 0.0 ICMS (2) 12.0 12.0 12.0 12.0 12.0 12.0 12.0 12.0 12.0 PIS / COFINS 11,6 11,6 11,6 11,6 11,6 11,6 8.10 6.02 6.02 Participação tot al no preço Total participation in the price 25,9 29,2 28,1 35,3 31,9 26,1 17,9 16,3 16,3 2022 e 2023 2022 and 2023 IPI (3) 5.27 9.78 8.28 18.81 13.55 5.20 0.0 0.0 0.0 ICMS 12.0 12.0 12.0 12.0 12.0 12.0 12.0 12.0 12.0 PIS / COFINS 11,6 11,6 11,6 11,6 11,6 11,6 8.10 6.02 6.02 Participação tot al no preço Total participation in the price 24,7 27,3 26,4 32,3 29,5 24,3 17,9 16,3 16,3
IPI
de 29 de julho de
a partir de abril
from April
Em porcentagem / In percentage
PEUGEOT 208 TURBO
LIBERTE SUA POTÊNCIA
NO TRÂNSITO, ESCOLHA A VIDA!

Brazilian automotive industry 54 | Anuário da Indústria Automobilística Brasileira | Brazilian Automotive Industry Yearbook | 2024 1.11
ANO Year AUTOMÓVEIS Vehicles COMERCIAIS LEVES Light commercials CAMINHÕES Trucks ÔNIBUS Buses TOTAL Total 2000 17.080.185 2.407.213 1.147.694 224.807 20.859.900 2001 17.797.010 2.477.909 1.176.469 232.399 21.683.787 2002 18.399.233 2.524.782 1.197.240 239.517 22.360.771 2003 18.865.467 2.563.396 1.218.776 246.952 22.894.592 2004 19.482.685 2.650.100 1.256.857 253.648 23.643.290 2005 20.217.943 2.683.562 1.287.577 258.335 24.447.417 2006 21.119.730 2.730.862 1.313.716 266.919 25.431.227 2007 22.445.951 2.828.880 1.361.254 278.555 26.914.641 2008 23.997.349 2.995.656 1.430.763 293.736 28.717.504 2009 25.817.430 3.191.911 1.485.972 304.162 30.799.475 2010 27.812.726 3.488.885 1.586.828 319.929 33.208.366 2011 29.811.473 3.829.976 1.699.893 341.386 35.682.727 2012 31.977.005 4.157.310 1.776.541 356.472 38.267.328 2013 34.017.474 4.494.613 1.866.099 375.206 40.753.392 2014 35.756.646 4.819.888 1.935.681 387.978 42.900.192 2015 36.765.902 4.952.192 1.938.387 389.629 44.046.110 2016 37.279.361 5.014.338 1.919.552 385.311 44.598.562 2017 37.897.466 5.081.835 1.901.896 381.275 45.262.473 2018 38.696.561 5.189.101 1.907.813 380.223 46.173.698 2019 39.591.508 5.312.974 1.938.009 384.616 47.227.107 2020 39.778.682 5.359.939 1.955.356 381.622 47.475.599 2021 39.847.584 5.474.494 2.010.211 378.410 47.710.700 2022 39.877.781 5 543 758 2.061.128 378.143 47.860.810 2023 39.986.756 5 673 170 2.090.721 381.138 48 .131.785 1.10 Tributos - Autoveículos / 1.10 Taxes - Vehicles PARTICIPAÇÃO DOS TRIBUTOS SOBRE AUTOMÓVEIS NO PREÇO AO CONSUMIDOR EM ALGUNS PAÍSES - 2023 TAX BURDEN ON CARS IN SELECTED COUNTRIESSHARE IN CONSUMER PRICES - 2023 * Alíquota de IPI básica. Automóveis a gasolina de 1 000 cm³ a 2 000 cm3 / IPI rate basic. Gasoline powered cars from 1 000 cm³ to 2 000 cm3 ** Estado da Califórnia / California State 27,3 18,0 17,3 16,7 16,7 16,0 9,1 6,8
Indústria automobilística brasileira
Estimativa da frota de autoveículos - 2000/2023 1.11 Vehicle fleet estimate - 2000/2023
Germany França France Reino Unido UK Espanha Spain Itália Italy Brasil * Brazil * FONTE / SOURCE: ANFAVEA NOTA / NOTE: Os dados dos anos anteriores foram revisados. Note: data from previous years has been revised.
Estados Unidos
** USA ** Japão Japan Alemanha

CAPÍTULO 2
Autoveículos: produção, vendas internas e exportações
CHAPTER 2
Vehicles: production, domestic sales and exports
2
ASSOCIAÇÃO NACIONAL DOS FABRICANTES DE VEÍCULOS AUTOMOTORES
Autoveículos: produção, vendas internas e exportações
Vehicles: production, domestic sales and exports
2.1 Produção de autoveículos montados - 1957/2023 (unidades) 2.1 Production of assembled vehicles - 1957/2023 (units)
56 | Anuário da Indústria Automobilística Brasileira | Brazilian Automotive Industry Yearbook | 2024
ANO Year AUTOMÓVEIS Cars COMERCIAIS LEVES Light commercials CAMINHÕES Trucks ÔNIBUS Buses TOTAL Total 1957 10 449 1 588 16 259 2 246 30 542 1958 20 808 9 503 26 998 3 674 60.983 1959 40 171 16 283 36 657 3 003 96 .114 1960 70 479 20 875 37 810 3 877 133 041 1961 86 437 28 654 26 891 3 602 145. 584
118 026 33 498 36 174 3 496 191 194 1963 121 666 28 495 21 556 2 474 174 .191 1964 132 157 27 056 21 790 2 704 183 .707 1965 135 041 25 187 21 828 3 131 185 187 1966 157 352 32 204 31 098 3 955 224 .609 1967 158 362 35 319 27 141 4 665 225 487 1968 185 922 46 107 40 642 7 044 279.715 1969 258 675 48 777 40 569 5 679 353 700 1970 319 574 54 069 38 388 4 058 416 .089 1971 416 563 56 264 38 868 4 393 516 .088 1972 482 037 72 194 50 150 5 230 609 611 1973 565 221 93 371 64 828 6 362 729.782 1974 670 888 104 938 75 149 8 262 859 237 1975 690 943 106 987 74 891 10 126 882 .947 1976 721 917 109 811 80 885 12 059 924 .672 1977 700 649 69 202 99 527 13 588 882 966 1978 828 025 86 050 83 649 13 992 1.011.716 1979 866 399 101 933 89 959 12 809 1 071 100 1980 873 721 105 572 97 463 14 449 1.091. 205 1981 516 329 94 470 69 312 13 305 693 . 416 1982 619 984 122 712 44 000 9 763 796 459 1983 689 897 100 900 33 235 6 037 830.069 1984 601 929 123 683 43 117 5 979 774 708 1985 687 360 124 251 60 266 7 559 879. 436 1986 736 617 139 898 78 634 10 134 965 283 1987 600 373 143 412 67 935 11 814 823 . 534 1988 690 855 191 115 68 880 16 032 966 . 882 1989 685 262 199 850 57 013 13 408 955. 533 1990 604 499 177 749 48 219 12 962 843 . 429 ANO Year AUTOMÓVEIS Cars COMERCIAIS LEVES Light commercials CAMINHÕES Trucks ÔNIBUS Buses TOTAL Total 1991 616 970 176 376 46 715 21 108 861.169 1992 667 716 183 741 30 960 22 621 905.038 1993 910 464 199 754 45 382 17 700 1 173 300 1994 1 027 152 218 793 60 019 15 727 1. 321.691 1995 1 149 940 220 003 70 073 19 660 1. 459.676 1996 1 320 105 239 290 48 022 15 718 1 623 135 1997 1 519 529 258 170 63 414 20 088 1. 861. 201 1998 1 137 219 209 087 63 264 20 290 1. 429. 860 1999 1 059 533 160 935 55 194 14 315 1 289 977 2000 1 298 437 214 994 71 114 21 303 1.605. 848 2001 1 384 368 190 957 77 251 21 946 1.674 . 522 2002 1 376 219 167 767 68 354 21 450 1 633 790 2003 1 428 270 154 181 77 785 24 479 1.684 .715 2004 1 777 642 216 735 104 792 25 008 2 .124 .177 2005 1 979 545 235 340 112 921 29 366 2 357 172 2006 2 027 305 243 666 103 297 29 412 2 . 403 .680 2007 2 360 739 295 738 133 739 35 008 2 . 825. 224 2008 2 498 482 350 188 163 757 38 202 3 050 629 2009 2 568 167 356 817 120 994 30 022 3 .076 .000 2010 2 682 924 468 747 189 933 40 531 3 . 382 .135 2011 2 630 893 513 918 223 602 49 369 3 417 782 2012 2 764 866 469 480 133 403 36 635 3 . 404 . 384 2013 2 955 356 530 901 187 002 40 554 3 .713 . 813 2014 2 507 759 471 170 139 965 32 937 3 151 831 2015 2 016 308 316 221 74 062 21 498 2 . 428 .089 2016 1 798 894 298 703 60 482 18 705 2 .176 .784 2017 2 307 897 325 672 83 044 20 643 2 737 256 2018 2 387 967 358 981 105 534 28 536 2 . 881.018 2019 2 448 490 355 351 113 476 27 671 2 .944 .988 2020 1.607.175 297.539 90.936 18.405 2.014.055 2021 1.707.851 362.711 158.810 18.881 2.248.253 2022 1.824.833 351.167 161.992 31.777 2.369.769 2023 1.782.079 421.626 100.535 20.598 2.324.838 FONTE / SOURCE: ANFAVEA NOTA / NOTE: Somente autoveículos montados / Only CBU Vehicles Unidades / Units
1962
2.2 Produção total* de autoveículos - 1957/2023 (unidades) 2.2 Total production* of vehicles - 1957/2023 (units)
/ SOURCE: ANFAVEA.
2024 | Anuário da Indústria Automobilística Brasileira | Brazilian Automotive Industry Yearbook | 57
ANUÁRIO DA INDÚSTRIA AUTOMOBILÍSTICA BRASILEIRA Brazilian Automotive Industry Yearbook
2024
ANO Year AUTOMÓVEIS Cars COMERCIAIS LEVES Light commercials CAMINHÕES Trucks ÔNIBUS Buses TOTAL Total 1957 10 449 1 588 16 259 2 246 30. 542 1958 20 808 9 503 26 998 3 674 60 983 1959 40 171 16 283 36 657 3 003 96 .114 1960 70 479 20 875 37 810 3 877 133 .041 1961 86 437 28 654 26 891 3 602 145 584 1962 118 026 33 498 36 174 3 496 191.194 1963 121 666 28 495 21 556 2 474 174 .191 1964 132 157 27 056 21 790 2 704 183 707 1965 135 041 25 187 21 828 3 131 185.187 1966 157 352 32 204 31 098 3 955 224 .609 1967 158 362 35 319 27 141 4 665 225 487 1968 185 922 46 107 40 642 7 044 279.715 1969 258 675 48 777 40 569 5 679 353 .700 1970 319 574 54 069 38 388 4 058 416 089 1971 416 995 56 708 38 868 4 393 516 .964 1972 488 061 75 323 53 557 5 230 622 .171 1973 577 583 97 229 69 202 6 362 750 376 1974 707 068 111 177 79 413 8 262 905.920 1975 726 067 115 354 78 688 10 126 930. 235 1976 775 401 115 260 83 891 12 059 986 611 1977 736 205 69 792 101 368 13 828 921.193 1978 876 807 86 598 86 269 14 340 1.064 .014 1979 918 141 103 942 93 051 12 832 1 127 966 1980 939 278 109 414 102 017 14 465 1.165.174 1981 589 181 101 959 76 350 13 393 780 883 1982 676 014 126 772 46 698 9 820 859 304 1983 750 209 104 560 35 487 6 206 896 . 462 1984 680 645 128 171 48 497 7 340 864 653 1985 760 784 132 770 64 769 8 385 966 .708 1986 818 221 142 349 84 544 11 218 1.056. 332 1987 686 665 145 562 74 205 13 639 920 071 1988 785 368 193 151 71 810 18 427 1.068 .756 1989 733 676 202 324 62 699 14 553 1.013 . 252 1990 665 051 182 787 51 597 15 031 914 466 ANO Year AUTOMÓVEIS Cars COMERCIAIS LEVES Light commercials CAMINHÕES Trucks ÔNIBUS Buses TOTAL Total 1991 707 176 180 736 49 295 23 012 960 219 1992 816 446 201 104 32 025 24 286 1.073 . 861 1993 1 100 670 223 995 47 876 18 894 1. 391. 435 1994 1 249 098 250 719 64 137 17 435 1 581 389 1995 1 299 493 237 373 70 495 21 647 1.629.008 1996 1 479 490 258 783 48 712 17 343 1. 804 . 328 1997 1 700 438 283 965 63 744 21 556 2 069 703 1998 1 273 356 227 704 63 773 21 458 1 586 291 1999 1 118 483 168 020 55 277 14 934 1. 356.714 2000 1 375 382 221 498 71 686 22 674 1 691 240 2001 1 516 182 199 813 77 431 23 690 1 817 116 2002 1 525 491 174 655 68 558 22 826 1.791. 530 2003 1 561 780 160 061 78 960 26 990 1 827 791 2004 1 954 604 226 527 107 338 28 758 2 317 227 2005 2 122 101 255 068 117 693 35 387 2 . 530. 249 2006 2 204 390 266 826 106 601 34 512 2 612 329 2007 2 481 949 321 922 137 229 39 011 2 980 111 2008 2 634 010 370 852 167 406 44 111 3 . 216 . 379 2009 2 655 704 369 609 123 633 34 536 3 .183 . 482 2010 2 924 208 484 839 191 613 45 880 3 646 540 2011 2 630 893 530 330 229 083 56 023 3 . 446 . 329 2012 2 766 978 488 872 136 264 41 556 3 . 433 .670 2013 2 955 788 547 749 190 962 45 026 3 739 525 2014 2 509 295 487 682 143 660 37 222 3 .177. 859 2015 2 016 500 332 445 77 686 25 659 2 . 452 . 290 2016 1 800 040 307 583 64 539 23 550 2 195 712 2017 2 308 797 330 616 89 449 25 280 2 .754 .142 2018 2 388 337 358 981 115 697 31 889 2 . 894 .904 2019 2 448 600 355 351 117 692 29 803 2 951 446 2020 1.607.335 297.539 94.809 20.546 2.020.229 2021 1.707.851 362.711 164.945 20.817 2.256.324 2022 1.824.833 351.167 169.006 35.155 2.380.161 2023 1.782.079 421.626 111.560 24.089 2.339.354
(*) Autoveículos montados e desmontados (CKD). / Includes assembled and CKD vehicles. Unidades / Units
FONTE
Autoveículos: produção, vendas internas e exportações
Vehicles: production, domestic sales and exports
2.3 Licenciamento de autoveículos novos - nacionais e importados - 1957/2023 (unidades)
2.3 Registration of new vehicles - local and imported - 1957/2023 (units)
58 | Anuário da Indústria Automobilística Brasileira | Brazilian Automotive Industry Yearbook | 2024
ANO Year AUTOMÓVEIS Cars COMERCIAIS LEVES Light commercials CAMINHÕES Trucks ÔNIBUS Buses TOTAL Total 1957 9 478 1 532 18 063 1 904 30 977 1958 20 677 9 532 27 384 3 333 60.926 1959 40 020 16 339 37 211 3 159 96 .729 1960 68 762 20 735 38 053 3 949 131. 499 1961 86 863 28 595 26 289 3 050 144 797 1962 117 204 33 405 36 194 3 349 190.152 1963 121 562 28 241 21 536 2 420 173 .759 1964 130 435 26 672 21 174 2 624 180 905 1965 136 794 25 853 22 451 2 956 188 054 1966 155 552 31 845 30 547 3 632 221. 576 1967 158 982 35 533 27 609 4 788 226 .912 1968 185 059 46 096 40 458 7 002 278 615 1969 255 802 48 631 39 433 5 627 349 493 1970 320 690 53 724 38 167 4 123 416 .704 1971 412 121 55 523 37 643 4 336 509.623 1972 474 343 72 513 50 342 4 222 601 420 1973 571 193 92 817 64 818 6 400 735 228 1974 655 140 101 353 71 433 7 167 835.093 1975 674 633 105 013 69 901 8 931 858 . 478 1976 705 136 105 042 74 971 10 986 896 135 1977 682 288 68 397 90 247 12 038 852 .970 1978 802 004 79 606 78 891 11 861 972 . 362 1979 832 669 92 021 78 706 11 529 1.014 .925 1980 797 395 89 401 81 933 11 532 980 261 1981 449 872 65 736 55 938 9 179 580.725 1982 559 191 82 801 41 257 8 045 691. 294 1983 610 126 76 458 34 573 6 575 727 732 1984 533 424 94 777 42 884 5 997 677 082 1985 603 623 96 752 55 664 7 141 763 .180 1986 675 353 111 034 71 853 8 488 866 .728 1987 413 438 100 194 56 385 10 068 580 085 1988 559 542 120 294 54 912 12 968 747 716 1989 569 231 134 731 48 178 9 485 761.625 1990 534 769 126 568 41 313 10 091 712 .741 ANO Year AUTOMÓVEIS Cars COMERCIAIS LEVES Light commercials CAMINHÕES Trucks ÔNIBUS Buses TOTAL Total 1991 604 510 127 934 41 464 16 865 790 773 1992 600 189 124 462 25 659 13 706 764 .016 1993 910 605 170 781 38 383 11 396 1.131.165 1994 1 135 001 195 458 52 349 12 595 1 395 403 1995 1 415 542 236 736 58 734 17 368 1.728 . 380 1996 1 428 509 244 627 42 134 15 518 1 730 788 1997 1 605 214 268 451 54 931 14 862 1.943 . 458 1998 1 246 064 220 359 52 768 15 761 1. 534 .952 1999 1 036 202 159 407 50 665 10 679 1 256 953 2000 1 205 070 198 574 69 209 16 628 1. 489. 481 2001 1 318 232 192 573 73 517 16 960 1.601. 282 2002 1 243 467 152 931 65 680 16 502 1 478 580 2003 1 215 549 131 206 65 962 15 887 1. 428 .604 2004 1 315 358 164 301 81 484 17 632 1 578 775 2005 1 439 822 180 020 79 533 15 269 1.714 .644 2006 1 632 947 199 338 75 971 19 482 1.927.738 2007 2 085 706 255 517 98 585 22 905 2 462 713 2008 2 341 304 329 889 122 287 26 874 2 . 820. 354 2009 2 643 862 365 005 109 827 22 546 3 .141. 240 2010 2 856 540 472 489 157 707 28 328 3 515 064 2011 2 901 647 524 184 172 870 34 547 3 .633 . 248 2012 3 115 223 518 960 139 174 28 714 3 . 802 .071 2013 3 040 783 539 113 154 576 32 898 3 767 370 2014 2 794 687 538 796 137 055 27 474 3 . 498 .012 2015 2 123 009 357 523 71 652 16 792 2 568 976 2016 1 688 289 300 307 50 560 11 161 2 .050. 317 2017 1.856.584 319.400 51.943 11.755 2.239.682 2018 2.102.114 373.224 76.005 15.081 2.566.424 2019 2.262.073 403.510 101.335 20.932 2.787.850 2020 1.615.942 338.877 89.678 13.940 2.058.437 2021 1.558.467 418.643 128.679 14.062 2.119.851 2022 1.576.662 383.799 126.643 17.357 2.104.461 2023 1.721.400 458.830 108.024 20.435 2.308.689 FONTES / SOURCES: ABEIFA, ANFAVEA, RENAVAM/SENATRAN. NOTA 1 Nesta tabela consideram-se as vendas de autoveículos importados a partir de 1990 / In this table, sales of imported vehicles have been considered starting from 1990. NOTA 2 . Os dados até 2001 se referem a vendas internas no atacado / Before 2002 the date refer to domestic wholesales of vehicles.
/ Units
Unidades


Autoveículos: produção, vendas internas e exportações
Vehicles: production, domestic sales and exports
2.4 Licenciamento de autoveículos novos por unidade da federação - nacionais e importados - 2022/2023 (unidades)
2.4 Registration of new vehicles per state - local and imported - 2022/2023 (units)
/
PARTICIPAÇÃO PERCENTUAL NO LICENCIAMENTO DE AUTOVEÍCULOS

60 | Anuário da Indústria Automobilística Brasileira | Brazilian Automotive Industry Yearbook | 2024
2023 São Paulo Paraná Rio Grande do Sul Minas Gerais Santa Catarina
FONTES
SOURCES: RENAVAM/SENATRAN.
NOVOS DOS CINCO MAIORES ESTADOS CONSUMIDORES - 2002/2023 / PERCENTAGE PARTICIPATION IN THE REGISTRATION OF NEW MOTOR VEHICLES OF THE FIVE LARGEST CONSUMER STATES - 2002/2023 REGIÃO / UF Region / States AUTOMÓVEIS Cars COMERCIAIS LEVES Light commercials CAMINHÕES Trucks ÔNIBUS Buses TOTAL Total 2022 2023 2022 2023 2022 2023 2022 2023 2022 2023 NORTE / North 68.863 66.425 31.353 35.741 7.305 7.278 995 1.296 108.516 110.740 Amazonas 18.635 17.835 5.743 6.902 1.135 895 372 358 25.885 25.990 Pará 24.370 23.563 9.758 11.329 2.658 2.779 375 551 37.161 38.222 Rondônia 9.283 8.702 6.242 6.613 1.004 1.012 111 163 16.640 16.490 Acre 3.033 3.221 1.398 1.697 235 308 11 76 4.677 5.302 Amapá 3.830 3.811 1.480 1.793 211 261 13 19 5.534 5.884 Roraima 3.343 2.510 2.179 2.014 203 265 14 26 5.739 4.815 Tocantins 6.369 6.783 4.553 5.393 1.859 1.758 99 103 12.880 14.037 NORDESTE / Northeast 201.864 222.451 54.346 64.969 15.839 14.875 3.640 3.331 275.689 305.626 Maranhão 17.926 18.007 6.449 7.171 2.095 1.843 201 345 26.671 27.366 Piauí 10.523 12.685 3.451 4.493 1.249 1.167 74 144 15.297 18.489 Ceará 31.838 35.105 6.914 8.111 2.125 2.052 377 591 41.254 45.859 Rio Grande do Norte 12.879 14.010 3.309 3.545 708 639 167 190 17.063 18.384 Paraíba 15.808 18.421 3.461 4.847 768 699 374 338 20.411 24.305 Pernambuco 40.142 45.108 8.887 10.265 2.321 2.056 716 542 52.066 57.971 Alagoas 13.566 15.119 3.354 4.132 1.118 581 374 192 18.412 20.024 Sergipe 8.920 10.550 2.116 3.072 688 687 323 153 12.047 14.462 Bahia 50.262 53.446 16.405 19.333 4.767 5.151 1.034 836 72.468 78.766 SUDESTE / Southeast 920.399 1.008.526 181.386 216.863 53.746 43.616 7.780 11.771 1.163.311 1.280.776 Minas Gerais 403.960 410.875 96.425 99.627 18.758 13.522 1.942 3.129 521.085 527.153 Espírito Santo 27.269 29.715 8.929 11.322 3.697 3.095 362 389 40.257 44.521 Rio de Janeiro 74.772 81.849 10.305 12.034 5.047 4.680 1.248 3.056 91.372 101.619 São Paulo 414.398 486.087 65.727 93.880 26.244 22.319 4.228 5.197 510.597 607.483 SUL / South 246.613 275.830 61.620 79.836 35.104 30.269 2.571 2.337 345.908 388.272 Paraná 98.127 107.304 27.383 34.892 13.915 12.379 1.355 1.320 140.780 155.895 Santa Catarina 73.607 84.170 15.462 20.778 10.772 9.478 639 358 100.480 114.784 Rio Grande do Sul 74.879 84.356 18.775 24.166 10.417 8.412 577 659 104.648 117.593 CENTRO-OESTE / Midwest 138.923 148.168 55.094 61.421 14.649 11.986 2.371 1.700 211.037 223.275 Mato Grosso 26.421 27.202 15.867 17.760 5.283 4.150 1.098 407 48.669 49.519 Mato Grosso do Sul 17.930 19.331 8.103 9.354 2.411 2.056 255 224 28.699 30.965 Goiás 50.707 49.928 22.304 24.039 5.716 4.870 340 372 79.067 79.209 Distrito Federal 43.865 51.707 8.820 10.268 1.239 910 678 697 54.602 63.582 TOTAL 1.576.662 1.721.400 383.799 458.830 126.643 108.024 17.357 20.435 2.104.461 2.308.689 2002 26,3% 9,0% 22,8% 8,6% 6,8% 6,6% 5,1% 4,7% 5,0% TOTAL BRASIL TOTAL BRAZIL 2002 1.478.580 2023 2.308.689
34,1%
Unidades / Units


Ser parte da solução.
Conectar pessoas. Movimentar cargas. Chegar aos mais diversos rincões do planeta. Este é o setor de transporte e logística – essencial para o funcionamento da economia e da sociedade.
Mas também é um dos maiores responsáveis pela emissão de gases de efeito estufa, que provocam o aumento da temperatura da Terra e causam desastres climáticos.
Como resolver esse dilema? Fazendo da descarbonização um norte e da sustentabilidade a razão de existir.
Esse é o propósito da Scania, que como parte do problema decidiu ser parte da solução. E nesta jornada tudo conta: engenharia de ponta, profissionais talentosos, investimentos, alta tecnologia e rigor por qualidade.
Mais do que um negócio, liderar a transformação para um ecossistema de transporte e logística livre de combustíveis fósseis é um compromisso da Scania.
E você, como contribui para fazer um mundo mais sustentável?
Autoveículos: produção, vendas internas e exportações
Vehicles: production, domestic sales and exports
2.5 Licenciamento de autoveículos novos por combustível - 1957/2023 (unidades) 2.5 Registration of new vehicles by fuel type - 1957/2023 (units)
62 | Anuário da Indústria Automobilística Brasileira | Brazilian Automotive Industry Yearbook | 2024
ANO Year AUTOMÓVEIS Cars COMERCIAIS LEVES Light Commercials GASOLINA Gasoline ETANOL Ethanol FLEX FUEL Flex Fuel EL ETRIFICADO Electrified DIESEL Diesel GASOLINA Gasoline ETANOL Ethanol FLEX FUEL Flex Fuel EL ETRIFICADO Electrified DIESEL Diesel 1957 9.478 - - - - 1.532 - - -1958 20.677 - - - - 9.532 - - -1959 39.554 - - - 466 16.339 - - -1960 68.452 - - - 310 20.735 - - -1961 86.859 - - - 4 28.595 - - -1962 116.666 - - - 538 33.405 - - -1963 120.338 - - - 1.224 27.976 - - - 265 1964 128.857 - - - 1.578 26.028 - - - 644 1965 136.240 - - - 554 25.428 - - - 425 1966 155.120 - - - 432 31.418 - - - 427 1967 158.716 - - - 266 35.151 - - - 382 1968 184.812 - - - 247 45.422 - - - 674 1969 255.509 - - - 293 48.010 - - - 621 1970 320.544 - - - 146 53.281 - - - 443 1971 411.987 - - - 134 55.153 - - - 370 1972 474.216 - - - 127 72.051 - - - 462 1973 571.106 - - - 87 92.331 - - - 486 1974 655.066 - - - 74 100.882 - - - 471 1975 674.517 - - - 116 104.403 - - - 610 1976 704.880 - - - 256 103.849 - - - 1.193 1977 681.920 - - - 368 66.151 - - - 2.246 1978 801.505 - - - 499 75.790 - - - 3.816 1979 829.919 2.276 - - 474 75.787 838 - - 15.396 1980 570.249 226.534 - - 612 56.218 14.109 - - 19.074 1981 320.421 128.774 - - 677 24.046 7.468 - - 34.222 1982 346.479 212.060 - - 652 18.955 20.515 - - 43.331 1983 70.837 538.834 - - 455 7.781 40.494 - - 28.183 1984 29.012 503.904 - - 508 4.470 61.632 - - 28.675 1985 24.321 578.725 - - 577 4.334 66.826 - - 25.592 1986 54.384 620.221 - - 748 7.533 76.828 - - 26.673 1987 24.752 387.785 - - 901 6.438 70.898 - - 22.858 1988 65.698 492.642 - - 1.202 11.614 73.840 - - 34.840 1989 222.551 345.658 - - 1.022 38.270 53.871 - - 42.590 1990 463.464 70.250 - - 1.055 79.391 11.746 - - 35.431 1991 474.069 129.139 - - 1.302 72.189 21.843 - - 33.902 1992 434.173 164.840 - - 1.176 64.754 30.663 - - 29.045 1993 679.685 227.289 - - 3.631 84.913 36.946 - - 48.922 1994 1.013.410 119.203 - - 2.388 114.075 22.631 - - 58.752 1995 1.381.192 32.808 - - 1.542 176.482 7.898 - - 52.356 1996 1.421.342 6.333 - - 834 200.626 1.314 - - 42.687 1997 1.599.517 924 - - 4.773 202.171 196 - - 66.084 1998 1.239.984 982 - - 5.098 148.750 242 - - 71.367 1999 1.023.240 9.851 - - 3.111 98.989 1.096 - - 59.322 2000 1.191.685 9.610 - - 3.775 118.794 682 - - 79.098 2001 1.299.796 14.979 - - 3.457 112.624 3.356 - - 76.593 2002 1.181.780 47.366 - - - 102.183 8.595 - - 64.341 2003 1.046.474 33.034 39.095 - - 105.989 3.346 9.083 - 54.729 2004 967.235 49.801 278.764 - - 110.710 1.149 49.615 - 66.247 2005 646.659 30.904 752.597 - 9.662 50.347 1.453 59.507 - 68.713 2006 283.240 1.651 1.334.342 1 13.713 33.319 212 95.992 2 69.813 2007 233.440 90 1.834.259 2 17.915 12.211 17 168.821 1 74.467 2008 206.815 70 2.113.289 8 21.122 10.201 14 215.962 1 103.711 2009 210.281 61 2.416.111 21 17.388 11.407 9 236.187 1 117.401 2010 264.330 44 2.570.578 24 21.564 16.347 6 305.595 5 150.536 2011 350.848 44 2.524.402 200 26.153 25.956 7 323.669 - 174.552 2012 258.950 46 2.834.334 117 21.776 14.965 6 328.488 - 175.501 2013 182.046 29 2.833.091 484 25.133 7.063 5 335.989 7 196.049 2014 180.561 10 2.588.367 842 24.907 4.280 4 352.127 13 182.372 2015 133.922 13 1.959.868 843 28.363 2.228 3 234.136 3 121.153 2016 79.490 12 1.572.798 1.085 34.904 1.005 4 177.934 6 121.358 2017 68.145 26 1.739.014 3.278 46.121 757 4 188.177 18 130.444 2018 81.493 20 1.969.672 3.965 46.964 442 1 198.480 5 174.296 2019 73.429 26 2.123.841 11.844 52.933 425 2 204.780 14 198.289 2020 58.330 18 1.490.480 19.687 47.427 600 3 174.498 58 163.718 2021 52.089 19 1.411.662 34.839 59.858 1.499 6 212.660 151 204.327 2022 44.284 32 1.437.715 48.744 45.887 4.520 3 195.532 517 183.227 2023 48.514 31 1.545.015 92.847 34.993 12.052 3 264.815 1.064 180.896 FONTES / SOURCES: ABEIFA, ANFAVEA, RENAVAM/SENATRAN. NOTAS / NOTES: 1. Em comerciais leves, coluna gasolina, estão incluídas 85 unidades movidas a eletricidade produzidas e vendidas no período 1981-1985./ In light commercial vehicles, gasoline column, 85 electric-powered units produced and sold in the period 1981-1985 are included. 2. Os dados de caminhões e ônibus elétricos e a gás estão disponíveis a partir de 2005. / Data for electric and gas trucks and buses are available as of 2005. Continua na página 64/ Continued from 64
Units
Unidades /
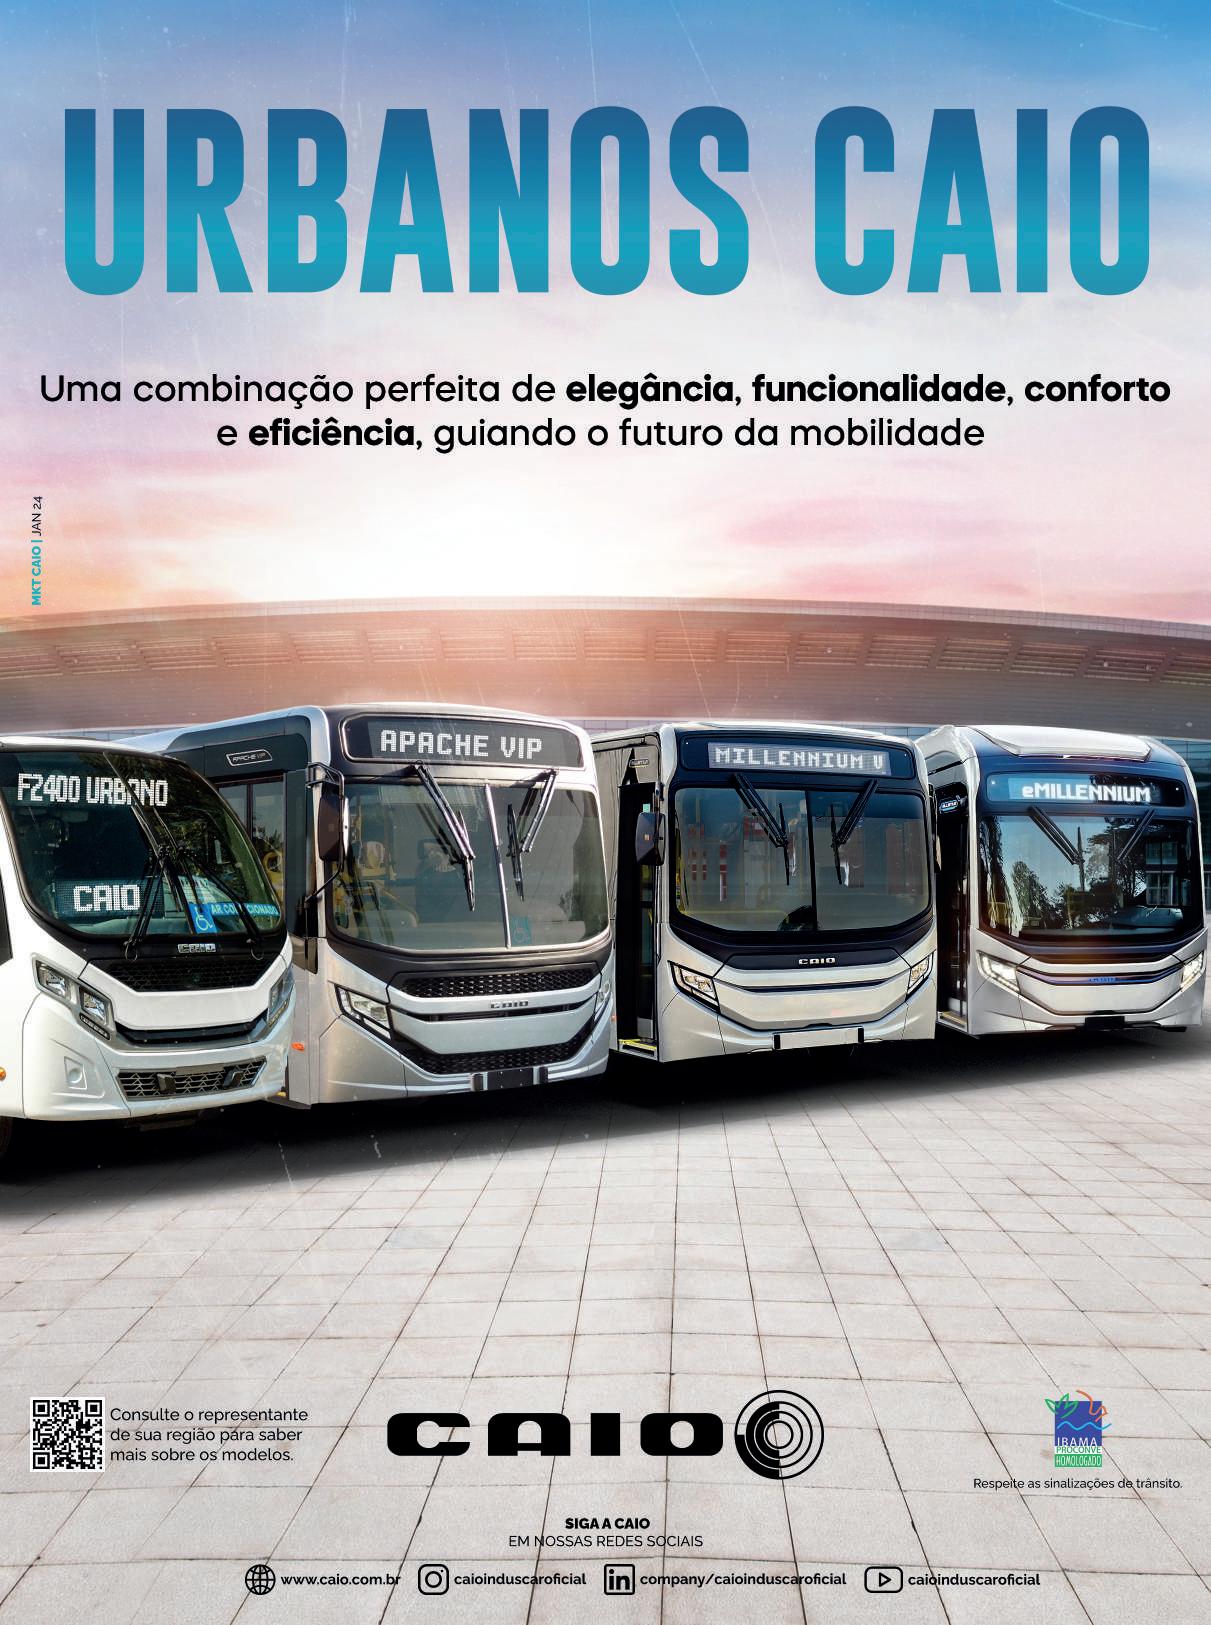
Autoveículos: produção, vendas internas e exportações
Vehicles: production, domestic sales and exports
2.5 Licenciamento de autoveículos novos por combustível - 1957/2023 (unidades)
2.5 Registration of new vehicles by fuel type - 1957/2023 (units)
64 | Anuário da Indústria Automobilística Brasileira | Brazilian Automotive Industry Yearbook | 2024
ANO Year CAMINHÕES Truks ÔNIBUS Buses TOTAL DE AUTOVEÍCULOS Vehicle total GASOLINA Gasoline ETANOL Ethanol ELETRIFICADO Electrified GÁS Gas DIESEL Diesel GASOLINA Gasoline ETANOL Ethanol ELETRIFICADO Electrified GÁS Gas DIESEL Diesel GASOLINA Gasoline ETANOL Ethanol FLEX FUEL Flex Fuel ELETRIFICADO Electrified GÁS Gas DIESEL Diesel 1957 9.957 - - - 8.106 - - - - 1.904 20.967 - - - - 10.010 1958 16.071 - - - 11.313 - - - - 3.333 46.280 - - - - 14.646 1959 27.111 - - - 10.100 329 - - - 2.830 83.333 - - - - 13.396 1960 28.311 - - - 9.742 527 - - - 3.422 118.025 - - - - 13.474 1961 20.575 - - - 5.714 200 - - - 2.850 136.229 - - - - 8.568 1962 28.791 - - - 7.403 156 - - - 3.193 179.018 - - - - 11.134 1963 15.559 - - - 5.977 121 - - - 2.299 163.994 - - - - 9.765 1964 15.692 - - - 5.482 71 - - - 2.553 170.648 - - - - 10.257 1965 15.692 - - - 6.759 29 - - - 2.927 177.389 - - - - 10.665 1966 20.213 - - - 10.334 23 - - - 3.609 206.774 - - - - 14.802 1967 17.602 - - - 10.007 23 - - - 4.765 211.492 - - - - 15.420 1968 25.400 - - - 15.058 7 - - - 6.995 255.641 - - - - 22.974 1969 22.558 - - - 16.875 6 - - - 5.621 326.083 - - - - 23.410 1970 17.067 - - - 21.100 23 - - - 4.100 390.915 - - - - 25.789 1971 15.872 - - - 21.771 32 - - - 4.304 483.044 - - - - 26.579 1972 19.901 - - - 30.441 17 - - - 4.205 566.185 - - - - 35.235 1973 25.888 - - - 38.930 67 - - - 6.333 689.392 - - - - 45.836 1974 29.385 - - - 42.048 97 - - - 7.070 785.430 - - - - 49.663 1975 16.350 - - - 53.551 151 - - - 8.780 795.421 - - - - 63.057 1976 8.209 - - - 66.762 14 - - - 10.972 816.952 - - - - 79.183 1977 1.874 - - - 88.373 26 - - - 12.012 749.971 - - - - 102.999 1978 519 - - - 78.372 2 - - - 11.859 877.816 - - - - 94.546 1979 1.174 6 - - 77.526 5 - - - 11.524 906.885 3.120 - - - 104.920 1980 583 - - - 81.350 - - - - 11.532 627.050 240.643 - - - 112.568 1981 61 1.058 - - 54.819 1 7 - - 9.171 344.529 137.307 - - - 98.889 1982 121 919 - - 40.217 - 3 - - 8.042 365.555 233.497 - - - 92.242 1983 206 2.045 - - 32.322 - - - - 6.575 78.824 581.373 - - - 67.535 1984 82 2.613 - - 40.189 - 14 - - 5.983 33.564 568.163 - - - 75.355 1985 22 1.894 - - 53.748 - - - - 7.141 28.677 647.445 - - - 87.058 1986 104 1.514 - - 70.235 - - - - 8.488 62.021 698.563 - - - 106.144 1987 51 539 - - 55.795 - - - - 10.068 31.241 459.222 - - - 89.622 1988 15 128 - - 54.769 - - - - 12.968 77.327 566.610 - - - 103.779 1989 60 49 - - 48.069 - - - - 9.485 260.881 399.578 - - - 101.166 1990 122 5 - - 41.186 - - - - 10.091 542.977 82.001 - - - 87.763 1991 123 3 - - 41.338 - - - - 16.865 546.381 150.985 - - - 93.407 1992 58 7 - - 25.594 - - - - 13.706 498.985 195.510 - - - 69.521 1993 66 - - - 38.317 - - - - 11.396 764.664 264.235 - - - 102.266 1994 22 1 - - 52.326 - - - - 12.595 1.127.507 141.835 - - - 126.061 1995 8 1 - - 58.725 - - - - 17.368 1.557.682 40.707 - - - 129.991 1996 - - - - 42.134 - - - - 15.518 1.621.968 7.647 - - - 101.173 1997 - - - - 54.931 - - - - 14.862 1.801.688 1.120 - - - 140.650 1998 - - - - 52.768 - - - - 15.761 1.388.734 1.224 - - - 144.994 1999 - - - - 50.665 - - - - 10.679 1.122.229 10.947 - - - 123.777 2000 117 - - - 69.092 - - - - 16.628 1.310.596 10.292 - - - 168.593 2001 - - - - 73.517 - - - - 16.960 1.412.420 18.335 - - - 170.527 2002 - - - - 66.484 - - - - 16.790 1.283.963 55.961 - - - 147.615 2003 - - - - 68.121 - - - - 17.413 1.152.463 36.380 48.178 - - 140.263 2004 - - - - 85.729 - - - - 16.982 1.077.945 50.950 328.379 - - 168.958 2005 - - - - 79.533 - - 16 5 15.248 697.006 32.357 812.104 16 5 173.156 2006 - - - 1 75.970 - - 4 2 19.476 316.559 1.863 1.430.334 7 3 178.972 2007 - - - - 98.585 - - 2 2 22.901 245.651 107 2.003.080 5 2 213.868 2008 - - - - 122.287 - - 1 - 26.873 217.016 84 2.329.251 10 - 273.993 2009 - - - 6 109.821 - - 12 3 22.531 221.688 70 2.652.298 34 9 267.141 2010 - - - 5 157.702 - - 3 1 28.324 280.677 50 2.876.173 32 6 358.126 2011 - - - 7 172.863 - - 3 - 34.544 376.804 51 2.848.071 203 7 408.112 2012 - - - 2 139.172 - - 94 - 28.620 273.915 52 3.162.822 211 2 365.069 2013 - - 1 3 154.572 - - 118 - 32.780 189.109 34 3.169.080 610 3 408.534 2014 - - - 4 137.051 - - - - 27.474 184.841 14 2.940.494 855 4 371.804 2015 - - - 1 71.651 - - 13 1 16.778 136.150 16 2.194.004 859 2 237.945 2016 - - 1 - 50.559 - - 15 2 11.144 80.495 16 1.750.732 1.107 2 217.965 2017 2 - - - 51.941 1 - 2 - 11.752 68.905 30 1.927.191 3.298 - 240.258 2018 12 - 3 1 75.989 3 - 4 - 15.074 81.950 21 2.168.152 3.977 1 312.323 2019 17 2 29 10 101.277 - - 37 - 20.895 73.871 30 2.328.621 11.924 10 373.394 2020 8 - 23 45 89.602 1 - 18 - 13.921 58.939 21 1.664.978 19.786 45 314.668 2021 9 - 293 93 128.284 - - 20 2 14.040 53.597 25 1.624.322 35.303 95 406.509 2022 34 1 714 356 125.538 - - 35 - 17.322 48.838 36 1.633.247 50.010 356 371.974 2023 36 - 379 147 107.462 - - 86 2 20.347 60.602 34 1.809.830 94.376 149 343.698 3. Os dados até 2004 referem-se a vendas internas no atacado. / Data up to 2004 refer to domestic wholesale sales Eletrificado: inclui as versões elétrico/fonte externa, elétrico/fonte interna e híbrido (combustível líquido/elétrico) / Electrified: includes electric/external source electric/internal source and hybrid (liquid/electric fuel) versions Flex Fuel: Gasolina/Etanol / Gasoline/Ethanol
Continuação da página 62 / Continuation from 62 Unidades / Units
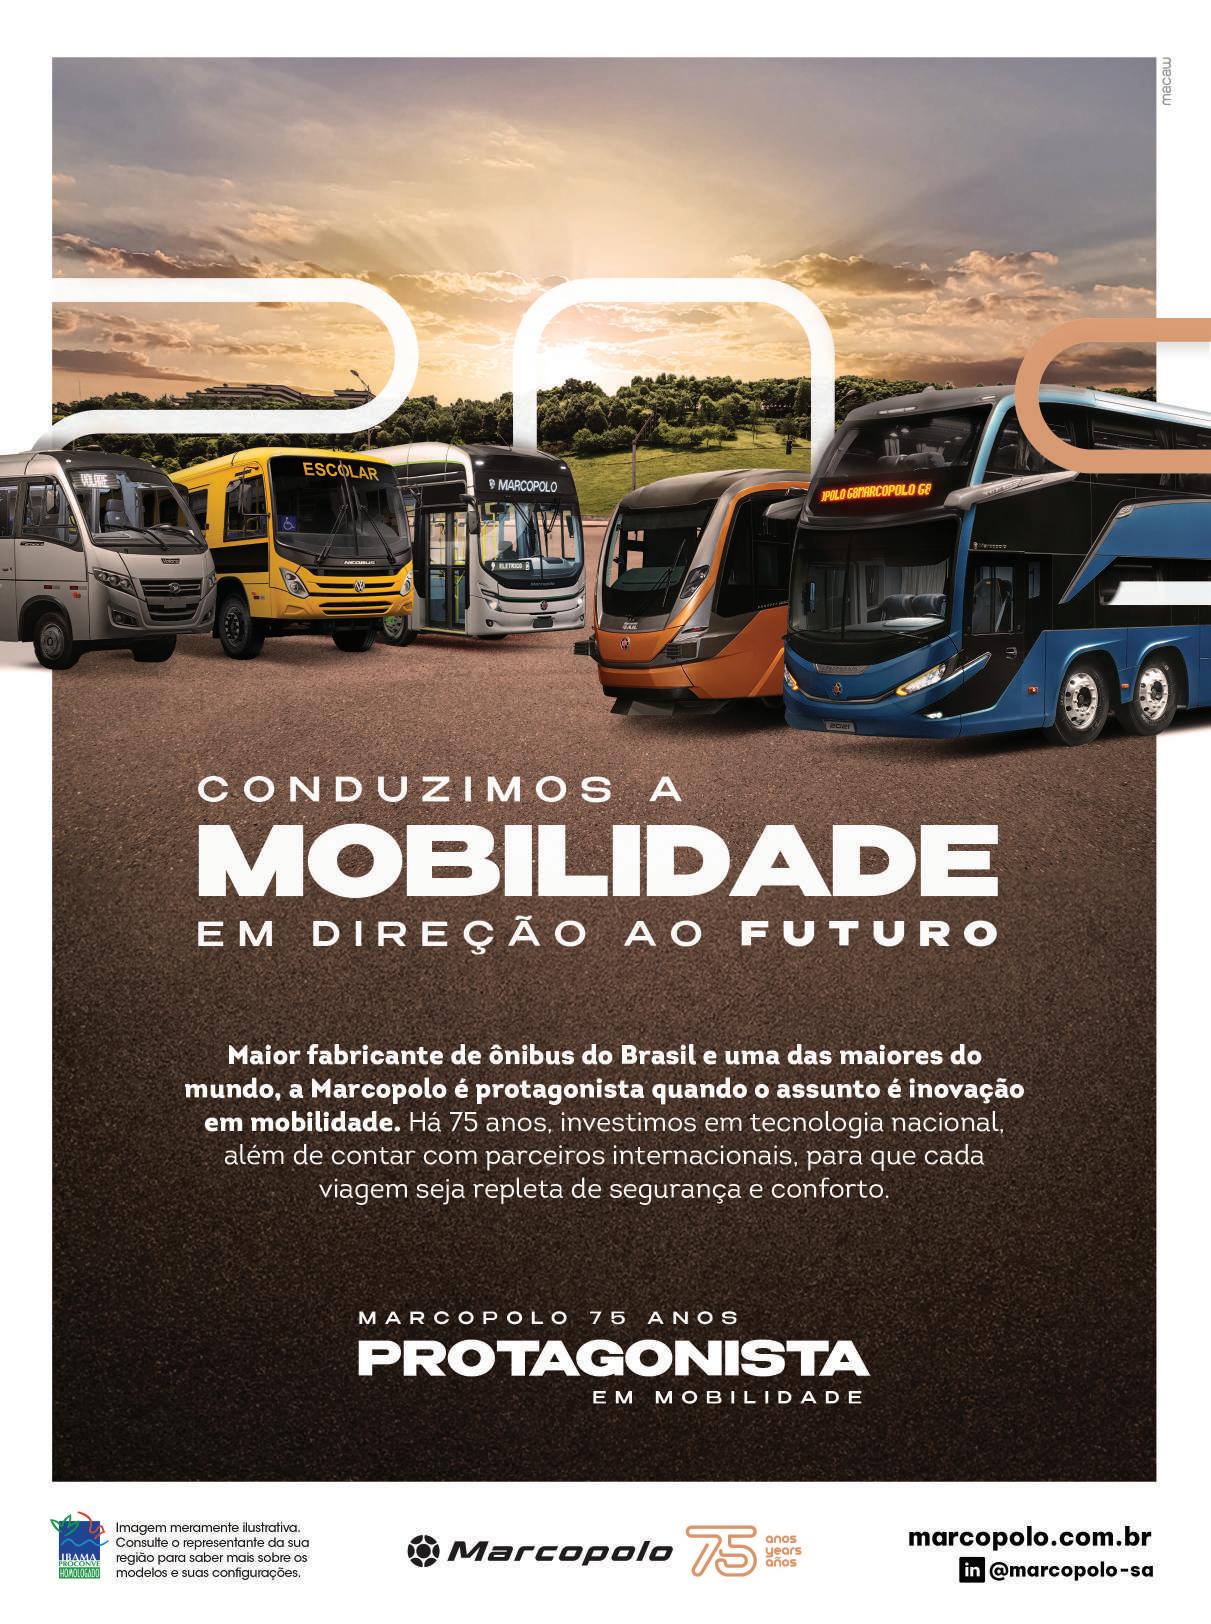
Vehicles: production, domestic sales and exports
2.6 Licenciamento de autoveículos novos nacionais - 1957/2023 (unidades) 2.6 Registration of nationally manufactures new vehicles - 1957/2023 (units)
66 | Anuário da Indústria Automobilística Brasileira | Brazilian Automotive Industry Yearbook | 2024
Autoveículos: produção, vendas internas e exportações
ANO Year AUTOMÓVEIS Cars COMERCIAIS LEVES Light commercials CAMINHÕES Trucks ÔNIBUS Buses TOTAL Total 1957 9 478 1 532 18 063 1 904 30.977 1958 20 677 9 532 27 384 3 333 60 926 1959 40 020 16 339 37 211 3 159 96 .729 1960 68 762 20 735 38 053 3 949 131 499 1961 86 863 28 595 26 289 3 050 144 .797 1962 117 204 33 405 36 194 3 349 190.152 1963 121 562 28 241 21 536 2 420 173 759 1964 130 435 26 672 21 174 2 624 180.905 1965 136 794 25 853 22 451 2 956 188 054 1966 155 552 31 845 30 547 3 632 221. 576 1967 158 982 35 533 27 609 4 788 226 .912 1968 185 059 46 096 40 458 7 002 278 615 1969 255 802 48 631 39 433 5 627 349. 493 1970 320 690 53 724 38 167 4 123 416 .704 1971 412 121 55 523 37 643 4 336 509 623 1972 474 343 72 513 50 342 4 222 601. 420 1973 571 193 92 817 64 818 6 400 735 228 1974 655 140 101 353 71 433 7 167 835.093 1975 674 633 105 013 69 901 8 931 858 . 478 1976 705 136 105 042 74 971 10 986 896 135 1977 682 288 68 397 90 247 12 038 852 .970 1978 802 004 79 606 78 891 11 861 972 362 1979 832 669 92 021 78 706 11 529 1.014 .925 1980 797 395 89 401 81 933 11 532 980. 261 1981 449 872 65 736 55 938 9 179 580 725 1982 559 191 82 801 41 257 8 045 691. 294 1983 610 126 76 458 34 573 6 575 727 732 1984 533 424 94 777 42 884 5 997 677.082 1985 603 623 96 752 55 664 7 141 763 .180 1986 675 353 111 034 71 853 8 488 866 728 1987 413 438 100 194 56 385 10 068 580.085 1988 559 542 120 294 54 912 12 968 747.716 1989 569 231 134 731 48 178 9 485 761 625 1990 534 654 126 568 41 313 10 091 712 .626 ANO Year AUTOMÓVEIS Cars COMERCIAIS LEVES Light commercials CAMINHÕES Trucks ÔNIBUS Buses TOTAL Total 1991 584 949 127 658 41 464 16 865 770 936 1992 577 789 123 171 25 659 13 706 740. 325 1993 850 940 161 368 37 769 11 390 1.061. 467 1994 976 014 170 087 50 409 10 313 1 206 823 1995 1 108 544 178 986 56 963 14 839 1 359 332 1996 1 263 955 189 666 40 573 12 589 1. 506 .783 1997 1 378 536 195 311 52 305 14 091 1.640. 243 1998 980 768 141 822 49 919 15 228 1.187.737 1999 907 050 113 585 46 906 10 674 1 078 215 2000 1 088 335 148 961 61 624 16 383 1. 315. 303 2001 1 183 886 151 780 70 509 16 791 1. 422 .966 2002 1 158 417 124 963 63 510 16 442 1. 363 . 332 2003 1 161 405 113 185 64 351 15 810 1 354 751 2004 1 275 421 144 608 79 357 17 629 1 517 015 2005 1 383 116 151 512 76 584 15 264 1.626 . 476 2006 1 527 904 165 197 72 675 19 468 1.785. 244 2007 1 853 900 213 521 95 277 22 898 2 185 596 2008 2 024 920 275 173 118 237 26 872 2 445 202 2009 2 219 909 303 274 106 454 22 545 2 .652 .182 2010 2 285 318 386 071 154 974 28 326 2 . 854 .689 2011 2 151 071 420 759 168 835 34 546 2 .775. 211 2012 2 438 673 411 805 134 777 28 714 3 013 969 2013 2 454 403 422 004 151 202 32 894 3 .060. 503 2014 2 289 382 429 143 134 991 27 473 2 . 880.989 2015 1 786 956 280 653 70 226 16 782 2 .154 .617 2016 1 484 744 232 219 48 743 11 154 1 776 860 2017 1 691 833 241 826 50 160 11 754 1.995. 573 2018 1 896 325 270 447 74 069 15 078 2 . 255.919 2019 2.081.815 289.227 98.220 20.931 2.490.193 2020 1.498.119 249.017 85.742 13.940 1.846.818 2021 1.417.314 311.875 122.824 14.060 1.866.073 2022 1.411.329 282.174 120.133 17.356 1.830.992 2023 1.487.575 348.623 100.074 20.428 1.956.700 FONTES / SOURCES: ANFAVEA, RENAVAM/SENATRAN. NOTA / NOTE: Os dados até 2001 referem-se a vendas internas no atacado. Before 2002 the data refer to domestic wholesales of nationally manufactured vehicles. Unidades / Units
2.7 Licenciamento de autoveículos novos importados - 1990/2023 (unidades)
2.7 Registration of imported new vehicles - 1990/2023 (units)
Unidades / Units
FONTES / SOURCES: ABEIFA, ANFAVEA, RENAVAM/SENATRAN. NOTAS / NOTES:
1. As importações foram retomadas em 1990. Imports were recommenced in 1990. 2. Os dados até 2001 inclusive se referem a vendas internas no atacado. A partir de 2002, a licenciamento (DENATRAN). Before 2002. the data refer to domestic wholesales of nationally manufacture vehicles. As from 2002, the figures relate to registration of new vehicles (DENATRAN).
2024 | Anuário da Indústria Automobilística Brasileira | Brazilian Automotive Industry Yearbook | 67
ANUÁRIO DA INDÚSTRIA AUTOMOBILÍSTICA BRASILEIRA Brazilian Automotive Industry Yearbook
2024
ANO Year AUTOMÓVEIS Cars COMERCIAIS LEVES Light commercials CAMINHÕES Trucks ÔNIBUS Buses TOTAL Total 1990 115 - - - 115 1991 19 561 276 - - 19. 837 1992 22 400 1 291 - - 23 .691 1993 59 665 9 413 614 6 69.698 1994 158 987 25 371 1 940 2 282 188 . 580 1995 306 998 57 750 1 771 2 529 369.048 1996 164 554 54 961 1 561 2 929 224 005 1997 226 678 73 140 2 626 771 303 215 1998 265 296 78 537 2 849 533 347 215 1999 129 152 45 822 3 759 5 178 738 2000 116 735 49 613 7 585 245 174 .178 2001 134 346 40 793 3 008 169 178 . 316 2002 85 050 27 968 2 170 60 115. 248 2003 54 144 18 021 1 611 77 73 . 853 2004 39 937 19 693 2 127 3 61.760 2005 56 706 28 508 2 949 5 88 .168 2006 105 043 34 141 3 296 14 142 . 494 2007 231 806 41 996 3 308 7 277 117 2008 316 384 54 716 4 050 2 375 152 2009 423 953 61 731 3 373 1 489 058 2010 571 222 86 418 2 733 2 660. 375 2011 750 576 103 425 4 035 1 858 .037 2012 676 550 107 155 4 397 - 788 .102 2013 586 380 117 109 3 374 4 706 . 867 2014 505 305 109 653 2 064 1 617.023 2015 336 053 76 870 1 426 10 414 . 359 2016 203 545 68 088 1 817 7 273 . 457 2017 164.751 77.574 1.783 1 244.109 2018 205.789 102.777 1.936 3 310.505 2019 180.258 114.283 3.115 1 297.657 2020 117.823 89.860 3.936 - 211.619 2021 141.153 106.768 5.855 2 253.778 2022 165.333 101.625 6.510 1 273.469 2023 233.825 110.207 7.950 7 351.989
Autoveículos: produção, vendas internas e exportações
Vehicles: production, domestic sales and exports
2.8 Licenciamento de autoveículos novos importados por país de origem - 2022/2023 (unidades)
2.8 Registration of imported new vehicles per country of origin - 2022/2023 (units)
68 | Anuário da Indústria Automobilística Brasileira | Brazilian Automotive Industry Yearbook | 2024
PAÍS Country AUTOMÓVEIS Cars COMERCIAIS LEVES Ligth commercials CAMINHÕES Trucks ÔNIBUS Buses TOTAL Total 2022 2023 2022 2023 2022 2023 2022 2023 2022 2023 AMÉRICA DO SUL / SOUTH AMERICA ARGENTINA / Argentina 112.126 128.027 83.855 89.517 2.431 2.366 - - 198.412 219.910 URUGUAI / Uruguay 3 2 11.688 11.941 - - - - 11.691 11.943 TOTAL 112.129 128.029 95.543 101.458 2.431 2.366 - - 210.103 231.853 AMÉRICA DO NORTE / NORTH AMERICA CANADÁ / Canada 68 103 12 9 5 2 - - 85 114 ESTADOS UNIDOS / United States 872 1.242 1.437 2.683 35 57 - - 2.344 3.982 MÉXICO / Mexico 9.959 22.097 3.789 4.161 3.252 4.810 - - 17.000 31.068 TOTAL / TOTAL 10.899 23.442 5.238 6.853 3.292 4.869 - - 19.429 35.164 EUROPA / EUROPE ALEMANHA / Germany 18.412 22.209 11 10 18 29 - 2 18.441 22.250 ESLOVÁQUIA / Slovakia 682 1.062 - - - - - - 682 1.062 FRANÇA / France 2.091 1.140 571 629 58 119 - - 2.720 1.888 INGLATERRA / England 2.445 3.920 - 3 - - - - 2.445 3.923 ITÁLIA / Italy 764 597 1 888 2 29 - - 767 1.514 SUÉCIA / Sweden 3.493 4.046 - - 24 10 1 2 3.518 4.058 TOTAL / TOTAL 27.887 32.974 583 1.530 102 187 1 4 28.573 34.695 ÁSIA / ASIA CHINA / China 7.052 41.288 190 164 664 511 - 3 7.906 41.966 COREIA DO SUL / South Korea 1.885 2.055 3 5 - - - - 1.888 2.060 JAPÃO / Japan 3.333 3.270 6 3 - 1 - - 3.339 3.274 TAILÂNDIA / Thailand 1.953 2.544 2 - - - - - -TOTAL / TOTAL 14.223 49.157 201 172 664 512 - 3 15.088 49.844 OCEANIA / OCEANIA AUSTRÁLIA / Australia 4 8 1 - - - - - 5 8 TOTAL / TOTAL 4 8 1 - - - - - 5 8 NÃO IDENTIFICADOS Unidentified 191 215 59 194 21 16 - - 271 425 TOTAL GERAL / TOTAL 165.333 233.825 101.625 110.207 6.510 7.950 1 7 273.469 351.989 FONTE / SOURCE: RENAVAM/SENATRAN. Unidades / Units
2.9 Vendas internas no atacado de importados procedentes do Mercosul - 1991/2023 (unidades)
2.9 Domestic wholesales of imported products from Mercosur - 1991/2023 (units)
Da Argentina / From Argentina
Do Uruguai / From Uruguay
2024 | Anuário da Indústria Automobilística Brasileira | Brazilian Automotive Industry Yearbook | 69
ANUÁRIO DA INDÚSTRIA AUTOMOBILÍSTICA BRASILEIRA Brazilian Automotive Industry Yearbook
2024
ANO Year AUTOMÓVEIS Cars COMERCIAIS LEVES Light commercials CAMINHÕES Trucks ÔNIBUS Buses TOTAL Total 1991 3 728 218 - - 3 .946 1992 12 777 459 - - 13 236 1993 20 240 4 439 614 - 25. 293 1994 23 020 8 197 1 538 2 144 34 . 899 1995 16 741 17 208 1 482 2 464 37 895 1996 83 075 16 346 833 2 858 103 .112 1997 135 273 38 260 398 553 174 484 1998 175 508 47 356 162 - 223 026 1999 68 296 33 105 750 - 102 .151 2000 62 626 31 792 4 544 56 99 018 2001 88 093 29 239 2 857 53 120. 242 2002 38 487 19 786 2 247 184 60.704 2003 22 411 15 437 1 739 43 39 630 2004 22 814 16 688 2 968 - 42 . 470 2005 24 546 27 956 2 453 - 54 .955 2006 53 466 39 094 3 273 - 95 833 2007 120 400 51 486 3 290 - 175.176 2008 155 764 58 773 3 842 - 218 . 379 2009 222 069 58 513 2 886 - 283 468 2010 294 719 60 773 1 341 - 356 . 833 2011 318 302 67 615 1 071 - 386 .988 2012 245 417 78 436 807 - 324 660 2013 245 716 93 738 1 214 - 340.668 2014 214 336 99 328 1 229 - 314 . 893 2015 144 513 71 675 1 047 - 217 235 2016 91 982 65 372 1 042 - 158 . 396 2017 66 835 71 761 1 371 - 139 967 2018 87 407 89 057 1 179 - 177.643 2019 69 193 101 482 1 957 - 172 .632 2020 43.067 79.430 2.129 - 124.626 2021 74.715 92.824 3.022 - 170.561 2022 112.126 83.855 2.431 - 198.412 2023 128.027 89.517 2.366 - 219.910 ANO Year AUTOMÓVEIS Cars COMERCIAIS LEVES Light commercials CAMINHÕES Trucks ÔNIBUS Buses TOTAL Total 1991 - - - -1992 144 - - - 144 1993 346 - - - 346 1994 1 793 - - - 1.793 1995 1 543 - - - 1 543 1996 2 856 - - - 2 . 856 1997 1 461 - - - 1 461 1998 1 918 811 - - 2 729 1999 2 758 1 208 - - 3 .966 2000 4 368 213 - - 4 581 2001 2 522 6 - - 2 . 528 2002 3 939 - - - 3 .939 2003 1 145 1 - - 1 146 2004 20 - - - 20 2005 15 - - - 15 2006 - - - -2007 - - - -2008 162 - - - 162 2009 421 - - - 421 2010 2 682 - - - 2 .682 2011 4 102 5 037 - - 9.139 2012 1 292 2 178 - - 3 470 2013 3 221 2 852 - - 6 .073 2014 8 177 4 518 - - 12 .695 2015 6 135 3 310 - - 9 445 2016 3 582 1 923 - - 5. 505 2017 2 985 2 303 - - 5 288 2018 2 238 4 630 - - 6 . 868 2019 230 6 722 - - 6 .952 2020 35 5.991 - - 6.026 2021 14 9.549 - - 9.563 2022 3 11.688 - - 11.691 2023 2 11.941 - - 11.943 FONTES / SOURCES: ABEIFA, ANFAVEA, RENAVAM/SENATRAN. NOTA / NOTE: : Os dados anteriores a 2010 referem-se a vendas internas no atacado. / Before 2010 the figures refer to domestic wholesales. Unidades / Units
Vehicles: production, domestic sales and exports
2.10 Licenciamento de automóveis novos de 1.000 cm3 - 1990/2023 (unidades)
2.10 Registration of cars with 1.000 cm3 engines - 1990/2023 (units)
Unidades / Units
2.11 Licenciamento de caminhões por categoria - 2002/2023 (unidades) 2.11 Registration of trucks by type -
(units)
Unidades / Units
70 | Anuário da Indústria Automobilística Brasileira | Brazilian Automotive Industry Yearbook | 2024
Autoveículos: produção, vendas internas e exportações
ANO Year AUTOMÓVEIS DE 1.000 CM3 Cars with 1.000 cm3 TOTAL DE AUTOMÓVEIS All Cars PARTICIPAÇÃO EM % Share % 1990 23 013 534 769 4,3 1991 67 299 604 510 11,1 1992 92 959 600 189 15,5 1993 243 511 910 605 26,7 1994 450 925 1 135 001 39,7 1995 602 098 1 415 542 42,5 1996 703 118 1 428 509 49, 2 1997 880 119 1 605 214 54,8 1998 748 474 1 246 064 60,1 1999 625 445 1 036 202 60,4 2000 777 604 1 205 070 64,5 2001 920 389 1 318 232 69,8 2002 820 135 1 243 467 66,0 2003 707 430 1 215 549 58, 2 2004 742 005 1 315 358 56,4 2005 825.462 1.439.822 57,3 ANO Year AUTOMÓVEIS DE 1.000 CM3 Cars with 1.000 cm3 TOTAL DE AUTOMÓVEIS All Cars PARTICIPAÇÃO EM % Share % 2006 922.221 1.632.947 56,5 2007 1.124.012 2.085.706 53,9 2008 1.185.778 2.341.304 50,6 2009 1.369.045 2.643.862 51,8 2010 1.393.214 2.856.540 48,8 2011 1.236.443 2.901.647 42,6 2012 1.208.398 3.115.223 38,8 2013 1.097.248 3.040.783 36,1 2014 998.944 2.794.687 35,7 2015 716.796 2.123.009 33,8 2016 552.685 1.688.289 32,7 2017 639.189 1.856.584 34,4 2018 738.831 2.102.114 35,1 2019 878.823 2.262.073 38,9 2020 774.144 1.615.942 47,9 2021 679.751 1.558.467 43,6 2022 854.973 1.576.662 54,2 2023 935.699 1.721.400 54,4 FONTE / SOURCE: ANFAVEA, RENAVAM/SENATRAN NOTA / NOTE: Os dados anteriores a 2005 referem-se a vendas internas no atacado / Before 2005 the figures refer to domestic wholesales. ANO Year SEMILEVES Semi-light LEVES Light MÉDIOS Medium SEMIPESADOS Semi-heavy PESADOS Heavy TOTAL Total 2 002 6 898 19 627 9 907 15 276 13 972 65.680 2003 5 460 17 925 8 485 16 883 17 209 65.962 2004 5 943 20 245 8 647 22 308 24 341 81. 484 2005 6 891 19 943 8 449 22 597 21 653 79 533 2006 7 451 19 385 9 538 20 189 19 408 75 971 2007 8 468 22 639 11 239 27 940 28 299 98 585 2008 8 863 25 441 11 888 37 434 38 661 122 . 287 2009 6 604 25 823 11 503 34 773 31 124 109. 827 2010 7 325 34 466 14 038 49 985 51 893 157.707 2011 7 893 39 453 14 052 57 955 53 517 172 . 870 2012 6.551 33.346 11.849 45.877 41.551 139.174 2013 5.522 34.090 11.135 47.943 55.886 154.576 2014 3.967 28.725 11.699 44.883 47.781 137.055 2015 3.709 19.375 6.965 22.459 19.144 71.652 2016 3.514 13.161 4.221 14.186 15.478 50.560 2017 3.518 11.687 4.449 13.295 18.994 51.943 2018 4.122 11.554 7.677 17.414 35.238 76.005 2019 5.079 11.242 10.069 22.805 52.140 101.335 2020 4.859 9.049 8.357 23.120 44.293 89.678 2021 6.586 12.577 11.185 32.187 66.144 128.679 2022 7.553 10.811 10.423 32.851 65.005 126.643 2023 8.594 9.040 8.320 28.771 53.299 108.024 SEMILEVES / Semi-light PBT > 3,5 t < 6 t LEVES / Light PBT ≥ 6 t < 10 t MÉDIOS / Medium PBT ≥ 10 t < 15 t SEMIPESADOS / Semi-heavy Caminhão-chassi / Truck PBT ≥ 15 t e CMT ≤ 45 t Caminhão-trator / Truck-tractor PBT ≥ 15 t e PBTC < 40 t PESADOS / Heavy Caminhão-chassi / Truck PBT ≥ 15 t e CMT > 45 t Caminhão-trator / Truck-tractor PBT ≥ 15 t e PBTC ≥ 40 t PBT - Peso Bruto Total / Gross Vehicle Weight; CMT - Capacidade Máxima de Tração / Maximum Traction Capacity; PBTC - Peso Bruto Total Combinado / Total Combined Gross Weight > Maior / more than; ≥ maior ou igual / more than or equal ; < menor / less than; ≤ menor ou igual / less than or equal
2002/2023
FONTE / SOURCE: RENAVAM/SENATRAN.
2.12 Exportações de autoveículos montados - 1961/2023 (unidades) 2.12 Exports of assembled vehicles - 1961/2023 (units)
2024 | Anuário da Indústria Automobilística Brasileira | Brazilian Automotive Industry Yearbook | 71 2024 ANUÁRIO DA INDÚSTRIA AUTOMOBILÍSTICA BRASILEIRA Brazilian Automotive Industry Yearbook
ANO Year AUTOMÓVEIS Cars COMERCIAIS LEVES Light commercials CAMINHÕES Trucks ÔNIBUS Buses TOTAL Total 1961 - - - 380 380 1962 - - - 170 170 1963 - - - -1964 - - - 57 57 1965 - - 9 120 129 1966 - - 3 207 210 1967 - - 3 32 35 1968 - - 7 2 9 1969 3 - 4 18 25 1970 175 78 122 34 409 1971 259 121 364 32 776 1972 683 202 544 932 2 361 1973 2 353 940 1 384 183 4 . 860 1974 12 518 3 070 2 932 916 19 436 1975 18 163 2 073 4 416 1 337 25.989 1976 11 324 2 972 6 084 1 015 21. 395 1977 16 461 2 465 6 427 1 471 26 . 824 1978 31 537 5 388 7 524 1 284 45.733 1979 25 382 8 784 11 255 1 986 47 407 1980 49 359 14 512 14 462 2 391 80.724 1981 88 328 24 692 11 745 4 047 128 812 1982 63 773 41 701 2 580 1 025 109.079 1983 72 638 28 049 1 419 185 102 291 1984 76 955 30 415 1 596 620 109. 586 1985 88 250 28 346 4 738 632 121 966 1986 57 516 28 778 5 674 722 92 .690 1987 188 301 42 187 11 244 2 143 243 875 1988 132 498 70 537 12 924 3 189 219.148 1989 115 401 66 083 9 988 3 271 194 743 1990 60 606 48 354 5 060 3 020 117.040 1991 36 728 48 858 3 601 4 210 93 . 397 1992 94.633 63 441 7 794 7 542 173.410 ANO Year AUTOMÓVEIS Cars COMERCIAIS LEVES Light commercials CAMINHÕES Trucks ÔNIBUS Buses TOTAL Total 1993 58 903 38 614 8 588 6 741 112 . 846 1994 51 435 48 118 10 390 6 661 116 604 1995 40 653 41 018 8 266 3 989 93 .926 1996 54 148 48 962 7 883 3 575 114 568 1997 129 814 61 513 12 126 5 645 209.098 1998 160 766 63 435 14 042 5 013 243 256 1999 145 631 50 051 8 386 3 849 207.917 2000 207 186 65 343 8 745 4 629 285.903 2001 197 157 39 223 6 562 5 330 248 . 272 2002 220 123 34 935 5 291 5 358 265.707 2003 329 773 44 677 11 685 6 693 392 828 2004 469 638 63 606 23 216 9 182 565.642 2005 595 098 82 526 33 632 12 907 724 163 2006 514 972 73 545 35 083 10 873 634 . 473 2007 511 186 74 459 38 111 10 800 634 556 2008 457 695 66 339 34 831 9 717 568 . 582 2009 308 772 42 872 10 851 5 528 368 .023 2010 405 709 66 661 21 182 9 202 502 754 2011 442 606 75 966 27 034 7 720 553 . 326 2012 349 172 62 483 23 067 8 363 443 085 2013 461 066 70 561 24 201 9 283 565.111 2014 263 604 46 270 17 737 6 608 334 219 2015 316 537 72 487 20 983 7 325 417. 332 2016 408 123 77 132 21 548 9 765 516 . 568 2017 623 976 104 763 28 220 9 102 766 061 2018 500 164 95 089 24 642 9 101 628 .996 2019 351.203 61.621 13.552 7.136 433.512 2020 258.279 48.689 13.243 4.119 324.330 2021 298.012 51.438 22.699 4.234 376.383 2022 386.422 63.918 25.258 5.331 480.929 2023 308.228 73.771 16.946 4.974 403.919
/ Units FONTE / SOURCE: ANFAVEA
Unidades
Autoveículos: produção, vendas internas e exportações
Vehicles: production, domestic sales and exports
2.13 Exportações totais* de autoveículos - 1961/2023 (unidades) 2.13 Total exports* of vehicles - 1961/2023 (units)


72 | Anuário da Indústria Automobilística Brasileira | Brazilian Automotive Industry Yearbook | 2024
ANO Year AUTOMÓVEIS Cars COMERCIAIS LEVES Light commercials CAMINHÕES Trucks ÔNIBUS Buses TOTAL Total 1961 - - - 380 380 1962 - - - 170 170 1963 - - - -1964 - - - 57 57 1965 - - 9 120 129 1966 - - 3 207 210 1967 - - 3 32 35 1968 - - 7 2 9 1969 3 - 4 18 25 1970 175 78 122 34 409 1971 691 565 364 32 1.652 1972 6.706 2.754 3.136 932 13.528 1973 14.043 4.510 5.754 199 24.506 1974 47.630 9.236 6.896 916 64.678 1975 53.035 10.761 7.968 1.337 73.101 1976 62.096 8.264 9.032 1.015 80.407 1977 56.699 3.269 8.347 1.711 70.026 1978 78.615 5.796 10.129 1.632 96.172 1979 78.644 10.716 14.270 2.018 105.648 1980 117.197 18.520 18.977 2.391 157.085 1981 158.546 31.343 18.662 4.135 212.686 1982 120.926 45.960 5.400 1.065 173.351 1983 133.070 31.637 3.660 307 168.674 1984 152.043 35.395 7.024 2.053 196.515 1985 160.716 36.541 8.945 1.438 207.640 1986 138.297 31.599 11.769 1.614 183.279 1987 279.675 44.425 17.342 4.113 345.555 1988 226.481 72.533 15.948 5.514 320.476 1989 164.953 68.785 15.429 4.553 253.720 1990 120.396 53.560 8.371 4.984 187.311 1991 127.217 53.218 6.416 6.297 193.148 1992 243.149 80.660 8.915 9.176 341.900 ANO Year AUTOMÓVEIS Cars COMERCIAIS LEVES Light commercials CAMINHÕES Trucks ÔNIBUS Buses TOTAL Total 1993 249.617 62.903 11.049 7.953 331.522 1994 274.815 79.996 14.532 8.284 377.627 1995 189.774 58.436 8.700 6.134 263.044 1996 214.061 68.455 8.545 5.212 296.273 1997 310.051 87.308 12.438 7.075 416.872 1998 297.479 82.052 14.550 6.163 400.244 1999 204.677 57.136 8.498 4.488 274.799 2000 284.131 71.847 9.293 6.028 371.299 2001 328.971 48.079 6.762 7.042 390.854 2002 370.280 41.895 5.475 6.765 424.415 2003 463.283 50.557 12.820 9.320 535.980 2004 646.792 73.398 25.650 12.947 758.787 2005 737.654 102.254 38.312 18.924 897.144 2006 692.057 96.705 38.190 15.860 842.812 2007 632.396 100.643 41.384 14.942 789.365 2008 593.223 87.003 38.618 15.690 734.534 2009 396.309 55.616 13.504 9.896 475.325 2010 646.993 82.753 23.060 14.626 767.432 2011 442.606 93.434 32.232 14.480 582.752 2012 351.236 80.387 26.340 13.140 471.103 2013 461.402 88.369 28.153 13.699 591.623 2014 265.620 61.486 21.513 10.952 359.571 2015 316.777 89.335 24.501 11.400 442.013 2016 409.251 87.647 25.786 14.742 537.426 2017 625.186 110.619 34.977 13.967 784.749 2018 501.124 95.089 34.947 12.261 643.421 2019 351.373 61.621 17.898 9.456 440.348 2020 258.289 48.689 17.116 6.260 330.354 2021 298.012 51.438 28.789 6.145 384.384 2022 386.422 63.918 32.317 8.733 491.390 2023 308.228 73.771 28.055 8.406 418.460
/ Units FONTE / SOURCE: ANFAVEA * Autoveículos montados e desmontados (CKD). / Includes assembled and CKD vehicles.
Unidades


Autoveículos: produção, vendas internas e exportações
Vehicles: production, domestic sales and exports
2.14 Informações por empresa (unidades) / 2.14 Information per company (units)
Agrale S.A.
Licenciamento de nacionais*
Registration of nationally manufactured vehicles*

74 | Anuário da Indústria Automobilística Brasileira | Brazilian Automotive Industry Yearbook | 2024
ANO Year COMERCIAIS LEVES Light commercials CAMINHÕES Trucks ÔNIBUS Buses TOTAL Total 1982 180 - - 180 1983 164 93 - 257 1984 107 447 - 554 1985 108 692 - 800 1986 1 1.641 - 1.642 1987 5 1.249 - 1.254 1988 - 1.173 - 1.173 1989 - 1.401 - 1.401 1990 - 1.517 - 1.517 1991 - 1.134 - 1.134 1992 - 337 - 337 1993 - 956 - 956 1994 - 1.254 - 1.254 1995 - 1.138 - 1.138 1996 - 399 5 404 1997 - 445 98 543 1998 - 550 703 1.253 1999 - 176 1.417 1.593 2000 - 343 2.760 3.103 2001 - 491 2.900 3.391 2002 - 566 3.362 3.928 2003 5 625 3.060 3.690 2004 - 712 3.117 3.829 2005 22 447 2.746 3.215 2006 24 337 3.015 3.376 2007 55 541 3.360 3.956 2008 37 834 4.960 5.831 2009 21 571 3.985 4.577 2010 25 790 4.430 5.245 2011 21 842 4.390 5.253 2012 14 568 3.537 4.119 2013 11 474 5.828 6.313 2014 14 444 4.420 4.878 2015 9 265 2.388 2.662 2016 1 198 1.572 1.771 2017 1 119 1.452 1.572 2018 - 57 1.847 1.90 4 2019 - 58 2.229 2.287 2020 - 18 1.614 1.632 2021 1 50 2.832 2.883 2022 1 76 2.939 3.016 2023 2 90 2.910 3.002
FONTE / SOURCE: ANFAVEA * Os dados anteriores a 2002 referem-se a vendas internas no atacado./ * Before 2002, the figures refer to domestic wholesales.
/ Units
Unidades
SUA EMPRESA ESTA PRONTA PARA LIDERAR A ERA DA TRANSFORMAÇÃO DIGITAL?
A Reply é uma empresa global que utiliza a tecnologia para transformar negócios. Apoiamos as indústrias no desenvolvimento de modelos inovadores frente aos novos paradigmas tecnológicos e estamos presentes em mais de 18 países.
Conhecemos os desafios da indústria nacional, especialmente do mercado automotivo, e por
comercial.bh.br@reply.com
+55 (31) 2514-5900

isso nos destacamos pela análise criteriosa dos negócios, processos e projetos digitais.
Nosso DNA inovador se apoia na transformação digital, oferecemos soluções e serviços como Inteligência Artificial, IoT, Integração de sistemas, manufatura aditiva e preventiva no desenvolvimento para indústria 4.0.
REPLY
Autoveículos: produção, vendas internas e exportações
Vehicles: production, domestic sales and exports
2.14 Informações por empresa (unidades) / 2.14 Information per company (units)
Audi do Brasil Indústria e Comércio de Veículos Ltda.
Licenciamento de nacionais
Registration
Licenciamento de importados
Registration of imported vehicles
Unidades / Units
Unidades / Units
Licenciamento de nacionais e importados
Registration of nationally manufactured and imported vehicles
Unidades /
FONTE / SOURCE: RENAVAM/SENATRAN.
NOTA S:
1 Os dados anteriores a 2014 estão incluídos na Volkswagen.
2 Dados de produção não disponíveis.
NOTE:
1. Before 2014 the data are included in Volkswagen.
2. The data of production are not available
76 | Anuário da Indústria Automobilística Brasileira | Brazilian Automotive Industry Yearbook | 2024
ANO Year AUTOMÓVEIS Cars TOTAL Total 2015 503 503 2016 6 216 6 . 216 2017 6 588 6 588 2018 4 942 4 .942 2019 4 313 4 . 313 2020 1.935 1.935 2021 129 129 2022 664 664 2023 1.256 1.256 ANO Year AUTOMÓVEIS Cars TOTAL Total 2014 12.489 12.489 2015 17.038 17.038 2016 5.384 5.384 2017 3.325 3.325 2018 3.735 3.735 2019 4.398 4.398 2020 5.021 5.021 2021 6.131 6.131 2022 4.823 4.823 2023 5.283 5.283 ANO Year AUTOMÓVEIS Cars TOTAL Total 2014 12.489 12.489 2015 17.541 17.541 2016 11.600 11.600 2017 9.913 9.913 2018 8.677 8.677 2019 8.711 8.711 2020 6.956 6.956 2021 6.260 6.260 2022 5.487 5.487 2023 6.539 6.539
of nationally manufactured
vehicles
Units
BMW do Brasil Ltda.
Licenciamento de nacionais
Registration
Licenciamento de importados*
Registration of imported vehicles
Unidades / Units

Licenciamento de nacionais e importados*
Registration
and imported vehicles*
FONTE / SOURCE: ABEIFA, ANFAVEA, RENAVAM/SENATRAN.
NOTAS / N OTES:
1 Dados de produção e exportações não disponíveis. / 1. The data of production and exports are not avaliable.
2 Licenciamentos referem-se a BMW e MINI (Denatran). / 2. Registration refer to BMW and Mini (Denatran).
2024 | Anuário da Indústria Automobilística Brasileira | Brazilian Automotive Industry Yearbook | 77 2024 ANUÁRIO DA INDÚSTRIA AUTOMOBILÍSTICA BRASILEIRA Brazilian Automotive Industry Yearbook
ANO Year AUTOMÓVEIS Cars TOTAL Total 2014 518 518 2015 10.216 10.216 2016 8 666 8.666 2017 7 978 7.978 2018 8.563 8 . 563 2019 8.301 8.301 2020 8.818 8.818 2021 9.819 9. 819 2022 9.620 9.620 2023 9.153 9.153 ANO Year AUTOMÓVEIS Cars TOTAL Total 1992 364 364 1993 1.931 1.931 1994 3.503 3.503 1995 2.915 2.915 1996 3.412 3.412 1997 3.256 3.256 1998 2.284 2.284 1999 1.464 1.464 2000 1.411 1.411 2001 2.106 2.106 2002 1.512 1.512 2003 1.164 1.164 2004 1.316 1.316 2005 1.909 1.909 2006 2.093 2.093 2007 2.744 2.744 2008 3.083 3.083 2009 6.328 6.328 2010 10.170 10.170 2011 14.997 14.997 2012 10.821 10.821 2013 16.048 16.048 2014 17.024 17.024 2015 7.634 7.634 2016 4.630 4.630 2017 3.780 3.780 2018 4.538 4.538 2019 6.486 6.486 2020 4.894 4.894 2021 6.131 6 .131 2022 5.387 5.387 2023 7.542 7.542 ANO Year AUTOMÓVEIS Cars TOTAL Total 1992 364 364 1993 1.931 1.931 1994 3.503 3.503 1995 2.915 2.915 1996 3.412 3.412 1997 3.256 3.256 1998 2.284 2.284 1999 1.464 1.464 2000 1.411 1.411 2001 2.106 2.106 2002 1.512 1.512 2003 1.164 1.164 2004 1.316 1.316 2005 1.909 1.909 2006 2.093 2.093 2007 2.744 2.744 2008 3.083 3.083 2009 6.328 6.328 2010 10.170 10.170 2011 14.997 14.997 2012 10.821 10.821 2013 16.048 16.048 2014 17.542 17.542 2015 17.850 17.850 2016 13.296 13.296 2017 11.758 11.758 2018 13.101 13.101 2019 14.787 14.787 2020 13.712 13.712 2021 15.950 15.950 2022 15.007 15.007 2023 16.695 16.695
nationally manufactured vehicles
of
manufactured
of nationally
* Os dados anteriores a 2002 referem-se a vendas internas no atacado. * Before to 2002 the figures refer to domestic wholesales
Unidades / Units
Unidades
/ Units
e
CAOA Montadora de Veículos Ltda.
Licenciamento de nacionais

company
78 | Anuário da Indústria Automobilística Brasileira | Brazilian Automotive Industry Yearbook | 2024
2.14 Informações por empresa (unidades) / 2.14 Information per
(units)
Autoveículos: produção, vendas internas
exportações Vehicles: production, domestic sales and exports
ANO Year AUTOMÓVEIS Cars COMERCIAIS LEVES Light commercials TOTAL Total 2007 - 2.983 2.983 2008 - 11.268 11.268 2009 - 6.814 6.814 2010 14.496 10.281 24.777 2011 22.826 15.809 38.635 2012 20.839 4.729 25.568 2013 18.756 16.361 35.117 2014 35.508 50 35.558 2015 27.821 5.918 33.739 2016 15.340 3.805 19.145 2017 17.802 3.586 21.388 2018 11.476 3.316 14.792 2019 31.664 4.927 36.591 2020 23.669 3.987 27.656 2021 43.887 2.799 46.686 2022 32.997 301 33.298 2023 25.812 418 26.230 ANO Year AUTOMÓVEIS Cars COMERCIAIS LEVES Light commercials CAMINHÕES Trucks TOTAL Total 1992 856 - - 856 1993 2.943 - - 2.943 1994 4.133 - - 4.133 1995 4.958 1.327 - 6.285 1996 3.025 1.415 - 4.440 1997 2.459 1.153 - 3.612 1998 2.436 - - 2.436 1999 5.353 105 - 5.458 2000 4.081 4.254 - 8.335 2001 2 414 2.451 - 4.865 2002 700 1.388 - 2.088 2003 297 978 - 1.275 2004 371 634 - 1.005 2005 1 131 514 - 1.645 2006 4 321 1.170 - 5.491 2007 15 194 2.786 1 17.981 2008 32.138 2.790 - 34.928 2009 62 382 3 302 - 65.684 2010 84 028 4 362 - 88.390 2011 89 053 34 - 89 087 2012 58 640 3 1 58 644 2013 30 569 3 - 30 572 2014 16 622 3 - 16 625 2015 10 484 6 - 10 490 2016 5 907 1 - 5 908 2017 4 398 3 - 4 401 2018 2 850 2 - 2.852 2019 1.075 4 - 1.079 2020 491 4 - 495 2021 474 - - 474 2022 3.630 2 1 3.633 2023 6.645 3 - 6.648 ANO Year AUTOMÓVEIS Cars COMERCIAIS LEVES Light commercials CAMINHÕES Trucks TOTAL Total 1992 856 - - 856 1993 2.943 - - 2.943 1994 4.133 - - 4.133 1995 4.958 1.327 - 6.285 1996 3.025 1.415 - 4.440 1997 2.459 1.153 - 3.612 1998 2.436 - - 2.436 1999 5.353 105 - 5.458 2000 4.081 4.254 - 8.335 2001 2.414 2.451 - 4.865 2002 700 1.388 - 2.088 2003 297 978 - 1.275 2004 371 634 - 1.005 2005 1 131 514 - 1.645 2006 4.321 1.170 - 5.491 2007 15 194 4.246 1 19.441 2008 32 138 12.658 - 44.796 2009 62 382 10 879 - 73 . 261 2010 93 817 14 865 - 108 .682 2011 106 959 10 337 4 117 300 2012 79 588 8 066 133 87.787 2013 48 770 7 168 299 56 237 2014 49 855 8 697 695 59. 247 2015 36 431 6 201 893 43 . 525 2016 27 312 4 310 52 31 674 2017 19 679 4 043 12 23 .734 2018 25 181 4 312 70 29 563 2019 30.497 3.999 258 34.754 2020 25.418 4.153 226 29.797 2021 44.352 3.299 489 48.140 2022 38.268 648 245 39.161 2023 32.740 218 317 33.275 ANO Year AUTOMÓVEIS Cars COMERCIAIS LEVES Light commercials CAMINHÕES Trucks TOTAL Total 2007 - 1.460 - 1.460 2008 - 9.868 - 9.868 2009 - 7.577 - 7.577 2010 9.789 10.503 - 20.292 2011 17.906 10.303 4 28.213 2012 20.948 8.063 132 29.143 2013 18.201 7.165 299 25.665 2014 33.233 8.694 695 42.622 2015 25.947 6.195 893 3 3 035 2016 21.405 4.309 52 25.766 2017 15.281 4.040 12 19 333 2018 22.331 4.310 70 26 .711 2019 29.422 3.995 258 33.675 2020 24.927 4.149 226 29.302 2021 43.878 3.299 489 47.666 2022 34.638 646 244 35.528 2023 26.095 215 317 26.627 Produção Production
Registration of imported vehicles*
Licenciamento de importados*
Registration of nationally manufactured and imported vehicles*
Licenciamento de nacionais e importados*
Registration of nationally manufactured vehicles * Os dados anteriores a 2002 referem-se a vendas internas no atacado. / * Before 2002 the figures refer to domestic wholesales FONTE / SOURCE: ABEIFA, ANFAVEA, RENAVAM/SENATRAN. NOTA S / NOTES: 1 Dados de licenciamentos até 2017 referem-se a Hyundai e Subaru. A partir de 2018, referem-se a Chery, Hyundai e Subaru. 2 Na produção estão incluídos os dados da Chery a partir de 2019. 1. Licensing data up to 2017 refer to Hyundai and Subaru. As of 2018, they refer to Chery, Hyundai and Subaru. 2. Chery data from 2019 is included in production. Unidades / Units Unidades / Units Unidades / Units Unidades / Units
DAF Caminhões Brasil Indústria Ltda.

Licenciamento de importados
Licenciamento de nacionais e importados Registration
2024 | Anuário da Indústria Automobilística Brasileira | Brazilian Automotive Industry Yearbook | 79
ANUÁRIO DA INDÚSTRIA AUTOMOBILÍSTICA BRASILEIRA Brazilian Automotive Industry Yearbook
2024
ANO Year CAMINHÕES Trucks TOTAL Total 2012 3 3 2013 29 29 2014 17 17 2015 -2016 1 1 2017 1 1 2018 1 1 2019 21 21 2020 -2021 -2022 -2023 -ANO Year CAMINHÕES Trucks TOTAL Total 2012 3 3 2013 29 29 2014 257 257 2015 443 443 2016 673 673 2017 1.048 1.048 2018 2.344 2.344 2019 3.247 3.247 2020 3.831 3.831 2021 5.600 5.600 2022 6.793 6.793 2023 8.344 8.344 ANO Year CAMINHÕES Trucks TOTAL Total 2012 -2013 -2014 240 240 2015 443 443 2016 672 672 2017 1.047 1.047 2018 2.343 2.343 2019 3.226 3.226 2020 3.831 3.831 2021 5.600 5.600 2022 6.793 6.793 2023 8.344 8 344 Licenciamento de nacionais Registration of nationally manufactured vehicles
Registration of imported vehicles
of nationally manufactured and imported vehicles Unidades / Units Unidades / Units Unidades / Units FONTE / SOURCE: RENAVAM/SENATRAN
Autoveículos: produção, vendas internas e exportações
Vehicles: production, domestic sales and exports
2.14 Informações por empresa (unidades) / 2.14 Information per company (units)
FCA Fiat Chrysler Automóveis do Brasil Ltda.
80 | Anuário da Indústria Automobilística Brasileira | Brazilian Automotive Industry Yearbook | 2024
ANO Year AUTOMÓVEIS Cars COMERCIAIS LEVES Light commercials TOTAL Total 1976 8.350 - 8.350 1977 65.052 - 65.052 1978 95.695 1.607 97.302 1979 120.004 9.317 129.321 1980 145.199 15.018 160.217 1981 103.672 26.709 130.381 1982 130.238 33.211 163.449 1983 115.185 31.028 146.213 1984 99.843 38.364 138.207 1985 114.370 36.611 150.981 1986 130.811 36.578 167.389 1987 169.760 43.887 213.647 1988 150.844 62.805 213.649 1989 149.669 68.160 217.829 1990 162.577 61.091 223.668 1991 192.140 63.416 255.556 1992 244.652 65.620 310.272 1993 337.445 56.146 393.591 1994 426.848 73.890 500.738 1995 396.517 67.152 463.669 1996 477.775 61.883 539.658 1997 551.051 68.115 619.166 1998 360.937 53.137 414.074 1999 345.575 54.228 399.803 2000 362.419 71.274 433.693 2001 384.694 51.524 436.218 2002 338.945 47.215 386.160 2003 309.520 48.451 357.971 2004 370.252 66.353 436.605 2005 423.663 79.442 503.105 2006 480.552 81.979 562.531 2007 610.323 107.513 717.836 2008 603.089 119.361 722.450 2009 603.108 133.512 736.620 2010 576.307 181.111 757.418 2011 576.029 186.152 762.181 2012 648.520 171.521 820.041 2013 571.935 184.782 756.717 2014 461.384 214.012 675.396 2015 339.147 146.141 485.288 2016 241.485 134.777 376.262 2017 346.703 147.478 494.181 2018 332.932 164.236 497.168 2019 344.581 178.235 522.816 2020 267.879 164.506 432.385 2021 386.057 215.748 601.805 2022 382.227 206.786 589.013 2023 400.376 218.703 619.079 ANO Year AUTOMÓVEIS Cars COMERCIAIS LEVES Light commercials CAMINHÕES Trucks TOTAL Total 1976 3.067 - - 3.067 1977 63.468 - - 63.468 1978 91.689 1.393 - 93.082 1979 103.321 8.496 - 111.817 1980 107.484 13.186 - 120.670 1981 47.004 8.211 - 55.215 1982 58.447 7.164 - 65.611 1983 64.153 6.574 - 70.727 1984 55.080 7.878 - 62.958 1985 78.263 11.107 - 89.370 1986 87.002 15.400 - 102.402 1987 62.842 12.936 - 75.778 1988 62.968 12.675 - 75.643 1989 67.102 13.557 - 80.659 1990 89.003 15.014 - 104.017 1991 128.318 19.376 - 147.694 1992 128.648 16.828 - 145.476 1993 201.016 23.484 - 224.500 1994 275.465 33.084 - 308.549 1995 300.441 28.867 - 329.308 1996 407.275 31.657 - 438.932 1997 454.490 36.645 - 491.135 1998 289.983 19.853 - 309.836 1999 272.653 24.073 - 296.726 2000 316.024 37.728 55 353.807 2001 347.357 41.525 451 389.333 2002 317.655 39.413 315 357.383 2003 300.613 39.961 293 340.867 2004 304.568 44.155 358 349.081 2005 344.901 59.487 391 404.779 2006 404.079 61.456 8 465.543 2007 523.043 84.524 5 607.572 2008 541.808 100.535 - 642.343 2009 559.541 118.041 - 677.582 2010 534.907 149.398 1 684.306 2011 507.550 155.293 - 662.843 2012 608.347 147.624 1 755.972 2013 522.756 154.749 - 677.505 2014 442.728 193.114 - 635.842 2015 312.579 123.055 - 435.634 2016 225.798 114.874 - 340.672 2017 253.265 118.981 1 372.247 2018 260.357 139.563 - 399.920 2019 306.301 159.302 1 465.604 2020 259.531 152.266 - 411.797 2021 347.076 201.591 - 548.667 2022 338.261 184.175 1 522.437 2023 352.460 202.450 1 554.911
Production Licenciamento de nacionais* Registration of nationally manufactured vehicles* FONTES / SOURCES: ABEIFA, ANFAVEA, RENAVAM/SENATRAN NOTA / N OTE:: Em vendas internas/licenciamento, inclui Alfa Romeo a partir de 1990. A partir de 2014, inclui as marcas Chrysler, Jeep e Dodge. / In-house sales/licensing, includes Alfa Romeo from 1990 As of 2014, it includes the Chrysler, Jeep and Dodge brands. * Os dados anteriores a 2002 referem-se a vendas internas no atacado. / * Before 2002 the figures refer to domestic wholesales. Unidades / Units Unidades / Units
Produção
FCA Fiat Chrysler Automóveis do Brasil Ltda.
Licenciamento de importados*
Registration of imported vehicles*
Licenciamento de nacionais e importados*
Registration of nationally manufactured and imported vehicles*
FONTES / SOURCES: ABEIFA, ANFAVEA, RENAVAM/SENATRAN
NOTA / N OTE: : Em vendas internas/licenciamento, inclui Alfa Romeo a partir de 1990. A partir de 2014, inclui as marcas Chrysler, Jeep e Dodge. / In-house sales/licensing, includes Alfa Romeo from 1990 As of 2014, it includes the Chrysler, Jeep and Dodge brands
* Os dados anteriores a 2002 referem-se a vendas internas no atacado.
* Before 2002 the figures refer to domestic wholesales.
2024 | Anuário da Indústria Automobilística Brasileira | Brazilian Automotive Industry Yearbook | 81 2024 ANUÁRIO DA INDÚSTRIA AUTOMOBILÍSTICA BRASILEIRA Brazilian Automotive Industry Yearbook
ANO Year AUTOMÓVEIS Cars COMERCIAIS LEVES Light commercials CAMINHÕES Trucks TOTAL Total 1990 8 - - 8 1991 865 - - 865 1992 4.766 - - 4.766 1993 19.239 - - 19.239 1994 80.685 - - 80.685 1995 89.870 - - 89.870 1996 8.833 - - 8.833 1997 17.514 238 - 17.752 1998 53.563 1.015 - 54.578 1999 6.173 1.336 218 7.727 2000 6.749 1.191 502 8.442 2001 26.335 189 14 26.538 2002 676 4 1 681 2003 103 4 1 108 2004 101 1 1 103 2005 23 1 - 24 2006 18 - - 18 2007 22 1 1 24 2008 15.428 2 - 15.430 2009 59.387 - 4 59.391 2010 76.189 - - 76.189 2011 91.433 - - 91.433 2012 82.247 - - 82.247 2013 85.475 - - 85.475 2014 69.395 9 279 69.683 2015 47.496 6 80 47.582 2016 24.188 7 459 24.654 2017 7.808 5 332 8.145 2018 30.354 2.836 677 33.867 2019 24.997 5.480 653 31.130 2020 16.634 3.694 1.476 21.804 2021 28.328 3.445 2.231 34.004 2022 42.442 4.812 3.264 50.518 2023 51.579 8.300 4.852 64.731 ANO Year AUTOMÓVEIS Cars COMERCIAIS LEVES Light commercials CAMINHÕES Trucks TOTAL Total 1976 3.067 - - 3.067 1977 63.468 - - 63.468 1978 91.689 1.393 - 93.082 1979 103.321 8.496 - 111.817 1980 107.484 13.186 - 120.670 1981 47.004 8.211 - 55.215 1982 58.447 7.164 - 65.611 1983 64.153 6.574 - 70.727 1984 55.080 7.878 - 62.958 1985 78.263 11.107 - 89.370 1986 87.002 15.400 - 102.402 1987 62.842 12.936 - 75.778 1988 62.968 12.675 - 75.643 1989 67.102 13.557 - 80.659 1990 89.011 15.014 - 104.025 1991 129.183 19.376 - 148.559 1992 133.414 16.828 - 150.242 1993 220.255 23.484 - 243.739 1994 356.150 33.084 - 389.234 1995 390.311 28.867 - 419.178 1996 416.108 31.657 - 447.765 1997 472.004 36.883 - 508.887 1998 343.546 20.868 - 364.414 1999 278.826 25.409 218 304.453 2000 322.773 38.919 557 362.249 2001 373.692 41.714 465 415.871 2002 318.331 39.417 316 358.064 2003 300.716 39.965 294 340.975 2004 304.669 44.156 359 349.184 2005 344.924 59.488 391 404.803 2006 404.097 61.456 8 465.561 2007 523.065 84.525 6 607.596 2008 557.236 100.537 - 657.773 2009 618.928 118.041 4 736.973 2010 611.096 149.398 1 760.495 2011 598.983 155.293 - 754.276 2012 690.594 147.624 1 838.219 2013 608.231 154.749 - 762.980 2014 512.123 193.123 279 705.525 2015 360.075 123.061 80 483.216 2016 249.986 114.881 459 365.326 2017 261.073 118.986 333 380.392 2018 290.711 142.399 677 433.787 2019 331.298 164.782 654 496.734 2020 276.165 155.960 1.476 433.601 2021 375.404 205.036 2.231 582.671 2022 380.703 188.987 3.265 572.955 2023 404.039 210.750 4.853 619.642
Unidades / Units
Unidades / Units
Autoveículos: produção, vendas internas e exportações
Vehicles: production, domestic sales
and exports
2.14 Informações por empresa (unidades) / 2.14 Information per company (units)
FCA Fiat Chrysler Automóveis do Brasil Ltda.
Exportações Exports
82 | Anuário da Indústria Automobilística Brasileira | Brazilian Automotive Industry Yearbook | 2024
ANO Year AUTOMÓVEIS Cars COMERCIAIS LEVES Light commercials TOTAL Total 1977 1.346 - 1.346 1978 7.071 60 7.131 1979 13.375 109 13.484 1980 38.256 2.056 40.312 1981 59.382 11.797 71.179 1982 71.928 31.749 103.677 1983 47.810 24.300 72.110 1984 46.811 31.197 78.008 1985 39.284 25.741 65.025 1986 43.105 21.136 64.241 1987 107.520 30.539 138.059 1988 87.936 50.280 138.216 1989 82.842 54.988 137.830 1990 71.369 44.949 116.318 1991 65.815 44.229 110.044 1992 116.074 49.727 165.801 1993 135.944 32.473 168.417 1994 151.173 40.386 191.559 1995 95.724 38.034 133.758 1996 70.570 30.316 100.886 1997 91.605 31.290 122.895 1998 75.123 32.070 107.193 1999 71 313 31 504 102.817 2000 47 300 33.230 80.530 2001 36.705 9 812 46.517 2002 20.897 8.317 29.214 2003 29 214 11.018 40.232 2004 57 654 18 050 75.704 2005 77 299 21 678 98.977 2006 76 442 19 474 95.916 2007 80 825 21 813 102.638 2008 60 854 17 367 78.221 2009 30 158 15 060 45.218 2010 42 630 23 924 66.554 2011 57 665 29 513 87.178 2012 32 382 22 777 55.159 2013 48 669 27 051 75.720 2014 24 742 18 774 43.516 2015 29 014 31 461 60.475 2016 46 826 17 798 64.624 2017 86 078 35 139 121.217 2018 62 660 21 625 84.285 2019 29 909 14 279 44.188 2020 20.403 13.589 33.992 2021 23.573 14.232 37.805 2022 36.038 13.177 49.215 2023 45.002 12.369 57.371
/ Units FONTE / SOURCE: ANFAVEA.
Unidades
Ford Motor Company Brasil Ltda.
Licenciamento de nacionais*
2024 | Anuário da Indústria Automobilística Brasileira | Brazilian Automotive Industry Yearbook | 83 2024 ANUÁRIO DA INDÚSTRIA AUTOMOBILÍSTICA BRASILEIRA Brazilian Automotive Industry Yearbook
Produção Production
nationally
ANO Year AUTOMÓVEIS Cars COMERCIAIS LEVES Light commercials TOTAL Total 1957 - 1.217 1.217 1958 - 3.231 3.231 1959 - 4.755 4.755 1960 - 5.388 5.388 1961 - 3.877 3.877 1962 - 6.506 6.506 1963 - 4.541 4.541 1964 - 3.754 3.754 1965 - 3.303 3.303 1966 - 2.603 2.603 1967 9.237 1.816 11.053 1968 11.806 4.240 16.046 1969 49.621 2.656 52.277 1970 43.920 1.848 45.768 1971 57.482 3.160 60.642 1972 92.433 15.895 108.328 1973 115.079 20.166 135.245 1974 134.532 26.236 160.768 1975 128.409 27.471 155.880 1976 134.735 21.577 156.312 1977 98.602 11.699 110.301 1978 128.152 10.471 138.623 1979 136.050 12.389 148.439 1980 127.106 13.459 140.565 1981 101.126 9.119 110.245 1982 113.819 19.915 133.734 1983 135.200 22.457 157.657 1984 141.902 27.225 169.127 1985 146.425 28.830 175.255 1986 138.773 31.190 169.963 1987 89.672 25.339 115.011 1988 124.683 33.185 157.868 1989 120.277 40.459 160.736 1990 99.055 36.384 135.439 1991 107.529 33.994 141.523 1992 107.556 39.124 146.680 1993 145.585 58.018 203.603 1994 155.386 54.584 209.970 1995 117.977 26.855 144.832 1996 99.574 37.747 137.321 1997 168.553 44.723 213.276 1998 131.837 39.327 171.164 1999 78.315 20.082 98.397 2000 80.964 26.902 107.866 2001 79.252 26.688 105.940 2002 122.956 21.807 144.763 2003 187.621 16.113 203.734 2004 236.224 20.259 256.483 2005 279.996 22.016 302.012 2006 277.492 21.363 298.855 2007 265.114 21.003 286.117 2008 276.723 18.071 294.794 2009 306.709 15.517 322.226 2010 302.982 15.387 318.369 2011 272.059 14.298 286.357 2012 279.144 7.181 286.325 2013 331.032 2.092 333.124 2014 246.397 - 246.397 2015 227.749 - 227.749 2016 209.570 - 209.570 2017 248.061 - 248.061 2018 267.758 - 267.758 2019 227.214 - 227.214 2020 126.254 - 126.254 2021 3.203 - 3.203 2022 - -2023 - -ANO Year AUTOMÓVEIS Cars COMERCIAIS LEVES Light commercials CAMINHÕES Trucks ÔNIBUS Buses TOTAL Total 1957 - 1.162 5.232 - 6.394 1958 - 3.308 7.755 - 11.063 1959 - 4.852 12.629 - 17.481 1960 - 5.371 13.674 - 19.045 1961 - 3.884 10.164 - 14.048 1962 - 6.473 15.148 - 21.621 1963 - 4.540 8.279 - 12.819 1964 - 3.571 8.271 - 11.842 1965 - 3.267 8.638 - 11.905 1966 - 2.545 11.202 - 13.747 1967 8.773 1.929 9.180 - 19.882 1968 11.682 4.255 14.138 - 30.075 1969 48.808 2.776 10.758 - 62.342 1970 43.691 1.737 8.128 - 53.556 1971 58.183 2.837 7.857 - 68.877 1972 92.566 16.467 10.933 - 119.966 1973 112.227 20.543 12.780 - 145.550 1974 136.849 25.992 14.985 - 177.826 1975 129.295 27.766 14.565 - 171.626 1976 133.036 21.260 15.372 - 169.668 1977 99.840 11.249 18.451 - 129.540 1978 127.175 11.046 19.306 - 157.527 1979 133.390 12.419 21.372 - 167.181 1980 123.143 13.206 23.467 - 159.816 1981 86.932 8.788 13.917 - 109.637 1982 99.201 19.775 9.979 97 129.052 1983 120.922 22.210 7.844 33 151.009 1984 109.004 27.132 10.392 19 146.547 1985 124.031 28.813 11.689 23 164.556 1986 131.864 30.827 15.385 - 178.076 1987 84.909 24.644 11.422 - 120.975 1988 113.695 32.526 12.292 - 158.513 1989 112.717 39.661 10.118 - 162.496 1990 88.669 35.860 9.710 - 134.239 1991 88.931 34.017 9.012 - 131.960 1992 70.094 28.965 5.010 7 104.076 1993 116.011 37.929 5.656 477 160.073 1994 118.079 30.087 6.621 715 155.502 1995 114.196 25.762 10.215 1.508 151.681 1996 85.000 29.414 7.536 725 122.675 1997 143.437 33.080 11.334 541 188.392 1998 101.359 26.604 10.723 275 138.961 1999 60.082 17.090 10.476 1 87.649 2000 66.150 19.828 12.082 - 98.060 2001 57.752 13.942 13.114 - 84.808 2002 78.001 11.289 13.622 - 102.912 2003 116.192 8.524 13.301 1 138.018 2004 134.605 9.999 15.872 - 160.476 2005 162.433 9.271 15.155 1 186.860 2006 160.143 11.165 14.531 - 185.839 2007 188.913 12.367 19.049 - 220.329 2008 205.843 10.658 20.760 - 237.261 2009 242.533 10.779 19.773 - 273.085 2010 258.402 9.582 27.672 1 295.657 2011 220.590 10.215 30.345 - 261.150 2012 224.718 7.527 21.780 - 254.025 2013 255.737 3.056 20.406 - 279.199 2014 224.086 10 19.596 - 243.692 2015 198.303 7 12.922 - 211.232 2016 146.501 4 7.753 - 154.258 2017 172.830 13 7.810 - 180.653 2018 191.396 17 9.310 - 200.723 2019 193.224 32 6.452 - 199.708 2020 117.346 18 577 - 117.941 2021 13.409 20 128 - 13.557 2022 163 36 49 - 248 2023 143 46 30 - 219 FONTES / SOURCES: ABEIFA, ANFAVEA, RENAVAM/SENATRAN. * Os dados anteriores a 2002 referem-se a vendas internas no atacado. / * Before 2002 the figures refer to domestic wholesales.
Registration of
manufactured vehicles*
Unidades / Units
Autoveículos: produção, vendas internas e exportações
Vehicles: production, domestic sales and exports
2.14 Informações por empresa (unidades) / 2.14 Information per company (units)
Ford Motor Company Brasil Ltda.
Licenciamento de importados*
Registration of imported vehicles*
Licenciamento de nacionais e importados*

84 | Anuário da Indústria Automobilística Brasileira | Brazilian Automotive Industry Yearbook | 2024
Registration of nationally manufactured and imported vehicles* ANO Year AUTOMÓVEIS Cars COMERCIAIS LEVES Light commercials CAMINHÕES Trucks TOTAL Total 1991 3.005 - - 3.005 1992 4.256 - - 4.256 1993 544 3.005 434 3.983 1994 2.397 4.304 1.084 7.785 1995 40.071 8.260 745 49.076 1996 50.938 8.757 372 60.067 1997 77.060 12.804 - 89.864 1998 44.293 12.323 - 56.616 1999 18.750 11.098 - 29.848 2000 18.973 15.557 - 34.530 2001 24.044 13.991 - 38.035 2002 28.328 10.561 1 38.890 2003 20.492 5.995 1 26.488 2004 18.054 7.584 1 25.639 2005 17.076 8.542 2 25.620 2006 24.971 9.863 - 34.834 ANO Year AUTOMÓVEIS Cars COMERCIAIS LEVES Light commercials CAMINHÕES Trucks ÔNIBUS Buses TOTAL Total 1957 - 1.162 5.232 - 6.394 1958 - 3.308 7.755 - 11.063 1959 - 4.852 12.629 - 17.481 1960 - 5.371 13.674 - 19.045 1961 - 3.884 10.164 - 14.048 1962 - 6.473 15.148 - 21.621 1963 - 4.540 8.279 - 12.819 1964 - 3.571 8.271 - 11.842 1965 - 3.267 8.638 - 11.905 1966 - 2.545 11.202 - 13.747 1967 8.773 1.929 9.180 - 19.882 1968 11.682 4.255 14.138 - 30.075 1969 48.808 2.776 10.758 - 62.342 1970 43.691 1.737 8.128 - 53.556 1971 58.183 2.837 7.857 - 68.877 1972 92 566 16 467 10 933 - 119.966 1973 112 227 20 543 12 780 - 145 550 1974 136 849 25 992 14 985 - 177 826 1975 129 295 27 766 14 565 - 171 626 1976 133 036 21 260 15 372 - 169 668 1977 99 840 11 249 18 451 - 129. 540 1978 127 175 11 046 19 306 - 157. 527 1979 133 390 12 419 21 372 - 167.181 1980 123 143 13 206 23 467 - 159. 816 1981 86 932 8 788 13 917 - 109.637 1982 99 201 19 775 9 979 97 129.052 1983 120 922 22 210 7 844 33 151 009 1984 109 004 27 132 10 392 19 146 547 1985 124 031 28 813 11 689 23 164 556 1986 131 864 30 827 15 385 - 178 .076 1987 84 909 24 644 11 422 - 120.975 1988 113 695 32 526 12 292 - 158 . 513 1989 112.717 39.661 10.118 - 162.496 ANO Year AUTOMÓVEIS Cars COMERCIAIS LEVES Light commercials CAMINHÕES Trucks TOTAL Total 2007 33.234 12.683 1 45.918 2008 30.001 13.673 1 43.675 2009 37.349 13.409 2 50.760 2010 50.675 17.683 4 68.362 2011 64.046 19.205 7 83.258 2012 72.878 18.585 5 91.468 2013 51.900 24.386 3 76.289 2014 58.756 25.356 3 84.115 2015 38.447 16.934 1 55.382 2016 18.061 15.826 4 33.891 2017 16.117 17.855 - 33.972 2018 14.530 20.587 4 35.121 2019 3.115 22.239 6 25.360 2020 2.108 19.846 2 21.956 2021 3.865 20.601 5 24.471 2022 2.971 17.811 15 20.797 2023 3.051 25.661 26 28.738 ANO Year AUTOMÓVEIS Cars COMERCIAIS LEVES Light commercials CAMINHÕES Trucks ÔNIBUS Buses TOTAL Total 1990 88.669 35.860 9.710 - 134.239 1991 91.936 34.017 9.012 - 134.965 1992 74.350 28.965 5.010 7 108.332 1993 116.555 40.934 6.090 477 164.056 1994 120.476 34.391 7.705 715 163.287 1995 154.267 34.022 10.960 1.508 200.757 1996 135.938 38.171 7.908 725 182.742 1997 220.497 45.884 11.334 541 278.256 1998 145.652 38.927 10.723 275 195.577 1999 78.832 28.188 10.476 1 117.497 2000 85.123 35.385 12 082 - 132.590 2001 81 796 27 933 13 114 - 122.843 2002 106 329 21 850 13 623 - 141. 802 2003 136 684 14 519 13 302 1 164 . 506 2004 152 659 17 583 15 873 - 186 115 2005 179 509 17 813 15 157 1 212 . 480 2006 185 114 21 028 14 531 - 220 673 2007 222 147 25 050 19 050 - 266. 247 2008 235 844 24 331 20 761 - 280 936 2009 279 882 24 188 19 775 - 323 . 845 2010 309 077 27 265 27 676 1 364 019 2011 284 636 29 420 30 352 - 344 . 408 2012 297 596 26 112 21 785 - 345 493 2013 307 637 27 442 20 409 - 355. 488 2014 282 842 25 366 19 599 - 327 807 2015 236 750 16 941 12 923 - 266.614 2016 164.562 15 830 7 757 - 188 149 2017 188 947 17 868 7 810 - 214 .625 2018 205 926 20 604 9 314 - 235 844 2019 196.339 22.271 6.458 - 225.068 2020 119.454 19.864 579 - 139.897 2021 17.274 20.621 133 - 38.028 2022 3.134 17.847 64 - 21.045 2023 3.194 25.707 56 - 28.957 FONTES / SOURCES: ABEIFA, ANFAVEA, RENAVAM/SENATRAN * Os dados anteriores a 2002 referem-se a vendas internas no atacado. / * Before 2002 the figures refer to domestic wholesales.
Unidades / Units
Unidades / Units
Ford Motor Company Brasil Ltda.
Exportações / Exports
Unidades
2024 | Anuário da Indústria Automobilística Brasileira | Brazilian Automotive Industry Yearbook | 85
ANUÁRIO DA INDÚSTRIA AUTOMOBILÍSTICA BRASILEIRA Brazilian Automotive Industry Yearbook
2024
ANO Year AUTOMÓVEIS Cars COMERCIAIS LEVES Light commercials TOTAL Total 1970 1 - 1 1971 8 - 8 1972 96 9 105 1973 118 - 118 1974 28 - 28 1975 386 - 386 1976 23 13 36 1977 16 20 36 1978 1.200 11 1.211 1979 2.133 52 2.185 1980 4.121 100 4.221 1981 13.587 363 13.950 1982 15.260 131 15.391 1983 14.074 165 14.239 1984 32.406 237 32.643 1985 23.873 152 24.025 1986 6.574 250 6.824 1987 3.931 557 4.488 1988 11.068 645 11.713 1989 7.144 499 7.643 1990 10.351 162 10.513 1991 17.150 130 17.280 1992 39.061 10.655 49.716 1993 29.744 20.006 49.750 1994 37.716 24.579 62.295 1995 3.729 1.136 4.865 1996 14.215 8.003 22.218 1997 25.012 11.194 36.206 1998 27.641 10.645 38.286 1999 19.187 4.200 23.387 2000 15.294 7.928 23.222 2001 22.132 11.944 34.076 2002 41.436 11.278 52.714 2003 73.226 8.766 81.992 2004 97.144 10.749 107.893 2005 119.191 11.571 130.762 2006 113.395 10.080 123.475 2007 89.709 8.434 98.143 2008 71.824 6.572 78.396 2009 49.108 4.535 53.643 2010 61.849 5.070 66.919 2011 57.383 3.911 61.294 2012 53.555 19 53.574 2013 69.574 - 69.574 2014 43.526 - 43.526 2015 50.310 - 50.310 2016 61.466 - 61.466 2017 79.604 - 79.604 2018 65.296 - 65.296 2019 36.990 - 36.990 2020 16.582 - 16.582 2021 2.623 - 2.623 2022-2023- -
/ Units FONTE / SOURCE: ANFAVEA
Autoveículos: produção, vendas internas e exportações
Vehicles: production, domestic sales and exports
2.14 Informações por empresa (unidades) / 2.14 Information per company (units)
General Motors do Brasil Ltda.
Produção Production
Licenciamento de nacionais*
Registration of nationally manufactured vehicles
86 | Anuário da Indústria Automobilística Brasileira | Brazilian Automotive Industry Yearbook | 2024
ANO Year AUTOMÓVEIS Cars COMERCIAIS LEVES Light commercials TOTAL Total 1958 - 1.453 1.453 1959 8 3.145 3.153 1960 355 3.883 4.238 1961 532 3.547 4.079 1962 968 5.508 6.476 1963 763 4.298 5.061 1964 501 6.123 6.624 1965 1.253 3.077 4.330 1966 1.328 5.012 6.340 1967 2.066 6.037 8.103 1968 3.850 7.404 11.254 1969 30.209 10.534 40.743 1970 46.466 13.207 59.673 1971 57.774 15.477 73.251 1972 70.872 20.416 91.288 1973 93.850 28.212 122.062 1974 133.268 28.939 162.207 1975 134.057 25.404 159.461 1976 143.461 24.453 167.914 1977 118.547 12.141 130.688 1978 163.739 19.560 183.299 1979 168.217 27.793 196.010 1980 186.977 30.231 217.208 1981 126.543 20.968 147.511 1982 159.548 17.185 176.733 1983 187.267 18.105 205.372 1984 171.339 22.944 194.283 1985 190.767 26.436 217.203 1986 211.969 32.215 244.184 1987 153.770 34.275 188.045 1988 192.854 45.226 238.080 1989 191.103 43.092 234.195 1990 164.198 35.481 199.679 1991 162.012 31.064 193.076 1992 173.333 38.273 211.606 1993 236.900 35.714 272.614 1994 250.680 36.152 286.832 1995 292.012 50.224 342.236 1996 377.298 65.517 442.815 1997 427.037 78.063 505.100 1998 355.540 56.764 412.304 1999 294.784 39.181 333.965 2000 379.930 58.962 438.892 2001 452.234 57.177 509.411 2002 470.000 47.167 517.167 2003 464.492 47.025 511.517 2004 488.983 73.029 562.012 2005 476.082 85.367 561.449 2006 464.653 85.532 550.185 2007 472.683 104.269 576.952 2008 492.211 111.608 603.819 2009 493.258 105.515 598.773 2010 532.940 118.111 651.051 2011 520.412 130.434 650.846 2012 480.059 135.491 615.550 2013 543.035 137.702 680.737 2014 462.428 119.643 582.071 2015 296.761 65.018 361.779 2016 272.295 62.152 334.447 2017 412.342 61.684 474.026 2018 400.416 66.029 466.445 2019 459.781 57.762 517.543 2020 315.747 36.170 351.917 2021 230.426 47.162 277.588 2022 366.154 46.212 412.366 2023 304.481 84.608 389.089 ANO Year AUTOMÓVEIS Cars COMERCIAIS LEVES Light commercials CAMINHÕES Trucks ÔNIBUS Buses TOTAL Total 1957 - - 4.725 - 4.725 1958 - 1.430 7.893 - 9.323 1959 - 3.141 13.741 329 17.211 1960 362 3.852 13.398 527 18.139 1961 527 3.494 9.383 200 13.604 1962 962 5.500 12.397 156 19.015 1963 752 4.229 6.932 106 12.019 1964 238 5.921 7.011 66 13.236 1965 1.114 3.623 6.861 26 11.624 1966 1.365 4.984 9.550 24 15.923 1967 2.022 6.019 9.023 23 17.087 1968 3.753 7.386 13.748 7 24.894 1969 29.744 10.465 11.795 7 52.011 1970 46.248 13.169 10.635 25 70.077 1971 57.146 15.158 9.727 32 82.063 1972 68.755 20.446 12.907 17 102.125 1973 95.746 28.101 18.346 100 142.293 1974 131.996 28.780 19.409 105 180.290 1975 132.922 24.429 13.270 153 170.774 1976 141.175 23.024 13.724 14 177.937 1977 115.714 13.450 22.989 47 152.200 1978 154.332 19.330 11.503 61 185.226 1979 154.513 26.946 11.257 12 192.728 1980 170.404 29.240 12.638 7 212.289 1981 107.463 20.506 6.419 8 134.396 1982 149.548 16.515 3.291 1 169.355 1983 170.112 17.212 2.237 - 189.561 1984 146.025 22.621 2.975 17 171.638 1985 163.824 21.771 5.542 - 191.137 1986 174.696 25.297 6.826 - 206.819 1987 118.078 26.415 4.441 - 148.934 1988 161.124 30.319 3.829 - 195.272 1989 173.393 34.841 3.423 - 211.657 1990 140.170 27.443 2.803 - 170.416 1991 143.496 26.398 2.447 - 172.341 1992 148.252 26.608 1.049 - 175.909 1993 217.715 35.059 1.913 - 254.687 1994 233.644 31.793 1.852 - 267.289 1995 266.786 37.088 1.425 - 305.299 1996 326.300 43.476 334 - 370.110 1997 348.478 41.763 1.523 - 391.764 1998 279.905 29.766 2.220 - 311.891 1999 233.783 23.678 1.714 - 259.175 2000 283.442 36.027 2.937 - 322.406 2001 305.079 36.884 3.923 - 345.886 2002 307.203 21.615 938 - 329.756 2003 305.151 18.319 24 - 323.494 2004 326.850 35.668 12 - 362.530 2005 325.791 31.752 7 - 357.550 2006 365.369 33.677 6 - 399.052 2007 394.881 45.181 7 - 440.069 2008 417.505 64.221 4 - 481.730 2009 459.111 73.396 1 - 532.508 2010 494.400 79.903 2 - 574.305 2011 453.575 88.669 - - 542.244 2012 460.252 96.205 2 - 556.459 2013 467.565 100.968 - - 568.533 2014 411.935 86.557 - - 498.492 2015 287.033 56.991 1 - 344.025 2016 274.746 41.313 - - 316.059 2017 308.705 45.320 1 - 354.026 2018 332.779 44.882 1 - 377.662 2019 386.678 44.708 2 - 431.388 2020 283.434 33.304 - - 316.738 2021 195.465 37.255 - - 232.720 2022 247.256 27.159 - - 274.415 2023 250.684 56.015 - - 306.699 FONTES / SOURCES: ABEIFA, ANFAVEA, RENAVAM/SENATRAN * Os dados anteriores a 2002 referem-se a vendas internas no atacado * Before 2002 the figures refer to domestic wholesales
Unidades /
Units
Unidades /
Units
General Motors do Brasil Ltda.
Licenciamento de importados* / Registration of imported vehicles*
Licenciamento de nacionais e importados*
Registration
2024 | Anuário da Indústria Automobilística Brasileira | Brazilian Automotive Industry Yearbook | 87
ANUÁRIO DA INDÚSTRIA AUTOMOBILÍSTICA BRASILEIRA Brazilian Automotive Industry Yearbook
2024
of nationally manufactured and imported vehicles* ANO Year AUTOMÓVEIS Cars COMERCIAIS LEVES Light commercials CAMINHÕES Trucks TOTAL Total 1991 79 218 - 297 1992 41 417 - 458 1993 152 379 - 531 1994 474 1.560 - 2.034 1995 31.256 11.798 - 43.054 1996 70 12.644 707 13.421 1997 2 15.922 1.944 17.868 1998 18.244 12.912 1.155 32.311 1999 14.161 4.174 400 18.735 2000 10.308 82 187 10.577 2001 7.912 19 47 7.978 2002 9.656 10 1 9.667 2003 9.932 21 - 9.953 2004 1.658 39 1 1.698 2005 7.692 21 - 7.713 2006 10.899 8 - 10.907 2007 58.612 11 - 58.623 ANO Year AUTOMÓVEIS Cars COMERCIAIS LEVES Light commercials CAMINHÕES Trucks ÔNIBUS Buses TOTAL Total 1957 - - 4.725 - 4.725 1958 - 1.430 7.893 - 9.323 1959 - 3.141 13.741 329 17.211 1960 362 3.852 13.398 527 18.139 1961 527 3.494 9.383 200 13.604 1962 962 5.500 12.397 156 19.015 1963 752 4.229 6.932 106 12.019 1964 238 5.921 7.011 66 13.236 1965 1.114 3.623 6.861 26 11.624 1966 1.365 4.984 9.550 24 15.923 1967 2.022 6.019 9.023 23 17.087 1968 3.753 7.386 13.748 7 24.894 1969 29.744 10.465 11.795 7 52.011 1970 46.248 13.169 10.635 25 70.077 1971 57.146 15.158 9.727 32 82.063 1972 68.755 20 446 12 907 17 102 .125 1973 95.746 28 101 18 346 100 142.293 1974 131.996 28 780 19 409 105 180. 290 1975 132.922 24.429 13 270 153 170 774 1976 141.175 23 024 13 724 14 177.937 1977 115.714 13 450 22 989 47 152.200 1978 154.332 19 330 11 503 61 185 226 1979 154.513 26 946 11 257 12 192 .728 1980 170.404 29 240 12.638 7 212.289 1981 107.463 20.506 6 419 8 134 396 1982 149.548 16 515 3 291 1 169. 355 1983 170.112 17 212 2 237 - 189. 561 1984 146.025 22 621 2 975 17 171.638 1985 163.824 21 771 5.542 - 191.137 1986 174.696 25 297 6 826 - 206 819 1987 118.078 26.415 4 441 - 148 934 1988 161.124 30 319 3 829 - 195.272 1989 173.393 34.841 3.423 - 211.657 1990 140.170 27.443 2.803 - 170.416 ANO Year AUTOMÓVEIS Cars COMERCIAIS LEVES Light commercials CAMINHÕES Trucks TOTAL Total 2008 67.183 16 - 67.199 2009 63.007 23 1 63.031 2010 83.379 40 1 83.420 2011 90.012 23 - 90.035 2012 86.162 29 2 86.193 2013 81.261 33 - 81.294 2014 80.370 14 1 80.385 2015 44.024 20 - 44.044 2016 29.814 9 - 29.823 2017 40.125 5 1 40.131 2018 56.744 17 3 56.764 2019 44.345 16 7 44.368 2020 21.851 16 - 21.867 2021 9.455 23 - 9.478 2022 17.044 34 - 17.078 2023 21.105 341 - 21.446 ANO Year AUTOMÓVEIS Cars COMERCIAIS LEVES Light commercials CAMINHÕES Trucks ÔNIBUS Buses TOTAL Total 1991 143.575 26.616 2.447 - 172.638 1992 148.293 27.025 1.049 - 176.367 1993 217.867 35.438 1.913 - 255.218 1994 234.118 33.353 1.852 - 269.323 1995 298.042 48.886 1.425 - 348.353 1996 326.370 56.120 1.041 - 383.531 1997 348 480 57.685 3.467 - 409.632 1998 298.149 42.678 3.375 - 344.202 1999 247.944 27.852 2.114 - 277.910 2000 293.750 36.109 3.124 - 332.983 2001 312.991 36 903 3 970 - 353.864 2002 316 859 21.625 939 - 339.423 2003 315 083 18 340 24 - 333 447 2004 328 508 35 707 13 - 364.228 2005 333 483 31.773 7 - 365. 263 2006 376 268 33.685 6 - 409.959 2007 453 493 45.192 7 - 498 692 2008 484.688 64.237 4 - 548 .929 2009 522 118 73.419 2 - 595. 539 2010 577 779 79.943 3 - 657 725 2011 543 587 88 692 - - 632 . 279 2012 546 414 96 234 4 - 642 .652 2013 548 826 101 001 - - 649.827 2014 492 305 86 571 1 - 578.877 2015 331 057 57 011 1 - 388.069 2016 304 560 41 322 - - 345. 882 2017 348.830 45.325 2 - 394 157 2018 389.523 44.899 4 - 434.426 2019 431.023 44.724 9 - 475.756 2020 305.285 33.320 - - 338.605 2021 204.920 37.278 - - 242.198 2022 264.300 27.193 - - 291.493 2023 271.789 56.356 - - 328.145 FONTES / SOURCES: ABEIFA, ANFAVEA, RENAVAM/SENATRAN * Os dados anteriores a 2002 referem-se a vendas internas no atacado. / * Before 2002 the figures refer to domestic wholesales
Units
Unidades
/
Units
Unidades
/
Autoveículos: produção, vendas internas e exportações
Vehicles: production, domestic sales and exports
2.14 Informações por empresa (unidades) / 2.14 Information per company (units)
General Motors do Brasil Ltda.
Exportações / Exports
88 | Anuário da Indústria Automobilística Brasileira | Brazilian Automotive Industry Yearbook | 2024
ANO Year AUTOMÓVEIS Cars COMERCIAIS LEVES Light commercials TOTAL Total 1969 3 - 3 1970 8 10 18 1971 88 60 148 1972 85 72 157 1973 171 286 457 1974 377 116 493 1975 872 505 1.377 1976 2.041 509 2.550 1977 3.583 264 3.847 1978 9.976 241 10.217 1979 13.823 1.015 14.838 1980 16.419 635 17.054 1981 19.343 863 20.206 1982 9.913 351 10.264 1983 14.406 480 14.886 1984 26.561 763 27.324 1985 28.540 4.916 33.456 1986 35.313 6.862 42.175 1987 37.132 7.248 44.380 1988 31.298 15.568 46.866 1989 17.850 8.122 25.972 1990 18.535 7.052 25.587 1991 21.376 4.669 26.045 1992 27.989 12.544 40.533 1993 19.040 1.212 20.252 1994 16.696 4.254 20.950 1995 25.033 13.548 38.581 1996 50.487 22.296 72.783 1997 75.219 35.741 110.960 1998 77.596 27.320 104.916 1999 61.291 14.959 76.250 2000 94.460 22.485 116.945 2001 147.864 19.677 167.541 2002 169.142 18.723 187.865 2003 183.647 24.764 208.411 2004 146.582 35.202 181.784 2005 154.321 54.572 208.893 2006 109.202 53.429 162.631 2007 75.830 55.677 131.507 2008 61.497 46.988 108.485 2009 24.330 26.229 50.559 2010 40.160 37.914 78.074 2011 53.924 43.551 97.475 2012 33.416 34.870 68.286 2013 67.793 36.707 104.500 2014 22.922 24.672 47.594 2015 37.461 34.670 72.131 2016 61.238 31.606 92.844 2017 109.509 24.818 134.327 2018 82.910 19.672 102.582 2019 61.884 9.579 71.463 2020 55.382 9.646 65.028 2021 47.196 11.177 58.373 2022 98.126 14.355 112.481 2023 49.086 22.781 71.867
FONTE / SOURCE: ANFAVEA
Unidades / Units
Honda Automóveis do Brasil Ltda.

2024 | Anuário da Indústria Automobilística Brasileira | Brazilian Automotive Industry Yearbook | 89 2024 ANUÁRIO DA INDÚSTRIA AUTOMOBILÍSTICA BRASILEIRA Brazilian Automotive Industry Yearbook
ANO Year AUTOMÓVEIS Cars TOTAL Total 1997 837 837 1998 15.775 15.775 1999 17.957 17.957 2000 20.568 20.568 2001 22.058 22.058 2002 20.564 20.564 2003 33.927 33.927 2004 56.544 56.544 2005 65 527 65. 527 2006 78 962 78 .962 2007 106 027 106.027 2008 131 139 131 139 2009 132 122 132 122 2010 131 455 131. 455 2011 85 545 85. 545 2012 135 058 135.058 2013 135 065 135 065 2014 127 232 127 232 2015 148 074 148 .074 2016 120 585 120. 585 2017 134 813 134 . 813 2018 137 983 137 983 2019 127 223 127. 223 2020 79.056 79.056 2021 88.025 88.025 2022 63.409 63 409 2023 79.381 79.381 ANO Year AUTOMÓVEIS Cars TOTAL Total 1992 741 741 1993 4.157 4.157 1994 6.822 6.822 1995 4.851 4.851 1996 2.076 2.076 1997 2.048 2.048 1998 848 848 1999 401 401 2000 637 637 2001 485 485 2002 311 311 2003 234 234 2004 460 460 2005 1.513 1.513 2006 2.914 2.914 2007 3.572 3.572 ANO Year AUTOMÓVEIS Cars TOTAL Total 2008 9.391 9.391 2009 12.382 12.382 2010 19.128 19.128 2011 16.538 16.538 2012 18.230 18.230 2013 18.511 18.511 2014 12.730 12.730 2015 7.681 7.681 2016 5.441 5.441 2017 2.451 2.451 2018 1.758 1.758 2019 4.379 4.379 2020 1.001 1.001 2021 494 494 2022 108 108 2023 1.337 1.337 ANO Year AUTOMÓVEIS Cars TOTAL Total 1997 872 872 1998 15.575 15.575 1999 17.102 17.102 2000 19.685 19.685 2001 21.375 21.375 2002 20.592 20.592 2003 31.915 31.915 2004 50.234 50.234 2005 55.526 55.526 2006 64.415 64 . 415 2007 82 176 82 .176 2008 108 208 108 208 2009 113.487 113 487 2010 107 311 107.311 2011 76 363 76 . 363 2012 116.726 116 .726 2013 120 768 120 768 2014 125 175 125 175 2015 145 712 145.712 2016 117 110 117.110 2017 128 645 128 .645 2018 129 843 129 843 2019 124 751 124 .751 2020 83.128 83.128 2021 80.960 80.960 2022 56.592 56 592 2023 70.713 70.713 Produção Production
of nationally manufactured vehicles*
Licenciamento de nacionais* Registration
imported
FONTES / SOURCES: ABEIFA, ANFAVEA, RENAVAM/SENATRAN. * Os dados anteriores a 2002 referem-se a vendas internas no atacado. / * Before 2002 the figures refer to domestic wholesales. Unidades / Units Unidades / Units Unidades / Units
Licenciamento de importados* Registration of
vehicles*
Vehicles: production, domestic sales and exports
2.14 Informações por empresa (unidades) / 2.14 Information per company (units)
Honda Automóveis do Brasil Ltda.
Licenciamento de nacionais e importados*
Registration of nationally manufactured and imported vehicles*
Exportações / Exports
90 | Anuário da Indústria Automobilística Brasileira | Brazilian Automotive Industry Yearbook | 2024
Autoveículos: produção, vendas internas e exportações
ANO Year AUTOMÓVEIS Cars TOTAL Total 1992 741 741 1993 4.157 4.157 1994 6.822 6.822 1995 4.851 4.851 1996 2.076 2.076 1997 2.920 2.920 1998 16.423 16.423 1999 17.503 17.503 2000 20.322 20.322 2001 21.860 21.860 2002 20.903 20.903 2003 32.149 32.149 2004 50.694 50.694 2005 57.039 57.039 2006 67.329 67.329 2007 85.748 85.748 2008 117.599 117.599 2009 125.869 125.869 2010 126.439 126.439 2011 92.901 92.901 2012 134.956 134.956 2013 139.279 139.279 2014 137.905 137.905 2015 153.393 153.393 2016 122.551 122.551 2017 131.096 131.096 2018 131.601 131.601 2019 129.130 129.130 2020 84.129 84.129 2021 81.454 81.454 2022 56.700 56 700 2023 72.050 72.050 ANO Year AUTOMÓVEIS Cars TOTAL Total 1998 200 200 1999 856 856 2000 804 804 2001 497 497 2002 157 157 2003 1.784 1.784 2004 4.937 4.937 2005 9.819 9.819 2006 13.741 13.741 2007 22.831 22.831 2008 21.135 21.135 2009 19.086 19.086 2010 26.695 26.695 2011 13.098 13.098 2012 16.012 16.012 2013 13.267 13.267 2014 3.873 3.873 2015 870 870 2016 1.853 1.853 2017 5.340 5.340 2018 6.637 6.637 2019 6.457 6.457 2020 2.848 2.848 2021 6.134 6.134 2022 7.655 7.655 2023 7.092 7.092
FONTES
SOURCES: ABEIFA, ANFAVEA,
Os dados
2002
atacado.
2002
refer to domestic wholesales.
/
RENAVAM/SENATRAN. *
anteriores a
referem-se a vendas internas no
/ * Before
the figures
Unidades / Units
Unidades / Units
HPE Automotores do Brasil Ltda.

Licenciamento de nacionais* Registration
Licenciamento de importados* Registration
2024 | Anuário da Indústria Automobilística Brasileira | Brazilian Automotive Industry Yearbook | 91
ANUÁRIO DA INDÚSTRIA AUTOMOBILÍSTICA BRASILEIRA Brazilian Automotive Industry Yearbook
2024
ANO Year AUTOMÓVEIS Cars COMERCIAIS LEVES Light commercials TOTAL Total 1998 - 652 652 1999 - 3.098 3.098 2000 - 6.252 6.252 2001 - 8.571 8.571 2002 653 9.090 9.743 2003 2.553 9.214 11.767 2004 4.881 13.130 18.011 2005 6.089 14.064 20.153 2006 8.473 11.698 20.171 2007 13.352 12.492 25.844 2008 14.911 22.292 37.203 2009 11.777 20.652 32.429 2010 15.476 22.082 37.558 2011 14.123 25.318 39.441 2012 16.439 20.914 37.353 2013 21.430 21.671 43.101 2014 24.950 20.822 45.772 2015 15.754 13.643 29.397 2016 9.115 10.458 19.573 2017 9.111 9.670 18.781 2018 10.292 12.071 22.363 2019 5.415 9.067 14.482 2020 3.375 8.186 11.561 2021 6.214 14.479 20.693 2022 3.513 16.032 19.545 2023 4.275 12.511 16.786 ANO Year AUTOMÓVEIS Cars COMERCIAIS LEVES Light commercials TOTAL Total 1998 - 629 629 1999 - 3.079 3.079 2000 - 6.305 6.305 2001 - 8.559 8.559 2002 522 9.074 9.596 2003 2.626 9.496 12.122 2004 4.534 12.601 17.135 2005 5.926 12.586 18.512 2006 8.849 11.543 20.392 2007 13.486 11.039 24.525 2008 14.589 19.038 33.627 2009 11.717 20.087 31.804 2010 15.342 20.650 35.992 2011 14.044 22.142 36.186 2012 15.850 21.525 37.375 2013 20.991 21.377 42.368 2014 27.927 20.566 48.493 2015 18.895 14.502 33.397 2016 10.731 9.938 20.669 2017 8.535 9.945 18.480 2018 9.745 10.765 20.510 2019 7.094 10.226 17.320 2020 3.910 9.489 13.399 2021 5.182 13.163 18.345 2022 4.759 15.830 20.589 2023 3.989 12.663 16.652 ANO Year AUTOMÓVEIS Cars COMERCIAIS LEVES Light commercials TOTAL Total 2008 7.828 2 7.830 2009 8.720 5 8.725 2010 13.182 8 13.190 2011 26.724 5 26.729 2012 30.316 3 30.319 2013 22.096 2 22.098 2014 16.827 4 16.831 2015 12.934 3 12.937 2016 7.648 6 7.654 2017 7.936 2 7.938 2018 6.279 2 6.281 2019 8.254 - 8.254 2020 6.539 - 6.539 2021 4.079 - 4.079 2022 3.285 1 3.286 2023 3.068 - 3.068 ANO Year AUTOMÓVEIS Cars COMERCIAIS LEVES Light commercials TOTAL Total 1991 64 58 122 1992 1.664 449 2.113 1993 4.746 1.280 6.026 1994 6.846 2.092 8.938 1995 7.992 2.755 10.747 1996 3.713 2.396 6.109 1997 8.420 3.053 11.473 1998 8.715 2.858 11.573 1999 5.261 354 5.615 2000 8.075 - 8.075 2001 7.219 - 7.219 2002 5.063 1 5.064 2003 3.740 1 3.741 2004 3.732 8 3.740 2005 4.358 1 4.359 2006 3.137 1 3.138 2007 4.846 1 4.847 Produção Production Unidades / Units
of nationally manufactured vehicles*
of imported vehicles* FONTES / SOURCES: ABEIFA, ANFAVEA, RENAVAM/SENATRAN. NOTA / NOTE: Os dados referem-se a Mitsubishi e Suzuki. / The figures refer to Mitsubishi and Suzuki. * Os dados anteriores a 2002 referem-se a vendas internas no atacado. / * Before 2002 the figures refer to domestic wholesales. Unidades / Units Unidades / Units Unidades / Units
Autoveículos: produção, vendas internas e exportações
Vehicles: production, domestic sales and exports
2.14 Informações por empresa (unidades) / 2.14 Information per company (units)
HPE Automotores do Brasil Ltda.
Licenciamento de nacionais e importados*
Exportações / Exports
FONTES / SOURCES: ABEIFA, ANFAVEA, RENAVAM/SENATRAN.
* Os dados anteriores a 2002 referem-se a vendas internas no atacado.
* Before 2002 the figures refer to domestic wholesales.
92 | Anuário da Indústria Automobilística Brasileira | Brazilian Automotive Industry Yearbook | 2024
ANO Year AUTOMÓVEIS Cars COMERCIAIS LEVES Light commercials TOTAL Total 1991 64 58 122 1992 1.664 449 2.113 1993 4.746 1.280 6.026 1994 6.846 2.092 8.938 1995 7.992 2.755 10.747 1996 3.713 2.396 6.109 1997 8.420 3.053 11.473 1998 8.715 3.487 12.202 1999 5.261 3.433 8.694 2000 8.075 6.305 14.380 2001 7.219 8.559 15.778 2002 5.585 9.075 14.660 2003 6.366 9.497 15.863 2004 8.266 12.609 20.875 2005 10.284 12.587 22.871 2006 11.986 11.544 23.530 2007 18.332 11.040 29.372 2008 22.417 19.040 41.457 2009 20.437 20.092 40.529 2010 28.524 20.658 49.182 2011 40.768 22.147 62.915 2012 46.166 21.528 67.694 2013 43.087 21.379 64.466 2014 44.754 20.570 65.324 2015 31.829 14.505 46.334 2016 18.379 9.944 28.323 2017 16.471 9.947 26.418 2018 16.024 10.767 26.791 2019 15.348 10.226 25.574 2020 10.449 9.489 19.938 2021 9.261 13.163 22.424 2022 8.044 15.831 23.875 2023 7.057 12.663 19.720 ANO Year AUTOMÓVEIS Cars COMERCIAIS LEVES Light commercials TOTAL Total 2010 - 861 861 2011 - 713 713 2012 - 210 210 2013 - 251 251 2014 - 20 20 2015 - 329 329 2016 - 364 364 2017 - 100 100 2018 - -2019 - -2020 40 92 132 2021 - 209 209 2022 - 4 4 2023 - - -
of nationally manufactured and imported vehicles* NOTA / NOTE: O s dados referem-se a Mitsubishi e Suzuki. / The figures refer to Mitsubishi and Suzuki.
Registration
Units
Unidades / Units Unidades /
Hyundai Motor Brasil Montadora de Automóveis Ltda.
Produção Production
Licenciamento de nacionais
Registration
Exportações / Exports

2024 | Anuário da Indústria Automobilística Brasileira | Brazilian Automotive Industry Yearbook | 93 2024 ANUÁRIO DA INDÚSTRIA AUTOMOBILÍSTICA BRASILEIRA Brazilian Automotive Industry Yearbook
ANO Year AUTOMÓVEIS Cars TOTAL Total 2012 22.053 22.053 2013 157.713 157.713 2014 179.724 179.724 2015 163.686 163.686 2016 167.674 167.674 2017 179.400 179.400 2018 186.655 186.655 2019 193.956 193.956 2020 158.294 158.294 2021 176.796 176.796 2022 184.417 184 . 417 2023 185.016 185.016
of
manufactured vehicles ANO Year AUTOMÓVEIS Cars TOTAL Total 2012 27.424 27.424 2013 167.346 167.346 2014 179.480 179.480 2015 175.002 175.002 2016 161.756 161.756 2017 182.773 182.773 2018 192.855 192.855 2019 203.868 203.868 2020 150.404 150.404 2021 186.153 186.153 2022 209.045 209.045 2023 204.244 204.244
nationally
ANO Year AUTOMÓVEIS Cars TOTAL Total 2016 1.212 1.212 2017 2.734 2.734 2018 2.758 2.758 2019 3.895 3.895 2020 4.427 4 427 2021 13.359 13 359 2022 16.818 16 . 818 2023 20.056 20.056
/ Units
/ Units
/ Units FONTES / SOURCES: ANFAVEA, RENAVAM/SENATRAN.
Unidades
Unidades
Unidades
Autoveículos: produção, vendas internas e exportações
Vehicles: production, domestic sales and exports
2.14 Informações por empresa (unidades) / 2.14 Information per company (units)
Jaguar e Land Rover Brasil Indústria e Comércio de Veículos Ltda.
Licenciamento de nacionais*
Registration of nationally manufactured vehicles*
Licenciamento de
importados*
Licenciamento de nacionais e importados*
94 | Anuário da Indústria Automobilística Brasileira | Brazilian Automotive Industry Yearbook | 2024
ANO Year AUTOMÓVEIS Cars COMERCIAIS LEVES Light commercials TOTAL Total 1999 262 40 302 2000 1.170 35 1.205 2001 1.115 39 1.154 2002 1.177 47 1.224 2003 687 46 733 2004 629 85 714 2005 442 32 474 2006 57 2 59 2007 3 2 5 2008 1 2 3 2009 1 - 1 2010 3 3 6 2011 - 1 1 2012 - -2013 1 - 1 2014 - -2015 - 1 1 2016 750 3 753 2017 4.667 5 4.672 2018 4.296 1 4.297 2019 2.782 3 2.785 2020 1.655 - 1.655 2021 1.719 1 1.720 2022 2.004 2 2.006 2023 1.922 8 1.930 ANO Year AUTOMÓVEIS Cars COMERCIAIS LEVES Light commercials TOTAL Total 1992 16 11 27 1993 45 65 110 1994 152 170 322 1995 131 36 167 1996 147 340 487 1997 397 517 914 1998 421 706 1.127 1999 344 393 737 2000 321 5 326 2001 413 3 416 2002 308 - 308 2003 444 - 444 2004 1 019 - 1.019 2005 1 549 - 1.549 2006 1 997 - 1.997 2007 3 300 - 3.300 2008 4 465 5 4.470 2009 3 282 9 3.291 2010 5 287 27 5.314 2011 8 297 18 8.315 2012 8 248 6 8.254 2013 10 937 25 10.962 2014 9 784 9 9.793 2015 9 337 2 9. 339 2016 6 739 1 6 .740 2017 3 069 1 3 .070 2018 4 277 1 4 . 278 2019 4.905 - 4.905 2020 3.992 1 3.993 2021 3.861 2 3.863 2022 2.042 1 2.043 2023 3.451 4 3.455
vehicles* ANO Year AUTOMÓVEIS Cars COMERCIAIS LEVES Light commercials TOTAL Total 2007 3.303 2 3.305 2008 4.466 7 4.473 2009 3.283 9 3.292 2010 5.290 30 5.320 2011 8.297 19 8.316 2012 8.248 6 8.254 2013 10.938 25 10.963 2014 9.784 9 9.793 2015 9.337 3 9.340 2016 7.489 4 7.493 2017 7.736 6 7.742 2018 8.573 2 8.575 2019 7.687 3 7.690 2020 5.647 1 5.648 2021 5.580 3 5.583 2022 4.046 3 4.049 2023 5.373 12 5.385 ANO Year AUTOMÓVEIS Cars COMERCIAIS LEVES Light commercials TOTAL Total 1992 16 11 27 1993 45 65 110 1994 152 170 322 1995 131 36 167 1996 147 340 487 1997 397 517 914 1998 421 706 1.127 1999 606 433 1.039 2000 1.491 40 1.531 2001 1.528 42 1.570 2002 1.485 47 1.532 2003 1.131 46 1.177 2004 1.648 85 1.733 2005 1.991 32 2.023 2005 4.358 1 4.359 2006 2.054 2 2.056
Registration of imported
Registration of nationally manufactured and imported vehicles* FONTES / SOURCES: ABEIFA, ANFAVEA, RENAVAM/SENATRAN. NOTAS / NOTES: 1 Dados de produção não disponíveis. / 1. The data of production are not available. 2 Licenciamentos referem-se a Land Rover e Jaguar. / 2. Registrations referes to Land Rover and Jaguar. * Os dados anteriores a 2002 referem-se a vendas internas no atacado. / * Before 2002 the figures refer to domestic wholesales. Unidades / Units Unidades / Units Unidades / Units
Mercedes-Benz Cars & Vans Brasil –Indústria
e Comércio de Veículos
Ltda.
Licenciamento de nacionais
Registration of nationally Manufactured vehicles
Licenciamento de importados
Registration of imported vehicles
Licenciamento de nacionais e importados
Registration of nationally manufactured and imported vehicles

FONTES / SOURCES: RENAVAM/SENATRAN.
2024 | Anuário da Indústria Automobilística Brasileira | Brazilian Automotive Industry Yearbook | 95
ANUÁRIO DA INDÚSTRIA AUTOMOBILÍSTICA BRASILEIRA Brazilian Automotive Industry Yearbook
2024
ANO Year AUTOMÓVEIS Cars TOTAL Total 2020 3.270 3.270 2021 537 537 2022 -2023 - -
ANO Year AUTOMÓVEIS Cars COMERCIAIS LEVES Light commercials CAMINHÕES Trucks TOTAL Total 2020 3.579 7.624 2.131 13.334 2021 4.894 6.174 3.023 14.091 2022 4.993 6.154 2.436 13.583 2023 4.069 5.345 2.376 11.790
ANO Year AUTOMÓVEIS Cars COMERCIAIS LEVES Light commercials CAMINHÕES Trucks TOTAL Total 2020 6.849 7.624 2.131 16.604 2021 5.431 6.174 3.023 14.628 2022 4.993 6.154 2.431 13.578 2023 4.069 5.345 2.218 11.632 Unidades / Units Unidades / Units Unidades / Units
Autoveículos: produção, vendas internas e exportações
Vehicles: production, domestic sales and exports
2.14 Informações por empresa (unidades) / 2.14 Information per company (units)
Mercedes-Benz do Brasil Ltda.
Licenciamento de nacionais*
Registration
Licenciamento de importados*
96 | Anuário da Indústria Automobilística Brasileira | Brazilian Automotive Industry Yearbook | 2024
of nationally manufactured vehicles* ANO Year AUTOMÓVEIS Cars COMERCIAIS LEVES Light commercials CAMINHÕES Trucks ÔNIBUS Buses TOTAL Total 1957 - - 4.012 1.614 5.626 1958 - - 7.307 3.323 10.630 1959 - - 7.528 2.673 10.201 1960 - - 6.601 3.103 9.704 1961 - - 3.864 2.632 6.496 1962 - - 5.568 3.048 8.616 1963 - - 3.782 2.024 5.806 1964 - - 3.835 2.255 6.090 1965 - - 4.489 2.444 6.933 1966 - - 7.669 3.285 10.954 1967 - - 7.915 4.434 12.349 1968 - - 10.732 6.027 16.759 1969 - - 12.023 4.912 16.935 1970 - - 14.280 3.442 17.722 1971 - - 15.329 3.873 19.202 1972 - - 21.572 3.943 25.515 1973 - - 26.384 5.659 32.043 1974 - - 28.031 6.467 34.498 1975 - - 31.137 8.029 39.166 1976 - - 32.758 10.323 43.081 1977 - - 35.764 11.288 47.052 1978 - - 40.218 11.289 51.507 1979 - - 39.965 11.072 51.037 1980 - - 36.468 10.724 47.192 1981 - - 28.183 8.414 36.597 1982 - - 20.870 6.973 27.843 1983 - - 16.957 5.608 22.565 1984 - - 18.611 5.031 23.642 1985 - - 22.028 5.775 27.803 1986 - - 27.195 7.007 34.202 1987 - - 23.982 8.498 32.480 1988 - - 23.998 10.845 34.843 1989 - - 20.309 7.339 27.648 1990 - - 13.539 7.764 21.303 1991 - - 17.848 13.540 31.388 1992 - - 10.719 11.323 22.042 1993 - - 14.600 8.126 22.726 1994 - - 20.668 6.618 27.286 1995 - - 22.110 9.187 31.297 1996 - - 16.312 8.002 24.314 1997 - - 19.357 8.880 28.237 1998 - - 18.410 9.540 27.950 1999 9.831 - 16.826 6.317 32.974 2000 12.006 - 22.005 8.464 42.475 2001 8.661 2.808 21.135 8.131 40.735 2002 8.549 58 20.045 7.501 36.153 2003 6.630 3 19.666 6.891 33.190 2004 5.050 2 23.842 8.942 37.836 2005 3.499 - 22.446 7.657 33.602 2006 20 - 21.655 10.447 32.122 2007 13 1 27.889 11.890 39.793 2008 5 18 33.768 12.931 46.722 2009 874 3 29.307 11.086 41.270 2010 875 1 38.835 14.320 54.031 2011 3 4 39.837 14.905 54.749 2012 - 4 33.058 12.680 45.742 2013 2 24 36.821 13.643 50.490 2014 - 7 34.299 13.011 47.317 2015 - 2 18.053 8.253 26.308 2016 3.072 - 13.905 6.068 23.045 2017 7.632 1 13.293 6.007 26.933 2018 7.620 - 19.969 7.457 35.046 2019 6.073 - 27.985 11.146 45.204 2021 - - 33.080 5.841 38.921 2022 - - 30.565 8.158 38.723 2023 - - 22.981 11.246 34.227
Registration of imported vehicles* ANO Year AUTOMÓVEIS Cars COMERCIAIS LEVES Light commercials CAMINHÕES Trucks ÔNIBUS Buses TOTAL Total 1990 107 - - - 107 1991 330 - - - 330 1992 251 - - - 251 1993 865 - - - 865 1994 1.365 1.778 100 2.144 5.387 1995 2.001 5.737 70 2.464 10.272 1996 3.026 4.610 39 2.858 10.533 1997 3.200 8.625 152 553 12.530 1998 3.372 11.522 10 - 14.904 1999 1.687 6.843 - - 8.530 2000 1.718 2.993 3.622 56 8.389 2001 3.213 2.386 2.097 53 7.749 2002 1.517 976 1.073 58 3.624 2003 1.367 1.375 1.019 76 3.837 2004 1.736 1.867 1.416 3 5.022 2005 2.789 2.164 2.621 1 7.575 2006 4.873 3.199 3.215 - 11.287 2007 6.475 2.990 3.239 1 12.705 2008 3.682 4.096 2.251 1 10.030 2009 5.895 4.473 1.442 - 11.810 2010 8.607 5.126 1.977 - 15.710 2011 11.324 5.323 2.750 - 19.397 2012 6.849 4.961 1.588 - 13.398 2013 10.021 8.372 1.316 - 19.709 2014 12.283 8.324 1.241 - 21.848 2015 18.138 5.982 1.104 - 25.224 2016 8.254 4.146 1.053 - 13.453 2017 4.843 5.390 1.377 - 11.610 2018 4.511 7.175 1.183 - 12.869 2019 4.028 9.508 1.966 - 15.502 2020 - - 7 - 7 2021 - - 9 - 9 2022 - - 3 - 3 2023 - - - -* Os dados anteriores a 2002 referem-se a vendas internas no atacado. * Before 2002 the figures refer to domestic wholesales. Unidades / Units Unidades / Units
/ SOURCES:
FONTES
ANFAVEA, RENAVAM/SENATRAN.
Mercedes-Benz do Brasil Ltda.
Licenciamento de nacionais e importados*
FONTES / SOURCES:: ANFAVEA, RENAVAM/SENATRAN.
NOTAS / NOTES: 1. Inclui Chrysler, Dodge e Jeep (marcas da Chrysler) de 2001 a 2007, período em que essas marcas, juntamente com a Mercedes-Benz, compunham a DaimlerChrysler. / 1.Includes Chrysler, Dodge and Jeep (Chrysler brands) from 2001 to 2007, a period when these brands, together with Mercedes-Benz, made up DaimlerChrysler. 2. A partir de 2020 houve o desmembramento da empresa originando a Mercedes-Benz Cars & Vans. / 2 As of 2020, the company was dismembered, creating Mercedes-Benz Cars & Vans
2024 | Anuário da Indústria Automobilística Brasileira | Brazilian Automotive Industry Yearbook | 97 2024 ANUÁRIO DA INDÚSTRIA AUTOMOBILÍSTICA BRASILEIRA Brazilian Automotive Industry Yearbook
ANO Year AUTOMÓVEIS Cars COMERCIAIS LEVES Light commercials CAMINHÕES Trucks ÔNIBUS Buses TOTAL Total 1957 - - 4.012 1.614 5.626 1958 - - 7.307 3.323 10.630 1959 - - 7.528 2.673 10.201 1960 - - 6.601 3.103 9.704 1961 - - 3.864 2.632 6.496 1962 - - 5.568 3.048 8.616 1963 - - 3.782 2.024 5.806 1964 - - 3.835 2.255 6.090 1965 - - 4.489 2.444 6.933 1966 - - 7.669 3.285 10.954 1967 - - 7.915 4.434 12.349 1968 - - 10.732 6.027 16.759 1969 - - 12.023 4.912 16.935 1970 - - 14.280 3.442 17.722 1971 - - 15.329 3.873 19.202 1972 - - 21.572 3.943 25.515 1973 - - 26.384 5.659 32.043 1974 - - 28.031 6.467 34.498 1975 - - 31.137 8.029 39.166 1976 - - 32.758 10.323 43.081 1977 - - 35.764 11.288 47.052 1978 - - 40.218 11.289 51.507 1979 - - 39.965 11.072 51.037 1980 - - 36.468 10.724 47.192 1981 - - 28.183 8.414 36.597 1982 - - 20.870 6.973 27.843 1983 - - 16.957 5.608 22.565 1984 - - 18.611 5.031 23.642 1985 - - 22.028 5.775 27.803 1986 - - 27.195 7.007 34.202 1987 - - 23.982 8.498 32.480 1988 - - 23.998 10.845 34.843 1989 - - 20.309 7.339 27.648 1990 107 - 13.539 7.764 21.410 ANO Year AUTOMÓVEIS Cars COMERCIAIS LEVES Light commercials CAMINHÕES Trucks ÔNIBUS Buses TOTAL Total 1991 330 - 17.848 13.540 31.718 1992 251 - 10.719 11.323 22.293 1993 865 - 14.600 8.126 23.591 1994 1.365 1.778 20.768 8.762 32.673 1995 2.001 5.737 22.180 11.651 41.569 1996 3.026 4.610 16.351 10.860 34.847 1997 3.200 8.625 19.509 9.433 40.767 1998 3.372 11.522 18.420 9.540 42.854 1999 11.518 6.843 16.826 6.317 41.504 2000 13.724 2.993 25.627 8.520 50.864 2001 11.874 5.194 23.232 8.184 48.484 2002 10.066 1.034 21.118 7.559 39.777 2003 7.997 1.378 20.685 6.967 37.027 2004 6.786 1.869 25.258 8.945 42.858 2005 6.288 2.164 25.067 7.658 41.177 2006 4.893 3.199 24.870 10.447 43.409 2007 6.488 2.991 31.128 11.891 52.498 2008 3.687 4.114 36.019 12.932 56.752 2009 6.769 4.476 30.749 11.086 53.080 2010 9.482 5.127 40.812 14.320 69.741 2011 11.327 5.327 42.587 14.905 74.146 2012 6.849 4.965 34.646 12.680 59.140 2013 10.023 8.396 38.137 13.643 70.199 2014 12.283 8.331 35.540 13.011 69.165 2015 18.138 5.984 19.157 8.253 51.532 2016 11.326 4.146 14.958 6.068 36.498 2017 12.475 5.391 14.670 6.007 38.543 2018 12.131 7.175 21.152 7.457 47.915 2019 10.101 9.508 29.951 11.146 60.706 2021 - - 33.089 5.841 38.930 2022 - - 30.568 8.158 38.726 2023 - - 22.981 11.246 34.227
Registration of nationally manufactured and imported vehicles*
Unidades / Units
Autoveículos: produção, vendas internas e exportações
Vehicles: production, domestic sales and exports
2.14 Informações por empresa (unidades) / 2.14 Information per company (units)
Nissan do Brasil Automóveis Ltda.
Licenciamento de nacionais*

98 | Anuário da Indústria Automobilística Brasileira | Brazilian Automotive Industry Yearbook | 2024
ANO Year AUTOMÓVEIS Cars COMERCIAIS LEVES Light commercials TOTAL Total 2002 - 3.744 3.744 2003 1.003 7.022 8.025 2004 1.705 8.491 10.196 2005 1.728 8.578 10.306 2006 1.208 7.453 8.661 2007 1.074 8.037 9.111 2008 254 5.062 5.316 2009 11.966 6.942 18.908 2010 10.491 7.664 18.155 2011 17.797 14.843 32.640 2012 14.364 16.978 31.342 2013 10.636 16.173 26.809 2014 23.572 9.116 32.688 2015 41.512 5.549 47.061 2016 40.544 3.209 43.753 2017 81.764 - 81.764 2018 104.317 - 104.317 2019 103.493 - 103.493 2020 51.959 - 51.959 2021 60.672 - 60.672 2022 48.369 - 48.369 2023 69.630 - 69.630 ANO Year AUTOMÓVEIS Cars COMERCIAIS LEVES Light commercials TOTAL Total 2002 - 3.021 3.021 2003 797 6.580 7.377 2004 1.104 6.672 7.776 2005 1.264 6.048 7.312 2006 586 3.921 4.507 2007 425 3.373 3.798 2008 176 2.177 2.353 2009 6.147 6.786 12.933 2010 13.800 8.580 22.380 2011 16.688 13.679 30.367 2012 15.279 17.562 32.841 2013 9.544 15.595 25.139 2014 21.895 11.588 33.483 2015 40.992 5.778 46.770 2016 40.287 3.605 43.892 2017 59.180 861 60.041 2018 86.755 7 86.762 2019 84.735 5 84.740 2020 49.952 - 49.952 2021 41.573 1 41.574 2022 38.992 - 38.992 2023 50.783 1 50.784 ANO Year AUTOMÓVEIS Cars COMERCIAIS LEVES Light commercials TOTAL Total 2009 10.250 42 10.292 2010 13.490 4 13.494 2011 36.894 7 36.901 2012 71.935 4 71.939 2013 52.686 - 52.686 2014 38.880 2 38.882 2015 14.469 - 14.469 2016 17.024 1 17.025 2017 15.584 3.198 18.782 2018 4.434 6.319 10.753 2019 3.261 8.087 11.348 2020 2.988 8.079 11.067 2021 11.547 11.823 23.370 2022 6.006 8.675 14.681 2023 13.383 8.391 21.774 ANO Year AUTOMÓVEIS Cars COMERCIAIS LEVES Light commercials TOTAL Total 1993 549 215 764 1994 803 467 1.270 1995 984 534 1.518 1996 503 413 916 1997 902 151 1.053 1998 893 334 1.227 1999 360 211 571 2000 163 103 266 2001 216 1.336 1.552 2002 203 823 1.026 2003 170 4 174 2004 166 3 169 2005 786 - 786 2006 1.217 9 1.226 2007 7.200 910 8.110 2008 11.048 4.070 15.118
Production
Produção
Registration of nationally manufactured vehicles*
Registration of imported vehicles* FONTES / SOURCES: ABEIFA, ANFAVEA, RENAVAM/SENATRAN. * Os dados anteriores a 2002 referem-se a vendas internas no atacado. / * Before 2002 the figures refer to domestic wholesales. Unidades / Units
/ Units Unidades / Units
Licenciamento de importados*
Unidades
Nissan do Brasil Automóveis Ltda.
Licenciamento de nacionais e importados*
Registration of nationally manufactured and imported vehicles*
Exportações / Exports
FONTES / SOURCES: ABEIFA, ANFAVEA, RENAVAM/SENATRAN.
* Os dados anteriores a 2002 referem-se a vendas internas no atacado. /
* Before 2002 the figures refer to domestic wholesales.
2024 | Anuário da Indústria Automobilística Brasileira | Brazilian Automotive Industry Yearbook | 99
ANUÁRIO DA INDÚSTRIA AUTOMOBILÍSTICA BRASILEIRA Brazilian Automotive Industry Yearbook
2024
ANO Year AUTOMÓVEIS Cars COMERCIAIS LEVES Light commercials TOTAL Total 1993 549 215 764 1994 803 467 1 270 1995 984 534 1 518 1996 503 413 916 1997 902 151 1.053 1998 893 334 1. 227 1999 360 211 571 2000 163 103 266 2001 216 1 336 1. 552 2002 203 3 844 4 047 2003 967 6 584 7 551 2004 1 270 6 675 7 945 2005 2 050 6 048 8 .098 2006 1 803 3 930 5.733 2007 7 625 4 283 11.908 2008 11 224 6 247 17. 471 2009 16 397 6 828 23 . 225 2010 27 290 8 584 35 874 2011 53 582 13 686 67 268 2012 87 214 17 566 104.780 2013 62 230 15 595 77.825 2014 60 775 11 590 72.365 2015 55 461 5 778 61.239 2016 57 311 3 606 60.917 2017 74 764 4 059 78.823 2018 91 189 6 326 97.515 2019 87 996 8 092 96.088 2020 52.940 8.079 61.019 2021 53.120 11.824 64.944 2022 44.998 8.675 53.673 2023 64.166 8.392 72.558 ANO Year AUTOMÓVEIS Cars COMERCIAIS LEVES Light commercials TOTAL Total 2003 244 1.675 1.919 2004 832 2.062 2.894 2005 799 4.049 4.848 2006 650 3.547 4.197 2007 655 4.854 5. 509 2008 350 2.679 3 .029 2009 - -2010 - -2011 - -2012 - -2013 - -2014 - -2015 - -2016 3.690 - 3.690 2017 20.282 - 20.282 2018 24.183 - 24.183 2019 16.236 - 16.236 2020 7.350 - 7.350 2021 8.867 - 8.867 2022 4.328 - 4.328 2023 9.071 - 9.071
Unidades
Units Unidades / Units
/
Autoveículos: produção, vendas internas e exportações
Vehicles: production, domestic sales and exports
2.14 Informações por empresa (unidades) / 2.14 Information per company (units)
On-Highway Brasil Ltda.
Licenciamento de nacionais*
Registration of nationally manufactured vehicles*
Licenciamento
de importados
Registration of imported vehicles*
100 | Anuário da Indústria Automobilística Brasileira | Brazilian Automotive Industry Yearbook | 2024
ANO Year COMERCIAIS LEVES Light commercials CAMINHÕES Trucks ÔNIBUS Buses TOTAL Total 2000 - 578 - 578 2001 - 3.209 408 3.617 2002 210 2.352 479 3.041 2003 383 1.705 516 2.604 2004 600 2.437 381 3.418 2005 826 3.329 291 4.446 2006 674 2.530 272 3.476 2007 775 4.507 142 5.424 2008 2.014 8.545 52 10.611 2009 2.173 6.575 526 9.274 2010 3.436 11.851 484 15.771 2011 4.985 14.155 1.359 20.499 2012 4.612 10.340 1.678 16.630 2013 4.051 11.472 1.573 17.096 2014 3.863 8.793 731 13.387 2015 2.618 4.485 1.187 8.290 2016 2.043 2.562 730 5.335 2017 2.223 1.921 1.065 5.209 2018 2.799 2.779 1 018 6.596 2019 3 033 3 886 253 7 172 2020 3.378 5.061 612 9.051 2021 3.567 8.574 1.032 13.173 2022 3.561 10.593 584 14.738 2023 2.340 9.339 582 12.261 ANO Year COMERCIAIS LEVES Light commercials CAMINHÕES Trucks ÔNIBUS Buses TOTAL Total 1997 - 46 - 46 1998 - 1.307 - 1.307 1999 - 3.101 - 3.101 2000 - 3.270 189 3.459 2001 - 809 116 925 2002 11 1.071 2 1.084 2003 1 587 - 588 2004 - 697 - 697 2005 - 316 2 318 2006 - 80 12 92 2007 1 43 3 47 2008 - 618 - 618 2009 - 1.189 - 1.189 2010 - 154 - 154 2011 - 86 - 86 2012 2 37 - 39 2013 - 33 - 33 2014 - 2 - 2 2015 - 7 - 7 2016 - 11 - 11 2017 - 3 - 3 2018 - 5 - 5 2019 - 3 - 3 2020 - 3 - 3 2021 - 16 - 16 2022 1 16 - 17 2023 1 11 - 12
FONTES / SOURCES: ANFAVEA, RENAVAM/SENATRAN. *Os dados anteriores a 2002 referem-se a vendas internas no atacado. *Before 2002 the figures refer to domestic wholesales Unidades / Units Unidades / Units
On-Highway Brasil Ltda.
Licenciamento de nacionais e importados*
Registration of nationally manufactured and imported vehicles*
Unidades / Units
2024 | Anuário da Indústria Automobilística Brasileira | Brazilian Automotive Industry Yearbook | 101 2024 ANUÁRIO DA INDÚSTRIA AUTOMOBILÍSTICA BRASILEIRA Brazilian Automotive Industry Yearbook
ANO Year COMERCIAIS LEVES Light commercials CAMINHÕES Trucks ÔNIBUS Buses TOTAL Total 1997 - 46 - 46 1998 - 1.307 - 1.307 1999 - 3.101 - 3.101 2000 - 3.848 189 4.037 2001 - 4.018 524 4.542 2002 221 3.423 481 4.125 2003 384 2.292 516 3.192 2004 600 3.134 381 4.115 2005 826 3.645 293 4.764 2006 674 2.610 284 3.568 2007 776 4.550 145 5.471 2008 2.014 9.163 52 11.229 2009 2.173 7.764 526 10.463 2010 3.436 12.005 484 15.925 2011 4.985 14.241 1.359 20.585 2012 4.614 10.377 1.678 16.669 2013 4.051 11.505 1.573 17.129 2014 3.863 8.795 731 13.389 2015 2.618 4.492 1.187 8.297 2016 2.043 2.573 730 5.346 2017 2.223 1.924 1.065 5.212 2018 2.799 2.784 1.018 6.601 2019 3.033 3.889 253 7.175 2020 3.378 5.064 612 9.054 2021 3.567 8.590 1.032 13.189 2022 3.562 10.609 584 14.755 2023 2.341 9.350 582 12.273
dados
a 2002 referem-se a vendas internas no atacado. * Before 2002 the figures refer to domestic wholesales
FONTES / SOURCES: ANFAVEA, RENAVAM/SENATRAN. * Os
anteriores
Autoveículos: produção, vendas internas e exportações
Vehicles: production, domestic sales and exports
2.14 Informações por empresa (unidades) / 2.14 Information per company (units)
Peugeot Citroën do Brasil Automóveis Ltda.
Produção

Licenciamento de nacionais*
Registration
Licenciamento de importados* / Registration of imported vehicles*
102 | Anuário da Indústria Automobilística Brasileira | Brazilian Automotive Industry Yearbook | 2024
ANO Year AUTOMÓVEIS Cars COMERCIAIS LEVES Light commercials TOTAL Total 2001 18.116 - 18.116 2002 48.193 914 49.107 2003 44.922 1.192 46.114 2004 65.342 3.306 68.648 2005 93.617 5.285 98.902 2006 89.738 5.948 95.686 2007 115.897 3.542 119.439 2008 126.976 3.999 130.975 2009 111.628 5.661 117.289 2010 132.860 16.612 149.472 2011 132.948 14.237 147.185 2012 92.943 6.575 99.518 2013 137.193 6.441 143.634 2014 87.515 3.781 91.296 2015 66.482 3.230 69.712 2016 82.259 2.265 84.524 2017 95.704 9 95.713 2018 77.636 - 77.636 2019 52.250 - 52.250 2020 30.040 - 30.040 2021 43.970 - 43.970 2022 51.068 2.496 53.564 2023 49.420 1.493 50.913 ANO Year AUTOMÓVEIS Cars COMERCIAIS LEVES Light commercials CAMINHÕES Trucks TOTAL Total 2001 14.771 - - 14.771 2002 40.925 265 43 41.233 2003 44.079 1.553 118 45.750 2004 55.905 2.096 123 58.124 2005 67.437 1.768 117 69.322 2006 74.896 1.932 19 76.847 2007 92.482 2.833 3 95.318 2008 105.804 3.610 9 109.423 2009 104.761 2.910 - 107.671 2010 107.192 9.463 - 116.655 2011 102.915 11.684 - 114.599 2012 86.049 7.203 - 93.252 2013 81.489 6.698 - 88.187 2014 67.533 4.446 - 71.979 2015 43.416 2.863 - 46.279 2016 40.841 1.432 - 42.273 2017 40.931 502 - 41.433 2018 32.135 38 - 32.173 2019 36.404 19 - 36.423 2020 17.225 5 - 17.230 2021 27.408 2 - 27.410 2022 34.465 2.039 - 36.504 2023 32.172 1.706 - 33.878 ANO Year AUTOMÓVEIS Cars COMERCIAIS LEVES Light commercials CAMINHÕES Trucks TOTAL Total 1991 58 - - 58 1992 332 42 - 374 1993 1.692 1.055 - 2.747 1994 7.785 3.255 - 11.040 1995 14.759 2.427 - 17.186 1996 8.497 2.423 - 10.920 1997 7.071 1.501 - 8.572 1998 15.734 1.434 - 17.168 1999 21.644 2.569 - 24.213 2000 29.289 1.328 4 30.621 2001 31.789 2.012 41 33.842 2002 21.843 1.418 22 23.283 2003 9.990 690 2 10.682 2004 5.452 229 - 5.681 2005 10.725 324 - 11.049 2006 18.377 781 - 19.158 2007 31.781 1.121 - 32.902 ANO Year AUTOMÓVEIS Cars COMERCIAIS LEVES Light commercials CAMINHÕES Trucks TOTAL Total 2008 40.404 1.147 - 41.551 2009 42.682 806 - 43.488 2010 56.904 824 - 57.728 2011 60.568 695 - 61.263 2012 52.598 806 - 53.404 2013 34.841 595 - 35.436 2014 22.009 348 - 22.357 2015 11.776 141 - 11.917 2016 7.704 350 - 8.054 2017 6.769 1.214 - 7.983 2018 8.202 3.633 7 11.842 2019 4.619 6.739 347 11.705 2020 4.663 4.814 253 9.730 2021 17.238 8.065 174 25.477 2022 30.783 6.559 55 37.397 2023 29.321 3.890 118 33.329
Production
of nationally manufactured vehicles*
Unidades / Units Unidades / Units Unidades / Units FONTES / SOURCES: ABEIFA, ANFAVEA, RENAVAM/SENATRAN. * Os dados anteriores a 2002 referem-se a vendas internas no atacado. / * Before 2002 the figures refer to domestic wholesales.
Peugeot Citroën do Brasil Automóveis Ltda.
Licenciamento de nacionais e importados*
Registration of nationally manufactured and imported vehicles*
Exportações / Exports
FONTES / SOURCES: ABEIFA, ANFAVEA, RENAVAM/SENATRAN.
* Os dados anteriores a 2002 referem-se a vendas internas no atacado. /
* Before 2002 the figures refer to domestic wholesales.
2024 | Anuário da Indústria Automobilística Brasileira | Brazilian Automotive Industry Yearbook | 103 2024 ANUÁRIO DA INDÚSTRIA AUTOMOBILÍSTICA BRASILEIRA Brazilian Automotive Industry Yearbook
Unidades /
Units
ANO Year AUTOMÓVEIS Cars COMERCIAIS LEVES Light commercials CAMINHÕES Trucks TOTAL Total 1991 58 - - 58 1992 332 42 - 374 1993 1 692 1 055 - 2 .747 1994 7 785 3 255 - 11 040 1995 14 759 2 427 - 17.186 1996 8 497 2 423 - 10 920 1997 7 071 1 501 - 8 . 572 1998 15 734 1 434 - 17 168 1999 21 644 2 569 - 24 . 213 2000 29 289 1 328 4 30.621 2001 46 560 2 012 41 48 .613 2002 62.768 1.683 65 64.516 2003 54.069 2.243 120 56.432 2004 61.357 2.325 123 63.805 2005 78.162 2.092 117 80.371 2006 93.273 2.713 19 96.005 2007 124.263 3.954 3 128.220 2008 146.208 4.757 9 150.974 2009 147.443 3.716 - 151.159 2010 164.096 10.287 - 174.383 2011 163.483 12.379 - 175.862 2012 138.647 8.009 - 146.656 2013 116.330 7.293 - 123.623 2014 89.542 4.794 - 94.336 2015 55.192 3.004 - 58.196 2016 48.545 1.782 - 50.327 2017 47.700 1.716 - 49.416 2018 40.337 3.671 7 44.015 2019 41 023 6 758 347 48.128 2020 21 888 4 819 253 26 960 2021 44.646 8.067 174 52.887 2022 65.248 8.598 55 73.901 2023 61.493 5.596 118 67.207 ANO Year AUTOMÓVEIS Cars COMERCIAIS LEVES Light commercials TOTAL Total 2001 785 - 785 2002 813 - 813 2003 3.232 - 3.232 2004 10.031 - 10.031 2005 18.673 - 18.673 2006 14.941 - 14.941 2007 12.837 - 12.837 2008 12.746 - 12.746 2009 15.224 - 15.224 2010 17.751 184 17.935 2011 24.114 588 24.702 2012 21.436 380 21.816 2013 53.163 747 53.910 2014 28.136 152 28.288 2015 24.906 208 25.114 2016 41.345 1.456 42.801 2017 56.517 284 56.801 2018 37.931 - 37.931 2019 24.592 - 24.592 2020 17.417 - 17.417 2021 12.984 - 12.984 2022 16.367 - 16.367 2023 16.996 - 16.996
Unidades /
Units
Units
Unidades
/
Renault do Brasil S.A.

Licenciamento
Licenciamento de importados*
Registration
2.14
por empresa
2.14
per company (units) 104 | Anuário da Indústria Automobilística Brasileira | Brazilian Automotive Industry Yearbook | 2024
production, domestic sales
exports
Informações
(unidades) /
Information
Autoveículos: produção, vendas internas e exportações Vehicles:
and
ANO Year AUTOMÓVEIS Cars COMERCIAIS LEVES Light commercials TOTAL Total 1999 24.809 - 24.809 2000 58.083 - 58.083 2001 71.108 - 71.108 2002 46.721 1 319 48.040 2003 57.389 1 217 58.606 2004 63.242 3 403 66.645 2005 56.731 3 776 60.507 2006 60.314 5 290 65.604 2007 90.833 6 625 97. 458 2008 114.441 7 719 122 160 2009 116 301 5 228 121 529 2010 161 525 10 930 172 455 2011 209 920 11 813 221.733 2012 238 074 15 351 253 . 425 2013 248 763 33 832 282 . 595 2014 200.159 19 316 219. 475 2015 160 496 14 963 175 459 2016 164 324 40 565 204 889 2017 208 644 37 140 245 784 2018 243 257 48 089 291. 346 2019 262 203 44 050 306 . 253 2020 124.931 37.694 162.625 2021 136.032 32.923 168.955 2022 132.091 28.565 160.656 2023 122.503 30.787 153.290 ANO Year AUTOMÓVEIS Cars COMERCIAIS LEVES Light commercials TOTAL Total 1999 18.058 - 18.058 2000 42.189 - 42.189 2001 60.463 - 60.463 2002 53.745 525 54.270 2003 52.685 1 309 53.994 2004 49.119 2 401 51.520 2005 43.754 2 582 46.336 2006 47.407 2 779 50.186 2007 62.046 3 699 65.745 2008 93.170 4 155 97. 325 2009 89 014 3 869 92 . 883 2010 113 014 5 798 118 . 812 2011 140.129 7 439 147. 568 2012 189 117 8 660 197.777 2013 175 973 10 075 186 048 2014 190 881 12 338 203 219 2015 143 644 11 601 155 245 2016 112 323 20 586 132 909 2017 147 478 17 241 164 .719 2018 192 276 20 513 212 .789 2019 217 184 21 781 238 .965 2020 118.098 11.527 129.625 2021 105.526 21.758 127.284 2022 103.490 22.011 125.501 2023 102.273 23.294 125.567 Produção Production
de
Registration of nationally manufactured vehicles* ANO Year AUTOMÓVEIS Cars COMERCIAIS LEVES Light commercials TOTAL Total 2009 22.980 1.678 24 .658 2010 39.066 2.421 41 487 2011 43.620 3.106 46 .726 2012 38.478 5.312 43 .790 2013 44.723 5.559 50 282 2014 28.651 5.298 33 949 2015 22.692 3.547 26 . 239 2016 15.206 1.848 17.054 2017 1.151 1.257 2 408 2018 721 1.304 2 .025 2019 133 52 185 2020 1.918 38 1.956 2021 248 22 270 2022 1.205 2 1.207 2023 444 196 640 ANO Year AUTOMÓVEIS Cars COMERCIAIS LEVES Light commercials TOTAL Total 1993 1.559 - 1. 559 1994 7 740 - 7 740 1995 10 541 - 10. 541 1996 8 789 - 8 789 1997 8 541 919 9.460 1998 15 742 3 381 19.123 1999 11 968 2 514 14 482 2000 11 953 2 466 14 . 419 2001 7 605 2 321 9 926 2002 5 076 1 272 6 . 348 2003 2 491 1 565 4 .056 2004 1 240 767 2 007 2005 527 654 1.181 2006 1.007 479 1 486 2007 7.119 744 7. 863 2008 16.486 1.342 17. 828
nacionais*
imported
FONTES / SOURCES: ABEIFA, ANFAVEA, RENAVAM/SENATRAN. * Os dados anteriores a 2002 referem-se a vendas internas no atacado. / * Before 2002 the figures refer to domestic wholesales. Unidades / Units Unidades / Units Unidades / Units
of
vehicles*
Renault do Brasil S.A.
Licenciamento de nacionais e importados*
Registration of nationally manufactured and imported vehicles*
Exportações / Exports
FONTES / SOURCES: ABEIFA, ANFAVEA, RENAVAM/SENATRAN.
* Os dados anteriores a 2002 referem-se a vendas internas no atacado. / * Before 2002 the figures refer to domestic wholesales.
2024 | Anuário da Indústria Automobilística Brasileira | Brazilian Automotive Industry Yearbook | 105
ANUÁRIO DA INDÚSTRIA AUTOMOBILÍSTICA BRASILEIRA Brazilian Automotive Industry Yearbook
2024
ANO Year AUTOMÓVEIS Cars COMERCIAIS LEVES Light commercials TOTAL Total 1993 1.559 - 1.559 1994 7.740 - 7.740 1995 10.541 - 10.541 1996 8.789 - 8.789 1997 8.541 919 9.460 1998 15.742 3.381 19.123 1999 30.026 2.514 32.540 2000 54.142 2.466 56.608 2001 68.068 2.321 70.389 2002 58.821 1.797 60.618 2003 55.176 2.874 58.050 2004 50.359 3.168 53.527 2005 44.281 3.236 47.517 2006 48.414 3.258 51.672 2007 69.165 4.443 73.608 2008 109.656 5.497 115.153 2009 111.994 5.547 117.541 2010 152.080 8.219 160.299 2011 183.749 10.545 194.294 2012 227.595 13.972 241.567 2013 220.696 15.634 236.330 2014 219.532 17.636 237.168 2015 166.336 15.148 181.484 2016 127.529 22.434 149.963 2017 148.629 18.498 167.127 2018 192.997 21.817 214.814 2019 217.317 21.833 239.150 2020 120.016 11.565 131.581 2021 105.774 21.780 127.554 2022 104.695 22.013 126.708 2023 102.717 23.490 126.207 ANO Year AUTOMÓVEIS Cars COMERCIAIS LEVES Light commercials TOTAL Total 1999 1.903 - 1.903 2000 14.459 - 14.459 2001 5 507 - 5.507 2002 2.486 4 2.490 2003 6 451 406 6.857 2004 15 948 856 16.804 2005 17 438 1 819 19.257 2006 15 045 1 993 17.038 2007 33 189 2 771 35.960 2008 18 876 3 402 22.278 2009 31 524 3 461 34.985 2010 52.903 4 043 56.946 2011 54.817 5 247 60.064 2012 50.581 6 650 57.231 2013 58.244 5 032 63.276 2014 30.647 3 768 34.415 2015 30.153 2 341 32.494 2016 52 926 23 248 76.174 2017 70 142 24 024 94 .166 2018 66 820 34 738 101 558 2019 49 509 25 296 74 . 805 2020 43.203 13.524 56.727 2021 41.957 11.367 53.324 2022 43.673 14.707 58.380 2023 38.887 14.548 53.435
Units
Unidades /
/ Units
Unidades
Autoveículos: produção, vendas internas e exportações
Vehicles: production, domestic sales
and exports
2.14 Informações por empresa (unidades) / 2.14 Information per company (units)
Scania Latin America Ltda.
Licenciamento de nacionais* Registration

Licenciamento de importados*
Registration of imported vehicles*
106 | Anuário da Indústria Automobilística Brasileira | Brazilian Automotive Industry Yearbook | 2024
* Os dados anteriores a 2002 referem-se a vendas internas no atacado. / * Before 2002 the figures refer to domestic wholesales.
of nationally manufactured vehicles* ANO Year CAMINHÕES Trucks ÔNIBUS Buses TOTAL Total 1957 173 - 173 1958 225 - 225 1959 300 156 456 1960 384 136 520 1961 340 144 484 1962 723 100 823 1963 774 214 988 1964 595 138 733 1965 676 142 818 1966 753 132 885 1967 505 220 725 1968 710 217 927 1969 789 189 978 1970 864 180 1.044 1971 883 199 1.082 1972 1.303 199 1.502 1973 1.600 318 1.918 1974 2.068 239 2.307 1975 2.936 364 3.300 1976 3.666 490 4.156 1977 3.593 555 4.148 1978 2.404 348 2.752 1979 2.210 357 2.567 1980 2.823 478 3.301 1981 2.230 460 2.690 1982 2.137 552 2.689 1983 1.907 531 2.438 1984 2.667 620 3.287 1985 3.306 840 4.146 1986 4.057 951 5.008 1987 3.309 915 4.224 1988 3.716 1.267 4.983 1989 4.099 1.350 5.449 1990 3.730 1.372 5.102 1991 3.400 1.969 5.369 1992 3.211 1.255 4.466 1993 5.080 951 6.031 1994 6.499 773 7.272 1995 5.908 1.516 7.424 1996 5.149 1.369 6.518 1997 6.977 1.351 8.328 1998 5.200 1.104 6.304 1999 4.393 723 5.116 2000 5.335 1.100 6.435 2001 5.428 853 6.281 2002 3.453 396 3.849 2003 4.017 481 4.498 2004 5.955 580 6.535 2005 5.266 908 6.174 2006 5.101 708 5.809 2007 6.433 913 7.346 2008 7.838 868 8.706 2009 8.088 554 8.642 2010 15.287 1.005 16.292 2011 13.482 1.394 14.876 2012 11.076 1.037 12.113 2013 19.659 1.126 20.785 2014 14.110 1.063 15.173 2015 5.214 391 5.605 2016 4.238 292 4.530 2017 5.745 522 6.267 2018 8.631 760 9.391 2019 12.738 901 13.639 2020 8.707 394 9 101 2021 15.604 243 15.847 2022 13.193 286 13.479 2023 12.439 467 12.906
ANO Year CAMINHÕES Trucks ÔNIBUS Buses TOTAL Total 1993 180 - 180 1994 354 - 354 1995 667 - 667 1996 300 - 300 1997 307 - 307 1998 295 106 401 1999 18 1 19 2000 - -2001 - -2002 - -2003 - -2004 9 - 9 2005 9 1 10 2006 - -2007 8 2 10 2008 6 - 6 2009 6 1 7 2010 5 1 6 2011 2 - 2 2012 2 - 2 2013 39 - 39 2014 34 - 34 2015 10 - 10 2016 7 1 8 2017 9 - 9 2018 12 - 12 2019 19 - 19 2020 5 - 5 2021 7 1 8 2022 30 1 31 2023 4 - 4 Unidades / Units Unidades / Units FONTES / SOURCES: ANFAVEA, RENAVAM/SENATRAN.
Scania Latin America Ltda.
Licenciamento de nacionais e importados*
2024 | Anuário da Indústria Automobilística Brasileira | Brazilian Automotive Industry Yearbook | 107 2024 ANUÁRIO DA INDÚSTRIA AUTOMOBILÍSTICA BRASILEIRA Brazilian Automotive Industry Yearbook
of nationally manufactured and imported vehicles* ANO Year CAMINHÕES Trucks ÔNIBUS Buses TOTAL Total 1957 173 - 173 1958 225 - 225 1959 300 156 456 1960 384 136 520 1961 340 144 484 1962 723 100 823 1963 774 214 988 1964 595 138 733 1965 676 142 818 1966 753 132 885 1967 505 220 725 1968 710 217 927 1969 789 189 978 1970 864 180 1.044 1971 883 199 1.082 1972 1.303 199 1.502 1973 1.600 318 1.918 1974 2.068 239 2.307 1975 2.936 364 3.300 1976 3.666 490 4.156 1977 3.593 555 4.148 1978 2.404 348 2.752 1979 2.210 357 2.567 1980 2.823 478 3.301 1981 2.230 460 2.690 1982 2.137 552 2.689 1983 1.907 531 2.438 1984 2.667 620 3.287 1985 3.306 840 4.146 1986 4.057 951 5.008 1987 3.309 915 4.224 1988 3.716 1.267 4.983 1989 4.099 1.350 5.449 1990 3.730 1.372 5.102 ANO Year CAMINHÕES Trucks ÔNIBUS Buses TOTAL Total 1991 3.400 1.969 5.369 1992 3.211 1.255 4.466 1993 5.260 951 6.211 1994 6.853 773 7.626 1995 6.575 1.516 8.091 1996 5.449 1.369 6.818 1997 7.284 1.351 8.635 1998 5.495 1.210 6.705 1999 4.411 724 5.135 2000 5.335 1.100 6.435 2001 5.428 853 6.281 2002 3.453 396 3.849 2003 4.017 481 4.498 2004 5.964 580 6.544 2005 5.275 909 6.184 2006 5.101 708 5.809 2007 6.441 915 7.356 2008 7.844 868 8.712 2009 8.094 555 8.649 2010 15.292 1.006 16.298 2011 13.484 1.394 14.878 2012 11.078 1.037 12.115 2013 19.698 1.126 20.824 2014 14.144 1.063 15.207 2015 5.224 391 5.615 2016 4.245 293 4.538 2017 5.754 522 6.276 2018 8.643 760 9.403 2019 12.757 901 13.658 2020 8.712 394 9.106 2021 15.611 244 15.855 2022 13.223 287 13.510 2023 12.443 467 12.910 FONTES / SOURCES: ANFAVEA, RENAVAM/SENATRAN. * Os dados anteriores a 2002 referem-se a vendas internas no atacado. * Before 2002 the figures refer to domestic wholesales.
Registration
Unidades / Units
Autoveículos: produção, vendas internas e exportações
Vehicles: production, domestic sales and exports
2.14 Informações por empresa (unidades) / 2.14 Information per company (units)
Toyota do Brasil Ltda.
Produção Production
Licenciamento de nacionais*

Registration of nationally manufactured vehicles*
108 | Anuário da Indústria Automobilística Brasileira | Brazilian Automotive Industry Yearbook | 2024
ANO Year AUTOMÓVEIS Cars COMERCIAIS LEVES Light commercials TOTAL Total 1959 489 - 489 1960 295 - 295 1961 7 - 7 1962 627 - 627 1963 1.219 291 1.510 1964 1.592 645 2.237 1965 530 431 961 1966 461 439 900 1967 209 367 576 1968 249 700 949 1969 298 592 890 1970 146 447 593 1971 136 373 509 1972 129 459 588 1973 124 521 645 1974 94 545 639 1975 213 682 895 1976 273 1.225 1.498 1977 426 2.269 2.695 1978 554 3.115 3.669 1979 549 3.556 4.105 1980 803 3.507 4.310 1981 825 3.245 4.070 1982 675 2.031 2.706 1983 478 2.022 2.500 1984 548 2.742 3.290 1985 461 2.124 2.585 1986 587 2.906 3.493 1987 708 2.988 3.696 1988 1.158 3.849 5.007 1989 1.076 3.944 5.020 1990 1.009 4.082 5.091 1991 1.094 5.602 6.696 1992 450 2.603 3.053 1993 383 2.244 2.627 1994 325 3.409 3.734 1995 342 3.389 3.731 1996 327 2.876 3.203 1997 385 3.406 3.791 1998 2.409 2.655 5.064 1999 8.363 3.175 11.538 2000 16.747 2.062 18.809 2001 13.217 1.432 14.649 2002 17.426 - 17.426 2003 40.953 - 40.953 2004 53.131 - 53.131 2005 57.356 - 57.356 2006 57.991 - 57.991 2007 55.974 - 55.974 2008 66.983 - 66.983 2009 62.713 - 62.713 2010 64.588 - 64.588 2011 60.456 - 60.456 2012 66.332 - 66.332 2013 129.653 - 129.653 2014 160.541 - 160.541 2015 170.569 - 170.569 2016 177.037 - 177.037 2017 197.970 - 197.970 2018 209.384 - 209.384 2019 188.173 - 188.173 2020 116.131 - 116.131 2021 171.775 - 171.775 2022 224.133 - 224.133 2023 209.701 - 209.701 ANO Year AUTOMÓVEIS Cars COMERCIAIS LEVES Light commercials TOTAL Total 1959 466 - 466 1960 310 - 310 1961 4 - 4 1962 538 - 538 1963 1.224 265 1.489 1964 1.578 644 2.222 1965 554 425 979 1966 432 427 859 1967 266 382 648 1968 247 674 921 1969 293 621 914 1970 146 443 589 1971 134 370 504 1972 127 462 589 1973 87 486 573 1974 74 471 545 1975 116 610 726 1976 256 1.193 1.449 1977 368 2.246 2.614 1978 499 3.074 3.573 1979 474 3.374 3.848 1980 612 3.408 4.020 1981 677 3.124 3.801 1982 651 1.977 2.628 1983 455 2.037 2.492 1984 508 2.701 3.209 1985 418 2.068 2.486 1986 567 2.870 3.437 1987 671 2.905 3.576 1988 1.090 3.621 4.711 1989 1.019 3.768 4.787 1990 984 4.022 5.006 1991 1.011 5.402 6.413 1992 442 2.771 3.213 1993 363 2.160 2.523 1994 317 3.369 3.686 1995 339 3.339 3.678 1996 323 2.837 3.160 1997 382 3.401 3.783 1998 2.186 2.642 4.828 1999 7.748 3.095 10.843 2000 13.494 2.060 15.554 2001 12.338 1.451 13.789 2002 17.272 67 17.339 2003 35.704 20 35.724 2004 42.172 5 42.177 2005 43.827 6 43.833 2006 44.221 2 44.223 2007 42.982 2 42.984 2008 48.365 2 48.367 2009 54.619 1 54.620 2010 55.029 1 55.030 2011 53.157 2 53.159 2012 63.336 1 63.337 2013 116.152 11 116.163 2014 129.712 13 129.725 2015 128.721 36 128.757 2016 132.539 34 132.573 2017 139.586 22 139.608 2018 140.390 25 140.415 2019 156.462 22 156.484 2020 93.043 10 93.053 2021 112.542 18 112.560 2022 127.830 17 127.847 2023 128.924 18 128.942 FONTES / SOURCES: ANFAVEA, RENAVAM/SENATRAN. * Os dados anteriores a 2002 referem-se a vendas internas no atacado. * Before 2002 the figures refer to domestic wholesales.
Unidades / Units
Unidades / Units
Toyota do Brasil Ltda.
Licenciamento de importados*
Licenciamento de nacionais e importados*
Registration
2024 | Anuário da Indústria Automobilística Brasileira | Brazilian Automotive Industry Yearbook | 109 2024 ANUÁRIO DA INDÚSTRIA AUTOMOBILÍSTICA BRASILEIRA Brazilian Automotive Industry Yearbook
imported
Registration of
vehicles*
of nationally manufactured and imported vehicles* ANO Year AUTOMÓVEIS Cars COMERCIAIS LEVES Light commercials TOTAL Total 1992 548 372 920 1993 4.309 919 5.228 1994 3.431 1.279 4.710 1995 6.240 2.804 9.044 1996 2.244 933 3.177 1997 7.257 4.150 11.407 1998 5.642 7.283 12.925 1999 1.598 4.053 5.651 2000 2.158 7.775 9.933 2001 2.495 7.636 10.131 2002 1.130 7.162 8.292 2003 910 5.842 6.752 2004 1.261 6.719 7.980 2005 3.218 13.853 17.071 2006 8.103 17.388 25.491 2007 9.744 19.356 29.100 ANO Year AUTOMÓVEIS Cars COMERCIAIS LEVES Light commercials TOTAL Total 2008 10.780 21.751 32.531 2009 7.883 31.006 38.889 2010 10.838 33.719 44.557 2011 12.776 33.300 46.076 2012 11.559 38.913 50.472 2013 17.485 42.640 60.125 2014 22.621 43.349 65.970 2015 14.561 32.925 47.486 2016 14.268 34.047 48.315 2017 16.684 34.382 51.066 2018 21.206 39.299 60.505 2019 19.990 40.425 60.415 2020 13.138 32.397 45.535 2021 15.022 45.899 60.921 2022 15.275 48.618 63.893 2023 18.008 46.214 64.222 ANO Year AUTOMÓVEIS Cars COMERCIAIS LEVES Light commercials TOTAL Total 1959 466 - 466 1960 310 - 310 1961 4 - 4 1962 538 - 538 1963 1.224 265 1.489 1964 1.578 644 2.222 1965 554 425 979 1966 432 427 859 1967 266 382 648 1968 247 674 921 1969 293 621 914 1970 146 443 589 1971 134 370 504 1972 127 462 589 1973 87 486 573 1974 74 471 545 1975 116 610 726 1976 256 1.193 1.449 1977 368 2.246 2.614 1978 499 3.074 3.573 1979 474 3.374 3.848 1980 612 3.408 4.020 1981 677 3.124 3.801 1982 651 1.977 2.628 1983 455 2.037 2.492 1984 508 2.701 3.209 1985 418 2.068 2.486 1986 567 2.870 3.437 1987 671 2.905 3.576 1988 1.090 3.621 4.711 1989 1.019 3.768 4 787 ANO Year AUTOMÓVEIS Cars COMERCIAIS LEVES Light commercials TOTAL Total 1990 984 4.022 5.006 1991 1.011 5.402 6.413 1992 990 3.143 4.133 1993 4.672 3.079 7.751 1994 3.748 4.648 8.396 1995 6.579 6.143 12.722 1996 2.567 3.770 6.337 1997 7.639 7.551 15.190 1998 7.828 9.925 17.753 1999 9.346 7.148 16.494 2000 15.652 9.835 25.487 2001 14.833 9.087 23.920 2002 18.402 7.229 25.631 2003 36.614 5.862 42.476 2004 43.433 6.724 50.157 2005 47.045 13.859 60.904 2006 52.324 17.390 69.714 2007 52.726 19.358 72.084 2008 59.145 21.753 80.898 2009 62.502 31.007 93.509 2010 65.867 33.720 99.587 2011 65.933 33.302 99.235 2012 74.895 38.914 113.809 2013 133.637 42.651 176.288 2014 152.333 43.362 195.695 2015 143.282 32.961 176.243 2016 146.807 34.081 180.888 2017 156.270 34.404 190.674 2018 161.596 39.324 200.920 2019 176.452 40.447 216.899 2020 106.181 32.407 138.588 2021 127.564 45.917 173.481 2022 143.105 48.635 191.740 2023 146.932 46.232 193.164 FONTES / SOURCES: ANFAVEA, RENAVAM/SENATRAN. NOTA / NOTE: Inclui Lexus a partir de 1997. / Includes Lexus from 1997. * Os dados anteriores a 2002 referem-se a vendas internas no atacado. * Before 2002 the figures refer to domestic wholesales.
/ Units
/ Units
Unidades
Unidades
Autoveículos: produção, vendas internas e exportações
Vehicles: production, domestic sales and exports
2.14 Informações por empresa (unidades) / 2.14 Information per company (units)
Toyota do Brasil Ltda.
Exportações / Exports
Unidades /
110 | Anuário da Indústria Automobilística Brasileira | Brazilian Automotive Industry Yearbook | 2024
ANO Year AUTOMÓVEIS Cars COMERCIAIS LEVES Light commercials TOTAL Total 1971 4 - 4 1972 2 - 2 1973 38 32 70 1974 18 77 95 1975 100 68 168 1976 16 29 45 1977 57 15 72 1978 51 44 95 1979 81 189 270 1980 164 89 253 1981 149 111 260 1982 37 13 50 1983 36 46 82 1984 40 41 81 1985 43 56 99 1986 20 36 56 1987 37 83 120 1988 66 225 291 1989 55 175 230 1990 19 57 76 1991 64 17 81 1992 22 63 85 1993 10 81 91 1994 - 29 29 1995 - 27 27 1996 6 54 60 1997 4 5 9 1998 6 15 21 1999 648 72 720 2000 2.820 - 2.820 2001 1.429 - 1.429 2002 1.193 - 1.193 2003 4.948 - 4.948 2004 10.907 - 10.907 2005 12.429 - 12.429 2006 16.064 - 16.064 2007 20.792 - 20.792 2008 19.560 - 19.560 2009 8.307 - 8.307 2010 10.982 - 10.982 2011 12.652 - 12.652 2012 16.152 - 16.152 2013 19.617 - 19.617 2014 33.275 - 33.275 2015 39.023 - 39.023 2016 44.602 - 44.602 2017 57.974 - 57.974 2018 66.506 - 66.506 2019 30.273 - 30.273 2020 29.393 - 29.393 2021 58.223 - 58.223 2022 95.395 - 95.395 2023 82.419 - 82.419
Units FONTE / SOURCE: ANFAVEA
Volkswagen do Brasil Indústria de Veículos Automotores Ltda.
Produção Production

Licenciamento de nacionais*
Registration of nationally manufactured vehicles*
2024 | Anuário da Indústria Automobilística Brasileira | Brazilian Automotive Industry Yearbook | 111 2024 ANUÁRIO DA INDÚSTRIA AUTOMOBILÍSTICA BRASILEIRA Brazilian Automotive Industry Yearbook
ANO Year AUTOMÓVEIS Cars COMERCIAIS LEVES Light commercials TOTAL Total 1957 - 371 371 1958 - 4.819 4.819 1959 8.445 8.383 16.828 1960 17.059 11.299 28.358 1961 31.025 16.315 47.340 1962 39.189 14.563 53.752 1963 44.230 14.428 58.658 1964 54.040 12.378 66.418 1965 61.917 13.114 75.031 1966 80.024 15.098 95.122 1967 94.830 21.172 116.002 1968 128.089 26.883 154.972 1969 149.927 28.253 178.180 1970 202.806 30.205 233.011 1971 266.965 28.760 295.725 1972 307.915 35.618 343.533 1973 333.751 45.619 379.370 1974 406.611 52.343 458.954 1975 443.185 59.395 502.580 1976 463.356 66.280 529.636 1977 429.048 43.144 472.192 1978 467.040 51.563 518.603 1979 475.366 50.337 525.703 1980 467.974 46.263 514.237 1981 254.003 41.300 295.303 1982 270.167 53.975 324.142 1983 310.778 30.576 341.354 1984 266.066 36.631 302.697 1985 307.457 38.525 345.982 1986 333.359 39.332 372.691 1987 270.153 39.026 309.179 1988 313.958 48.035 361.993 1989 268.940 46.649 315.589 1990 234.978 45.708 280.686 1991 240.680 46.635 287.315 1992 288.784 55.484 344.268 1993 379.920 71.873 451.793 1994 415.859 82.684 498.543 1995 492.645 89.753 582.398 1996 524.516 90.760 615.276 1997 552.575 89.658 642.233 1998 406.858 71.518 478.376 1999 334.373 43.216 377.589 2000 440.989 49.882 490.871 2001 466.462 51.564 518.026 2002 451.865 42.101 493.966 2003 412.411 28.786 441.197 2004 608.740 37.631 646.371 2005 657.657 35.667 693.324 2006 685.007 46.960 731.967 2007 742.305 54.656 796.961 2008 779.978 68.911 848.889 2009 790.672 66.877 857.549 2010 968.649 98.456 1.067.105 2011 718.591 109.853 828.444 2012 747.782 104.304 852.086 2013 640.944 120.249 761.193 2014 500.080 96.422 596.502 2015 347.133 75.397 422.530 2016 277.426 47.460 324.886 2017 341.908 66.431 408.339 2018 374.241 59.225 433.466 2019 424.584 54.656 479.240 2020 304.773 41.146 345.919 2021 339.695 40.212 379.907 2022 300.123 46.282 346.405 2023 298.927 68.398 367.325 ANO Year AUTOMÓVEIS Cars COMERCIAIS LEVES Light commercials TOTAL Total 1957 - 370 370 1958 - 4.794 4.794 1959 8.406 8.346 16.752 1960 17.033 11.267 28.300 1961 31.014 16.306 47.320 1962 39.152 14.516 53.668 1963 44.224 14.430 58.654 1964 53.685 12.254 65.939 1965 62.210 13.230 75.440 1966 80.034 15.086 95.120 1967 94.683 21.147 115.830 1968 128.064 26.867 154.931 1969 148.134 28.132 176.266 1970 204.451 30.360 234.811 1971 262.496 27.787 290.283 1972 295.786 34.672 330.458 1973 328.161 43.225 371.386 1974 355.514 45.763 401.277 1975 391.215 52.114 443.329 1976 402.258 59.556 461.814 1977 379.363 41.362 420.725 1978 407.374 44.675 452.049 1979 423.997 40.660 464.657 1980 385.775 30.023 415.798 1981 205.290 24.771 230.061 1982 249.728 36.952 286.680 1983 253.226 28.072 281.298 1984 221.762 34.161 255.923 1985 235.834 32.744 268.578 1986 278.584 36.507 315.091 1987 144.414 33.245 177.659 1988 218.903 41.109 260.012 1989 212.362 42.884 255.246 1990 212.844 44.188 257.032 1991 219.218 42.440 261.658 1992 228.650 47.999 276.649 1993 315.377 62.736 378.113 1994 348.509 71.754 420.263 1995 426.782 83.930 510.712 1996 445.057 82.282 527.339 1997 430.877 80.422 511.299 1998 291.760 59.615 351.375 1999 287.793 38.287 326.080 2000 335.345 42.046 377.391 2001 356.090 45.457 401.547 2002 311.584 39.240 350.824 2003 262.899 26.902 289.801 2004 299.055 30.301 329.356 2005 326.748 27.124 353.872 2006 356.685 37.946 394.631 2007 451.974 48.197 500.171 2008 487.704 58.717 546.421 2009 575.853 57.396 633.249 2010 573.309 88.373 661.682 2011 546.311 96.021 642.332 2012 614.400 92.546 706.946 2013 505.879 97.596 603.475 2014 432.091 87.319 519.410 2015 263.488 56.850 320.338 2016 172.883 33.973 206.856 2017 205.542 42.446 247.988 2018 284.454 45.941 330.395 2019 322.522 42.290 364.812 2020 271.775 30.977 302.752 2021 253.544 26.765 280.309 2022 227.344 23.430 250.774 2023 271.289 46.633 317.922 FONTES / SOURCES: ANFAVEA, RENAVAM/SENATRAN. NOTA - Em vendas internas/licenciamento Inclui Audi de 1994 a 2013. / NOTE - In domestic sales / licensing / includes Audi from 1994 to 2013 *Os dados anteriores a 2002 referem-se a vendas internas no atacado. / *Before 2002 the figures refer to domestic wholesales.
/
Unidades / Units
Unidades
Units
Autoveículos: produção, vendas internas e exportações
Vehicles: production, domestic sales and exports
2.14 Informações por empresa (unidades) / 2.14 Information per company (units)
Volkswagen do Brasil Indústria de Veículos Automotores Ltda.
Licenciamento de importados*
Registration of imported vehicles*
Licenciamento de nacionais e importados*
Registration
112 | Anuário da Indústria Automobilística Brasileira | Brazilian Automotive Industry Yearbook | 2024
of nationally manufactured
imported
ANO Year AUTOMÓVEIS Cars COMERCIAIS LEVES Light commercials TOTAL Total 1992 3.784 - 3.784 1993 10.252 - 10.252 1994 20.286 - 20.286 1995 67.056 - 67.056 1996 59.003 - 59.003 1997 69.786 - 69.786 1998 75.367 833 76.200 1999 30.840 4.069 34.909 2000 12.518 2.108 14.626 2001 13.626 1.340 14.966 2002 5.838 497 6.335 2003 1.439 46 1.485 2004 2.352 11 2.363 2005 1.854 2 1.856 2006 18.179 2 18.181 2007 40.061 - 40.061 ANO Year AUTOMÓVEIS Cars COMERCIAIS LEVES Light commercials TOTAL Total 2008 40.189 4 40.193 2009 53.156 3 53.159 2010 35.550 3.389 38.939 2011 51.303 10.230 61.533 2012 46.580 19.831 66.411 2013 45.760 24.198 69.958 2014 39.363 17.892 57.255 2015 26.967 12.217 39.184 2016 12.444 9.173 21.617 2017 12.162 11.968 24.130 2018 17.750 18.767 36.517 2019 27.276 18.918 46.194 2020 14.339 10.619 24.958 2021 14.103 7.895 21.998 2022 12.366 6.014 18.380 2023 19.137 7.982 27.119 ANO Year AUTOMÓVEIS Cars COMERCIAIS LEVES Light commercials TOTAL Total 1957 - 370 370 1958 - 4.794 4.794 1959 8.406 8.346 16.752 1960 17.033 11.267 28.300 1961 31.014 16.306 47.320 1962 39.152 14.516 53.668 1963 44.224 14.430 58.654 1964 53.685 12.254 65.939 1965 62.210 13.230 75.440 1966 80.034 15.086 95.120 1967 94.683 21.147 115.830 1968 128.064 26.867 154.931 1969 148.134 28.132 176.266 1970 204.451 30.360 234.811 1971 262.496 27.787 290.283 1972 295.786 34.672 330.458 1973 328.161 43.225 371.386 1974 355.514 45.763 401.277 1975 391.215 52.114 443.329 1976 402.258 59.556 461.814 1977 379.363 41.362 420.725 1978 407.374 44.675 452.049 1979 423.997 40.660 464.657 1980 385.775 30.023 415.798 1981 205.290 24.771 230.061 1982 249.728 36.952 286.680 1983 253.226 28.072 281.298 1984 221.762 34.161 255.923 1985 235.834 32.744 268.578 1986 278.584 36.507 315.091 1987 144 414 33 245 177.659 1988 218 903 41 109 260.012 ANO Year AUTOMÓVEIS Cars COMERCIAIS LEVES Light commercials TOTAL Total 1989 212 362 42 884 255.246 1990 212.844 44.188 257.032 1991 219.218 42.440 261.658 1992 232.434 47.999 280.433 1993 325.629 62.736 388.365 1994 368.795 71.754 440.549 1995 493.838 83.930 577.768 1996 504.060 82.282 586.342 1997 500.663 80.422 581.085 1998 367.127 60.448 427.575 1999 318.633 42.356 360.989 2000 347.863 44.154 392.017 2001 369.716 46.797 416.513 2002 317.422 39.737 357.159 2003 264.338 26.948 291.286 2004 301.407 30.312 331.719 2005 328.602 27.126 355.728 2006 374.864 37.948 412.812 2007 492.035 48.197 540.232 2008 527.893 58.721 586.614 2009 629.009 57.399 686.408 2010 608.859 91.762 700.621 2011 597.614 106.251 703.865 2012 660.980 112.377 773.357 2013 551.639 121.794 673.433 2014 471.454 105.211 576.665 2015 290.455 69.067 359.522 2016 185.327 43.146 228.473 2017 217.704 54.414 272.118 2018 302.204 64.708 366.912 2019 349.798 61.208 411.006 2020 286.114 41.596 327.710 2021 267.647 34.660 302.307 2022 239.710 29.444 269.154 2023 290.426 54.615 345.041 FONTES / SOURCES: ANFAVEA, RENAVAM/SENATRAN. * Os dados anteriores a 2002 referem-se a vendas internas no atacado. / * Before 2002 the figures refer to domestic wholesales. NOTA / NOTE: Em vendas internas/licenciamento, inclui Audi de 1994 a 2013. / In domestic sales/licensing, includes Audi from 1994 to 2013.
and
vehicles*
Unidades / Units
Unidades
/ Units
Volkswagen do Brasil Indústria de Veículos Automotores Ltda.
Exportações / Exports
Unidades /
2024 | Anuário da Indústria Automobilística Brasileira | Brazilian Automotive Industry Yearbook | 113 2024 ANUÁRIO DA INDÚSTRIA AUTOMOBILÍSTICA BRASILEIRA Brazilian Automotive Industry Yearbook
ANO Year AUTOMÓVEIS Cars COMERCIAIS LEVES Light commercials TOTAL Total 1970 13 8 21 1971 552 486 1.038 1972 6.388 816 7.204 1973 13.656 1.861 15.517 1974 47.028 6.499 53.527 1975 51.523 7.649 59.172 1976 59.853 6.141 65.994 1977 51.444 2.298 53.742 1978 59.170 5.200 64.370 1979 48.506 8.954 57.460 1980 57.137 15.085 72.222 1981 65.013 17.856 82.869 1982 23.607 13.652 37.259 1983 56.642 6.645 63.287 1984 46.172 3.156 49.328 1985 68.922 5.672 74.594 1986 53.246 3.313 56.559 1987 130.947 5.994 136.941 1988 96.058 5.808 101.866 1989 57.049 5.001 62.050 1990 20.122 1.340 21.462 1991 22.812 4.173 26.985 1992 60.002 7.671 67.673 1993 64.879 9.131 74.010 1994 69.230 10.748 79.978 1995 65.288 5.691 70.979 1996 78.783 7.786 86.569 1997 118.211 9.078 127.289 1998 116.913 11.597 128.510 1999 45.958 5.787 51.745 2000 105.372 7.639 113.011 2001 113.200 6.498 119.698 2002 133.660 3.573 137.233 2003 159.936 3.928 163.864 2004 302.197 6.470 308.667 2005 327.072 8.514 335.586 2006 332.577 8.037 340.614 2007 287.577 6.556 294.133 2008 299.139 9.729 308.868 2009 204.527 6.183 210.710 2010 382.318 10.233 392.551 2011 168.953 9.390 178.343 2012 127.702 15.041 142.743 2013 131.075 17.836 148.911 2014 78.499 13.776 92.275 2015 105.040 19.903 124.943 2016 94.093 12.485 106.578 2017 132.257 24.267 156.524 2018 85.159 18.651 103.810 2019 91.628 12.099 103.727 2020 61.244 11.392 72.636 2021 83.096 14.080 97.176 2022 68.006 20.842 88.848 2023 39.619 23.319 62.938
Units FONTE / SOURCE: ANFAVEA
Autoveículos: produção, vendas internas e exportações
Vehicles: production, domestic sales and exports
2.14 Informações por empresa (unidades) / 2.14 Information per company (units)
Volkswagen Truck & Bus Indústria e Comércio de Veículos Ltda.
Licenciamento de nacionais*
Registration of nationally manufactured vehicles*
Licenciamento de importados
Registration

114 | Anuário da Indústria Automobilística Brasileira | Brazilian Automotive Industry Yearbook | 2024
ANO Year COMERCIAIS LEVES Light commercials CAMINHÕES Trucks ÔNIBUS Buses TOTAL Total 1981 - 1.344 - 1.344 1982 - 2.060 - 2.060 1983 - 2.561 - 2.561 1984 - 5.016 - 5.016 1985 - 10.010 - 10.010 1986 - 14.516 - 14.516 1987 - 9.883 46 9.929 1988 - 7.536 141 7.677 1989 - 6.419 140 6.559 1990 - 7.106 101 7.207 1991 - 5.408 105 5.513 1992 - 2.981 73 3.054 1993 - 5.113 1.099 6.212 1994 - 8.381 1.289 9.670 1995 - 10.636 1.549 12.185 1996 - 7.417 1.320 8.737 1997 - 8.337 2.301 10.638 1998 - 8.700 2.521 11.221 1999 - 9.573 1.760 11.333 2000 - 13.660 3.451 17.111 2001 - 17.844 3.985 21.829 2002 - 17.511 4.356 21.867 2003 - 20.058 4.590 24.648 2004 - 23.753 4.395 28.148 2005 - 23.238 3.457 26.695 2006 - 22.524 4.771 27.295 2007 - 28.946 6.380 35.326 2008 - 36.835 7.622 44.457 2009 - 33.353 6.169 39.522 2010 - 45.281 7.523 52.804 2011 - 50.824 11.139 61.963 2012 - 41.422 8.037 49.459 2013 - 40.832 9.025 49.857 2014 - 36.157 6.481 42.638 2015 - 19.537 3.659 23.196 2016 - 13.686 1.798 15.484 2017 - 14.207 2.176 16.383 2018 1.312 20.242 3.417 24.971 2019 3.497 26.740 5.509 35.746 2020 3.381 25.586 4.246 33.213 2021 3.545 37.462 3.695 44.702 2022 2.127 34.506 4.671 41.304 2023 1.898 27.018 4.490 33.406
of imported vehicles ANO Year CAMINHÕES Trucks TOTAL Total 2010 40 40 2011 6 6 2012 -2013 2 2 2014 -2015 6 6 2016 4 4 2017 -2018 -2019 -2020 -2021 1 1 2022 1 1 2023 -* Os dados anteriores a 2002 referem-se a vendas internas no atacado. * Before 2002 the figures refer to domestic wholesales. Unidades / Units Unidades / Units
Volkswagen Truck & Bus Indústria e Comércio de Veículos Ltda.
Licenciamento de nacionais e importados*
Registration of nationally manufactured and imported vehicles*

2024 | Anuário da Indústria Automobilística Brasileira | Brazilian Automotive Industry Yearbook | 115 2024 ANUÁRIO DA INDÚSTRIA AUTOMOBILÍSTICA BRASILEIRA Brazilian Automotive Industry Yearbook
ANO Year COMERCIAIS LEVES Light commercials CAMINHÕES Trucks ÔNIBUS Buses TOTAL Total 1981 - 1.344 - 1.344 1982 - 2.060 - 2.060 1983 - 2.561 - 2.561 1984 - 5.016 - 5.016 1985 - 10.010 - 10.010 1986 - 14.516 - 14.516 1987 - 9.883 46 9.929 1988 - 7.536 141 7.677 1989 - 6.419 140 6.559 1990 - 7.106 101 7.207 1991 - 5.408 105 5.513 1992 - 2.981 73 3.054 1993 - 5.113 1.099 6.212 1994 - 8.381 1.289 9.670 1995 - 10.636 1.549 12.185 1996 - 7.417 1.320 8.737 1997 - 8.337 2.301 10.638 1998 - 8.700 2.521 11.221 1999 - 9.573 1.760 11.333 2000 - 13.660 3.451 17.111 2001 - 17.844 3.985 21.829 2002 - 17.511 4.356 21.867 2003 - 20.058 4.590 24.648 2004 - 23.753 4.395 28.148 2005 - 23.238 3.457 26.695 2006 - 22.524 4.771 27.295 2007 - 28.946 6.380 35.326 2008 - 36.835 7.622 44.457 2009 - 33.353 6.169 39.522 2010 - 45.321 7.523 52.844 2011 - 50.830 11.139 61.969 2012 - 41.422 8.037 49.459 2013 - 40.834 9.025 49.859 2014 - 36.157 6.481 42.638 2015 - 19.543 3.659 23.202 2016 - 13.690 1.798 15.488 2017 - 14.207 2.176 16.383 2018 1.312 20.242 3.417 24.971 2019 3.497 26.740 5.509 35.746 2020 3.381 25.586 4.246 33.213 2021 3.545 37.462 3.695 44.702 2022 2.127 34.506 4.671 41.304 2023 1.898 27.018 4.490 33.406 FONTES / SOURCES: ANFAVEA, RENAVAM/SENATRAN. * Os dados anteriores a 2002 referem-se a vendas internas no atacado. * Before 2002 the figures refer to domestic wholesales.
Unidades / Units
Autoveículos: produção, vendas internas e exportações
Vehicles: production, domestic sales and exports
2.14 Informações por empresa (unidades) / 2.14 Information per company (units)
Volvo do Brasil Veículos Ltda.
Licenciamento de nacionais*
Registration of nationally manufactured vehicles*
Unidades / Units
116 | Anuário da Indústria Automobilística Brasileira | Brazilian Automotive Industry Yearbook | 2024
ANO Year CAMINHÕES Trucks ÔNIBUS Buses TOTAL Total 1979 - 13 13 1980 64 298 362 1981 458 279 737 1982 771 397 1.168 1983 1.049 392 1.441 1984 1.357 309 1.666 1985 2.028 503 2.531 1986 2.232 530 2.762 1987 2.099 609 2.708 1988 2.368 715 3.083 1989 2.409 656 3.065 1990 2.908 854 3.762 1991 2.215 1.069 3.284 1992 2.352 951 3.303 1993 4.451 667 5.118 1994 5.134 821 5.955 1995 5.531 1.012 6.543 1996 3.426 1.168 4.594 1997 4.332 920 5.252 1998 4.030 1.085 5.115 1999 3.226 456 3.682 2000 4.032 608 4.640 2001 4.209 514 4.723 2002 4.213 345 4.558 2003 4.526 246 4.772 2004 6.287 184 6.471 2005 6.184 141 6.325 2006 5.963 224 6.187 2007 7.907 202 8.109 2008 9.644 431 10.075 2009 8.785 211 8.996 2010 15.314 561 15.875 2011 19.066 1.350 20.416 2012 15.876 1.687 17.563 2013 20.730 1.661 22.391 2014 19.708 1.706 21.414 2015 8.345 864 9.209 2016 5.614 642 6.256 2017 5.953 341 6.294 2018 10.640 430 11.070 2019 16.842 744 17.586 2020 14.975 444 15.419 2021 21.823 368 22.191 2022 24.091 658 24.749 2023 19.639 698 20.337 FONTES / SOURCES: ANFAVEA, RENAVAM/SENATRAN. * Os dados anteriores a 2002 referem-se a vendas internas no atacado. * Before 2002 the figures refer to domestic wholesales.
Volvo do Brasil Veículos Ltda.
Licenciamento de importados*
Registration of imported vehicles*
Licenciamento de nacionais e importados*
Registration
2024 | Anuário da Indústria Automobilística Brasileira | Brazilian Automotive Industry Yearbook | 117
ANUÁRIO DA INDÚSTRIA AUTOMOBILÍSTICA BRASILEIRA Brazilian Automotive Industry Yearbook
2024
of nationally manufactured
vehicles* ANO Year CAMINHÕES Trucks ÔNIBUS Buses TOTAL Total 1994 402 52 454 1995 289 - 289 1996 143 1 144 1997 177 - 177 1998 64 - 64 1999 3 2 5 2000 - -2001 - -2002 1 - 1 2003 - -2004 1 - 1 2005 1 - 1 2006 - -2007 1 - 1 2008 - -ANO Year CAMINHÕES Trucks ÔNIBUS Buses TOTAL Total 2009 - -2010 - 1 1 2011 3 - 3 2012 2 - 2 2013 1 - 1 2014 24 - 24 2015 4 - 4 2016 - 2 2 2017 - -2018 2 - 2 2019 2 - 2 2020 1 - 1 2021 - -2022 2 - 2 2023 8 2 10 ANO Year CAMINHÕES Trucks ÔNIBUS Buses TOTAL Total 1979 - 13 13 1980 64 298 362 1981 458 279 737 1982 771 397 1.168 1983 1.049 392 1.441 1984 1.357 309 1.666 1985 2.028 503 2.531 1986 2.232 530 2.762 1987 2.099 609 2.708 1988 2.368 715 3.083 1989 2.409 656 3.065 1990 2.908 854 3.762 1991 2.215 1.069 3.284 1992 2.352 951 3.303 1993 4.451 667 5.118 1994 5.536 873 6.409 1995 5.820 1.012 6.832 1996 3.569 1.169 4.738 1997 4.509 920 5.429 1998 4.094 1.085 5.179 1999 3.229 458 3.687 2000 4.032 608 4.640 2001 4.209 514 4.723 ANO Year CAMINHÕES Trucks ÔNIBUS Buses TOTAL Total 2002 4.214 345 4.559 2003 4.526 246 4.772 2004 6.288 184 6.472 2005 6.185 141 6.326 2006 5.963 224 6.187 2007 7.908 202 8.110 2008 9.644 431 10.075 2009 8.785 211 8.996 2010 15.314 562 15.876 2011 19.069 1.350 20.419 2012 15.878 1.687 17.565 2013 20.731 1.661 22.392 2014 19.732 1.706 21.438 2015 8.349 864 9.213 2016 5.614 644 6.258 2017 5.953 341 6.294 2018 10.642 430 11.072 2019 16.844 744 17.588 2020 14.976 444 15.420 2021 21.823 368 22.191 2022 24.093 658 24.751 2023 19.647 700 20.347 FONTES / SOURCES: ANFAVEA, RENAVAM/SENATRAN. * Os dados anteriores a 2002 referem-se a vendas internas no atacado. / * Before 2002 the figures refer to domestic wholesales.
and imported
/ Units Unidades / Units
Unidades
Autoveículos: produção, vendas internas e exportações
Vehicles: production, domestic sales and exports
2.15 Licenciamento de autoveículos por empresa e tipo - 2022/2023 (unidades)
2.15 Registration of new vehicles per company and type - 2022/2023 (units)
118 | Anuário da Indústria Automobilística Brasileira | Brazilian Automotive Industry Yearbook | 2024
EMPRESA Company AUTOMÓVEIS Cars COMERCIAIS LEVES Light commercials CAMINHÕES Trucks ÔNIBUS Buses TOTAL Total AGRALE - 2 90 2.910 3.002 AUDI 6.539 - - - 6.539 BMW 16.695 - - - 16.695 CAOA 32.740 218 317 - 33.275 DAF - - 8.344 - 8.344 FCA FIAT CHRYSLER 404.039 210.750 4.853 - 619.642 FORD 3.194 25.707 56 - 28.957 GENERAL MOTORS 271.789 56.356 36 - 328.181 HONDA 72.050 - - - 72.050 HPE 7.057 12.663 - - 19.720 HYUNDAI 185.016 - - - 185.016 JAGUAR LAND ROVER 5.373 12 - - 5.385 MAN - 1.898 27.018 4.490 33.406 MERCEDES-BENZ - - 22.981 11.246 34.227 MERCEDES-BENZ CARS&VANS 4.069 5.345 2.218 - 11.632 NISSAN 64.166 8.392 - - 72.558 ON-HIGHWAY (IVECO) - 2.341 9.350 582 12.273 PEUGEOT CITROËN 61.493 5.596 118 - 67.207 RENAULT 102.717 23.490 - - 126.207 SCANIA - - 12.443 467 12.910 TOYOTA 146.932 46.232 - - 193.164 VOLKSWAGEN 290.426 54.615 - - 345.041 VOLVO - - 19.647 700 20.347 OUTRAS EMPRESAS 47.105 5.213 553 40 52.911 TOTAL 1.721.400 458.830 108.024 20.435 2.308.689 EMPRESA Company AUTOMÓVEIS Cars COMERCIAIS LEVES Light commercials CAMINHÕES Trucks ÔNIBUS Buses TOTAL Total AGRALE - 1 76 2.939 3.016 AUDI 5.487 - - - 5.487 BMW 15.007 - - - 15.007 CAOA 38.268 648 245 - 39.161 DAF - - 6.793 - 6.793 FCA FIAT CHRYSLER 380.703 188.987 3.265 - 572.955 FORD 3.134 17.847 64 - 21.045 GENERAL MOTORS 264.300 27.193 21 - 291.514 HONDA 56.700 - - - 56.700 HPE 8.044 15.831 - - 23.875 HYUNDAI 184.417 - - - 184.417 JAGUAR LAND ROVER 4.046 3 - - 4.049 MAN - 2.127 34.506 4.671 41.304 MERCEDES-BENZ - - 30.568 8.158 38.726 MERCEDES-BENZ CARS&VANS 4.993 6.154 2.431 - 13.578 NISSAN 44.998 8.675 - - 53.673 ON-HIGHWAY (IVECO) - 3.562 10.609 584 14.755 PEUGEOT CITROËN 65.248 8.598 55 - 73.901 RENAULT 104.695 22.013 - - 126.708 SCANIA - - 13.223 287 13.510 TOYOTA 143.105 48.635 - - 191.740 VOLKSWAGEN 239.710 29.444 - - 269.154 VOLVO - - 24.093 658 24.751 OUTRAS EMPRESAS 13.807 4.081 694 60 18.642 TOTAL 1.576.662 383.799 126.643 17.357 2.104.461 2023 2022 Fonte: Renavam / DENATRAN / Source: Renavam / DENATRAN Unidades / Units Unidades / Units FONTES / SOURCES: RENAVAM/SENATRAN.
CAPÍTULO 3
Agricultural and highway construction machinery: production, domestic sales and exports
Máquinas agrícolas e rodoviárias: produção, vendas internas e exportações 3 ASSOCIAÇÃO NACIONAL DOS FABRICANTES
CHAPTER 3
DE VEÍCULOS AUTOMOTORES
Máquinas agrícolas e rodoviárias: produção, vendas internas e exportações
Agricultural and highway construction machinery: production, domestic sales and exports
3.1 Produção - 1960/2020 (unidades) / 3.1 Production - 1960/2020 (units)
/
1 Informações sobre colheitadeiras de grãos disponíveis a partir de 1976 / Information on production is available starting from 1976.
2 Desde 2003, não há empresas associadas à ANFAVEA fabricantes de cultivadores motorizados. / Since 2003, there is no tiller assembling company associated to ANFAVEA.
3 Informações sobre produção de colhedoras de cana disponíveis a partir de 2013. / Information on production of sugarcane combines is available starting from 2013.
4 As informações, a partir de 2017, referem-se somente a empresas associadas à ANFAVEA. / As from 2017, the data refer only companies associated to ANFAVEA.
5 Retroescavadeiras - Em 2019 inclui os dados de mais uma empresa associada. / Backhoes - In 2019 includes data from one more associated.
120 | Anuário da Indústria Automobilística Brasileira | Brazilian Automotive Industry Yearbook | 2024
ANO Year CULTIVADORES MOTORIZADOS Tillers TRATORES DE RODAS Wheel tractors TRATORES DE ESTEIRAS Crawler tractors COLHEITADEIRAS DE GRÃOS Grain combines COLHEDORAS DE CANA Sugarcane combines RETROESCAVADEIRAS Loaders & backhoes TOTAL Total 1960 - 37 - - - - 37 1961 751 1.679 - - - - 2.430 1962 1.240 7.586 - - - - 8.826 1963 1.110 9.908 - - - - 11.018 1964 1.765 11.537 - - - - 13.302 1965 2.403 8.401 - - - - 10.804 1966 3.336 9.360 13 - - - 12.709 1967 2.500 6.295 73 - - - 8.868 1968 2.463 9.819 106 - - - 12.388 1969 1.946 9.841 91 - - 41 11.919 1970 2.065 14.326 185 - - 131 16.707 1971 2.190 22.192 770 - - 296 25.448 1972 2.916 29.754 1.426 - - 653 34.749 1973 3.466 38.705 1.961 - - 977 45.109 1974 5.463 46.060 2.678 - - 1.338 55.539 1975 5.606 58.301 3.942 - - 1.545 69.394 1976 5.275 64.175 4.631 6.481 - 2.070 82.632 1977 5.384 52.227 3.474 4.242 - 1.569 66.896 1978 5.522 47.640 2.981 3.719 - 2.436 62.298 1979 6.062 54.599 3.202 4.228 - 2.153 70.244 1980 6.896 57.974 4.285 6.003 - 2.320 77.478 1981 4.548 39.138 3.133 4.891 - 1.998 53.708 1982 5.364 30.126 1.900 3.434 - 1.245 42.069 1983 3.213 22.663 751 3.323 - 449 30.399 1984 2.595 45.523 1.348 5.806 - 960 56.232 1985 3.300 43.398 1.762 6.427 - 1.328 56.215 1986 7.128 50.450 2.409 6.747 - 2.236 68.970 1987 4.313 46.702 2.677 6.727 - 2.249 62.668 1988 2.026 39.147 2.596 5.651 - 2.056 51.476 1989 3.007 31.715 2.038 5.020 - 1.900 43.680 1990 2.519 24.223 1.746 2.971 - 1.655 33.114 1991 1.886 15.868 1.068 1.959 - 1.419 22.200 1992 1.790 15.648 989 2.445 - 1.212 22.084 1993 1.403 24.500 1.234 3.445 - 1.595 32.177 1994 1.538 41.094 1.705 5.326 - 1.670 51.333 1995 1.568 21.044 1.875 2.371 - 1.480 28.338 1996 926 15.545 1.543 2.531 - 1.644 22.189 1997 844 22.464 2.035 3.715 - 2.599 31.657 1998 692 24.092 2.072 4.063 - 2.493 33.412 1999 778 20.911 1.248 3.760 - 1.524 28.221 2000 813 27.546 1.429 4.296 - 1.417 35.501 2001 947 34.781 1.351 5.196 - 2.064 44.339 2002 1.079 40.352 1.665 6.851 - 2.063 52.010 2003 1.597 47.109 1.520 9.195 - 1.605 61.026 2004 1.703 52.768 2.229 10.443 - 2.275 69.418 2005 2.183 40.871 2.681 4.229 - 2.907 52.871 2006 1.940 35.586 2.781 2.314 - 3.444 46.065 2007 1.722 50.719 3.347 5.148 - 4.067 65.003 2008 1.751 66.504 3.415 8.407 - 4.915 84.992 2009 1.832 55.024 986 4.503 - 3.865 66.210 2010 1.922 71.763 2.234 7.007 - 5.948 88.874 2011 1.350 63.427 2.929 7.630 - 6.177 81.513 2012 1.404 64.456 2.939 7.485 - 7.420 83.704 2013 1.595 77.597 2.337 10.106 1.460 8.950 102.045 2014 1.566 64.793 2.765 7.623 1.025 5.581 83.353 2015 1.162 44.349 1.413 3.889 676 4.449 55.938 2016 803 43.442 1.152 4.889 870 2.876 54.032 2017 - 41.093 2.107 5.513 1.039 3.291 53.043 2018 - 49.851 4.071 6.552 982 4.200 65.656 2019 - 35.572 4.262 6.310 832 6.149 53.125 2020 - 33.981 2.769 4.985 780 5.345 47.860 FONTE
SOURCE: ANFAVEA. NOTAS
NOTES:
/
Unidades / Units
3.2 Vendas internas no atacado - 1960/2020 (unidades) / 3.2 Domestic wholesales - 1960/2020 (units)
2024 | Anuário da Indústria Automobilística Brasileira | Brazilian Automotive Industry Yearbook | 121 2024 ANUÁRIO DA INDÚSTRIA AUTOMOBILÍSTICA BRASILEIRA Brazilian Automotive Industry Yearbook
NACIONAIS E IMPORTADAS / NATIONALLY MANUFACTURED AND IMPORTED ANO Year CULTIVADORES MOTORIZADOS Tillers TRATORES DE RODAS Wheel tractors TRATORES DE ESTEIRAS Crawler tractors COLHEITADEIRAS DE GRÃOS Grain combines COLHEDORAS DE CANA Sugarcane combines RETROESCAVADEIRAS Loaders & backhoes TOTAL Total 1960 - 37 - - - - 37 1961 751 1.679 - - - - 2.430 1962 1.240 7.586 - - - - 8.826 1963 1.110 9.908 - - - - 11.018 1964 1.765 11.535 - - - - 13.300 1965 2.403 8.401 - - - - 10.804 1966 3.120 9.543 - - - - 12.663 1967 1.971 6.506 72 - - - 8.549 1968 2.535 9.376 104 - - - 12.015 1969 2.081 9.977 54 - - 5 12.117 1970 2.241 14.586 24 - - 154 17.005 1971 2.215 21.947 807 - - 270 25.239 1972 2.619 29.254 1.419 - - 650 33.942 1973 3.543 38.918 1.869 - - 980 45.310 1974 5.147 45.226 2.373 - - 1.309 54.055 1975 5.378 57.101 3.615 - - 1.478 67.572 1976 5.537 62.700 4.719 5.315 - 1.944 80.215 1977 5.152 47.815 3.251 5.127 - 1.518 62.863 1978 5.251 41.017 2.570 3.457 - 1.627 53.922 1979 6.165 48.963 3.140 5.087 - 1.885 65.240 1980 6.225 50.195 3.753 5.410 - 2.070 67.653 1981 4.724 27.949 2.393 4.522 - 837 40.425 1982 5.157 24.615 1.503 3.285 - 618 35.178 1983 2.996 22.546 877 3.512 - 569 30.500 1984 2.566 41.645 1.198 5.469 - 825 51.703 1985 3.139 40.736 1.600 5.775 - 1.215 52.465 1986 6.558 45.297 2.245 6.544 - 2.146 62.790 1987 3.593 38.815 2.010 5.747 - 2.022 52.187 1988 1.854 29.921 1.360 4.753 - 1.596 39.484 1989 2.617 26.310 1.493 3.942 - 1.527 35.889 1990 1.911 21.241 1.140 2.350 - 1.562 28.204 1991 1.983 13.495 589 1.718 - 1.159 18.944 1992 1.570 11.727 532 2.004 - 1.011 16.844 1993 1.096 21.396 908 2.735 - 1.272 27.407 1994 1.308 38.518 1.184 4.049 - 1.428 46.487 1995 1.210 17.594 1.178 1.423 - 1.334 22.739 1996 714 10.312 505 900 - 1.493 13.924 1997 707 16.049 842 1.709 - 2.158 21.465 1998 587 18.677 795 2.524 - 2.270 24.853 1999 629 19.205 646 2.906 - 1.310 24.696 2000 722 24.591 592 3.780 - 1.377 31.062 2001 856 28.203 496 4.098 - 1.870 35.523 2002 1.050 33.217 551 5.648 - 2.102 42.568 2003 1.585 29.476 449 5.440 - 1.045 37.995 2004 1.682 28.803 526 5.605 - 1.174 37.790 2005 2.141 17.729 408 1.534 - 1.410 23.222 2006 1.857 20.435 300 1.030 - 2.050 25.672 2007 1.548 31.300 437 2.377 - 2.675 38.337 2008 1.852 43.414 720 4.458 - 4.028 54.472 2009 1.759 45.437 618 3.817 - 3.681 55.312 2010 1.807 56.420 878 4.549 - 4.871 68.525 2011 1.307 52.296 1.022 5.343 - 5.355 65.323 2012 1.348 55.819 1.062 6.278 - 5.632 70.139 2013 1.618 65.089 942 8.539 1.406 6.804 84.398 2014 1.553 55.612 835 6.448 982 4.161 69.591 2015 1.059 37.381 380 3.917 713 2.258 45.708 2016 747 35.956 302 4.498 910 1.288 43.701 2017 - 35.622 291 4.537 721 1.220 42.391 2018 - 38.803 466 5.759 643 2.060 47.731 2019 - 33.148 553 5.580 645 3.929 43.855 2020 - 35.369 943 5.614 772 4.465 47.163
FONTE / SOURCE: ANFAVEA.
Unidades / Units
Agricultural and highway construction machinery: production, domestic sales and exports 3.3 Vendas internas no atacado por origem do produto - 1994/2020 (unidades) 3.3 Domestic wholesales by product origin - 1994 / 2020 (units)
/ SOURCE: ANFAVEA.
122 | Anuário da Indústria Automobilística Brasileira | Brazilian Automotive Industry Yearbook | 2024
Máquinas agrícolas e rodoviárias: produção, vendas internas e exportações
NACIONAIS / NATIONALLY MANUFACTURED IMPORTADAS / IMPORTED ANO Year CULTIVADORES MOTORIZADOS Tillers TRATORES DE RODAS Wheel tractors TRATORES DE ESTEIRAS Crawler tractors COLHEITADEIRAS DE GRÃOS Grain combines COLHEDORAS DE CANA Sugarcane combines RETROESCAVADEIRAS Loaders & backhoes TOTAL Total 1994 1.308 38.491 1.180 4.049 - 1.428 46.456 1995 1.210 17.584 1.155 1.423 - 1.334 22.706 1996 714 10.291 500 899 - 1.489 13.893 1997 707 15.731 777 1.662 - 2.152 21.029 1998 587 18.158 764 2.406 - 2.242 24.157 1999 629 18.788 582 2.850 - 1.194 24.043 2000 722 24.291 583 3.628 - 1.312 30.536 2001 856 28.090 490 4.054 - 1.762 35.252 2002 1.050 33.186 543 5.616 - 2.079 42.474 2003 1.585 29.405 449 5.434 - 1.045 37.918 2004 1.682 28.636 526 5.598 - 1.174 37.616 2005 2.141 17.543 408 1.533 - 1.410 23.035 2006 1.857 20.141 300 1.030 - 2.050 25.378 2007 1.548 30.691 427 2.347 - 2.675 37.688 2008 1.852 41.966 661 4.340 - 3.973 52.792 2009 1.759 44.206 506 3.683 - 3.523 53.677 2010 1.807 55.707 789 4.507 - 4.861 67.671 2011 1.307 50.966 884 5.306 - 5.337 63.800 2012 1.348 53.893 899 6.187 - 5.632 67.959 2013 1.618 63.786 863 8.285 1.406 6.803 82.761 2014 1.553 55.230 804 6.433 982 4.161 69.163 2015 1.059 36.959 372 3.907 713 2.258 45.268 2016 747 35.900 245 4.496 910 1.288 43.586 2017 - 35.526 229 4.524 721 1.220 42.220 2018 - 38.541 438 5.756 643 2.060 47.438 2019 - 32.746 551 5.579 645 3.929 43.450 2020 - 33.950 923 5.577 772 4.465 45.687 ANO Year CULTIVADORES MOTORIZADOS Tillers TRATORES DE RODAS Wheel tractors TRATORES DE ESTEIRAS Crawler tractors COLHEITADEIRAS DE GRÃOS Grain combines COLHEDORAS DE CANA Sugarcane combines RETROESCAVADEIRAS Loaders & backhoes TOTAL Total 1994 - 27 4 - - - 31 1995 - 10 23 - - - 33 1996 - 21 5 1 - 4 31 1997 - 318 65 47 - 6 436 1998 - 519 31 118 - 28 696 1999 - 417 64 56 - 116 653 2000 - 300 9 152 - 65 526 2001 - 113 6 44 - 108 271 2002 - 31 8 32 - 23 94 2003 - 71 - 6 - - 77 2004 - 167 - 7 - - 174 2005 - 186 - 1 - - 187 2006 - 294 - - - - 294 2007 - 609 10 30 - - 649 2008 - 1.448 59 118 - 55 1.680 2009 - 1.231 112 134 - 158 1.635 2010 - 713 89 42 - 10 854 2011 - 1.330 138 37 - 18 1.523 2012 - 1.926 163 91 - - 2.180 2013 - 1.303 79 254 - 1 1.637 2014 - 382 31 15 - - 428 2015 - 422 8 10 - - 440 2016 - 56 57 2 - - 115 2017 - 96 62 13 - - 171 2018 - 262 28 3 - - 293 2019 - 402 2 1 - - 405 2020 - 1.419 20 37 - - 1.476 FONTE
NOTAS
2.
3.
/ Units
/ Units
/ NOTES: 1. Informações sobre vendas internas de produtos importados disponíveis a partir de 1994. / Information about intern sales of imported products available since 1994.
As informações, a partir de 2017, referem-se somente a empresas associadas à ANFAVEA. / As from 2017, the data refer only companies associated to ANFAVEA.
Retroescavadeiras - Em 2019 inclui os dados de mais uma empresa associada. / Backhoes - In 2019 includes data from one more associated. Unidades
Unidades
3.4 Vendas internas no atacado por unidade da federação - 2019/2020 (unidades) 3.4 Domestic wholesales per state - 2019/2020 (units)
2024 | Anuário da Indústria Automobilística Brasileira | Brazilian Automotive Industry Yearbook | 123 2024 ANUÁRIO DA INDÚSTRIA AUTOMOBILÍSTICA BRASILEIRA Brazilian Automotive Industry Yearbook
REGIÃO / UF Region / State TRATORES DE RODAS Wheel tractors TRATORES DE ESTEIRAS Crawler tractors COLHEITADEIRAS DE GRÃOS Grain combines COLHEDORAS DE CANA Sugarcane combines RETROESCAVADEIRAS Loaders & backhoes TOTAL Total 2019 2020 2019 2020 2019 2020 2019 2020 2019 2020 2019 2020 NORTE / NORTH 1.798 2.181 50 80 263 312 8 1 198 326 2.317 2.900 AMAZONAS 45 58 3 7 - - - 1 43 68 91 134 PARÁ 778 914 42 56 75 71 4 - 101 163 1.000 1.204 RONDÔNIA 356 395 1 2 63 78 - - 31 25 451 500 ACRE 65 46 1 8 2 - - - 12 30 80 84 AMAPÁ 2 4 - 1 - - - - 5 9 7 14 RORAIMA 96 106 2 - 8 3 - - - 11 106 120 TOCANTINS 456 658 1 6 115 160 4 - 6 20 582 844 NORDESTE / NORTHEAST 3.085 3.657 49 93 286 250 5 8 735 935 4.160 4.943 MARANHÃO 611 575 16 14 84 62 - - 33 65 744 716 PIAUÍ 172 159 - - 47 32 - - 35 37 254 228 CEARÁ 196 175 3 10 - - - - 161 187 360 372 RIO GRANDE DO NORTE 139 171 - 3 - - - - 16 32 155 206 PARAÍBA 130 123 - - - - 1 1 13 29 144 153 PERNAMBUCO 341 406 17 31 - - - 2 171 211 529 650 ALAGOAS 160 222 - - - - 3 4 5 21 168 247 SERGIPE 368 565 2 1 20 52 1 1 31 48 422 667 BAHIA 968 1.261 11 34 135 104 - - 270 305 1.384 1.704 SUDESTE / SOUTHEAST 11.557 11.910 314 523 694 744 450 507 1.557 1.908 14.572 15.592 MINAS GERAIS 3.377 3.904 101 171 283 355 66 73 777 1.121 4.604 5.624 ESPÍRITO SANTO 833 669 7 4 - - - - 56 157 896 830 RIO DE JANEIRO 71 80 - 1 - - - - 56 35 127 116 SÃO PAULO 7.276 7.257 206 347 411 389 384 434 668 595 8.945 9.022 SUL / SOUTH 11.364 11.176 86 154 2.276 2.153 41 81 890 866 14.657 14.430 PARANÁ 4.292 4.960 27 61 1.077 1.165 41 81 329 393 5.766 6.660 SANTA CATARINA 1.930 1.896 36 57 142 161 - - 143 181 2.251 2.295 RIO GRANDE DO SUL 5.142 4.320 23 36 1.057 827 - - 418 292 6.640 5.475 CENTRO-OESTE / MIDWEST 5.344 6.445 54 93 2.061 2.155 141 175 549 430 8.149 9.298 MATO GROSSO 2.513 3.212 15 30 1.240 1.224 11 18 67 88 3.846 4.572 MATO GROSSO DO SUL 1.006 1.043 6 4 280 291 50 42 51 33 1.393 1.413 GOIÁS 1.820 2.184 32 31 541 640 80 115 430 308 2.903 3.278 DISTRITO FEDERAL 5 6 1 28 - - - - 1 1 7 35 TOTAL / TOTAL 33.148 35.369 553 943 5.580 5.614 645 772 3.929 4.465 43.855 47.163
Unidades
/ Units FONTE / SOURCE: ANFAVEA.
Agricultural and highway construction machinery: production, domestic sales and exports
3.5 Exportações - 1964/2020 (unidades) 3.5 Exports - 1964/2020 (units)
124 | Anuário da Indústria Automobilística Brasileira | Brazilian Automotive Industry Yearbook | 2024
exportações
Máquinas agrícolas e rodoviárias: produção, vendas internas e
ANO Year CULTIVADORES MOTORIZADOS Tillers TRATORES DE RODAS Wheel tractors TRATORES DE ESTEIRAS Crawler tractors COLHEITADEIRAS DE GRÃOS Grain combines COLHEDORAS DE CANA Sugarcane combines RETROESCAVADEIRAS Loaders & backhoes TOTAL Total 1964 - 2 - - - - 2 1965 - - - - - -1966 - 6 - - - - 6 1967 10 31 - - - - 41 1968 89 7 - - - - 96 1969 50 7 - - - - 57 1970 76 41 - - - - 117 1971 - 98 - - - - 98 1972 - 186 - - - - 186 1973 6 386 88 - - 6 486 1974 52 877 175 - - 26 1.130 1975 85 611 176 - - 62 934 1976 237 460 44 80 - 55 876 1977 132 4.546 202 129 - 79 5.088 1978 205 6.123 206 145 - 345 7.024 1979 193 7.201 522 224 - 219 8.359 1980 337 7.685 428 279 - 322 9.051 1981 179 10.040 397 314 - 1.042 11.972 1982 59 6.234 329 120 - 359 7.101 1983 103 1.895 221 164 - 80 2.463 1984 213 3.294 227 310 - 61 4.105 1985 259 3.279 216 534 - 47 4.335 1986 467 5.437 200 525 - 59 6.688 1987 641 6.593 599 522 - 240 8.595 1988 357 9.173 843 776 - 364 11.513 1989 223 6.150 903 1.227 - 318 8.821 1990 551 2.758 542 891 - 138 4.880 1991 174 2.974 365 447 - 258 4.218 1992 164 4.263 486 569 - 341 5.823 1993 336 2.725 518 611 - 293 4.483 1994 283 2.748 544 1.204 - 249 5.028 1995 327 3.138 721 948 - 129 5.263 1996 235 5.273 985 1.689 - 177 8.359 1997 138 6.384 1.199 1.906 - 437 10.064 1998 101 5.469 1.214 1.766 - 312 8.862 1999 144 2.335 824 677 - 227 4.207 2000 90 3.455 878 683 - 164 5.270 2001 74 5.814 888 1.202 - 268 8.246 2002 46 7.945 1.117 1.199 - 136 10.443 2003 6 16.589 1.067 3.232 - 528 21.422 2004 23 23.553 1.718 4.533 - 1.195 31.022 2005 34 23.968 2.202 3.001 - 1.473 30.678 2006 46 16.532 2.593 1.867 - 1.399 22.437 2007 129 20.068 2.929 2.783 - 1.339 27.248 2008 13 23.056 2.726 3.579 - 906 30.280 2009 39 12.344 775 1.231 - 391 14.780 2010 128 14.171 1.754 2.261 - 862 19.176 2011 27 12.620 2.460 2.390 - 837 18.334 2012 39 12.167 2.265 1.238 - 1.206 16.915 2013 10 11.217 1.580 1.143 242 1.730 15.922 2014 5 9.428 1.869 1.026 207 1.423 13.958 2015 82 7.338 885 383 105 1.389 10.182 2016 83 6.277 980 431 98 1.729 9.598 2017 - 8.441 1.959 1.006 185 2.368 13.959 2018 - 6.271 3.297 759 233 2.118 12.678 2019 - 6.497 3.547 486 203 2.142 12.875 2020 - 4.952 1.868 398 139 1.134 8.491 FONTE / SOURCE: ANFAVEA. NOTAS / NOTES: 1. As informações, a partir de 2017, referem-se somente a empresas associadas à ANFAVEA. / As from 2017, the data refer only companies associated to ANFAVEA. 2. Retroescavadeiras - Em 2019 inclui os dados de mais uma empresa associada. / Backhoes - In 2019 includes data from one more associated.
Unidades / Units
AGCO do Brasil Soluções Agrícolas Ltda. - Massey Ferguson

3.6 Informações por empresa (unidades) / 3.6 Information per company (units) Unidades

2024 | Anuário da Indústria Automobilística Brasileira | Brazilian Automotive Industry Yearbook | 125 2024 ANUÁRIO DA INDÚSTRIA AUTOMOBILÍSTICA BRASILEIRA Brazilian Automotive Industry Yearbook
ANO Year TRATORES DE RODAS MASSEY FERGUSON Massey Ferguson wheel tractors COLHEITADEIRAS DE GRÃOS MASSEY FERGUSON Massey Ferguson combines MASSEY FERGUSON AGCO ALLIS MASSEY FERGUSON AGCO ALLIS IDEAL Produção Production Vendas internas Domestic sales E xportações Exports Produção Production Vendas internas Domestic sales E xportações Exports Produção Production Vendas internas Domestic sales Exportações Exports Produção Vendas internas Domestic sales E xportações Exports Produção Production Vendas internas Domestic sales E xportações Exports 1961 7 7 - - - - - - - - - - - -1962 1 528 1 528 - - - - - - - - - - - -1963 3 287 3 287 - - - - - - - - - - - -1964 4 032 4 032 - - - - - - - - - - - -1965 2 824 2 824 - - - - - - - - - - - -1966 4 105 4 171 - - - - - - - - - - - -1967 2 441 2 455 - - - - - - - - - - - -1968 5 059 4 682 - - - - - - - - - - - -1969 4 646 4 965 - - - - - - - - - - - -1970 7 748 7 736 - - - - - - - - - - - -1971 11 003 11 016 33 - - - - - - - - - - -1972 16 060 15 885 - - - - - - - - - - - -1973 19 790 19 989 67 - - - - - - - - - - -1974 20 429 20 292 142 - - - - - - - - - - -1975 29 433 29 018 102 - - - - - - - - - - -1976 29 271 28 762 103 - - - 1 918 1 716 47 - - - 737 737 4 1977 21 015 18 209 3 056 - - - 650 1 091 69 - - - 572 572 14 1978 18 915 15 643 3 093 - - - 697 654 20 - - - 204 204 23 1979 18 642 17 232 2 031 - - - 842 772 25 - - - 189 401 18 1980 18 836 16 251 2 395 - - - 929 898 78 - - - 797 736 41 1981 11 270 9 847 1 416 - - - 820 615 103 - - - 668 674 38 1982 9 649 8 110 1 496 - - - 591 483 99 - - - 511 446 1 1983 9 241 8 287 1 042 - - - 736 685 123 - - - 332 453 7 1984 16 585 15 063 1 480 - - - 1 515 1 252 85 - - - 848 690 158 1985 16 038 15 127 1 087 - - - 1 481 1 270 199 - - - 930 800 128 1986 20 400 18 108 2 291 - - - 1 660 1 643 289 - - - 1 110 1 046 61 1987 20 141 17 078 2 942 - - - 1 757 1 166 308 - - - 902 865 39 1988 15 984 11 351 4 455 - - - 1 487 1 127 435 - - - 900 830 70 1989 12 263 9 721 2 487 - - - 1 642 864 847 - - - 524 400 34 1990 8 822 8 121 819 - - - 876 493 558 - - - 230 246 68 1991 6 157 5 341 894 - - - 502 416 190 - - - 218 205 23 1992 5 504 4 310 1 254 - - - 599 446 179 - - - 286 253 38 1993 10 364 9 669 813 - - - 695 606 115 - - - 390 343 51 1994 18 008 16 985 973 - - - 1 147 919 219 - - - 536 449 77 1995 8 988 7 879 1 164 - - - 398 240 121 - - - 97 44 36 1996 5 012 4 048 983 - - - 415 222 209 - - - 137 76 74 1997 6 585 5 508 1 057 - - - 330 212 141 - - - 48 33 15 1998 6 842 6 108 832 - - - 492 350 176 21 - 21 90 69 21 1999 6 939 5 992 613 - - - 555 400 79 94 - 72 30 27 5 2000 9 442 8 086 1 424 37 - 27 814 611 95 29 11 34 - 3 1 2001 13 897 9 703 3 902 143 - 136 1 023 826 204 50 11 35 - -2002 16 187 11 341 4 947 77 - 84 1 355 986 319 64 18 54 - -2003 18 395 9 654 8 580 953 - 845 1 906 1 207 639 256 3 243 - -2004 21 406 9 740 11 795 569 - 681 2 312 1 284 1 006 148 - 149 - -2005 19 019 5 881 13 077 994 - 991 892 332 617 164 - 165 - -2006 14 279 6 454 8 131 503 - 527 355 207 254 55 - 50 - -2007 18 831 9 390 9 472 495 - 510 697 463 250 10 - 13 - -2008 23 836 12 582 10 797 478 - 451 1 190 722 380 37 - 41 - -2009 20 996 13 970 7 514 46 - 76 616 554 191 - - - - -2010 23 577 17 085 6 168 151 - 145 958 605 237 - - - - -2011 20 689 14 451 6 364 50 - 54 879 686 225 8 - 4 - -2012 21 146 14 608 6 790 47 - 49 932 784 157 - - 4 - -2013 22 026 15 878 5 962 43 - 41 1 133 893 148 - - - - -2014 18 578 13 563 5 497 - - - 947 651 283 - - - - -2015 14 065 9 160 4 098 - - - 464 404 119 - - - - -2016 11 381 7 963 2 644 - - - 488 397 62 - - - - -2017 9 628 8 006 2 959 - - - 632 431 109 - - - - -2018 13 458 8 931 2 341 - - - 383 387 52 - - - - -2019 8 279 5 617 3 733 - - - 362 357 31 - - - - -2020 8.006 6.405 2.573 - - - 389 405 7 - - - - - -
/ Units FONTE
/ SOURCE: ANFAVEA.
Máquinas agrícolas e rodoviárias: produção, vendas internas e exportações
Agricultural and highway construction machinery: production, domestic sales and exports
3.6 Informações por empresa (unidades) / 3.6 Information per company (units)
AGCO do Brasil Soluções Agrícolas Ltda. - Massey Ferguson
FONTE / SOURCE: ANFAVEA.
NOTAS / NOTES:
1 Informações sobre colheitadeiras disponíveis a partir de 1976 / 1 Information on combines available from 1976 onwards
2 Foram produzidas e exportadas colheitadeiras Deutz em 1998 (21 unidades) e 1999 (64 unidades). / 2 Deutz harvesters were produced and exported in 1998 (21 units) and 1999 (64 units).
3 Informações sobre vendas internas de produtos importados disponíveis a partir de 1994. / 3. Information on domestic sales of imported products available from 1994 onwards.
4 Desde janeiro de 2003, não há empresas associadas à ANFAVEA fabricantes de cultivadores motorizados. / 4 Since January 2003, there are no companies associated with Anfavea that manufacture motorized cultivators.
5 As informações, a partir de 2017, referem-se somente a empresas associadas à ANFAVEA. / 5 The information, as of 2017, refers only to companies associated with ANFAVEA.
126 | Anuário da Indústria Automobilística Brasileira | Brazilian Automotive Industry Yearbook | 2024
ANO Year TRATORES DE RODAS MASSEY FERGUSON Massey Ferguson wheel tractors COLHEITADEIRAS DE GRÃOS MASSEY FERGUSON Massey Ferguson combines COLHEITADEIRAS DE GRÃOS AGCO ALLIS AGCO Allis combines NACIONAIS Nationally manufactured IMPORTADOS Imported TOTAL Total NACIONAIS Nationally manufactured IMPORTADOS Imported TOTAL Total NACIONAIS Nationally manufactured IMPORTADOS Imported TOTAL Total 1994 16 958 27 16 985 919 - 919 - -1995 7 871 8 7. 879 240 - 240 - -1996 4 033 15 4 048 222 - 222 - -1997 5 473 35 5. 508 212 - 212 - -1998 6 094 14 6 108 346 4 350 - -1999 5 988 4 5.992 400 - 400 - -2000 8 084 2 8 086 611 - 611 11 - 11 2001 9 703 - 9.703 826 - 826 11 - 11 2002 11 340 1 11. 341 980 6 986 18 - 18 2003 9 654 - 9 654 1 206 1 1 207 3 - 3 2004 9 740 - 9.740 1 284 - 1. 284 - -2005 5 881 - 5 881 332 - 332 - -2006 6 446 8 6 . 454 207 - 207 - -2007 9 378 12 9 390 445 18 463 - -2008 12 550 32 12 . 582 716 6 722 - -2009 13 960 10 13 970 554 - 554 - -2010 17 082 3 17.085 605 - 605 - -2011 14 451 - 14 . 451 686 - 686 - -2012 14 545 63 14 608 784 - 784 - -2013 15 785 93 15. 878 893 - 893 - -2014 13 477 86 13 563 651 - 651 - -2015 9 136 24 9.160 404 - 404 - -2016 7 952 11 7 963 397 - 397 2017 7 990 16 8 .006 431 - 431 - -2018 8 931 - 8 931 387 - 387 - -2019 5 60 2 15 5.617 357 - 357 - -2020 6.352 53 6.405 405 - 405 - -VENDAS INTERNAS NO ATACADO POR ORIGEM DO PRODUTO / INTERNAL WHOLESALES BY PRODUCT ORIGIN
Unidades / Units

AGCO do Brasil Soluções Agrícolas Ltda. - Valtra

2024 ANUÁRIO DA INDÚSTRIA AUTOMOBILÍSTICA BRASILEIRA Brazilian Automotive Industry Yearbook 2024 | Anuário da Indústria Automobilística Brasileira | Brazilian Automotive Industry Yearbook | 127
ANO Year TRATORES DE RODAS VALTRA Valtra wheel tractors TRATORES DE RODAS CHALLENGER Challenger wheel tractors COLHEITADEIRAS DE GRÃOS VALTRA Valtra grain combines COLHEITADEIRAS DE GRÃOS CHALLENGER Challenger grain combines COLHEDORAS DE CANA VALTRA Valtra sugarcane combines Produção Production Vendas internas Domestic sales E xportações Exports Produção Production Vendas internas Domestic sales E xportações Exports Produção Production Vendas internas Domestic sales E xportações Exports Produção Vendas internas Domestic sales E xportações Exports Produção Production Vendas internas Domestic sales E xportações Exports 1960 5 5 - - - - - - - - - - - -1961 327 327 - - - - - - - - - - - -1962 1.600 1.600 - - - - - - - - - - - -1963 1.638 1.638 - - - - - - - - - - - -1964 2.225 2.223 2 - - - - - - - - - - -1965 1.570 1.570 - - - - - - - - - - - -1966 1.340 1.429 6 - - - - - - - - - - -1967 1.389 1.341 19 - - - - - - - - - - -1968 1.657 1.596 7 - - - - - - - - - - -1969 2.309 2.309 6 - - - - - - - - - - -1970 3.553 3.642 30 - - - - - - - - - - -1971 6.250 6.026 15 - - - - - - - - - - -1972 8.239 8.127 76 - - - - - - - - - - -1973 10.005 10.016 224 - - - - - - - - - - -1974 12.008 11.615 422 - - - - - - - - - - -1975 14.080 13.831 231 - - - - - - - - - - -1976 15.071 14.914 157 - - - - - - - - - - -1977 14.954 14.407 201 - - - - - - - - - - -1978 10.882 10.919 280 - - - - - - - - - - -1979 13.547 13.146 417 - - - - - - - - - - -1980 14.382 14.166 232 - - - - - - - - - - -1981 8.133 7.764 355 - - - - - - - - - - -1982 7.806 7.643 107 - - - - - - - - - - -1983 6.317 6.290 81 - - - - - - - - - - -1984 14.026 12.843 1.017 - - - - - - - - - - -1985 11.675 11.037 796 - - - - - - - - - - -1986 12.434 11.633 857 - - - - - - - - - - -1987 11.010 9.487 1.414 - - - - - - - - - - -1988 10.304 8.636 1.461 - - - - - - - - - - -1989 8.359 7.393 1.218 - - - - - - - - - - -1990 7.029 5.688 1.081 - - - - - - - - - - -1991 4.568 3.799 1.133 - - - - - - - - - - -1992 5.010 3.696 1.399 - - - - - - - - - - -1993 6.959 5.494 1.376 - - - - - - - - - - -1994 11.222 10.100 1.079 - - - - - - - - - - -1995 5.363 4.400 992 - - - - - - - - - - -1996 4.353 2.632 1.732 - - - - - - - - - - -1997 6.012 4.262 1.747 - - - - - - - - - - -1998 6.990 5.130 1.738 - - - - - - - - - - -1999 5.738 5.195 675 - - - - - - - - - - -2000 6.702 5.810 907 - - - - - - - - - - -2001 7.330 6.549 742 - - - - - - - - - - -2002 8.449 7.458 814 - - - - - - - - - - -2003 9.087 6.851 2.234 - - - - - - - - - - -2004 9.898 7.062 2.851 - - - - - - - - - - -2005 7.745 5.369 2.464 179 - 179 - - - - - - - -2006 6.966 5.731 1.241 203 - 203 - - - - - - - -2007 10.622 8.597 2.069 237 - 233 51 37 - 47 - - - -2008 13.294 11.048 2.181 556 - 551 89 103 - 80 - 80 - -2009 10.120 9.623 616 180 - 184 143 121 - 22 - 20 - -2010 14.784 13.147 1.536 63 - 38 209 216 - 41 - 38 - -2011 13.107 11.757 1.356 9 - 21 292 266 1 - - 15 - -2012 14.126 12.580 1.581 1 - 12 319 300 2 14 - 16 - -2013 16.435 14.070 1.925 - - - 379 304 11 15 - 15 22 82014 12.184 11.551 1.072 - - - 155 222 5 13 - 2 14 292015 9.403 7.976 1.208 - - - 115 124 13 - - - 37 26 1 2016 9.691 7.226 1.118 - - - 107 94 - - - - 46 522017 6.771 6.658 1.340 - - - 136 106 3 - - - 28 16 4 2018 9.554 6.903 877 - - - 108 80 5 - - - 3 202019 4.340 4.433 637 - - - 48 51 17 - - - - 72020 4.979 5.570 464 - - - 29 60 - - - - - 4 -
FONTE
Unidades / Units
/ SOURCE: ANFAVEA.
Máquinas agrícolas e rodoviárias: produção, vendas internas e exportações
Agricultural and highway construction machinery: production, domestic sales and exports
3.6 Informações por empresa (unidades) / 3.6 Information per company (units)
AGCO do Brasil Soluções Agrícolas Ltda. - Valtra
FONTE / SOURCE: ANFAVEA. .
NOTAS / NOTES:
1 Informações sobre colheitadeiras disponíveis a partir de 1976 / 1. Information on combines available from 1976 onwards
2 Foram produzidas e exportadas colheitadeiras Deutz em 1998 (21 unidades) e 1999 (64 unidades). / 2 Deutz harvesters were produced and exported in 1998 (21 units) and 1999 (64 units).
3 Informações sobre vendas internas de produtos importados disponíveis a partir de 1994. / 3. Information on domestic sales of imported products available from 1994 onwards.
4 Desde janeiro de 2003, não há empresas associadas à ANFAVEA fabricantes de cultivadores motorizados. / 4 Since January 2003, there are no companies associated with Anfavea that manufacture motorized cultivators.
5 As informações, a partir de 2017, referem-se somente a empresas associadas à ANFAVEA. / 5 The information, as of 2017, refers only to companies associated with ANFAVEA.
6 - Foram vendidas nove colheitadeiras modelo Claas no ano de 1999 (origem Alemanha). / 6. 9 Claas model harvesters were sold in 1999 (Origin Germany).
128 | Anuário da Indústria Automobilística Brasileira | Brazilian Automotive Industry Yearbook | 2024
ANO Year TRATORES DE RODAS VALTRA Valtra wheel tractors COLHEITADEIRAS DE GRÃOS VALTRA Valtra grain combines COLHEDORAS DE CANA VALTRA Valtra sugarcane combines NACIONAIS Nationally manufactured IMPORTADOS Imported TOTAL Total NACIONAIS Nationally manufactured IMPORTADOS Imported TOTAL Total NACIONAIS Nationally manufactured IMPORTADOS Imported TOTAL Total 1999 5.187 8 5.195 - - - - -2000 5.810 - 5.810 - - - - -2001 6.549 - 6.549 - - - - -2002 7.458 - 7.458 - - - - -2003 6.851 - 6.851 - - - - -2004 7.062 - 7.062 - - - - -2005 5.369 - 5.369 - - - - -2006 5.731 - 5.731 - - - - -2007 8.597 - 8.597 37 - 37 - -2008 11.048 - 11.048 103 - 103 - -2009 9.623 - 9.623 121 - 121 - -2010 13.147 - 13.147 216 - 216 - -2011 11.757 - 11.757 266 - 266 - -2012 12.553 27 12.580 300 - 300 - -2013 14.019 51 14.070 304 - 304 8 - 8 2014 11.519 32 11.551 222 - 222 29 - 29 2015 7.751 225 7.976 124 - 124 26 - 26 2016 7.219 7 7.226 94 - 94 52 - 52 2017 6.650 8 6.658 106 - 106 16 - 16 2018 6.901 2 6.903 80 - 80 20 - 20 2019 4.431 2 4.433 51 - 51 7 - 7 2020 5,527 43 5,570 60 - 60 4 - 4
NO ATACADO POR ORIGEM DO PRODUTO / INTERNAL WHOLESALES BY PRODUCT ORIGIN
VENDAS INTERNAS
Unidades / Units
Agrale S.A.
VENDAS INTERNAS NO ATACADO POR ORIGEM DO PRODUTO / INTERNAL WHOLESALES BY PRODUCT ORIGIN
* Tratores Deutz; origem Argentina / *Deutz tractors; Argentine origin
FONTE / SOURCE: ANFAVEA.
NOTAS / NOTES: 1 Informações sobre colheitadeiras disponíveis a partir de 1976 / 1 Information on combines available from 1976 onwards
2 Foram produzidas e exportadas colheitadeiras Deutz em 1998 (21 unidades) e 1999 (64 unidades). / 2 Deutz harvesters were produced and exported in 1998 (21 units) and 1999 (64 units).
3 Informações sobre vendas internas de produtos importados disponíveis a partir de 1994. / 3. Information on domestic sales of imported products available from 1994 onwards.
4 Desde janeiro de 2003, não há empresas associadas à ANFAVEA fabricantes de cultivadores motorizados. / 4 Since January 2003, there are no companies associated with Anfavea that manufacture motorized cultivators.
5 As informações, a partir de 2017, referem-se somente a empresas associadas à ANFAVEA. / 5 The information, as of 2017, refers only to companies associated with ANFAVEA.
2024 ANUÁRIO DA INDÚSTRIA AUTOMOBILÍSTICA BRASILEIRA Brazilian Automotive Industry Yearbook 2024 | Anuário da Indústria Automobilística Brasileira | Brazilian Automotive Industry Yearbook | 129
/ Units ANO Year TRATORES DE RODAS AGRALE Agrale wheel tractors CULTIVADORES MOTORIZADOS AGRALE Agrale tillers Produção Production Vendas internas Domestic sales E xportações Exports Produção Production Vendas internas Domestic sales E xportações Exports 1964 - - - 55 551965 - - - - -1966 - - - 158 -1967 - - - 341 -1968 148 122 - 158 1801969 335 318 - 14 27 1 1970 409 449 - 30 261971 366 365 9 10 51972 850 833 14 5 -1973 2.062 2.027 34 34 12 6 1974 2.986 2.896 88 - 4 10 1975 2.992 2.754 64 - -1976 3.627 3.636 83 - -1977 4.241 4.064 134 - -1978 4.002 3.701 117 - -1979 4.281 4.313 248 - -1980 4.282 4.044 203 - -1981 2.598 2.195 71 - -1982 1.923 2.077 34 - -1983 1.250 1.437 2 - -1984 2.652 2.544 12 - -1985 2.748 2.790 46 - -1986 3.052 3.028 26 - -1987 3.482 2.741 146 - -1988 979 1.225 115 - -1989 959 1.099 37 - -1990 1.048 943 63 - -1991 1.088 1.032 122 - -ANO Year TRATORES DE RODAS AGRALE / Agrale wheel tractors NACIONAIS Nationally manufactured IMPORTADOS * Imported TOTAL Total 1997 560 12 572 1998 483 66 549 1999 420 32 452 2000 667 33 700 2001 763 8 771 2002 855 - 855 2003 904 - 904 2004 1.575 - 1.575 2005 924 - 924 2006 1.171 - 1.171 2007 1.507 - 1.507 2008 1.604 - 1.604 ANO Year TRATORES DE RODAS AGRALE / Agrale wheel tractors NACIONAIS Nationally manufactured IMPORTADOS Imported* TOTAL Total 2009 1.625 - 1.625 2010 1.918 - 1.918 2011 1.803 - 1.803 2012 2.069 - 2.069 2013 2.087 - 2.087 2014 2.022 - 2.022 2015 1.340 - 1.340 2016 1.090 - 1.090 2017 774 - 774 2018 372 - 372 2019 143 - 143 2020 89 - 89 ANO Year TRATORES DE RODAS AGRALE Agrale wheel tractors CULTIVADORES MOTORIZADOS AGRALE Agrale tillers Produção Production Vendas internas Domestic sales E xportações Exports Produção Production Vendas internas Domestic sales E xportações Exports 1992 1.131 1.070 124 - -1993 1.832 1.717 71 - -1994 1.935 1.963 45 - -1995 809 788 27 - -1996 495 417 61 - -1997 629 572 49 - -1998 480 549 16 - -1999 491 452 28 - -2000 737 700 59 - -2001 789 771 23 - -2002 946 855 48 - -2003 1.009 904 103 - -2004 1.761 1.575 153 - -2005 1.053 924 169 - -2006 1.171 1.171 60 - -2007 1.497 1.507 53 - -2008 1.841 1.604 45 - -2009 1.455 1.625 19 - -2010 1.987 1.918 29 - -2011 1.934 1.803 122 - -2012 2.171 2.069 119 - -2013 2.345 2.087 84 - -2014 2.451 2.022 454 - -2015 1.528 1.340 162 - -2016 1.077 1.090 61 - -2017 768 774 68 - -2018 406 372 17 - -2019 154 143 3 - -2020 73 89 - - - -
Unidades
Unidades / Units
Máquinas agrícolas e rodoviárias: produção, vendas internas e exportações
Agricultural and highway construction machinery: production, domestic sales and exports
3.6 Informações por empresa (unidades) / 3.6 Information per company (units)
CNH Industrial Brasil Ltda. – CASE


FONTE / SOURCE: ANFAVEA.
NOTAS / NOTES:
1 Informações sobre colheitadeiras disponíveis a partir de 1976 / 1 Information on combines available from 1976 onwards
2 Foram produzidas e exportadas colheitadeiras Deutz em 1998 (21 unidades) e 1999 (64 unidades). / 2 Deutz harvesters were produced and exported in 1998 (21 units) and 1999 (64 units).
3 Informações sobre vendas internas de produtos importados disponíveis a partir de 1994. / 3. Information on domestic sales of imported products available from 1994 onwards.
4 Desde janeiro de 2003, não há empresas associadas à ANFAVEA fabricantes de cultivadores motorizados. / 4 Since January 2003, there are no companies associated with Anfavea that manufacture motorized cultivators.
5 As informações, a partir de 2017, referem-se somente a empresas associadas à ANFAVEA. / 5 The information, as of 2017, refers only to companies associated with ANFAVEA.
130 | Anuário da Indústria Automobilística Brasileira | Brazilian Automotive Industry Yearbook | 2024
ANO Year TRATORES DE RODAS CASE Case wheel tractors COLHEITADEIRAS DE GRÃOS CASE Case grain combines COLHEDORAS DE CANA CASE Case sugarcane combines Produção Production Vendas internas Domestic sales E xportações Exports Produção Production Vendas internas Domestic sales E xportações Exports Produção Production Vendas internas Domestic sales E xportações Exports 1977 176 155 16 - - - - -1978 366 210 49 - - - - -1979 251 219 141 - - - - -1980 487 316 176 - - - - -1981 377 189 130 - - - - -1982 199 112 135 - - - - -1983 116 28 91 - - - - -1984 130 27 104 - - - - -1985 120 9 90 - - - - -1986 - 19 5 - - - - -1987 - - - - - - - -1988 - - - - - - - -1989 - - - - - - - -1990 - - - - - - - -1991 - - - - - - - -1992 - - - - - - - -1993 - - - - - - - -1994 - - - - - - - -1995 - - - - - - - -1996 - - - - 1 - - -1997 - 185 - - 47 - - -1998 114 270 - 45 151 - - -1999 253 290 - 100 58 - - -2000 181 292 66 13 135 - - -2001 27 201 7 4 74 1 - -2002 179 170 4 253 257 10 - -2003 713 423 185 532 378 127 - -2004 702 290 354 617 309 274 - -2005 102 138 114 296 137 187 - -2006 413 236 189 294 102 216 - -2007 763 381 376 674 227 451 - -2008 1.205 691 446 1.180 522 623 - -2009 600 629 260 673 566 157 - -2010 1.529 1.290 286 970 640 363 - -2011 1.965 1.791 259 1.334 884 352 - -2012 2.776 3.029 268 1.293 1.110 143 - -2013 4.966 4.500 305 1.884 1.562 160 584 561 231 2014 4.274 3.894 187 1.217 1.086 57 368 297 203 2015 2.281 2.299 160 550 607 31 201 264 101 2016 2.348 2.192 595 677 742 99 275 305 89 2017 3.272 2.714 1.186 1.095 825 367 470 277 86 2018 3.413 2.969 683 1.308 1.018 132 393 258 73 2019 3.035 3.127 603 1.139 1.031 158 361 348 53 2020 3.155 3.630 577 914 1.086 130 311 326 46
Unidades / Units
CNH Industrial Brasil Ltda. – CASE
VENDAS INTERNAS NO ATACADO POR ORIGEM DO PRODUTO / INTERNAL WHOLESALES BY


FONTE / SOURCE: ANFAVEA.
NOTAS / NOTES:
1 Informações sobre colheitadeiras disponíveis a partir de 1976 / 1 Information on combines available from 1976 onwards
2 Foram produzidas e exportadas colheitadeiras Deutz em 1998 (21 unidades) e 1999 (64 unidades). / 2 Deutz harvesters were produced and exported in 1998 (21 units) and 1999 (64 units).
3 Informações sobre vendas internas de produtos importados disponíveis a partir de 1994. / 3. Information on domestic sales of imported products available from 1994 onwards.
4 Desde aneiro de 2003, não há empresas associadas à ANFAVEA fabricantes de cultivadores motorizados. / 4 Since January 2003, there are no companies associated with Anfavea that manufacture motorized cultivators.
5 As informações, a partir de 2017, referem-se somente a empresas associadas à ANFAVEA. / 5 The information, as of 2017, refers only to companies associated with ANFAVEA.
ANUÁRIO DA INDÚSTRIA AUTOMOBILÍSTICA BRASILEIRA Brazilian Automotive Industry Yearbook 2024 | Anuário da Indústria Automobilística Brasileira | Brazilian Automotive Industry Yearbook | 131 ANO Year TRATORES DE RODAS CASE Case wheel tractors COLHEITADEIRAS DE GRÃOS CASE Case grain combines COLHEDORAS DE CANA CASE Case sugarcane combines NACIONAIS Nationally manufactured IMPORTADOS Imported TOTAL Total NACIONAIS Nationally manufactured IMPORTADOS Imported TOTAL Total NACIONAIS Nationally manufactured IMPORTADOS Imported TOTAL Total 1998 38 232 270 38 113 151 - -1999 109 181 290 38 20 58 - -2000 183 109 292 23 112 135 - -2001 166 35 201 50 24 74 - -2002 169 1 170 249 8 257 - -2003 423 - 423 378 - 378 - -2004 290 - 290 309 - 309 - -2005 138 - 138 137 - 137 - -2006 236 - 236 102 - 102 - -2007 381 - 381 222 5 227 - -2008 691 - 691 502 20 522 - -2009 401 228 629 551 15 566 - -2010 1.091 199 1.290 633 7 640 - -2011 1.632 159 1.791 881 3 884 - -2012 2.671 358 3.029 1.110 - 1.110 - -2013 4.339 161 4.500 1.467 95 1.562 561 - 561 2014 3.879 15 3.894 1.086 - 1.086 297 - 297 2015 2.291 8 2.299 607 - 607 264 - 264 2016 2.186 6 2.192 741 1 742 305 - 305 2017 2.660 54 2.714 814 11 825 277 - 277 2018 2.852 117 2.969 1.017 1 1.018 258 - 258 2019 2.957 170 3.127 1.031 - 1.031 348 - 348 2020 3.483 147 3.630 1.054 32 1.086 326 - 326
2024
PRODUCT ORIGIN Unidades / Units
Máquinas agrícolas e rodoviárias: produção, vendas internas e exportações
3.6 Informações por empresa / 3.6 Information per company
CNH Industrial Brasil Ltda. – New Holland


132 | Anuário da Indústria Automobilística Brasileira | Brazilian Automotive Industry Yearbook | 2024
and highway construction machinery: production, domestic sales and exports
Agricultural
/ SOURCE: ANFAVEA. NOTAS / NOTES: 1 Informações sobre colheitadeiras disponíveis a partir de 1976 / 1 Information on combines available from 1976 onwards 2 Foram produzidas e exportadas colheitadeiras Deutz em 1998 (21 unidades) e 1999 (64 unidades). / 2 Deutz harvesters were produced and exported in 1998 (21 units) and 1999 (64 units). 3 Informações sobre vendas internas de produtos importados disponíveis a partir de 1994. / 3. Information on domestic sales of imported products available from 1994 onwards. 4 Desde janeiro de 2003, não há empresas associadas à ANFAVEA fabricantes de cultivadores motorizados. / 4 Since January 2003, there are no companies associated with Anfavea that manufacture motorized cultivators.
2017,
somente a empresas associadas à ANFAVEA. / 5 The information, as of 2017, refers only to companies associated with ANFAVEA.
FONTE
5 As informações, a partir de
referem-se
ANO Year TRATORES DE RODAS NEW HOLLAND New Holland wheel tractors COLHEITADEIRAS DE GRÃOS NEW HOLLAND New Holland grain combines Produção Production Vendas internas Domestic sales E xportações Exports Produção Production Vendas internas Domestic sales E xportações Exports 1960 32 32 - - -1961 1.247 1.247 - - -1962 3.179 3.179 - - -1963 2.541 2.541 - - -1964 2.168 2.168 - - -1965 1.420 1.420 - - -1966 1.408 1.367 - - -1967 448 598 12 - -1968 - - - - -1969 - - - - -1970 - - - - -1971 - - - - -1972 - - - - -1973 - - - - -1974 - - - - -1975 - - - - -1976 5.186 4.872 - 1.515 1.225 26 1977 8.826 7.922 1.024 1.356 1.565 36 1978 9.636 6.618 2.351 1.614 1.227 60 1979 12.575 8.931 4.137 1.635 1.947 154 1980 13.482 9.378 4.350 1.935 1.829 111 1981 14.105 5.116 7.998 1.954 1.776 128 1982 8.606 4.634 4.422 1.179 1.141 10 1983 3.345 4.050 657 1.079 1.121 16 1984 7.921 7.273 661 1.748 1.732 38 1985 9.728 8.599 1.128 2.167 1.908 149 1986 10.588 8.384 2.224 2.029 1.992 100 1987 9.479 6.994 2.095 2.121 1.968 126 1988 8.847 5.644 3.095 1.567 1.309 143 1989 6.169 4.124 2.371 1.386 1.361 139 1990 4.111 3.430 588 885 790 109 ANO Year TRATORES DE RODAS NEW HOLLAND New Holland wheel tractors COLHEITADEIRAS DE GRÃOS NEW HOLLAND New Holland grain combines Produção Production Vendas internas Domestic sales E xportações Exports Produção Production Vendas internas Domestic sales E xportações Exports 1991 2 677 1 964 718 584 477 102 1992 2.893 1.707 1.313 593 550 74 1993 4.475 3.672 429 1 038 819 142 1994 9.011 8.596 613 1 707 1 393 300 1995 5.095 3.778 933 859 590 275 1996 4.180 2.566 1.960 897 372 576 1997 5.980 3.459 2.491 1 296 708 520 1998 6.026 4.082 1.728 1 380 979 410 1999 4.854 4.487 741 1 351 1 267 158 2000 6.251 5.857 627 1 692 1 551 124 2001 8.307 7.275 672 2 046 1 745 347 2002 9.752 8.762 1.557 2 448 2 275 201 2003 10.449 7.215 2.640 3 112 2 214 661 2004 10.619 6.264 4.114 3 147 2 091 957 2005 6.444 2.799 4.028 811 516 413 2006 7.648 3.960 4.096 545 377 326 2007 11.467 6.675 4.686 1 314 845 504 2008 14.751 9.952 5.012 2 432 1 560 783 2009 12.623 11.038 2.054 1 260 1 217 252 2010 16.391 12.507 3.592 1 801 1 503 350 2011 13.539 10.493 2.832 2 094 1 579 471 2012 10.792 9.786 2.056 2 023 1 853 238 2013 14.712 12.705 1.346 3 263 2 656 283 2014 12.296 10.031 1.351 2 347 1 822 309 2015 7.322 6.897 1.147 1 102 1 215 115 2016 6.829 6.672 1.071 1 491 1 376 126 2017 9.709 7.453 1.577 1 934 1 589 346 2018 9 196 8.014 1.238 2 045 1 902 339 2019 7 948 7 664 873 2 272 1 872 124 2020 8.241 10.041 898 1.651 1.946 188 VENDAS INTERNAS NO ATACADO POR ORIGEM DO PRODUTO / INTERNAL WHOLESALES BY PRODUCT ORIGIN ANO Year TRATORES DE RODAS NEW HOLLAND / New Holland wheel tractors COLHEITADEIRAS DE GRÃOS NEW HOLLAND / New Holland grain combines NACIONAIS / Nationally manufactured IMPORTADOS / Imported TOTAL / Total NACIONAIS / Nationally manufactured IMPORTADOS / Imported TOTAL / Total 1997 3.385 74 3.459 708 - 708 1998 3.959 123 4.082 978 1 979 1999 4.363 124 4.487 1 250 17 1.267 2000 5.798 59 5.857 1 531 20 1.551 2001 7.228 47 7.275 1 742 3 1.745 2002 8.760 2 8.762 2 275 - 2.275 2003 7 213 2 7.215 2 213 1 2.214 2004 6 263 1 6.264 2 091 - 2.091 2005 2 734 65 2.799 516 - 516 2006 3 761 199 3.960 377 - 377 2007 6 642 33 6.675 838 7 845 2008 9 684 268 9.952 1 498 62 1. 560 2009 10 808 230 11 038 1 126 91 1 217 2010 12 420 87 12 507 1 474 29 1 503 2011 10 387 106 10. 493 1 571 8 1. 579 2012 9 624 162 9.786 1 848 5 1. 853 2013 12 615 90 12 705 2 627 29 2 656 2014 10 025 6 10 031 1 811 11 1 822 2015 6 884 13 6 . 897 1 205 10 1. 215 2016 6 659 13 6 .672 1 375 1 1. 376 2017 7 441 12 7. 453 1 587 2 1. 589 2018 7 969 45 8 014 1 900 2 1 902 2019 7 484 180 7.664 1 871 1 1. 872 2020 8.889 1.152 10.041 1 941 5 1.946 Unidades / Units Unidades / Units
ASSOCIAÇÃO NACIONAL DOS FABRICANTES DE VEÍCULOS AUTOMOTORES
4 International data
4
4
CHAPTER
CAPÍTULO
Referências internacionais
Referências internacionais
International data
4.1 Frota e habitantes por autoveículo em alguns países - 2015 e 2020 (mil unidades)
4.1 Vehicle fleet and inhabitants per vehicle in selected countries - 2015 and 2020 (thousand units)
134 | Anuário da Indústria Automobilística Brasileira | Brazilian Automotive Industry Yearbook | 2024
FROTA / FLEET (Mil unidades / thousand units) HABITANTES POR AUTOVEÍCULO I nhabitants per vehicle PAÍS / Country 2015 2020 2015 2020 China / China 162.845 318.014 8,5 4,4 Estados Unidos / Unites States 264.194 289.037 1,2 1,1 Japão / Japan 77.404 76.703 1,6 1,6 Rússia / Russia 51.355 55.838 2,8 2,6 Alemanha / Germany 48.427 52.276 1,7 1,6 BRASIL / BRAZIL 42.743 45.722 4,8 4,6 Índia / India 28.860 45.687 45,8 30,6 França / France 43.482 45.421 1,5 1,5 México / Mexico 37.354 45.087 3,2 2,8 Itália / Italy 42.242 45.000 1,4 1,3 Reino Unido / United Kingdom 38.220 42.404 1,7 1,6 Espanha / Spain 27.463 29.708 1,7 1,6 Polônia / Poland 24.250 29.238 1,6 1,3 Canadá / Canada 23.215 26.788 1,5 1,4 Coreia do Sul / South Korea 20.990 23.730 2,4 2,2 Indonésia / Indonesia 16.646 21.114 15,6 12,9 Tailândia / Thailand 15.491 19.773 4,5 3,6 Austrália / Australia 17.201 18.924 1,4 1,4 Turquia / Turkey 15.361 18.513 5,2 4,5 Malásia / Malasya 13.309 17.749 2,3 1,9 Irã / Iran 14.130 15.963 5,8 5,5 Argentina / Argentina 13.736 14.025 3,1 3,2 Nigéria / Nigeria 9.093 11.605 20,2 18,0 África do Sul / South Africa 9.600 10.339 5,8 5,7 Holanda / Netherlands 9.395 10.248 1,8 1,7
FONTES
SOURCES: ANFAVEA
Mil unidades /Thousand units
/
OICA.
4.2 Produção de autoveículos - 2014/2023 (mil unidades)
4.2 Worldwide vehicle
- 2014/2023 (thousand
FONTES / SOURCES: ANFAVEA Oica.
NOTA S: 1. Os dados do Brasil referem-se a autoveículos montados (não incluem CKDs). 2.Os dados da França se referem a automóveis e comerciais leves e os dados da Suécia e Hungria se referem somente a automóveis. 3. Os dados da Alemanha de 2014 a 2021 referem-se a automóveis e comerciais leves. A partir de 2022, somente a automóveis. 4. A partir de 2015, os dados da Argentina se referem a automóveis e comerciais leves. 5. Os dados da India, a partir de 2016, não incluem os automóveis da Audi, BMW, Mercedes-Benz e Jaguar Land Rover.
NOTES: 1. Data from Brazil refer to assembled vehicles (does not include CKDs). 2. Data from France refer to cars and light commercial vehicles and data from Sweden and Hungary refer only to cars. 3. German data from 2014 to 2021 refers to cars and light commercial vehicles. From 2022, only for cars. 4. As of 2015, data from Argentina refer to cars and light commercial vehicles. 5. Data from India, as of 2016, does not include cars from Audi, BMW, Mercedes-Benz and Jaguar Land Rover.
PRODUÇÃO DE AUTOVEÍCULOS POR CONTINENTE - 2023
VEHICLE PRODUCTION BY CONTINENT - 2023
PRODUÇÃO TOTAL
93,5
/ MILLION
2024 | Anuário da Indústria Automobilística Brasileira | Brazilian Automotive Industry Yearbook | 135 2024 ANUÁRIO DA INDÚSTRIA AUTOMOBILÍSTICA BRASILEIRA Brazilian Automotive Industry Yearbook Ásia / Asia 58,9% Europa / Europe 19,4% África / Africa 1,3% Brasil / Brazil 2 ,5% PAÍS / Country 2014 2015 2016 2017 2018 2019 2020 2021 2022 2023 China / China 23.732 24.567 28.119 29.015 27.809 25.751 25.225 26.122 27.021 30.161 Estados Unidos / Unites States 11.661 12.106 12.180 11.190 11.298 10.893 8.821 9.157 10.053 10.612 Japão / Japan 9.775 9.278 9.205 9.691 9.730 9.685 8.068 7.837 7.836 8.997 Índia / India 3.845 4.161 4.519 4.792 5.143 4.524 3.382 4.399 5.457 5.852 Coreia do Sul / South Korea 4.525 4.556 4.229 4.115 4.029 3.951 3.507 3.462 3.757 4.244 Alemanha / Germany 5.908 6.033 5.747 5.646 5.120 4.947 3.743 3.309 3.480 4.109 México / Mexico 3.368 3.565 3.616 4.095 4.101 4.013 3.177 3.195 3.509 4.002 Espanha / Spain 2.403 2.733 2.886 2.848 2.820 2.823 2.268 2.098 2.219 2.451 BRASIL / BRAZIL 3.152 2.428 2.177 2.737 2.881 2.945 2.014 2.248 2.370 2.325 Tailândia / Thailand 1.880 1.909 1.944 1.989 2.168 2.014 1.427 1.686 1.884 1.842 Canadá / Canada 2.394 2.283 2.371 2.194 2.021 1.917 1.376 1.115 1.233 1.553 França / France 1.821 1.972 2.090 2.226 2.268 2.173 1.316 1.352 1.383 1.505 Turquia / Turkey 1.170 1.359 1.486 1.696 1.550 1.461 1.298 1.276 1.353 1.468 Tchéquia / Czech Republic 1.251 1.247 1.350 1.306 1.443 1.434 1.159 1.111 1.224 1.405 Indonésia / Indonesia 1.299 1.099 1.178 1.218 1.344 1.287 690 1.122 1.470 1.396 Irã / Iran 1.091 982 1.282 1.515 1.095 821 881 894 1.064 1.188 Eslováquia / Slovakia 971 1.039 1.040 1.032 1.093 1.108 991 1.030 982 1.080 Reino Unido / United Kingdom 1.599 1.682 1.817 1.749 1.604 1.381 987 932 877 1.025 Itália / Italy 698 1.014 1.103 1.142 1.062 915 777 797 796 880 Malásia / Malasya 597 615 545 501 565 572 485 482 702 775 Rússia / Russia 1.887 1.378 1.304 1.552 1.769 1.720 1.436 1.567 609 730 África do Sul / South Africa 566 616 599 590 611 632 447 499 556 633 Polônia / Poland 594 661 682 690 660 650 451 439 484 613 Argentina / Argentina 617 527 473 473 467 315 257 435 537 611 Marrocos / Morocco 232 288 345 342 402 403 328 403 465 536 Romênia / Romania 391 387 359 364 477 490 438 421 509 513 Hungria / Hungary 438 495 527 418 463 498 406 417 442 507 Bélgica / Belgium 517 409 399 377 308 286 267 261 285 332 Portugal / Portugal 162 157 143 176 294 346 264 290 322 318 Taiwan / Taiwan 379 351 310 292 253 251 246 265 261 286 Vietnã / Vietnam 49 172 236 236 237 176 166 168 232 177 Paquistão / Pakistan 149 230 215 251 270 187 117 239 235 80 Outros / Others 655 656 582 136 1.515 1.290 1.022 976 1.220 1.341 TOTAL / TOTAL 89.776 90.955 95.058 96.594 96.869 91.858 77.439 80.005 84.830 93.547
production
units)
TOTAL PRODUCTION
Demais países / Other countries 18% América / America 20,5% MILHÕES
Mil
units
unidades /Thousand
Referências internacionais
4.3 Licenciamento de autoveículos novos - 2014/2023 (mil unidades) 4.3 Registration of new vehicles - 2014/2023 (thousand units)
FONTES / SOURCES: ADEFA (Argentina / Argentina) AMIA (México / Mexico) ANFAVEA ANPACT (México / Mexico) Oica.
NOTA / NOTE: Os dados desta tabela compreendem vendas ou licenciamento de autoveículos produzidos no próprio país e importados. / The date of this table comprise sales or registration of nationally manufactured and imported vehicles. * A partir de 2015 os dados se referem a automóveis e comerciais leves. / *As from 2015 the data refer to cars and light commercials.

136 | Anuário da Indústria Automobilística Brasileira | Brazilian Automotive Industry Yearbook | 2024
International
data
Milhões de unidades / Million units 23,5 30,1 16,8 16,0 3,2 5,1 5,6 4,8 3,4 3,2 2014 2023 3,5 2,3 2,8 2,3 2,2 2,2 1,5 1,8 1,9 1,8 China China Estados Unidos USA Índia India Japão Japan Alemanha Germany BRASIL Brazil Reino Unido UK França France Itália Italy Canadá Canada PAÍS / COUNTRY 2014 2015 2016 2017 2018 2019 2020 2021 2022 2023 China / China 23.499 24.662 28.028 28.879 28.081 25.797 25.311 26.314 26.864 30.094 Estados Unidos / Unites States 16.843 17.846 17.866 17.551 17.701 17.488 14.881 15.409 14.230 16.009 Índia / India 3.177 3.425 3.669 4.059 4.400 3.817 2.939 3.759 4.726 5.080 Japão / Japan 5.563 5.047 4.970 5.234 5.272 5.195 4.599 4.448 4.201 4.779 Alemanha / Germany 3.357 3.540 3.709 3.810 3.822 4.017 3.267 2.973 2.964 3.204 BRASIL / BRAZIL 3.498 2.569 2.050 2.240 2.566 2.788 2.058 2.120 2.104 2.309 Reino Unido / United Kingdom 2.843 3.061 3.124 2.910 2.734 2.737 1.965 2.049 1.944 2.264 França / France 2.211 2.345 2.478 2.549 2.633 2.756 2.100 2.142 1.927 2.209 Itália / Italy 1.493 1.726 2.050 2.192 2.122 2.133 1.565 1.670 1.505 1.795 Canadá / Canada 1.890 1.940 1.984 2.039 1.985 1.976 1.586 1.705 1.563 1.765 Coreia do Sul / South Korea 1.662 1.834 1.823 1.830 1.827 1.795 1.906 1.735 1.684 1.750 México / Mexico 1.176 1.389 1.648 1.530 1.421 1.360 978 1.047 1.134 1.402 Rússia / Russia 2.592 1.441 1.404 1.658 1.821 1.779 1.631 1.742 809 1.317 Turquia / Turkey 807 1.011 1.008 980 642 492 796 773 831 1.289 Austrália / Australia 1.113 1.155 1.178 1.189 1.121 1.063 917 1.050 1.081 1.217 Espanha / Spain 1.030 1.277 1.347 1.435 1.563 1.501 1.031 1.034 959 1.128 Indonésia / Indonesia 1.195 1.031 1.048 1.070 1.153 1.030 532 887 1.048 1.006 Tailândia / Thailand 882 800 769 1.006 1.087 1.008 792 749 849 776 Arábia Saudita / Saudi Arabia 828 830 656 501 404 534 453 557 616 759 Malásia / Malasya 666 667 580 577 599 604 529 509 607 663 Polônia / Poland 392 432 505 577 633 656 510 555 518 577 Bélgica / Belgium 545 572 618 634 639 642 510 464 432 555 África do Sul / South Africa 645 618 547 547 552 533 373 451 514 532 Holanda / Netherlands 450 521 469 488 523 539 427 403 385 458 Filipinas / Philippines 235 289 360 469 401 410 244 287 359 418 Argentina* / Argentina* 614 644 709 862 774 452 334 381 376 407 Suécia / Sweden 352 397 432 443 418 418 330 344 330 342 Chile / Chile 354 298 320 369 417 349 259 416 446 329 Áustria / Austria 342 350 375 403 394 372 302 306 245 279
Mil unidades /Thousand units
4.4 América Latina - Dados automotivos - países selecionados
Latin America - Automotive data - selected countries
Fontes para produção e vendas / Sources for production and sales: ACAU - Asociación del Comercio Automotor del Uruguay (Uruguai / Uruguay ) ; ADAP - Asociación de Distribuidores de Automoviles de Panamá (Panamá / Panama); ADEFA - Asociación de Fabricantes de Automotores (Argentina /Argentina ) ; AEADE - Asociación de Empresas Automotrices del Ecuador (Bolívia, Equador, Peru, Venezuela / Bolivia, Ecuador, Peru, Venezuela ) ; Ale Montero Tech -https://alemonterotech.com/analisis-de-la-importacion-de-vehiculos-100-electricos-en-costa-rica-2023/ (Costa Rica / Costa Rica ) ; AMIA - Asociación Mexicana de la Industria Automotriz (México / Mexico ) ; ANAC - Asociación Nacional Automotriz de (Chile /Chile ) ; ANDEMOS - Asociación Colombiana de Vehículos Automotores (Colômbia / Colombia ) ; ANFAVEA - Associação Nacional dos Fabricantes de Veículos Automotores (Brasil / Brazil ) ; ANPACT - Asociación Nacional de Productores de Autobuses, Camiones y Tractocamiones (México / Mexico ) ; CADAM Camara de Distribuidores de Automotores y Maquinarias (Paraguai / Paraguay ) ; GUIA - Grupo Unido de Importadores de Automóviles (Porto Rico / Porto Rico ) ; OICA - International Organization of Motor Vehicle. Fontes para frota: ADEFA (Argentina /Argentina ) ; ANFAVEA (Brasil / Brazil ) ; DRA - La Dirección del Registro de Automotores (Paraguai / Paraguay ) ; Global Fleet - https://www.globalfleet.com/en/wikifleet/puerto-rico (Porto Rico / Porto Rico ) ; INE - Instituto Nacional de Estadística (Bolívia / Bolivia ); INE - Instituto Nacional de Estadística (Chile /Chile ) ; INEC - Instituto Nacional de Estadística y Censo (Costa Rica /Costa Rica ) ; INEC - Instituto Nacional de Estadística y Censo (Panamá / Panama ) ; INEGI - Instituto Nacional de Estadística, Geografía e Informática (México / Mexico ) ; Ministerio de Industria, Energía y Minería (Uruguai / Uruguay ) ; OICA (Equador, Peru, Venezuela / Ecuador, Peru, Venezuela ); RUNT - Registro Único Nacional de Transito (Colômbia / Colombia ) . Fonte para população: Banco Mundial. Elaboração: ANFAVEA.
1) Não inclui caminhões e ônibus.
2) Os dados de produção dizem respeito às vendas de veículos montados no país.
2024 | Anuário da Indústria Automobilística Brasileira | Brazilian Automotive Industry Yearbook | 137 2024 ANUÁRIO DA INDÚSTRIA AUTOMOBILÍSTICA BRASILEIRA Brazilian Automotive Industry Yearbook
PAÍS
COUNTRY PRODUÇÃO (em unidades) Production (units) VENDAS INTERNAS (em unidades) Domestics sales (units) FROTA (mil unidades) Fleet (thousand units) HABITANTES POR VEÍCULO Inhabitants per vehicle 2022 2023 2022 2023 2020 2020 Argentina1 / Argentina 536.893 610.715 376.257 406.940 14.025 3,2 Bolívia / Bolivia - - 45.724 51.012 1.517 7,7 BRASIL / BRAZIL 2.369.769 2.324.838 2.104.461 2.308.689 45.722 4,6 Chile / Chile - - 445.937 329.588 5.297 3,6 Colômbia / Colombia 51.455 34.700 262.595 186.826 5.660 9,0 Costa Rica / Costa Rica - - 40.048 54.554 1.277 4,0 Equador 2 / Ecuador 20.310 18.789 135.250 132.402 2.678 6,6 México / Mexico 3.509.101 4.002.047 1.134.443 1.402.428 44.929 2,9 Panamá / Panama - - 42.169 48.919 850 5,0 Paraguai / Paraguay - - 35.748 31.397 1.560 4,6 Peru / Peru - - 177.543 181.812 2.945 11,0 Porto Rico / Puerto Rico - - 123.604 128.531 2.130 1,5 Uruguai / Uruguay - - 55.056 60.487 978 3,6 Venezuela / Venezuela - - 3.998 7.313 4.235 6,7 TOTAL / TOTAL 6.487.528 6.991.089 4.982.833 5.330.898 133.805 4,3
4.4
/
Referências internacionais
4.5 Mercosul - Dados automotivos - 2022/2023 (unidades) 4.5
Mercosur - Automotive data - 2022/2023 (units)
FONTES/ SOURCES : ACAU - Asociación del Comercio Automotor del Uruguay (Uruguai / Uruguay); ADEFA - Asociación de Fabricantes de Automotores (Argentina / Argentina); ANFAVEA -Associação Nacional de Fabricantes de Veículos Automotores (Brasil / Brazil); CADAM - Camara de Distribuidores de Automotores y Maquinarias (Paraguai / Paraguay). Nota/ Note: Produção e exportações do Brasil dizem respeito a autoveículos montados./ Production and exports from Brazil refer to assembled vehicles. ND - não disponível / NA - not available unidades /
138 | Anuário da Indústria Automobilística Brasileira | Brazilian Automotive Industry Yearbook | 2024
International data
A RGENTINA / Argentina BRASIL / Brazil PARAGUAI / Paraguay URUGUAI / Uruguay TOTAL / Total 2022 2023 2022 2023 2022 2023 2022 2023 2022 2023 PRODUÇÃO / Production Automóveis / Cars 257.505 304.773 1.824.833 1.782.079 - - - - 2.082.338 2.086.852 Comerciais leves / Light commercials 279.388 305.942 351.167 421.626 - - - - 630.555 727.568 Caminhões / Trucks ND / NA ND / NA 161.992 100.535 - - - - ND / NA ND / NA Ônibus / Buses ND / NA ND / NA 31.777 20.598 - - - - ND / NA ND / NA TOTAL / TOTAL ND / NA ND / NA 2.369.769 2.324.838 - - - - ND / NA ND / NA VENDAS INTERNAS / Domestic sales / Total (nacionais e importados) / Total (nationally manufactured and imported) Automóveis e comerciais leves / Cars and light commercials 376.257 406.940 1.960.461 2.180.230 34.185 29.720 52.226 57.592 2.423.129 2.674.482 Caminhões e ônibus / Trucks and buses ND / NA ND / NA 144.000 128.459 1.563 1.677 2.830 2.895 ND / NA ND / NA TOTAL / TOTAL ND / NA ND / NA 2.104.461 2.308.689 35.748 31.397 55.056 60.487 ND / NA ND / NA EXPORTAÇÕES / Exports Automóveis / Cars 139.671 146.411 386.422 308.228 - - - - 526.093 454.639 Comerciais leves / Light commercials 182.615 179.483 63.918 73.771 - - - - 246.533 253.254 Caminhões
/ Trucks and buses ND / NA ND / NA 30.589 21.920 - - - - ND / NA ND / NA TOTAL / TOTAL ND / NA ND / NA 480.929 403.919 - - - - ND / NA ND / NA
e ônibus
units

ASSOCIAÇÃO NACIONAL DOS FABRICANTES DE VEÍCULOS AUTOMOTORES
CHAPTER 5 Organizations CAPÍTULO 5 Entidades 5
Entidades Organizations
5.1 Entidades da indústria de autoveículos – Internacionais
5.1 Motor vehicle organizations – International


ACEA – EUROPEAN AUTOMOBILE MANUFACTURER’S ASSOCIATION
Rond-Point Schuman 6 - 1040 – Brussels (Bélgica / Belgium)
Tel.: +32 (0) 2 732 55 50 | https://www.acea.auto
ADEFA – ASOCIACIÓN DE FÁBRICAS DE AUTOMOTORES
Viamonte, 1.133, 7º piso – Buenos Aires (Argentina / Argentina)
Tel.: +54 11 4372–4002 | http://www.adefa.org.ar
ALLIANCE OF AUTOMOBILE MANUFACTURERS
1050 K Street, NW, Suite 650 – Washington, DC
Tel: +202 326–5500 | https://www.autosinnovate.org/
AMIA – ASOCIACIÓN MEXICANA DE LA INDÚSTRIA AUTOMOTRIZ
Ensenada 90, Hipódromo, Cuauhtémoc – Ciudad de México (México / Mexico)
Tel.: +52 55 5272-1144 | https://www.amia.com.mx/
ANAC – ASOCIACIÓN NACIONAL AUTOMOTRIZ E CHILE A.G.
Avda. Presidente Kennedy 9.070, Of 702, Vitacura – Santiago (Chile / Chile)
Tel.: +562 237 18 390 | https://www.anac.cl

ANFAC – ASOCIACIÓN ESPAÑOLA DE FABRICANTES DE AUTOMÓVILES Y CAMIONES
Calle Oquendo, 23 – Planta 3 – Madrid (Espanha / Spain)
Tel.: +34 91 3431343 | https://anfac.com

ANFIA – ASSOCIAZIONE NAZIONALE FILIERA INDUSTRIA AUTOMOBILISTICA
Corso Galileo Ferraris, 61 – Torino (Itália / Italy)
Tel.: +39 011 55 46 511 | www.anfia.it

ANPACT – ASOCIACIÓN NACIONAL DE PRODUCTORES DE AUTOBUSES, CAMIONES Y TRACTOCAMIONES
Paseo de las Palmas, 1.650 – Col. Lomas de Chapultepec
Ciudad de México (México / Mexico)
Tel.: +55 5202–4900 | http://www.anpact.com.mx

CAAM – CHINA ASSOCIATION OF AUTOMOBILE MANUFACTURERS
15/F, Block A, Huirong Building – 106 Lianhuachi E. Rd, Xicheng District –
Beijing (China / China)
Tel.: +86 10 639 79 900 | http://www.caam.org.cn/english
Presidente / President: Luca
Presidente / President: Martin Zuppi
Presidente / President: John Bozzella
Presidente / President: José Zozaya
Presidente / President: Sebastián de Cárcer Prado
Presidente / President: D. Wayne Griffiths
Presidente / President: Roberto Vavassori
Presidente / President: Miguel Heberto Elizalde Lizarraga
Presidente / President: Zhu Yanfeng
140 | Anuário da Indústria Automobilística Brasileira | Brazilian Automotive Industry Yearbook | 2024
de Meo
–


CCFA – COMITÉ DES CONSTRUCTEURS FRANÇAIS D’AUTOMOBILES
2. Rue de Presbourg – Paris (França / France)
Tel.: +33 1 4952–5100 | https://ccfa.fr
CVMA – CANADIAN VEHICLE MANUFACTURER’S ASSOCIATION
116 Albert Street, Suite 300 – Ottawa, Ontario
Tel.: +1 416 364 9333 | http://www.cvma.ca
JAMA – JAPAN AUTOMOBILE MANUFACTURERS ASSOCIATION
Jidosha Kaikan, 16th floor – 1-30 – Shiba Daimon 1-chome, Minato-ku – Tokyo |
Tel.: +81 3 5405 6126 | http://www.jama-english.jp/
KAMA – KOREA AUTOMOBILE MANUFACTURERS ASSOCIATION
25 Banpodaero, Seocho-gu – Seoul, Korea
Tel.: +82 2 3660 1800 | http://www.kama.or.kr

NAAMSA – NATIONAL ASSOCIATION OF AUTOMOBILE MANUFACTURERS OF SOUTH AFRICA
Block F, Alenti Office Park – 457 Witherite St – The Willows, X82 –
Pretoria (África do Sul / South Africa)
Tel.: +12 807 0152 | https://naamsa.net/

OICA – INTERNATIONAL ORGANIZATION OF MOTOR VEHICLE MANUFACTURERS
Rue de Berri, 4 – Paris (França / France)
Tel.: +33 1 43 59 00 13 | http://www.oica.net


SIAM - SOCIETY OF INDIAN AUTOMOBILE MANUFACTURERS
Core 4-B, 5th Floor – India Habitat Centre – Lodhi Road, New Delhi
Tel.: +91-11-24647810 | https://www.siam.in/
SMMT – SOCIETY OF MOTOR MANUFACTURERS AND TRADERS
71 Great Peter Street – London (Reino Unido / UK)
Tel.: +44 0 207 235 7000 | https://www.smmt.co.uk
VDA – VERBAND DER AUTOMOBILINDUSTRIE
Behrenstrasse 35, 10117 – Berlin (Alemanha / Germany)
Tel.: +49 30 897–8420 | https://www.vda.de/de
Presidente / President: Jean-Luc Brossard
Presidente / President: Brian Kingston
Presidente / President: Masanori Katayama
Presidente / President: Nam-hoon Kang
Presidente / President: Billy Tom
Presidente / President: John Bozzella
Presidente / President: Vinod Aggarwal
Presidente / President: Mike Flanagan
Presidente / President: Hildegard Müller
2024 | Anuário da Indústria Automobilística Brasileira | Brazilian Automotive Industry Yearbook | 141
ANUÁRIO DA INDÚSTRIA AUTOMOBILÍSTICA BRASILEIRA Brazilian Automotive Industry Yearbook
2024
5.1 Entidades da indústria de autoveículos
Internacionais 5.1 Motor vehicle organizations – International
Entidades Organizations
5.2 Entidades da indústria de autoveículos – Nacionais
5.2 Motor vehicle organizations – Nationally


ABAC – ASSOCIAÇÃO BRASILEIRA DE ADMINISTRADORAS DE CONSÓRCIOS
Rua Avanhandava, 126 – 5º andar – Bela Vista – São Paulo/SP
Tel.: (11) 3155-5252 | https://abac.org.br | Consórcios / Consortiums
ABAG – ASSOCIAÇÃO BRASILEIRA DO AGRONEGÓCIO
Av. Paulista, 1754 – 14º andar – Conj. 147 – São Paulo/SP
Tel.: (11) 3285-3100 | http://www.abag.com.br | Agronegócio / Agrobusiness
ABAL – ASSOCIAÇÃO BRASILEIRA DO ALUMÍNIO
Av. Dr. Cardoso de Melo, 1.308 – 4º andar – Vila Olímpia – São Paulo/SP
Tel.: (11) 5904-6450 | http://abal.org.br
Indústria do alumínio / Aluminum industry
ABEIFA – ASSOCIAÇÃO BRASILEIRA DAS EMPRESAS IMPORTADORAS E FABRICANTES DE VEÍCULOS AUTOMOTORES
R. Dr. Renato Paes de Barros, 717 – Conj. 113 – 11º Andar – Itaim Bibi – São Paulo/SP
Tel.: (11) 3168-0658 | www.abeifa.com
Importadores e fabricantes de autoveículos / Importers ad manufactures of vehicles
ABIMAQ – ASSOCIAÇÃO BRASILEIRA DA INDÚSTRIA DE MÁQUINAS E EQUIPAMENTOS
Av. Jabaquara, 2925 – Mirandópolis – São Paulo/SP
Tel.: (11) 5582-6311 | http://www.abimaq.org.br
Indústria de máquinas / Machine industry
ABLA – ASSOCIAÇÃO BRASILEIRA DAS LOCADORAS DE AUTOMÓVEIS
R. Estela 515, Bloco. A, 5º Andar - Vila Mariana – São Paulo/SP
Tel.: (11) 5087-4100 | https://www.abla.com.br
Locadoras de automóveis / Car renting companies
ABNT – ASSOCIAÇÃO BRASILEIRA DE NORMAS TÉCNICAS
Rua Conselheiro Nebias, 1.131 – Campos Elíseos – São Paulo/SP
Tel.: (11) 3017-3600 | https://www.abnt.org.br
Normas técnicas / Technical normalization
ABRACICLO – ASSOCIAÇÃO BRASILEIRA DOS FABRICANTES
DE MOTOCICLETAS, CICLOMOTORES, MOTONETAS, BICICLETAS E SIMILARES
R. Américo Brasiliense, 2171 – Cj. 907 a 910 – Chácara Santo Antônio – São Paulo/SP
Tel.: (11) 5181-0222 | http://www.abraciclo.com.br
Indústria de motocicletas / Motorcycle industry
ABRAMET – ASSOCIAÇÃO BRASILEIRA DE MEDICINA DE TRÁFEGO
Rua Afonso Celso, 552 – Cjs. 51/52 – Vila Mariana – São Paulo/SP
Tel.: (11) 5083-2458 | https://www.abramet.com.br
Medicina de tráfego / Traffic medicine
ABRATI – ASSOCIAÇÃO BRASILEIRA DAS EMPRESAS DE TRANSPORTE TERRESTRE DE PASSAGEIROS
SAUS Quadra 1 Bloco J – Edifício CNT – 8º andar – Entrada 10/20, Torre A – Brasília/DF
Tel.: (61) 3322v2004 | http://www.abrati.org.br
Transporte rodoviário de passageiros / Highway passenger transportation
ABVE – ASSOCIAÇÃO BRASILEIRA DO VEÍCULO ELÉTRICO
R. Baronesa de Bela Vista, 675 – Vila Congonhas – São Paulo/SP
Tel.: (11) 9816-32931 | https://http://www.abve.org.br/
Veículos elétricos / Electric vehicles
ACREFI – ASSOCIAÇÃO NACIONAL DAS INSTITUIÇÕES DE CRÉDITO, FINANCIAMENTO E INVESTIMENTO
R. Líbero Badaró, 425 – 28º andar – Centro – São Paulo/SP
Tel.: (11) 3107-7177 | www.acrefi.org.br
Serviços financeiros e crédito / Financial passenger and credit
Presidente / President: Paulo Roberto Rossi
Presidente / President: Luiz Carlos Corrêa Carvalho
Presidente / President: Ricardo Rodrigues de Carvalho
Presidente / President: João Oliveira
Presidente / President: Gino Paulucci Junior
Presidente / President: Marco Aurélio Gonçalves Nazaré
Presidente / President: Mario William Esper
Presidente / President: Marcos Antonio Bento de Sousa
Presidente / President:
Presidente / President:
Presidente / President:
Presidente / President: José
142 | Anuário da Indústria Automobilística Brasileira | Brazilian Automotive Industry Yearbook | 2024
Dr. Antonio Edson Souza Meira Júnior
Paulo Alencar Porto Lima
Ricardo Bastos
Tadeu da Silva
5.2 Entidades da indústria de autoveículos – Nacionais
5.2 Motor vehicle organizations – Nationally


AEA – ASSOCIAÇÃO BRASILEIRA DE ENGENHARIA AUTOMOTIVA
Rua Salvador Correa, 80 – Aclimação – São Paulo/SP
Tel.: (11) 5908-4043 | https://aea.org.br
Engenheiros automotivos/ Automotive engineers
ANAV – ASSOCIAÇÃO NACIONAL DE EMPRESAS DE ALUGUEL DE VEÍCULOS E GESTÃO DE FROTAS
Rua Araguari, 817 – 10º andar – Cj. 105 – Moema – São Paulo/SP
Tel.: (11) 2936-8705 | http://www.anav.org.br
Aluguel de veículos e gestão de frotas / Car rent and fleet management
ANEF – ASSOCIAÇÃO NACIONAL DAS EMPRESAS FINANCEIRAS DAS MONTADORAS
Alameda dos Maracatins, 992 – Bloco B – 11º Andar – Cjs.112/114 – São Paulo/SP
Tel.: (11) 5531-7314 | http://www.anef.com.br
Serviços financeiros da indústria automobilística /Financial services for the automotive industry
ANFAVEA – ASSOCIAÇÃO NACIONAL DOS FABRICANTES DE VEÍCULOS AUTOMOTORES
Av. Indianópolis, 496 – São Paulo/SP
Tel. (11) 2193-7800 | www.anfavea.com.br
ANFIR – ASSOCIAÇÃO NACIONAL DOS FABRICANTES DE IMPLEMENTOS RODOVIÁRIOS


R. Conselheiro Saraiva, 306 – CJ. 55 – Santana – São Paulo/SP
Tel.: (11) 2972-5577 | https://www.anfir.org.br
Implementos rodoviários / Truck trunks and accessories
ANIP – ASSOCIAÇÃO NACIONAL DA INDÚSTRIA DE PNEUMÁTICOS
Rua André Ampere, 65 – 3º andar – Brooklin Paulista – São Paulo/SP
Tel.: 11 5503-5400 | http://www.anip.com.br
Indústria de pneumáticos / Pneumatic industry
ANTP – ASSOCIAÇÃO NACIONAL DE TRANSPORTES PÚBLICOS
Rua Marconi, 34 – 2º Andar – Cjs. 21/22 – Centro – São Paulo/SP
Tel.: (11) 3253-8095 | www.antp.org.br
Transportes públicos / Public transportation
APEXBRASIL – AGÊNCIA BRASILEIRA DE PROMOÇÃO DE EXPORTAÇÕES E INVESTIMENTOS
SAUN – Quadra 5 – Lote C – Torre B – 12º a 18º andar – Asa Norte – Brasília/DF
Tel.: (61) 2027-0202 | https://portal.apexbrasil.com.br
Agência de promoção de exportações e investimentos / Trade and investment promotion agency
BNDES – BANCO NACIONAL DE DESENVOLVIMENTO ECONÔMICO E SOCIAL
Av. República do Chile, 100 – Rio de Janeiro/RJ
Tel.:(21) 3747-7447 | https://www.bndes.gov.br/
Banco federal de crédito / Federal credit bank
CNI – CONFEDERAÇÃO NACIONAL DA INDÚSTRIA
SBN – Quadra 1 – Bloco C – Ed. Roberto Simonsen – Brasília/DF
Tel.: (61) 3317-9000 | http://www.portaldaindustria.com.br/cni
Indústra / Industry
CNT – CONFEDERAÇÃO NACIONAL DO TRANSPORTE
SAUS Q.1 – Bloco J – Entradas 10 e 20 – Ed. Clésio Andrade – Brasília/DF
Tel.: (61) 2196-5700 | https://www.cnt.org.br/home | Transporte / Transportation
FABUS – ASSOCIAÇÃO NACIONAL DOS FABRICANTES DE ÔNIBUS
Avenida Paulista, 1.636, – Conjunto 04 – Bela Vista – São Paulo/SP
Telefone: (11) 94597-4334 | https://fabus.com.br
Indústria de carrocerias de ônibus / Bus body department
FENABRAVE – FEDERAÇÃO NACIONAL DA DISTRIBUIÇÃO DE VEÍCULOS AUTOMOTORES
Av. Indianópolis, 1967 – Planalto Paulista – São Paulo/SP
Tel.: (11) 94597-4334 | www.fenabrave.org.br
Concessionários de autoveículos, motocicletas e máquinas agrícolas / Vehicle, motorcycle and agricultural machinery dealers
/
Presidente / President: Márcio de Lima Leite
Presidente / President: José Carlos Sprícigo
Presidente / President: Klaus Curt Müller
Presidente / President: Ailton Brasiliense Pires
Presidente / President: Jorge Ney Viana Macedo Neves
Presidente / President: Aloizio Mercadante
Presidente / President: Antonio Ricardo Alvarez Alban
Presidente / President: Vander Francisco Costa
Presidente / President: Ruben Antonio Bisi
Presidente / President: José Maurício Andreta Jr.
2024 | Anuário da Indústria Automobilística Brasileira | Brazilian Automotive Industry Yearbook | 143
ANUÁRIO DA INDÚSTRIA AUTOMOBILÍSTICA BRASILEIRA Brazilian Automotive Industry Yearbook
2024
Presidente / President: Marcus Vinícius Aguiar
Presidente / President: Paulo Saab
Presidente
President: Paulo Henrique Lage Noman
Entidades Organizations
5.2 Entidades da indústria de autoveículos – Nacionais
5.2 Motor vehicle organizations – Nationally
FENAUTO – FEDERAÇÃO NACIONAL


SENATRAN


DAS ASSOCIAÇÕES DOS REVENDEDORES DE VEÍCULOS AUTOMOTORES
Av. Marquês de São Vicente,1619 – Sala 2319 – Barra Funda – São Paulo/SP
Tel.: (11) 2533-7532| www.fenauto.org.br
Revendedores de autoveículos seminovos e usados / Second–hand vehicle dealers
INSTITUTO AÇO BRASIL
Rua do Mercado, 11 – 18º andar – Rio de Janeiro/RJ
Tel.: (21) 3445-6300 | https://acobrasil.org.br/site/
Indústria do aço / Steel industry
IQA – INSTITUTO DA QUALIDADE AUTOMOTIVA
R. Nicolau Barreto, 643 – Vila Cordeiro – São Paulo/SP
Tel.: (11) 3181-9181 | www.iqa.org.br
Qualidade automotiva e certificações / Automotive quality and certifications
NTC&LOGÍSTICA – ASSOCIAÇÃO NACIONAL DO TRANSPORTE DE CARGAS E LOGÍSTICA
Rua Orlando Monteiro, 21 – Vila Maria – São Paulo/SP
Tel.: (11) 2632-1500 | https://www.portalntc.org.br
Transporte de cargas e logística / Cargo transportation and logistics
NTU – ASSOCIAÇÃO NACIONAL DAS EMPRESAS DE TRANSPORTES URBANOS
SAUS Quadra 1 – Bloco J – Edifício CNT – Ala A – 9º andar – Brasília/DF
Tel.: (61) 2103-9293 | https://www.ntu.org.br
Transporte urbano de passageiros / Urban passenger transportation
RX BRASIL
R. Bela Cintra, 1200 – 7º Andar – Consolação – São Paulo/SP
Tel.: (11) 3060-5000 | https://rxglobal.com/
Feiras automotivas e outras / Automotive fairs and others
SAE BRASIL
Av. Paulista, 2073 – Ed. Horsa II – 10º andar – Conjunto 1.001 – São Paulo/SP
Tel.: (11) 3142-3489 | http://portal.saebrasil.org.br
Engenheiros automotivos / Automotive engineers
SENATRAN - SECRETARIA NACIONAL DE TRÂNSITO
Ed. Sede do MT, TérreoI – Ala Sul – Brasília/DF
Tel.: (61) 2029-8090
https://www.gov.br/infraestrutura/pt-br/assuntos/senatran
Secretaria Nacional de Trânsito / National Traffic Secretary
SIMEFRE – SINDICATO INTERESTADUAL DA INDÚSTRIA DE MATERIAIS E EQUIPAMENTOS FERROVIÁRIOS E RODOVIÁRIOS
Av. Paulista, 1313 – 8º andar – Cj. 801 – São Paulo/SP
Tel.: (11) 3289-9166 | http://simefre.org.br
Equipamentos rodoviários e ferroviários / Highway construction and railway equipment
SINDICATO NACIONAL DA INDÚSTRIA DE COMPONENTES PARA VEÍCULOS AUTOMOTORES
Avenida das Nações Unidas, 11.541 – 16.º andar – São Paulo/SP
Tel.: (11) 3848–4848 | https://www.sindipecas.org.br
Indústria de autopeças / Autoparts industry
SINDIREPA BRASIL – ASSOCIAÇÃO DE ENTIDADES OFICIAIS DA REPARAÇÃO DE VEÍCULOS DO BRASIL
Av. Paulista, 1313 – 4º andar – São Paulo/SP
Tel.: (11) 3549-4749 | https://www.sindirepabrasil.org.br
Indústria de reparação de autoveículos / Vehicles fixing
UNICA – UNIÃO DA INDÚSTRIA DE CANA-DE-AÇÚCAR
Av. Brigadeiro Faria Lima, 4055 – 1° andar – Sala 114 - Itaim Bibi -São Paulo/SP
Tel.: (11) 3093-4949 | https://www.unica.com.br
Produtores de etanol / Ethanol producers
Presidente / President:
Presidente / President: Jefferson
/ President:
Presidente / President: Eduardo Ferreira Rebuzzi
Presidente / President: Francisco Christovam
Diretor Executivo/ CEO: Claudio Della Nina
Presidente / President: Andre Gasparotti
Secretário Nacional de Transito / National Secretary of Transit: Adrualdo de Lima Catão
Presidente / President: José Antonio Fernandes Martins
Presidente / President: Cláudio Sahad
Presidente / President: Antonio Carlos Fiola Silva
Presidente / President: Evandro Gussi
144 | Anuário da Indústria Automobilística Brasileira | Brazilian Automotive Industry Yearbook | 2024
Enilson Espínola Sales de Souza
de Paula
Presidente
Claudio Luis Russo Moyses
VOCÊ SABIA QUE
A TOYOTA FABRICA
VEÍCULOS HÍBRIDOS
FLEX NO BRASIL
DESDE 2019?
TOYOTA:


A
MARCA LÍDER EM VENDAS DE VEÍCULOS
*Emplacamentos de veículos eletrificados – Fenabrave/2023. Paz no trânsito começa por você!
ELETRIFICADOS EM 2023*!
PAZ NO TRÂNSITO COMEÇA POR VOCÊ.
O futuro pede passagem, você vem?
Quando o assunto é o futuro da mobilidade, quatro palavras não podem faltar: conectividade, eletrificação, autonomia e compartilhamento.
Pensando nisso, a Mercedes-Benz Cars & Vans, uma das companhias do setor automotivo mais bemsucedidas do mundo e um dos principais fornecedores globais dos segmentos de automóveis de luxo e vans premium, trabalha para moldar o futuro da mobilidade de forma sustentável com o foco em performance, em tecnologias inovadoras e na experiência do cliente.
À frente do seu tempo, a Mercedes-Benz carrega a inovação e o pioneirismo em seu DNA desde 1886, quando os fundadores da empresa, Gottlieb Daimler e Karl Benz, fizeram história ao inventar o automóvel.
Com o intuito de manter-se na vanguarda da engenharia automotiva, a marca continua a investir
sistemicamente no desenvolvimento de powertrains eficientes e define o caminho para uma mobilidade totalmente elétrica, livre de emissões e guiada por novas tecnologias.
Consegue ouvir? Os motores de um futuro eletrificado se aproximam e estão à sua disposição. Embarque e viva uma experiência única, uma experiência Mercedes-Benz.