Alex Haddad, Jordy Hendrikx, Tore Humstad, Emil Solbakken, Jerry Johnson, Eric Sproles


• Snow avalanches pose a hazard to numerous public roadways throughout the world.
• Avalanche forecasters are tasked with determining the likelihood and size of avalanche events.
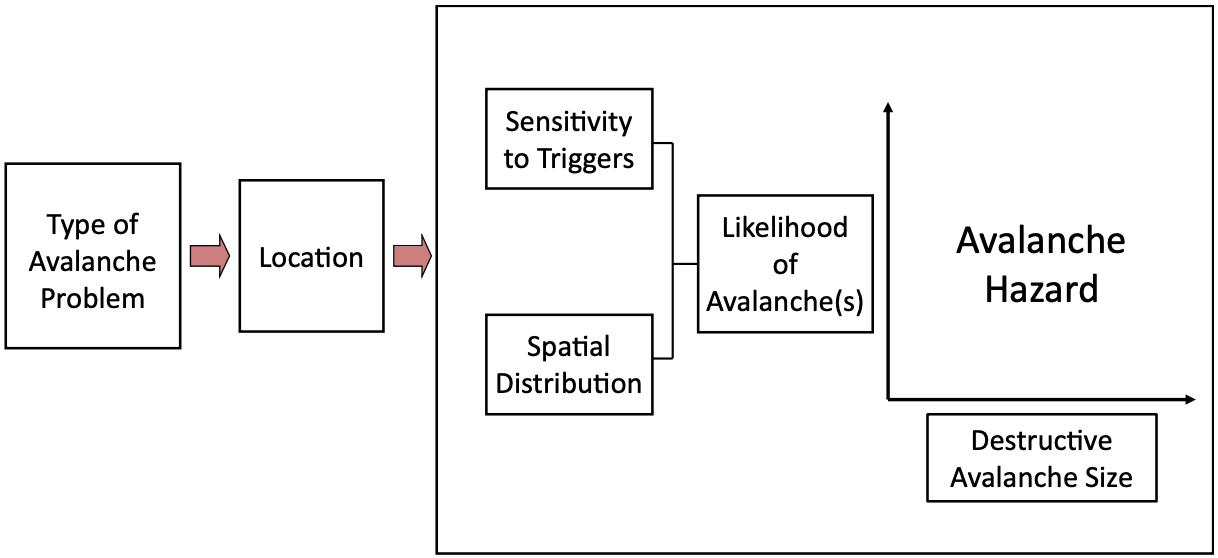
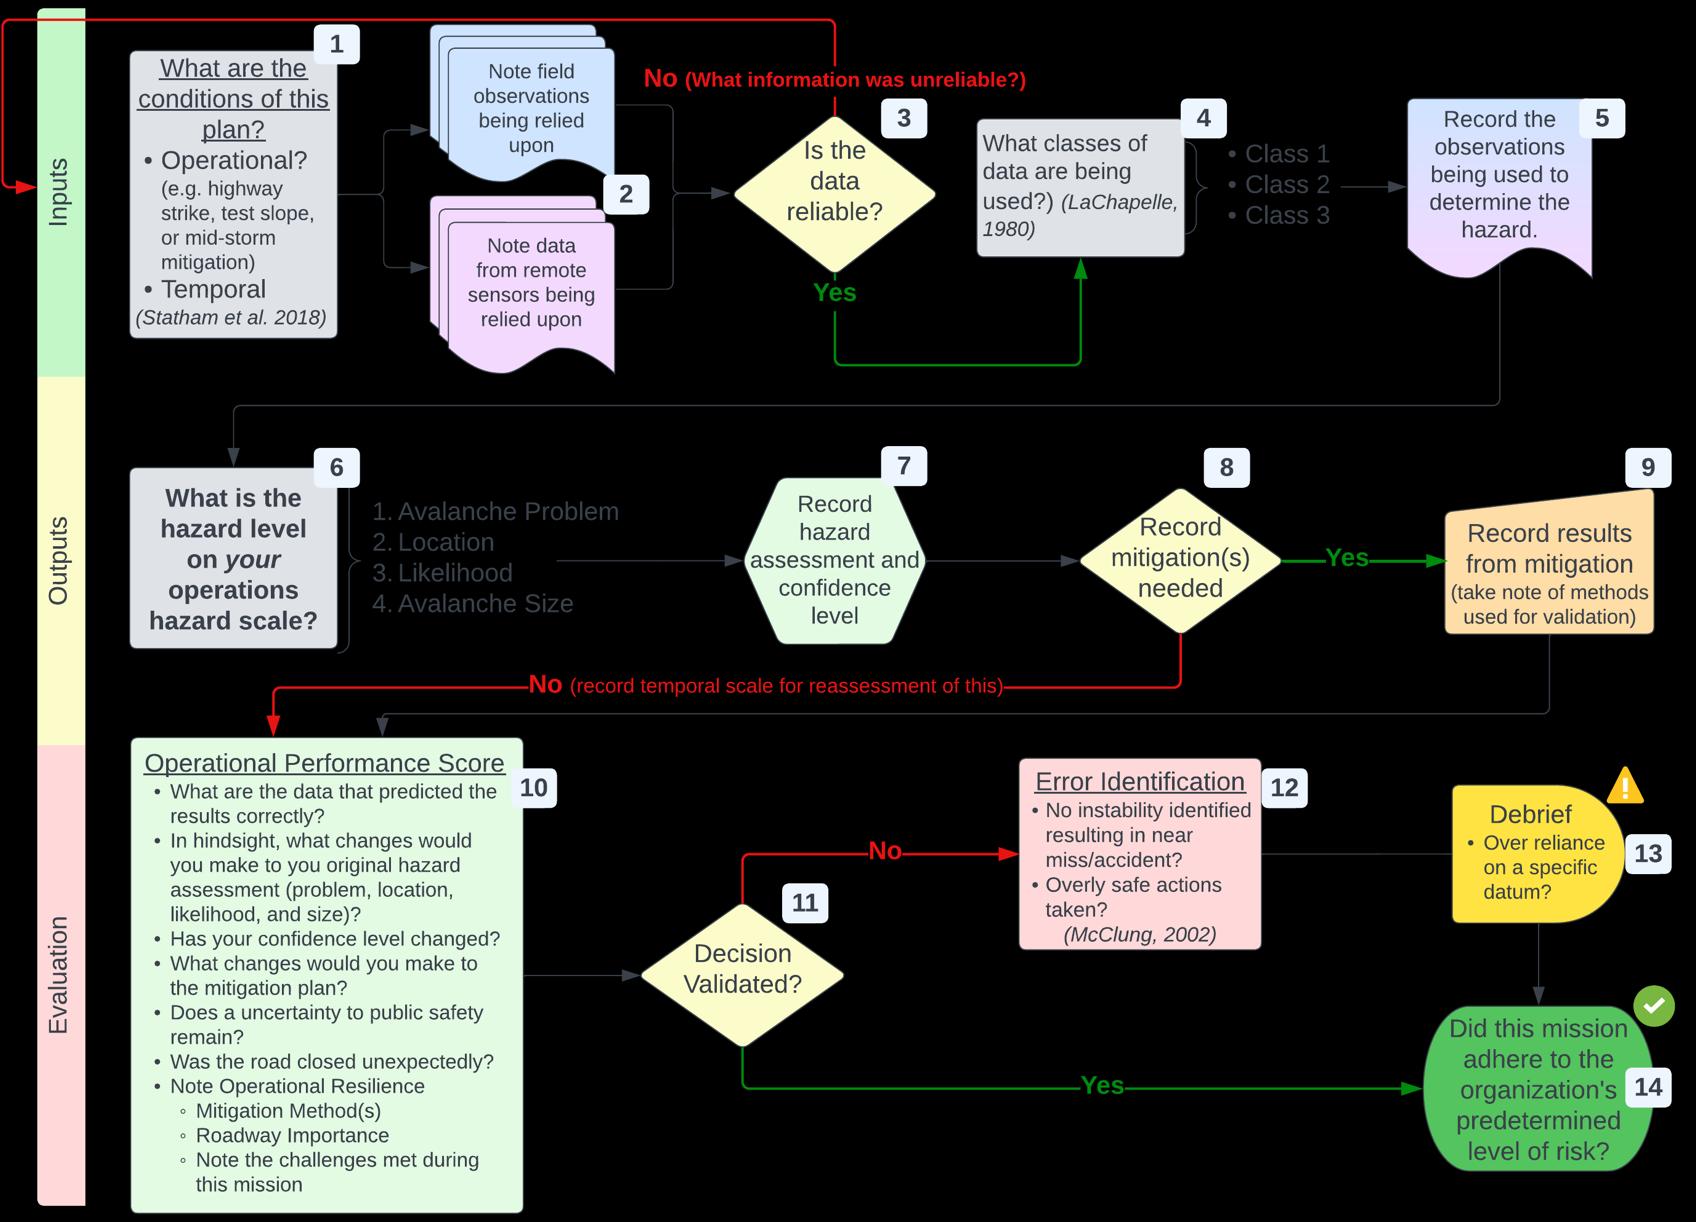
Conceptual Model of Avalanche Hazard used for assessing pertinent observations during hazard assessment process (Statham et al., 2018)
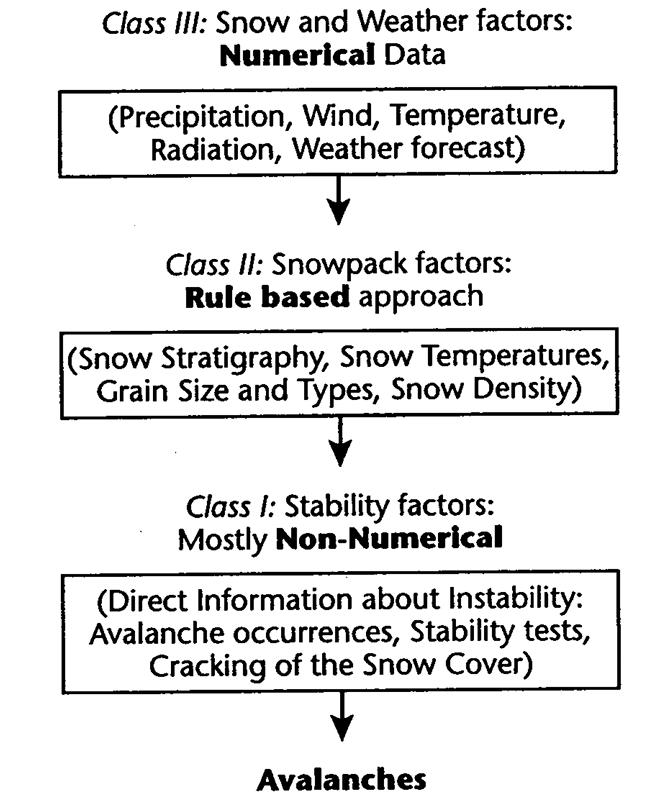
• Informational entropy of data elements in three classes for interpreting instability.
• The lower the class number the more relevant and more easily interpreted are the data.
• To reduce uncertainty, forecasters prefer low entropy data (e.g., evidence of avalanches)

The objective of the study was to answer if data entropy from remotely sensed data result in a statistically significant change in forecasting: (1) avalanche size, (2) likelihood(s), (3) avalanche problem type, and (4) avalanche hazard level?
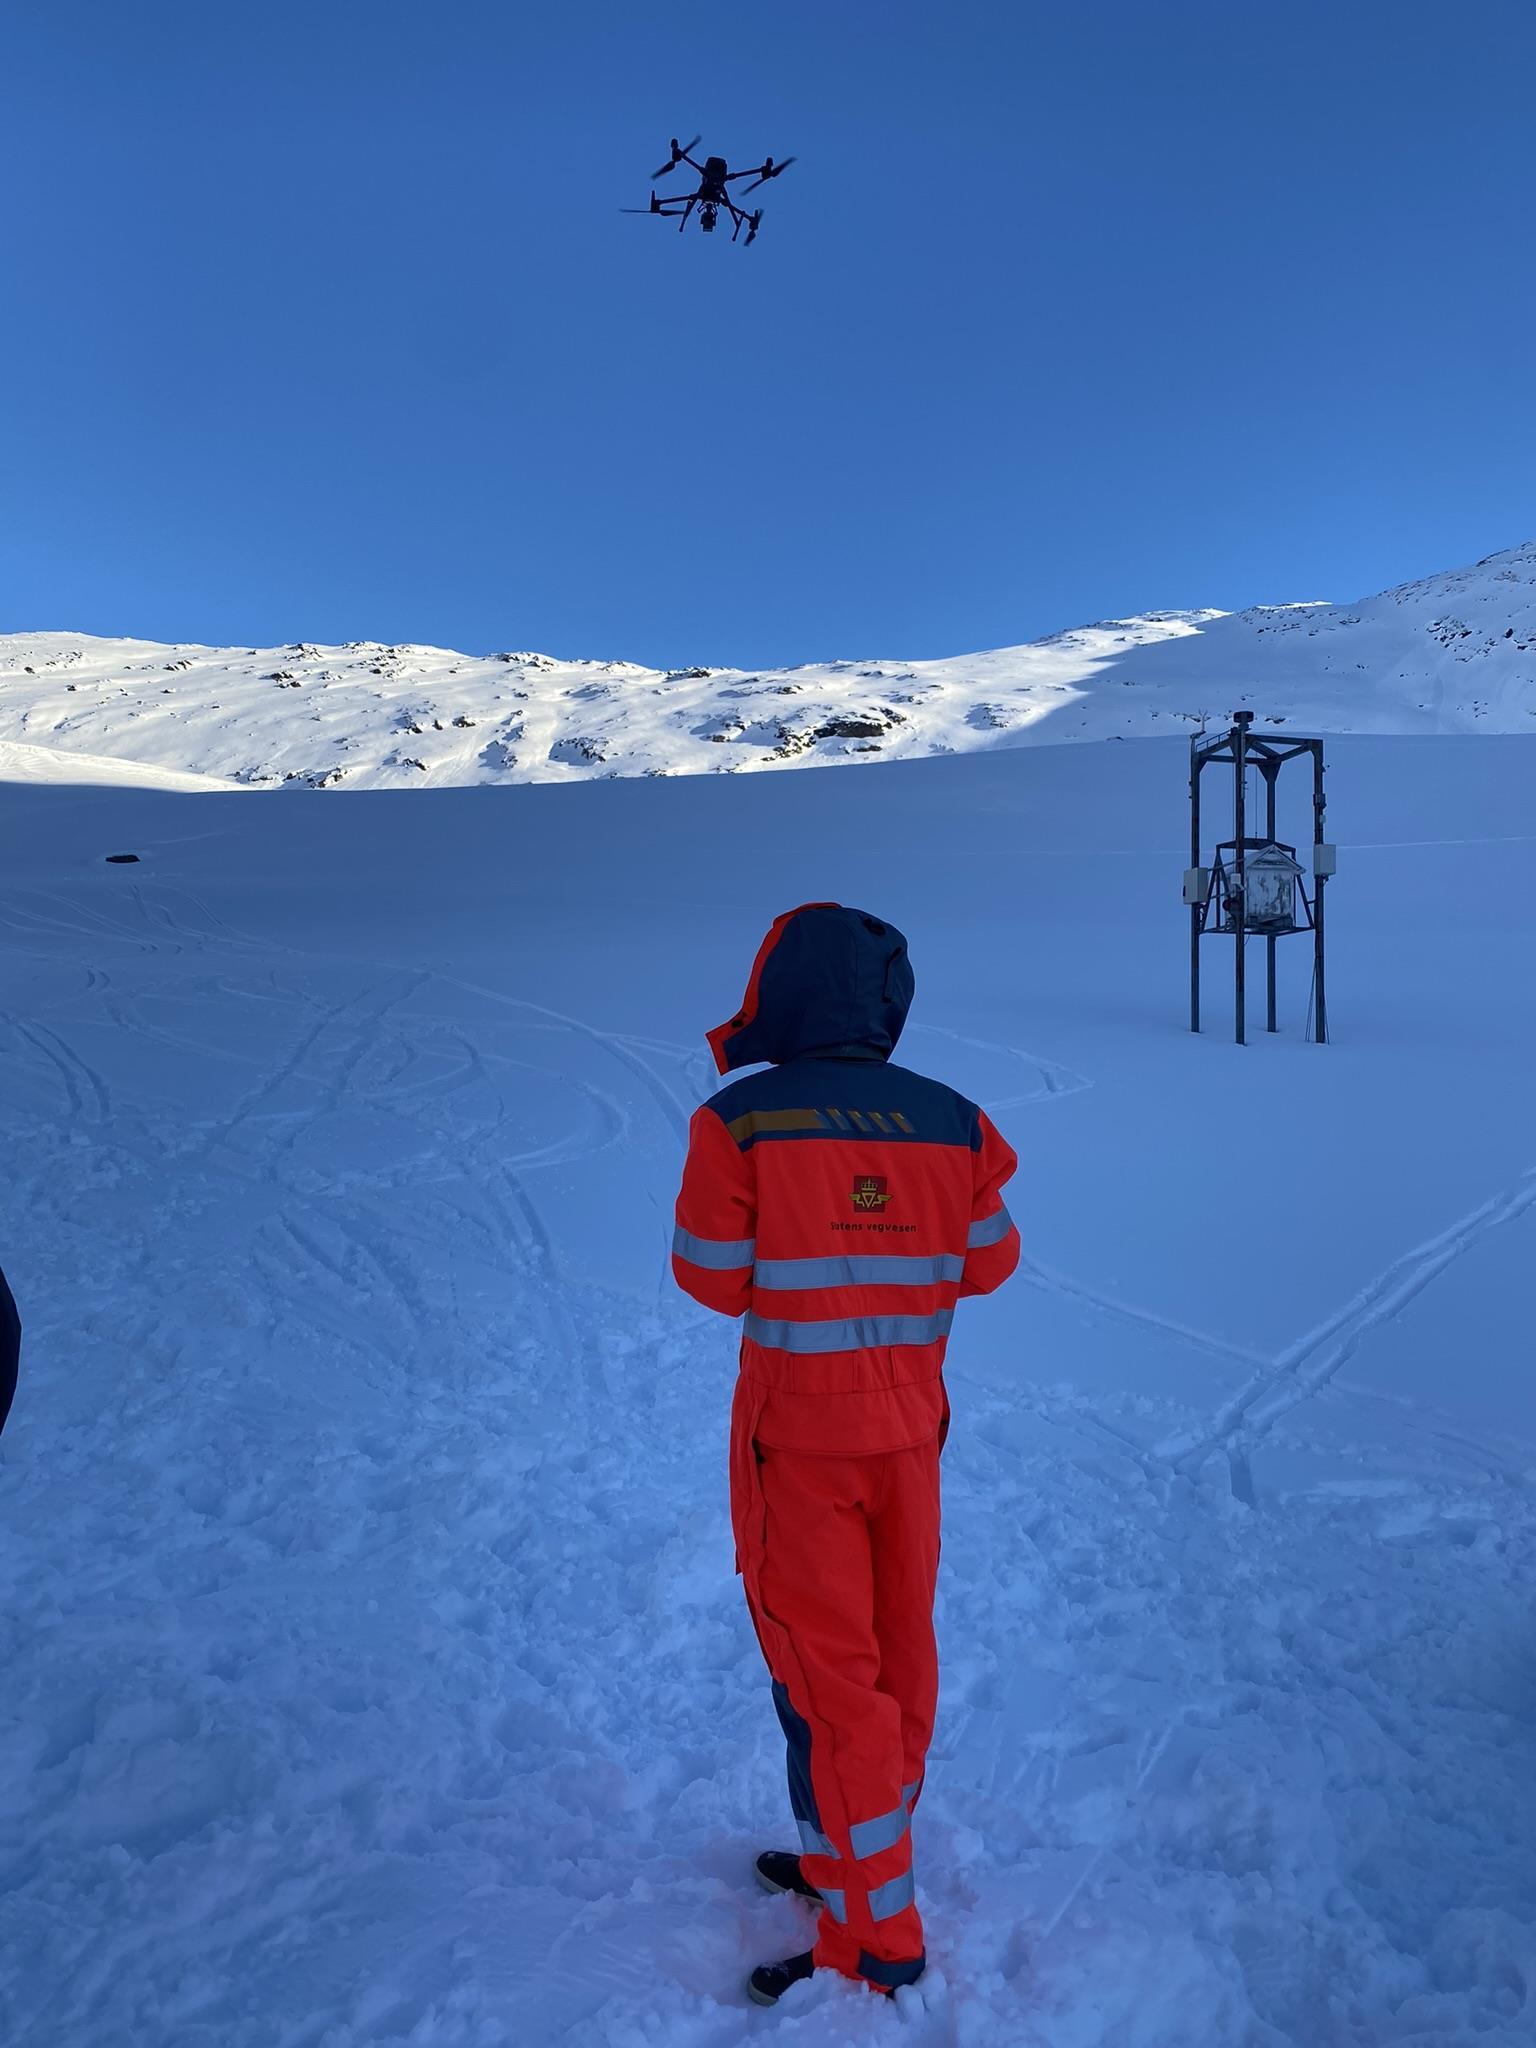
Part of the GEOSFAIR project (Geohazard Survey from Air)
Methods

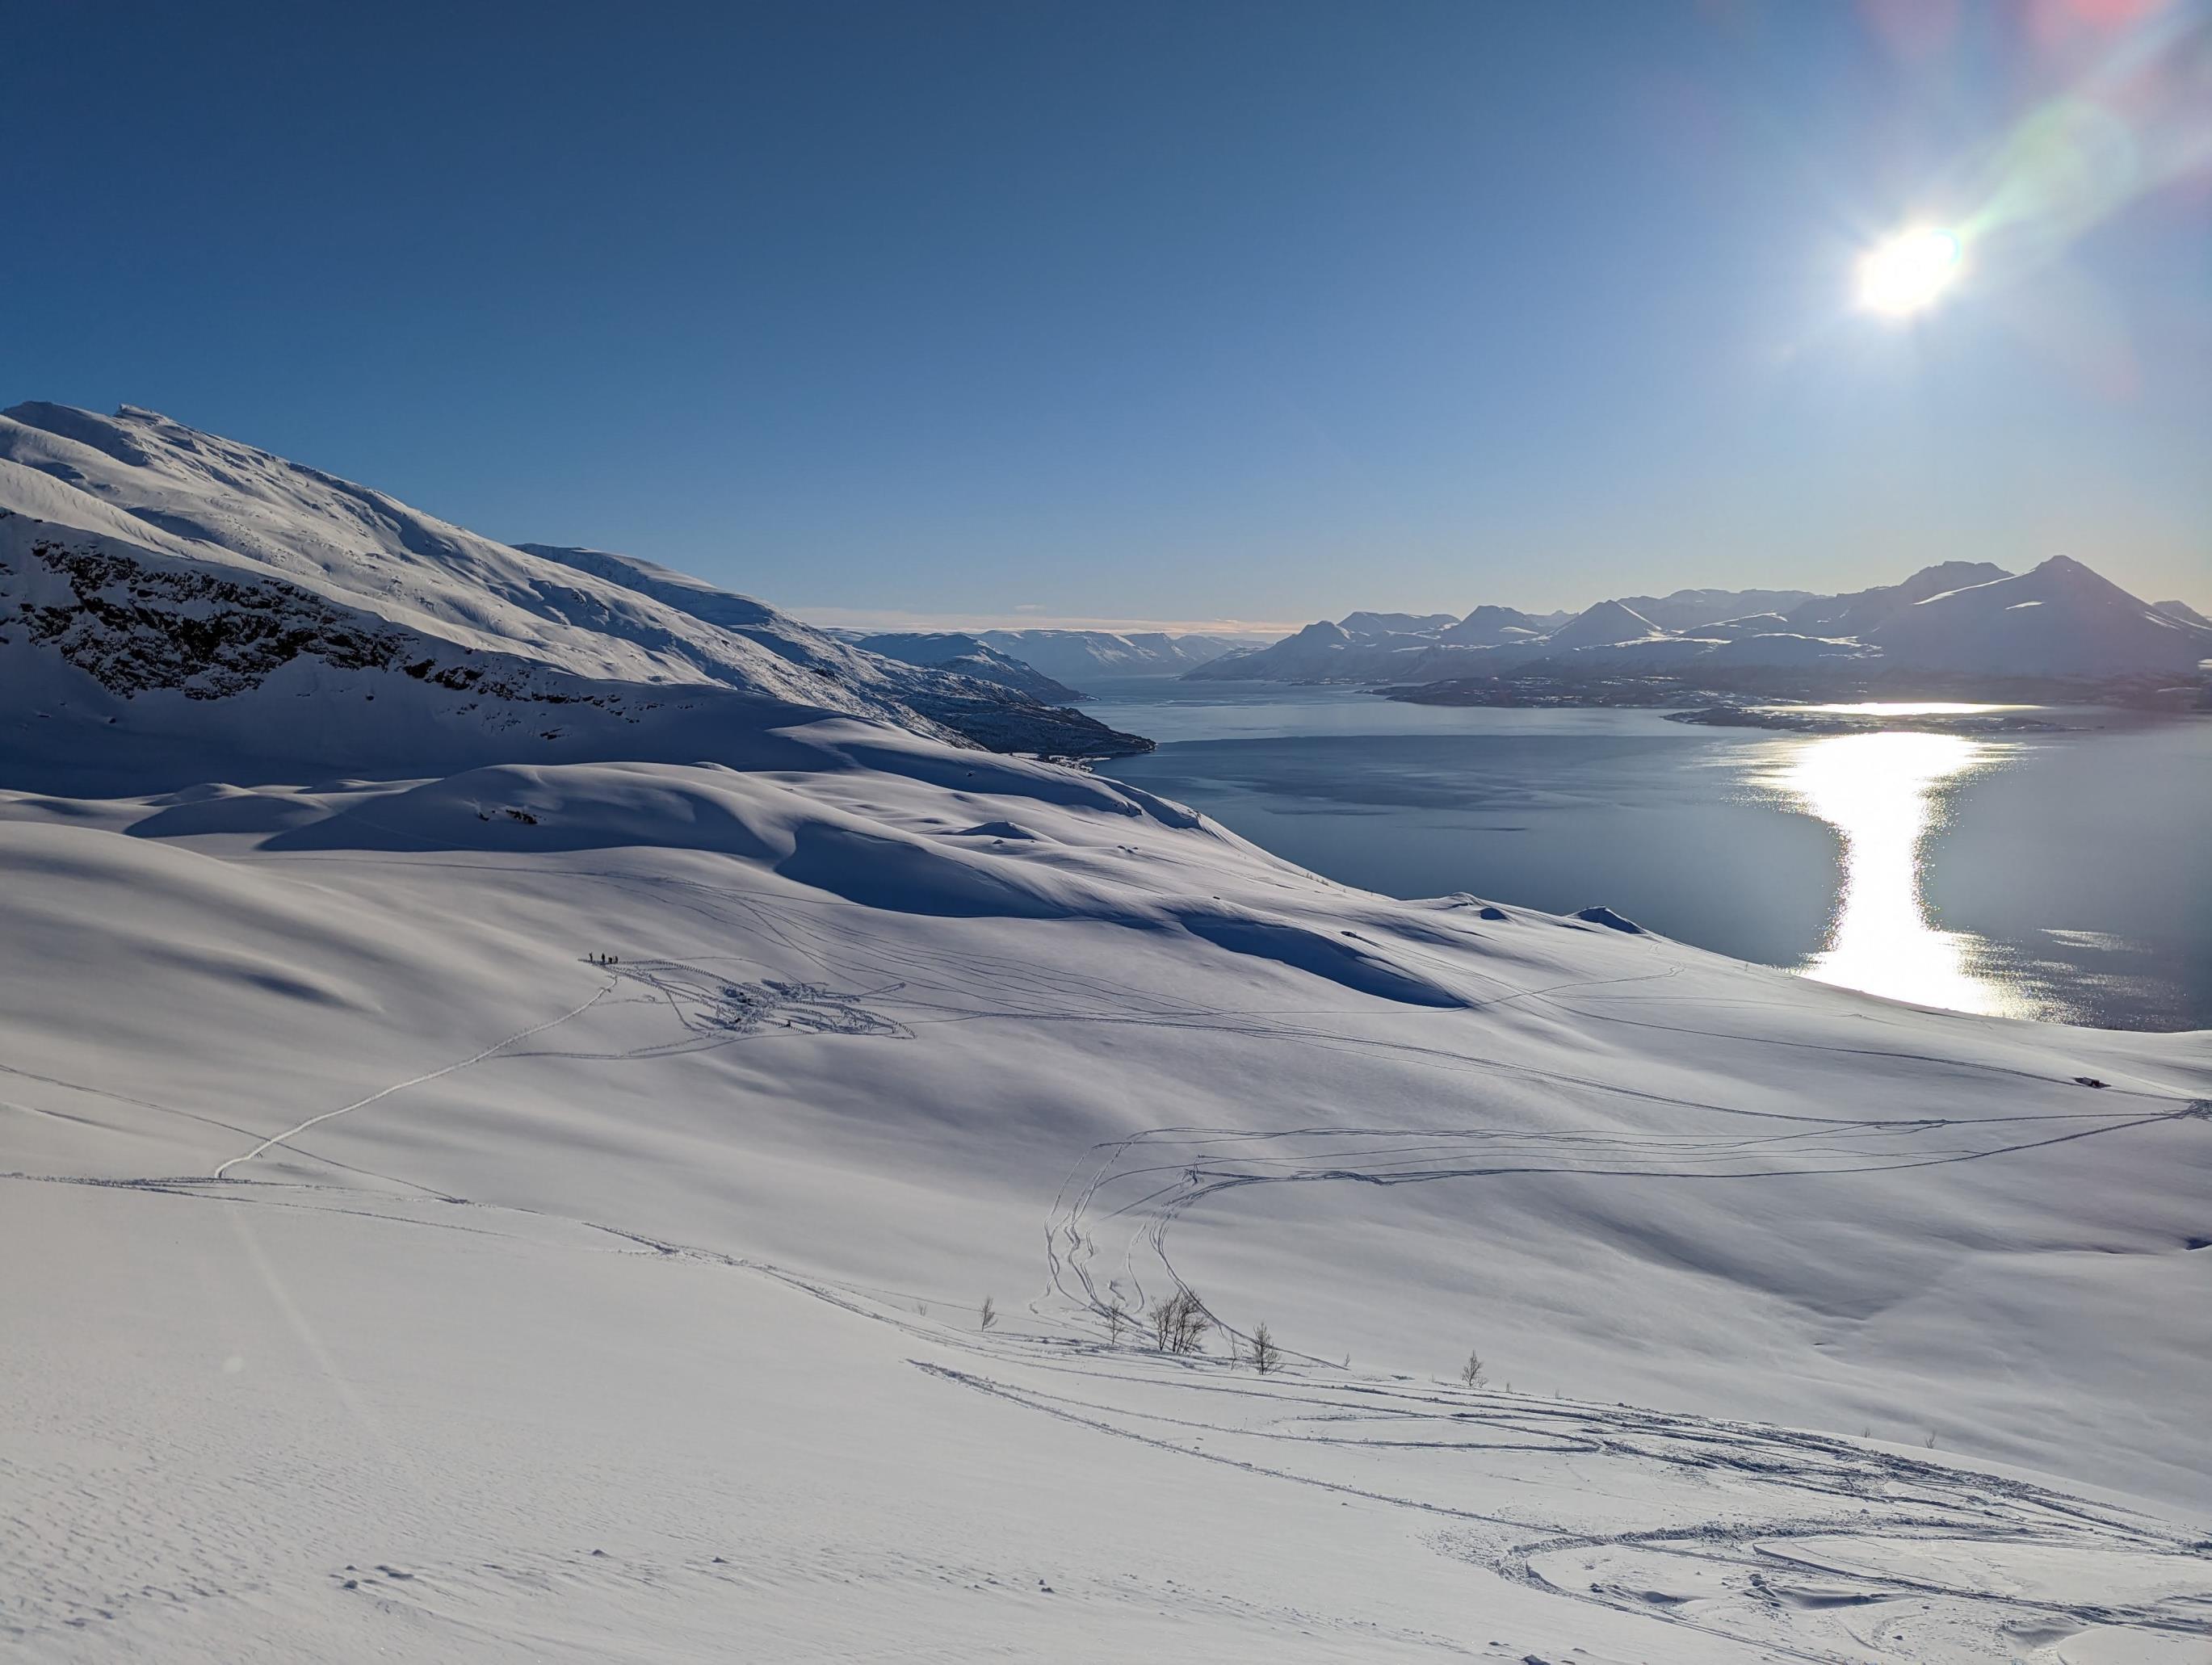
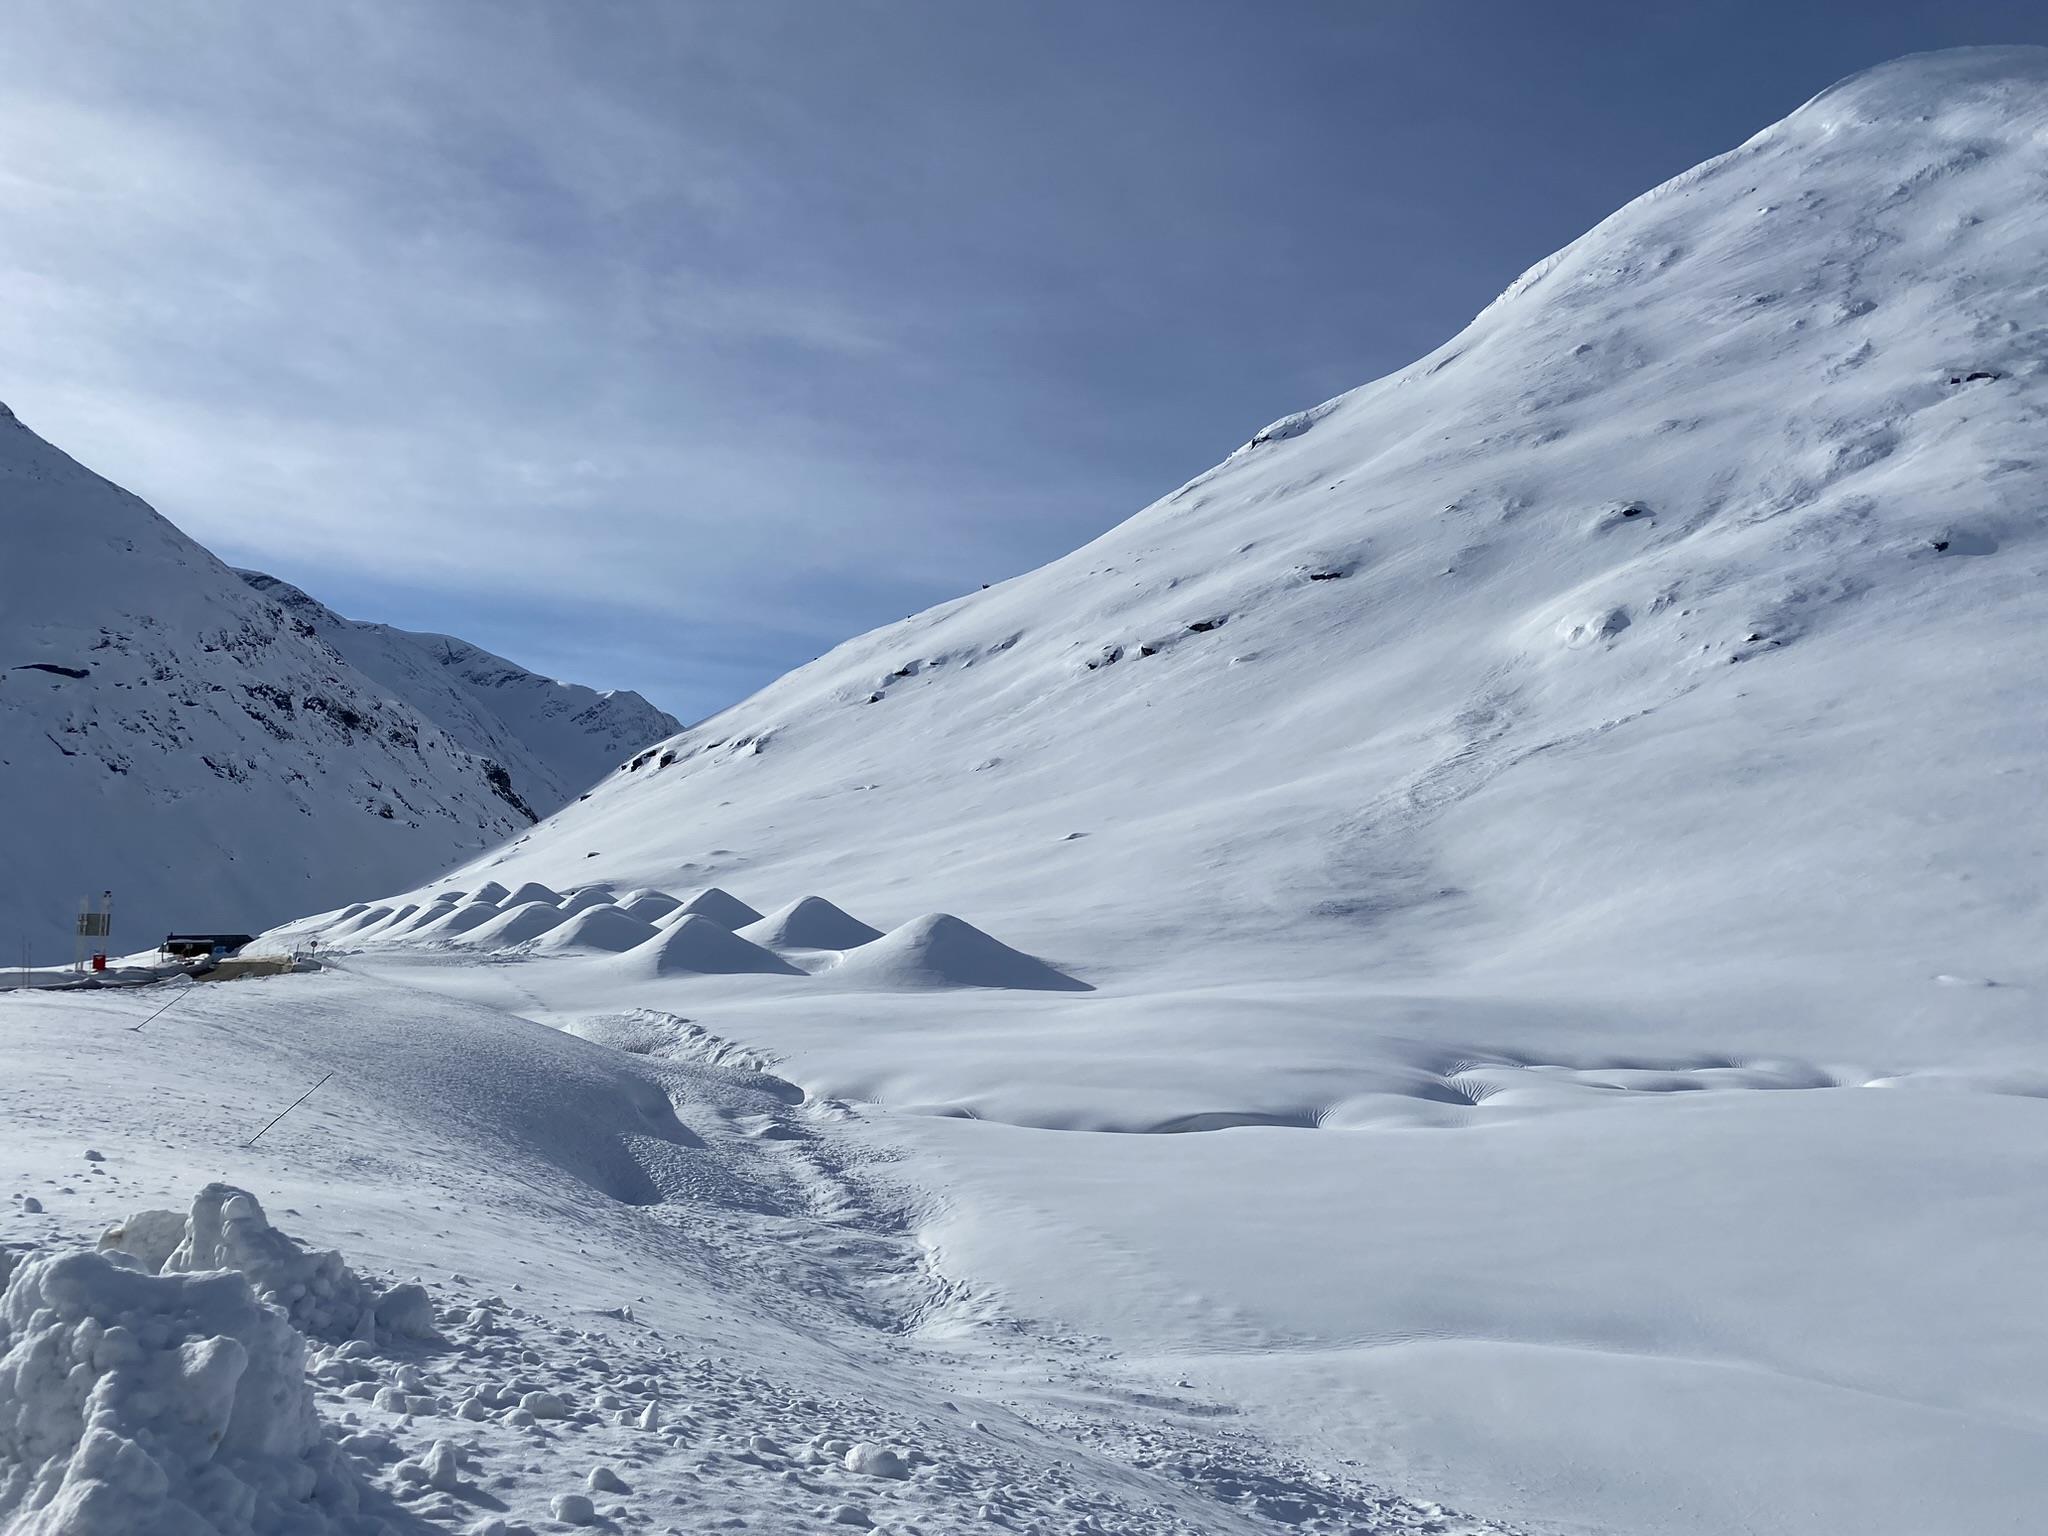
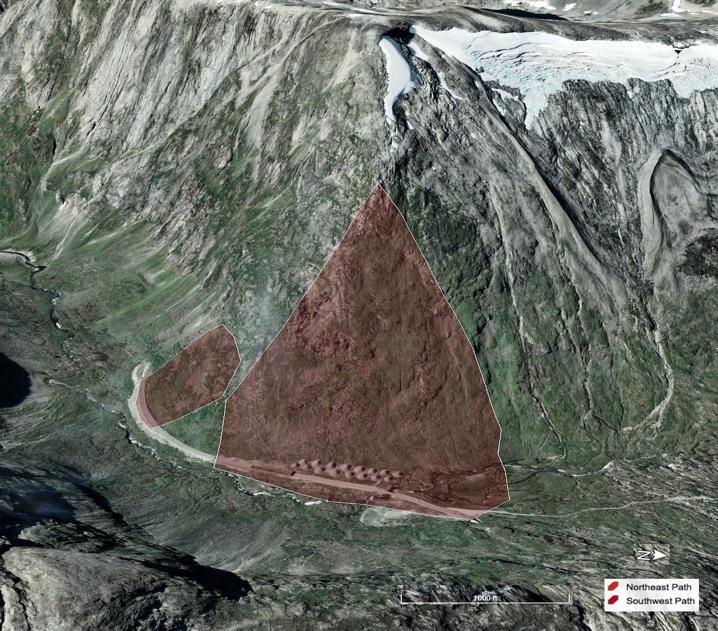
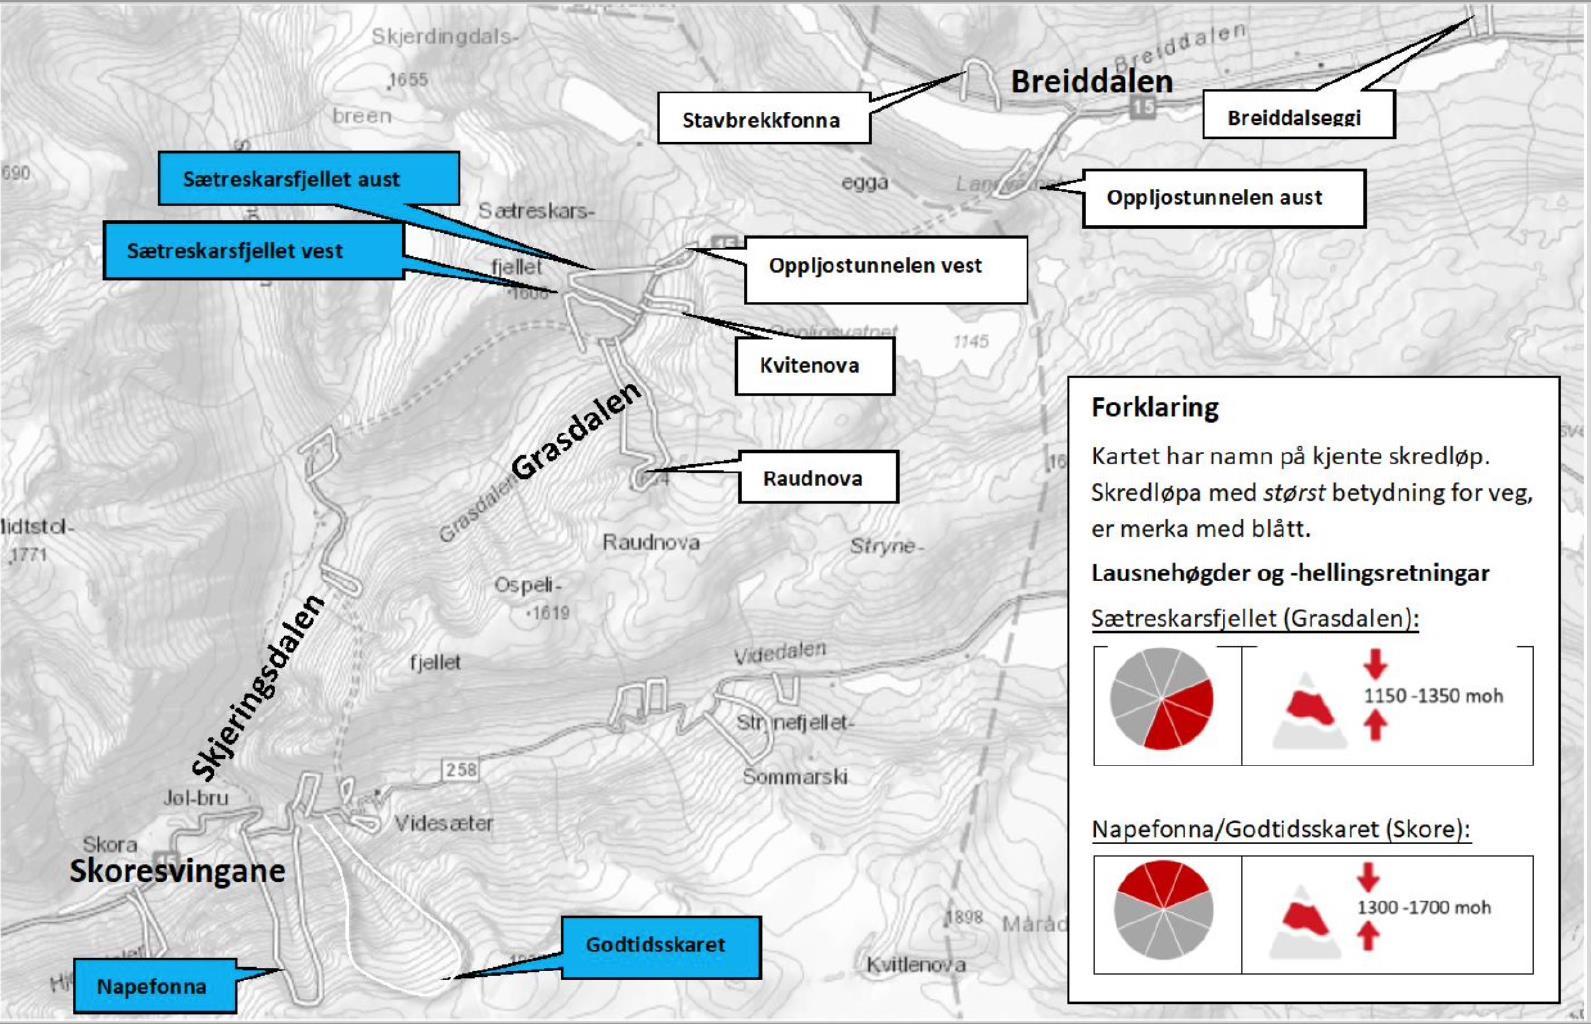
• Highway 15 in Western Norway near Grasdalen, Stryn Norway
• Paths ~1600 – 500m AMSL
• Real time forecasting in parallel:
• with RS data
• without RS data
• Scenario based forecasting:
• With RS data
• Without RS data


Roads

• Two field observations from NPRA employees.
• Crust on solar aspects
• D3 Hard slab from prior mitigation (24 hr prior)
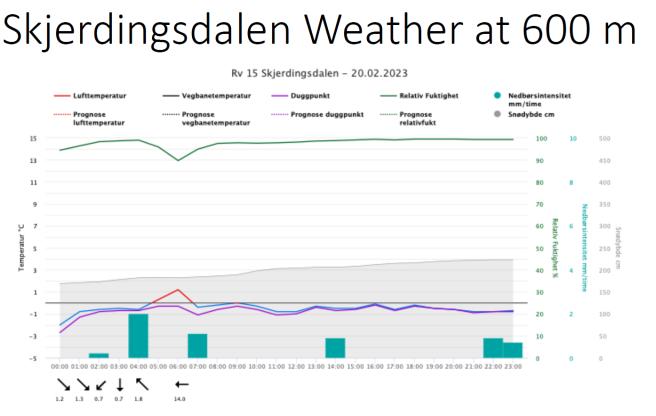
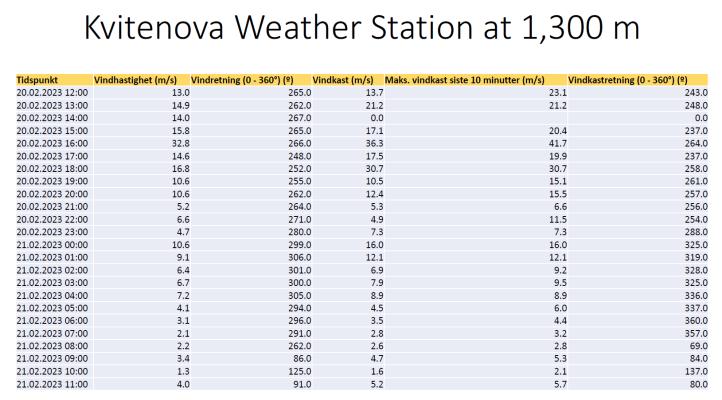
• 24hr of remote AWS data from 600 meters, including:
• windspeed and direction, air temperature, new snow and snow water equivalent (SWE)
• Overnight 10cm of new snow at 600m.
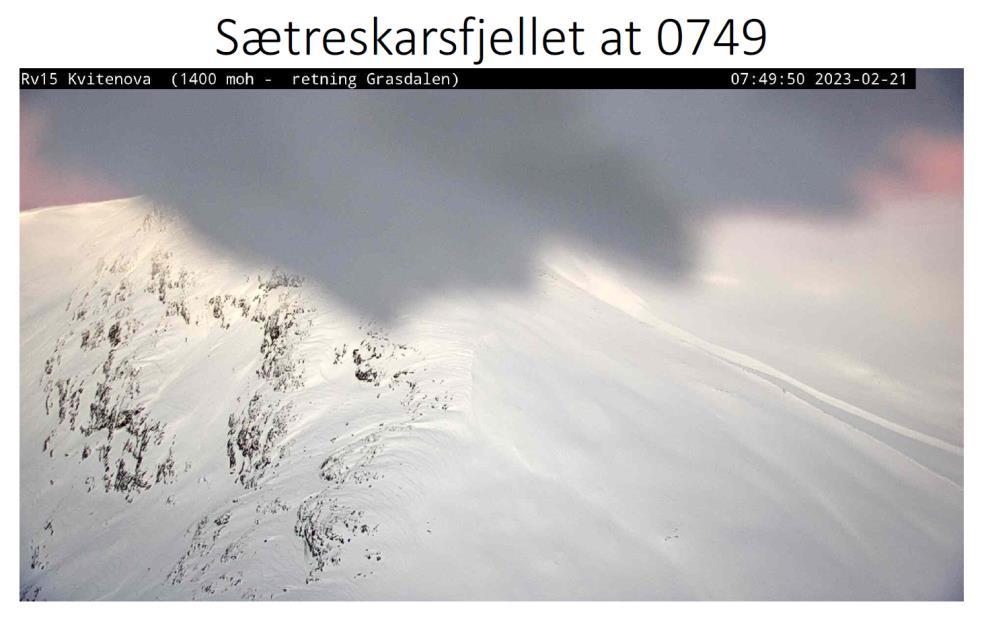
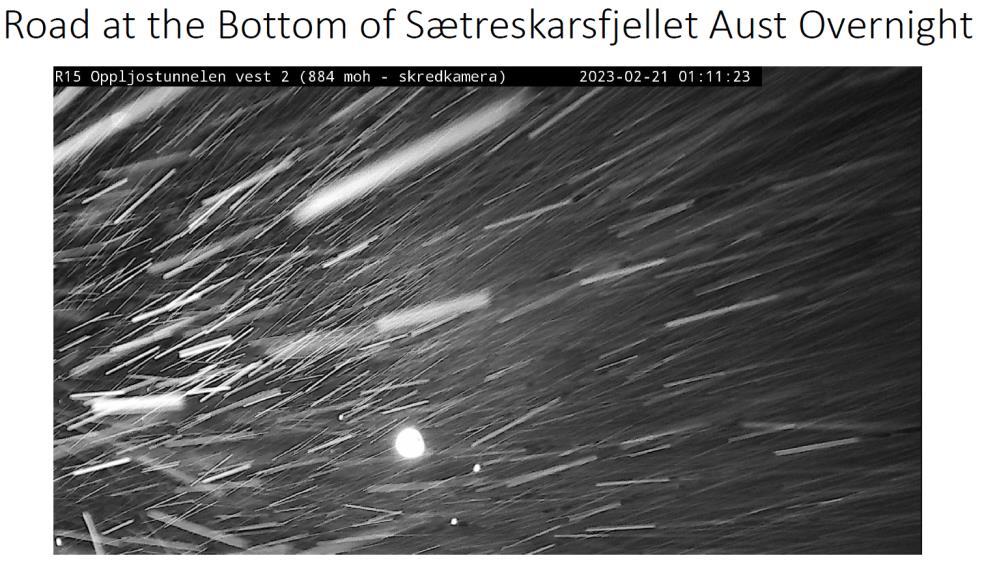
• Three static webcam photos of the road and avalanche path
• Showed snow and wind, and camera lens iced over
• Provided prior avalanche forecast
• Weather forecast for next 24hr
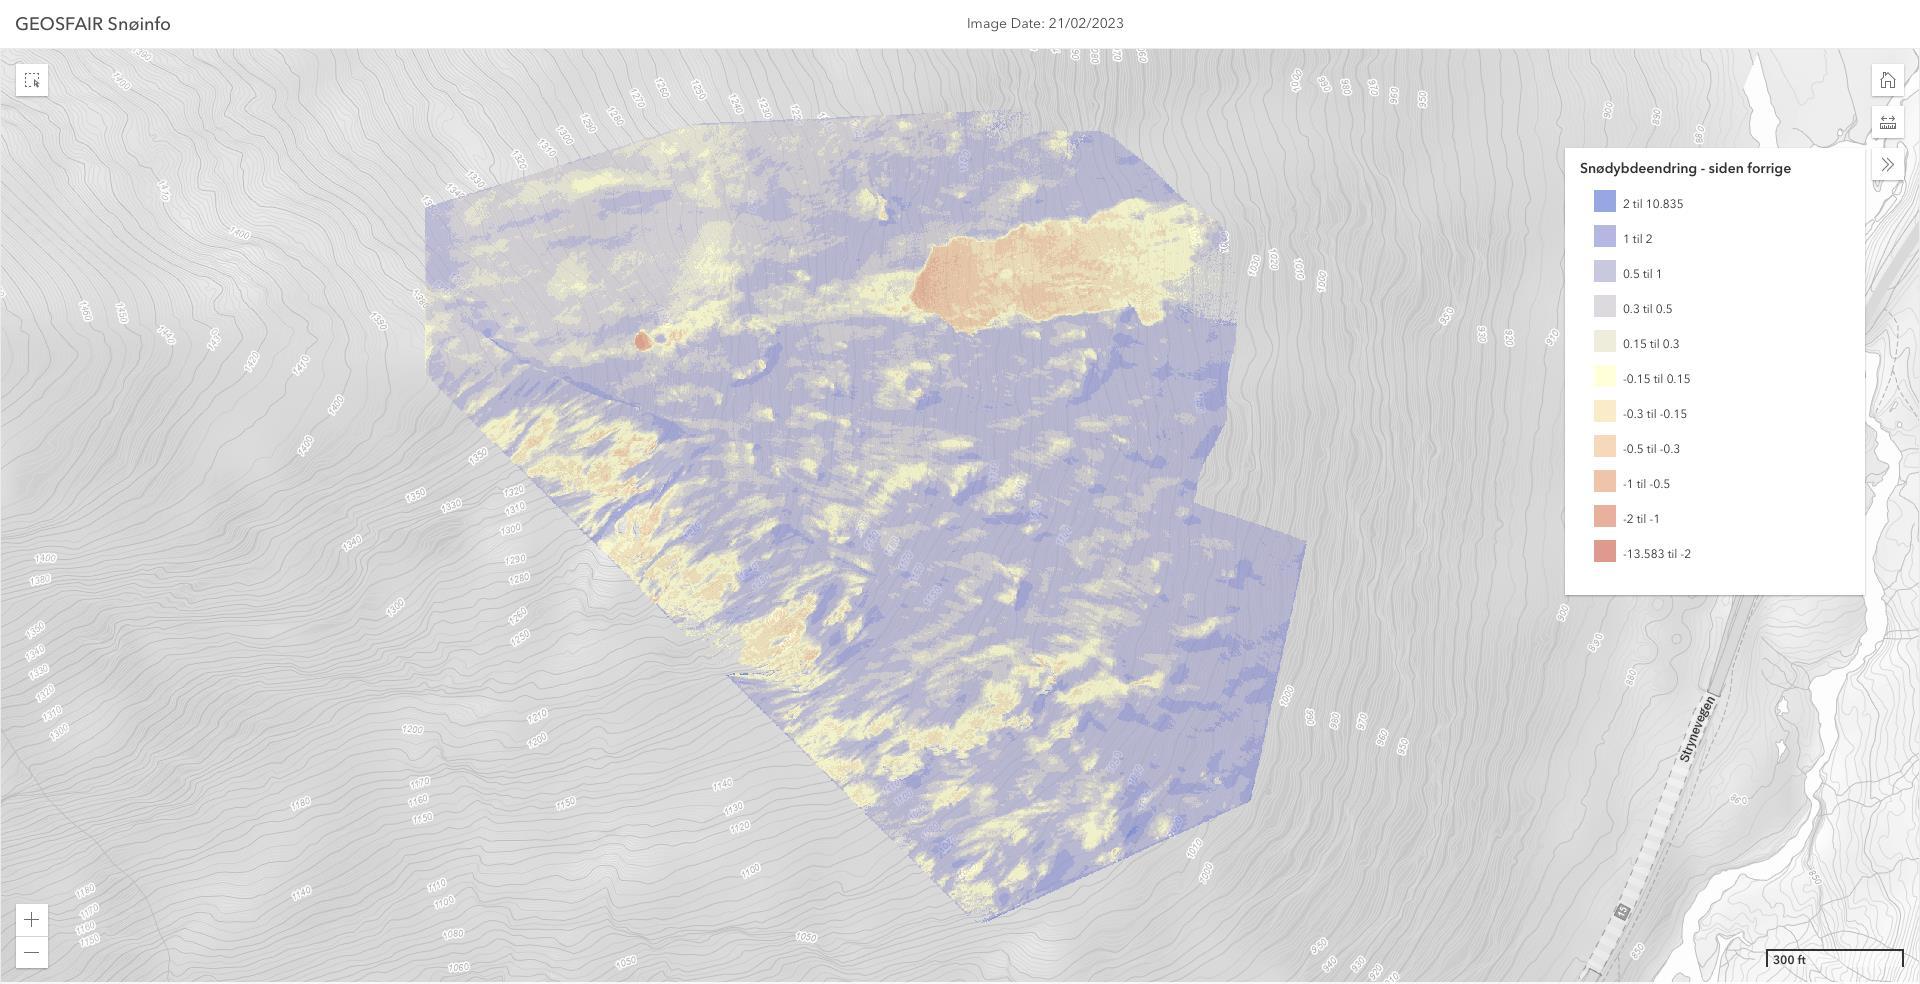
Forecasters with RS+ data also received UAV data from day of mitigation (24hr prior)


• Size: No difference statistically T = D3.0 24.4% / D3.5 24.4% vs RS = D2.5 23.9% / D3.0 19%
• Likelihood: Statistically different T = 48.9% Likely vs RS = 34.8% Likely

Based on the location of likelihood and size the hazard level the participants derived the hazard level.
T = 37.8% of participants at a hazard level as some restrictions (level 3 of 4). IQR of 2 with a spread from normal attention (level 1 of 4) to some restrictions (level 3 of 4).
RS = 58.7% of participants at a hazard level of normal attention (1 of 4) . IQR of 1, with a spread from normal attention (level 1 of 4) to increased awareness (level 2 of 4).


Case Study One, Traditional - Sætreskarsfjellet
Case Study One, RS+ - Sætreskarsfjellet
Total n: 10, Responses n: 46
Case study one = Overlay of traditional matrix and contingency chart for traditional data on the left and RS data on the right. Hatching represents cells with more than 10% of the responses. 5

• In case study one the consensus of the RS group was a lower likelihood, and two steps lower on the hazard level.
• In 2 of the 3 case studies, the RS group had fewer selections for size, likelihood and avalanche problems
- > Reduced uncertainty in forecasts.
• In the real-time forecast comparison, a similar result was observed, with greater clustering of selections
- > Reduced uncertainty in forecasts.
• Small data set
• Case studies based on 20 people (10 Trad / 10 RS)
• Real time forecasting in parallel for 17 forecasts
• Focused on UAV obtained data (GEOSFAIR)– but the concept could be applied to other sensors / data flows.
• More data is widely considered as good in forecasting– but how do we know if it is improving our forecasts? Or simply increasing the cognitive load? Or a distraction?
• What is the impact of a new tool? Does it meet a cost/benefit analysis?
• Propose this workflow as a potential methods to track the influence (value?) of new technology on the result of avalanche forecasting.


Alex Haddad, Jordy Hendrikx, Tore Humstad, Emil Solbakken, Jerry Johnson, Eric Sproles
Haddad, A., Hendrikx, J., Humstad, T., Solbakken, E., Johnson, J., & Sproles, E. A., 2023.
QUANTIFYING THE IMPACT OF NEW DATA STREAMS IN AVALANCHE FORECASTING.
International Snow Science Workshop Proceedings 2023, Bend, Oregon.
https://arc.lib.montana.edu/snow-science/item/2866

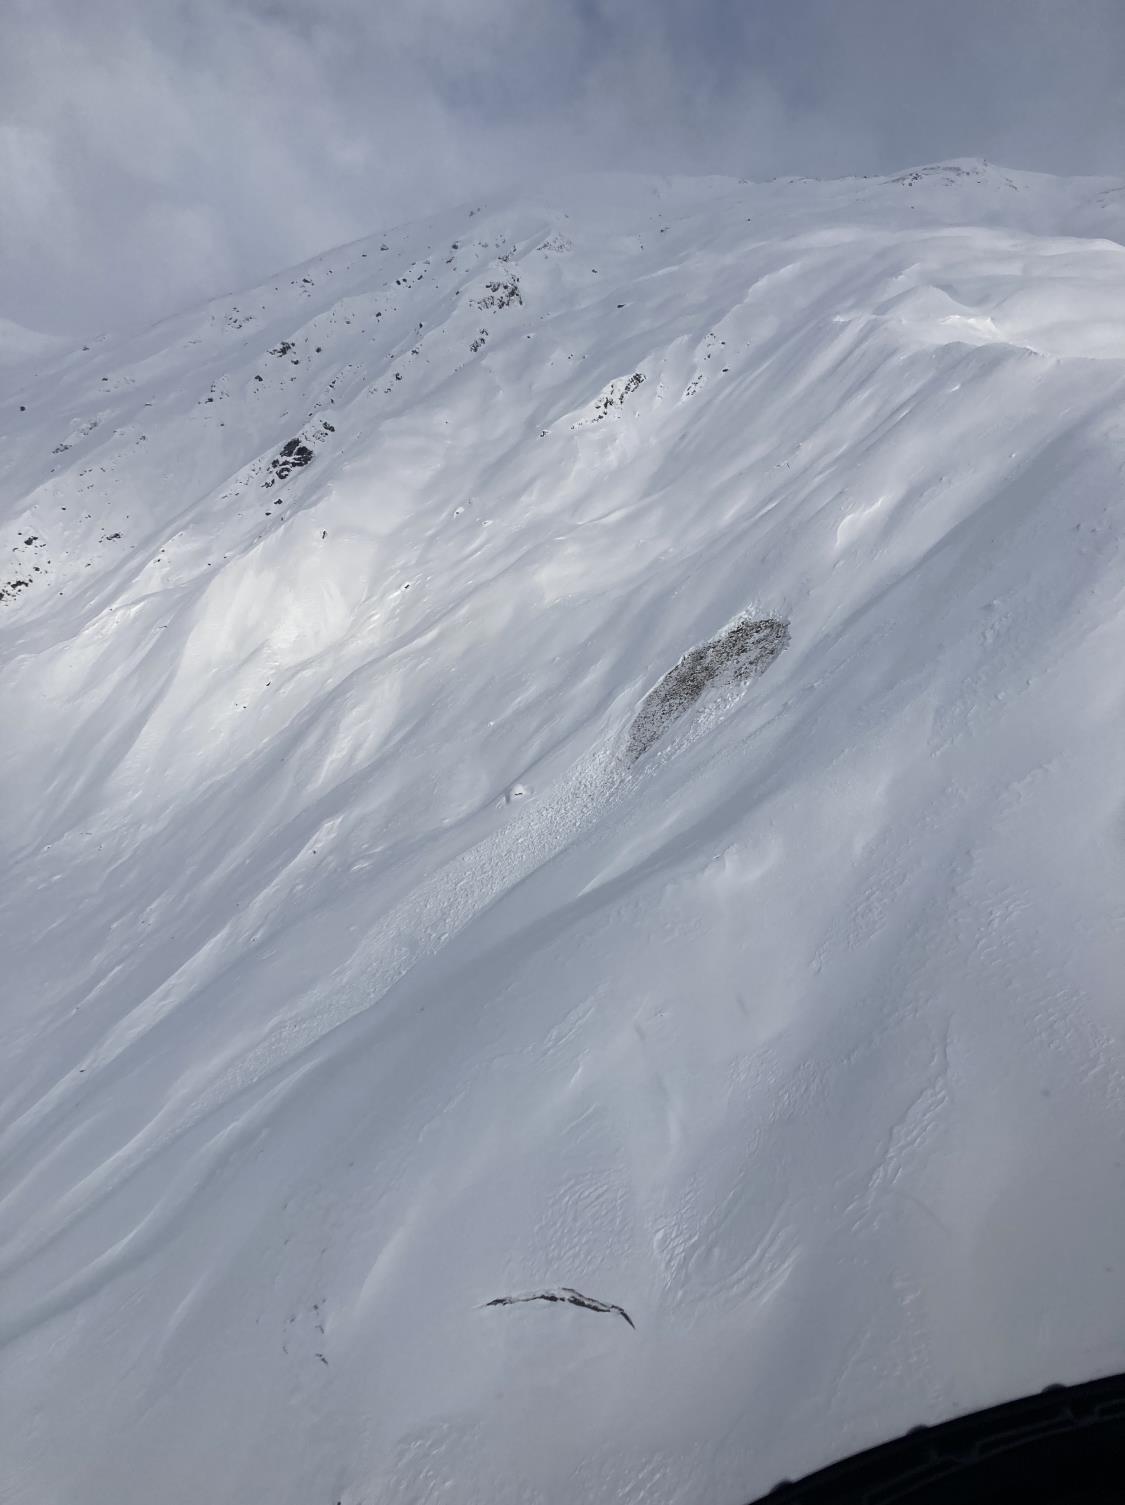
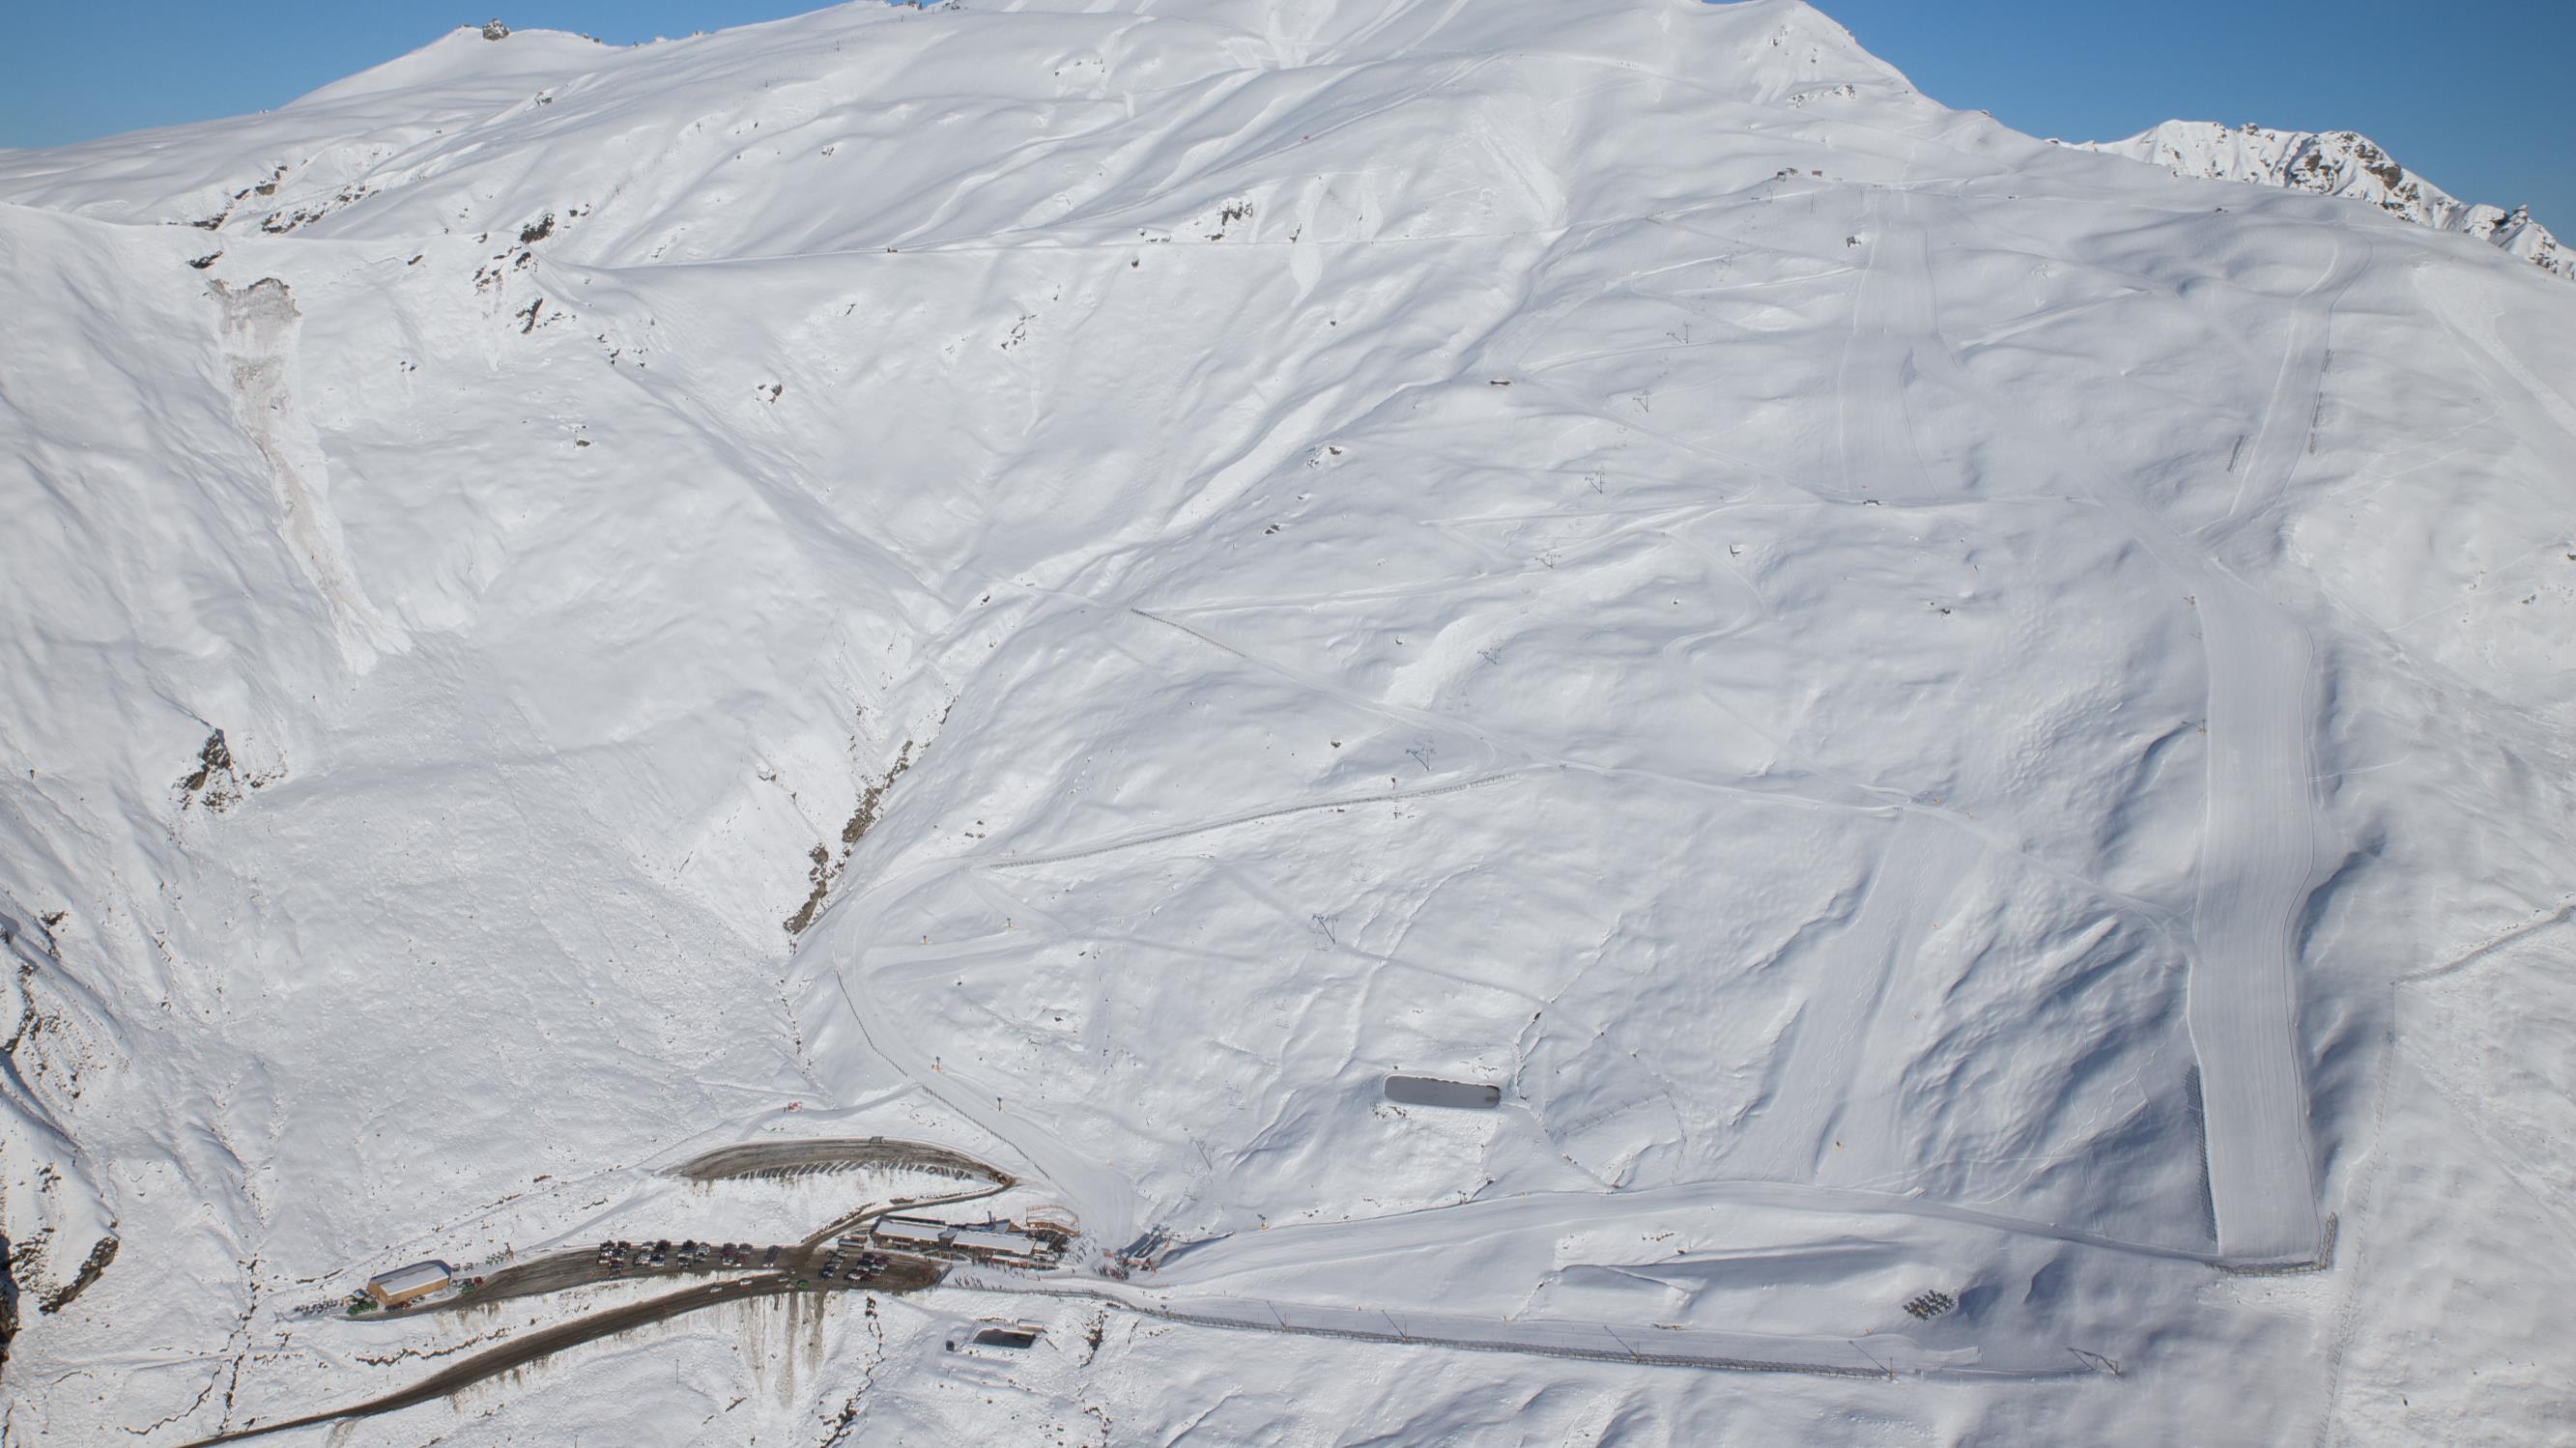
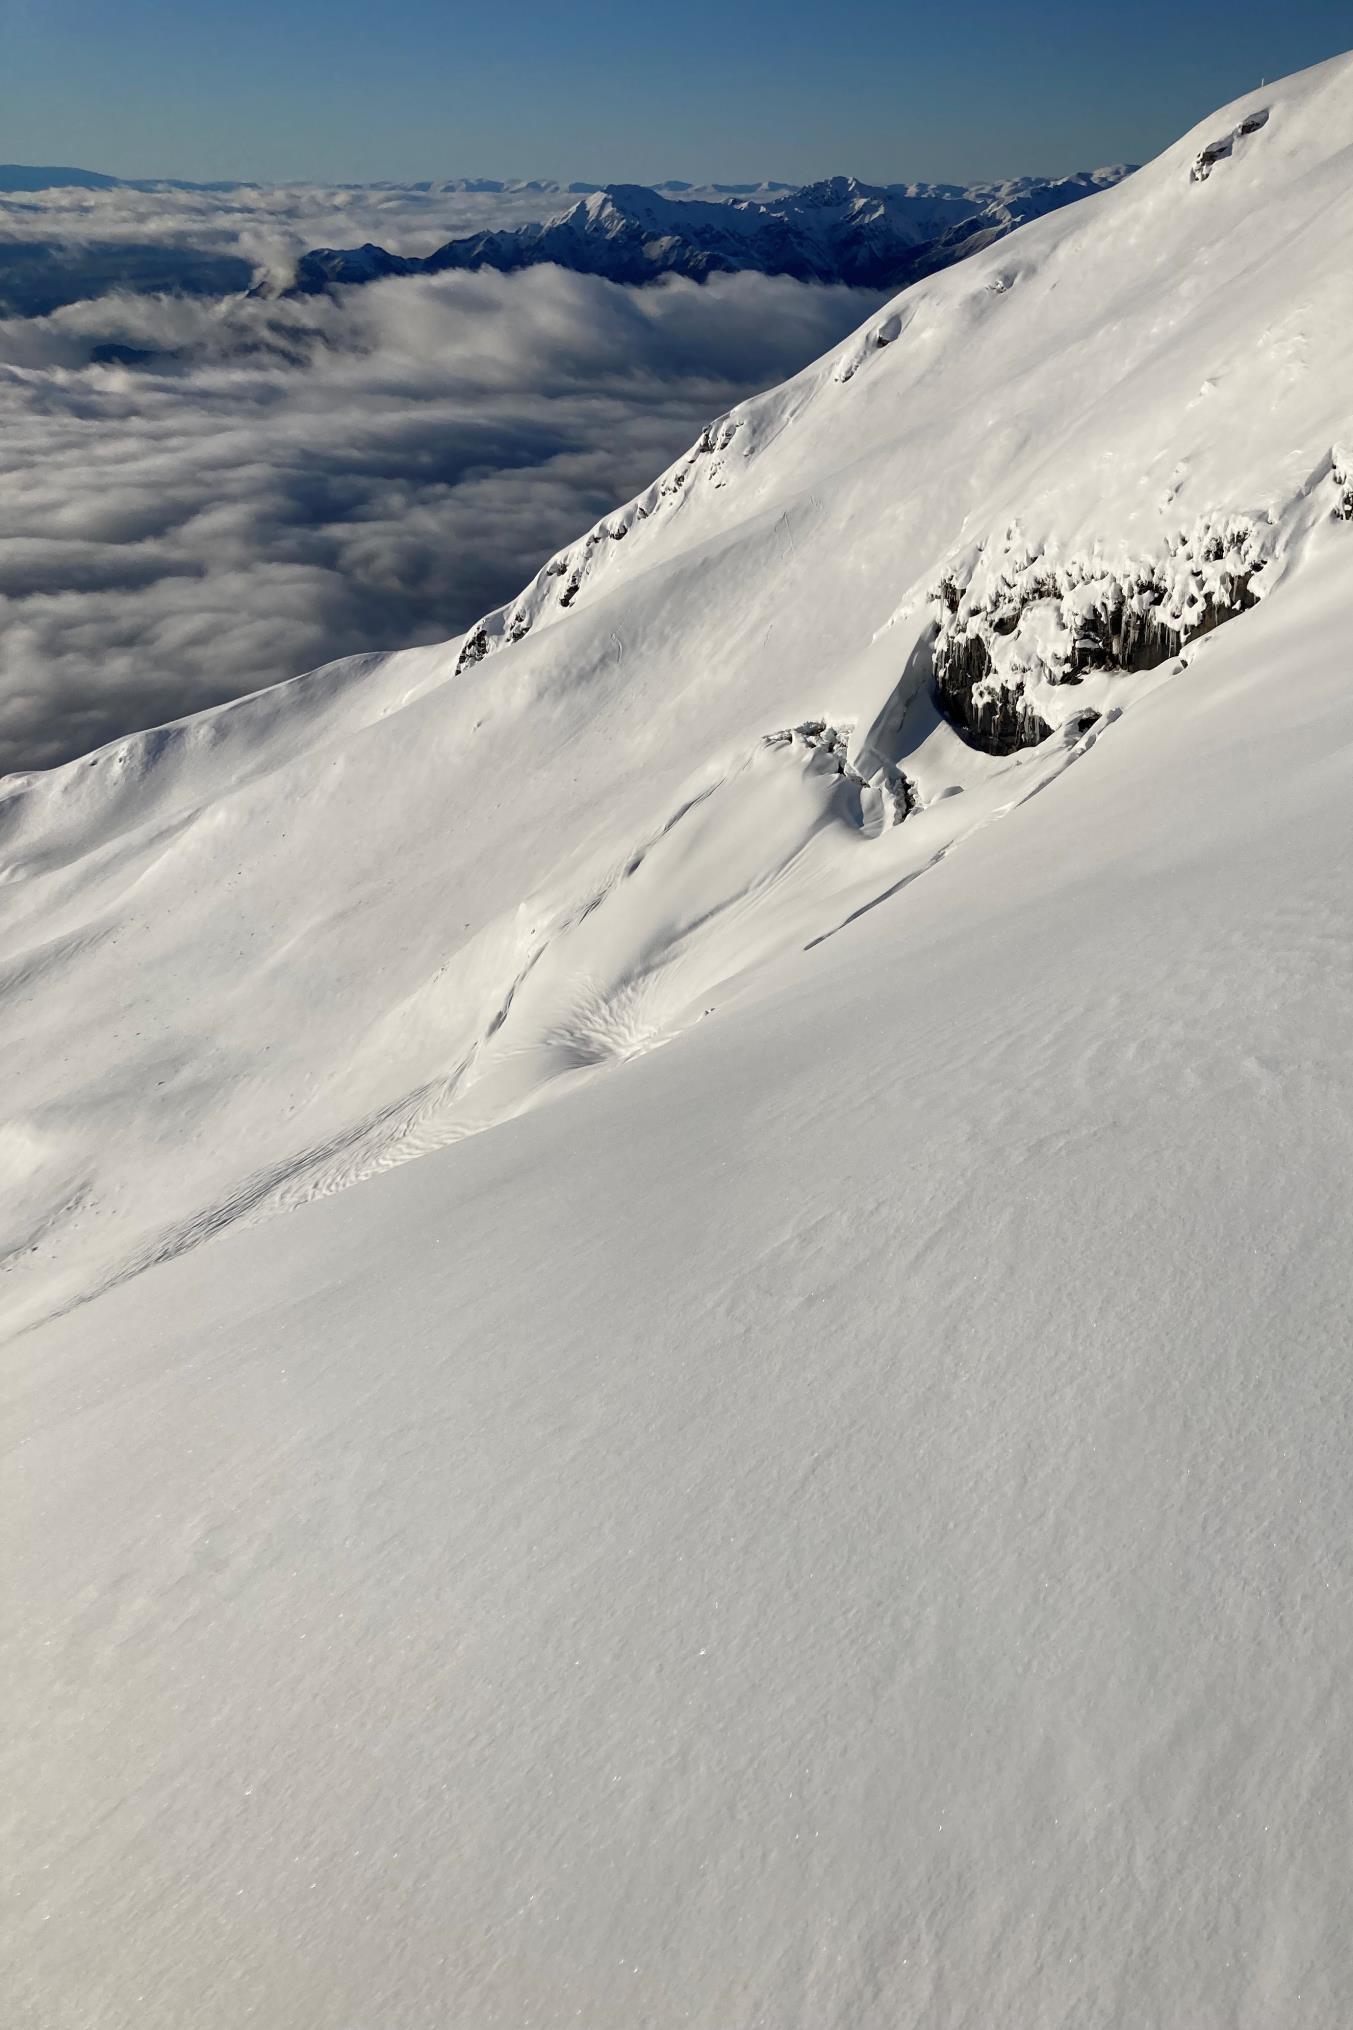
Llewellyn Murdoch
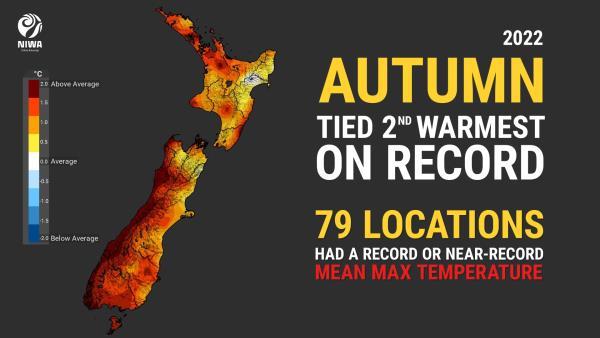
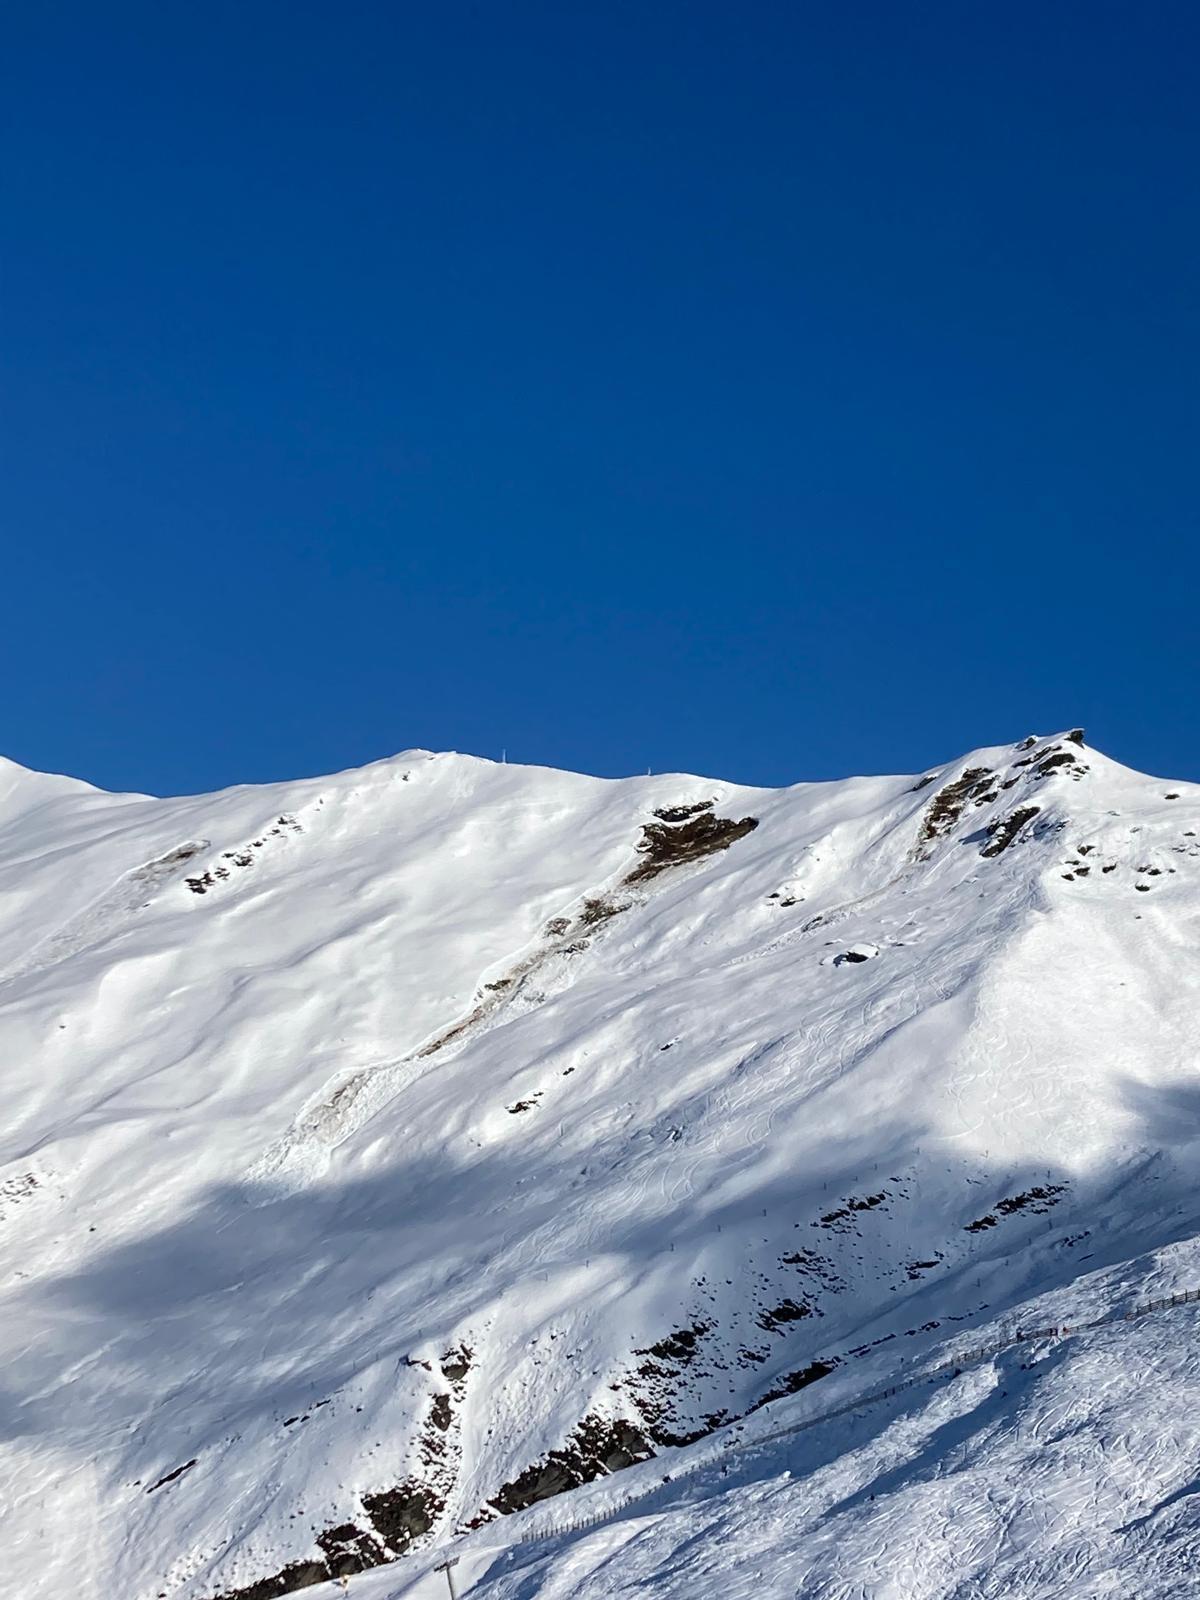
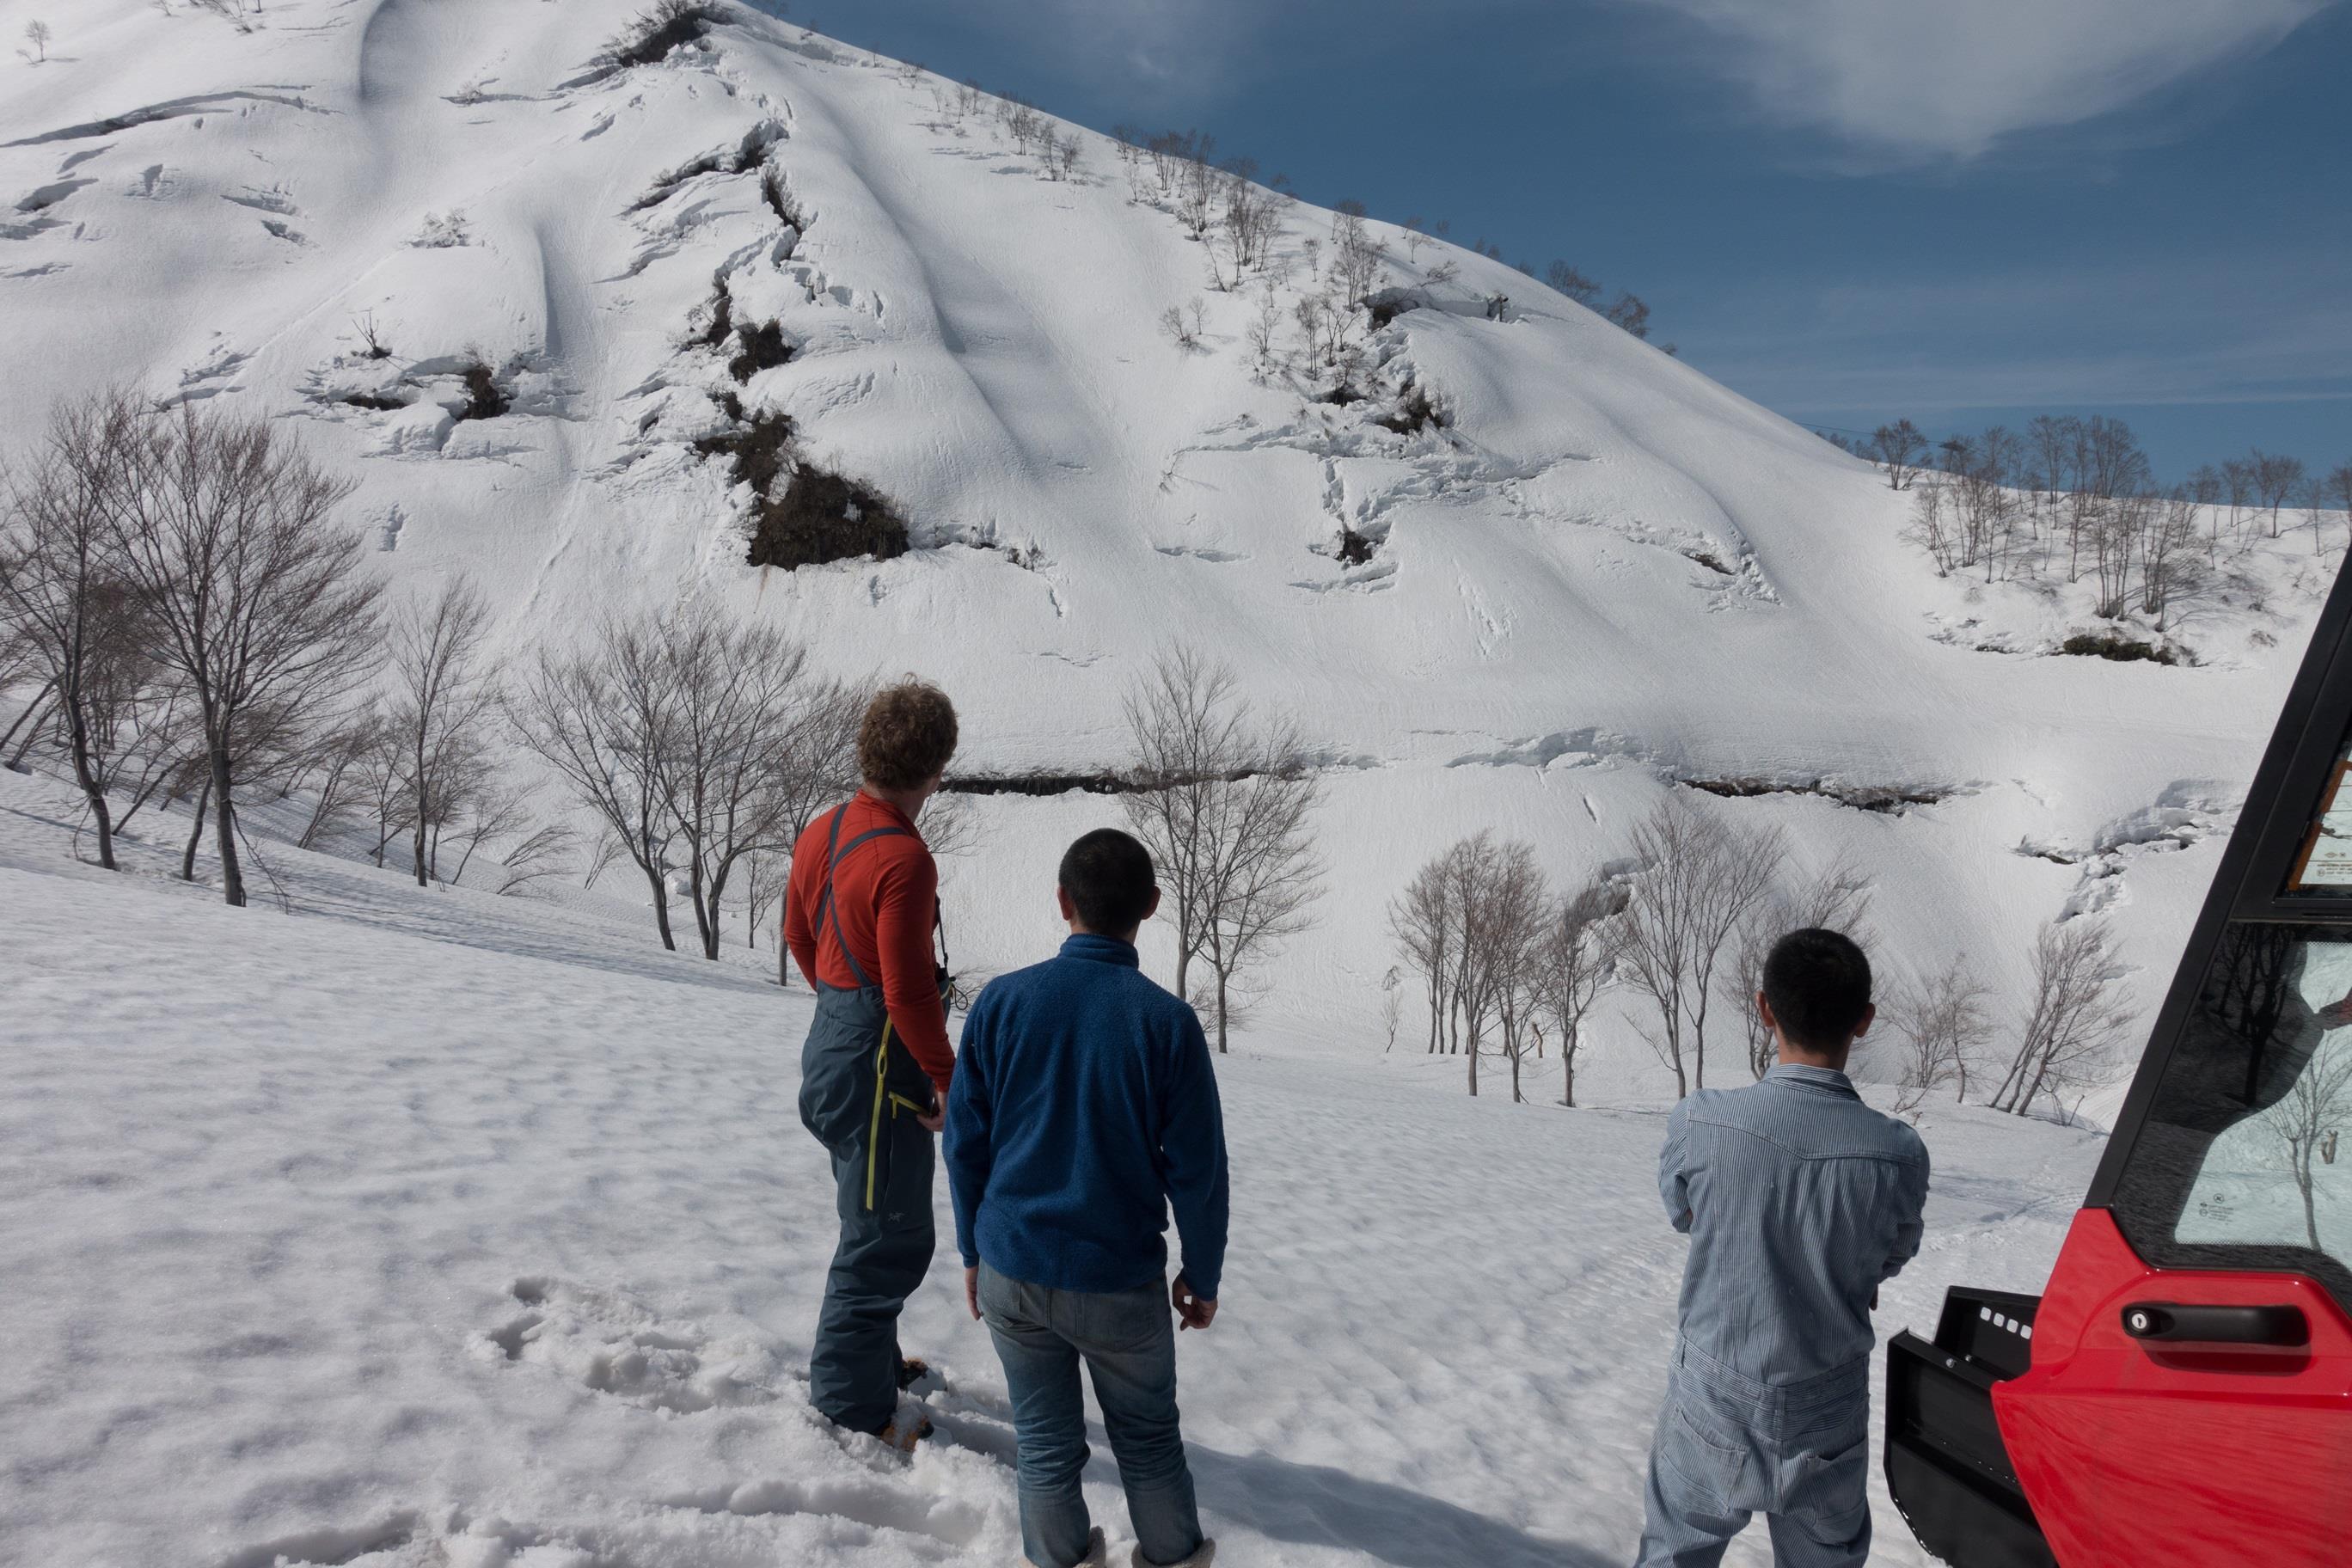
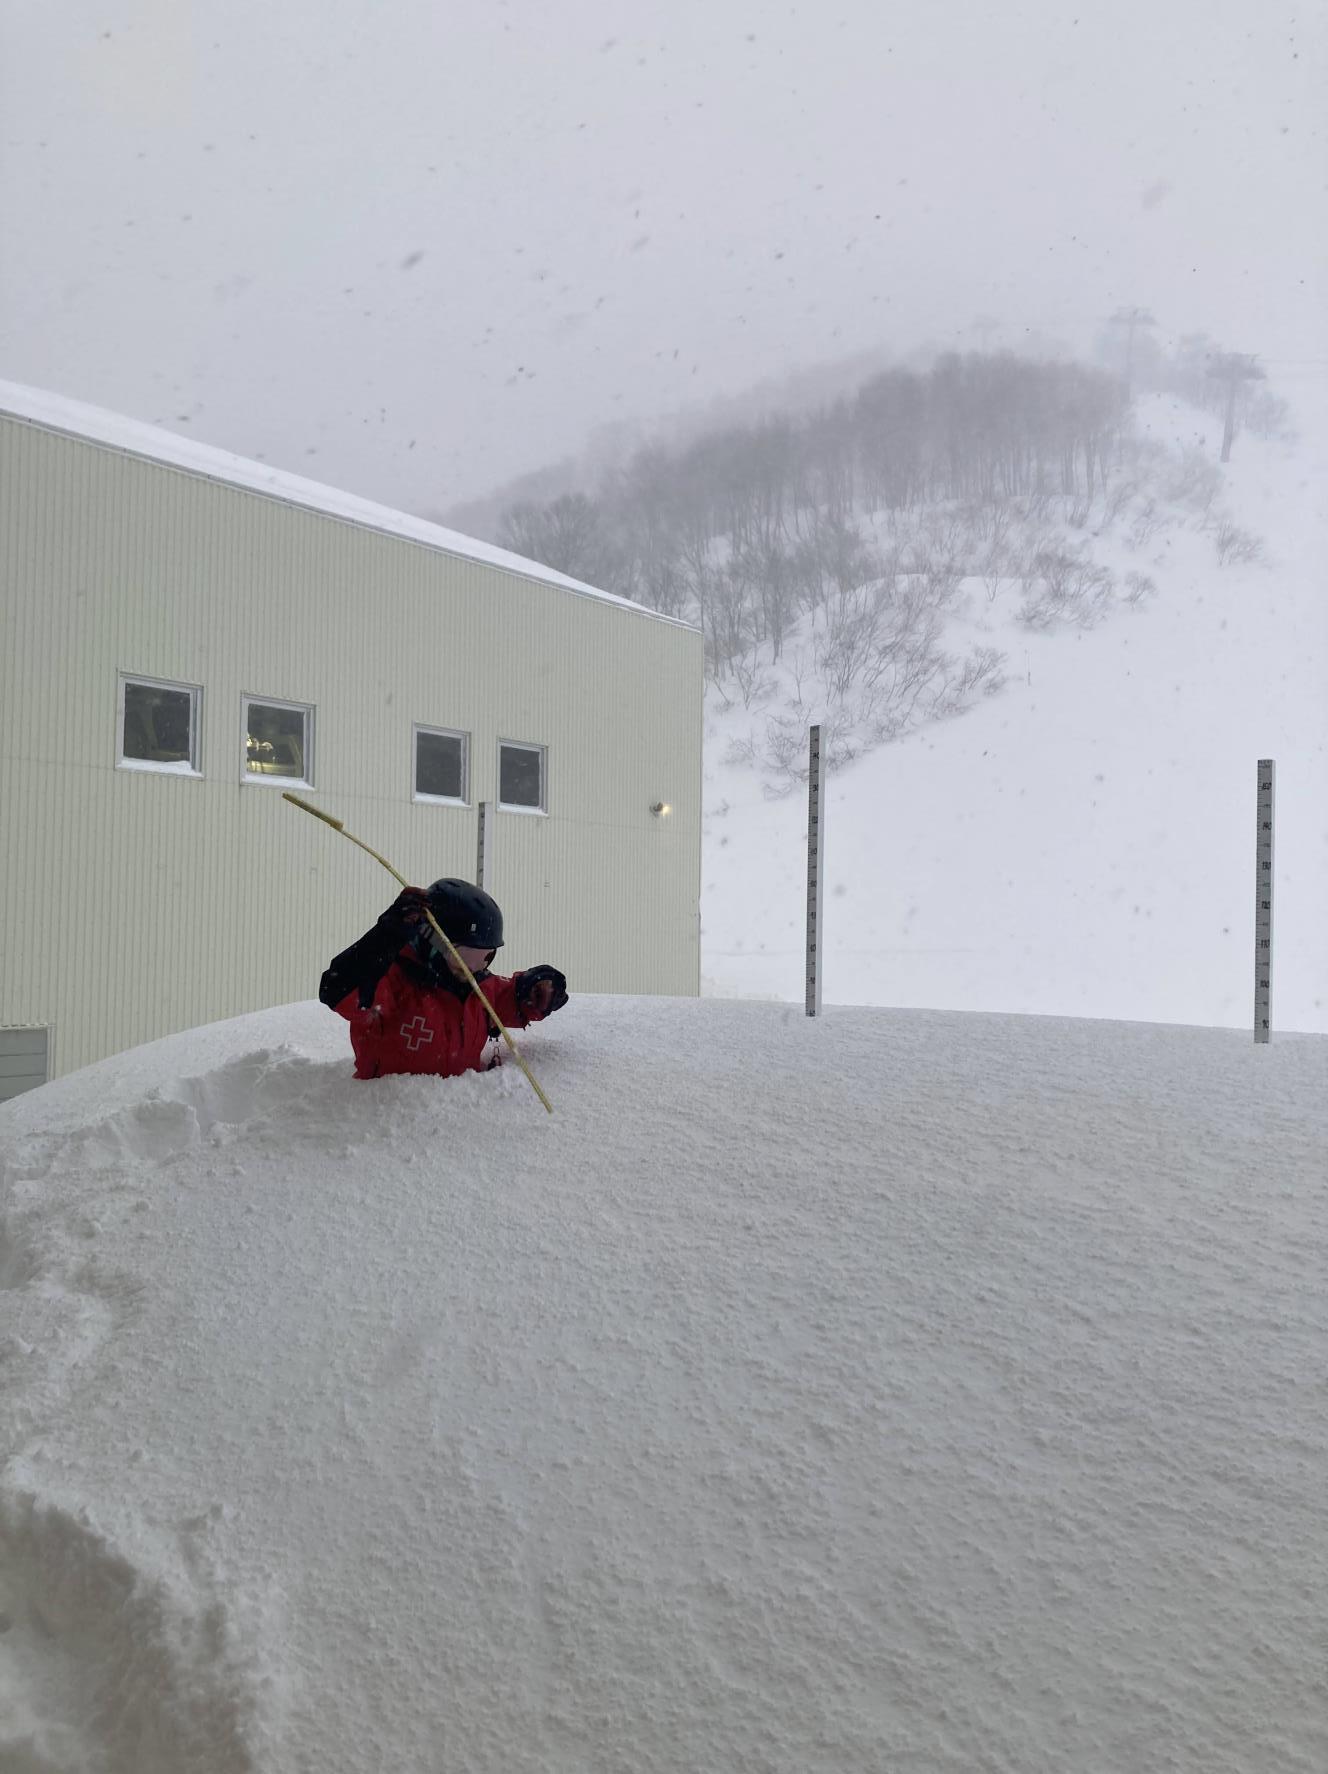
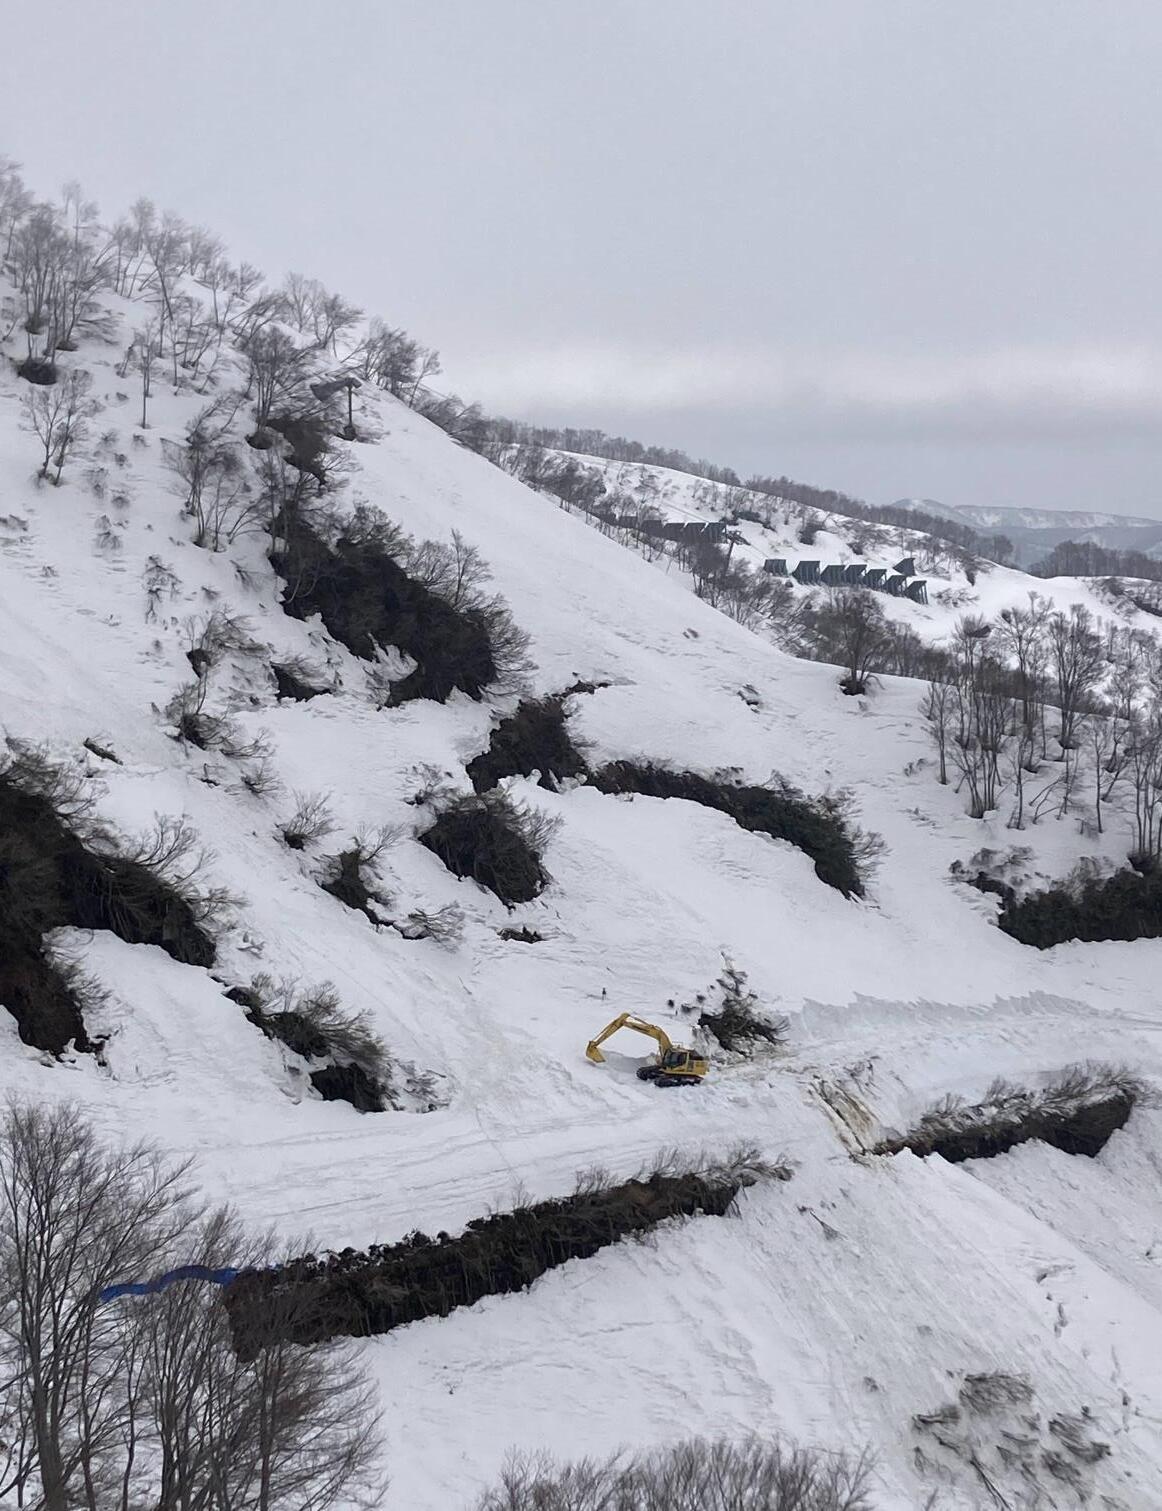
• Niwa reports 2nd warmest autumn on record
• No chance for ground to freeze prior to snowpack development
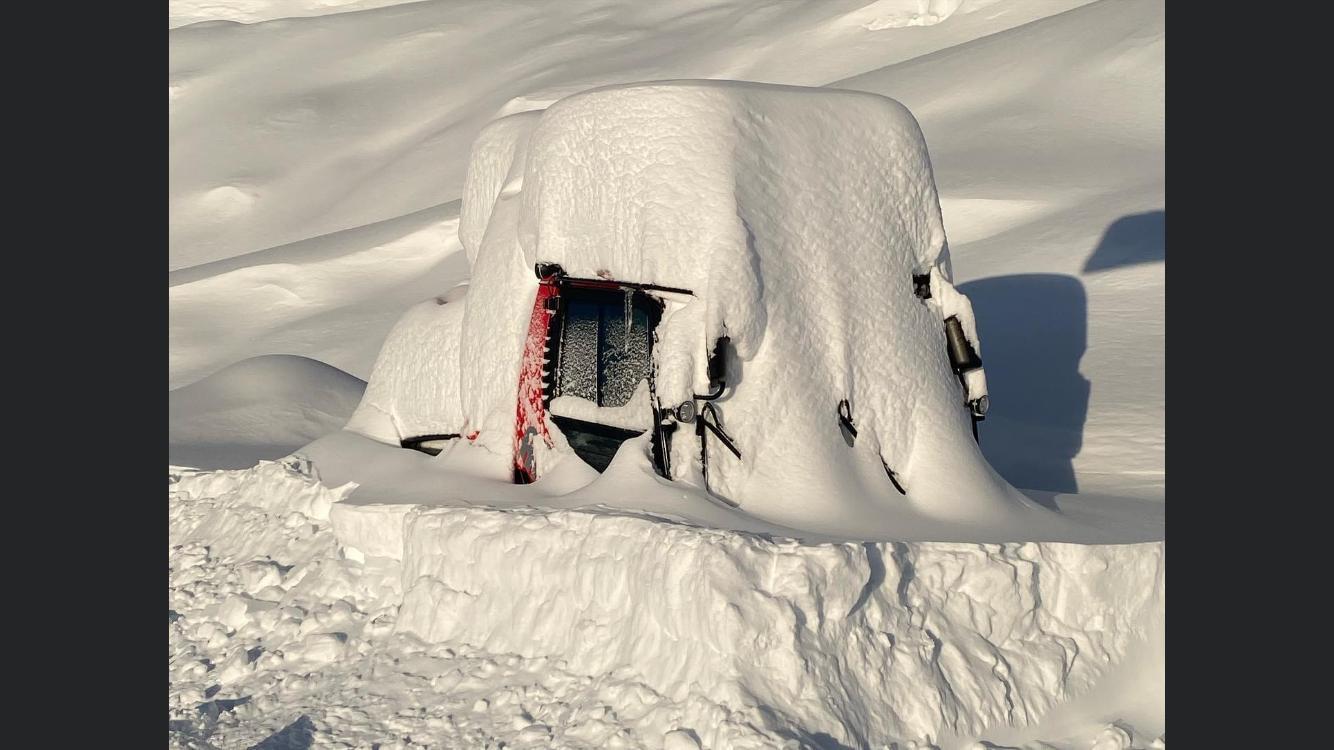
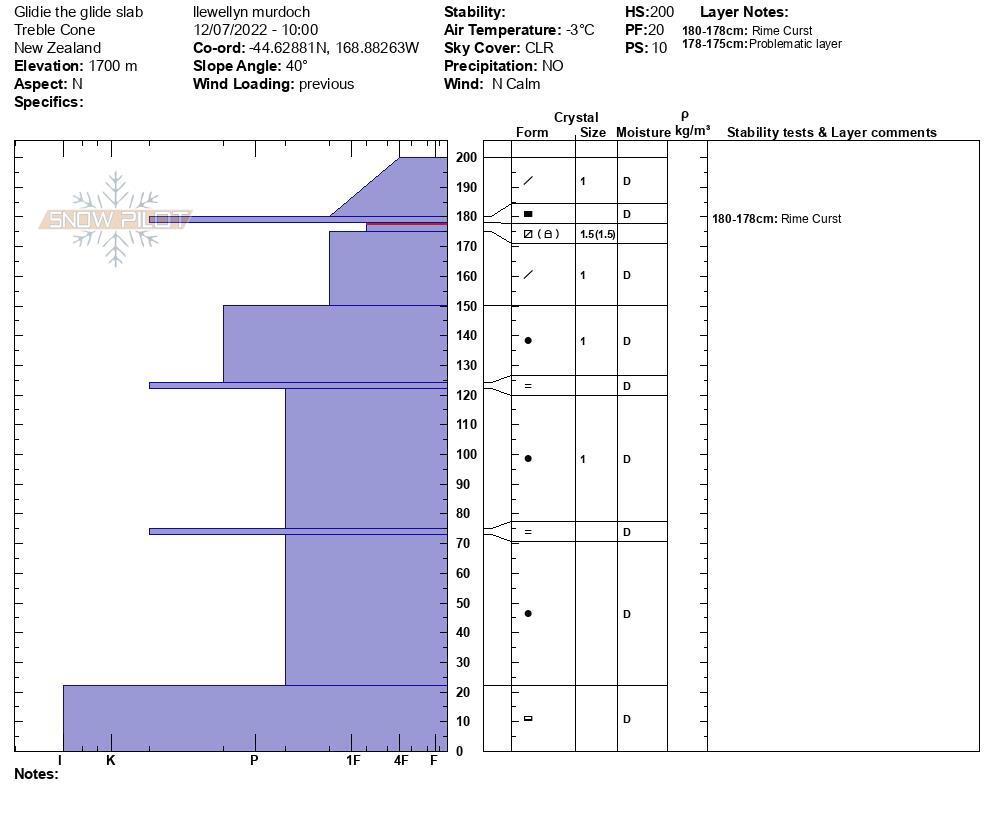
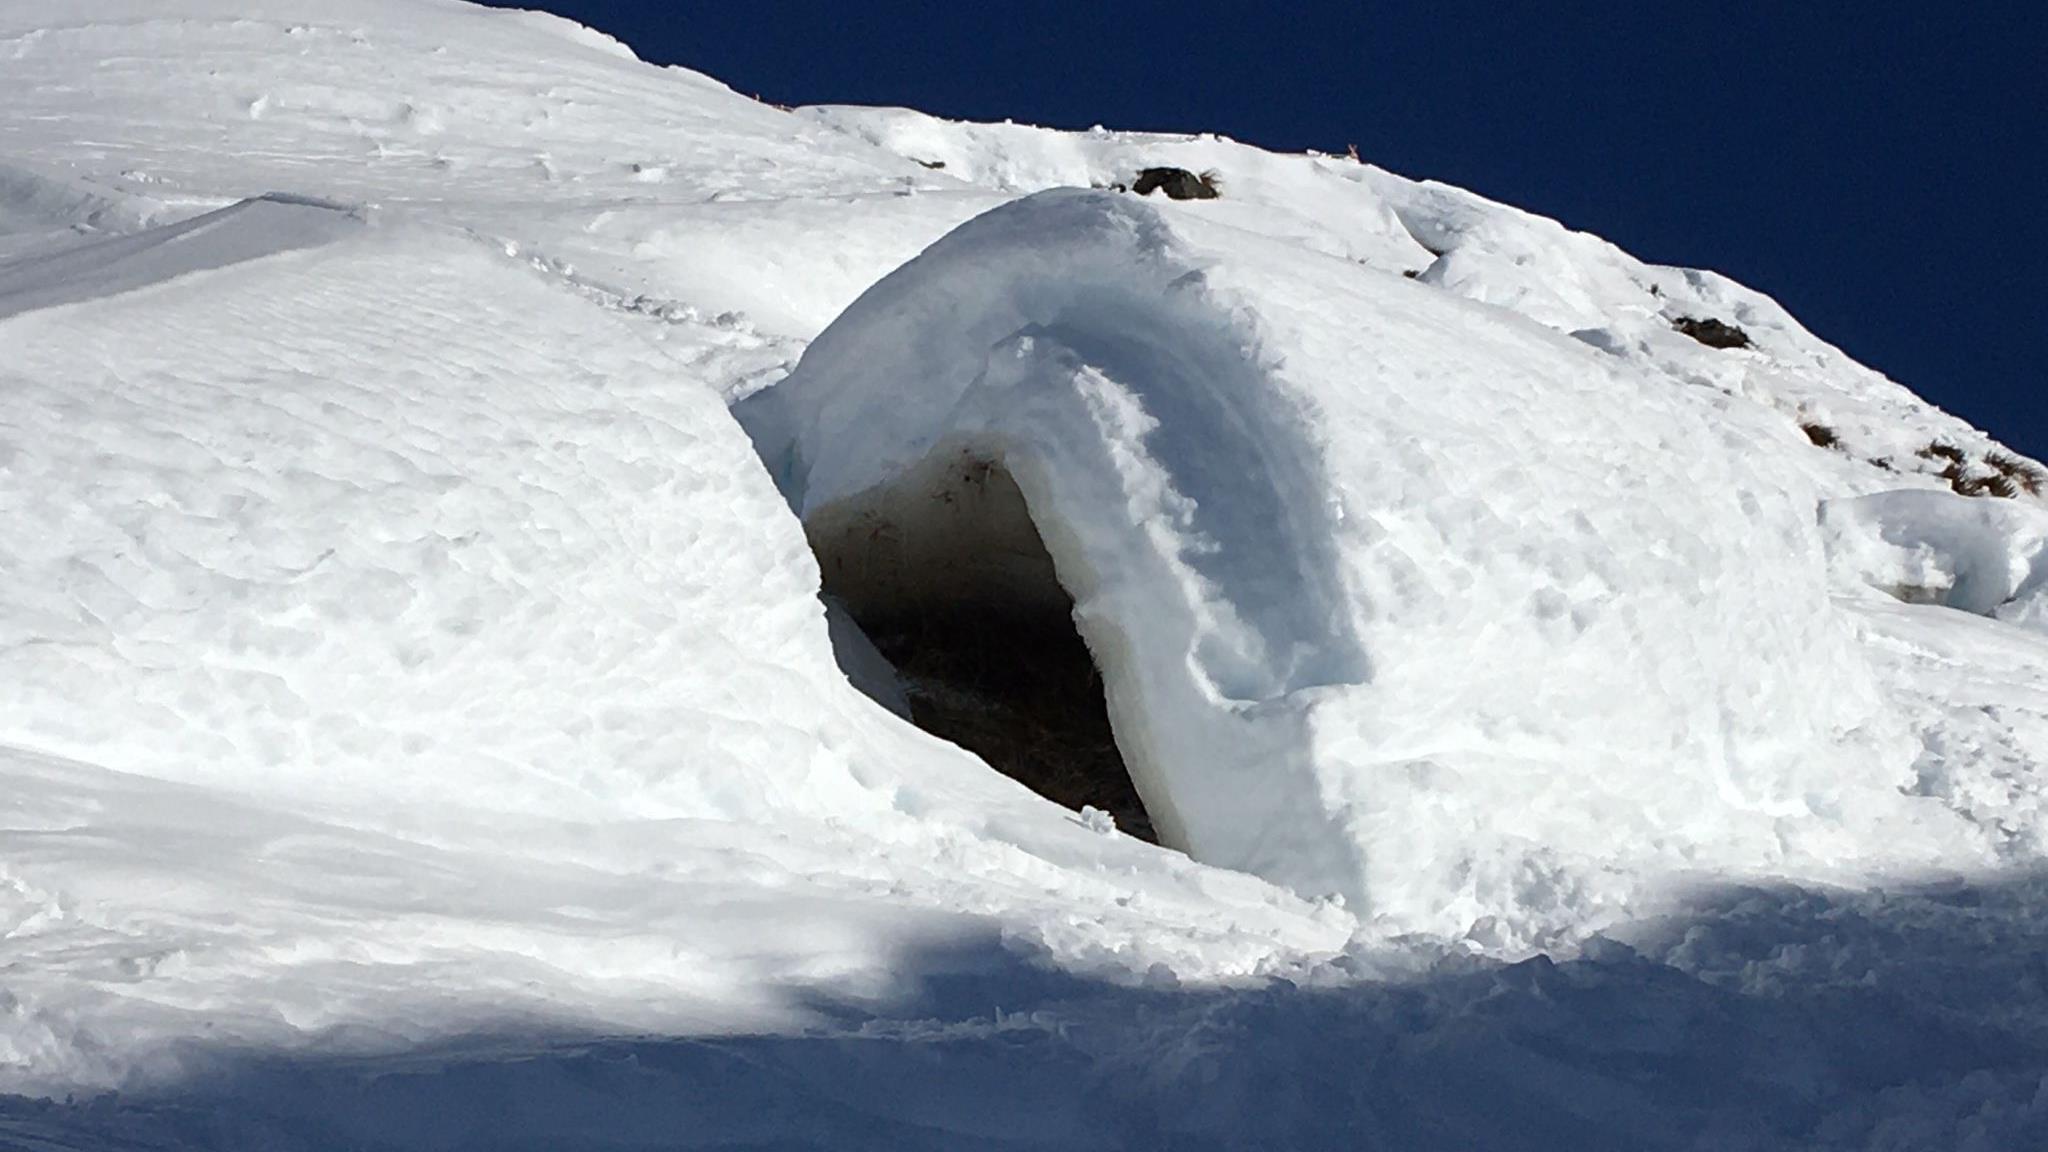
• Record snowfall on June 9th. 175cm HST (at 1760M)
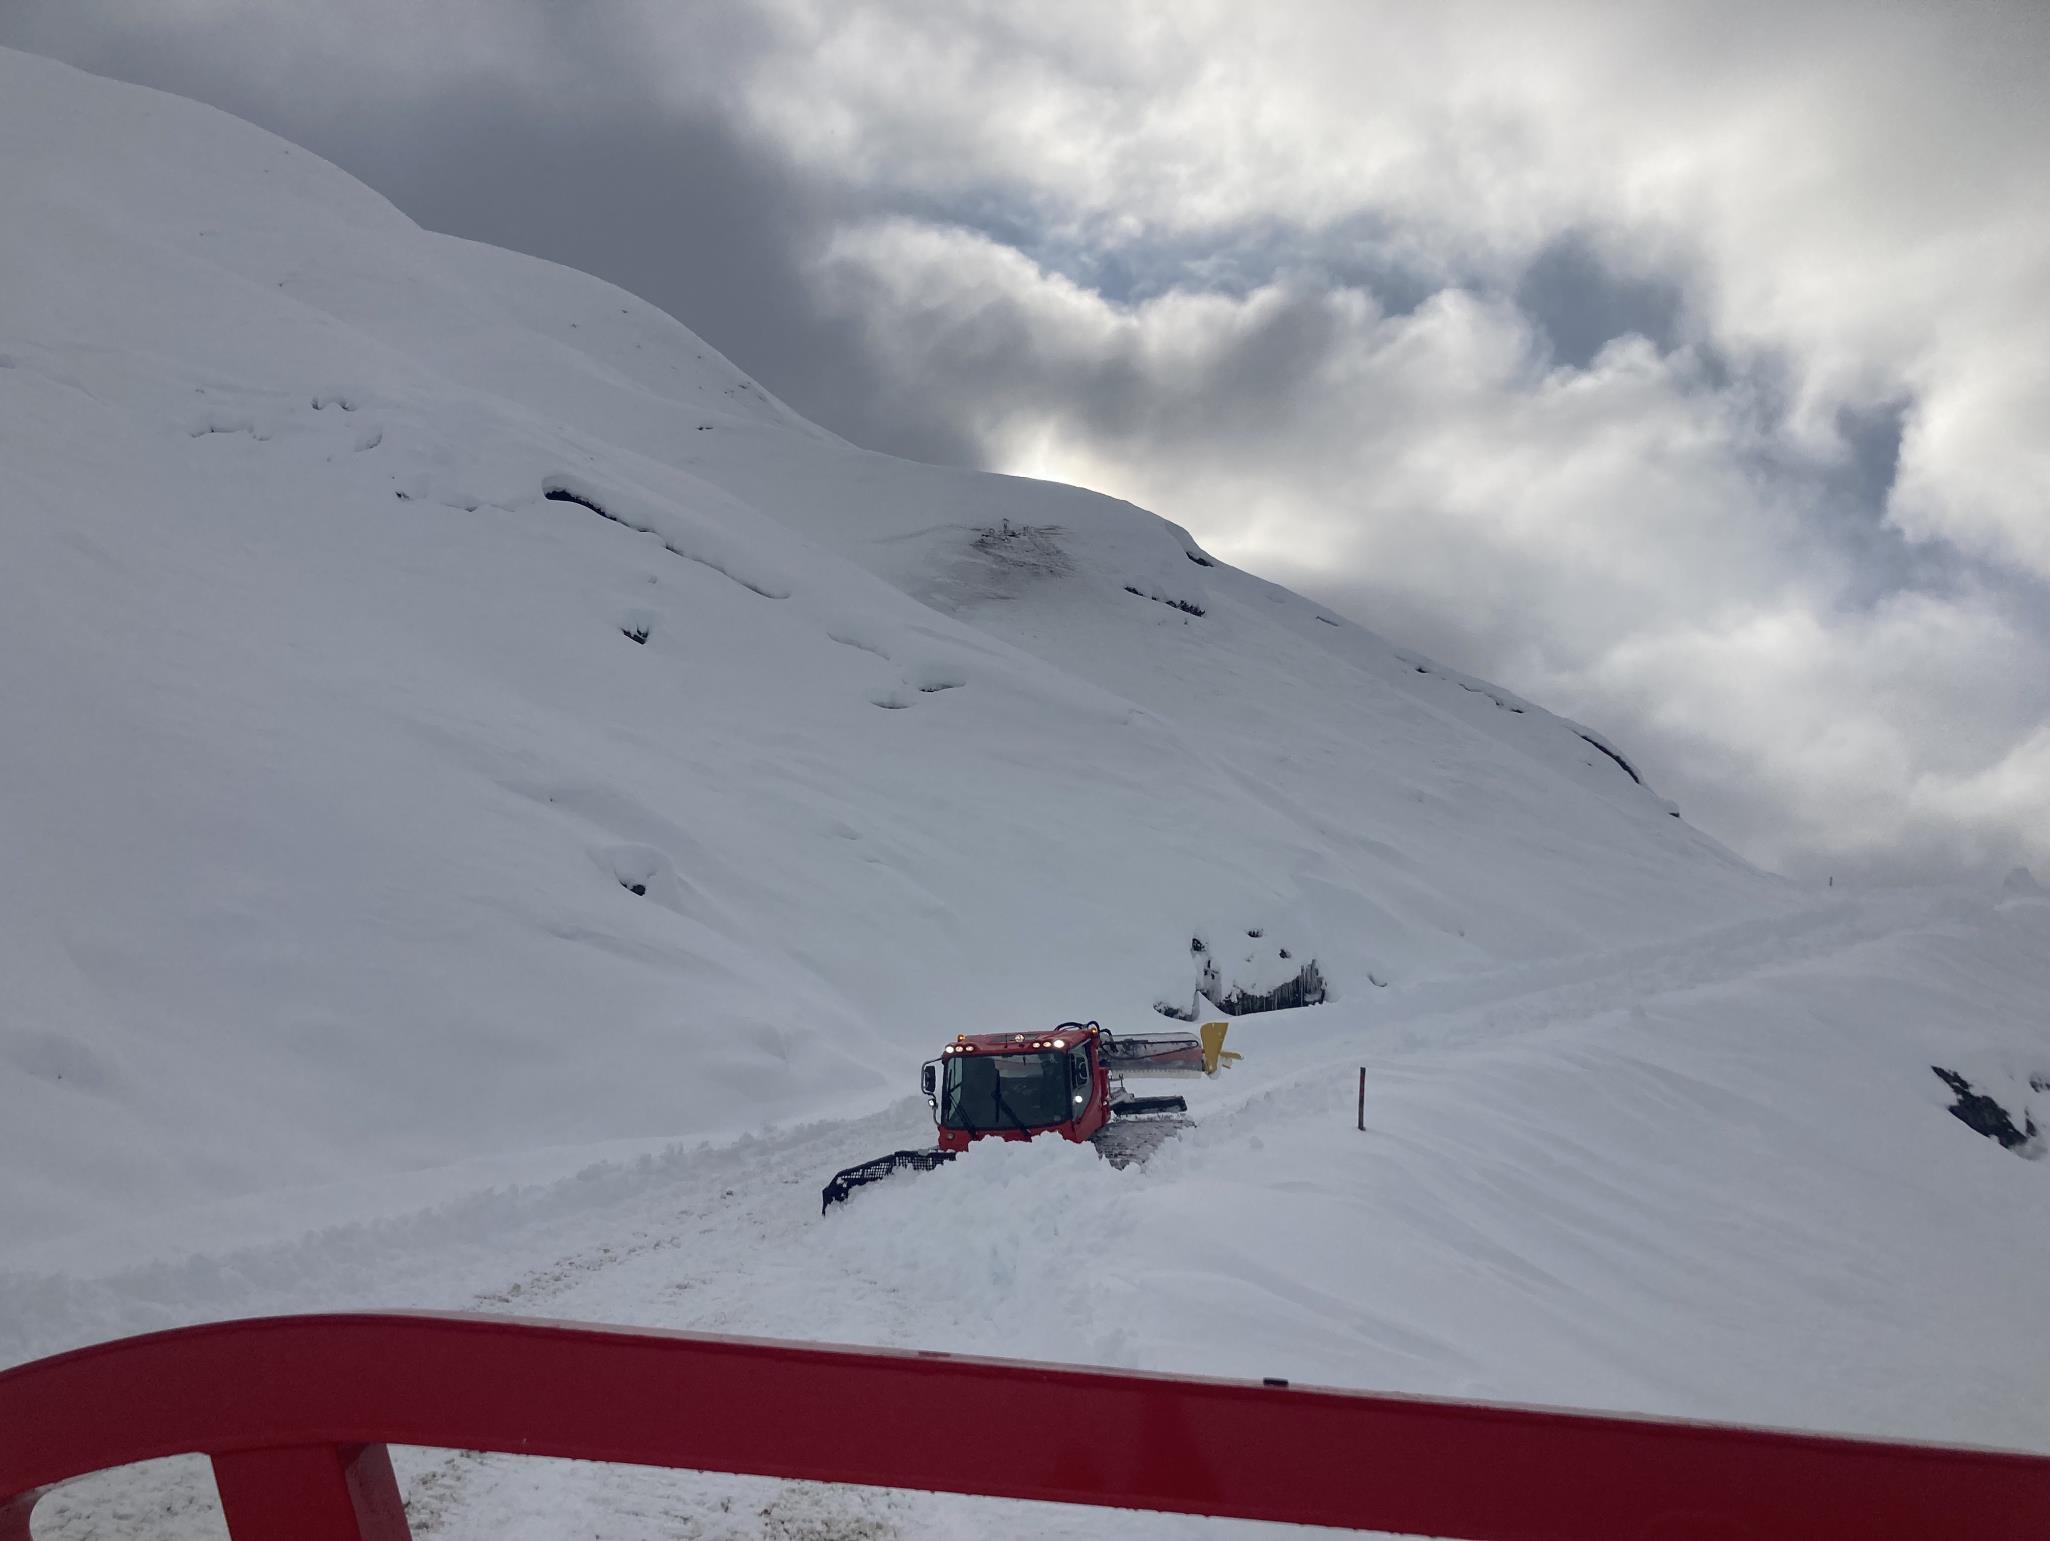
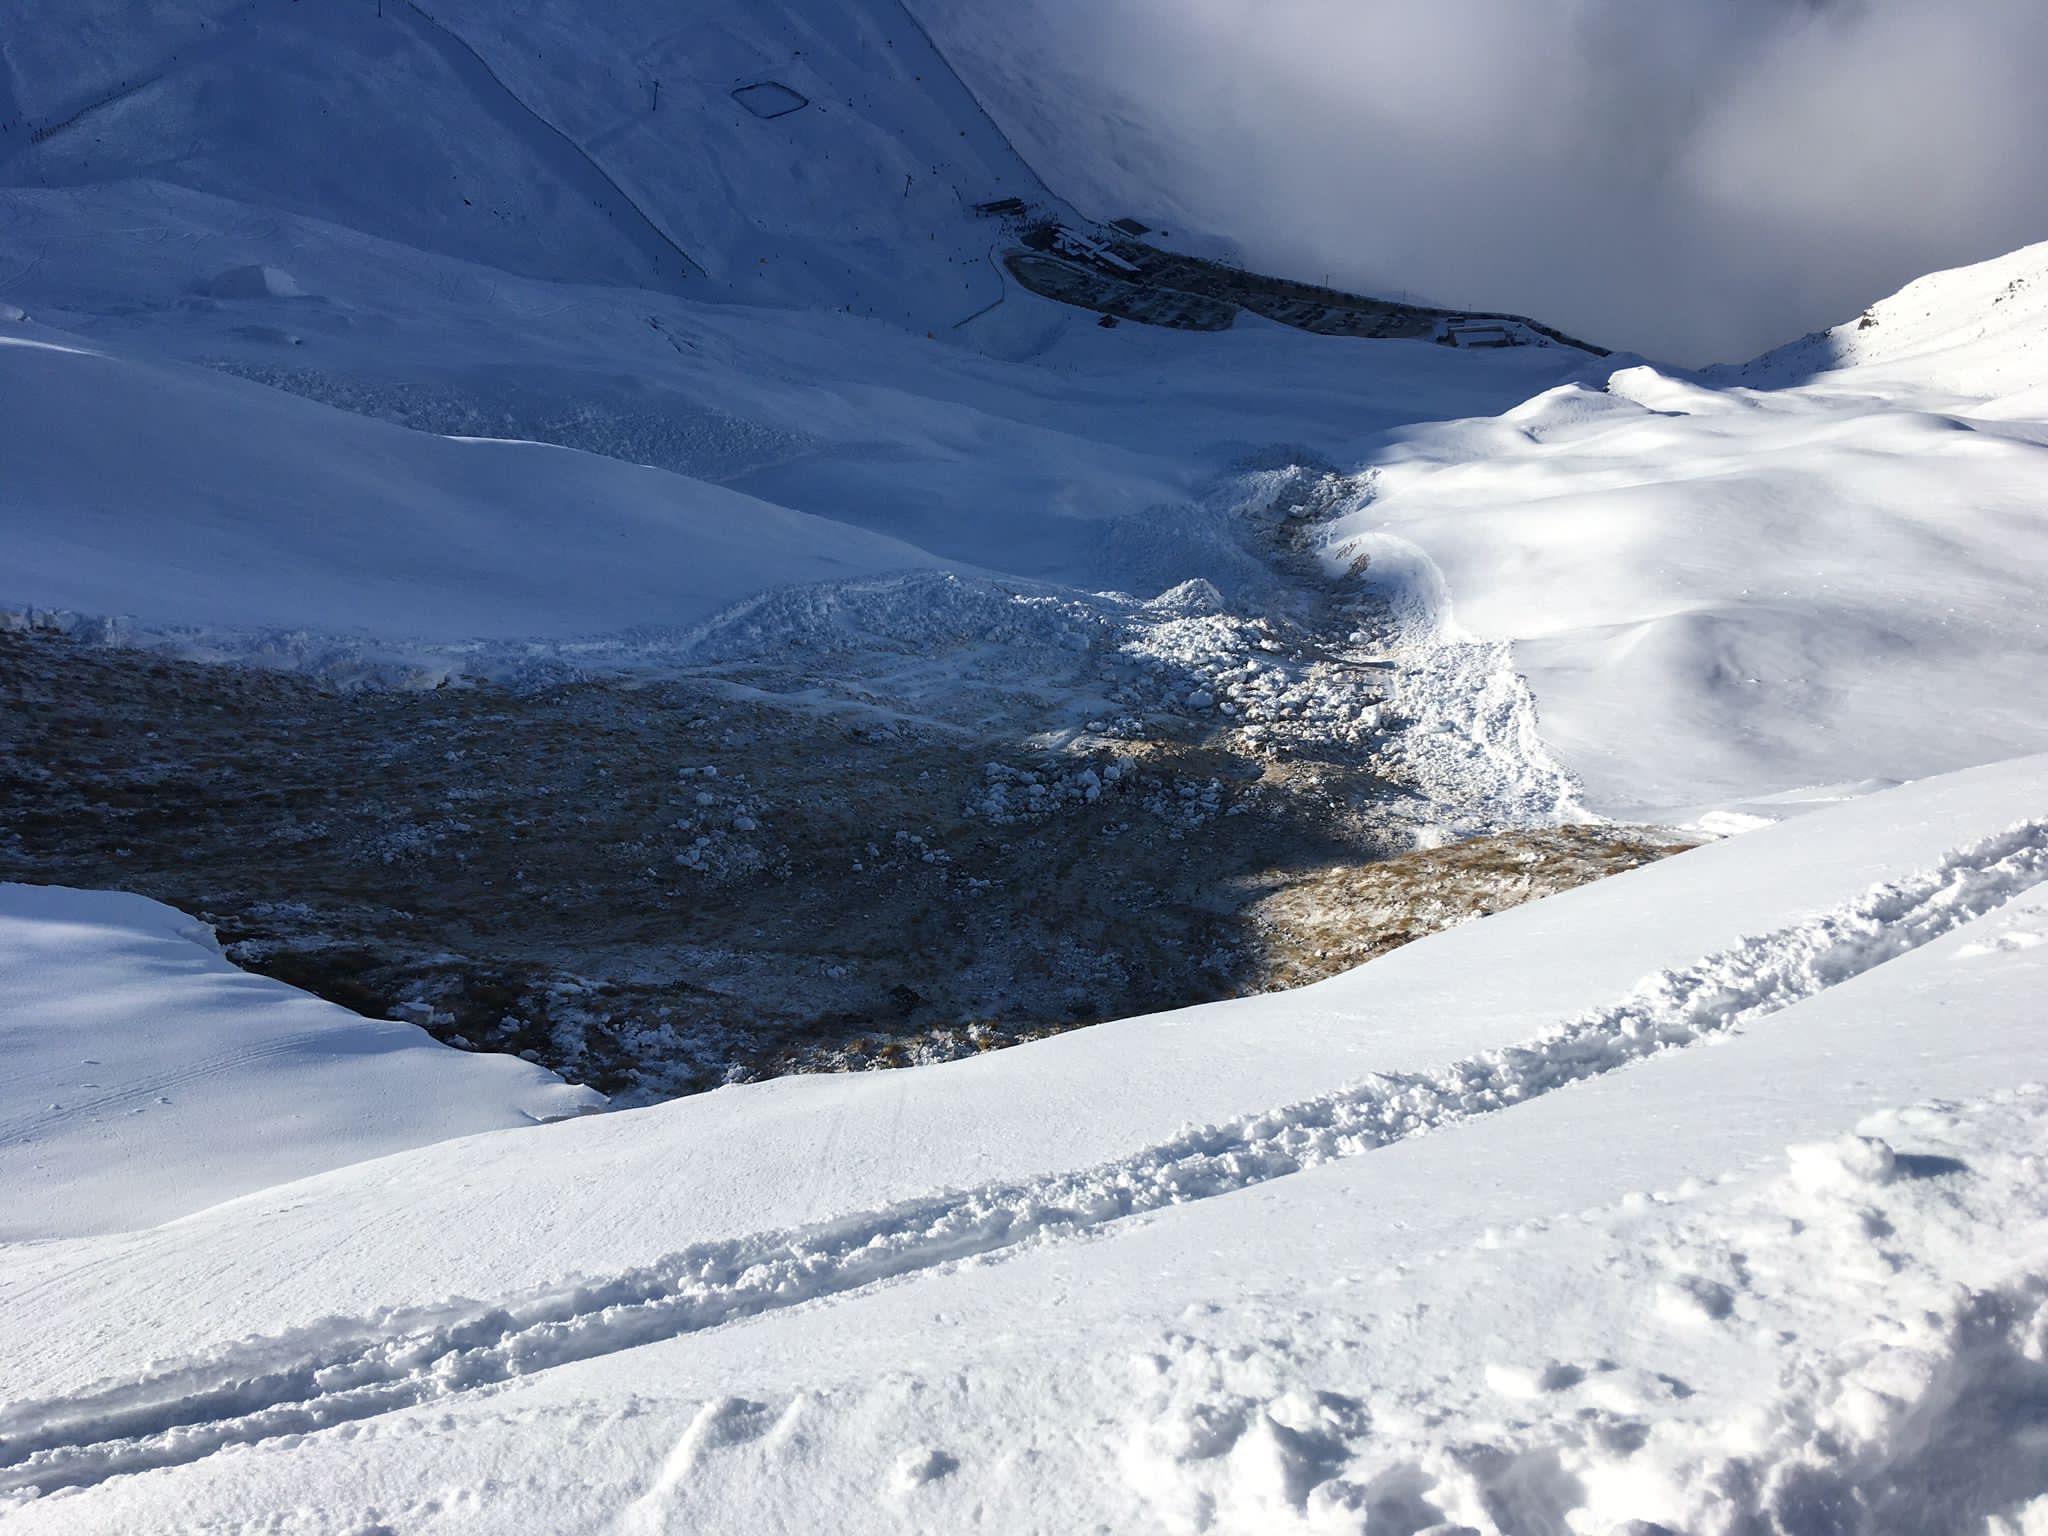
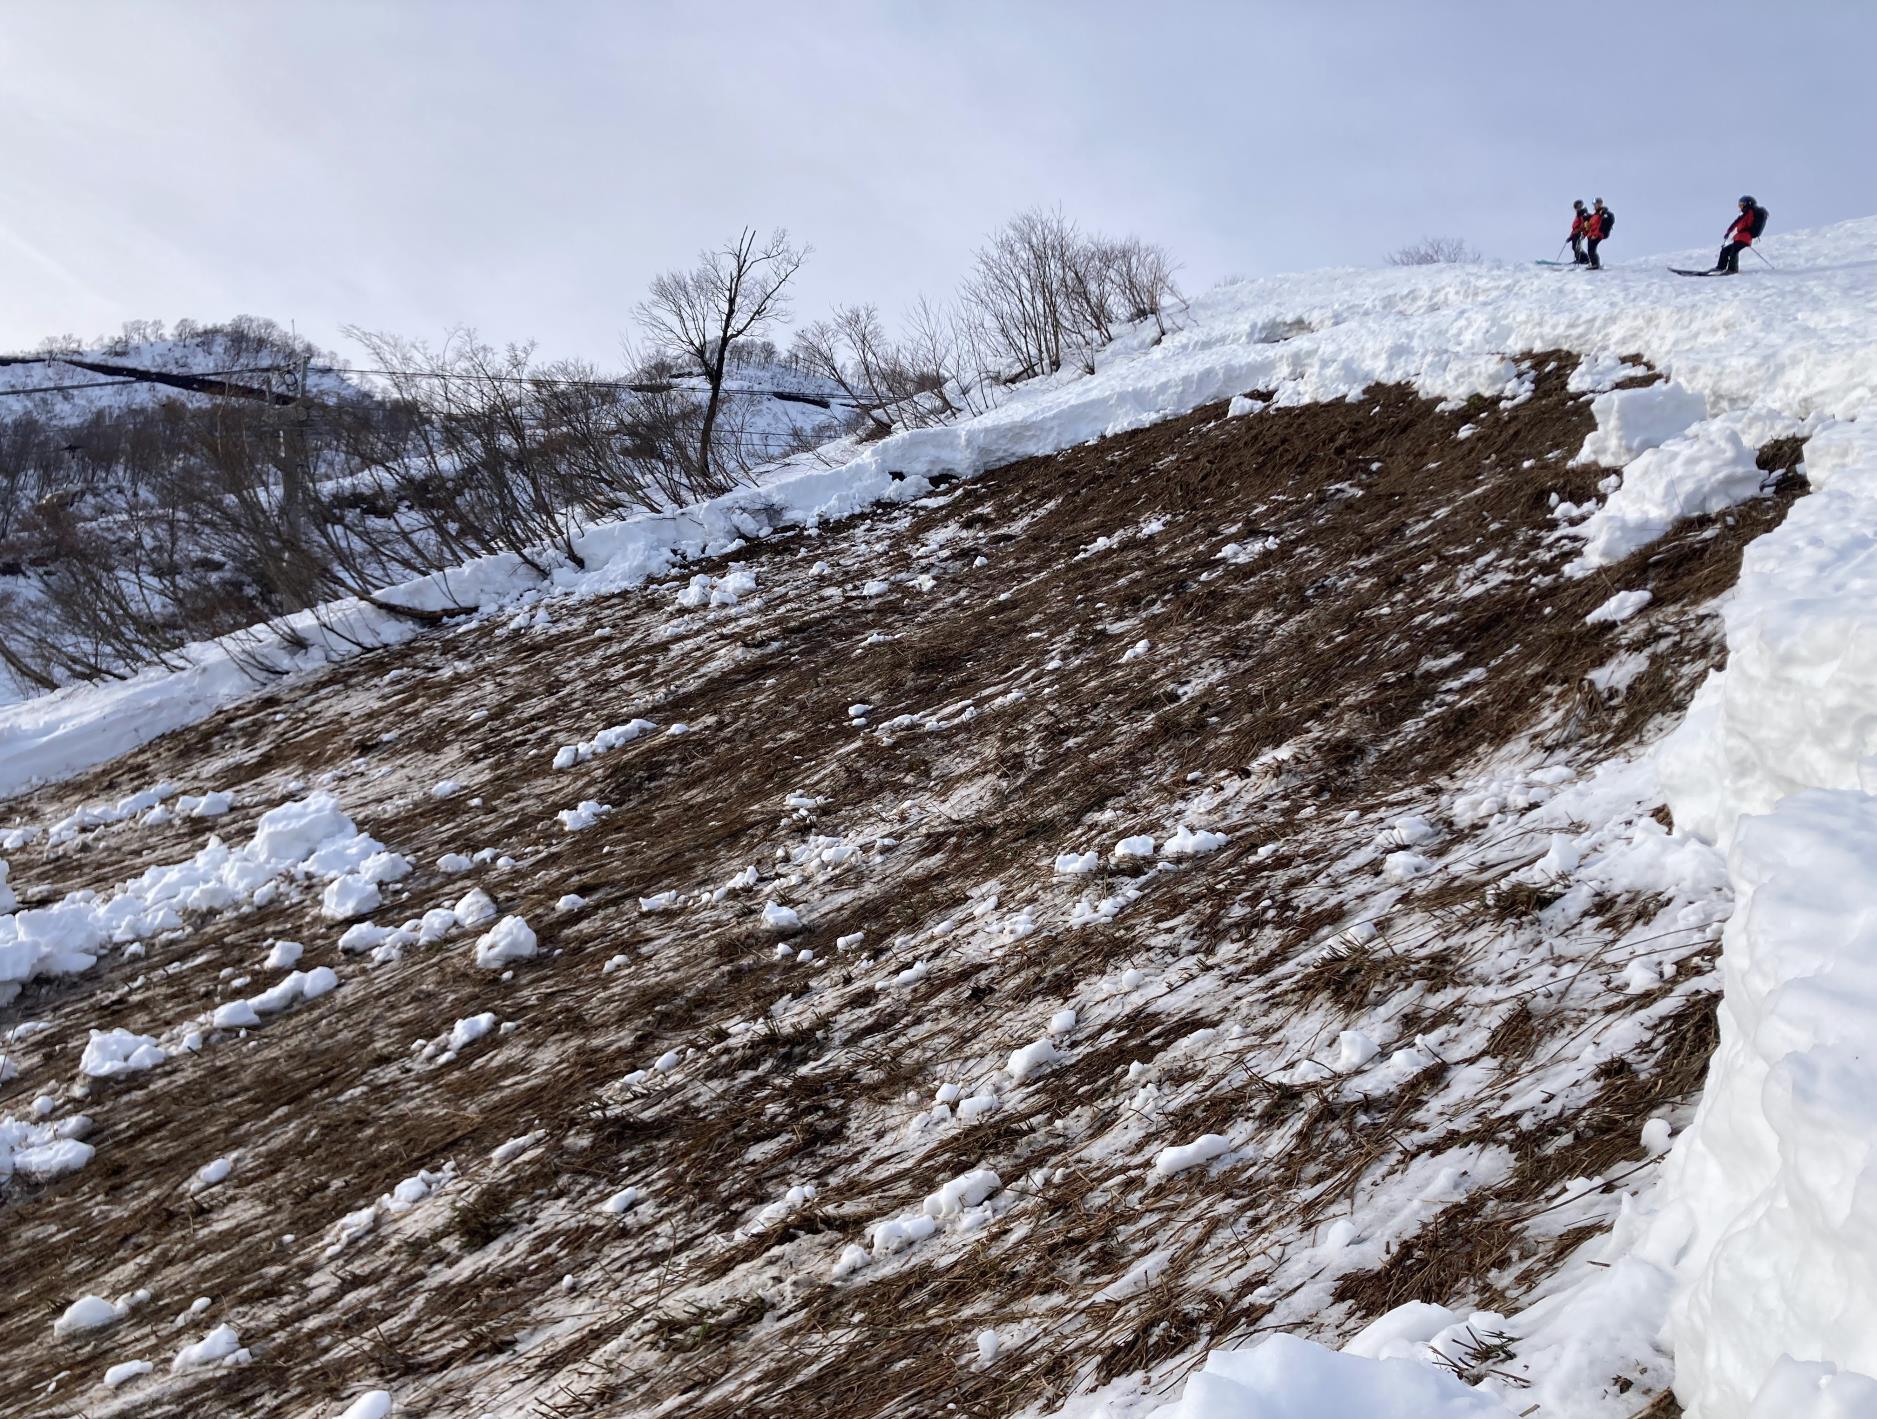
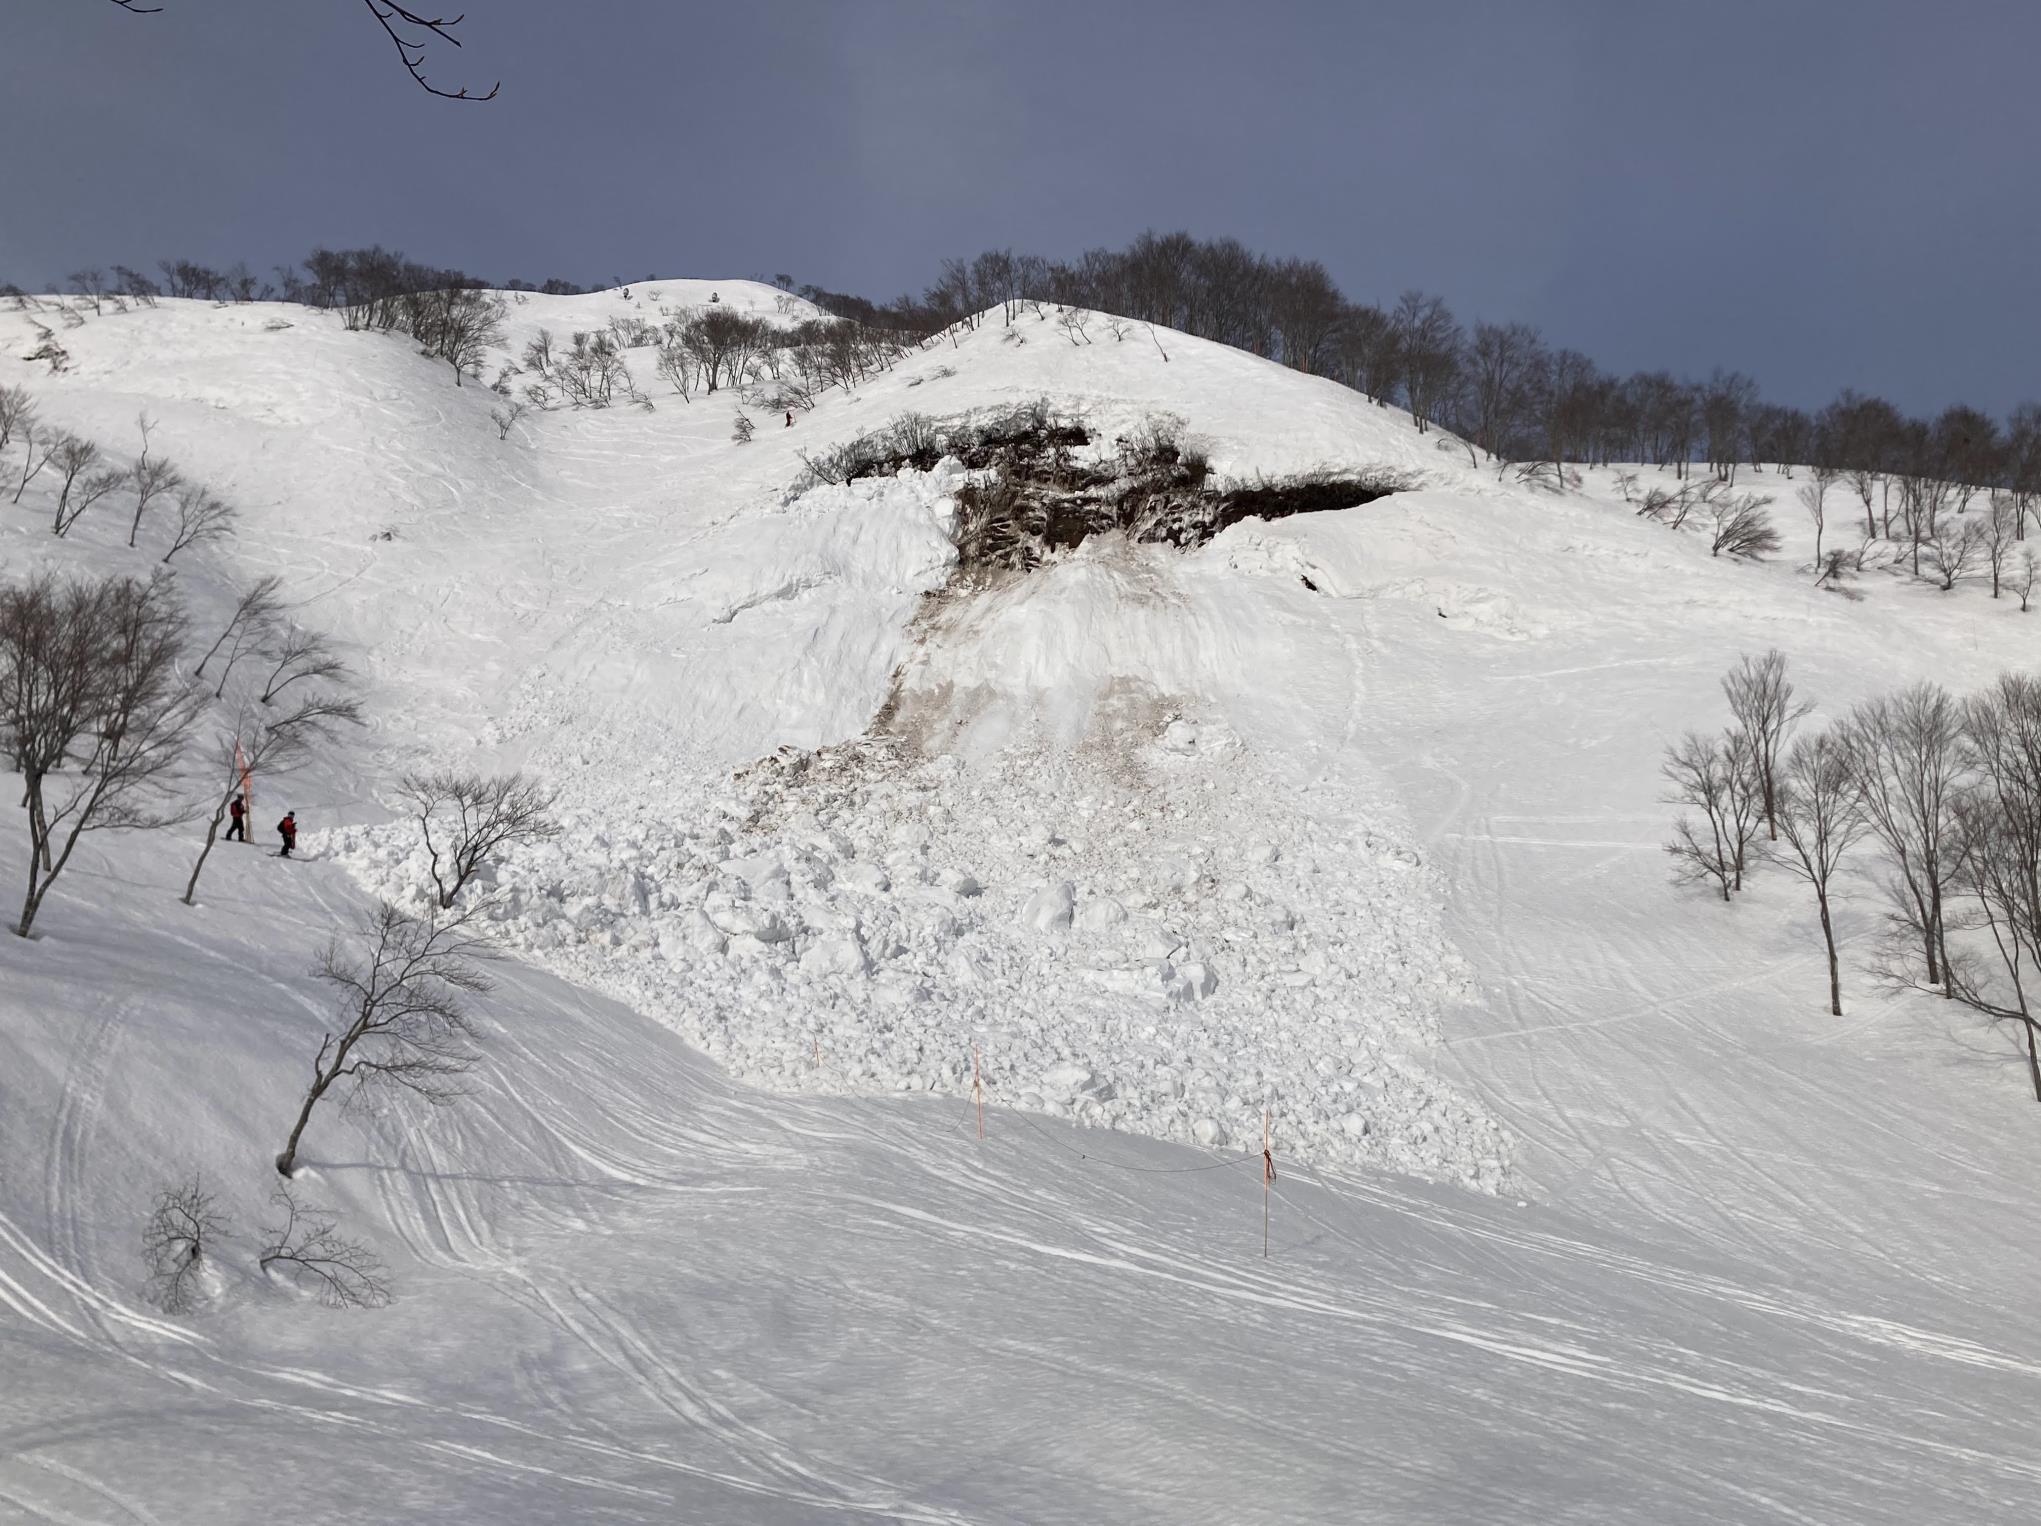
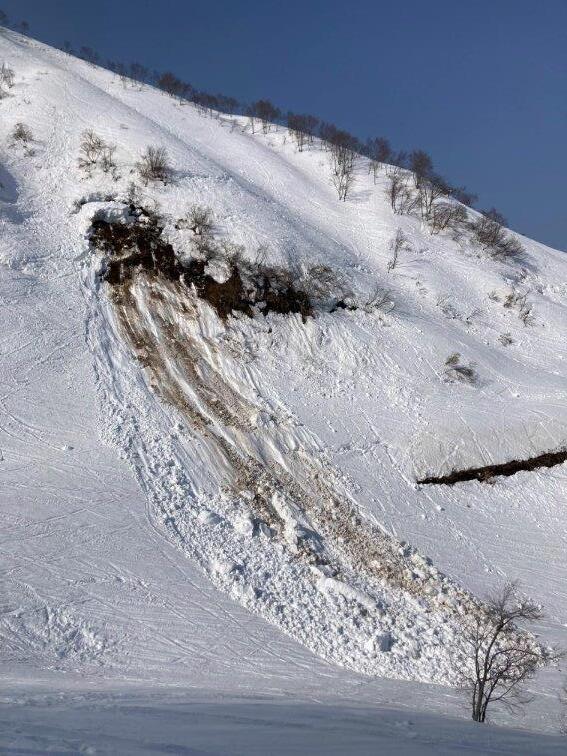
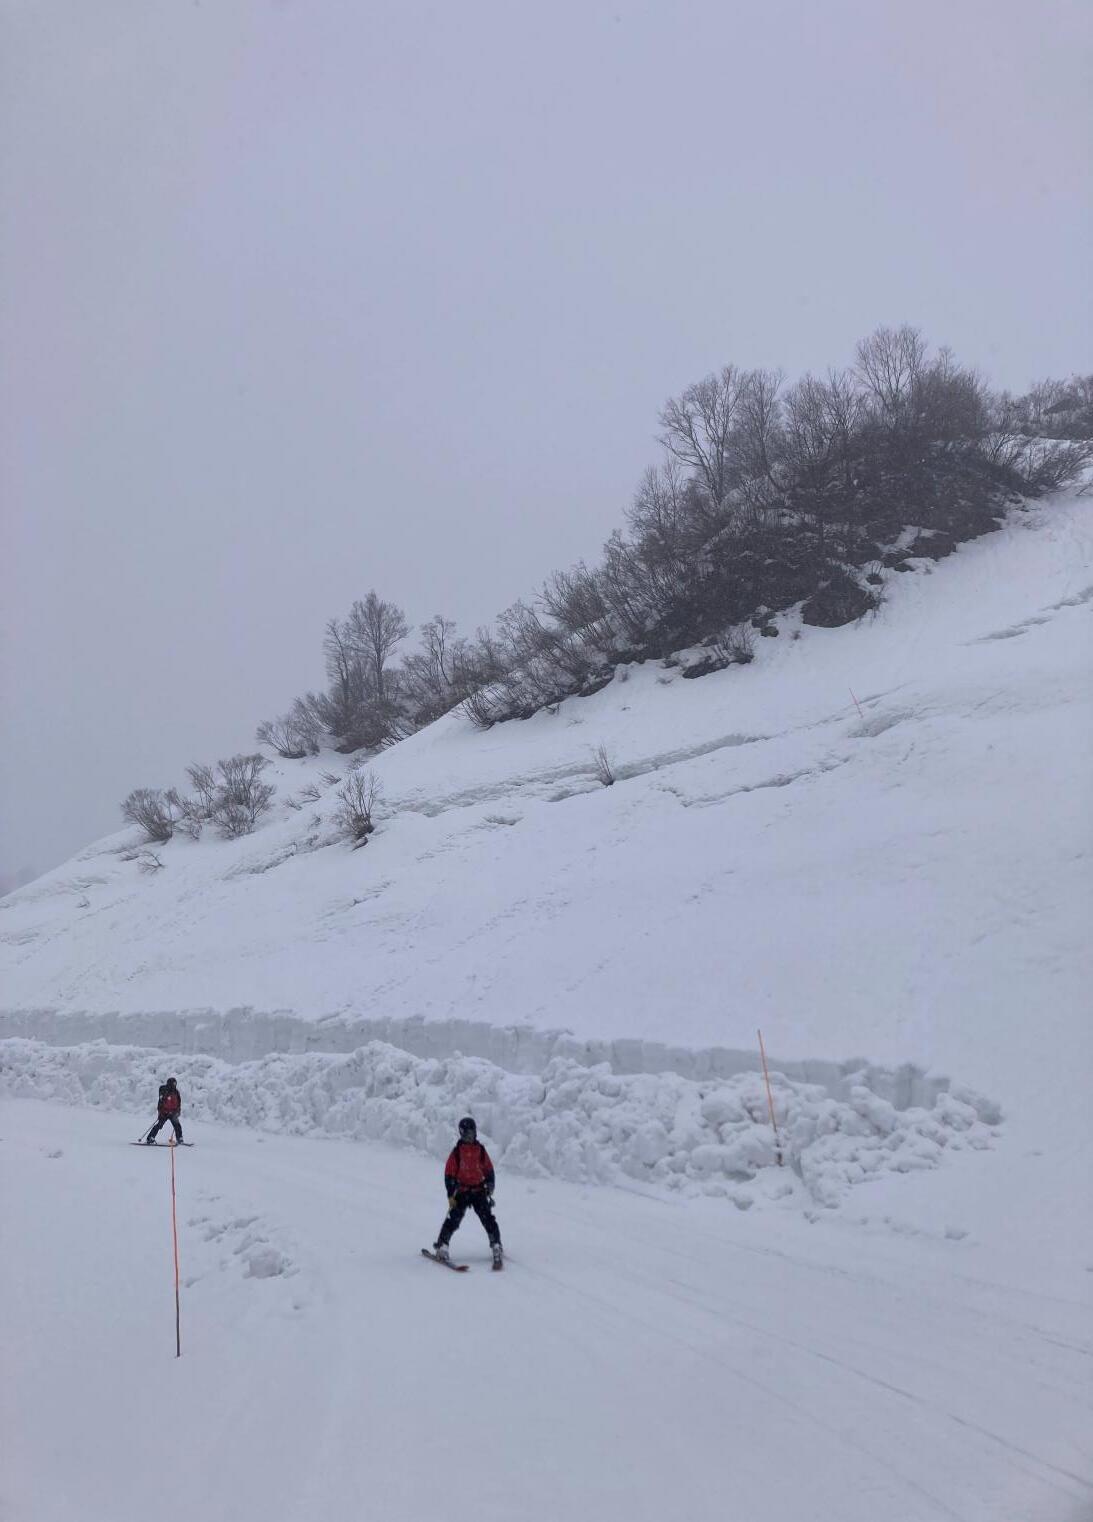
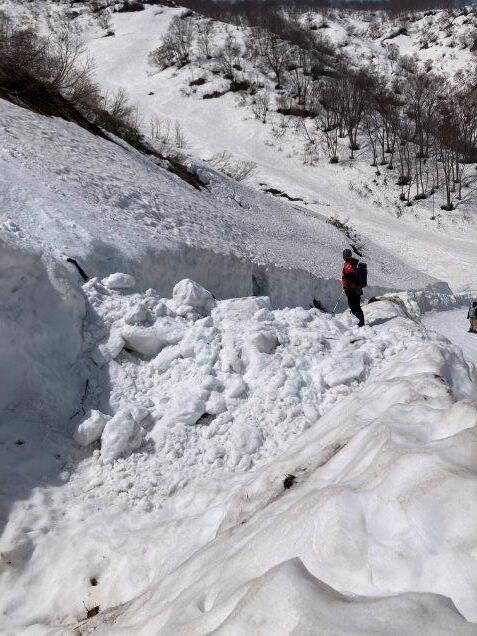
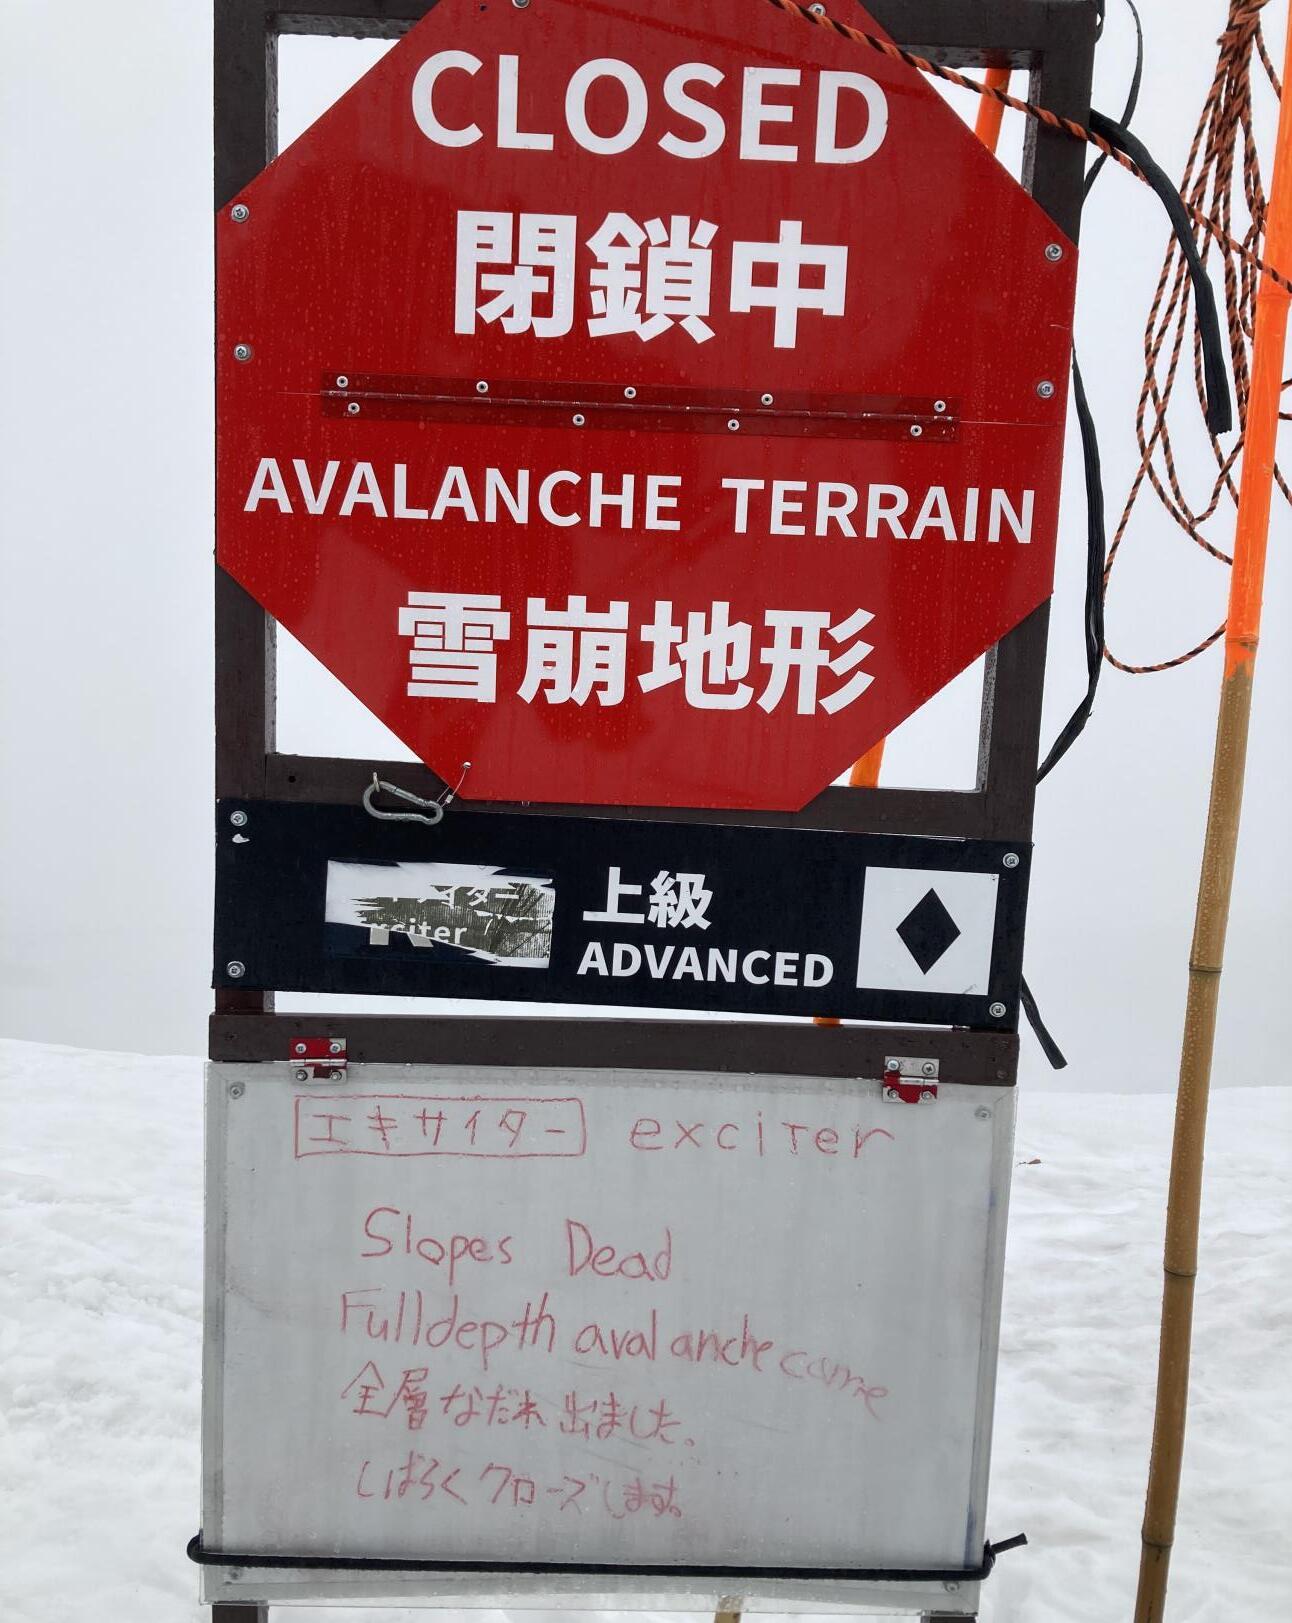
• Deep snow insulated the ground creating a widespread Glide problem on all aspects
Precipitation: Rain Snow
Number of Natural Glide Slab Avalanches
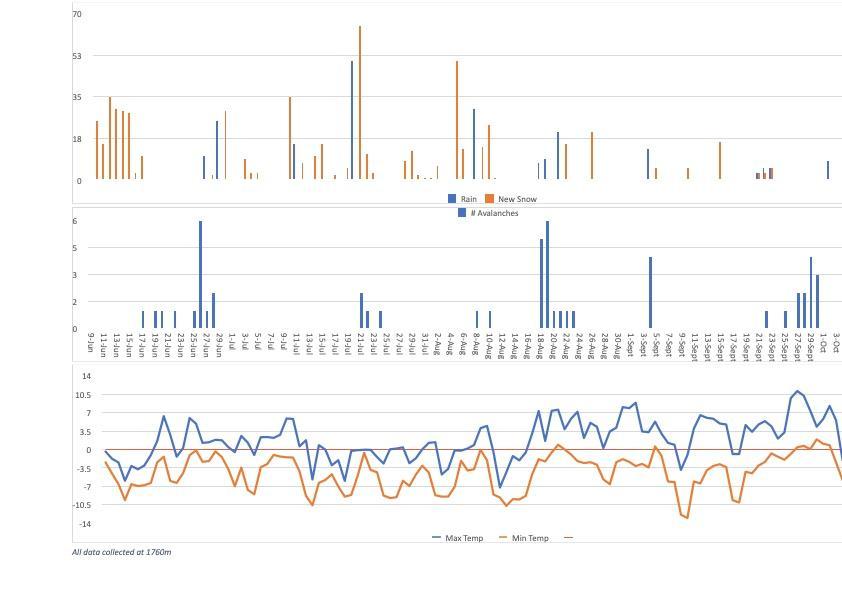
Precipitation: Rain Snow
Number of Natural Glide Slab Avalanches Temperature
17th – 28th June Glide
Precipitation: Rain Snow
Number of Natural Glide Slab Avalanches
Precipitation: Rain Snow
Number of Natural Glide
Slab Avalanches Temperature Maximum
17th-23rd August
17- 23 August
Precipitation: Rain Snow
Number of Natural Glide Slab Avalanches
22nd September- 1st October.
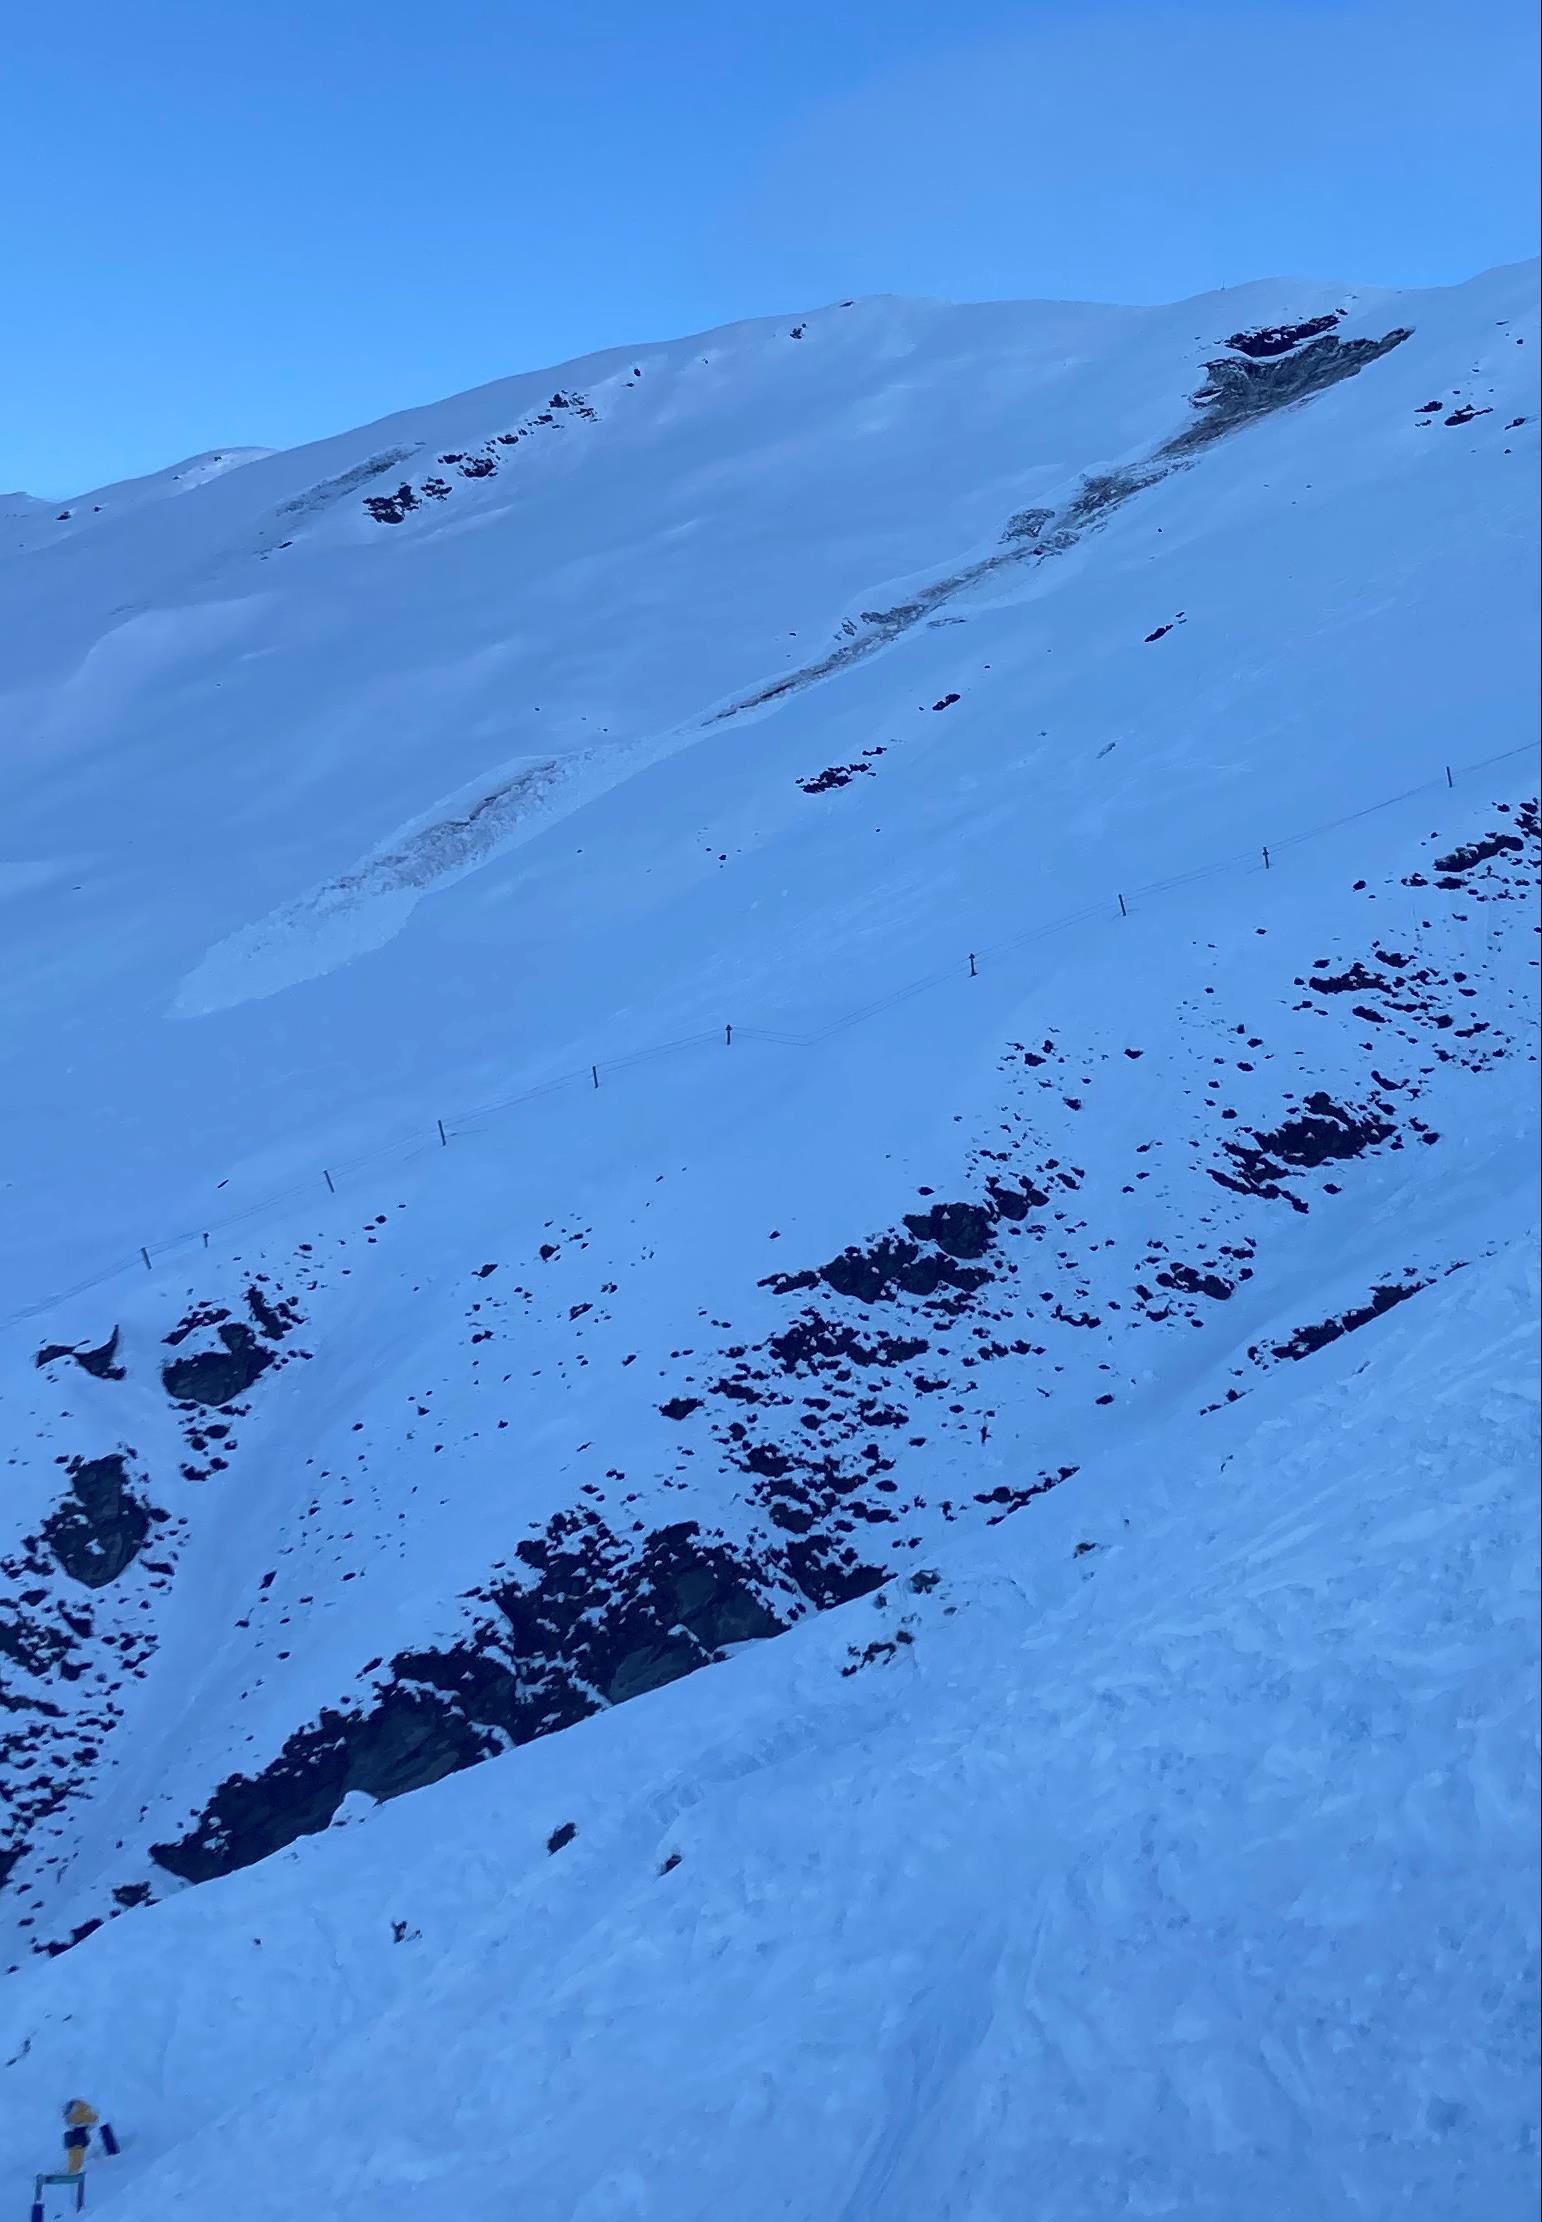
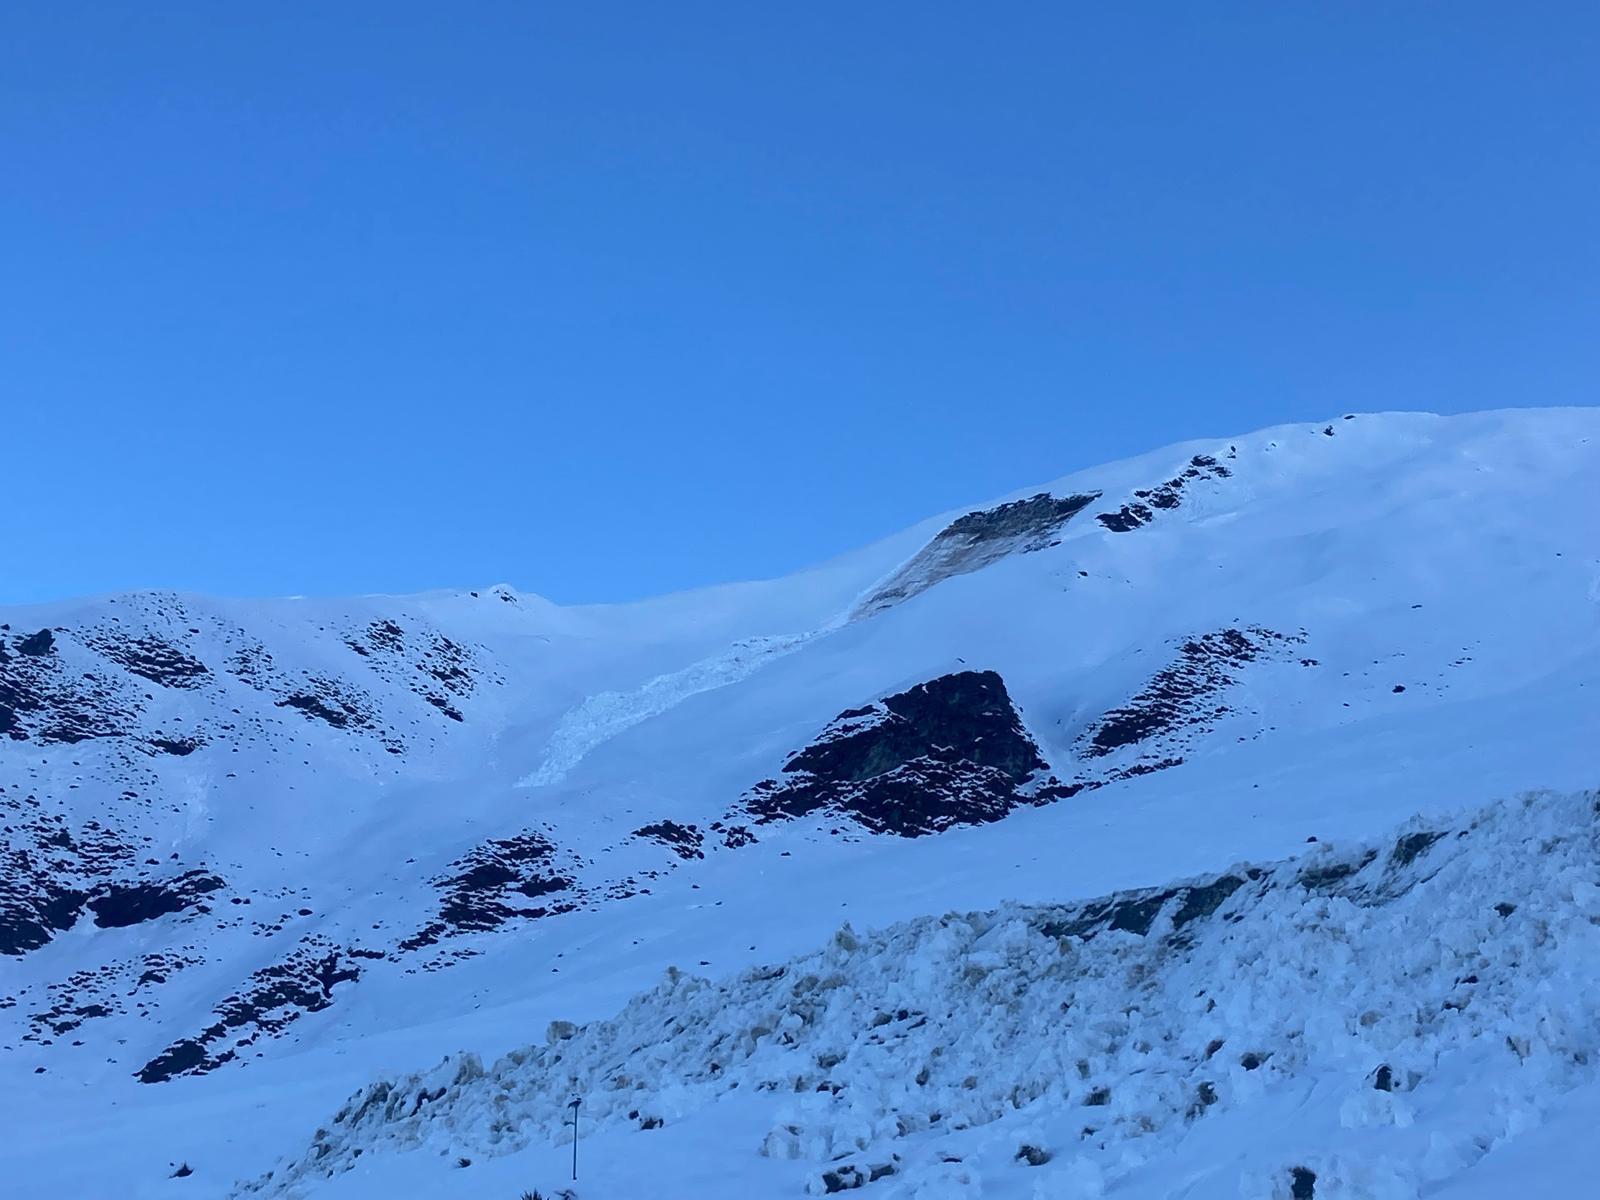
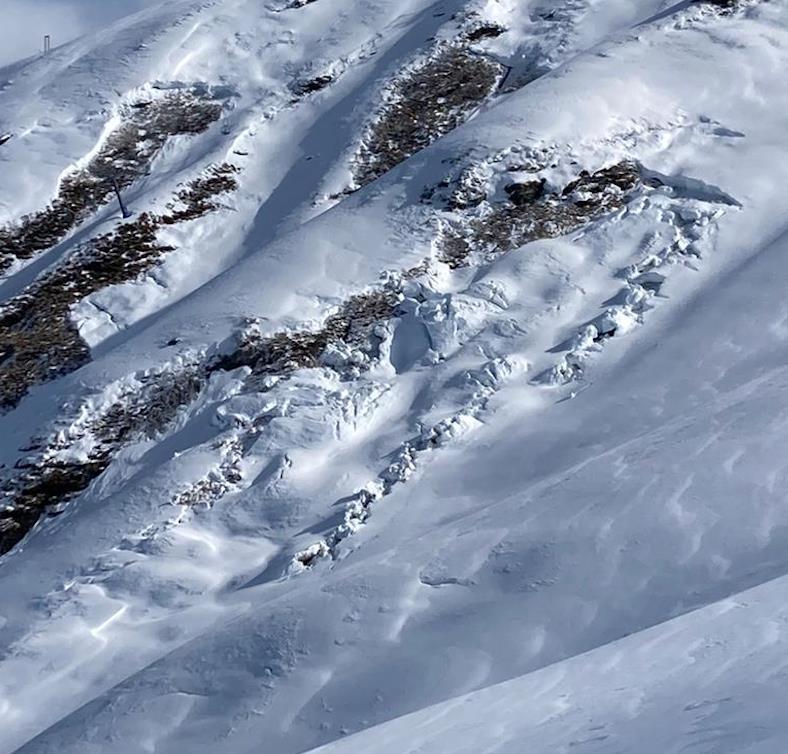
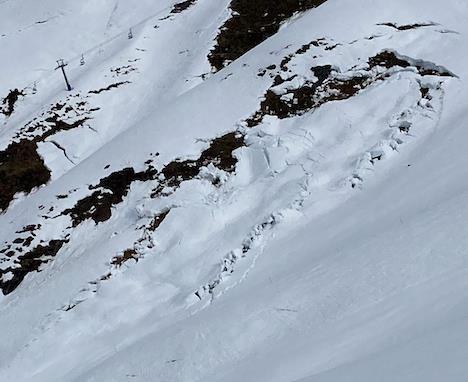

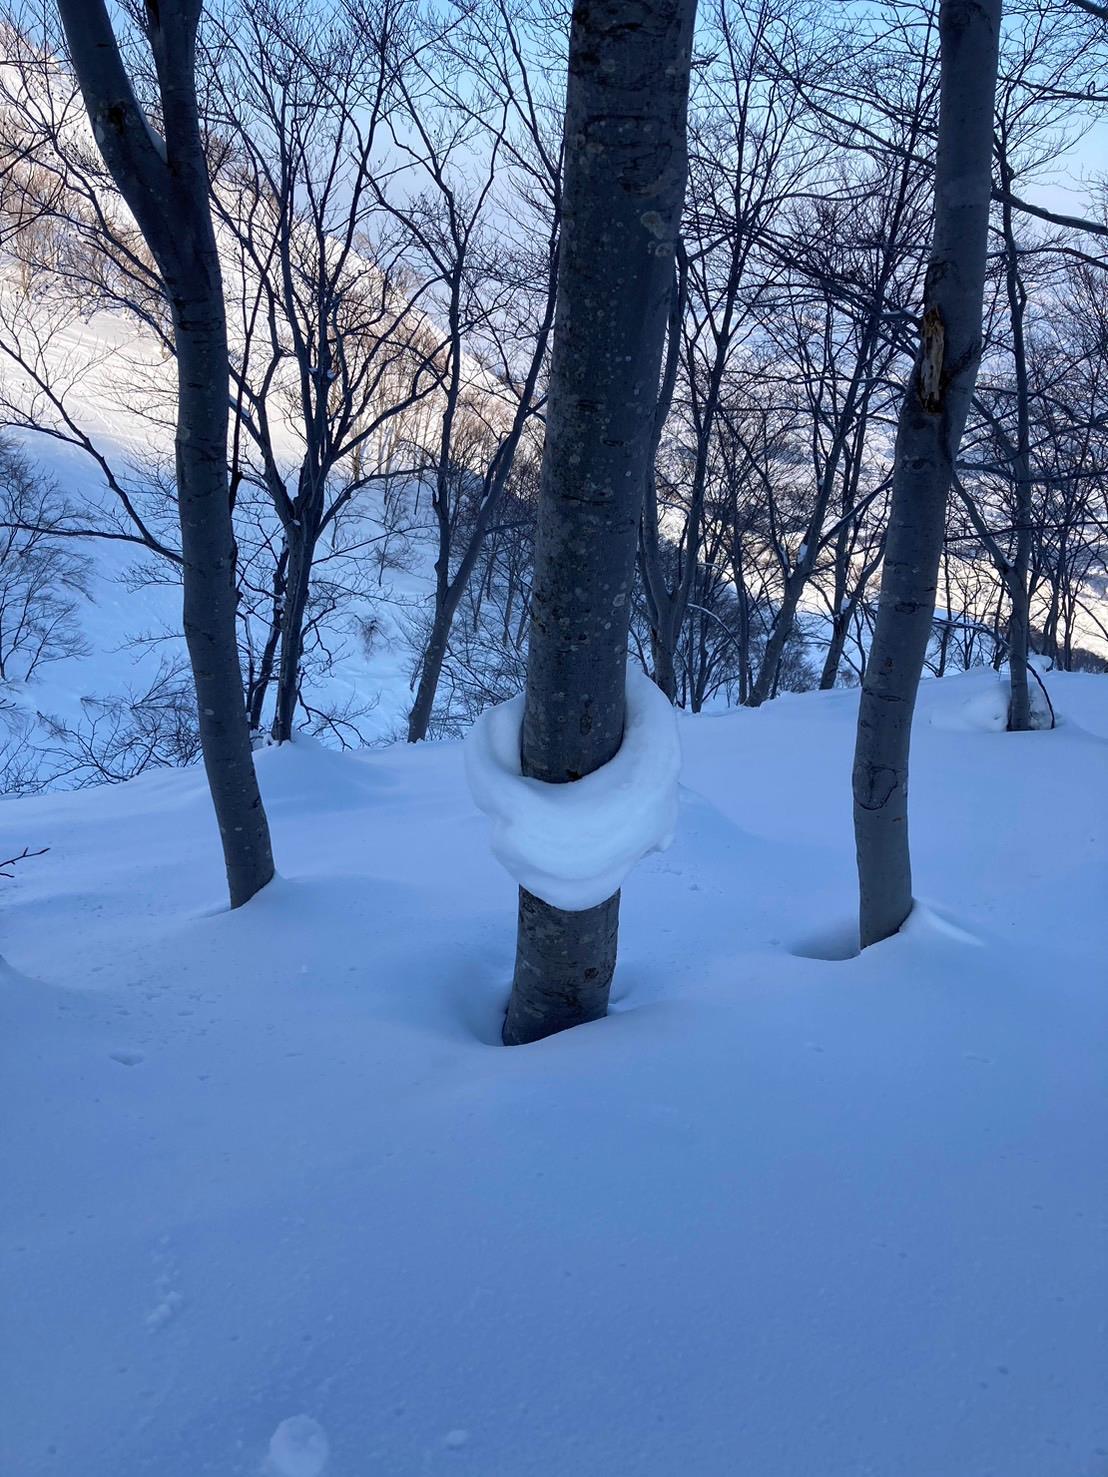
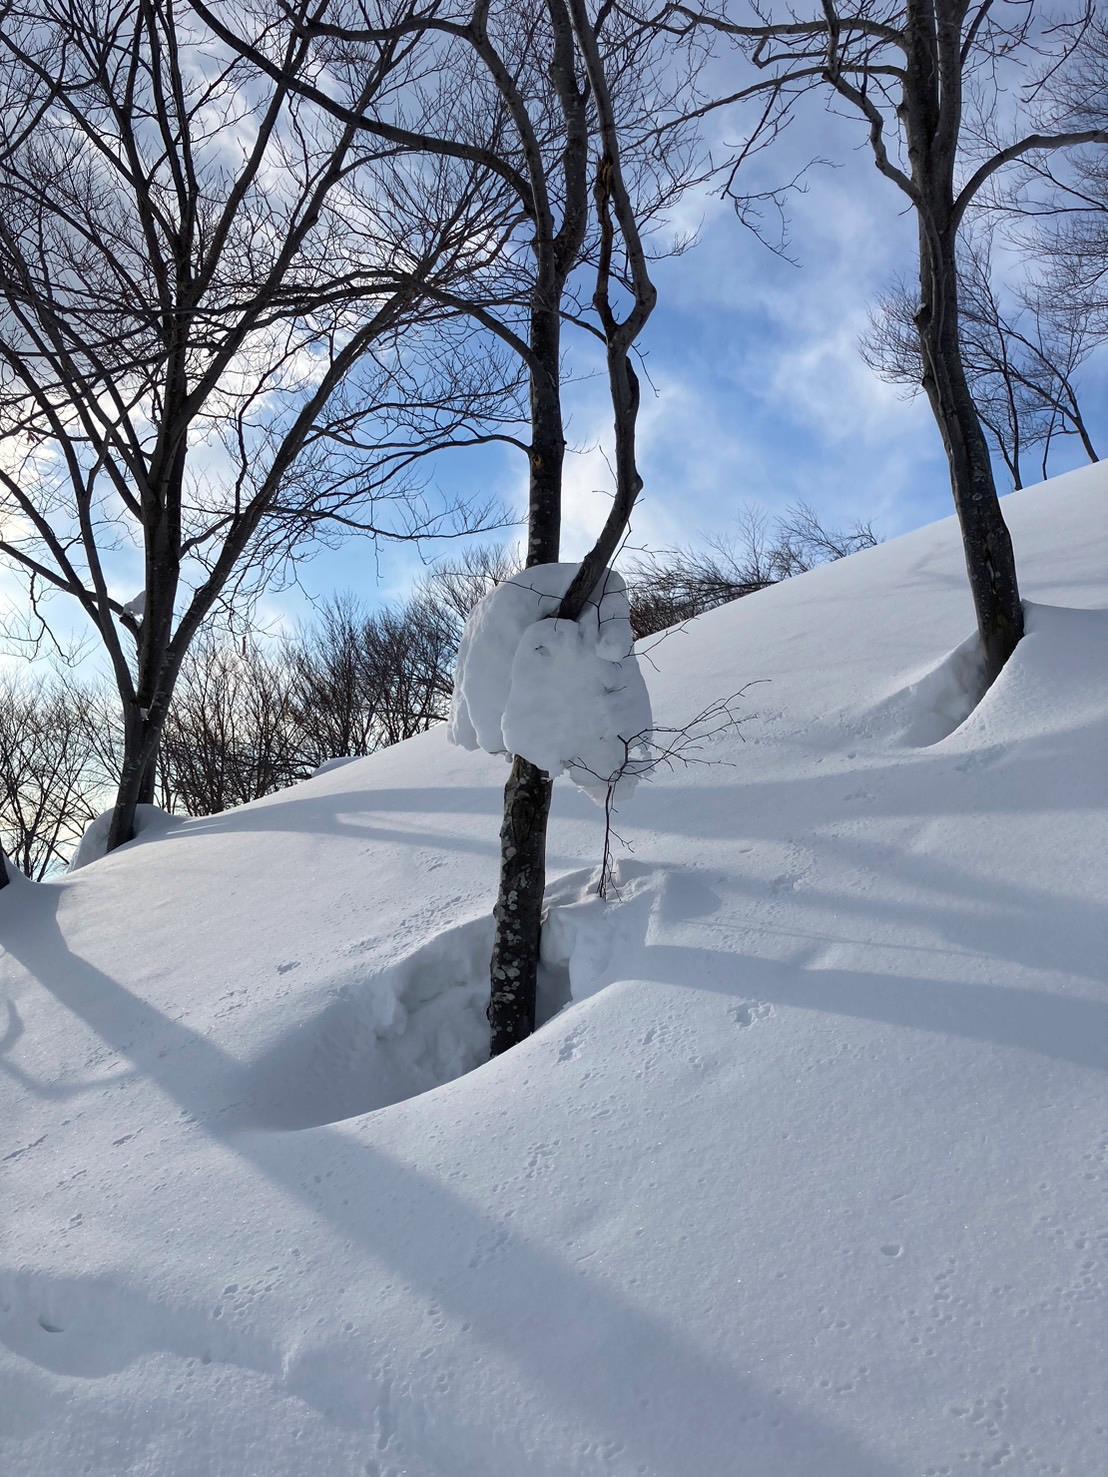
• The major influence on formation of a glide avalanche problem is lubrication of the ground cover, this does not only occur from melt and rain on the surface.
• The origin of free water at ground changes the character of the avalanche problem
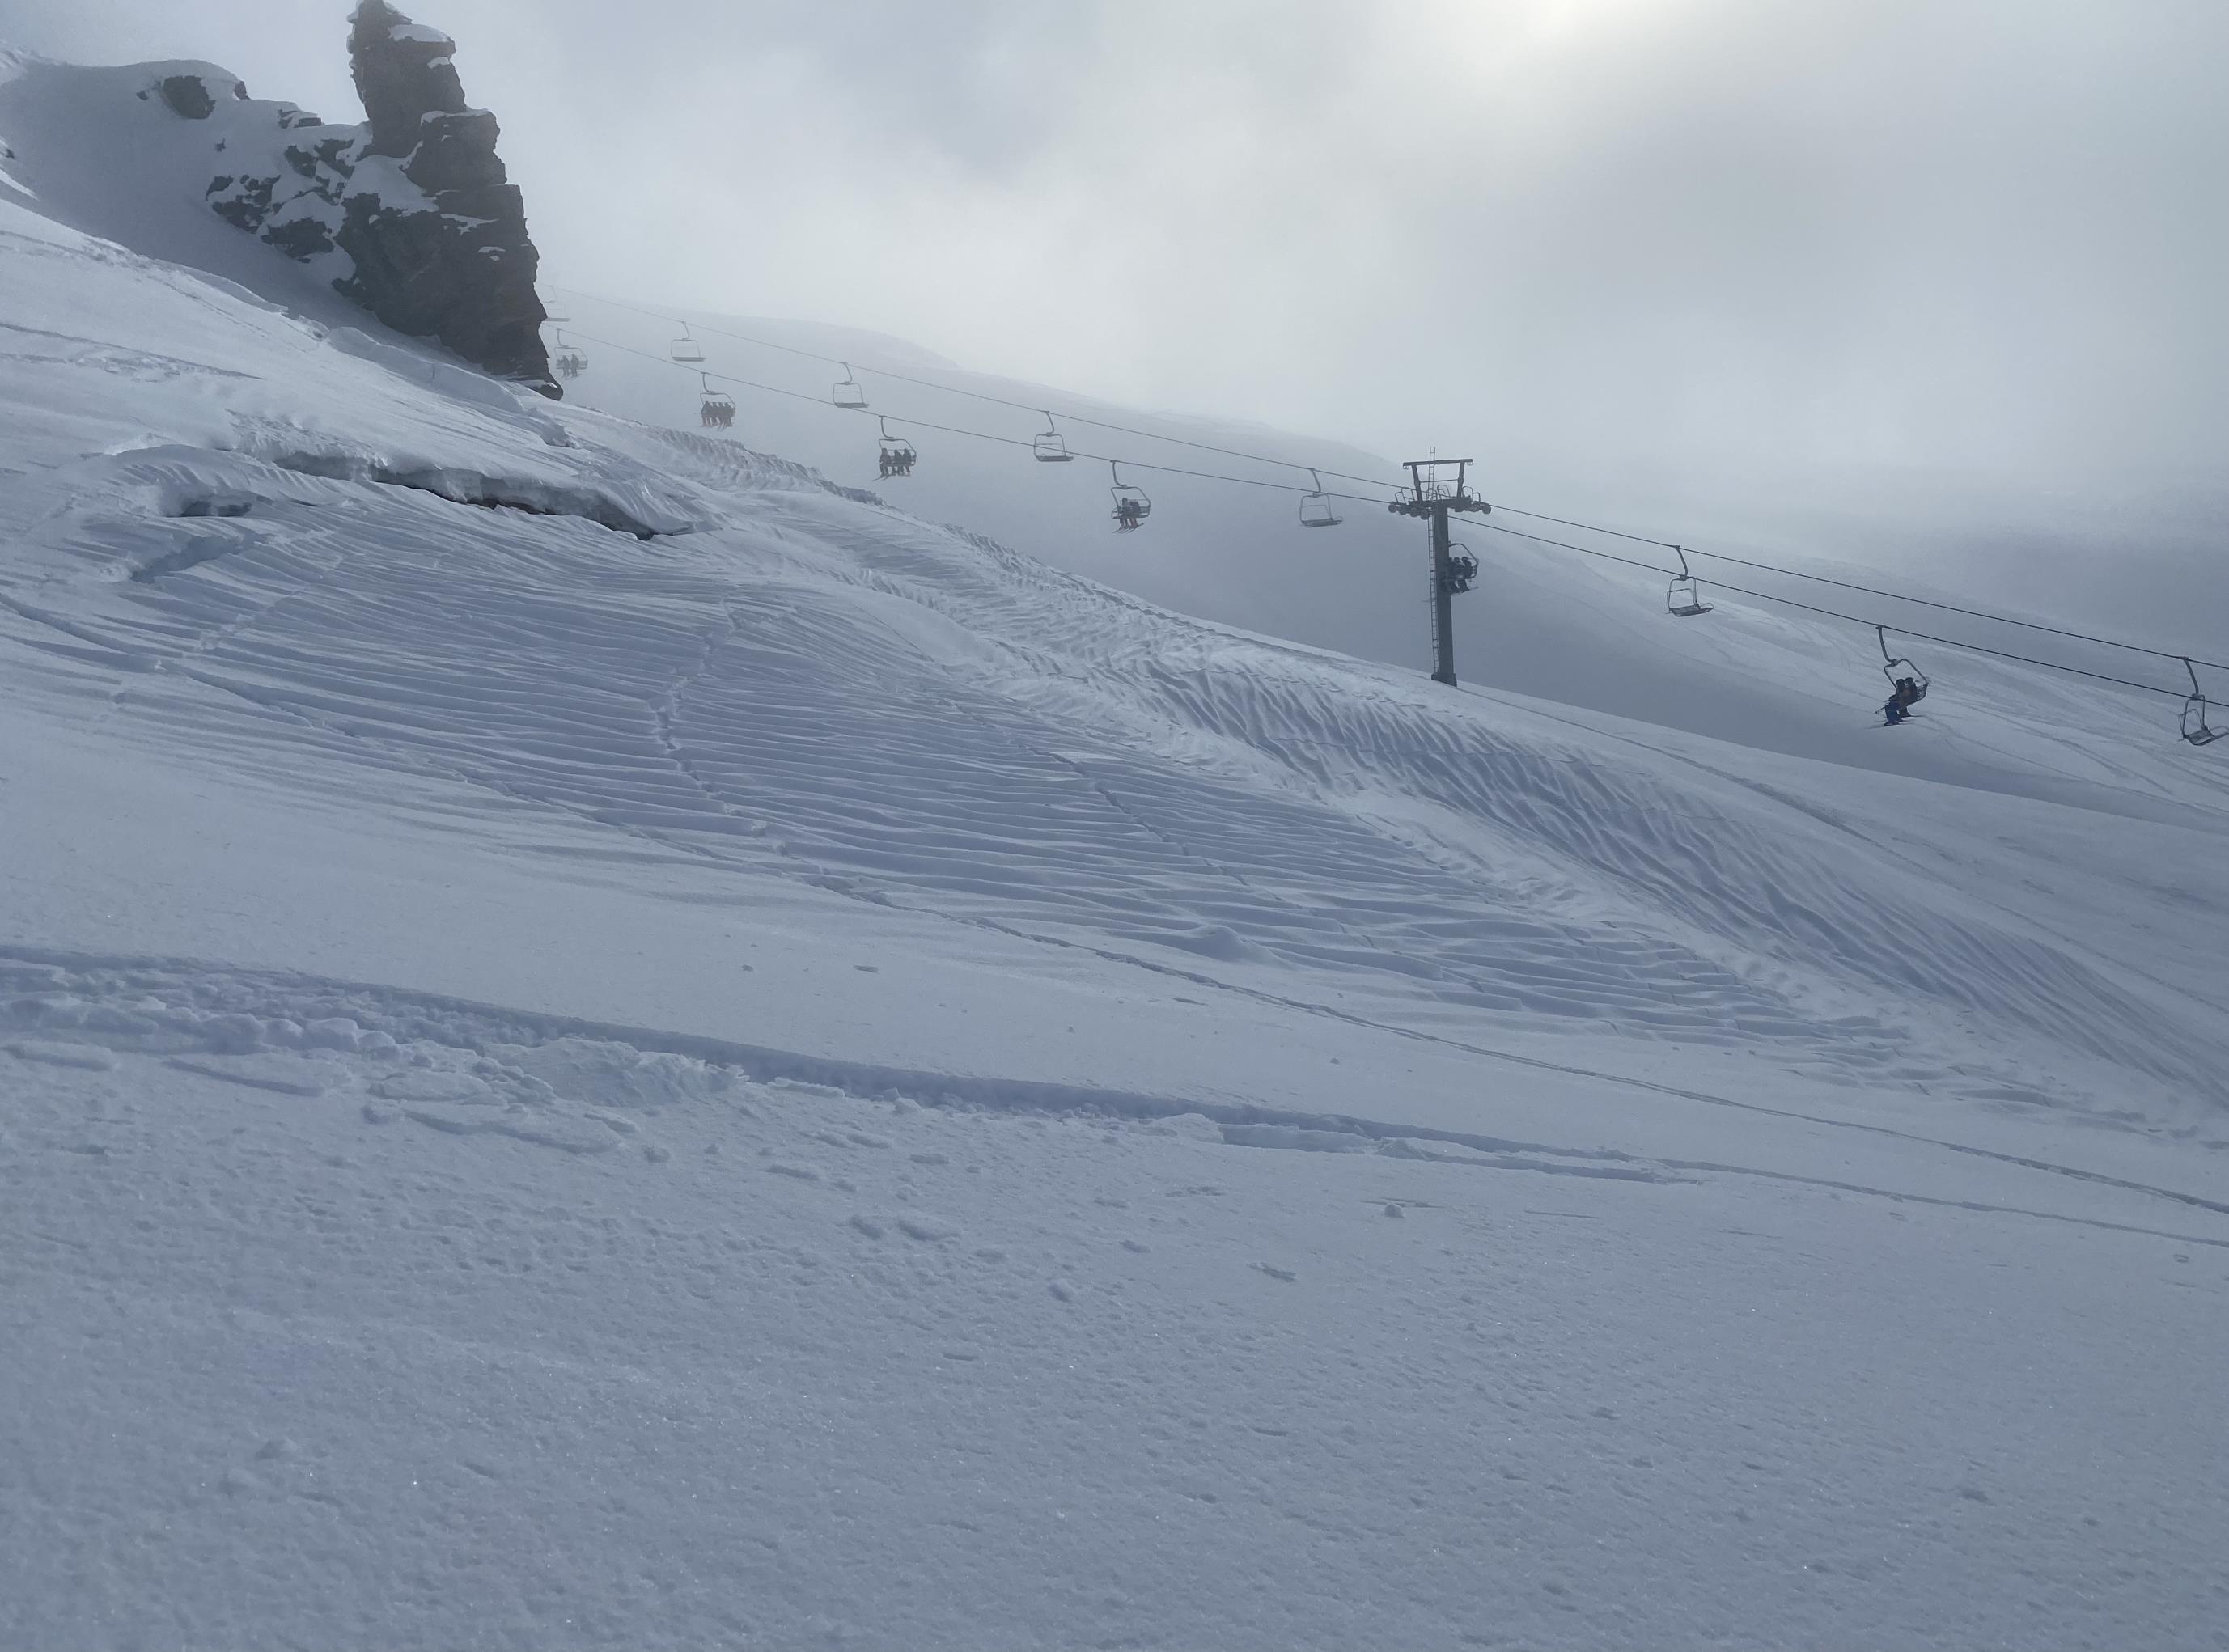
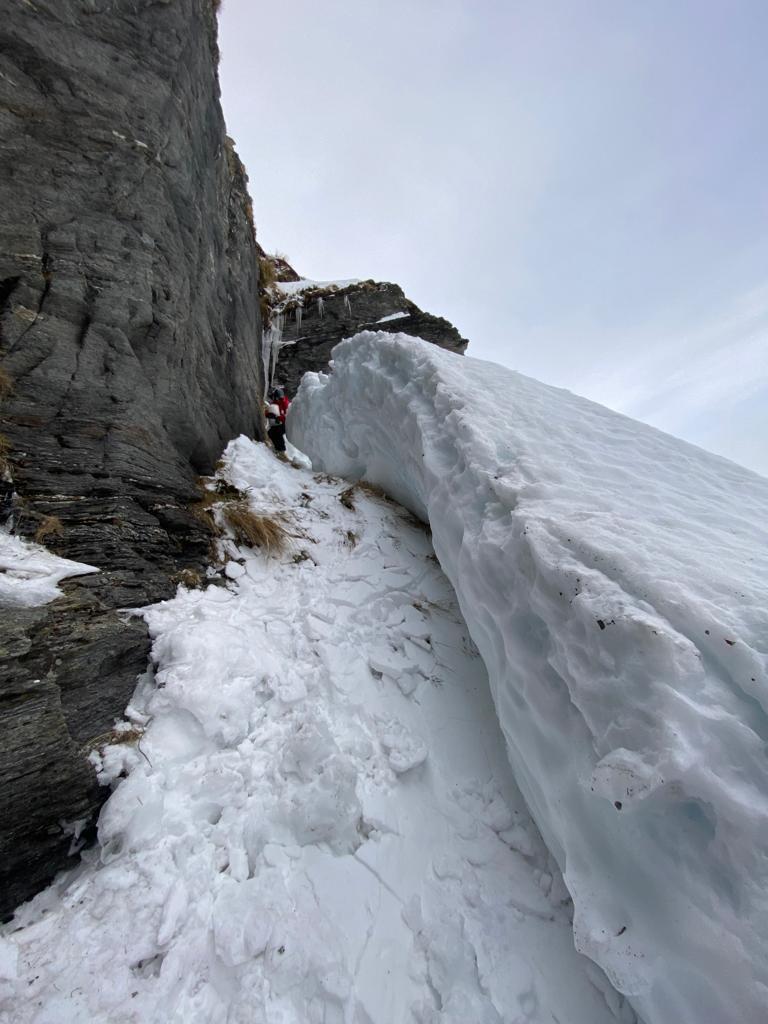
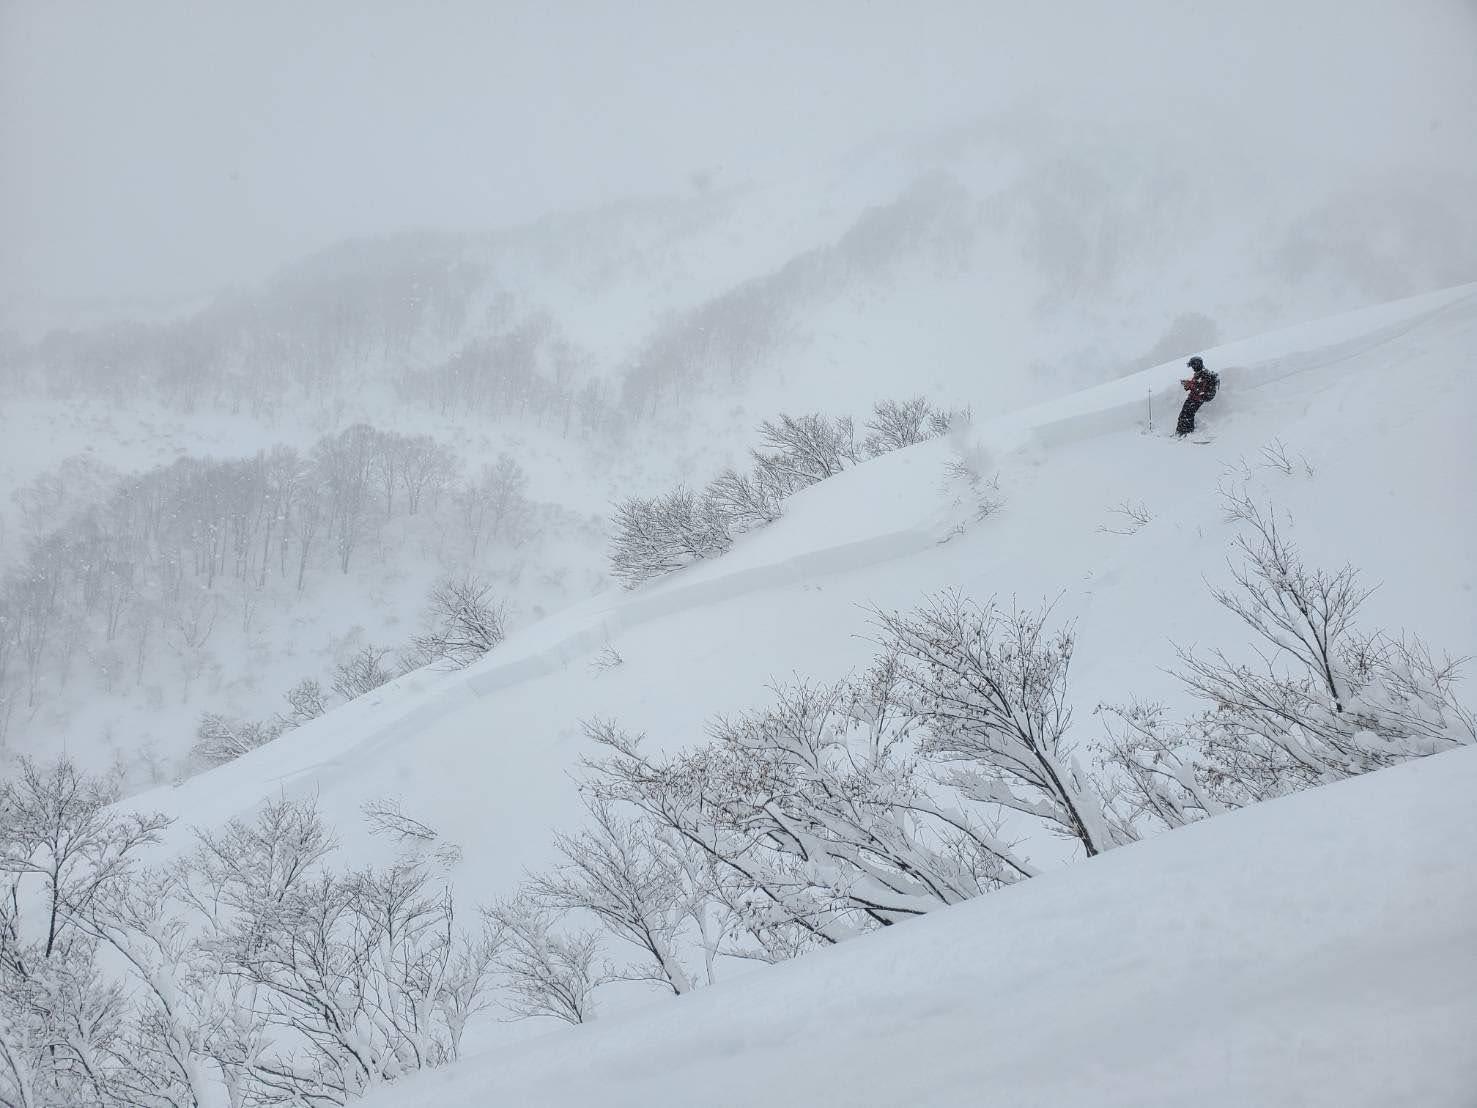
• Avalanche timing is extremely difficult to predict, but remember
• The 72 hrs after a storm event require cautious decision making around opening terrain
• New load in the start zone can be a contributing factor to glide avalanches
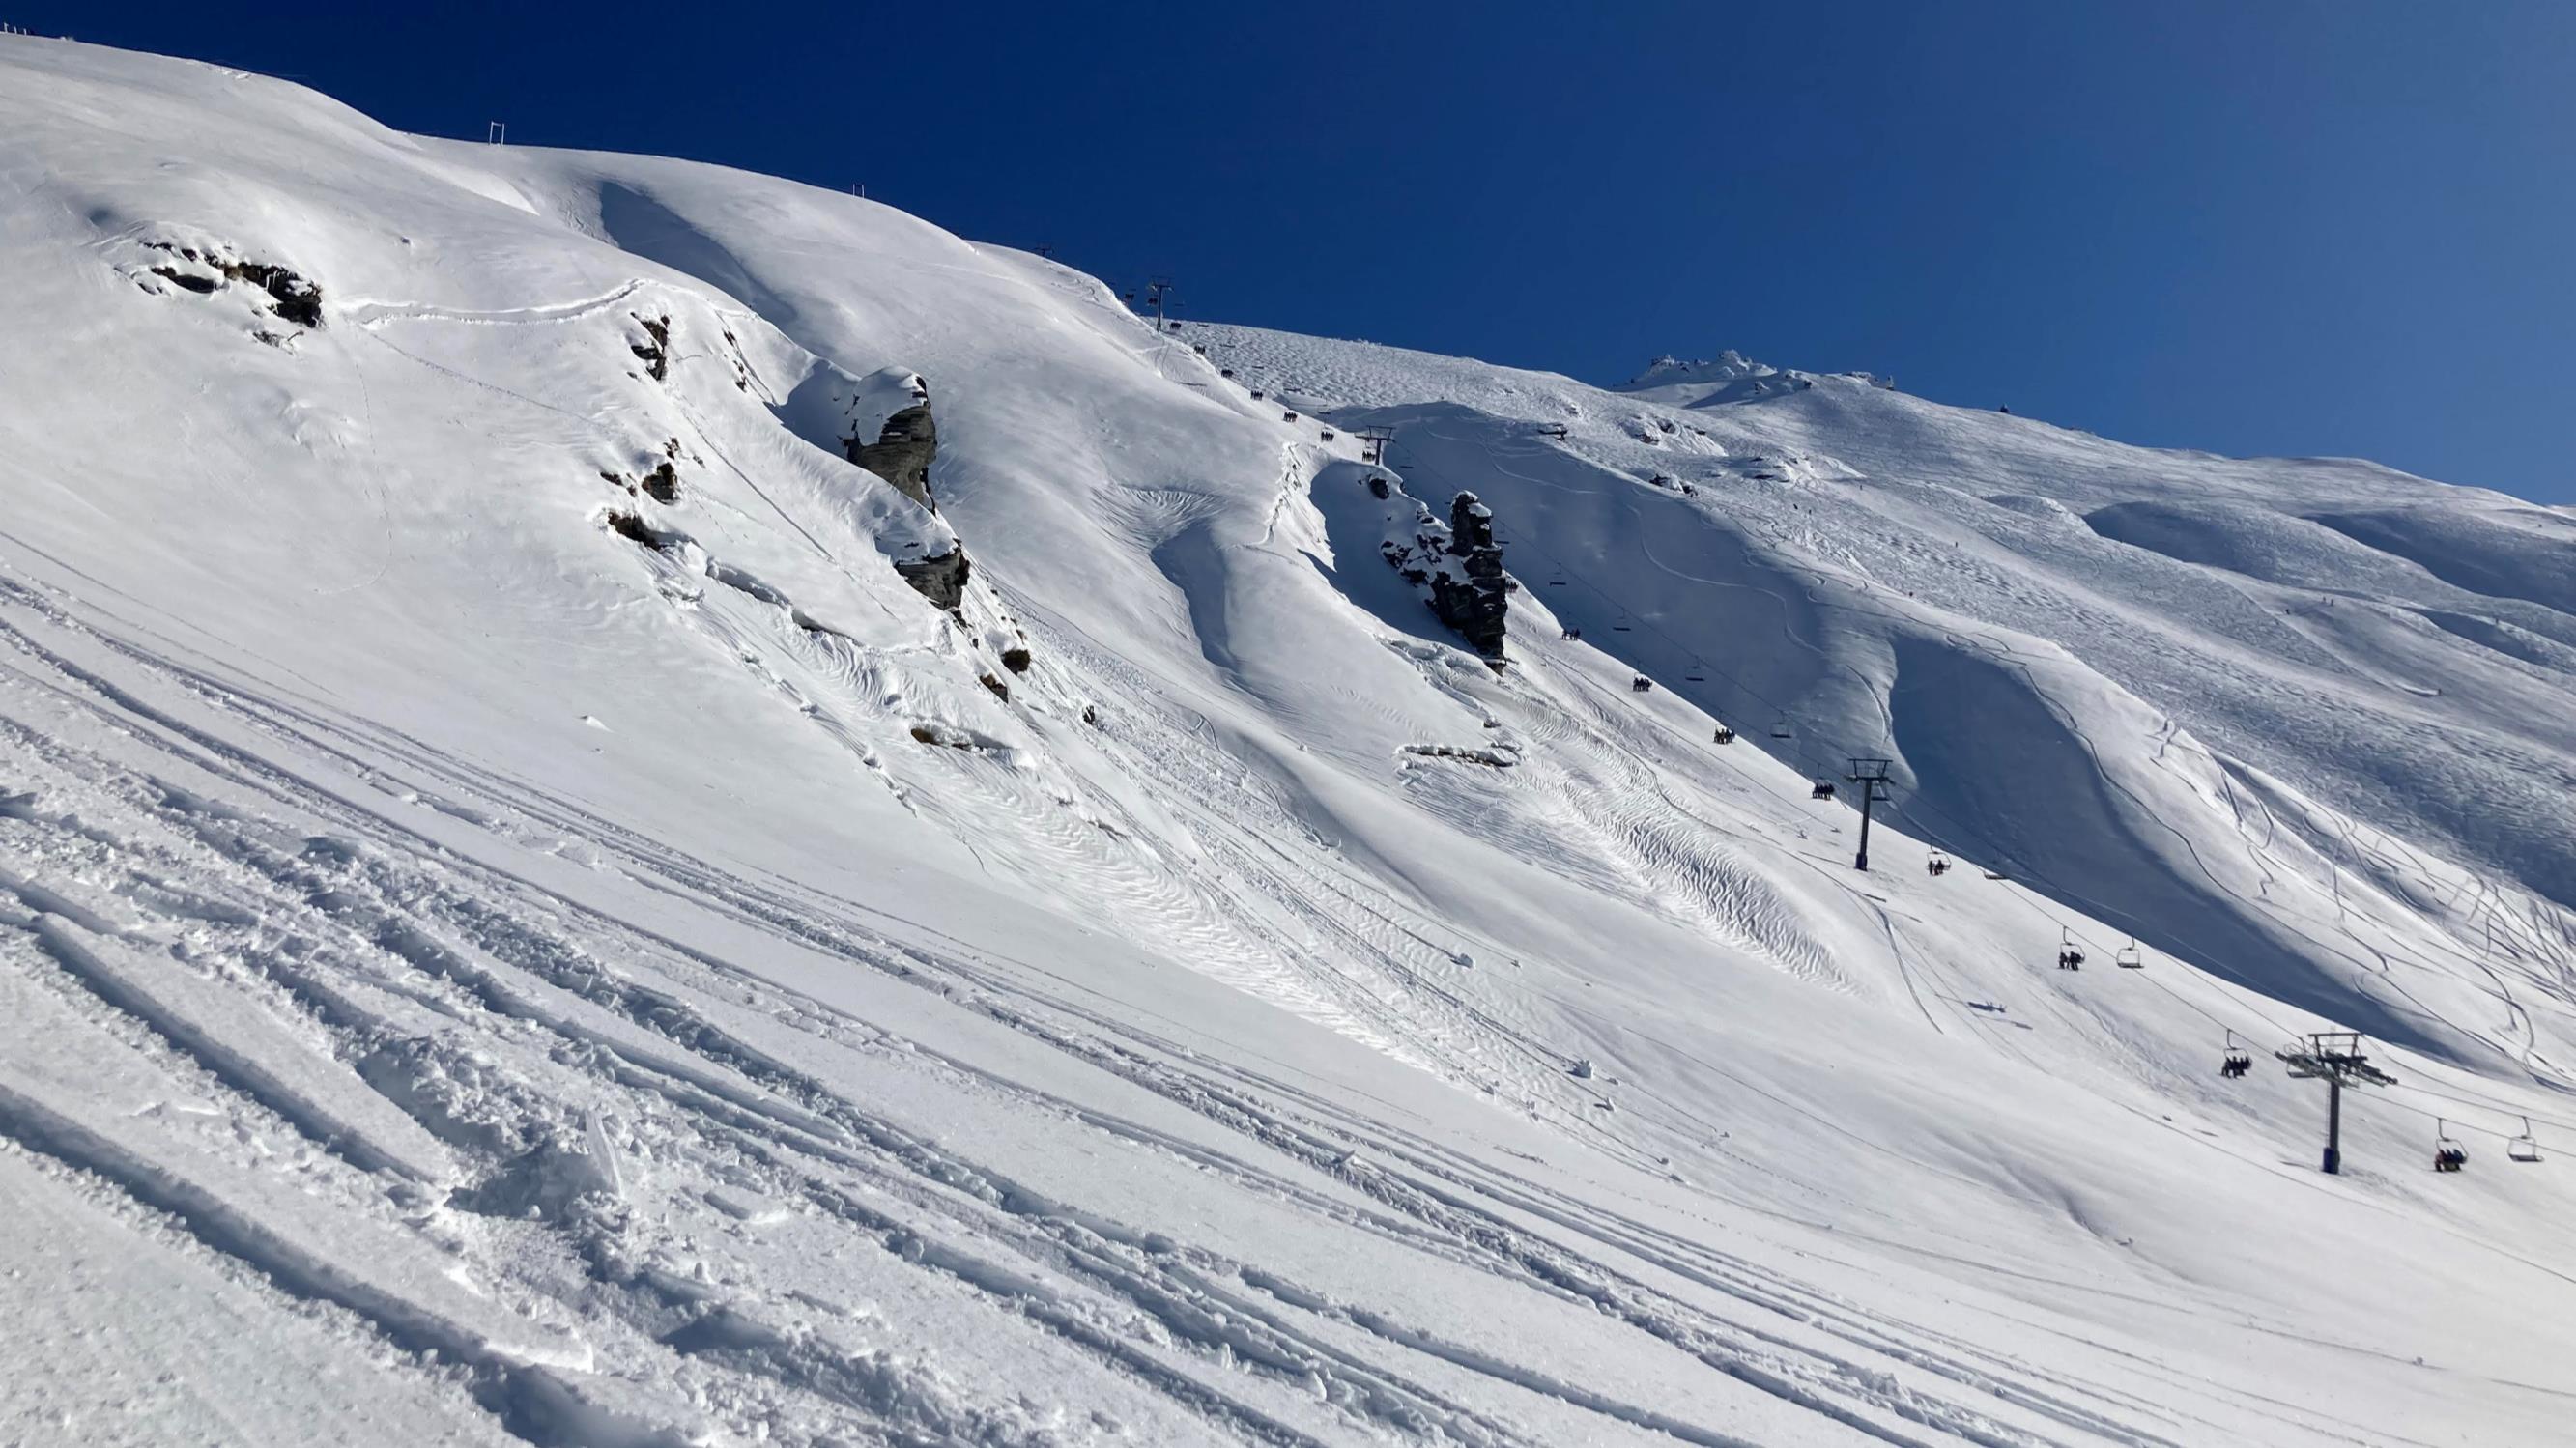
• Steep and unsupported start zones should be treated with extreme caution
• Shallow freezes should not be trusted
• "Cold" glide rates are generally slower and have less instances of avalanching
• Forecasting for a glide slab problem in an isothermal snowpack is generally easier than in a "winter" snowpack but still comes with its uncertainties
• Cool down avalanche theory is worth considering in relation to avalanche timing and mitigation
• Amelie Fees et all – Recent 2023 ISSW papers – Ongoing
• 2023-24 winter western European alps, another Glide season
Llewellyn Murdoch
• Niwa Reports 2nd warmest autumn on record.
• No chance for ground to freeze prior to snowpack development
• Record snow fall on June 9th. 175cm HST (at 1760M)
• Deep snow insulated the ground creating a widespread Glide problem on all aspects
Precipitation:
Precipitation: Rain Snow
17th – 28th June Glide
17-28 June
Precipitation:
Precipitation: Rain Snow
17th-23rd August
17- 23 August
Precipitation: Rain Snow
Number of Natural
22nd September- 1st October.
• The major influence on formation of a glide avalanche problem is lubrication of the ground cover, this does not only occur from melt and rain on the surface.
• The Origin of Free water at ground changes the character of the avalanche problem
• Avalanche timing is extremely difficult to predict, but remember
• The 72hrs after a storm event require cautious decision making around re opening terrain
• New load in the start zone can be a contributing factor to glide avalanches
• Steep and unsupported start zones should be treated with extream caution
• Shallow freezes should not be trusted
• "Cold" glide rates are generally slower and have less instances of avalanching
• Forecasting for a glide problem in an isothermal snowpack is generally eaiser than in a "winter" snowpack but still comes with its uncertainties
• Cool down avalanche theory is worth considering in relation to avalanche timing and mitigation
• Amelie Fees et all – Recent 2023 ISSW papers – Ongoing
• 2023-24 winter western European alps, another Glide season
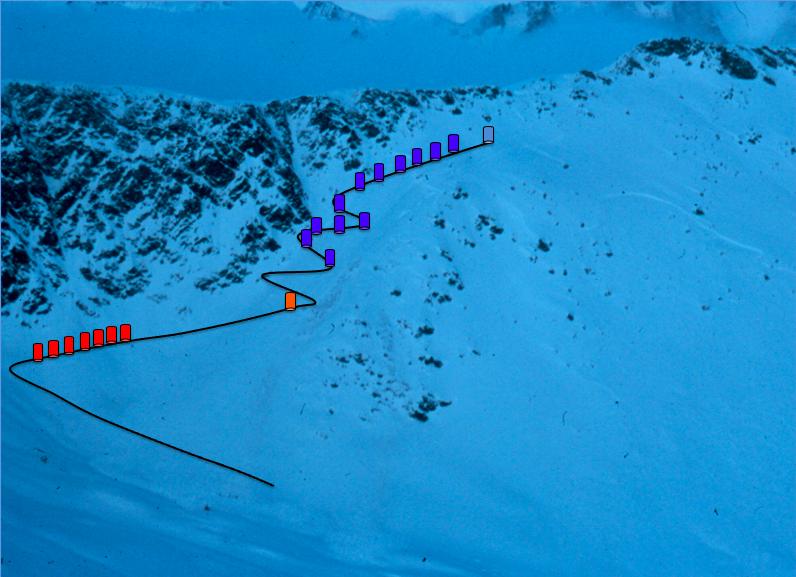
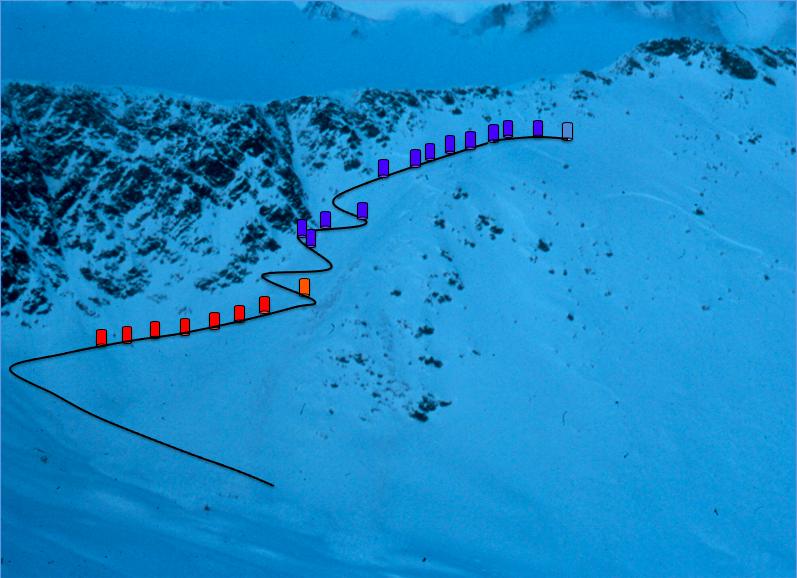
Learnings from a multi agency avalanche response and advising the public in a persistent slab cycle.
Will Rowntree
Intro
Summary of snowpack and weather history prior to event.
Forecasters and regional operators consensus on conditions.
Forecast on day
Avalanche Type, Size and Info.
Timeline and summary of event and response.
Big Picture take home points for other agencies and operators.
Personal learnings from forecasting on the day and providing advice and guidance to recreationists as a professional.
Questions?
• Early Season snowfall in May followed by extended cold and clear periods in June.
• The initial winter snowpack was thin and a myriad of FC/CR combinations.
• Late June through July saw consistent snow fall in small amounts with some notable Surface Hoar development in sheltered and shady areas.
• By mid to late July (in the S ½) we had a complex lower ½ of the snowpack, well formed FC and preserved SHsu was capped by a series consolidated slabs in the upper pack in the southern 1/2.
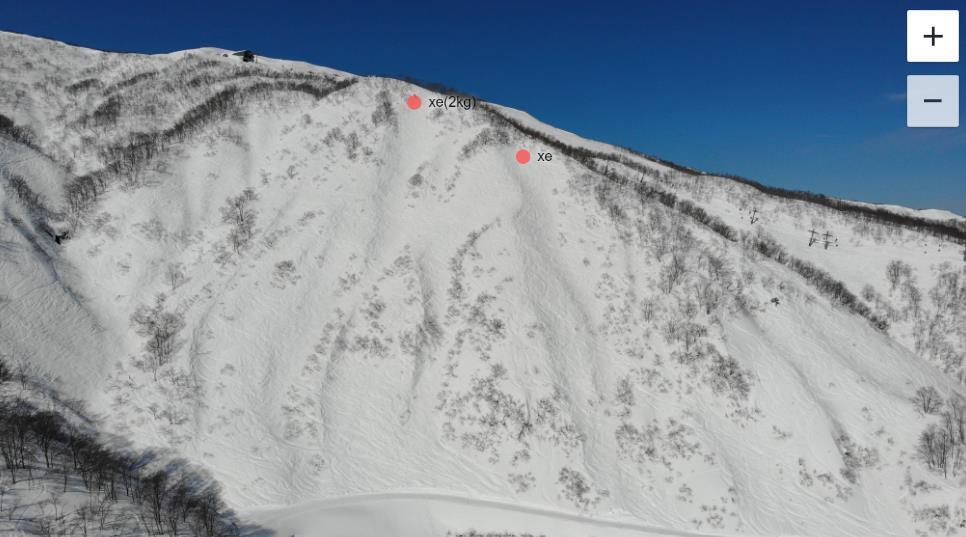
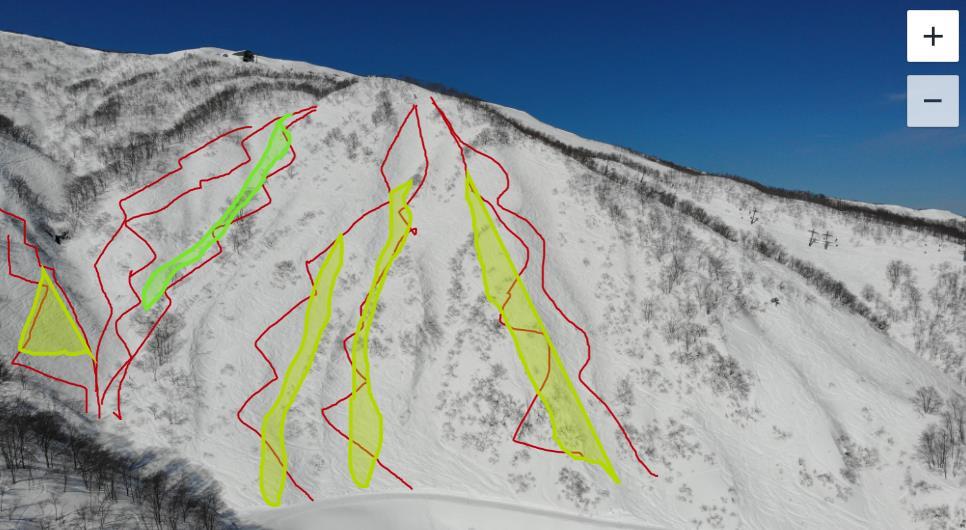
• Considerable snowfall in first week of August with multiple Sz 1-2 Sa and Xe triggered avalanches in the region on the 4th in the western part of the region. Swd only were obs in The Remarks.
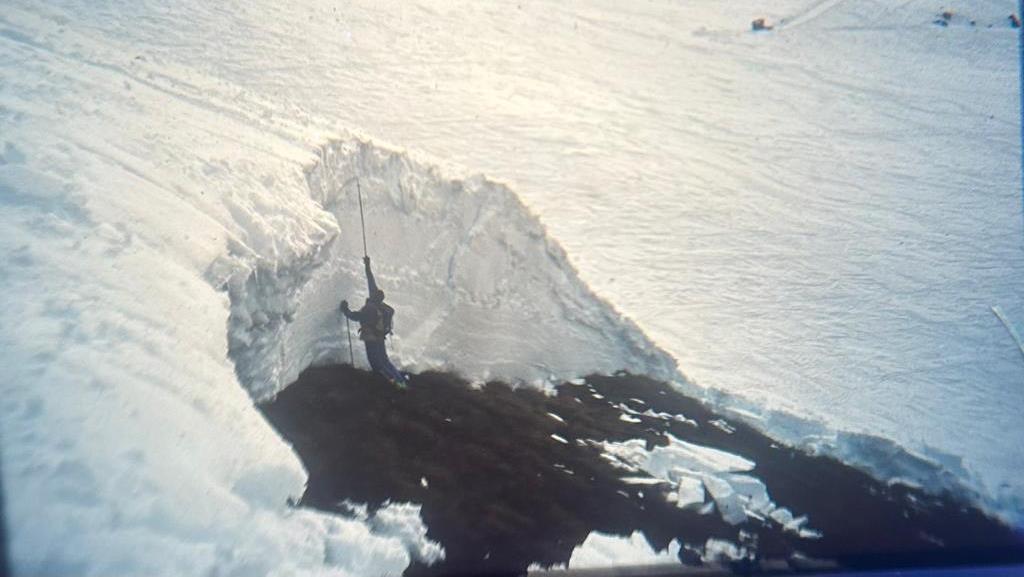
May 21st 2023
Sa Sz 2.5 S asp 1950m 5 July 2023
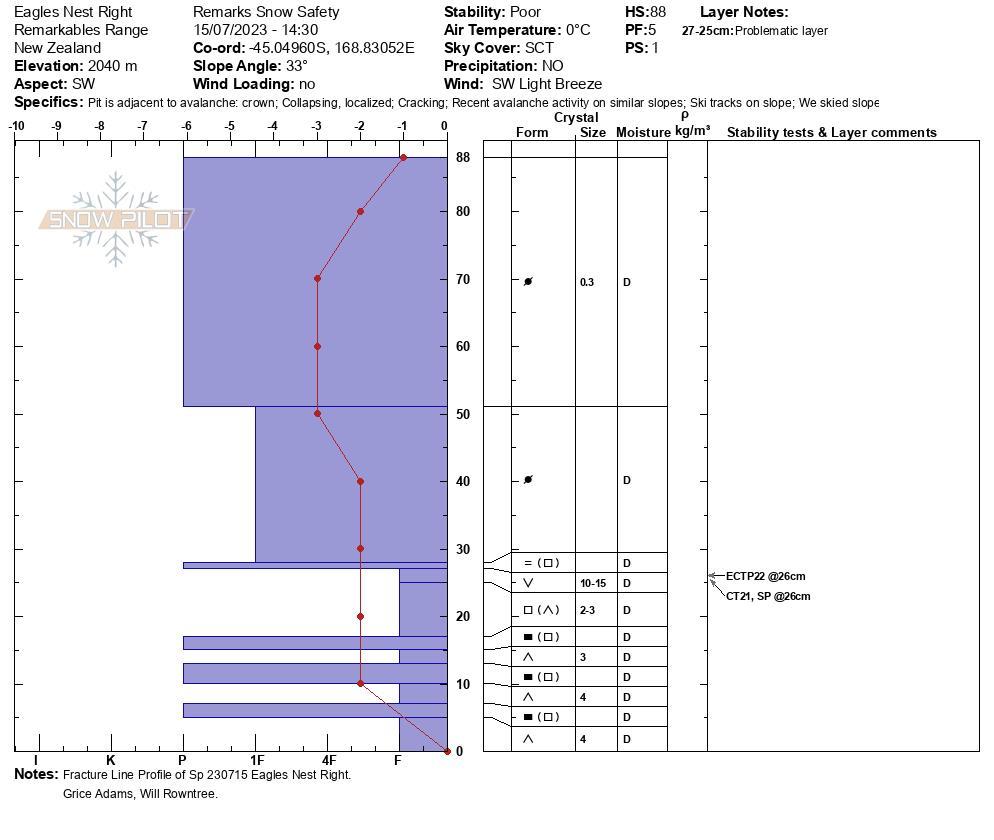
15 July 2023
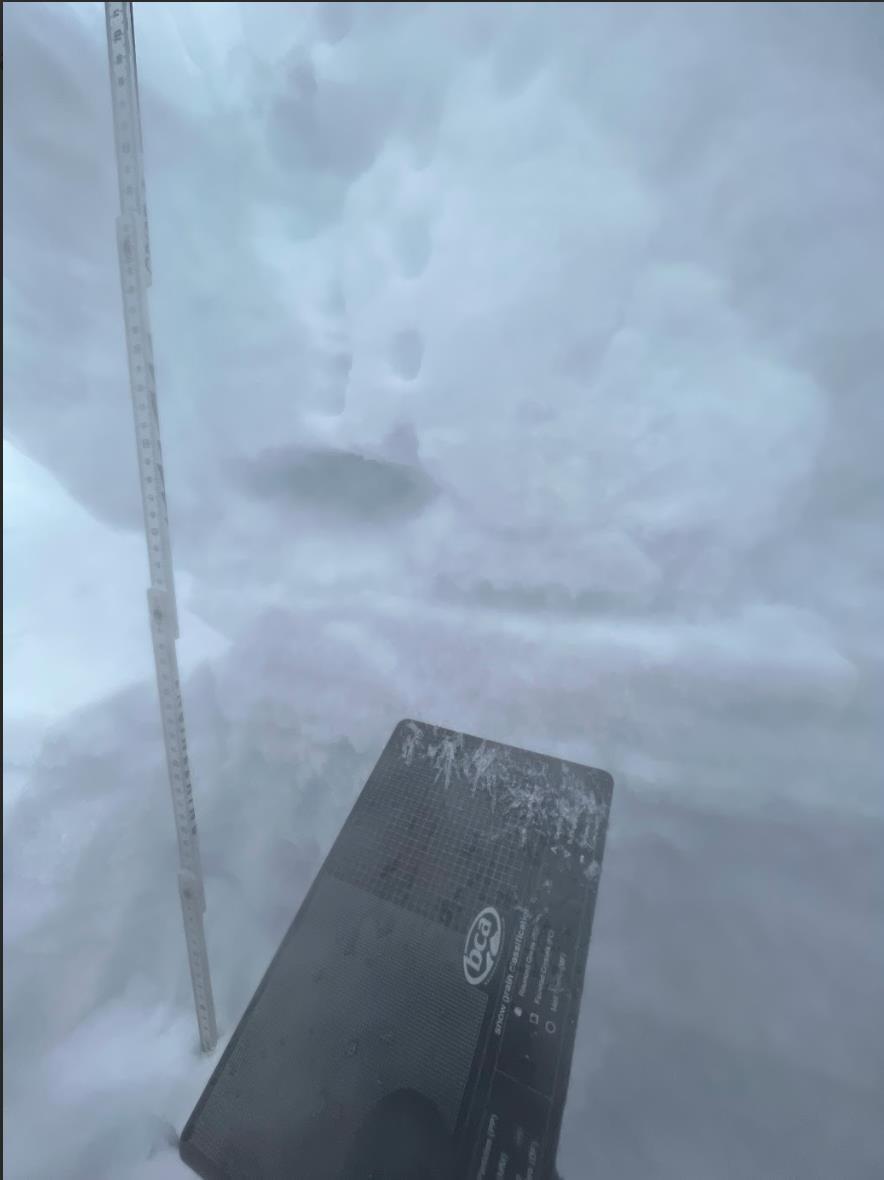
ECTP22 Down 58cm SHsu 10mm
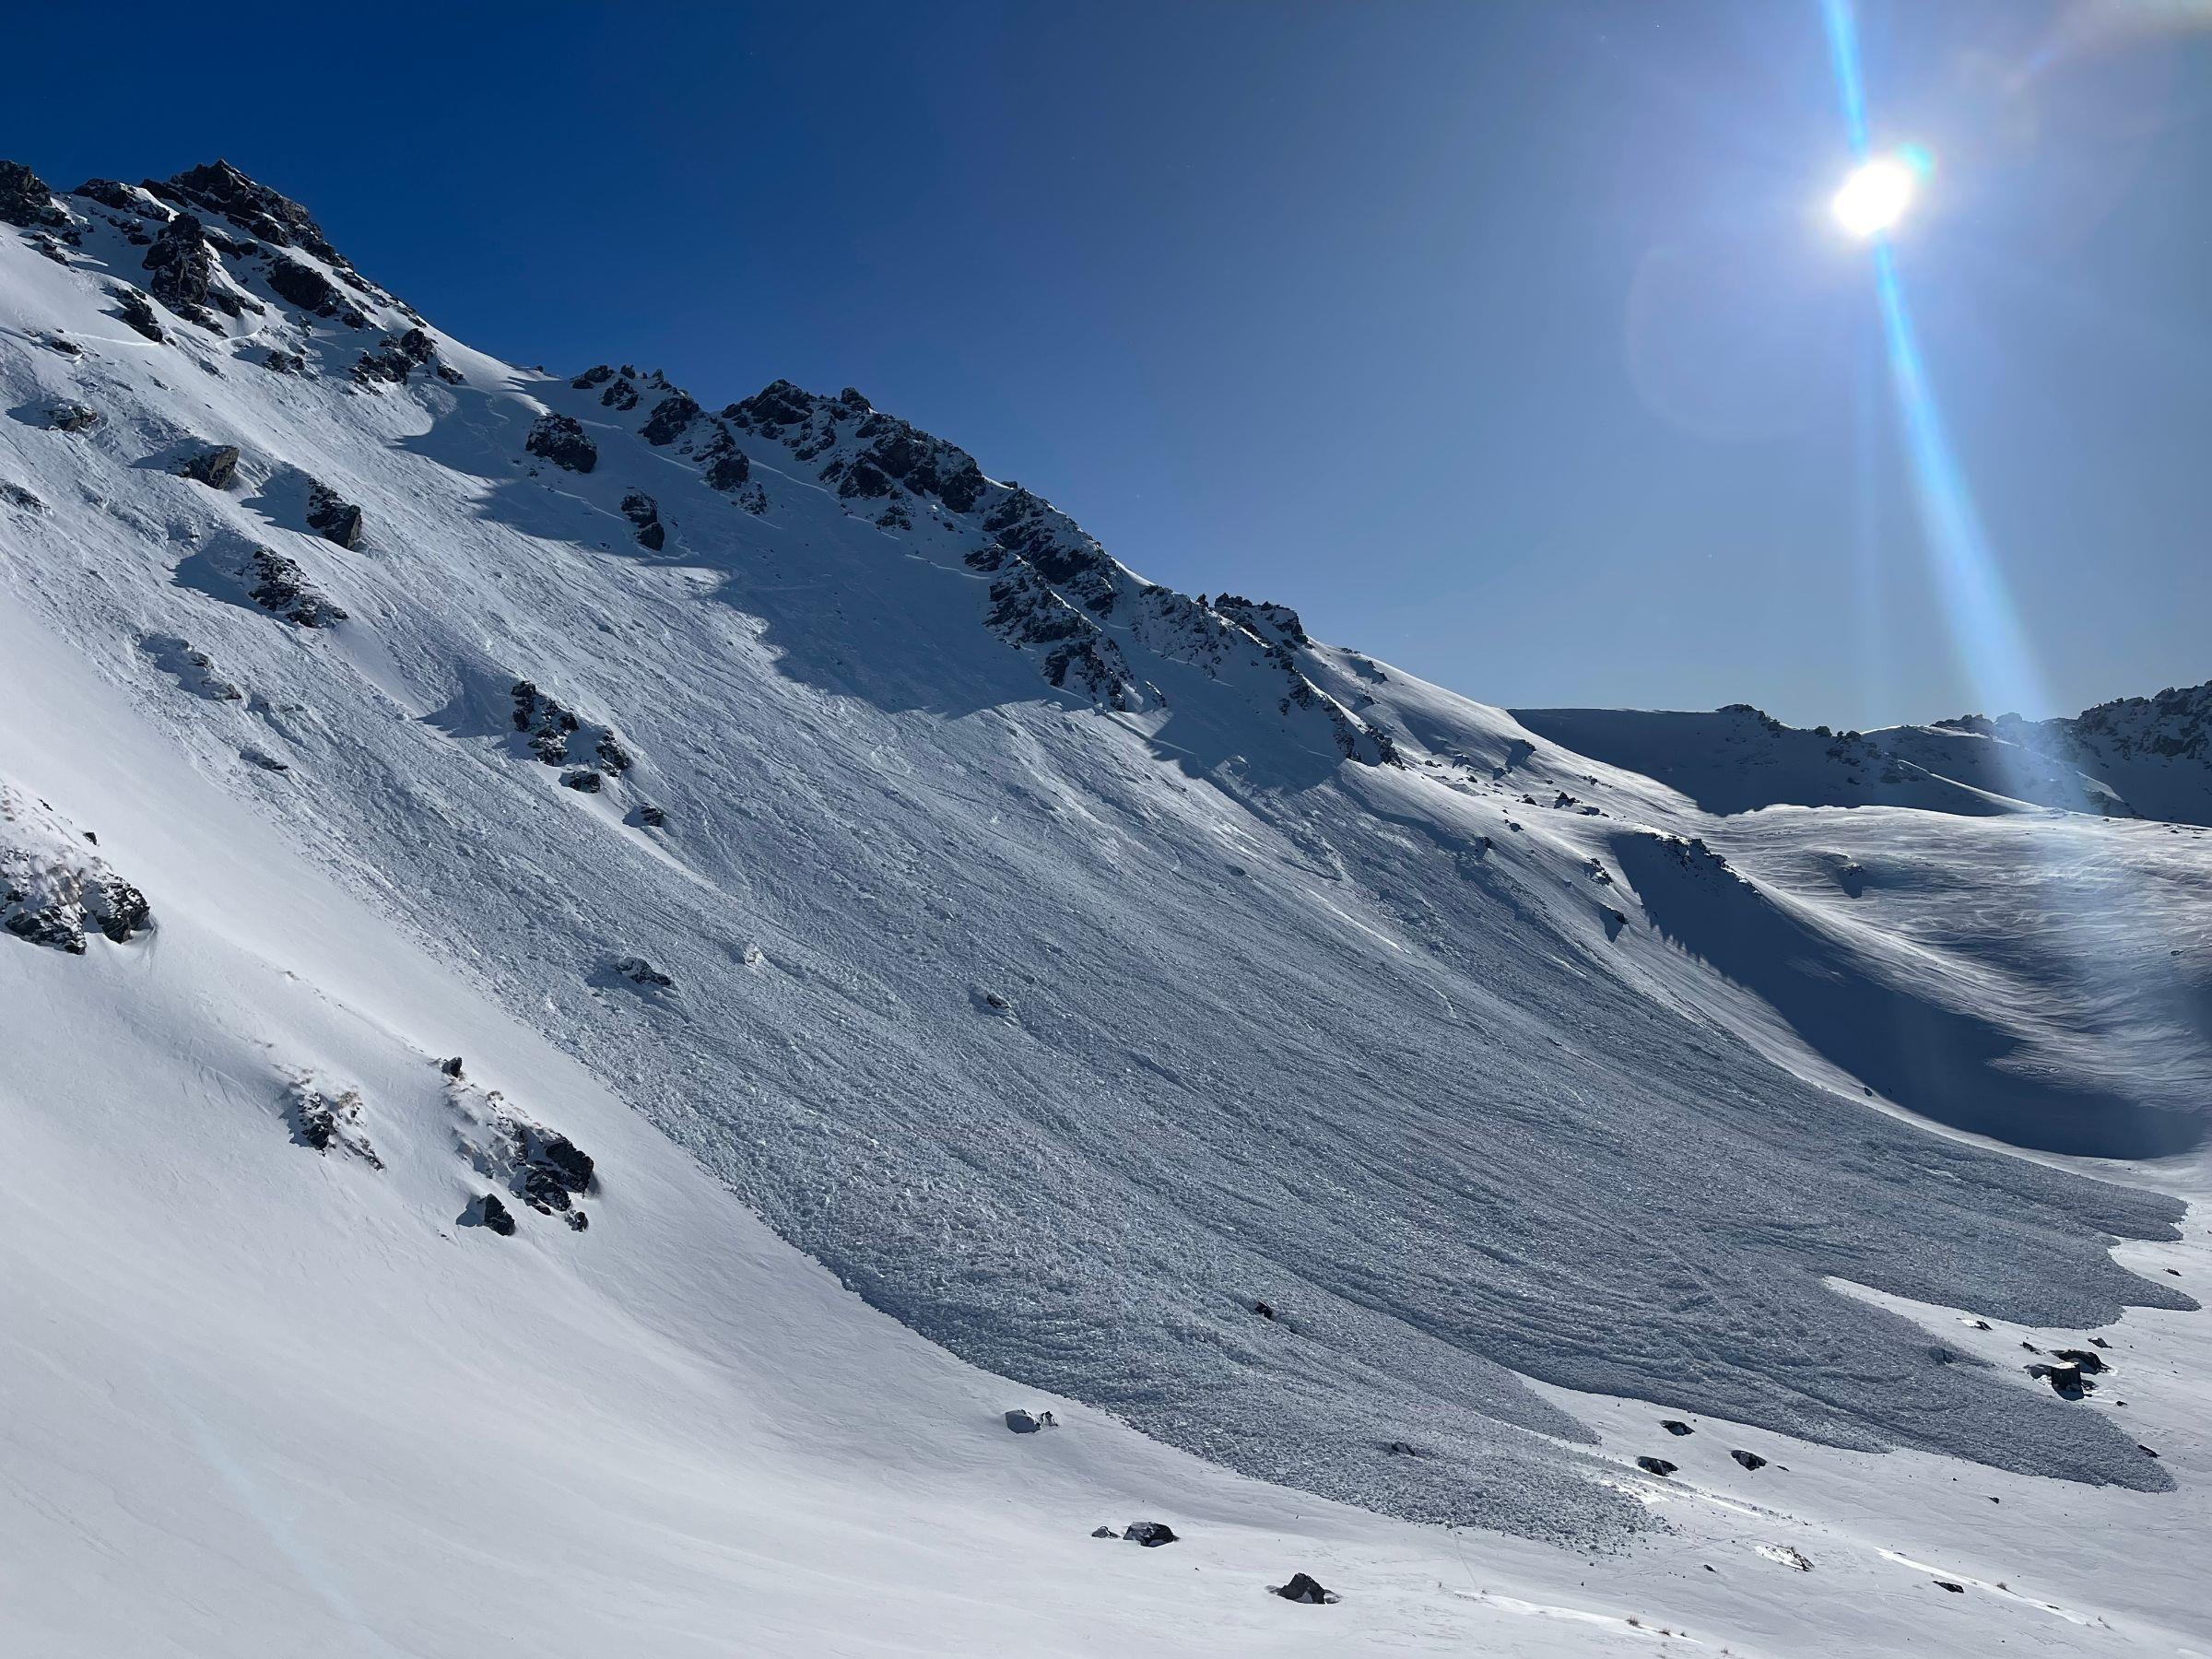
Crown wall investigation on Xe triggered Sz 2 Sp. SW asp 2040m
Forecast on the day
Key Message
"This storm has been great for coverage but has added significant weight and stress to the Persistent Weak Layers in the snowpack, particularly in the western parts of the region. Skier triggered avalanches are possible today, picking simple terrain is recommended. The heat yesterday has reduced the chance of wind slabs on N and E slopes but it may be possible to find on shady slopes also. Avoid areas of obvious loading."
Avalanche Problem 1 Windslab ~<Sz 2 Lee to SW in mid and high alpine. Stubborn/Specific. Possible. Decreasing reactivity.
Avalanche Problem 2 Persistent Slab ~<Sz 3 SW – SE asp in mid and high alpine. Stubborn/Specific. Possible. No change to reactivity trend.
Forecast on the day/Avalanche Problem 2 Sp.
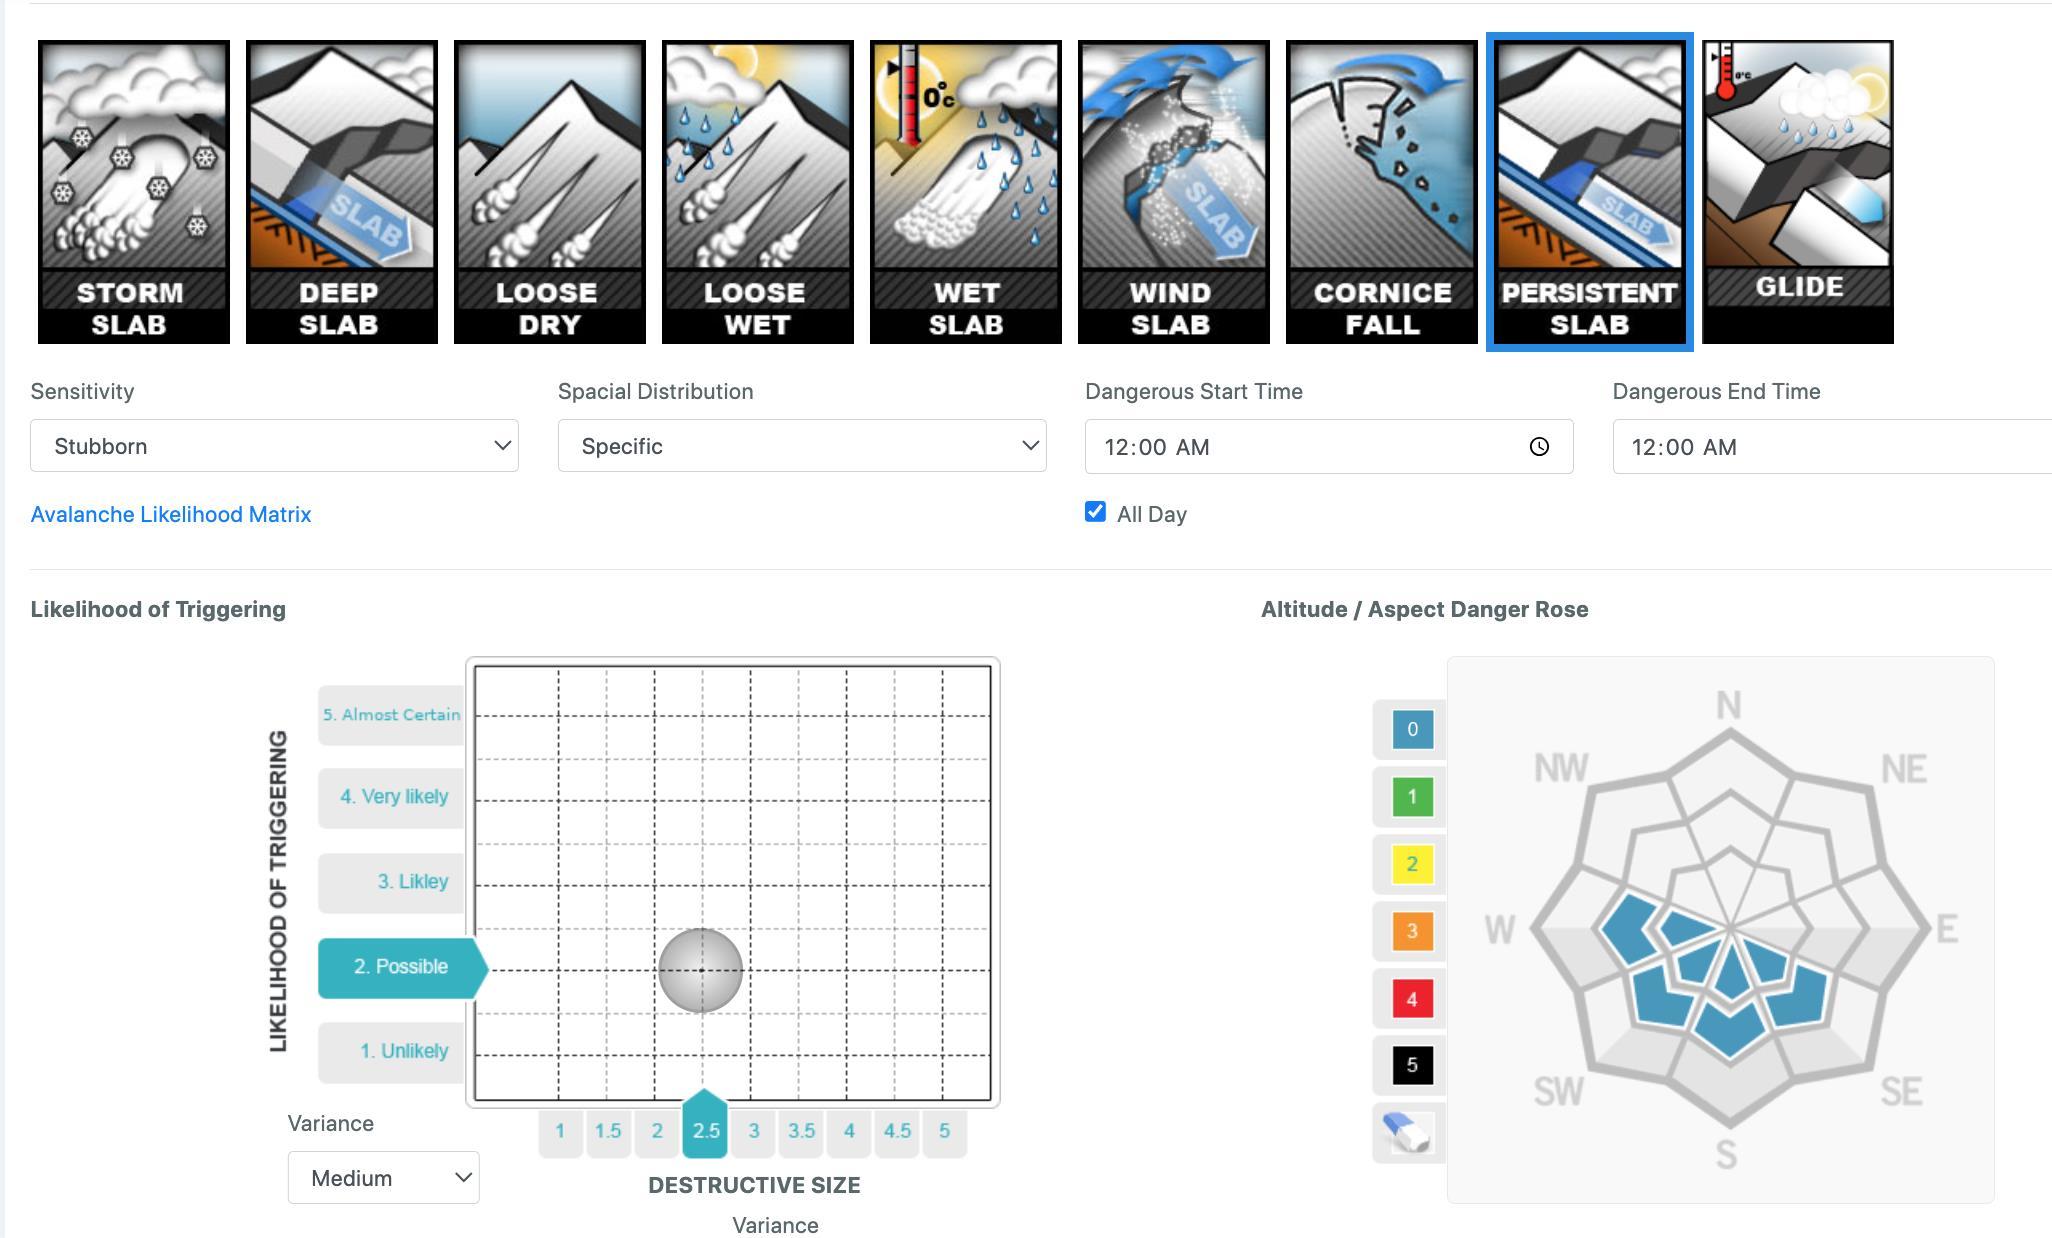
"The new snow has added more weight and stress to the buried weak layers in the snowpack. If skiing shady slopes in the middle and upper elevation bands then choose low angle slopes with clean and safe run outs.
Practice safe travel technique and ski one at a time."
We were of the mindset that the persistent problem was focused in the western part of the Queenstown region with Swd being the primary concern in the Eastern (Remarkables) zones. Although the persistent structure existed in The Remarkables we expected that the upper pack including a thick K rime crust was shielding this. Except for isolated thin areas....
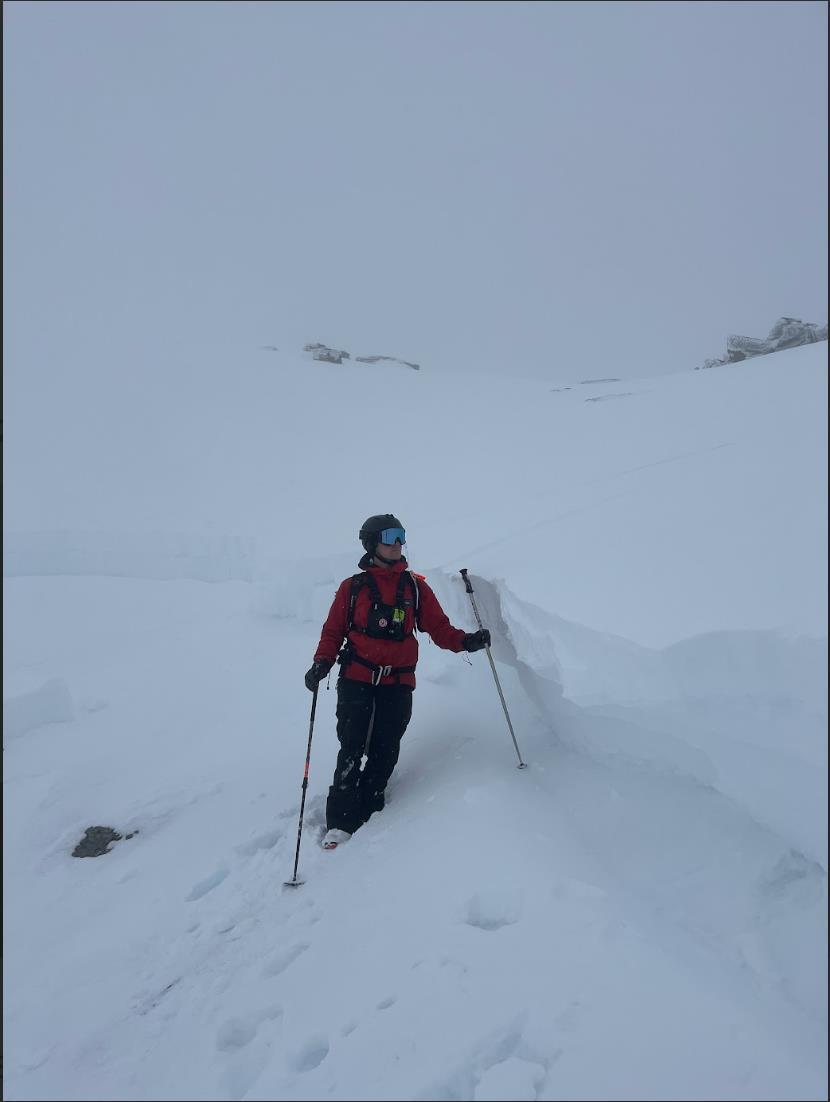
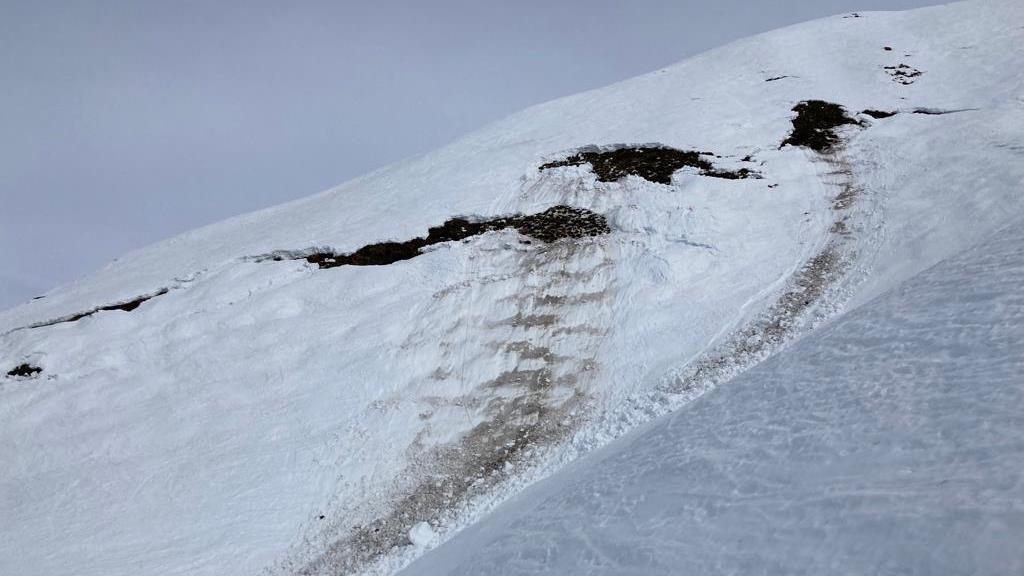
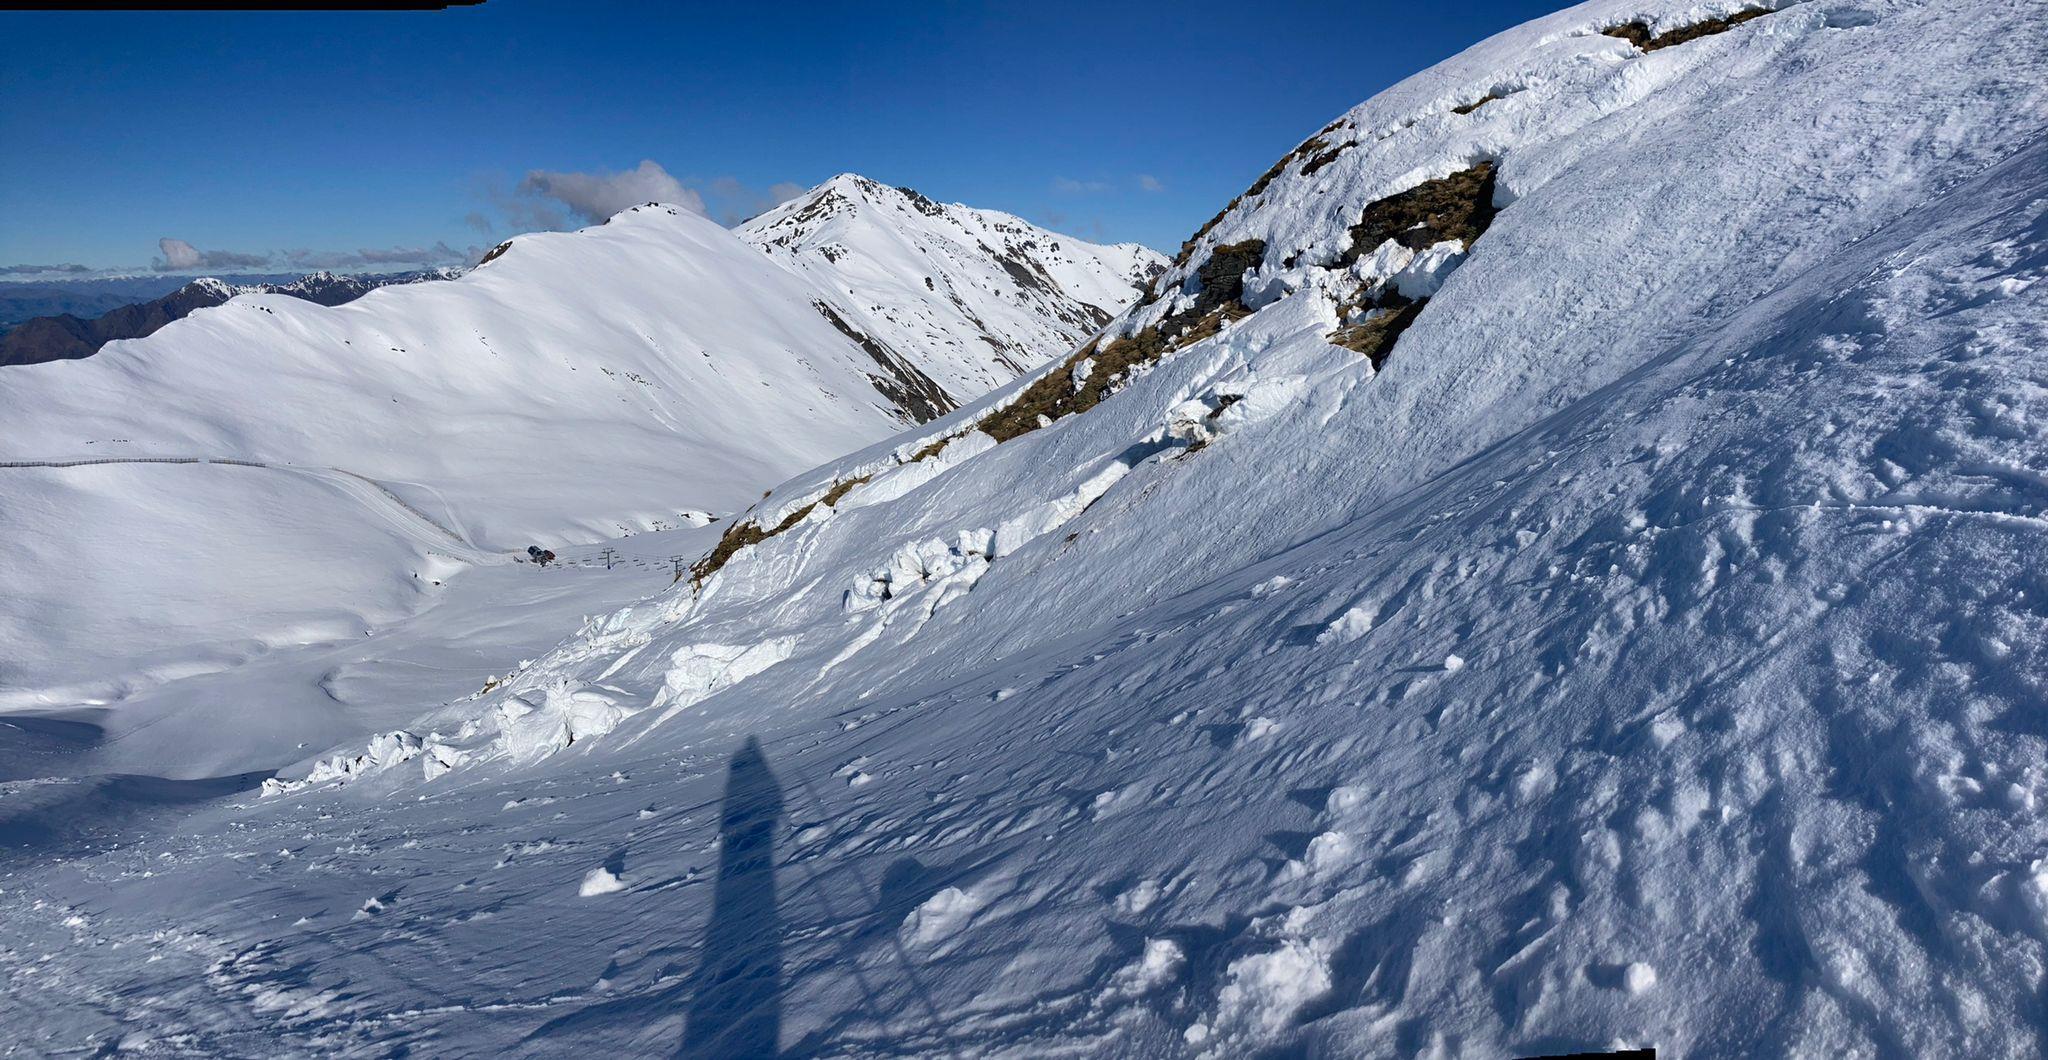
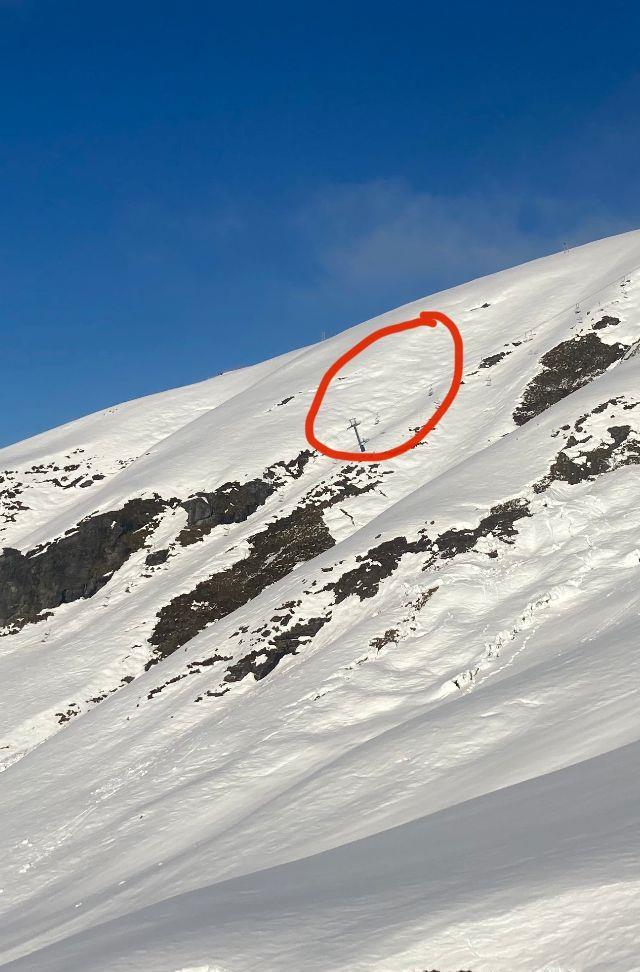
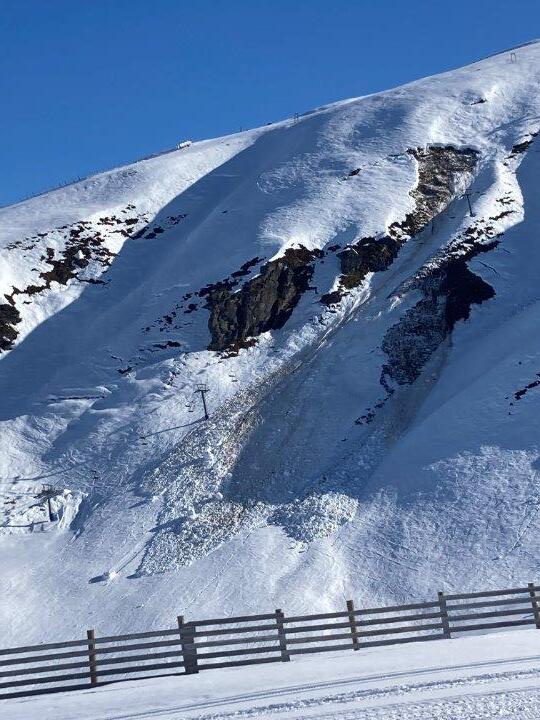
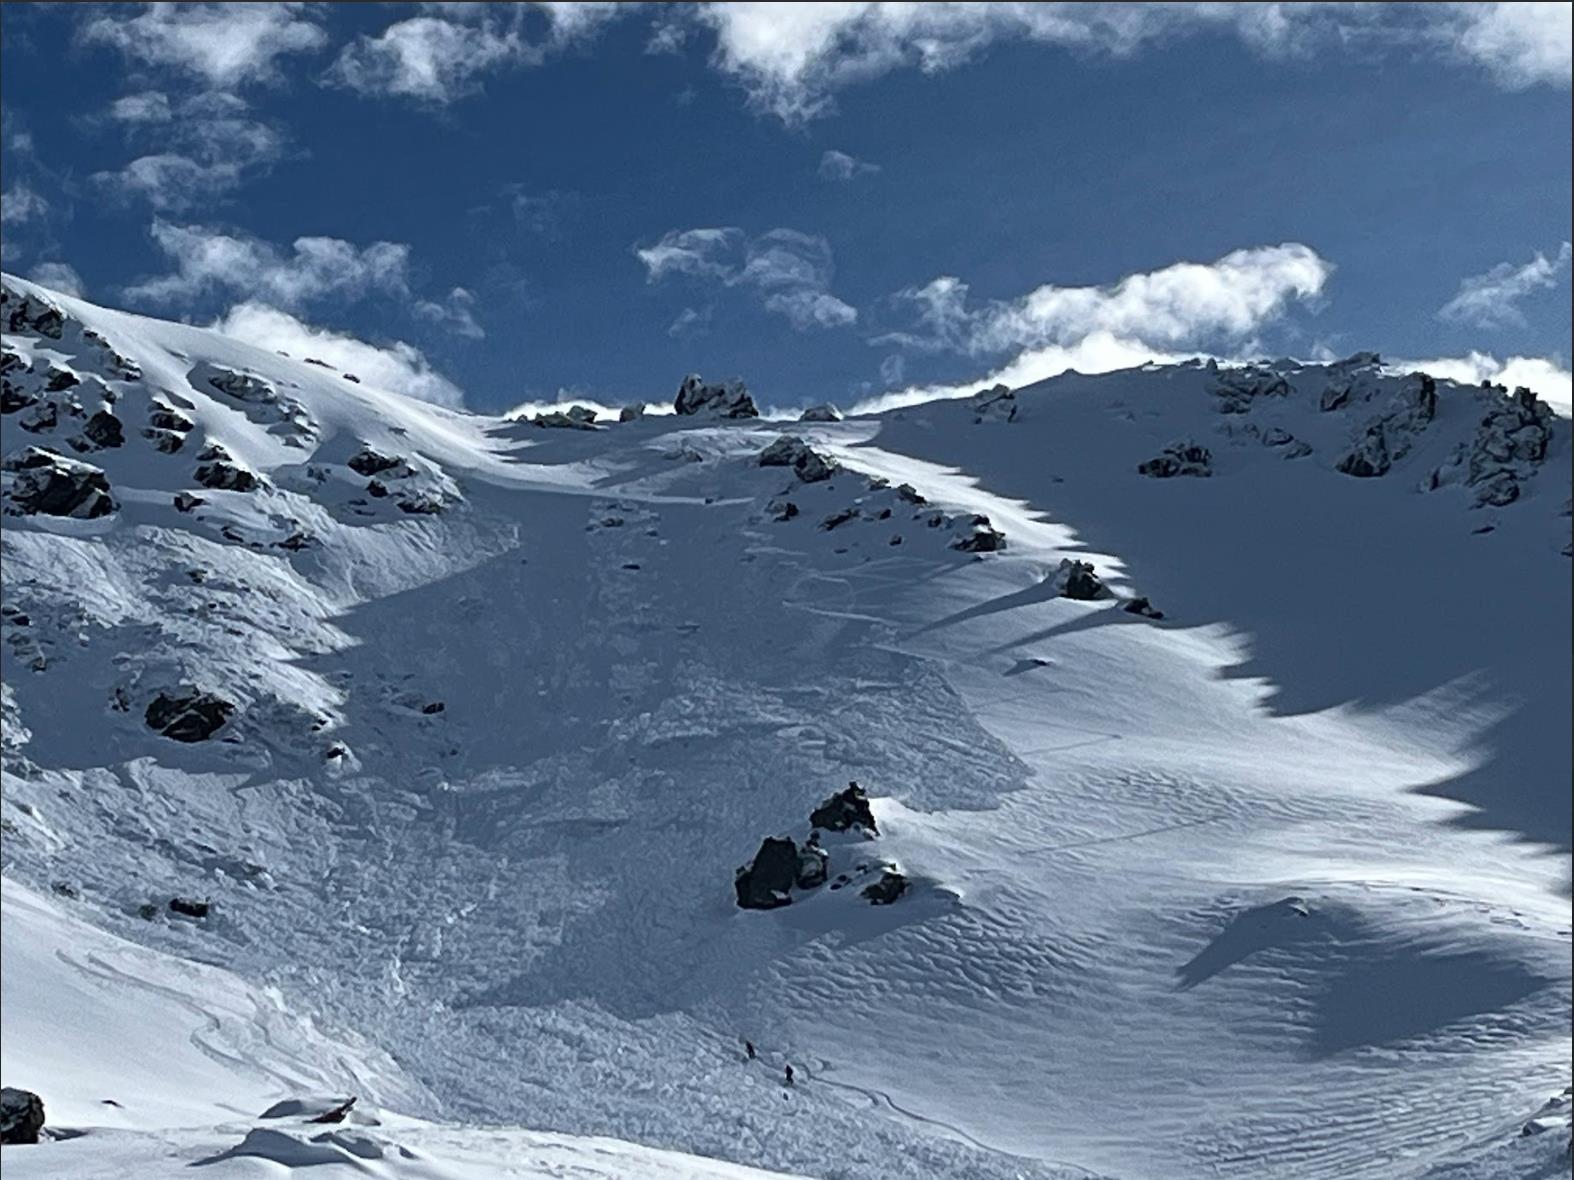
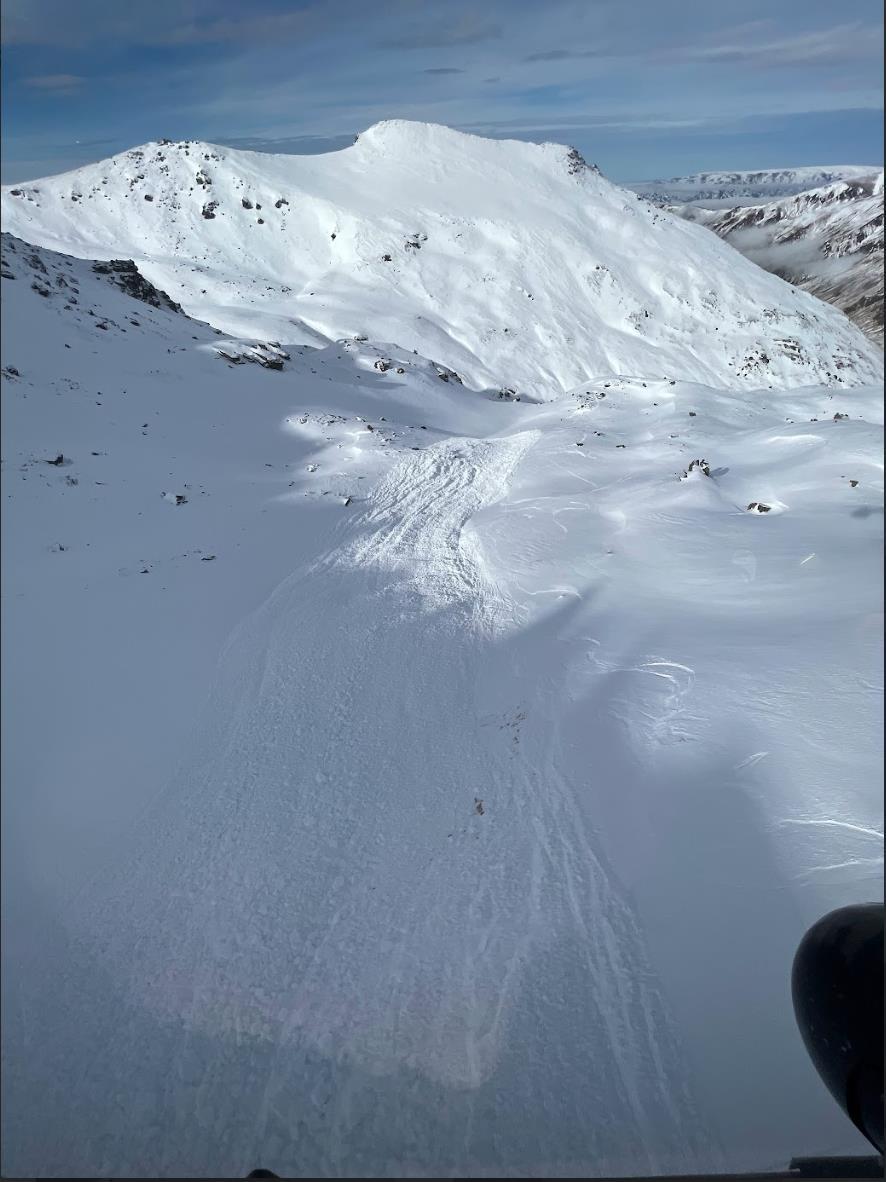
6 August
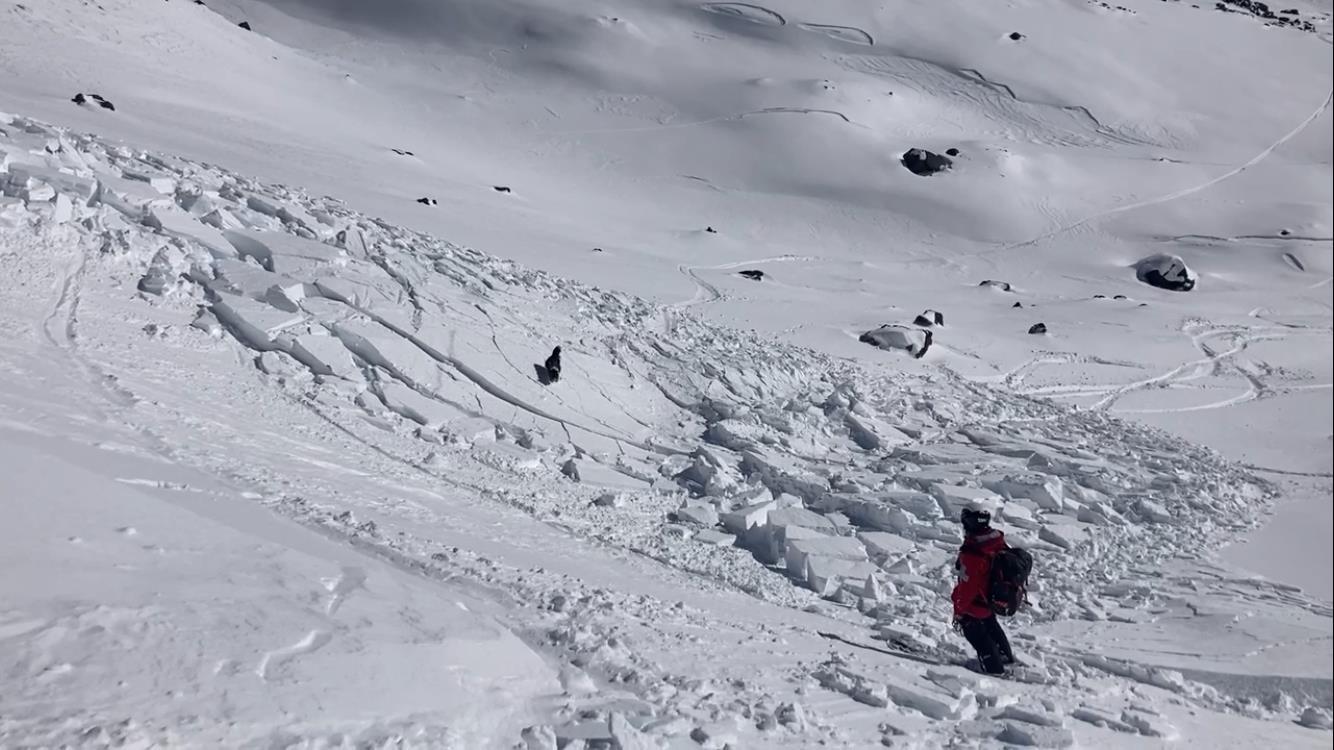
5 Aug 2023. Sa Size 3.5
Persistent Slab. SE asp 1900m.
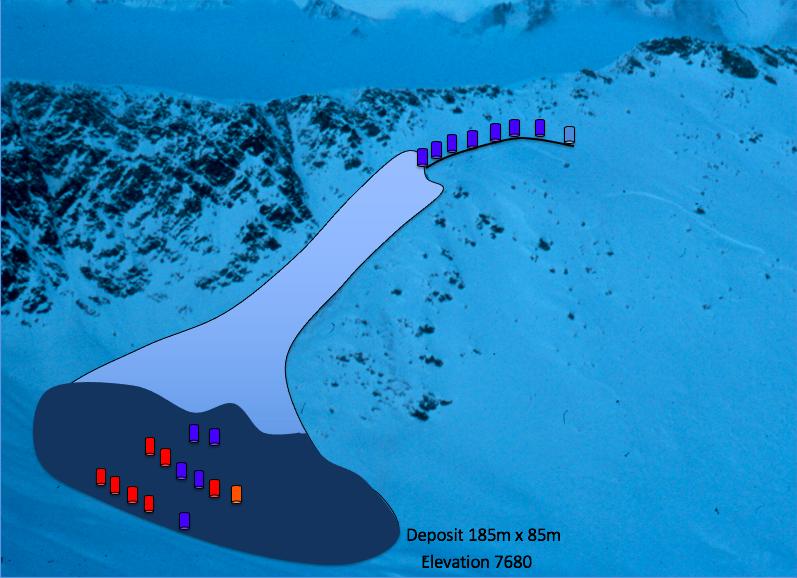
Failing on preserved Surface Hoar up to 20mm in length. Depth of failure between 50250cm. Approx 350m wide. 5600m from Crown to Toe of Debris. A mainly clear day with light to moderate winds and cool temps.
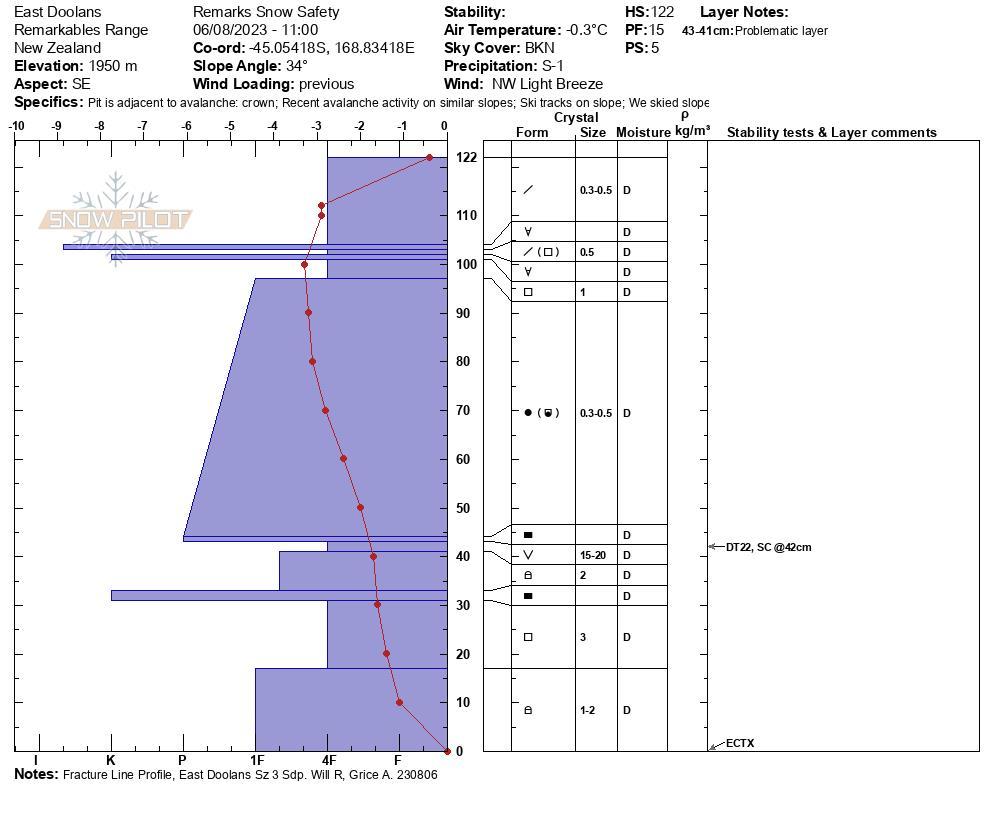
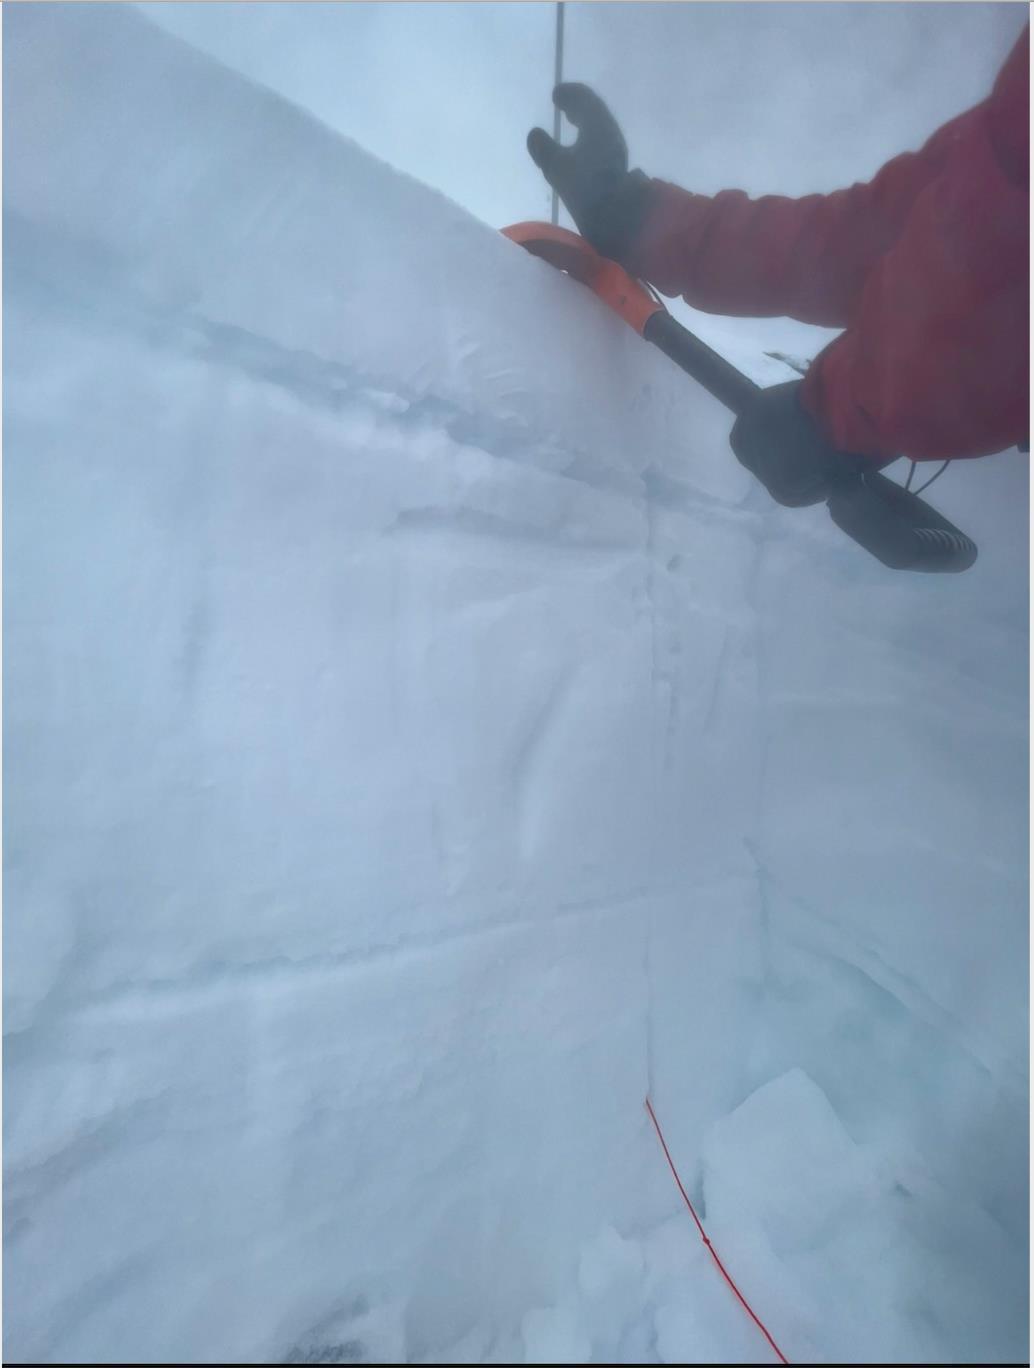
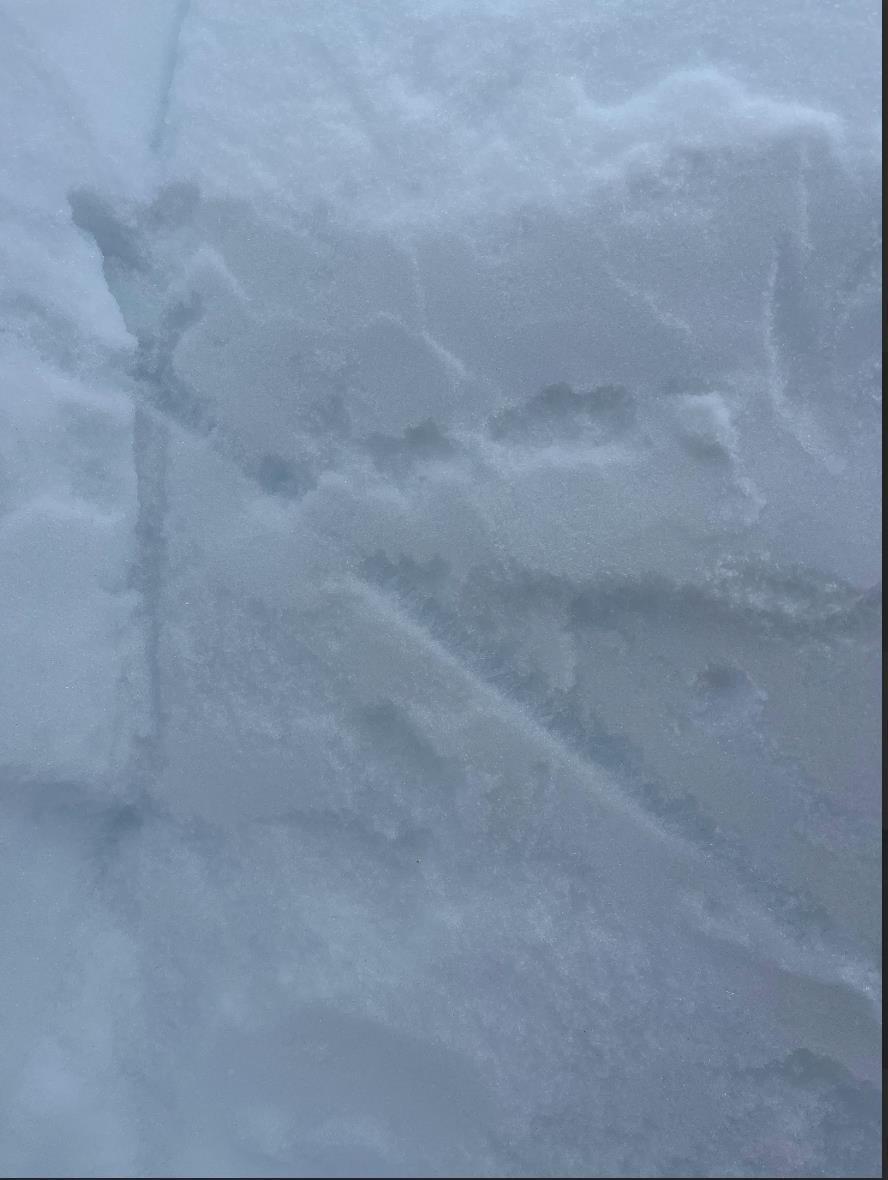
Surface Hoar Layer.
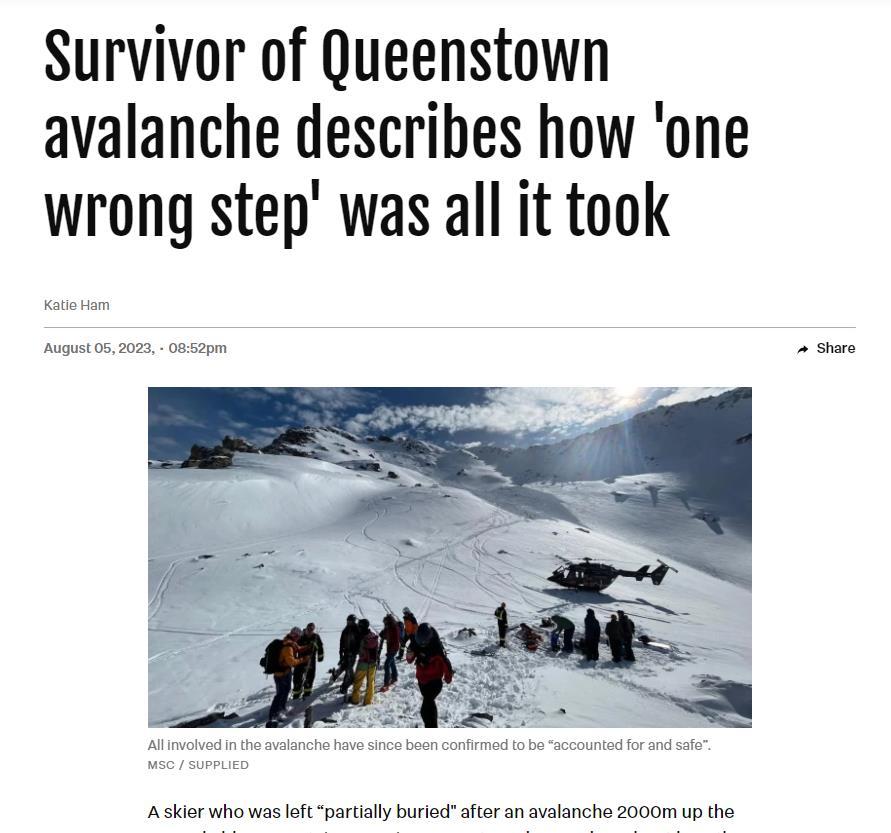
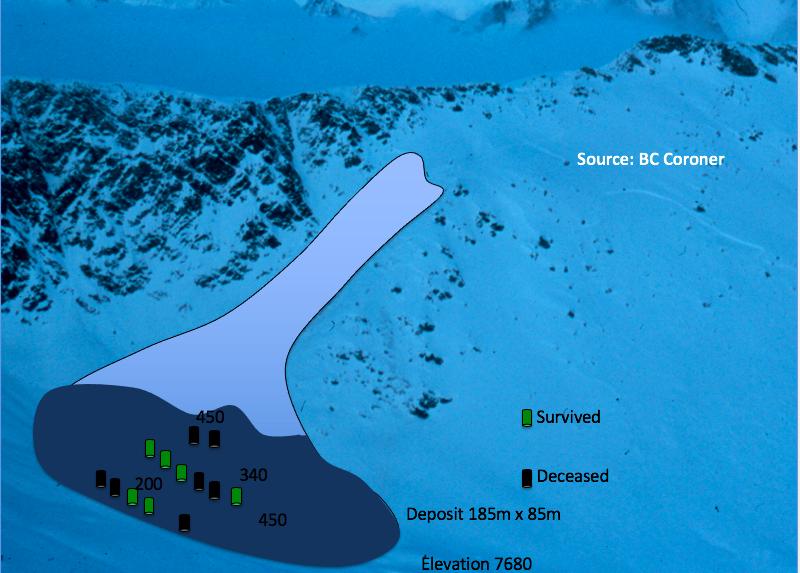
Event Overview.
Key points only for sake of presentation time. Detailed overview available upon request.
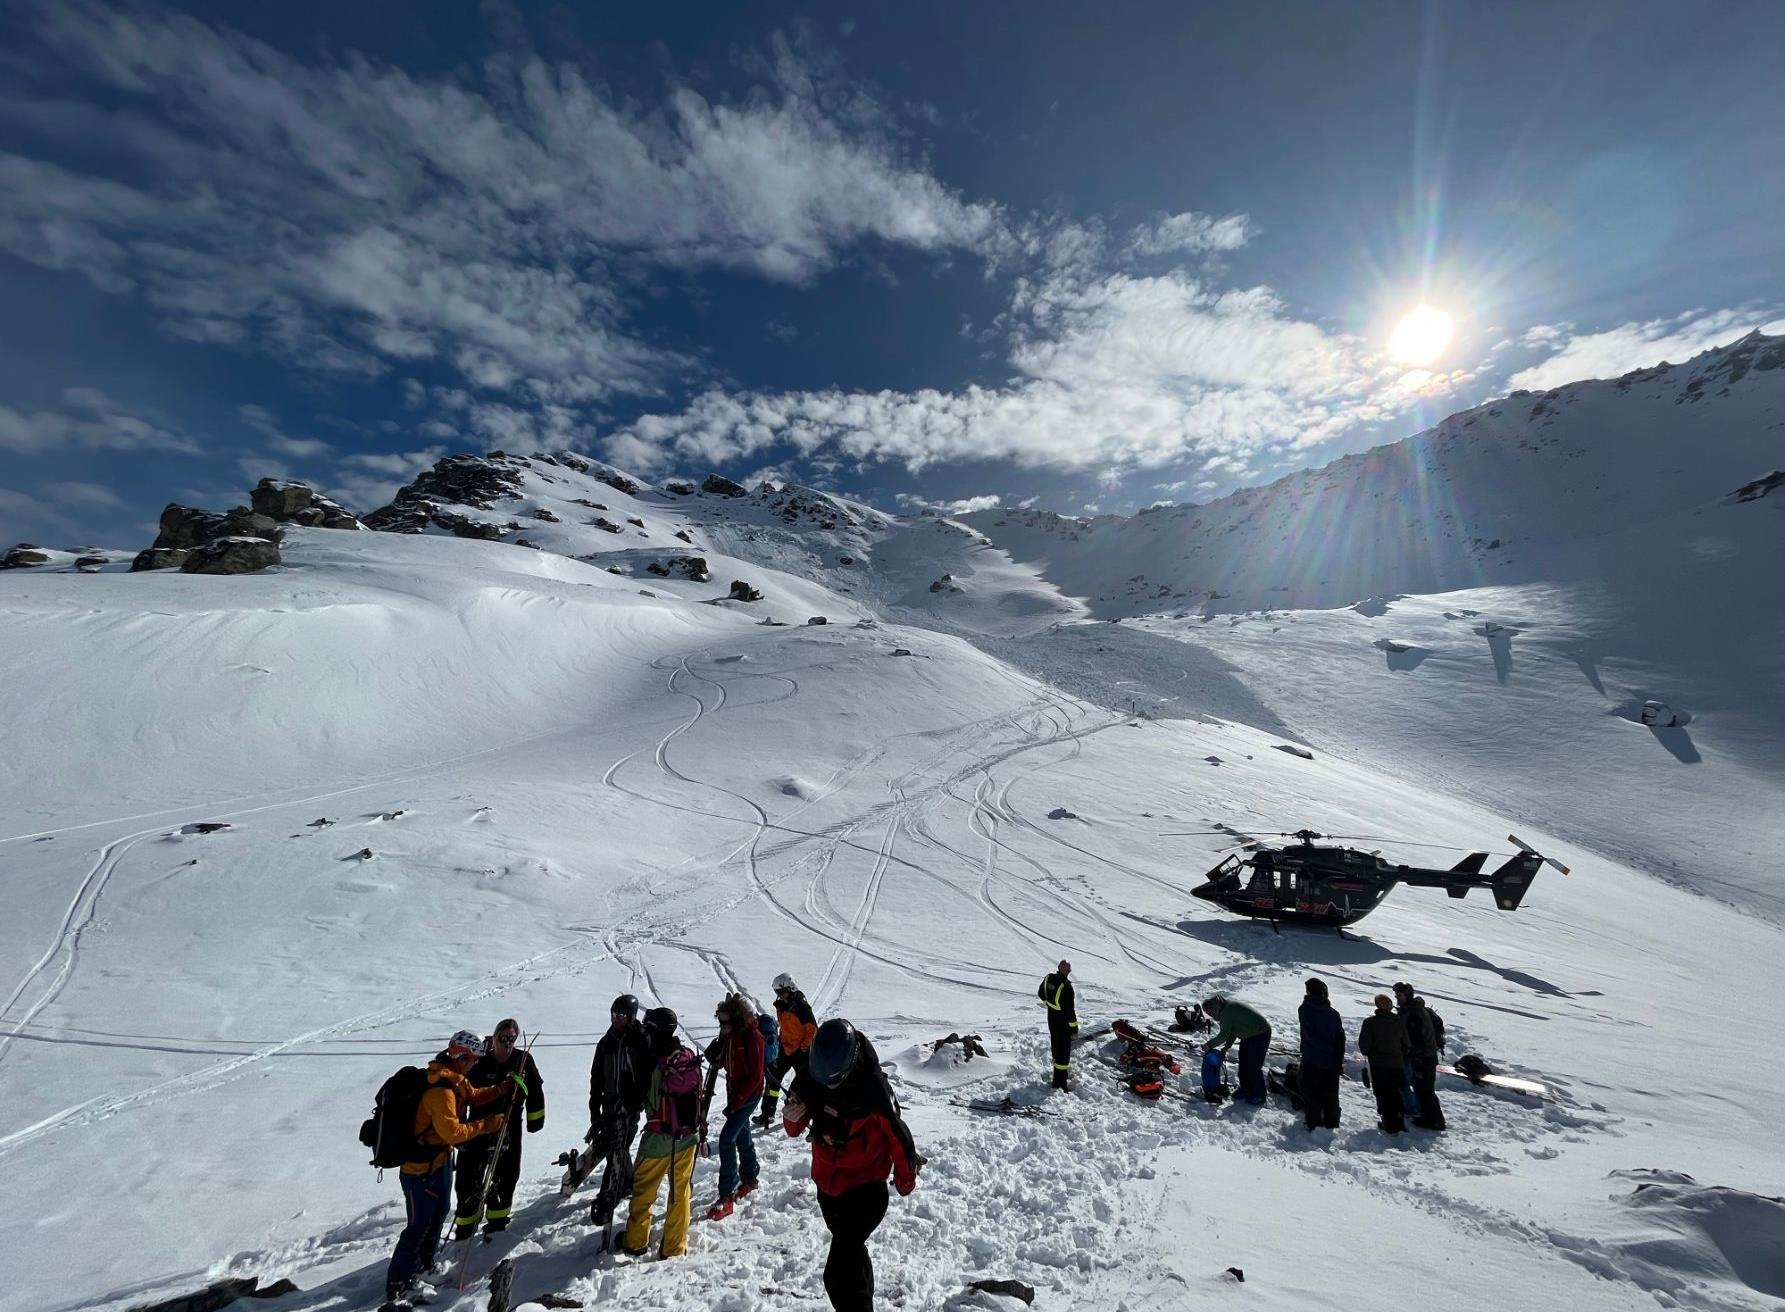
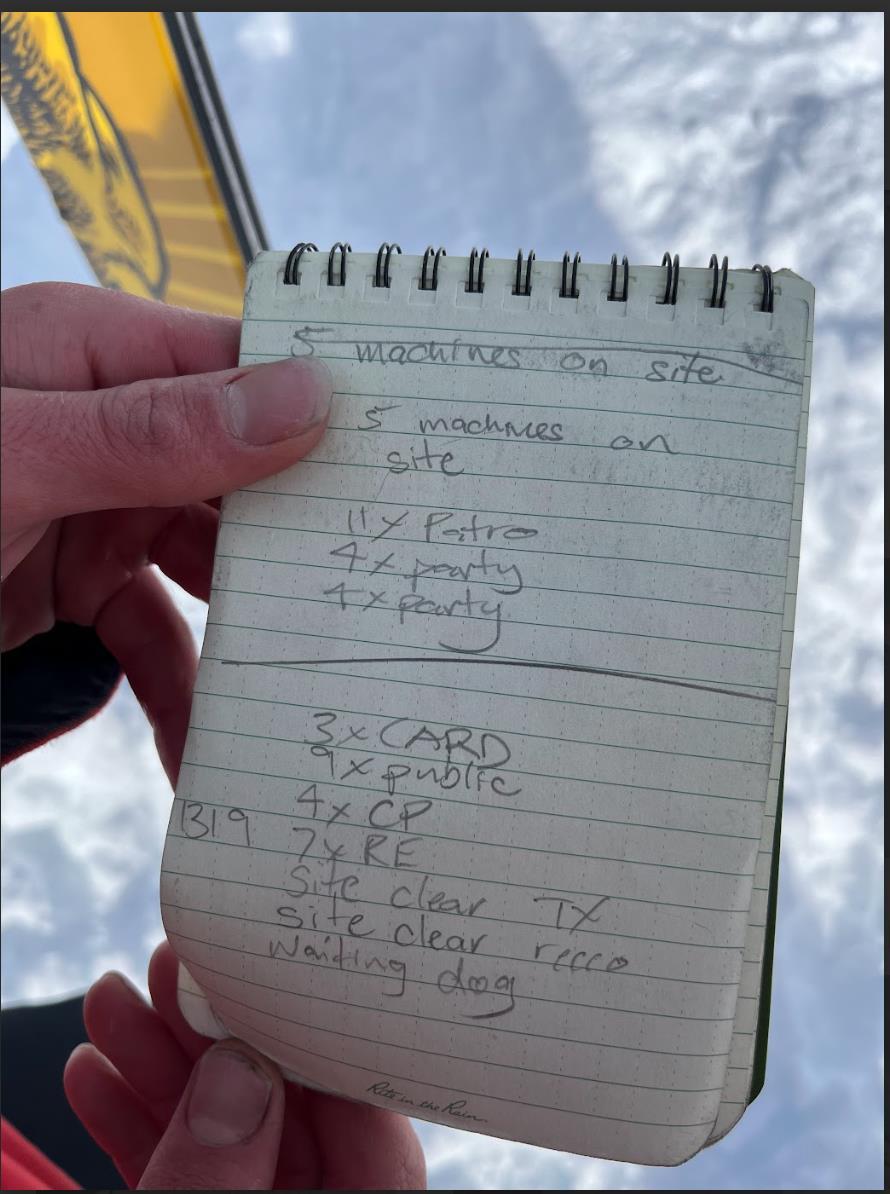
12.05 Initial report of avalanche, 2 caught. 9 people in area. Beginning Tx search. Call came from ex patrol HOD, qualified ski guide.
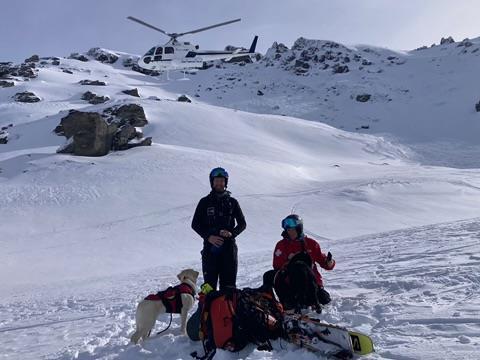
12.07 - 12.40 Remarkables Patrol team responding with 3 x patrollers accessing site on foot. 1 x ASC and 1x Dog handler + dog responding from base with the Otago Rescue BK117. Notification from people on site at 12.30 that site is clear of Tx.
12.40 - 13.00 Cardrona team with 2 x dog teams and 1 x patroller arrive and are tasked with Searching from the lower end of the site. Site is being recco searched. ASC relocates to bottom of site.
13.00 - 13.20 Coronet team of 4 Ski patrol on site. Additional helicopters. No further resources call made. Sit rep - 3 x Cardrona SP + 2 dogs
10 x public, 4 x CP Ski Patrol 5 x RE SP3 x O.resc BK + pilots and ICPs2 x Squirrels + Pilots.Site clear of Reccos and TXs. Confident site is clear but awaiting confirmation from dog teams.
13.21 - 13.45 Strong indication from a dog team. Second dog team re located to pass over Point of interest. CP patrol team dig area to ground to confirm no burial.
13.55 Site called clear and egress of all rescue party underway.
Avalanche Site Commander
• Prioritise establishing ESX 07 comms early.
• Don't be afraid to change location if needed.
• Appoint a Heli Coordinator/Load master separate to gate keeper/scribe etc.
• Utilise Heli's for even short distances with resource transport.
IMT & Police
Communications. - ESX07 capable radios essential for multi agency comms. Should be on forefront of ASCs mind in initial stage of rescue. Discussions are underway with the police about installing repeaters in high traffic areas like The Remarkables. Communications to IMT were reliant on NZSkis digital radios.
- As an operation responding to a backcountry avalanche it is important to start funneling all comms through police ASAP to ensure no double handling of resources.
•- With predominantly phone based comms between agencys at the initial stage of response and the relationships in the industry it is unlikely that “backdoor” calls will not be made. These calls must be clearly reported to the IMT/Police so they can manage resource allocation effectively.
Prompting for visual overview when in machine.
Awareness of site size, could’ve had a 4th team on standby for fatigue.
More downhill work. Prompt ASC and use Heli resources to bump up site.
Internal comms system worked well.
Patrol Teams
Airbags on site.
Don’t deplete ski hill of resources, ensure enough staff and essential avalanche equipment left behind.
Good support from Ski area Management.
Megaphones would've been good to take.
My message to the public.... To the best of my human factored brains abilities.
“Avoid areas of obvious wind loading. That area is where we are forecasting the persistent problem, however it will be very unlikely to trigger an avalanche (you’d be unlucky) but it will be very large if triggered. If you choose to go Ski long pitches, avoid areas of thin snow and use large and significant safe zones. Don’t ascend through avalanche terrain. The skiing will be good though.”
The skiing will be good though.....
• Key messaging. Keep to 30 words or less. Use the avalanche description text box for more specific detail around the individual problems.
• What is your primary avalanche problem? In this case the windslab had a higher likelihood but significantly less consequence. Does greater likelihood always equal primary concern?
• Better implementation of travel advice when choosing the danger scale. In hindsight The key message on the day of the event aligned with considerable.
Giving Advice as an Avalanche Professional
• Avoid referring to snow quality. Focus on the avalanche problem, likelihood, terrain management etc.
• Focus on what they should do and be aware of the bias of what you would do.... Likely different skill and experience sets.
• Be aware of closed questions like “do you think it will be good? Should we go?”
• Emphasise the need for them to make their own decisions.
• Be supportive and encouraging at all times, even when politely telling someone that their particular plan has a high propensity for death.
• Align with regional forecast.
• If in a team setting, incorporate the "brief" into your daily meeting etc to ensure there is uniform message being portrayed.
This may all seem fairly obvious but I raise it here to highlight the fact that as an avalanche professional within a region it may not be obvious that your casual comment is being taken as gasoline onto a confirmation bias fire.
Thank you for listening and I open the floor to questions.

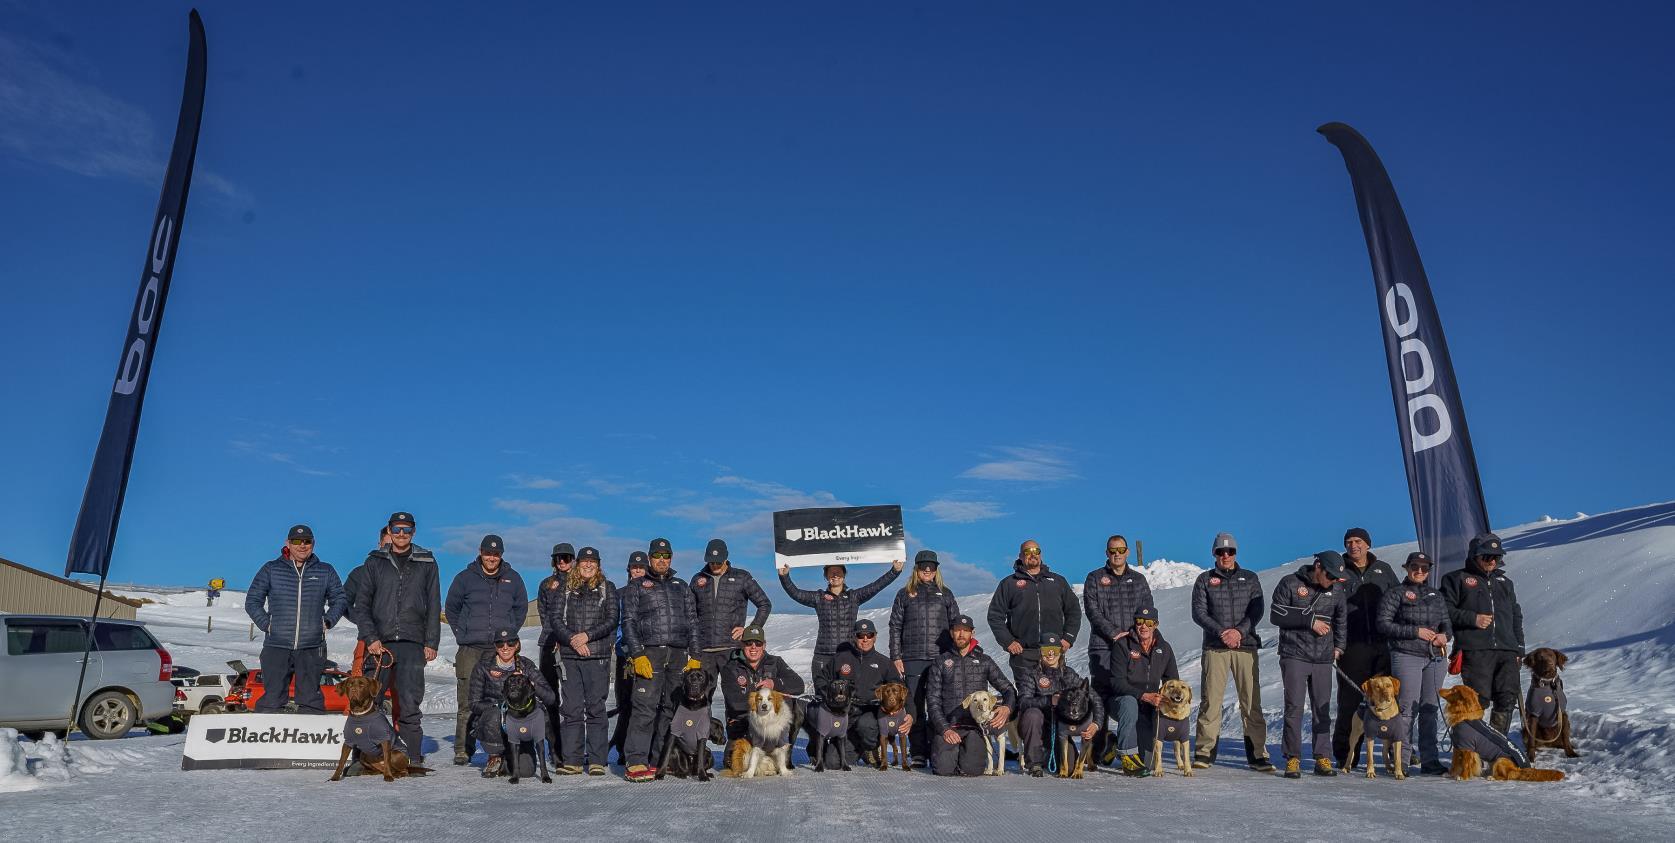
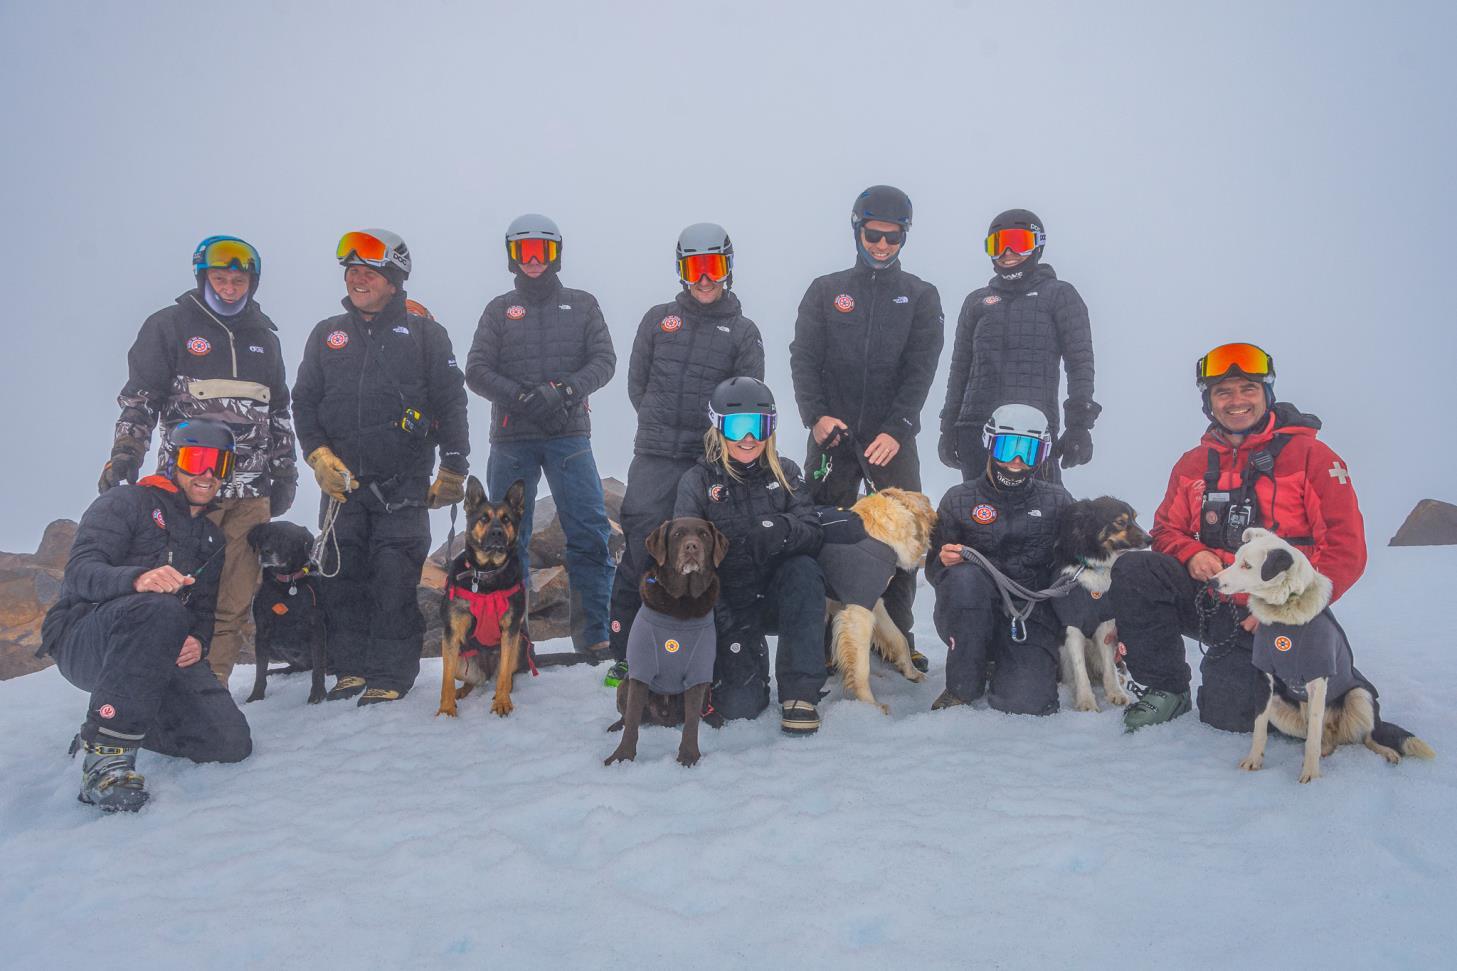
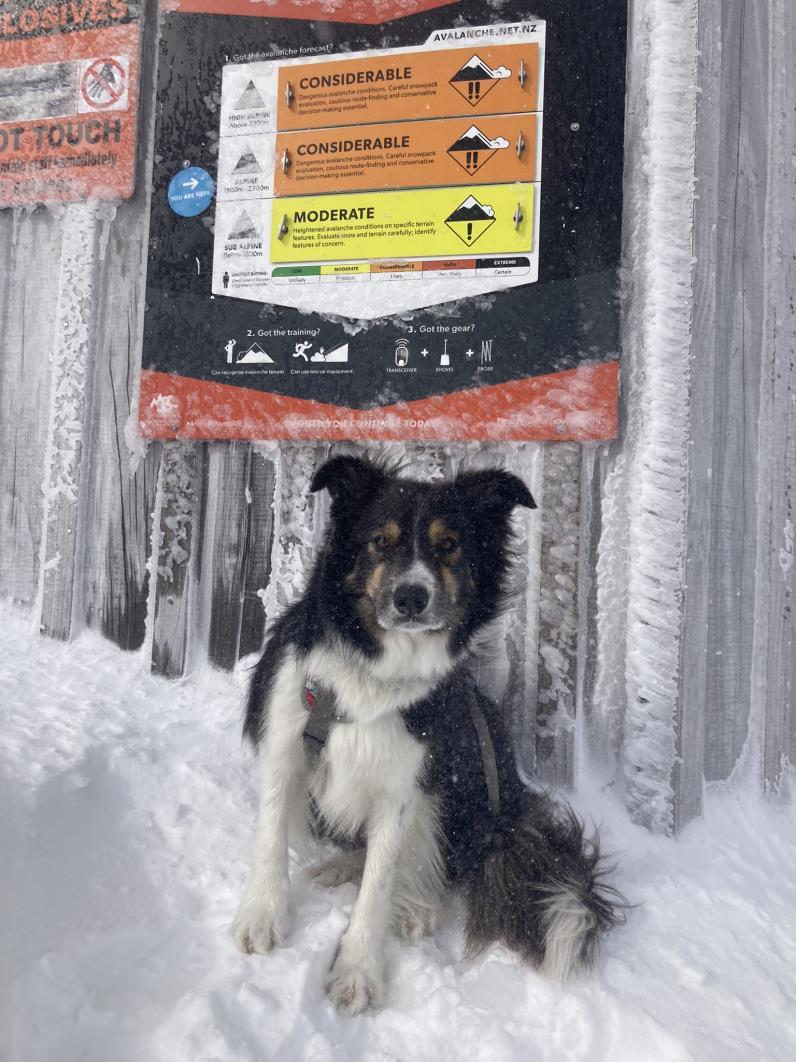
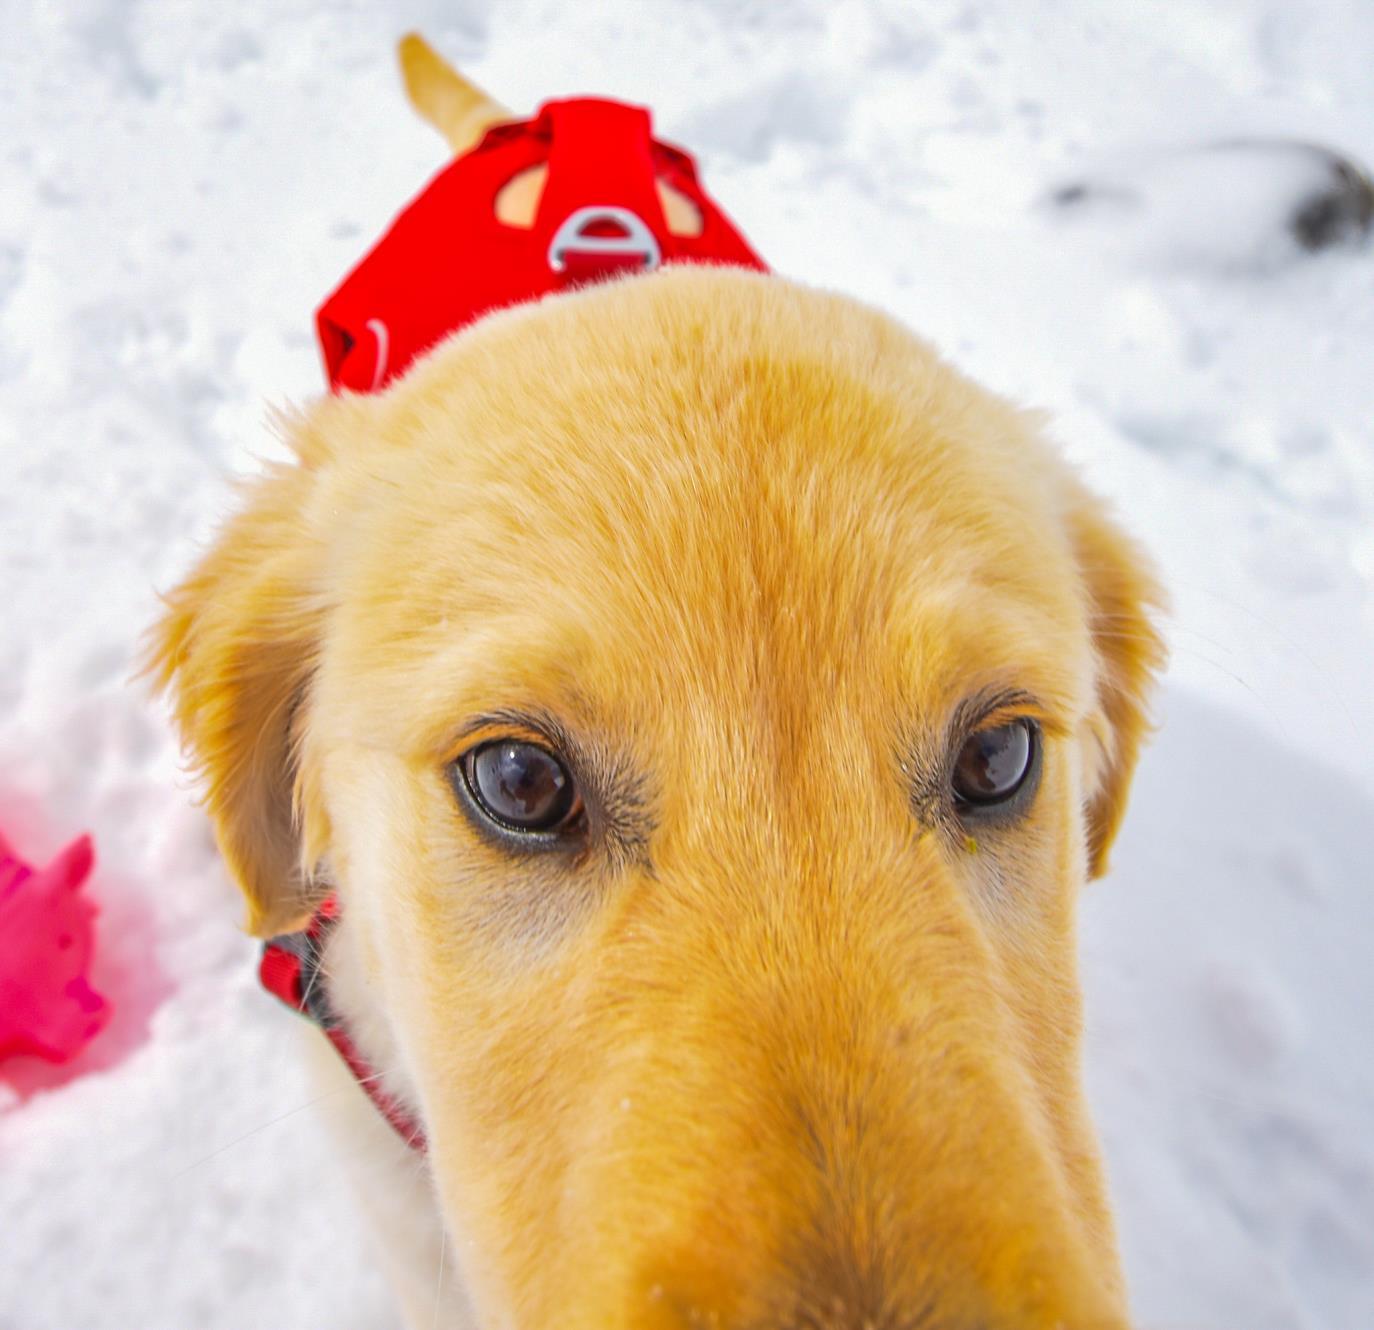
‘SARDA is the official volunteer organisation providing avalanche search and rescue dog teams in alpine environments across all of New Zealand.’
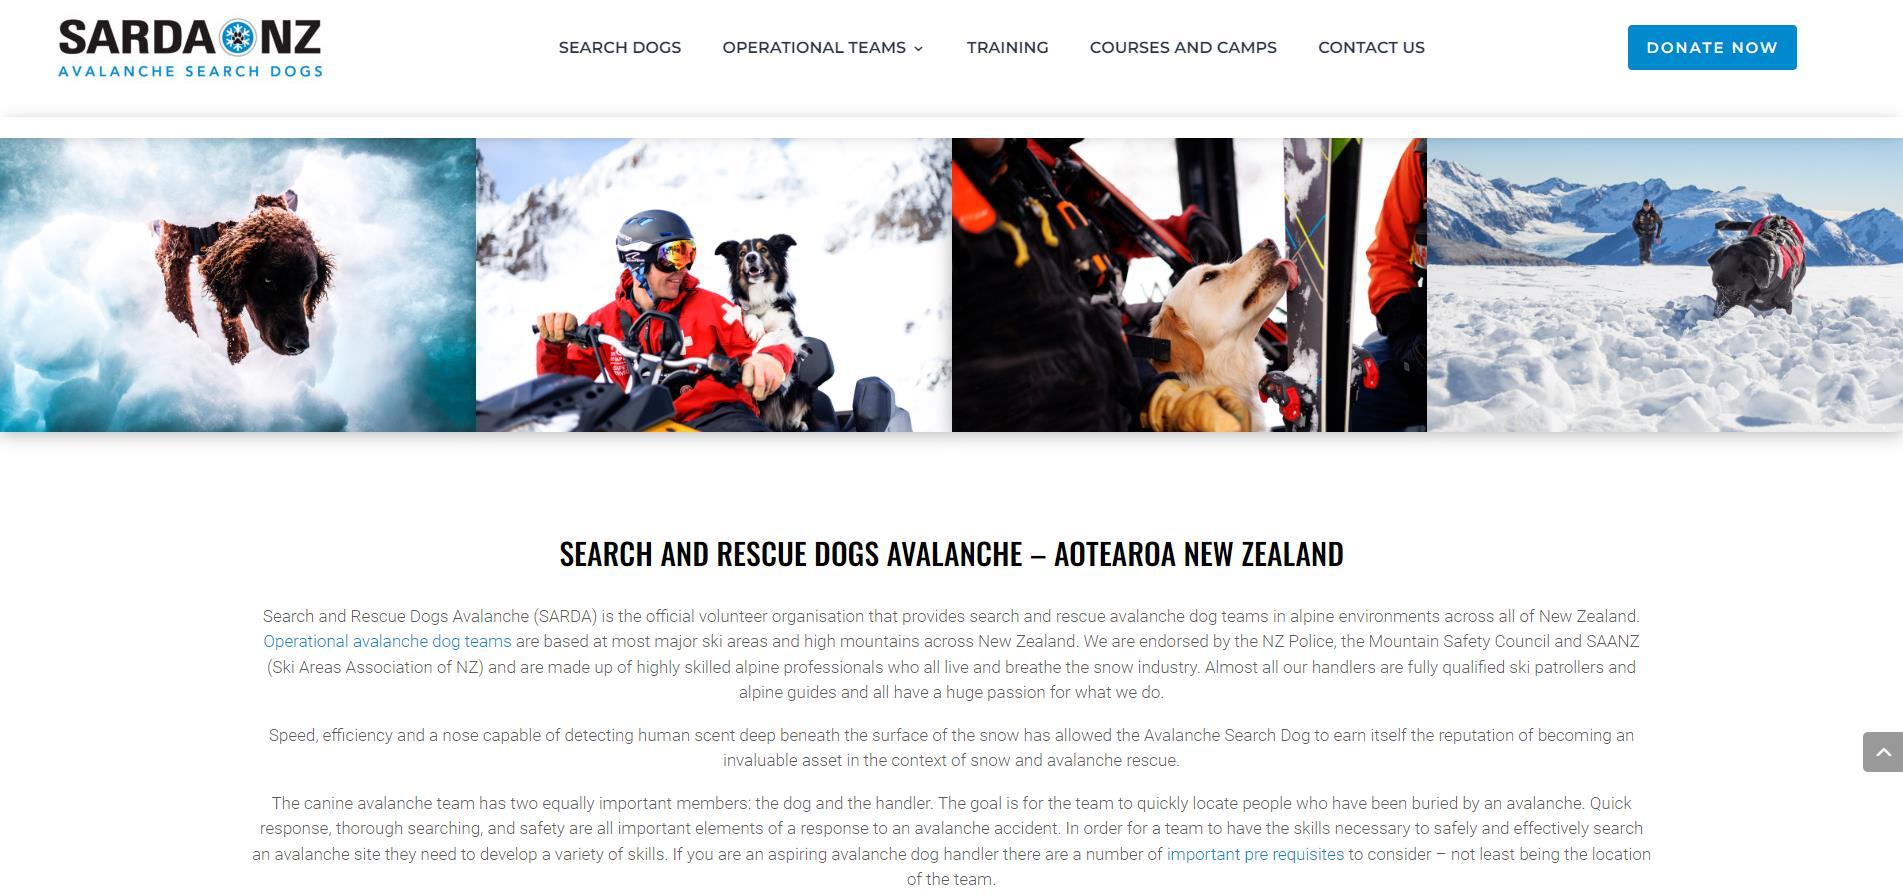

• We are PUMPED!
• We are the same great team of motivated folk – but with a renewed fire for this work
• We are stronger than we have ever been
• We have more operational teams than ever before
• Backcountry Avy SAROPs
• Sometimes technology fails
• Ski Areas and other PCBUs with primary duty of care
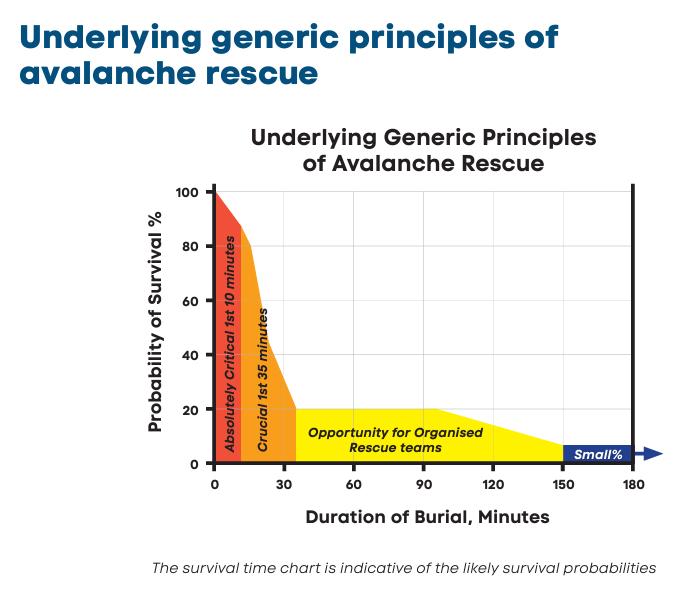
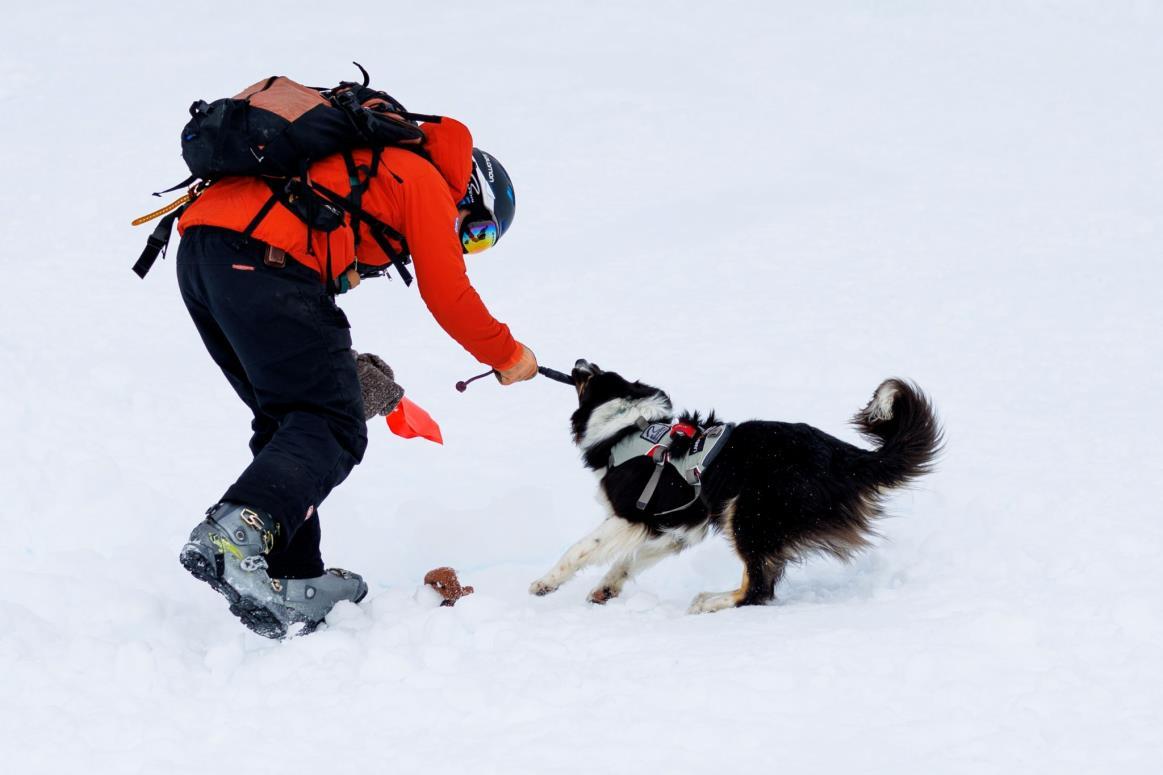
• One dog can search an area equal to a rugby field in 30 mins (20 human searchers x 4 hours for same area)
• Another tool in the kit


• Doolans – August
• Whakapapa – August
• From the InfoEx: 4 skier accidental events in 2023 (in ski areas)
Our Journey over the last 12 months

• Parted ways with NZ Land Search and Rescue prior to winter 2023
• Starting from scratch, we formed a new organisation
• Since then we have raised over $100,000 to re-equip all operational teams


• All training and exam camps completed in 2023


• Thanks to all the support from our partners we are in a strong position for 2024 and beyond


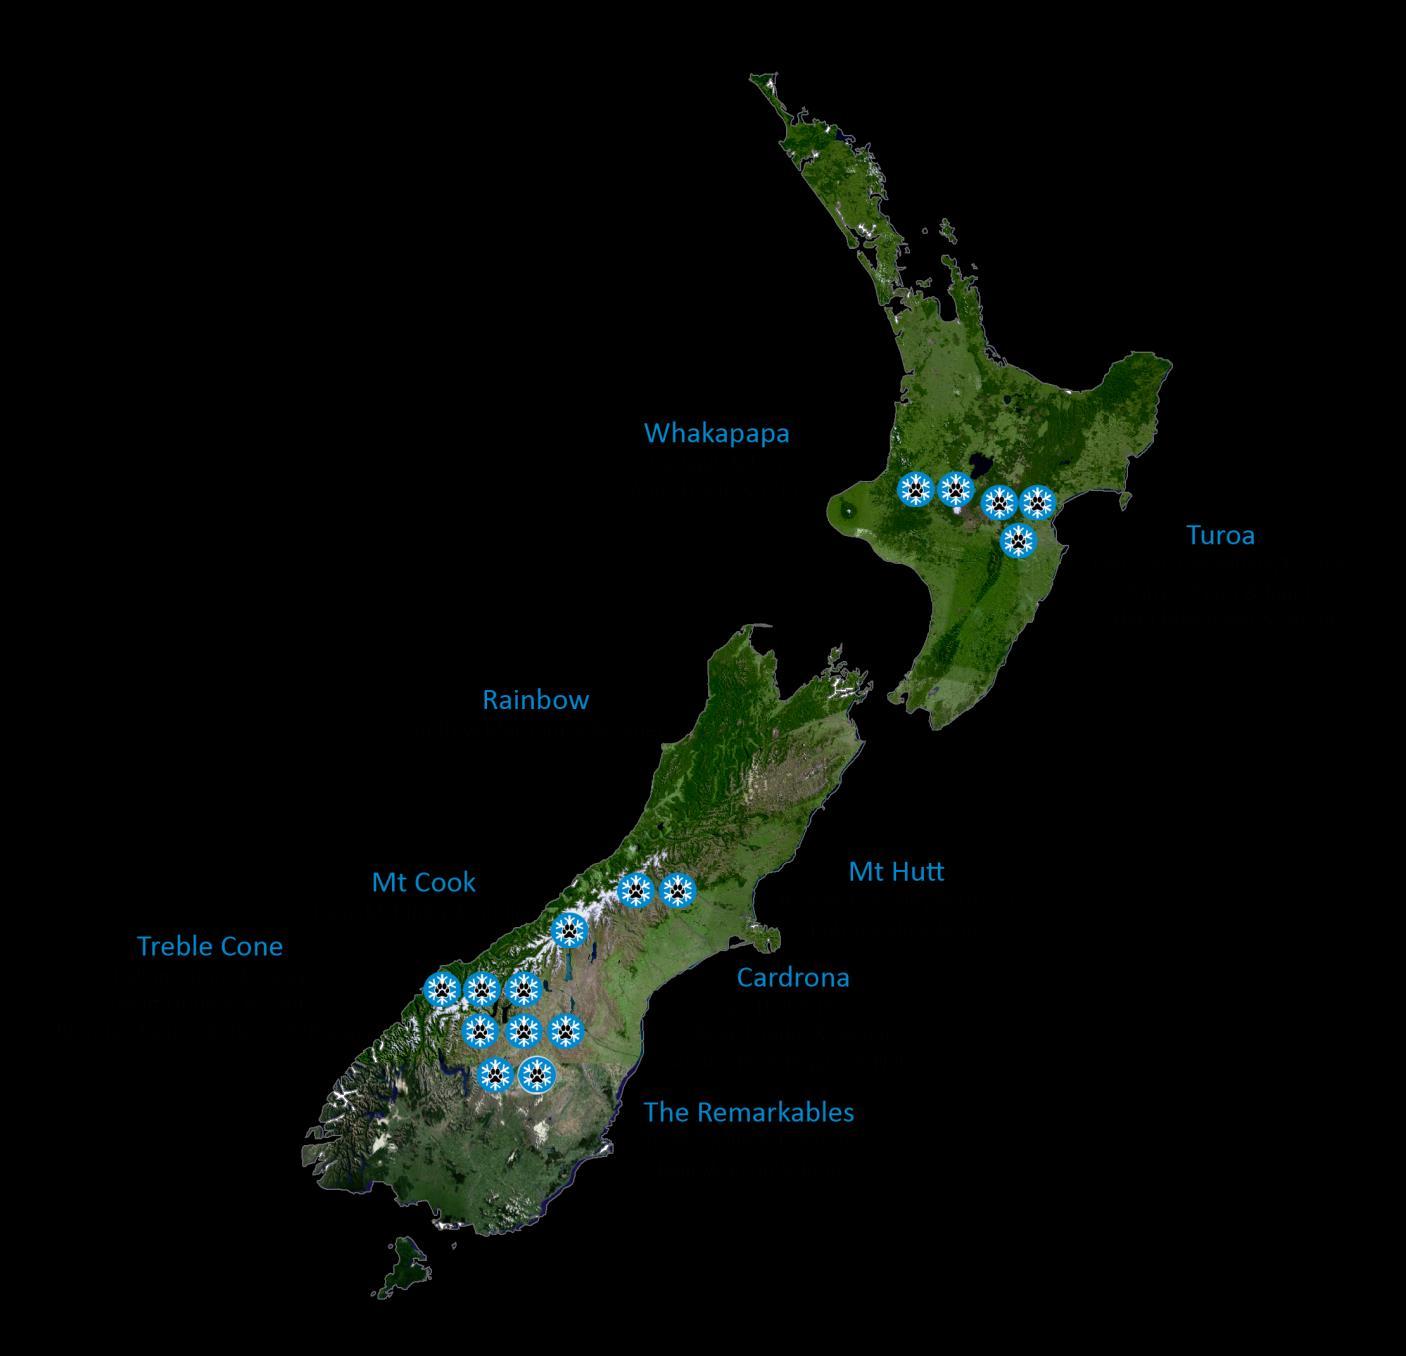
• We currently have 19 operational teams based throughout both islands
• Our South Island winter training camp is planned for 22/23 June 2024 at Ōhau
• North Island winter training camp set for July 27/28 at Tūroa
• Winter South Island assessment camp –August 30 – Southern Hemisphere Proving Grounds
• Winter North Island assessment camp –October 5/6 - Tūroa
• We aim to have as many operational handlers ready to respond within 15 mins as possible throughout winter
• All regional avalanche response plans are integrated with our current contact numbers – refer to website for real-time updates
• National Co-ordinator (and deputy) on call at all times to help connect the right resources with the relevant sites as required
• Make sure you reach out for any planned training events leading into or during the winter
• Maintain and grow a sustainable approach to providing ongoing SAR response to alpine regions of NZ
• Maintain and grow sustainable avalanche dog function for Ski Areas and other PCBUs
• Help to improve public avalanche safety education and awareness
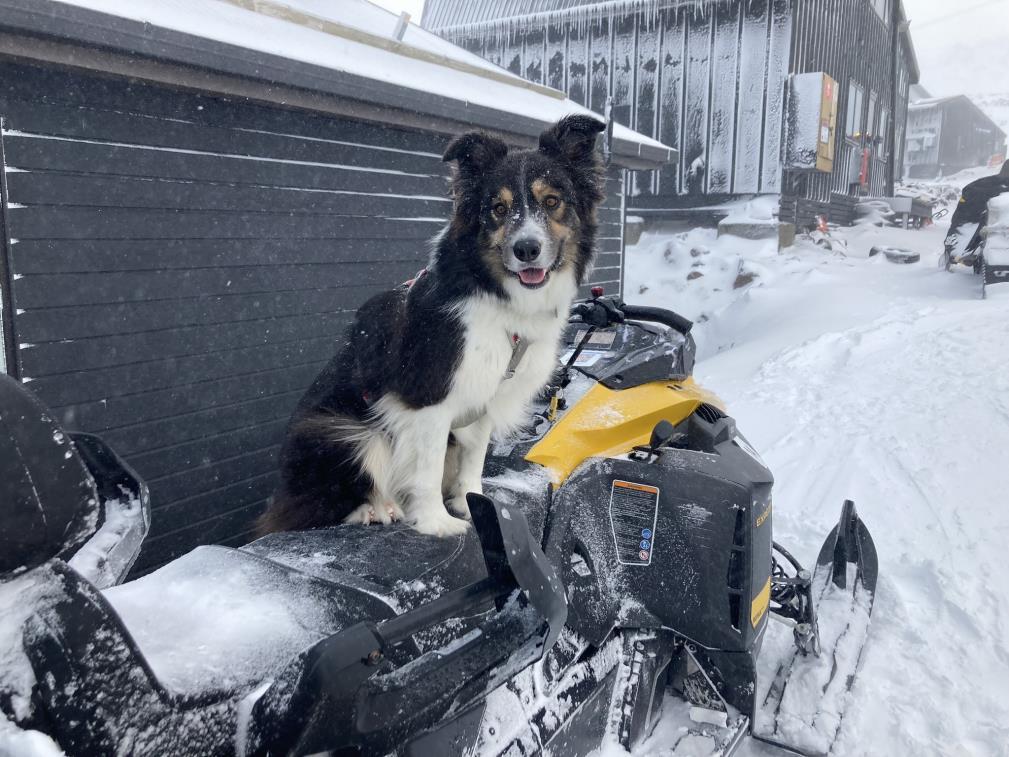
• Or just help you ride your snowmobile…
(Thanks for your support!)
THANK YOU TO OUR LUNCH SPONSOR

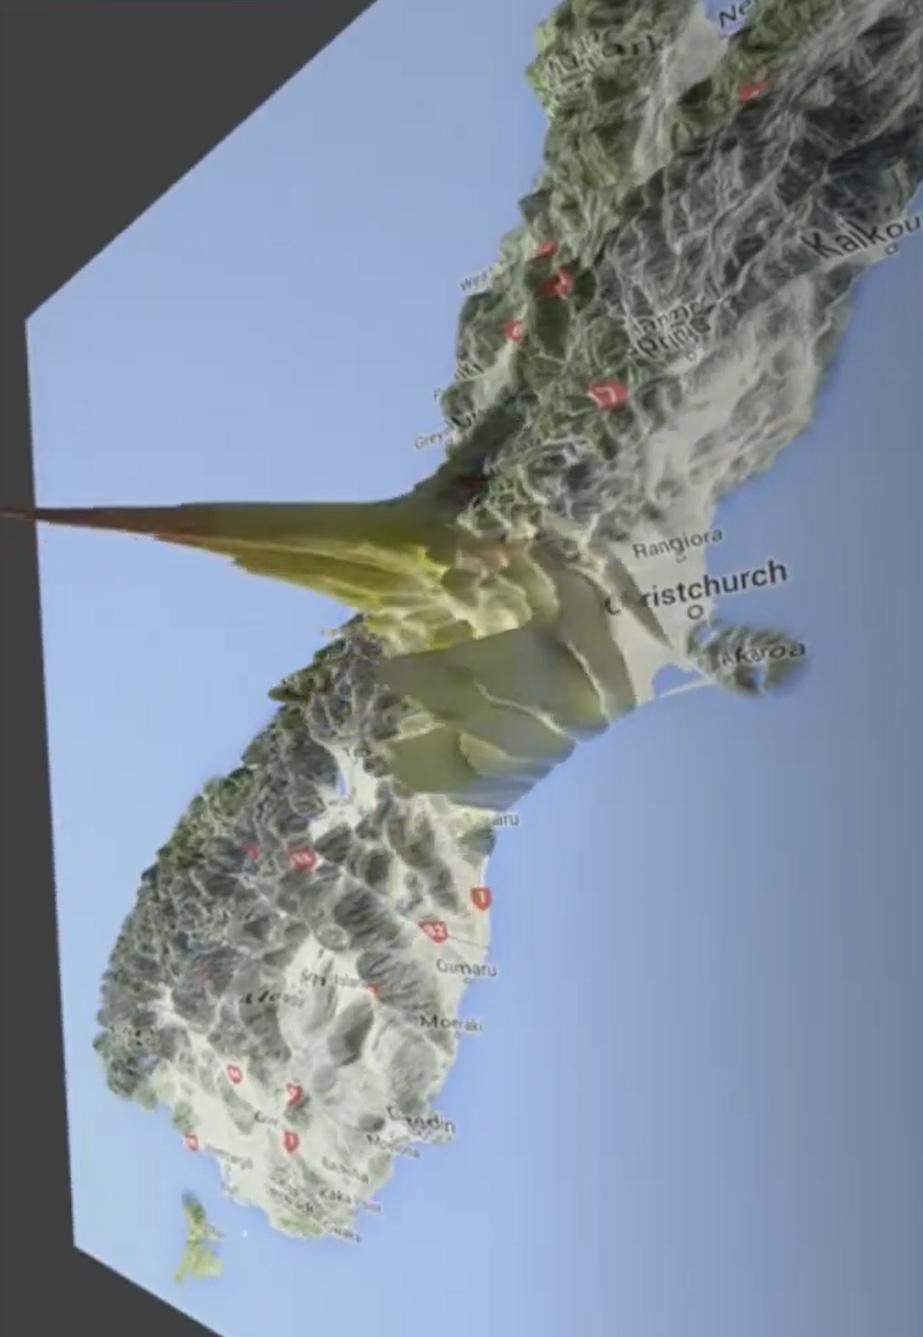
Fault Rupture Medical preparedness of South Island ski fields to a large scale earthquake
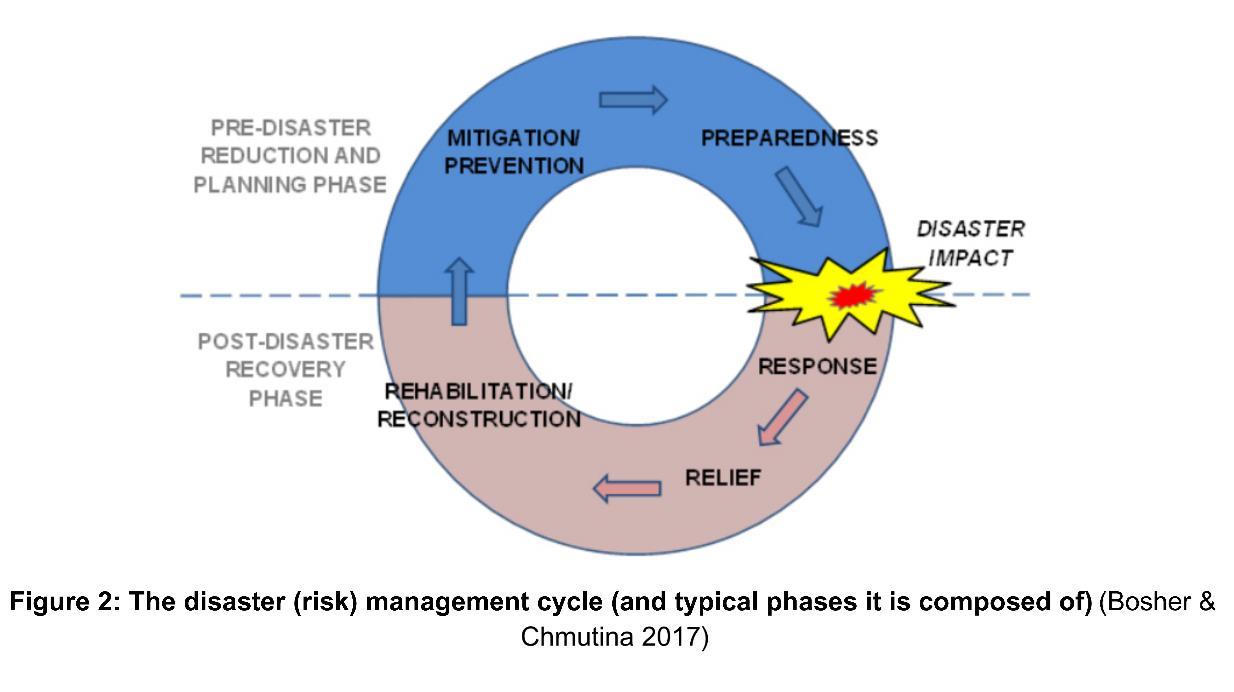
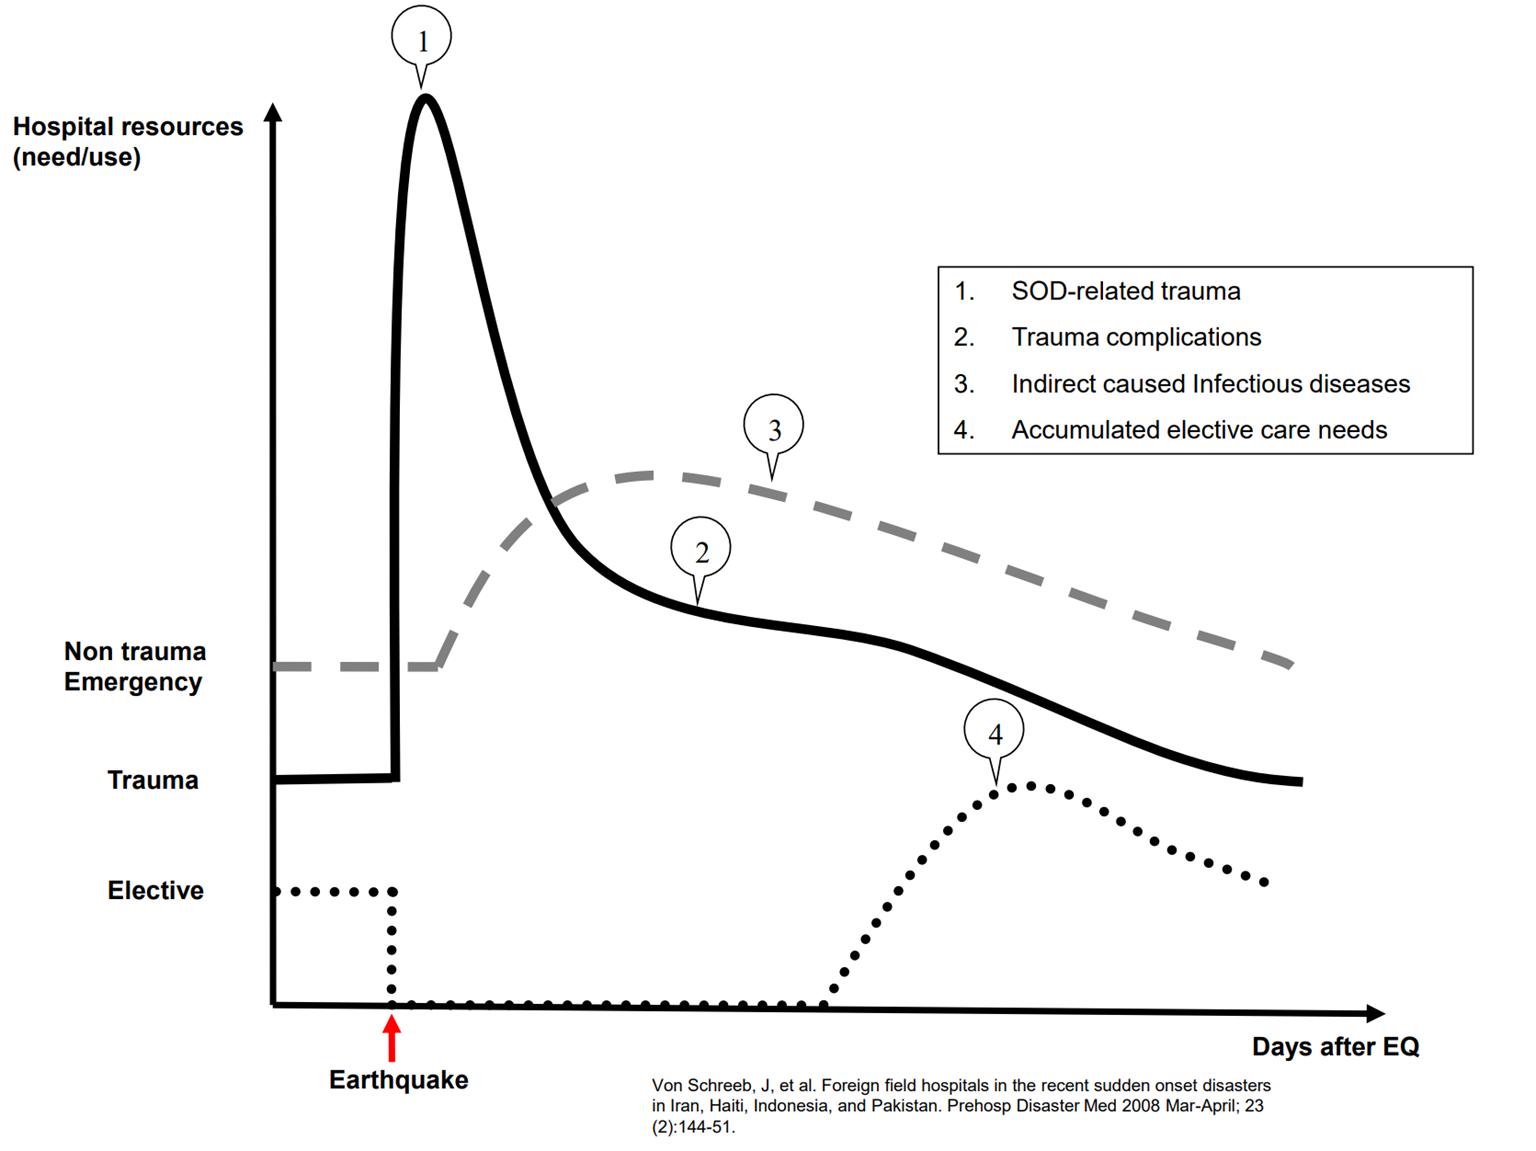
Introduction
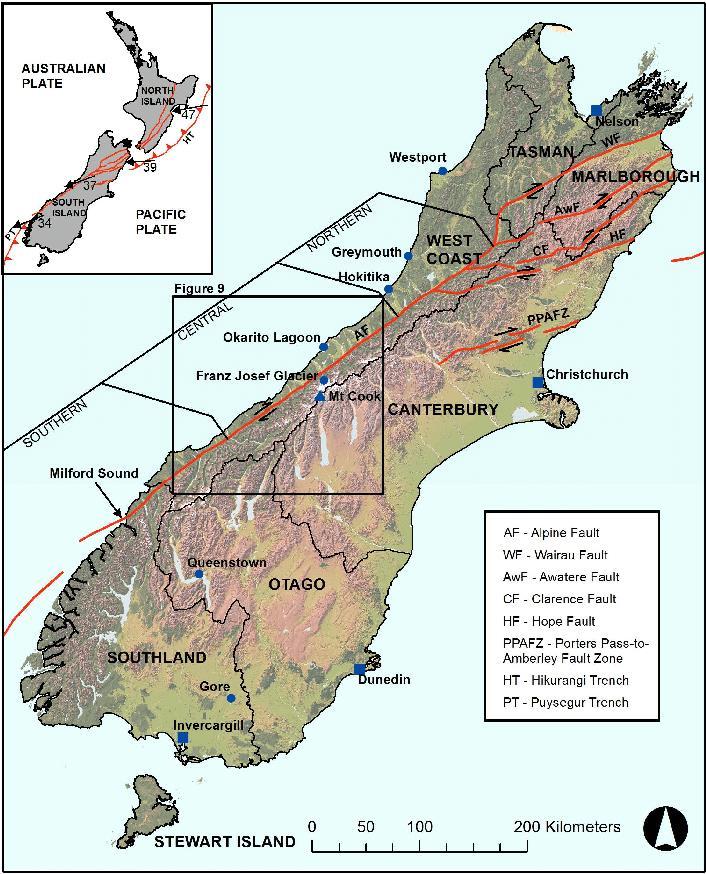
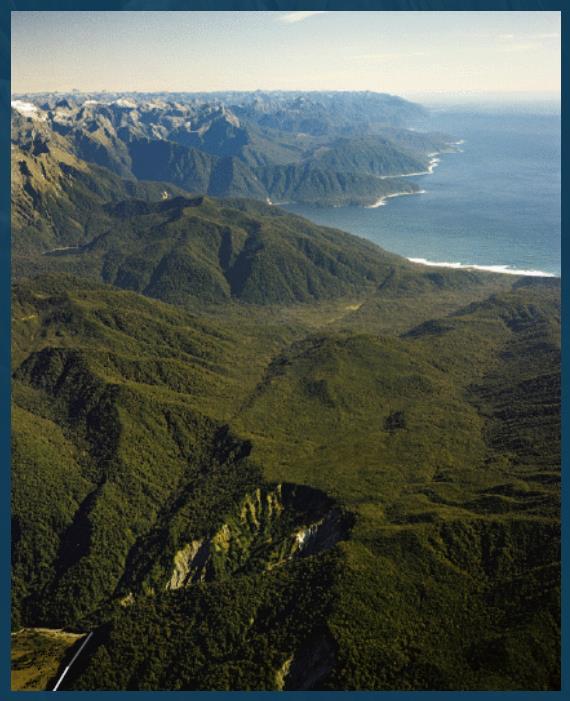
Geology
Disaster phases 4. Method & Questionnaire
5. Research themes
6. Possible interventions


- 19 ski fields across the South Island, all rural areas
- 5 major commercial
- 5 small commercial
- 3 medium club
- 6 small club
- Approx. 28,000 guests across South Island fields in one day (peak season)
- Alpine Fault has 75% chance of rupturing in next 50 years, 80% chance > 8Mw
- Are our ski fields medically prepared for a large scale earthquake / natural disaster?
● 2022 - Initial contact with 5 ski fields and generalised data gathered
● 2023 - 18/19 South Island ski fields Interviewed
● 2024 - Research paper in progress
- 5 ski fields and 10 organisations involved in disaster planning and response were interviewed
Issues highlighted
- International seasonal workers on ski fields
- Large amount
- Not aware of natural disaster risk eg Alpine Fault
- Varying amount of basic first aid skills
- Medical clinics
- Non existent, scarcely resourced or ‘just managing day-to-day’
- May contain outdated / lack appropriate equipment
- Lack of collaboration between organisations and ski fields for disaster planning
1. Guest information
2. Staffing
3. Medical availability
4. Emergency response / communications
5. Isolation
6. Preparedness
- Communication setbacks
- On field
- To external agencies
- Supply limitations
- Food, water, shelter
- Medical
- Triaging logistics
- Emergency scenario training
- No specific multi-scenario event
- Evacuation issues
- Egress + access route blocked / unstable
- Helicopter shortage
- Post evacuation limitations
- Hospital bed block
Intervention Ideas:
- Earthquake safe buildings
- Creation of alpine fault rupture specific triage system + kit
- Creation of alpine fault rupture specific response
- Mandatory AEDs on site
- Continue training
- Guests to be encouraged to bring up supplies
- Increase public awareness
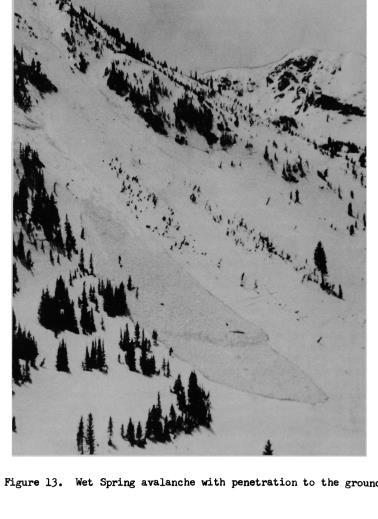
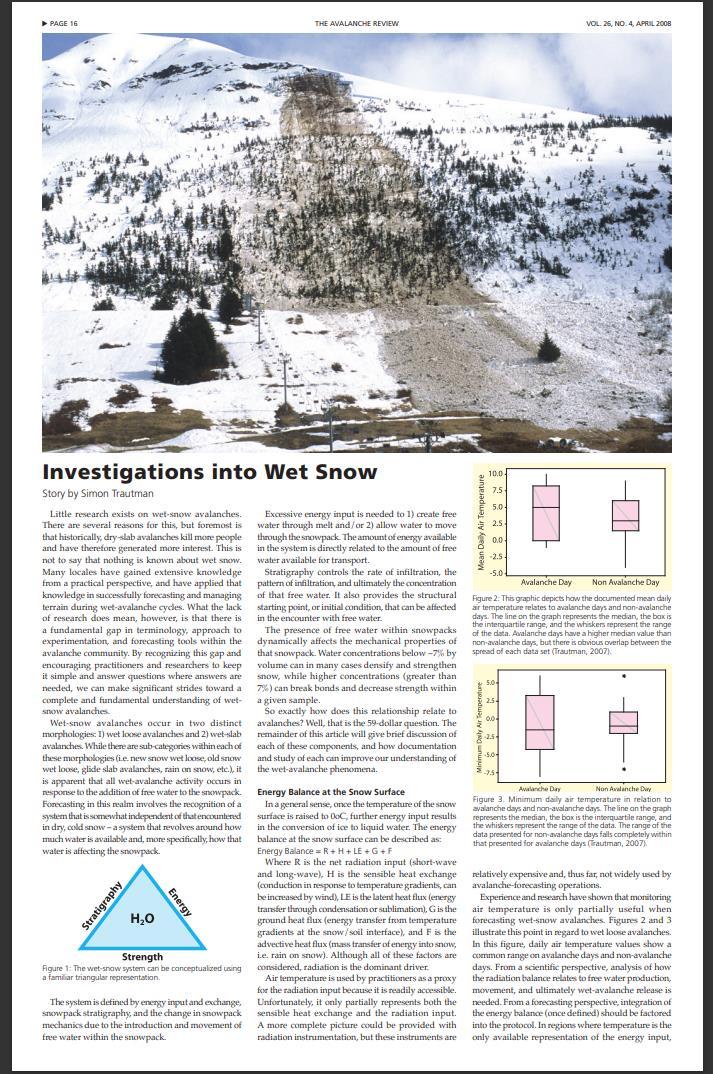
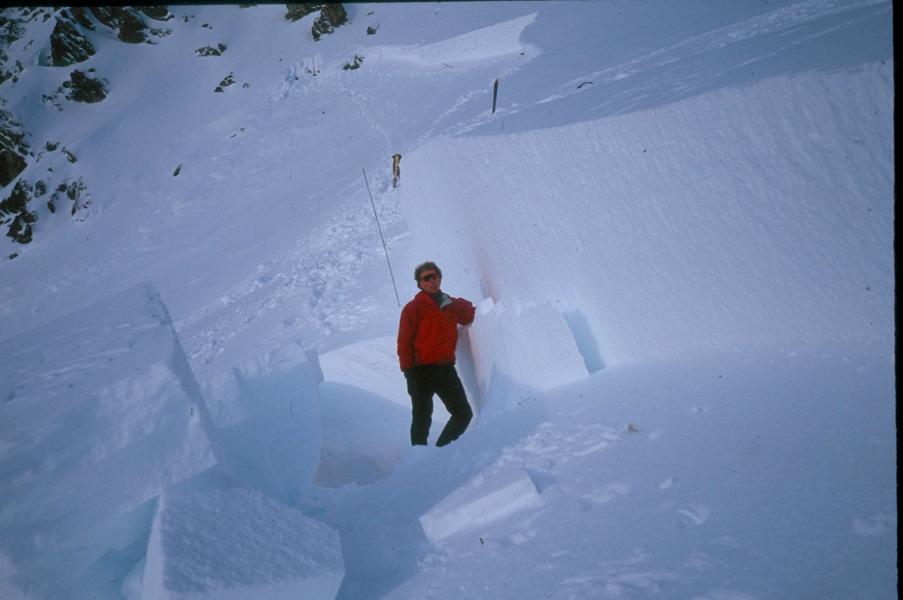
Wet avalanches are triggered by the decreasing strength of a snow layer Ch 2. How AvalanchesWork
He also says that wet snow avalanching is difficult to predict because the timing is more critical than with dry snow.
In Chapter 5 called Snowpackhe looks more at the physics of the pack.
He uses a lot of analogy to describe the varying strength of snow with low and high amounts of water in it.
It’s actually pretty good.
These are increased loading, decreased strength, and lubrication.
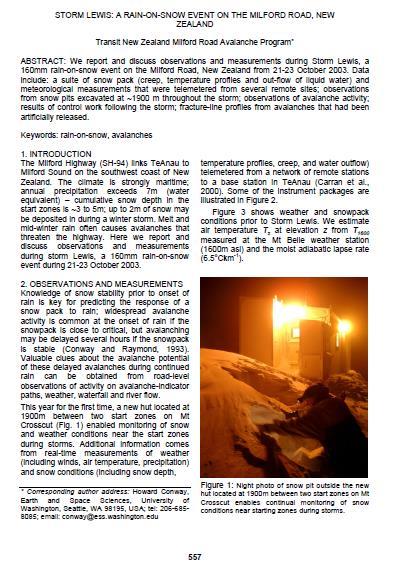

Widespread avalanche activity is common at the onset of rain if the snowpack is close to critical, but avalanching may be delayed several hours if the snowpack is stable (Conway and Raymond, 1993).
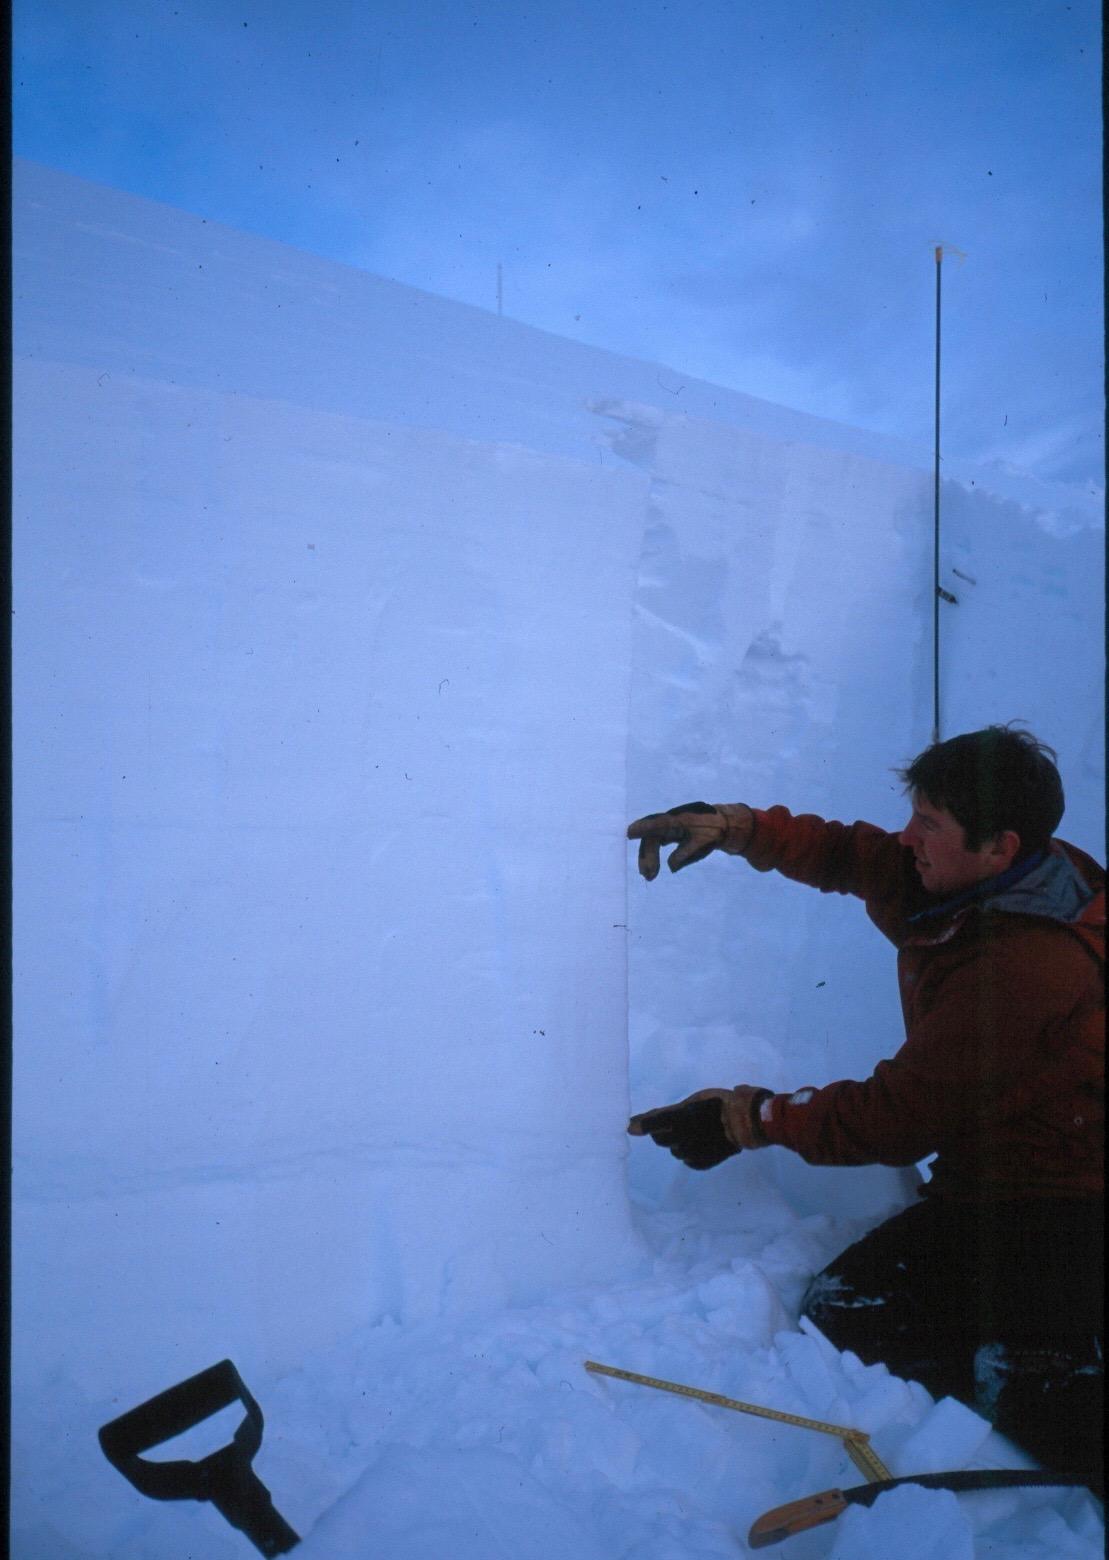
Twit analysed
wall profiles made during the storm and made some fairly complex stress/ strength calculations.
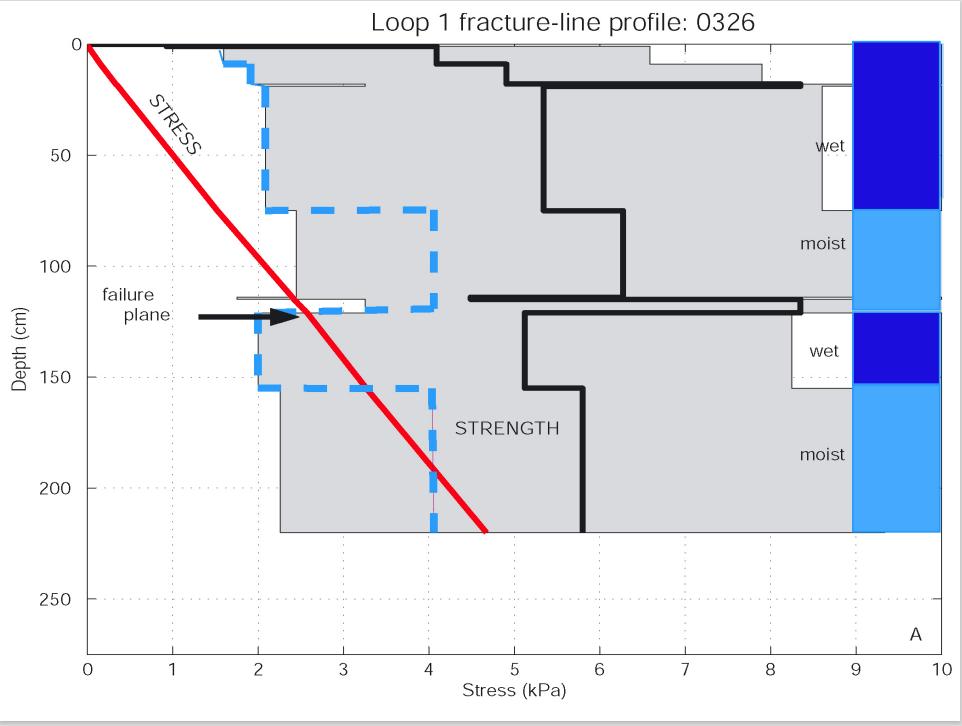
The snow pack prior to Storm Lewis was generally stable; immediate avalanche activity at the onset of rain was not observed.
Twit concluded by pointing out areas where dealing with rain on snow was difficult, which lists a bit like all the tough questions about rain on snow

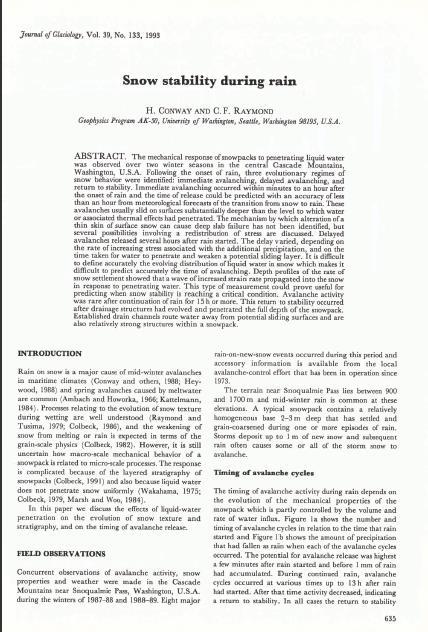
1.Immediate avalanching
2.Delayed avalanching
3. Return to stability
1.Immediate avalanching
2.Delayed avalanching
3. Return to stability
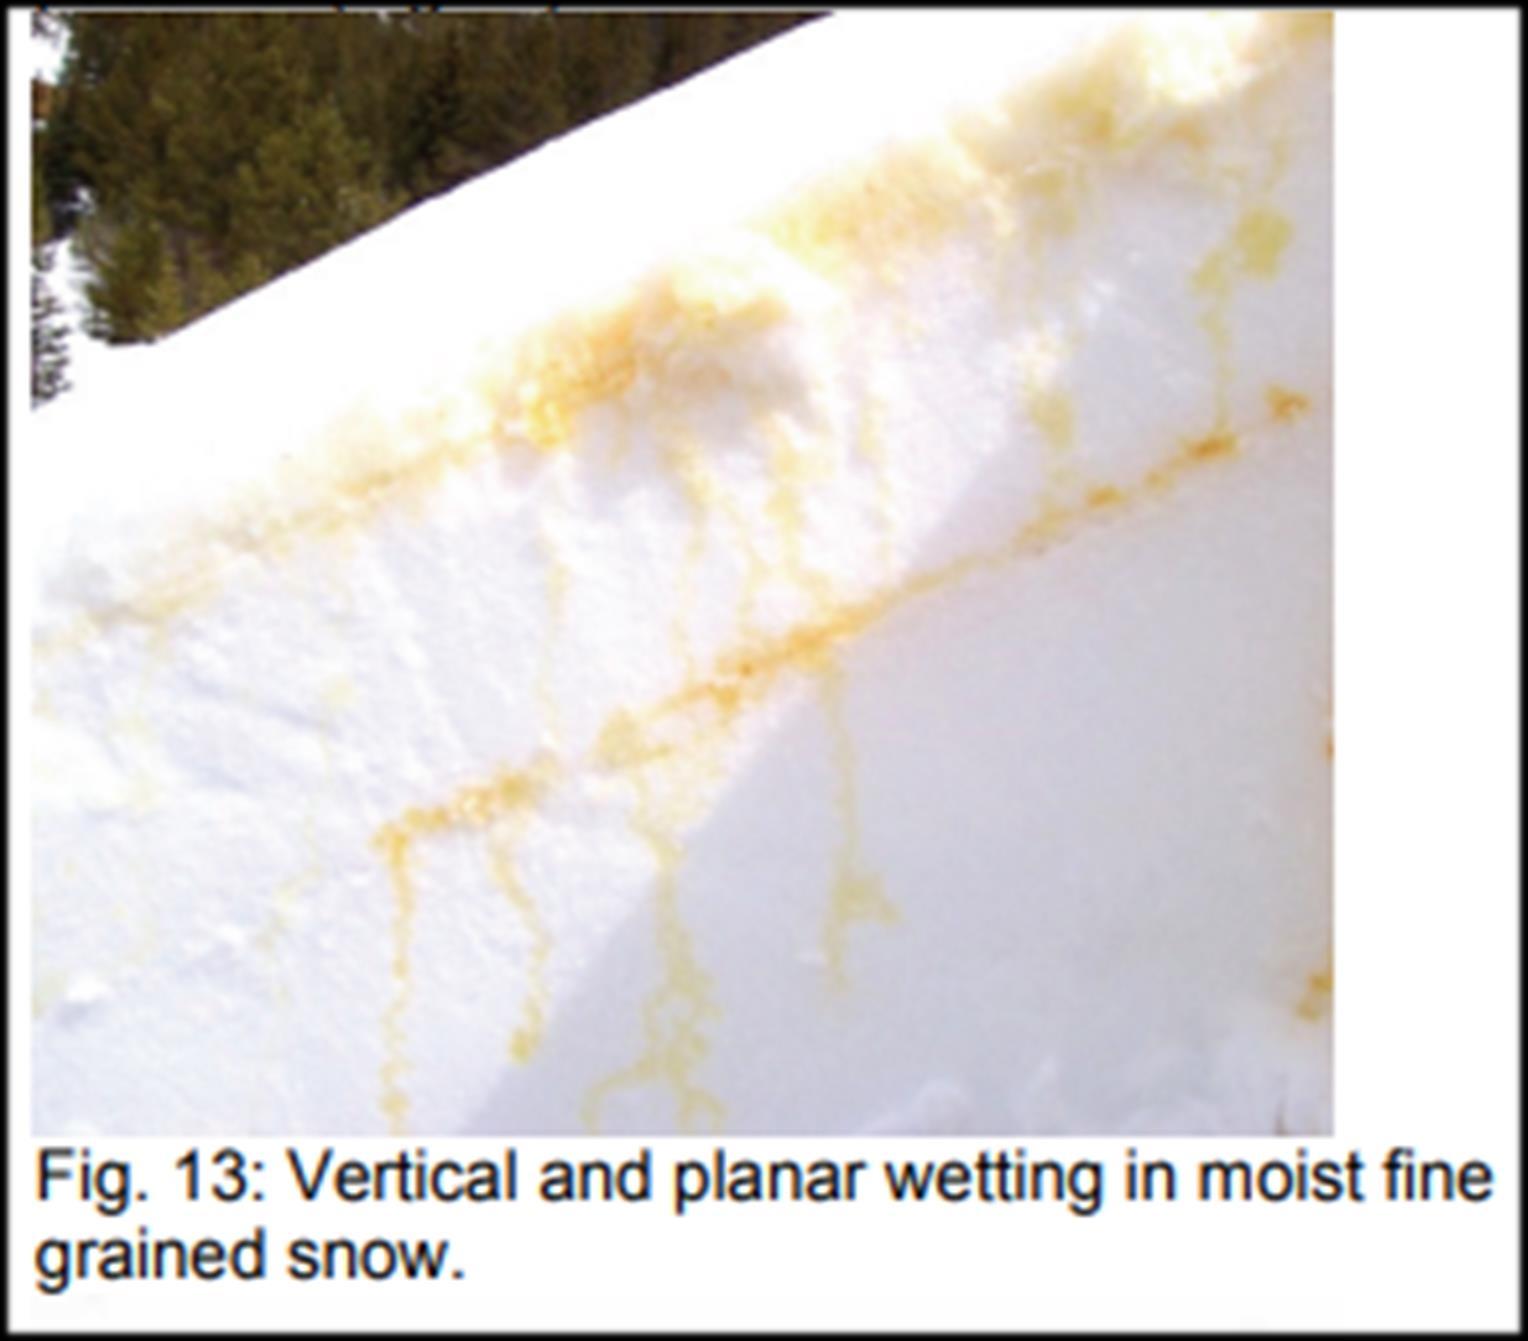
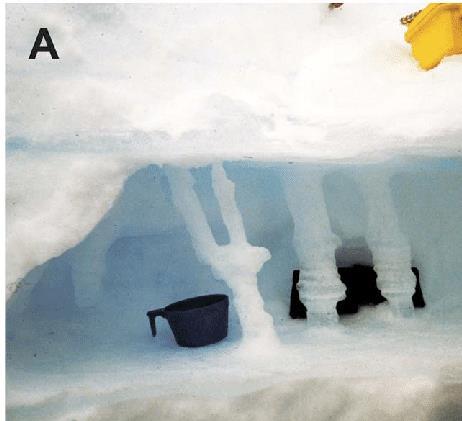
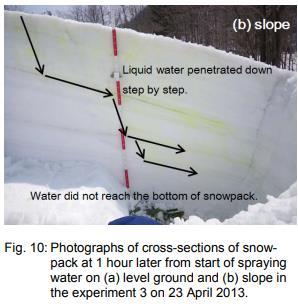
Used surface dye to track the water. Previously wetted snow - dye penetrated a 2m snowpack in a few minutes
New snow- dye penetrated upper 5-10cm in a hour
Water flowed in channels
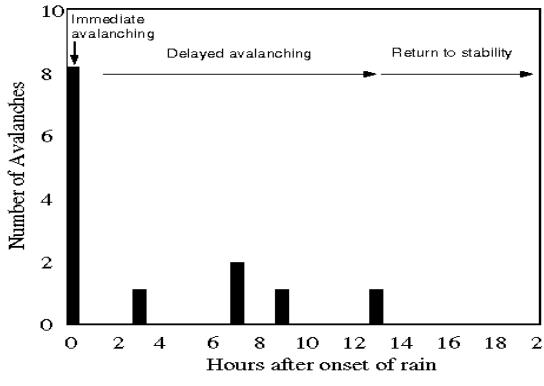
Water spreads laterally within layers that were initially low–density snow or at boundaries where fine grained snow overlay coarse grained snow. This contrasts an earlier idea that it was just at ice boundaries
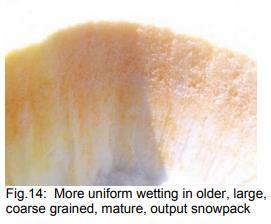
Surface changed during water infiltration.
Snow in the channel densifies faster than the dry snow outside the channel
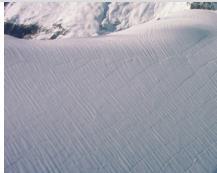
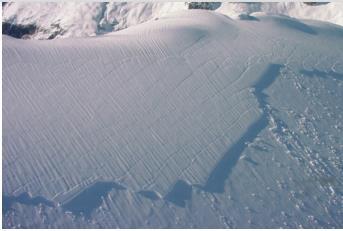
Runnels become visible on the surface.
Channels enlarged and coalesced, making coarse grained and relatively homogenous snowpack in 24-48hrs. Surface becomes uniform.
Adam Brown*

Adam Brown*

To forecast immediate avalanches, you need to know when it is rainingwx stations
To forecast delayed avalanches, you need to know the stratigraphy–get digging to find either coarse relatively homogenous snow or layered snow.
The two most complex problems associated with routing water through a snowpack involve flow interactions with layers in the snowpack and concentrations of flow in distinct channels.
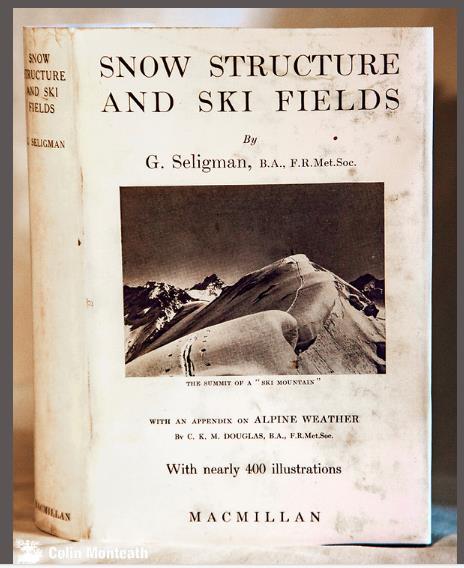
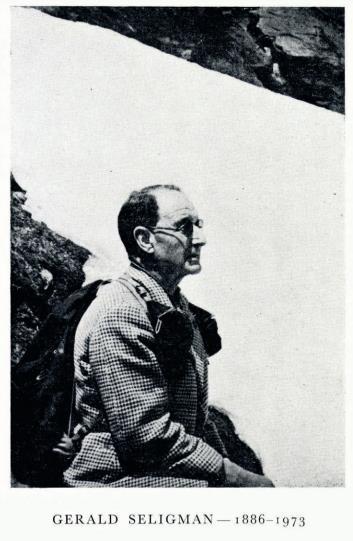
Both of these phenomena were described in the Alps half a century ago (Seligman 1936).
Being heavier and stickier, they develop more friction and therefore travel at a slower pace.
An alert skier can outrun them, and the principal hazard is to fixed installations
Gerdel,
R.W.
(1954), The transmission of water through snow, Trans. Am. Geophys. Union, 35(3): 475-485
Gerdel (1954) showed with dye tracing experiments that large spatial inhomogeneities may exist within snow after rain. He described vertical drainage tubes, subsurface as well as surface channels, through which liquid water preferentially drained.
OBSERVATIONS RELATING TO WET SNOW STABILITY H. Conway, Steve Breyfogle and Craig R. Wilbour 1988
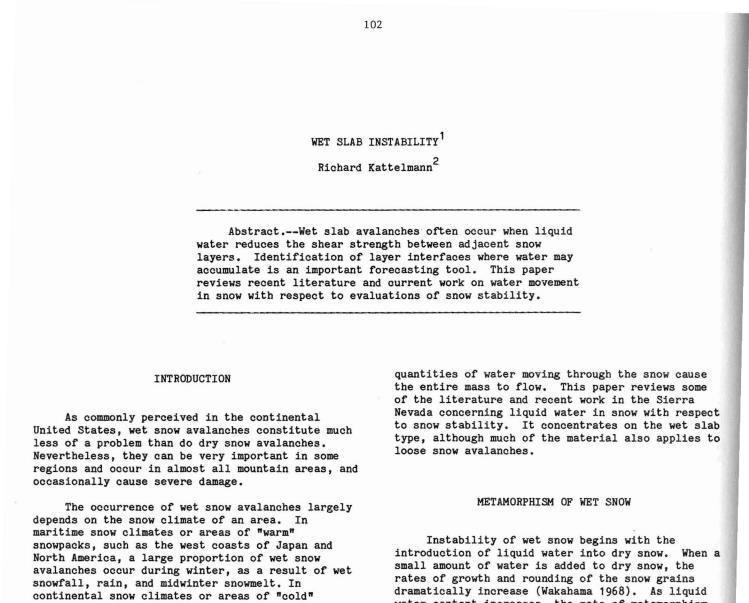
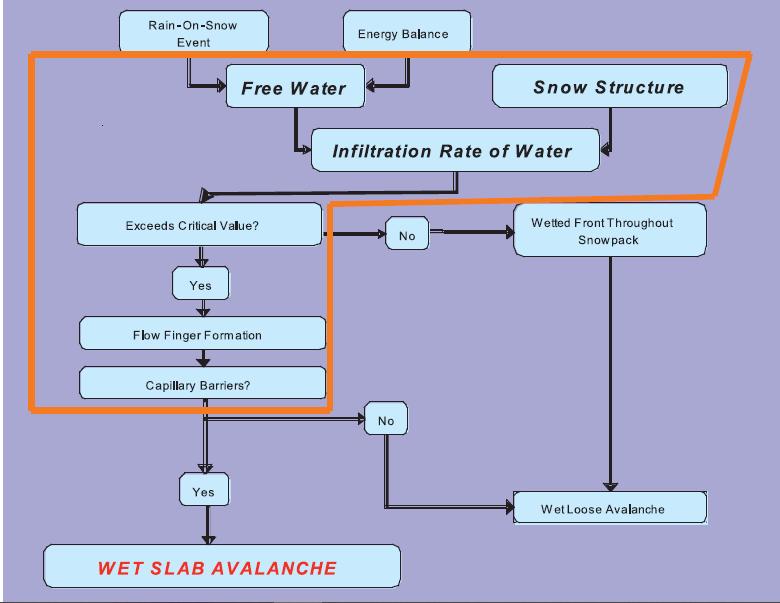
A conceptual model is a representation of a system. It consists of concepts used to help people know, understand, or simulate a subject the model represents. In contrast, a physical model focuses on a physical object such as a toy model that may be assembled and made to work like the object it represents.
Very readable, print this out for your staff.
What do we REALLY know about them
• How much has it been skied or settled, are there layers?
• Has the snow been rained on, when? How much? Did water get to ground?
• Did it refreeze?
• What has happened since- is there more snow?
• Will it be warm?
• Will it get warmer or colder?
• Will there be sun?
• will there be cloud?
• Will there be wind?
• What aspects and elevations are going to get cooked?
• What aspects and elevations and slopes won’t get cooked?
• What will be above me? Will that get cooked?
•Is it what I
•Where is the freezing line?
•How thick is the frozen snow layer?
•How wet is the snow underneath?
• Is the day shaping up like I thought?
• Am I in the same terrain as I planned?
• Is it warming up or cooling down?
• Am I getting more or less ski or foot penetration than half an hour ago?
• Is the corn getting boggy or staying just right?
• Is anything running?
• Is anything stepping down?
Keep going
Go colder
Go flatter
Go home

Jordy Hendrikx, Jerry Johnson, Andrea Mannberg, John Sykes, Diana Saly, Håvard Larsen, Andrew Schauer


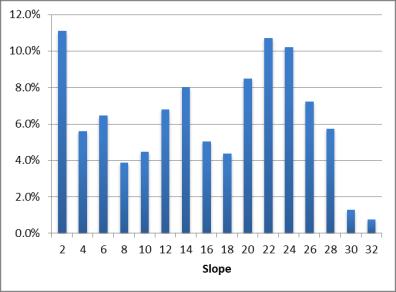
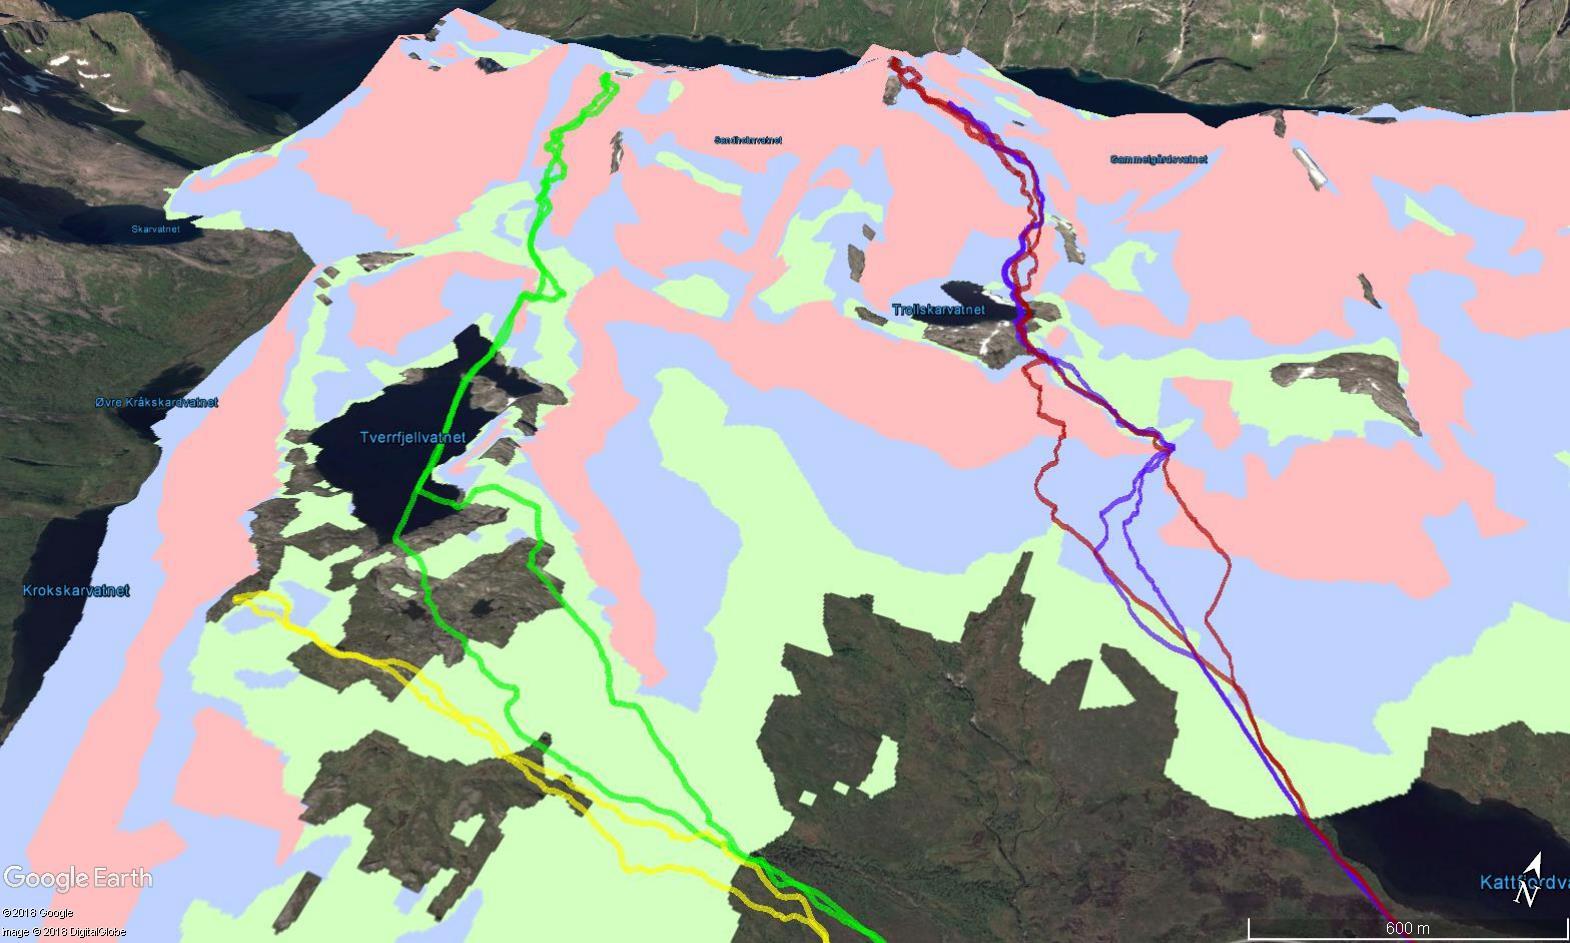
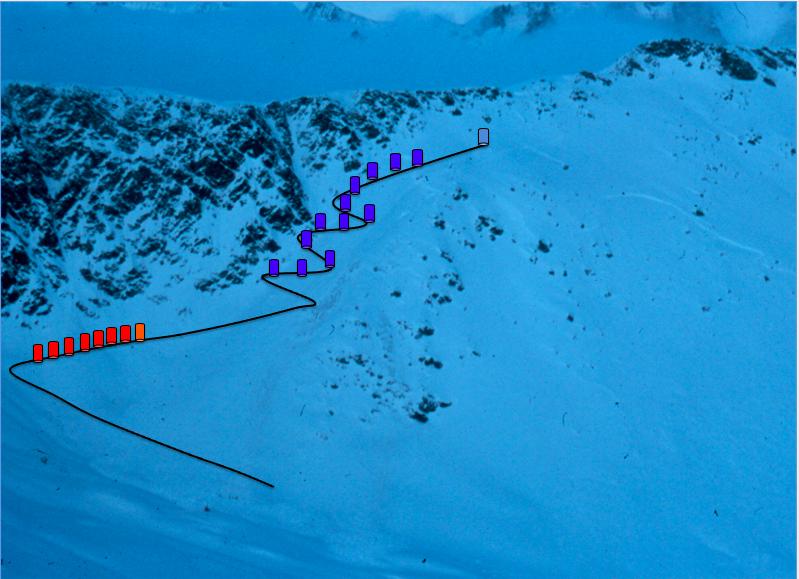
• Even under the most challenging circumstances, careful terrain selection can reduce your avalanche risk.
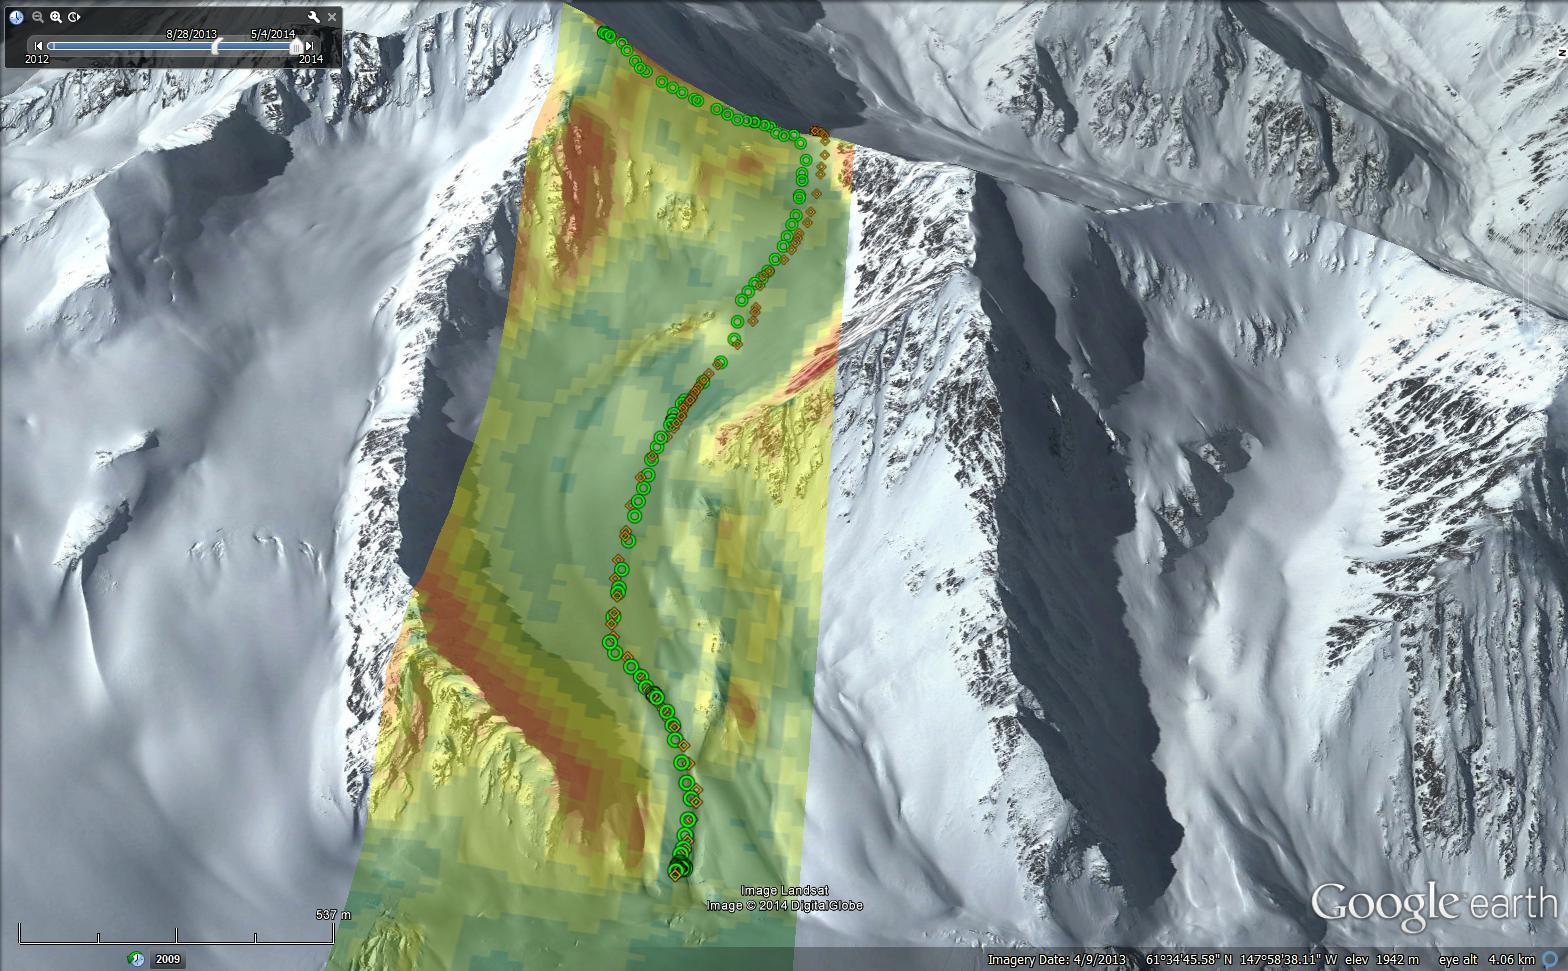
• We have taken a geo-spatial view:
-> Your track is the geographic expression of the sum of your choices.
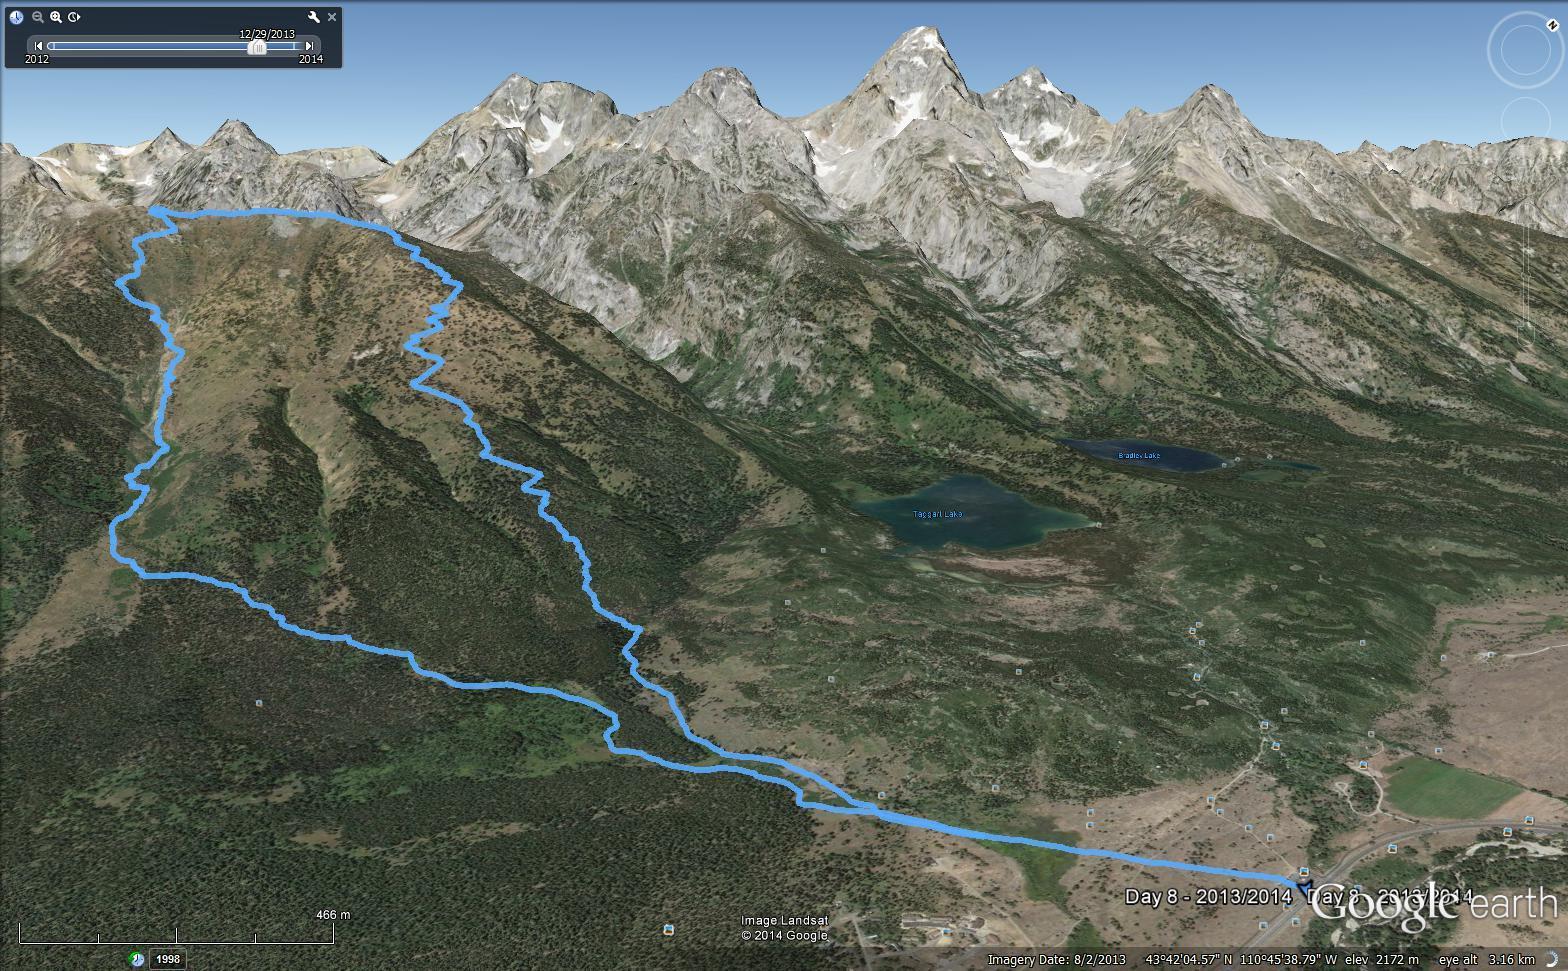
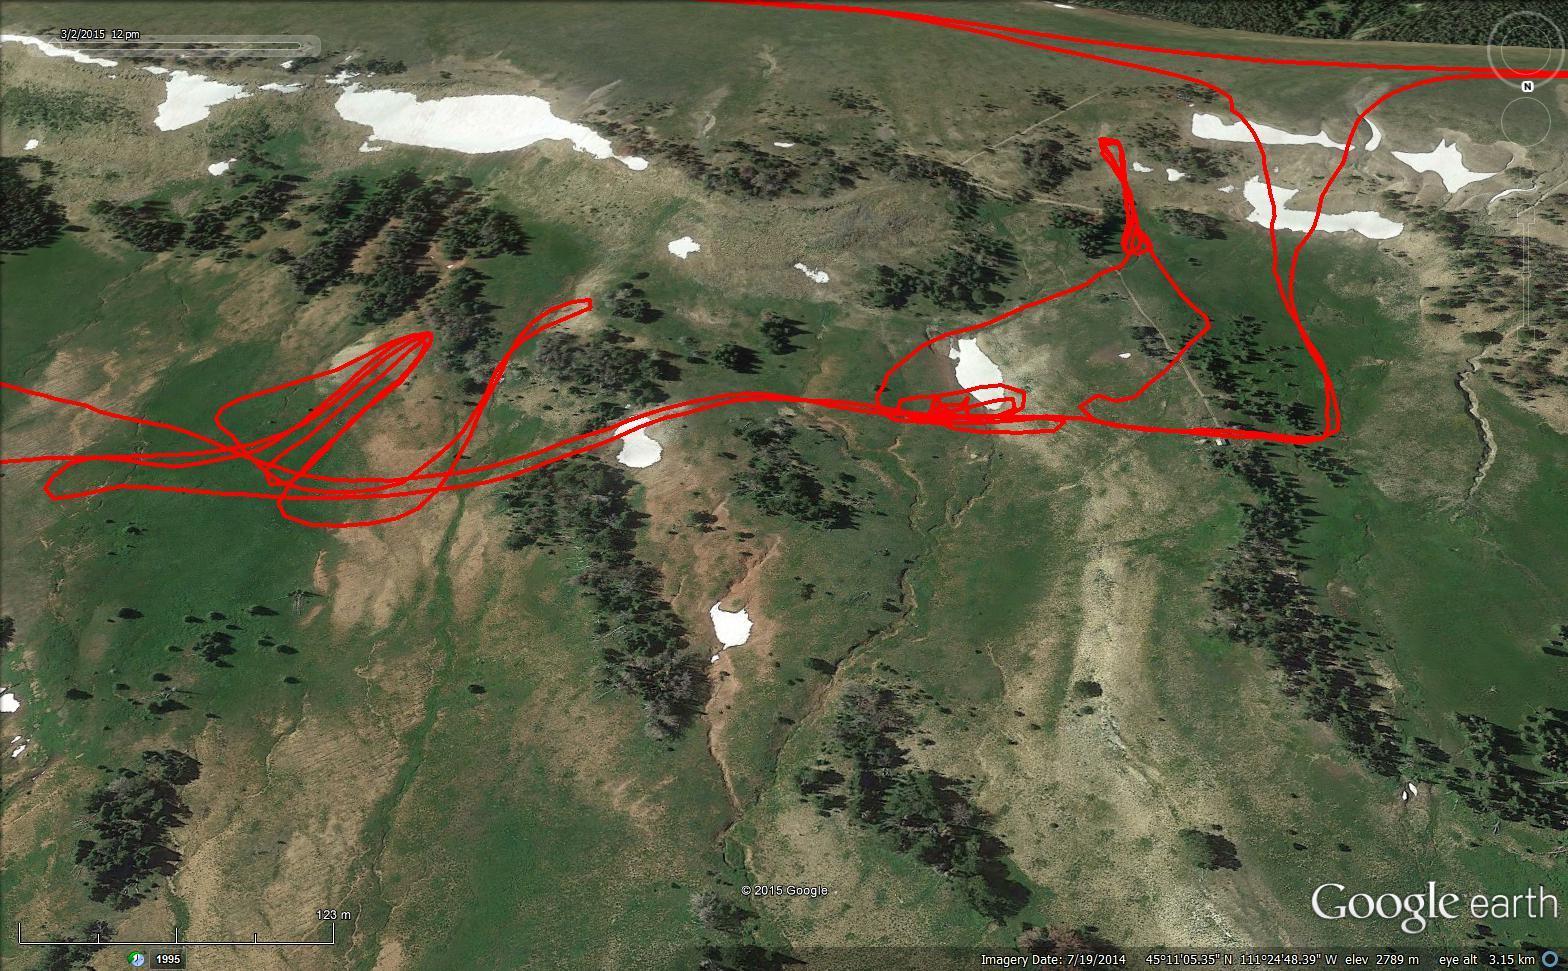
Sometimes its less obvious…

• Most accident analysis looks at the result, i.e When the risk margin was exceeded
• Our approach is trying to understand the reasons and the patterns of risky behavior
• Result in targeted education
• Who, when, where and why?
= How can we do this?


#1. Hendrikx, J. Johnson, J., and Shelly, C., (2016). Using GPS tracking to explore terrain preferences of heli-ski guides. Journal of Outdoor Recreation and Tourism, 13, 34-43. http://dx.doi.org/10.1016/j.jort.2015.11.004
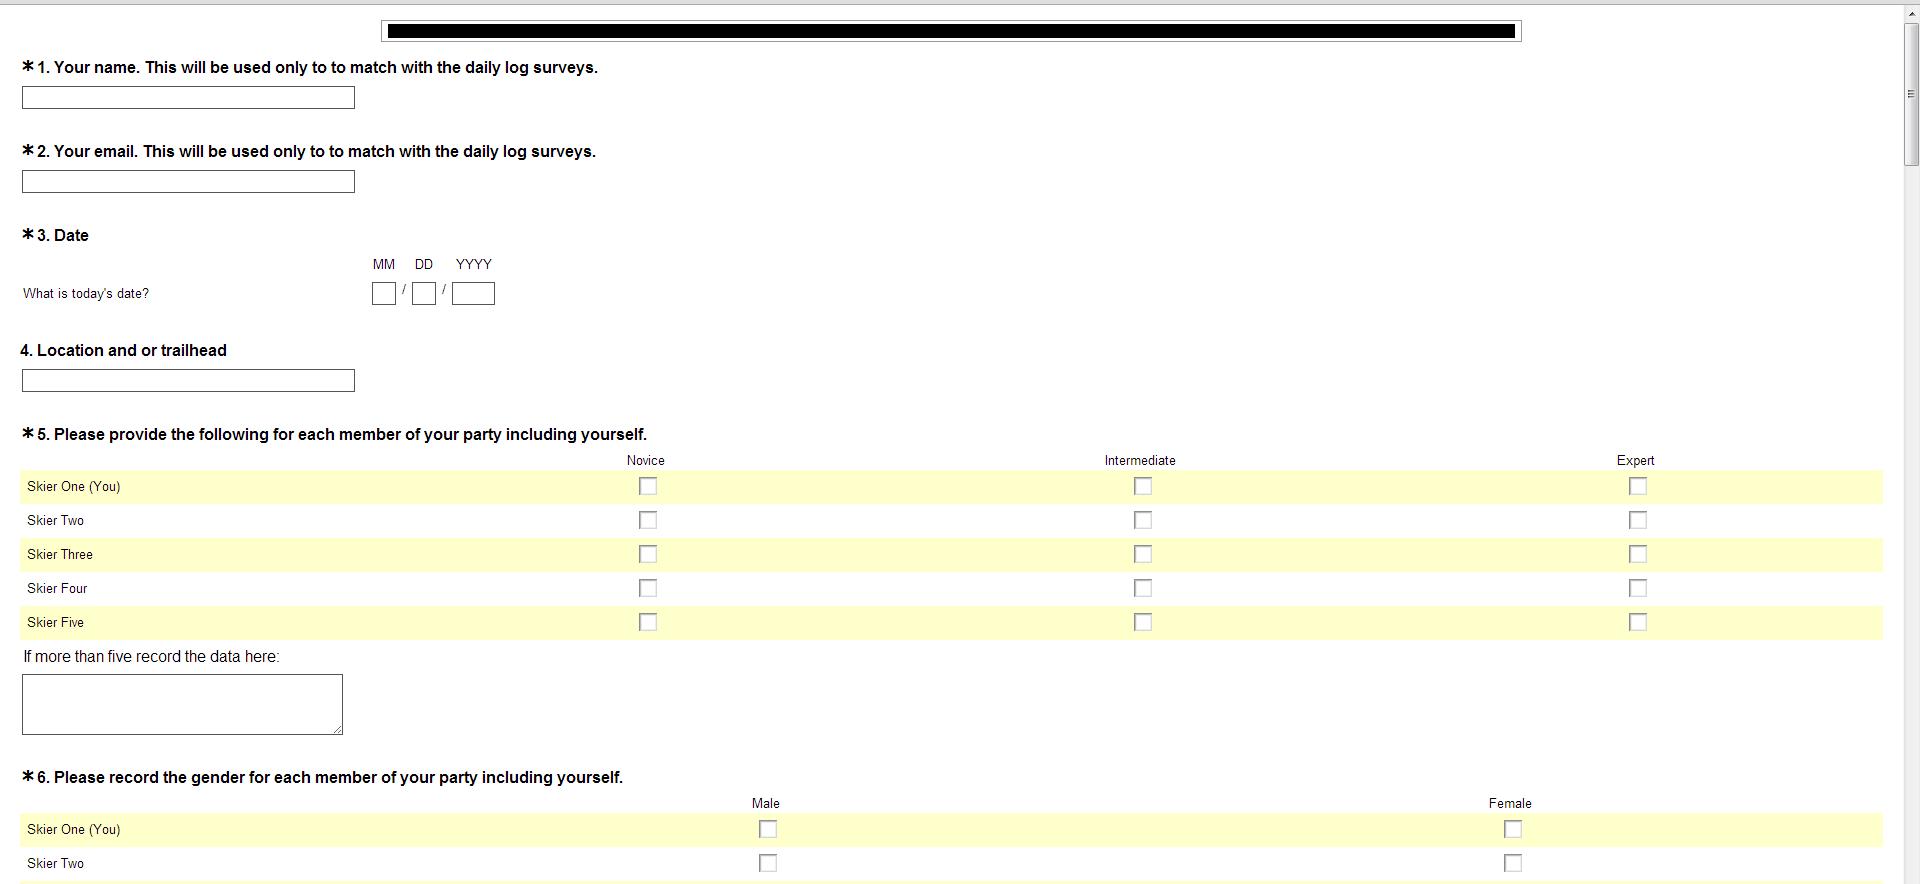
#2. Hendrikx, J., Johnson, J., & Mannberg, A. (2022). Tracking decision-making of backcountry users using GPS tracks and participant surveys. Applied Geography, 144, 102729.


#3. Sykes, J., Hendrikx, J., Johnson, J., Birkeland, K., 2020. Combining GPS tracking and survey data to better understand travel behavior of out-of-bounds skiers. Applied Geography, 122, 102261. https://doi.org/10.1016/j.apgeog.2020.102261
Gender
Avalanche Education
Mitigation perception


#3. Sykes, J., Hendrikx, J., Johnson, J., Birkeland, K., 2020. Combining GPS tracking and survey data to better understand travel behavior of out-of-bounds skiers. Applied Geography, 122, 102261. https://doi.org/10.1016/j.apgeog.2020.102261


#4. Saly, D., Hendrikx, J., Birkeland, K., Challender, S., Johnson, J., 2020. Using time-lapse photography to document terrain preferences of backcountry skiers. Cold Regions Science and Technology, 172, 102994. https://doi.org/10.1016/j.coldregions.2020.102994
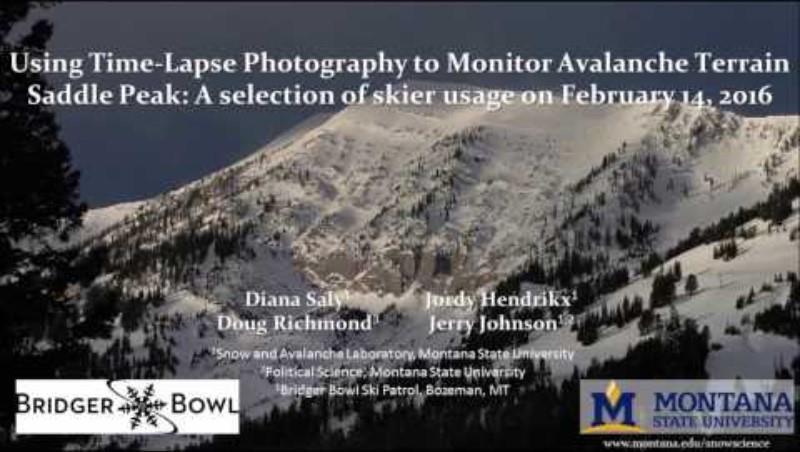
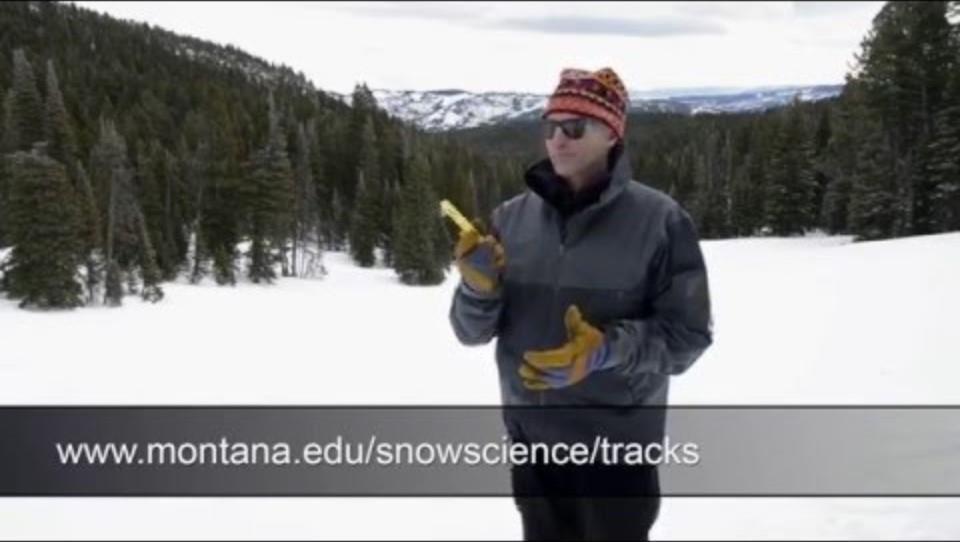
31,966 images

7,499 skier points

Regional Danger Rating

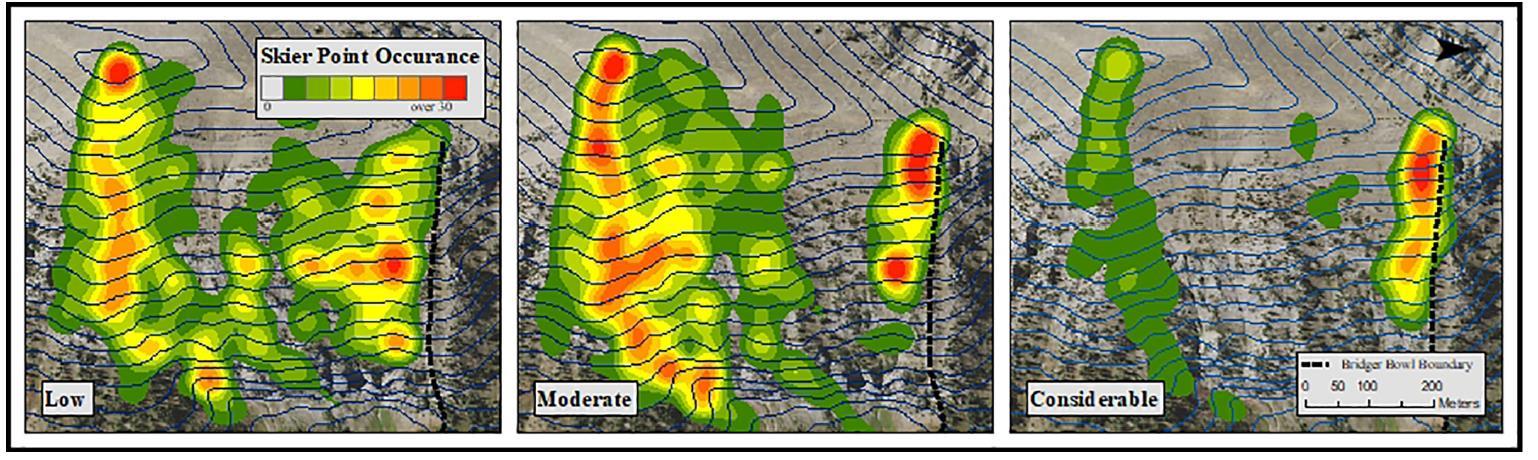
#4. Saly, D., Hendrikx, J., Birkeland, K., Challender, S., Johnson, J., 2020. Using time-lapse photography to document terrain preferences of backcountry skiers. Cold Regions Science and Technology, 172, 102994. https://doi.org/10.1016/j.coldregions.2020.102994

• Attitudes and perception of risk predict hypothetical choices in avalanche terrain.
• Riders accept to ski terrain that is riskier than their most preferred run
#5. Mannberg, A., Hendrikx, J., Landrø, M., Stefan, M.A., 2018. Who's at risk in the backcountry? Effects of individual characteristics on hypothetical terrain choices. Journal of Environmental Psychology, 59, 46-53.
https://doi.org/10.1016/j.jenvp.2018.08.004


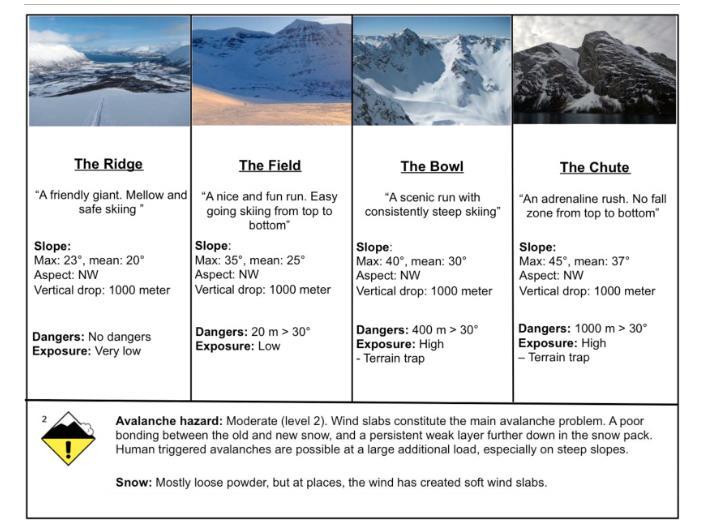
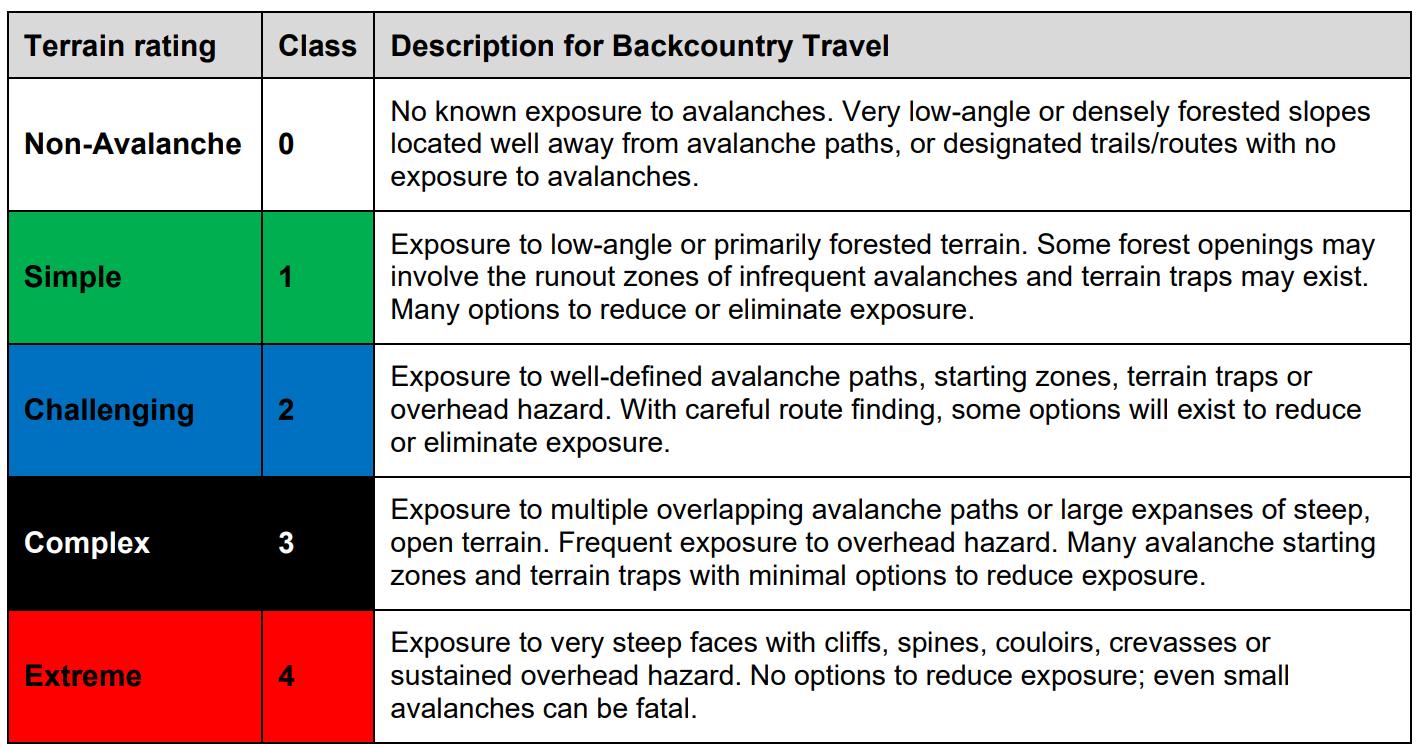
Avalanche risk is the probability or chance of harm resulting from interactions between avalanche hazard and a specific element(s) at risk.
Avalanche risk is determined by the exposure of that element, and its vulnerability to the avalanche hazard (Statham, 2008)
We know the hazard..
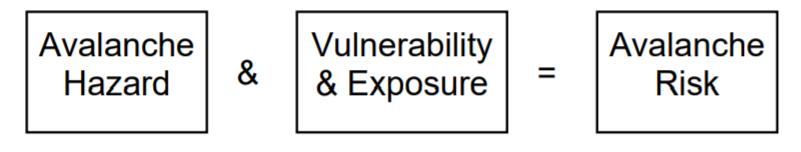


How do we relate this back to terrain use?


One approach:
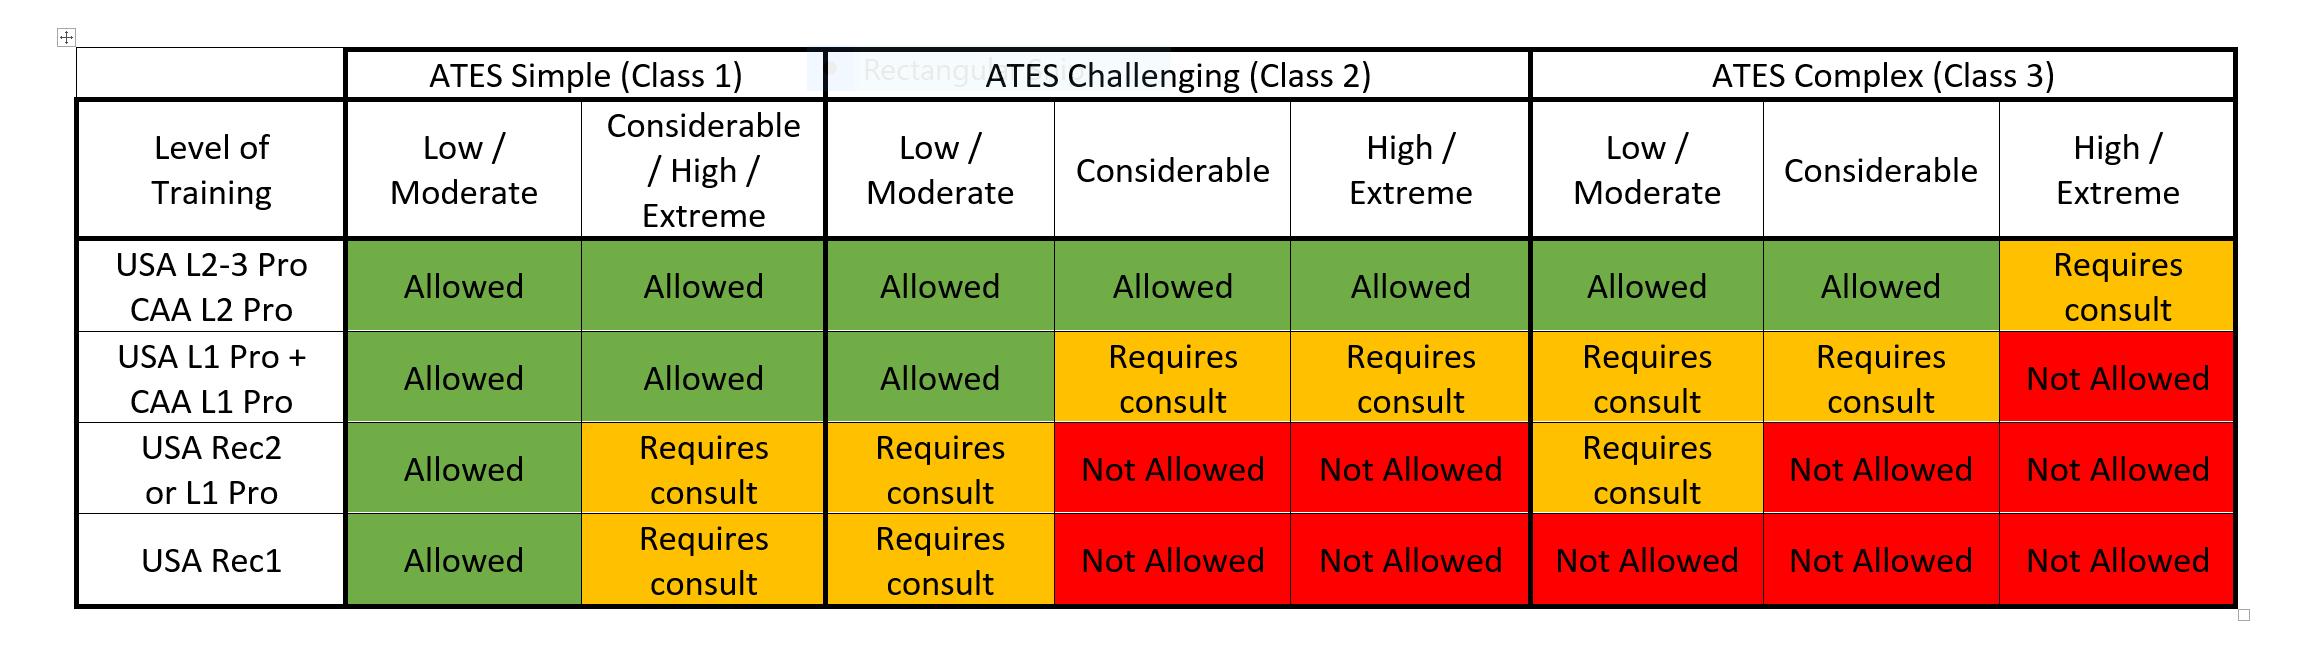
Modified from Table 7.1: Canadian Avalanche Association. (2016). Technical Aspects of Snow Avalanche Risk Management ─ Resources and Guidelines for Avalanche Practitioners in Canada. Revelstoke, BC, Canada: Canadian Avalanche Association.

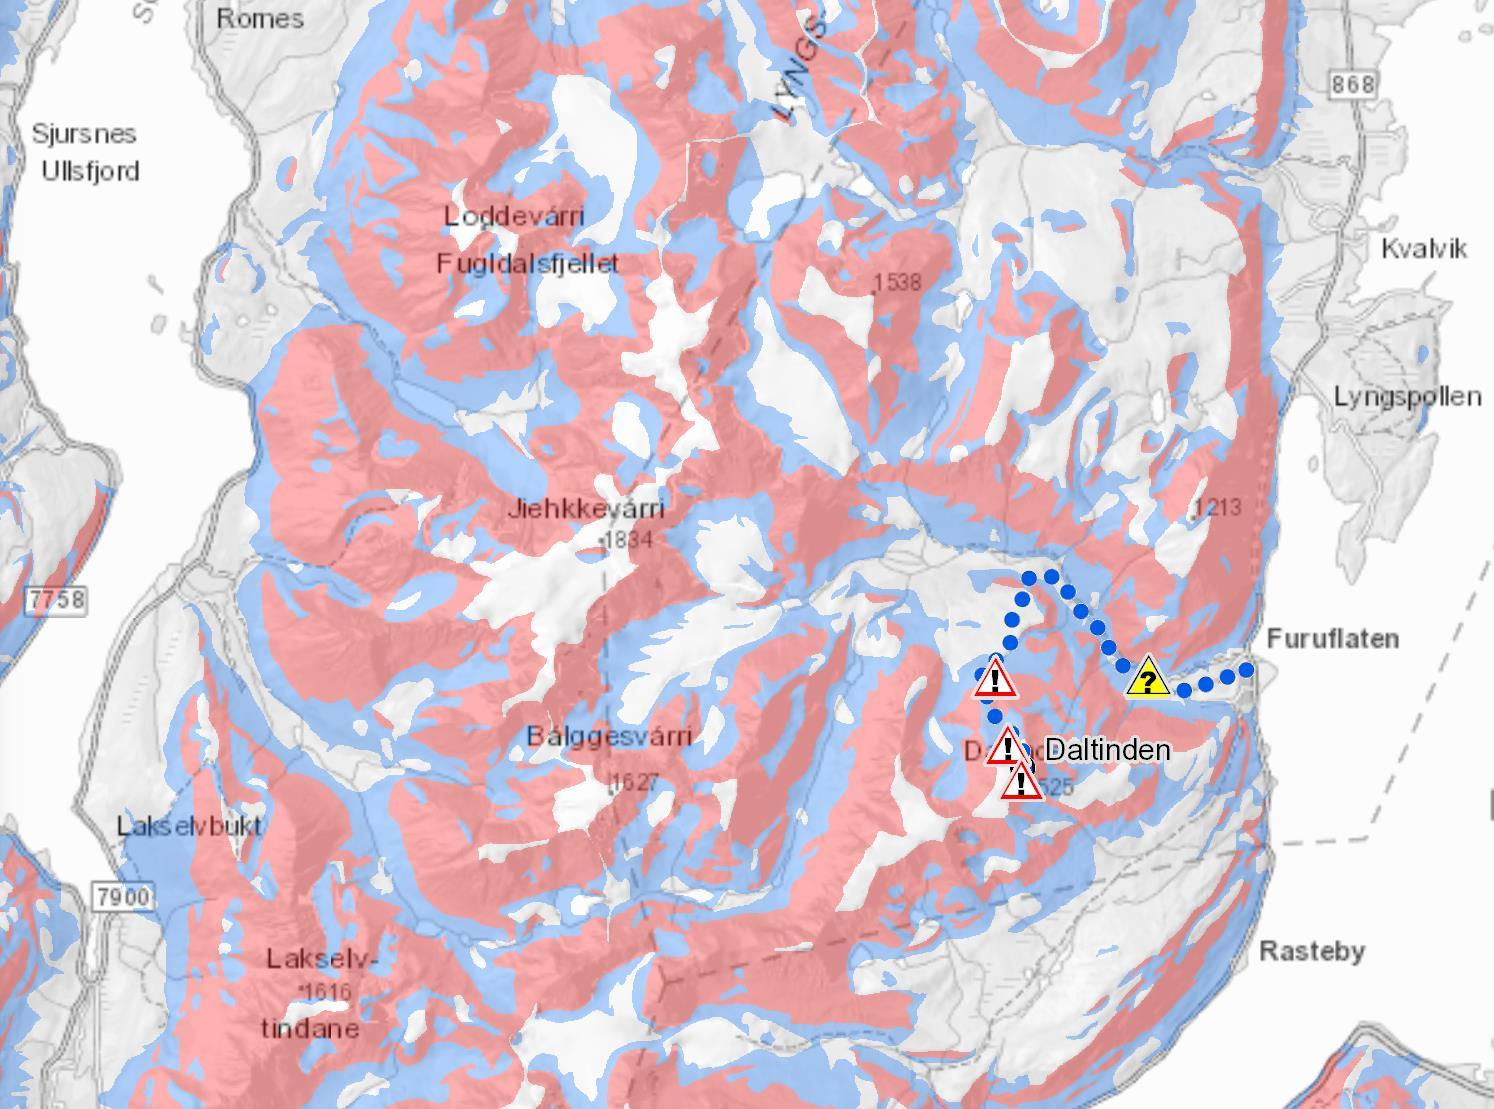
• Nationwide mapping in Norway: http://temakart.nve.no/link/?link=kast
• Beta-version for most forecast areas in North America.
#6. Larsen, H.T., Hendrikx, J., Slåtten, M.S., and Engeset, R.V., 2020. Developing nationwide avalanche terrain maps for Norway. Natural Hazards. https://doi.org/10.1007/s11069-020-04104-7

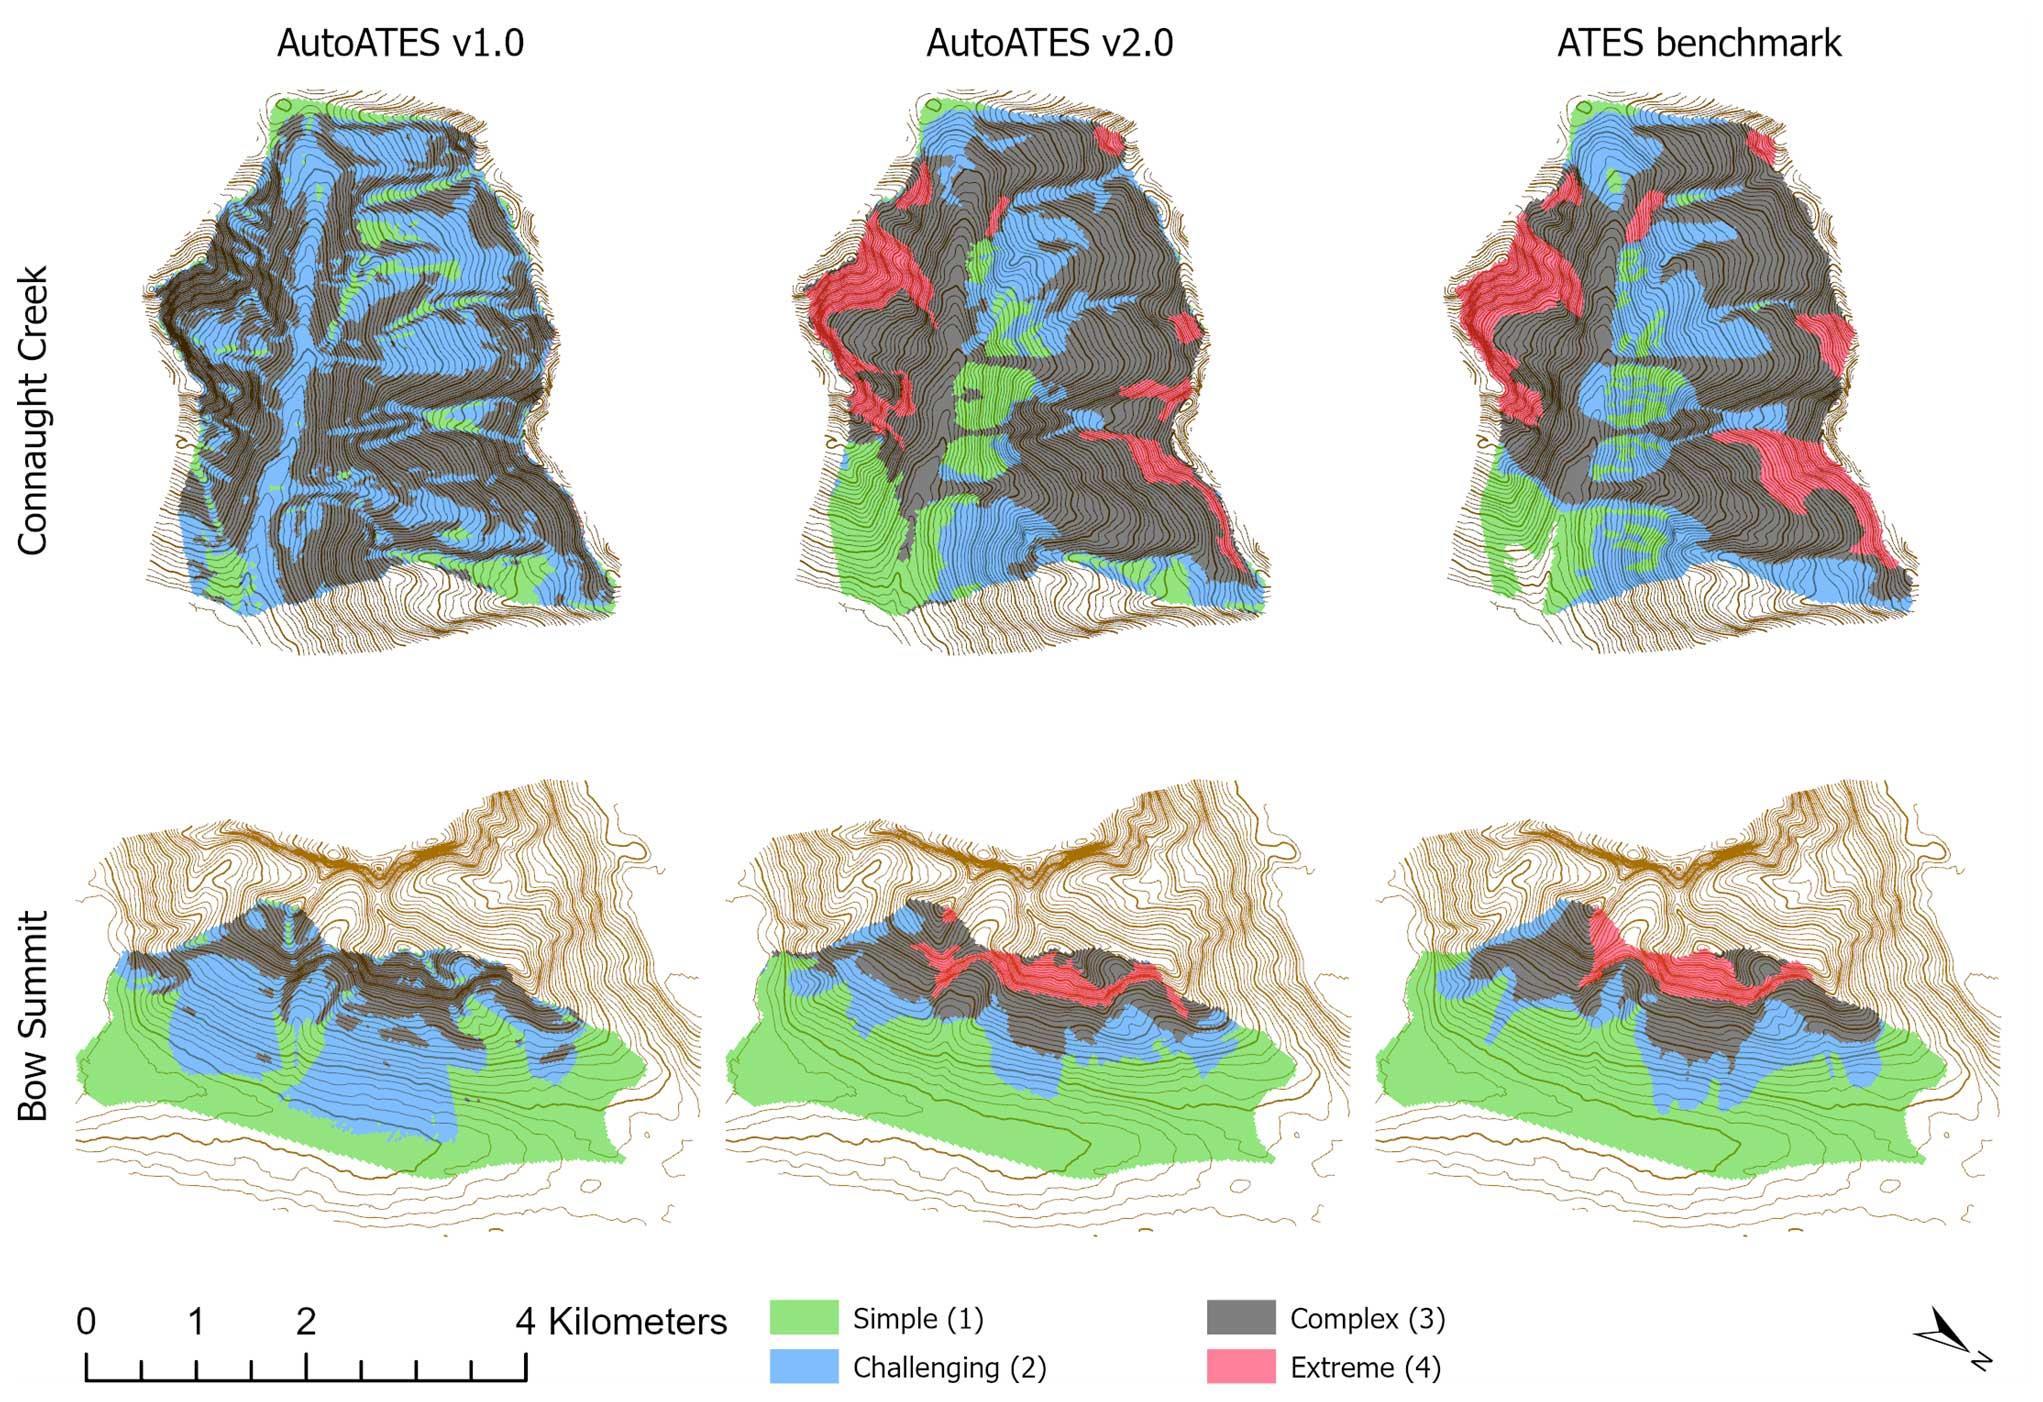
#7. Toft, H. B., Sykes, J., Schauer, A., Hendrikx, J., & Hetland, A. (2024). AutoATES v2. 0: Automated Avalanche Terrain Exposure
Scale mapping. Natural Hazards and Earth System Sciences, 24(5), 1779-1793.

Combine:
• Real-world tracks
• Hypothetical choice
• ATES Understand the who, where, and why of decision making in avalanche terrain.
➔CARE Panel:
10,000 skiers over 10years
www.uit.no/research/carepanel


What do you think your track say about your decision making? What does it say about the influence of your group? What does it say about your risk tolerance?


Jordy Hendrikx, Jerry Johnson, Andrea Mannberg, John Sykes, Diana Saly, Håvard Larsen, Andrew Schauer
There are many natural and human sources of infrasound
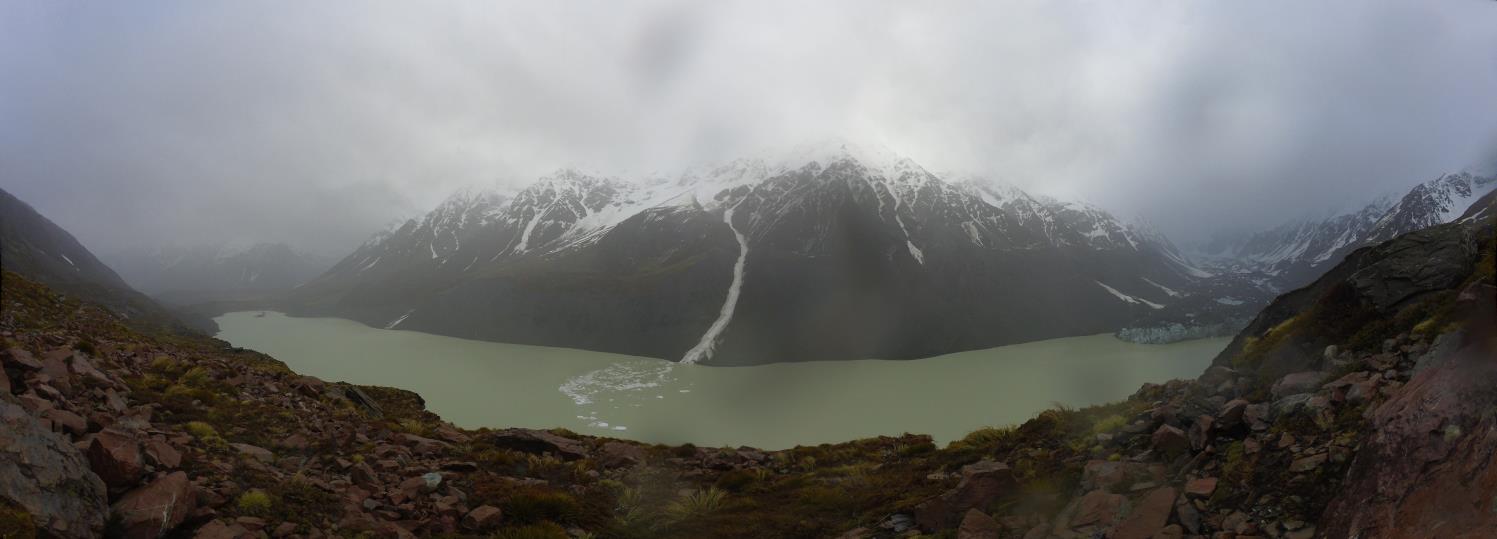
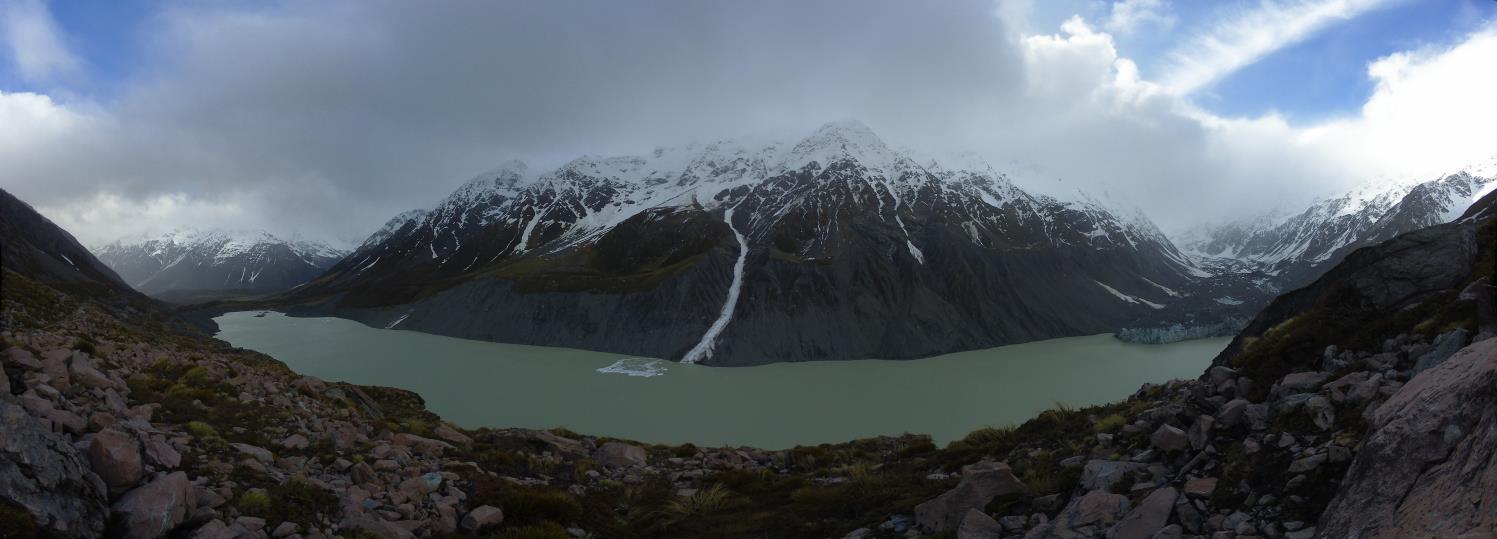
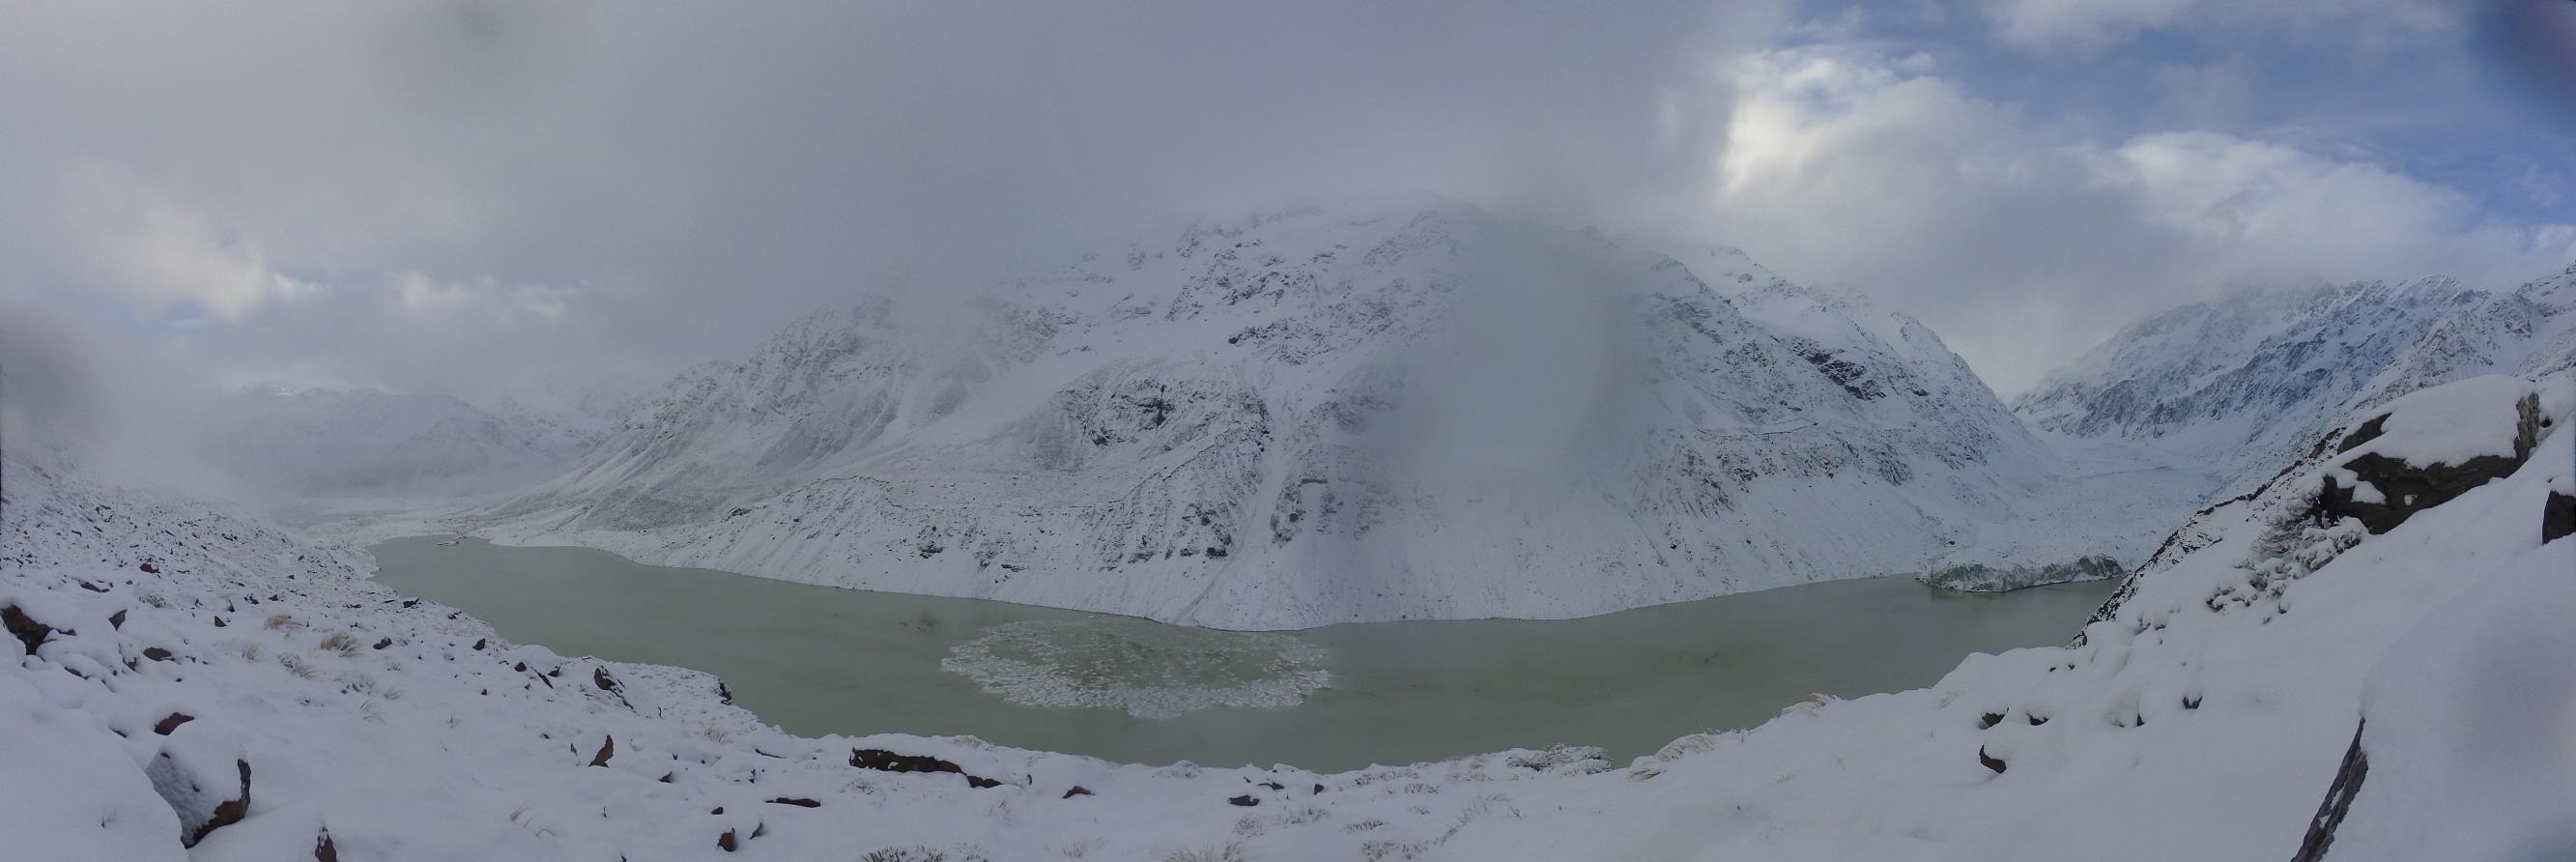
Infrasound observations of an avalanche in the Hooker Valley, Aoraki Mount Cook National Park in 2022
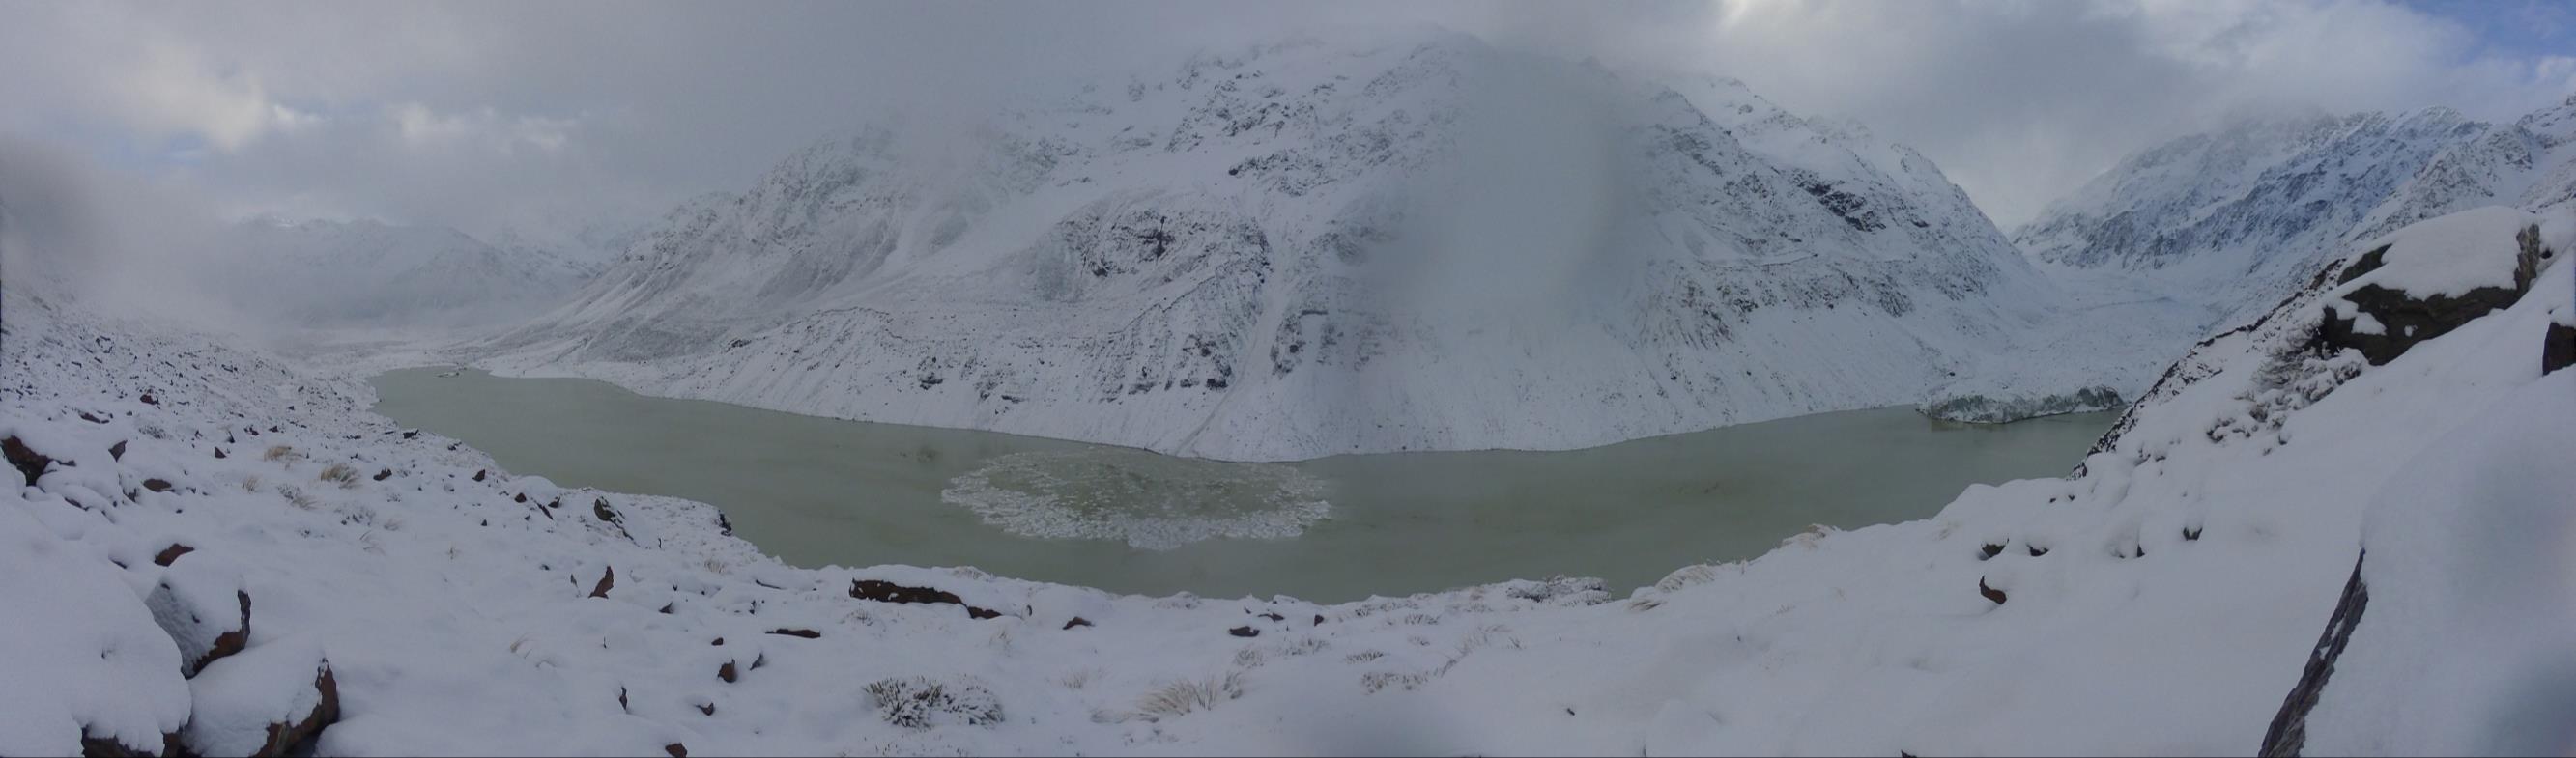
Infrasound observations of an avalanche in the Hooker Valley, Aoraki Mount Cook National Park in 2022
Infrasound complements existing avalanche monitoring technologies like visual cameras and radar systems
Benefits:
• Broad spatial coverage across whole valleys
• Works during night time and periods of low visibility
• Easier to do automatic processing than visual data
Challenges:
• Hard to relate infrasound observations to avalanche size, velocity, or style
• Challenging to distinguish between avalanches and other types of mass movements e.g., ice or rock fall, glacier calving
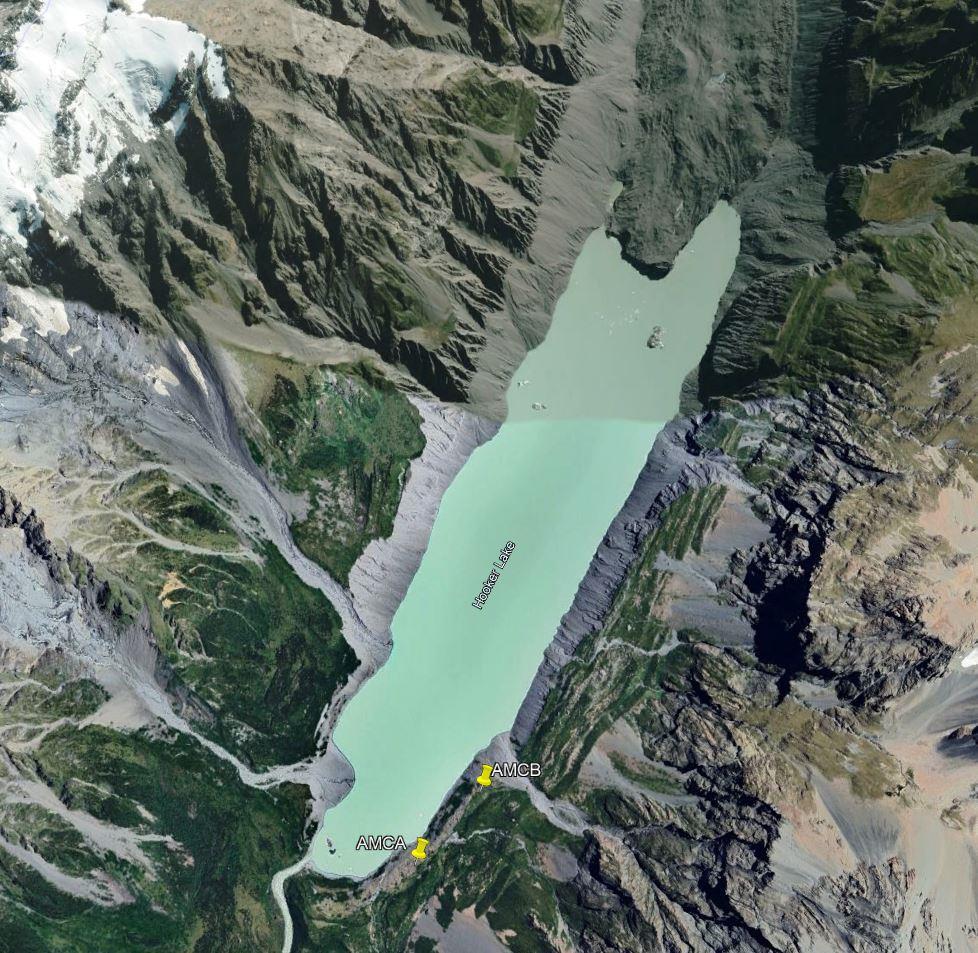
Collaboration with Aubrey Miller, University of Otago
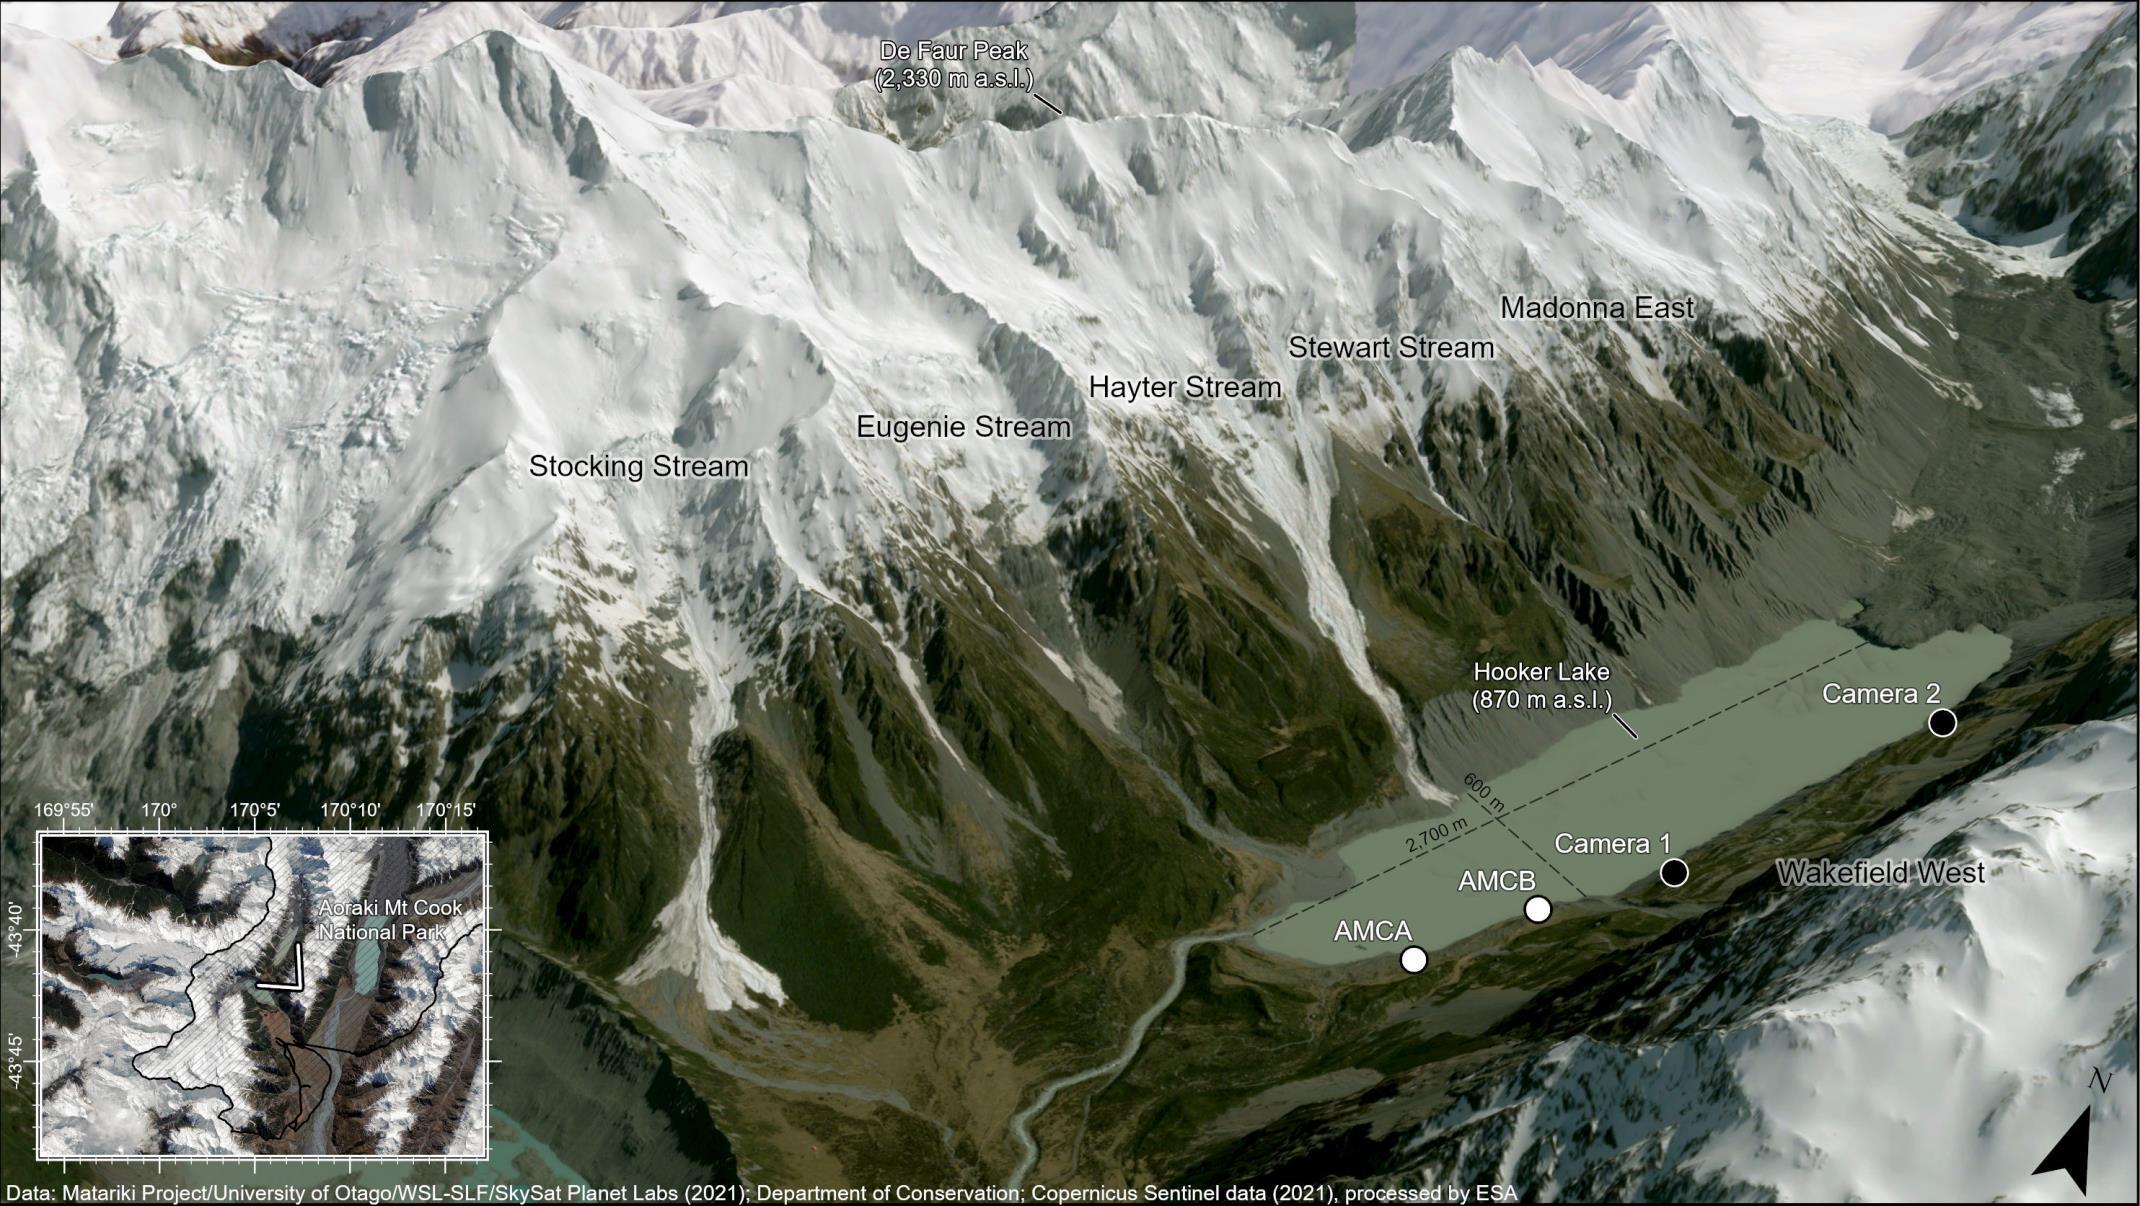
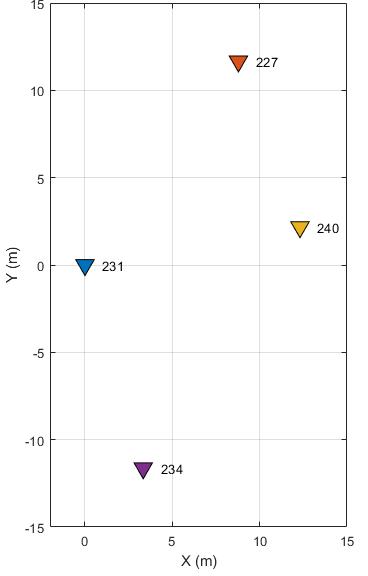
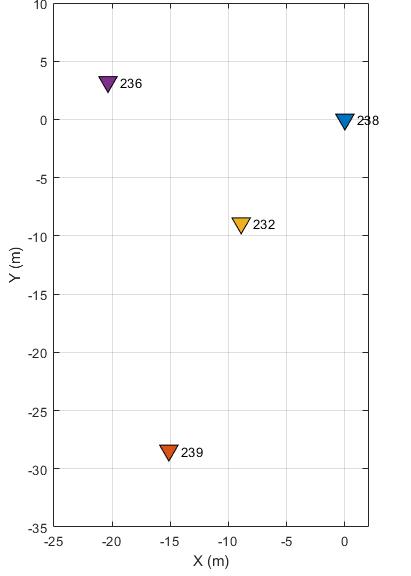
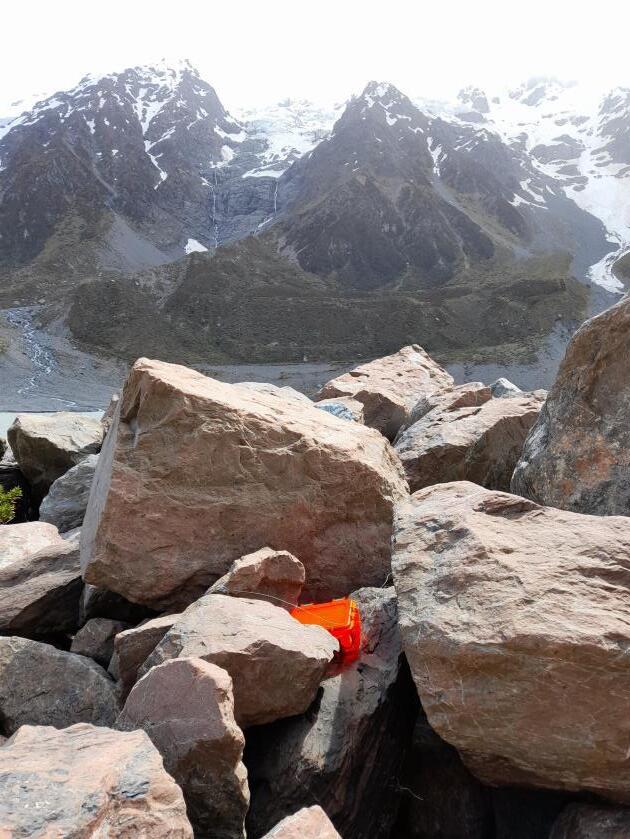
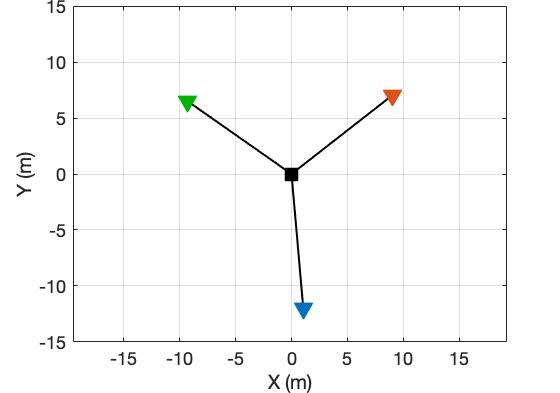
Deployed two infrasound arrays with four microphones each to complement time-lapse cameras
Recorded avalanches in Hooker Valley with cameras and infrasound
Deployed two infrasound arrays with four microphones each to complement time-lapse cameras
Recorded avalanches in Hooker Valley with cameras and infrasound
Deployed two infrasound arrays with four microphones each to complement time-lapse cameras
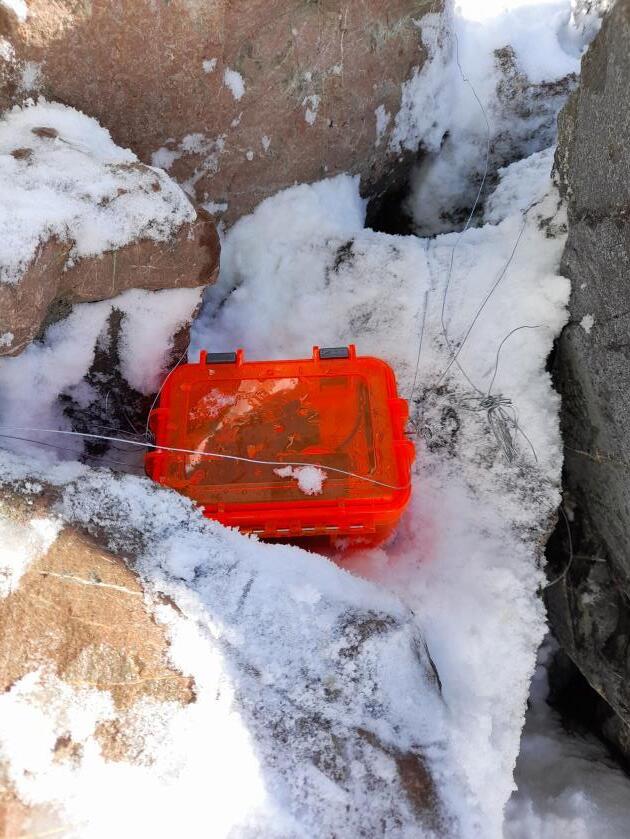
• Microphones are very small with integrated power system, GPS for timing, and data logger
• Data was manually downloaded and processed but there are ways to telemeter data and process in real-time
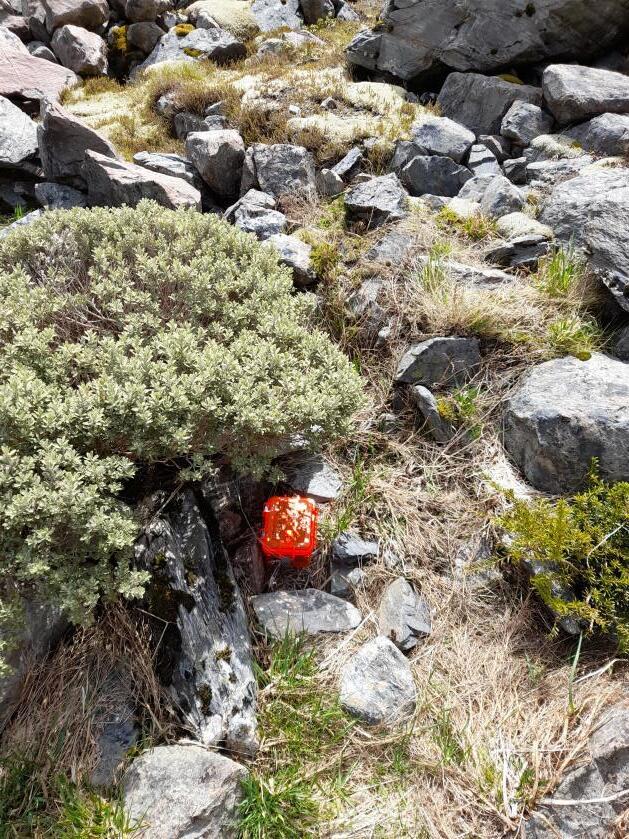
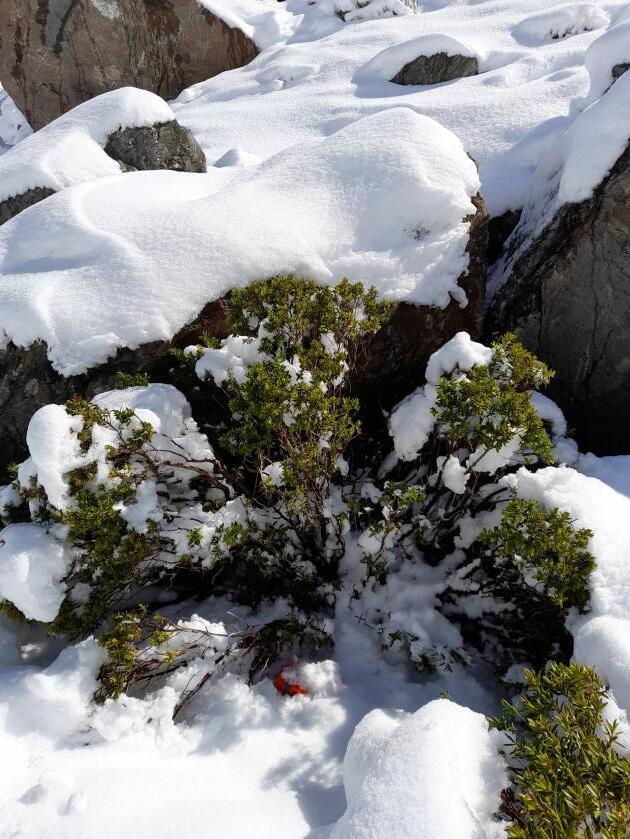
• Sensors are hidden under vegetation and rocks to reduce wind noise and keep equipment safe from people and kea
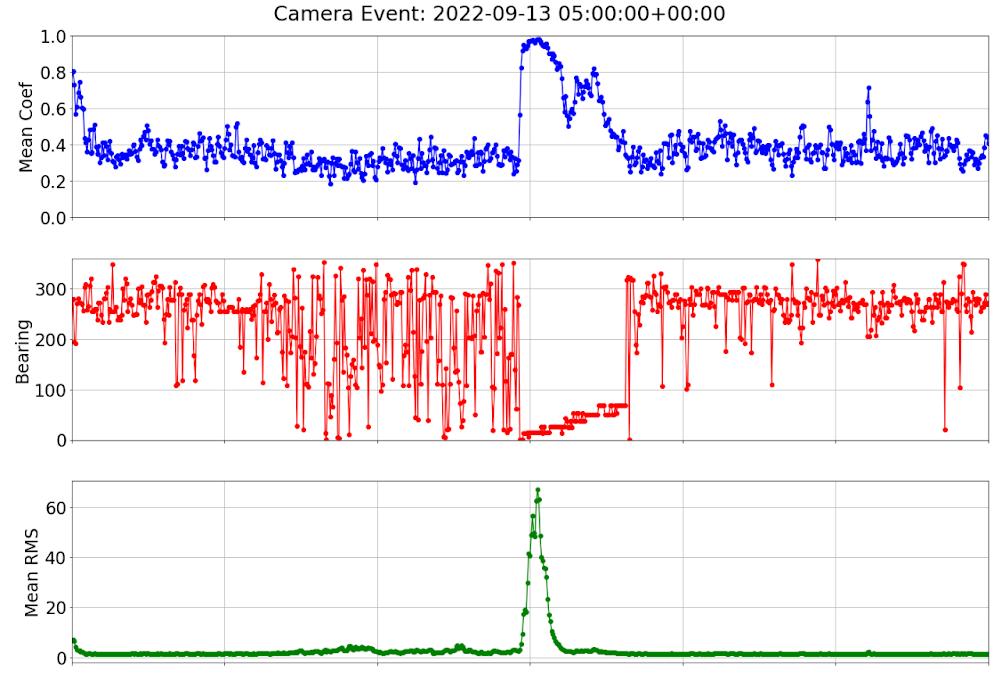
Cross correlation measures how similar two time series are to each other.
Avalanche signals are coherent across the different microphones and will have a high cross correlation whereas wind noise is incoherent and will have low cross correlation.
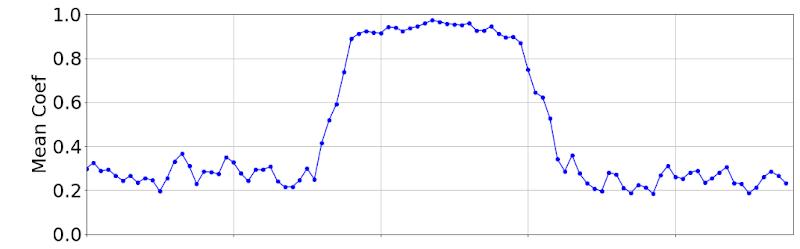
Low correlation before and after avalanche
High correlation during avalanche
Cross correlation measures how similar two time series are to each other.
Avalanche signals are coherent across the different microphones and will have a high cross correlation whereas wind noise is incoherent and will have low cross correlation.
Low correlation before and after avalanche
High correlation during avalanche
Back azimuth measures where the signal came from.
Calculated from the differential arrival times of signal across the different microphones.
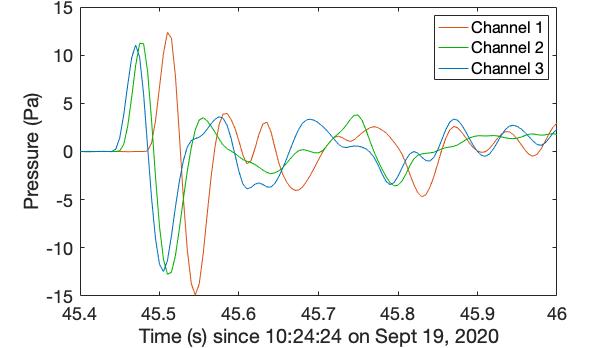
Propagation direction
Cross correlation measures how similar two time series are to each other.
Avalanche signals are coherent across the different microphones and will have a high cross correlation whereas wind noise is incoherent and will have low cross correlation.
Low correlation before and after avalanche
High correlation during avalanche
Back azimuth measures where the signal came from.
Calculated from the differential arrival times of signal across the different microphones.
Propagation direction
Slowness measures how fast the signal travel across the array.
This the inverse of velocity and relates to the elevation angle of the source
Apparent velocity is the inverse of horizontal slowness
Apparent slowness relates to sound speed and angle of incidence as measured from vertical
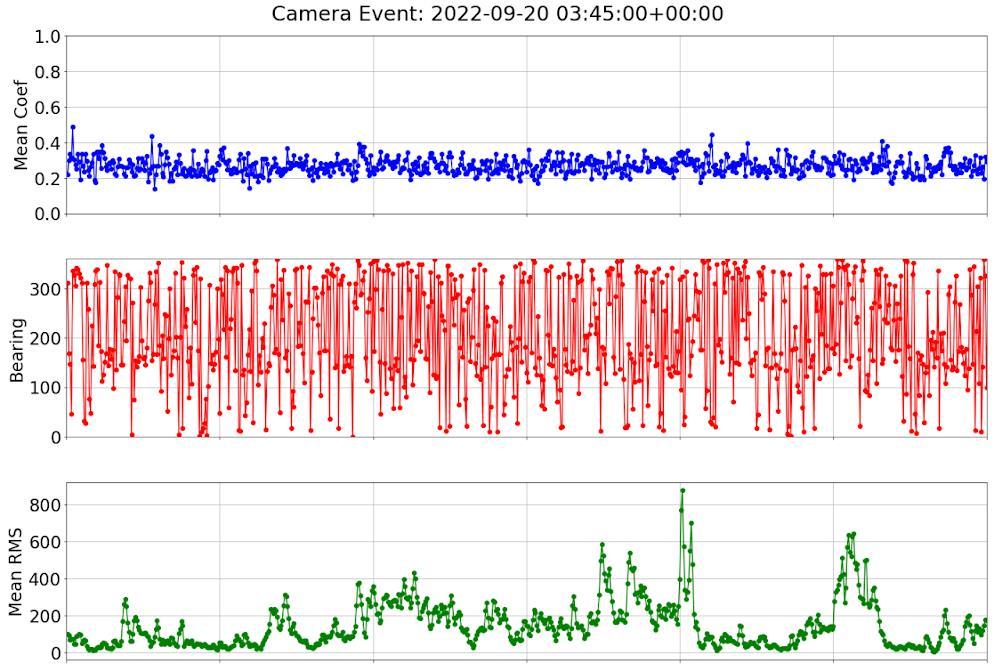
Filter the data based on:
• consistency threshold
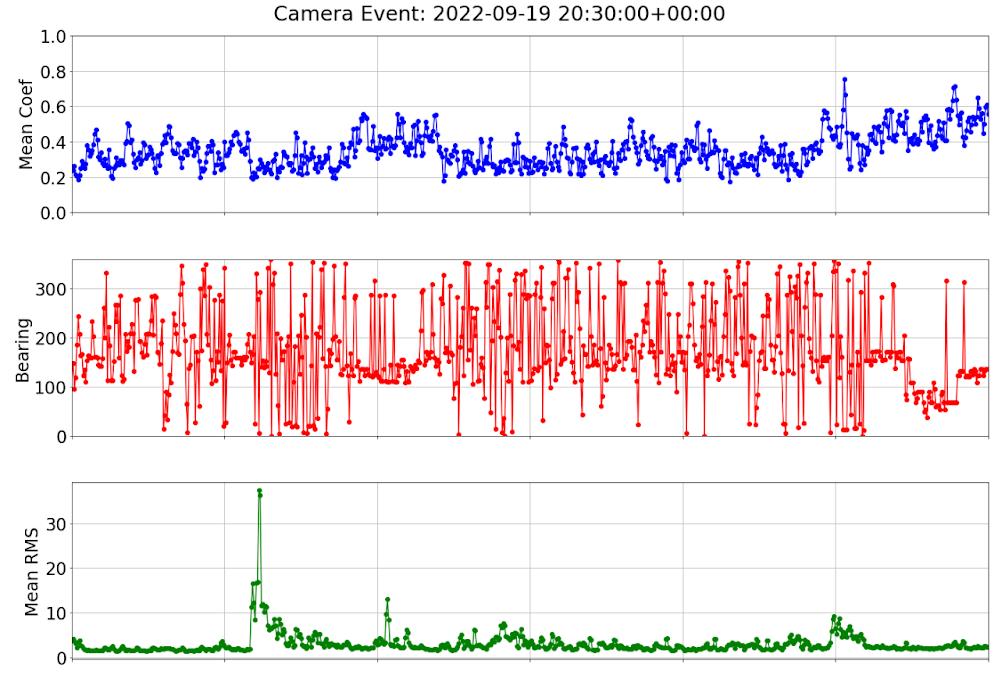
• mean cross correlation coefficient
• slowness to identify signals of potential avalanches or other mass movements
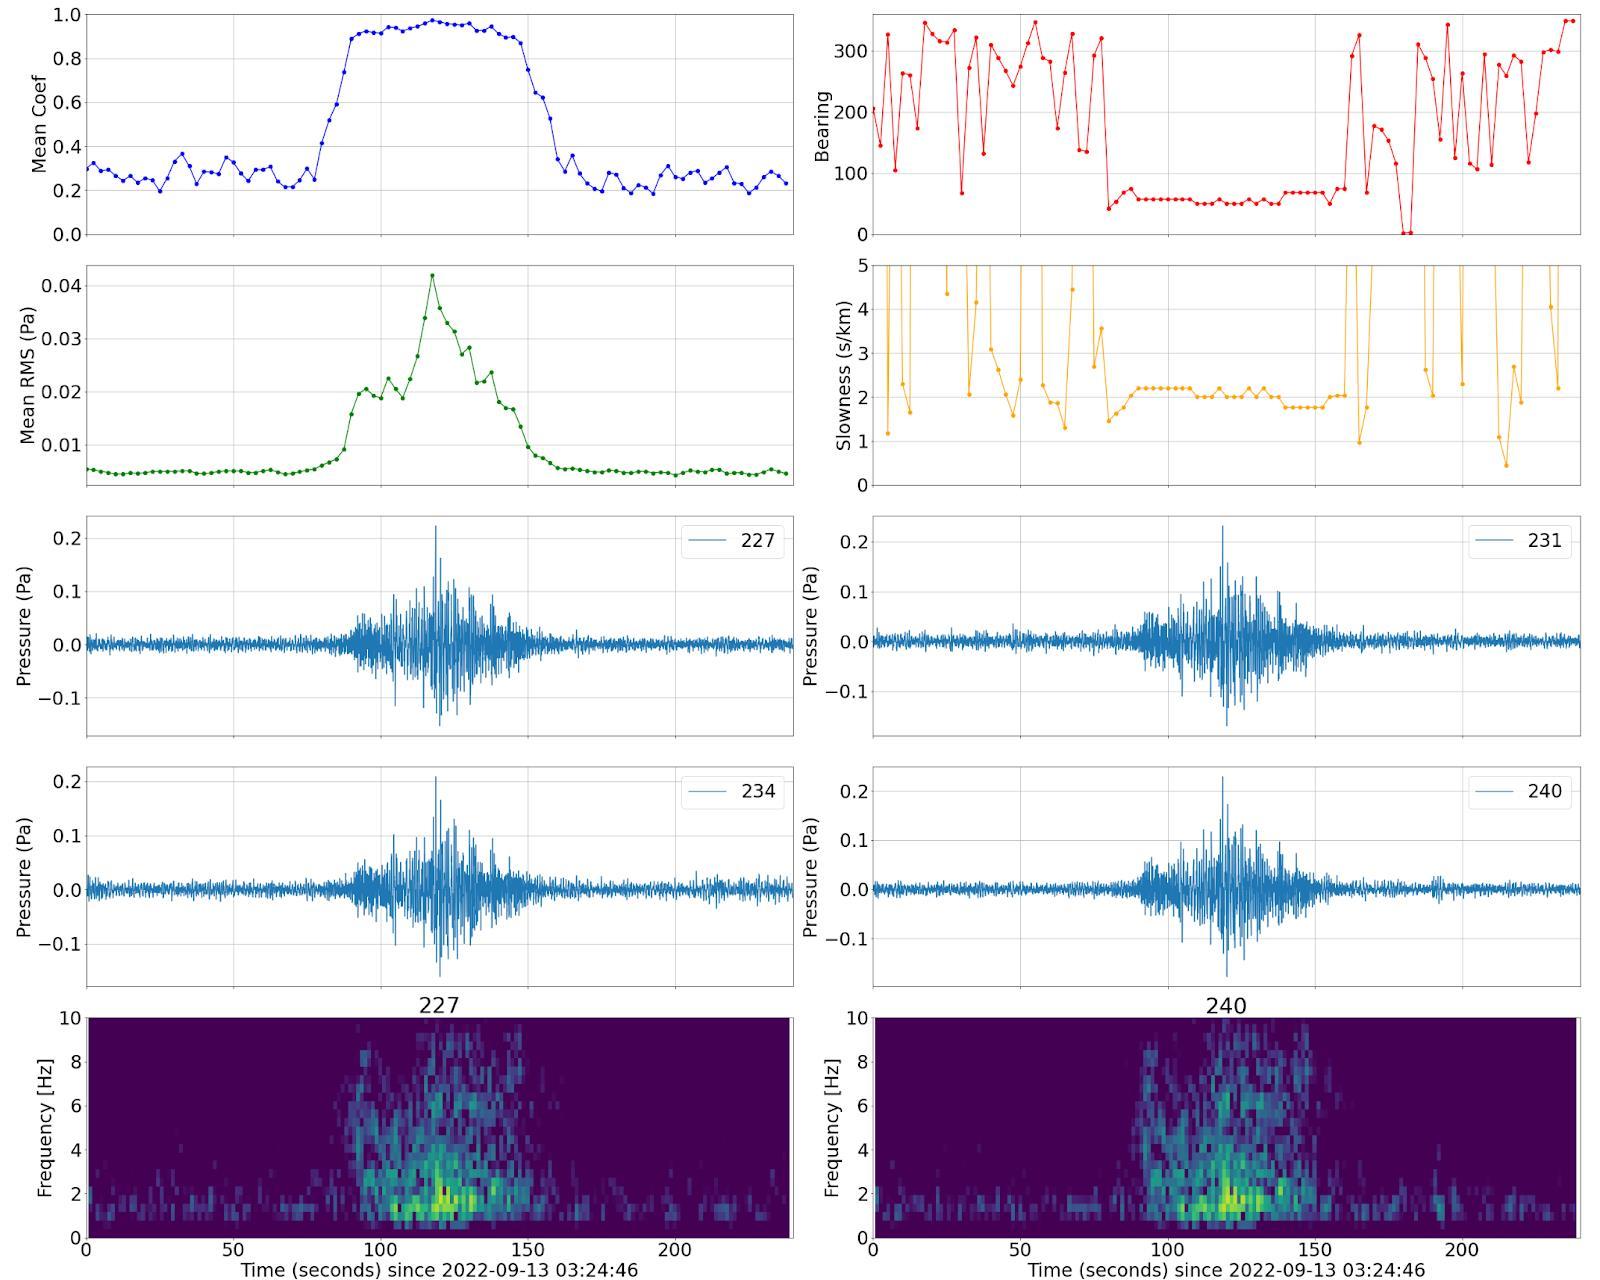
Cross correlation coefficient Slowness
Average pressure amplitude
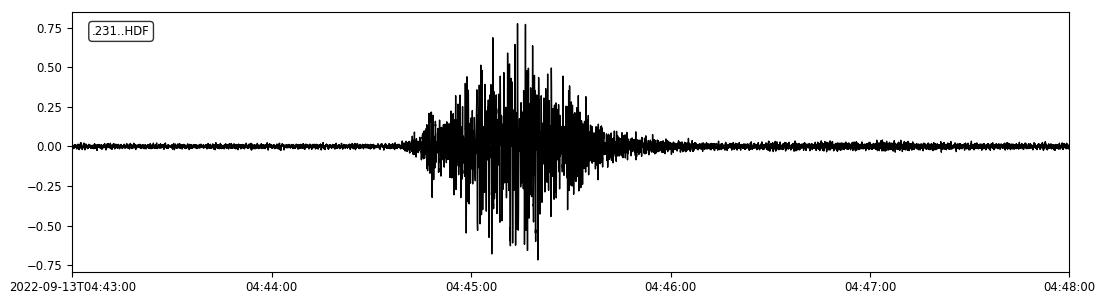
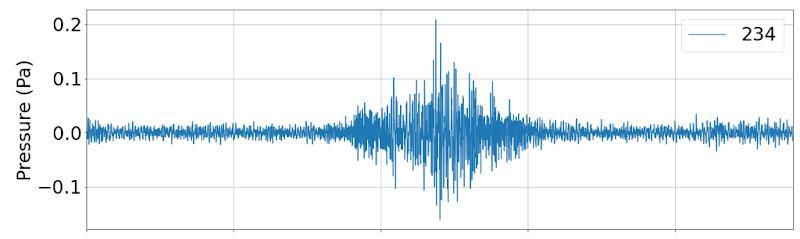
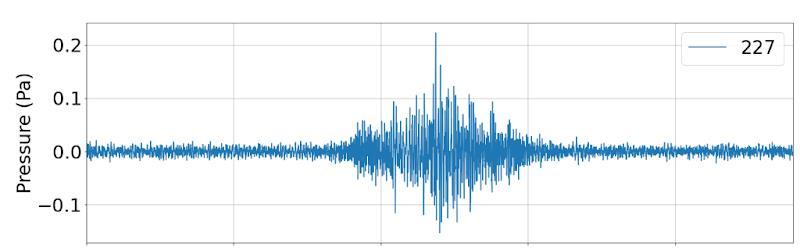
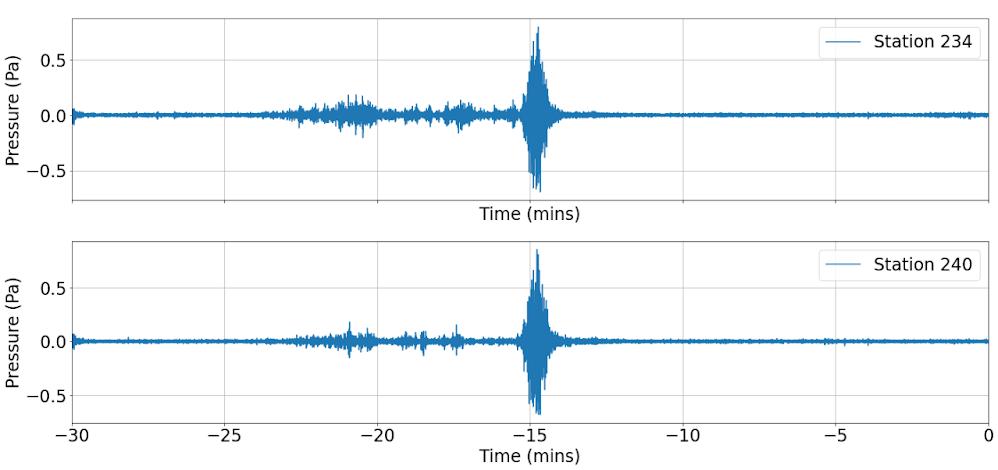
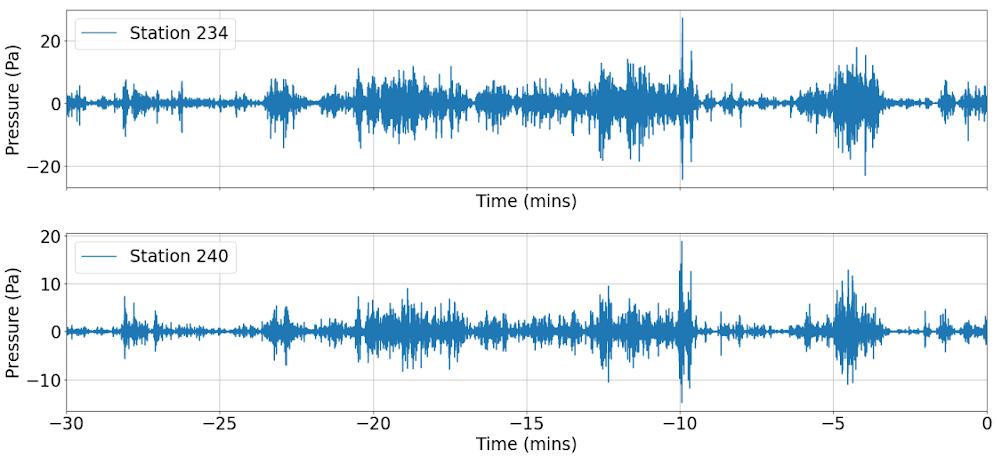
Pressure recorded at microphone
Pressure recorded at microphone
Bearing
Pressure recorded at microphone
Pressure recorded at microphone
Spectrogram
Spectrogram
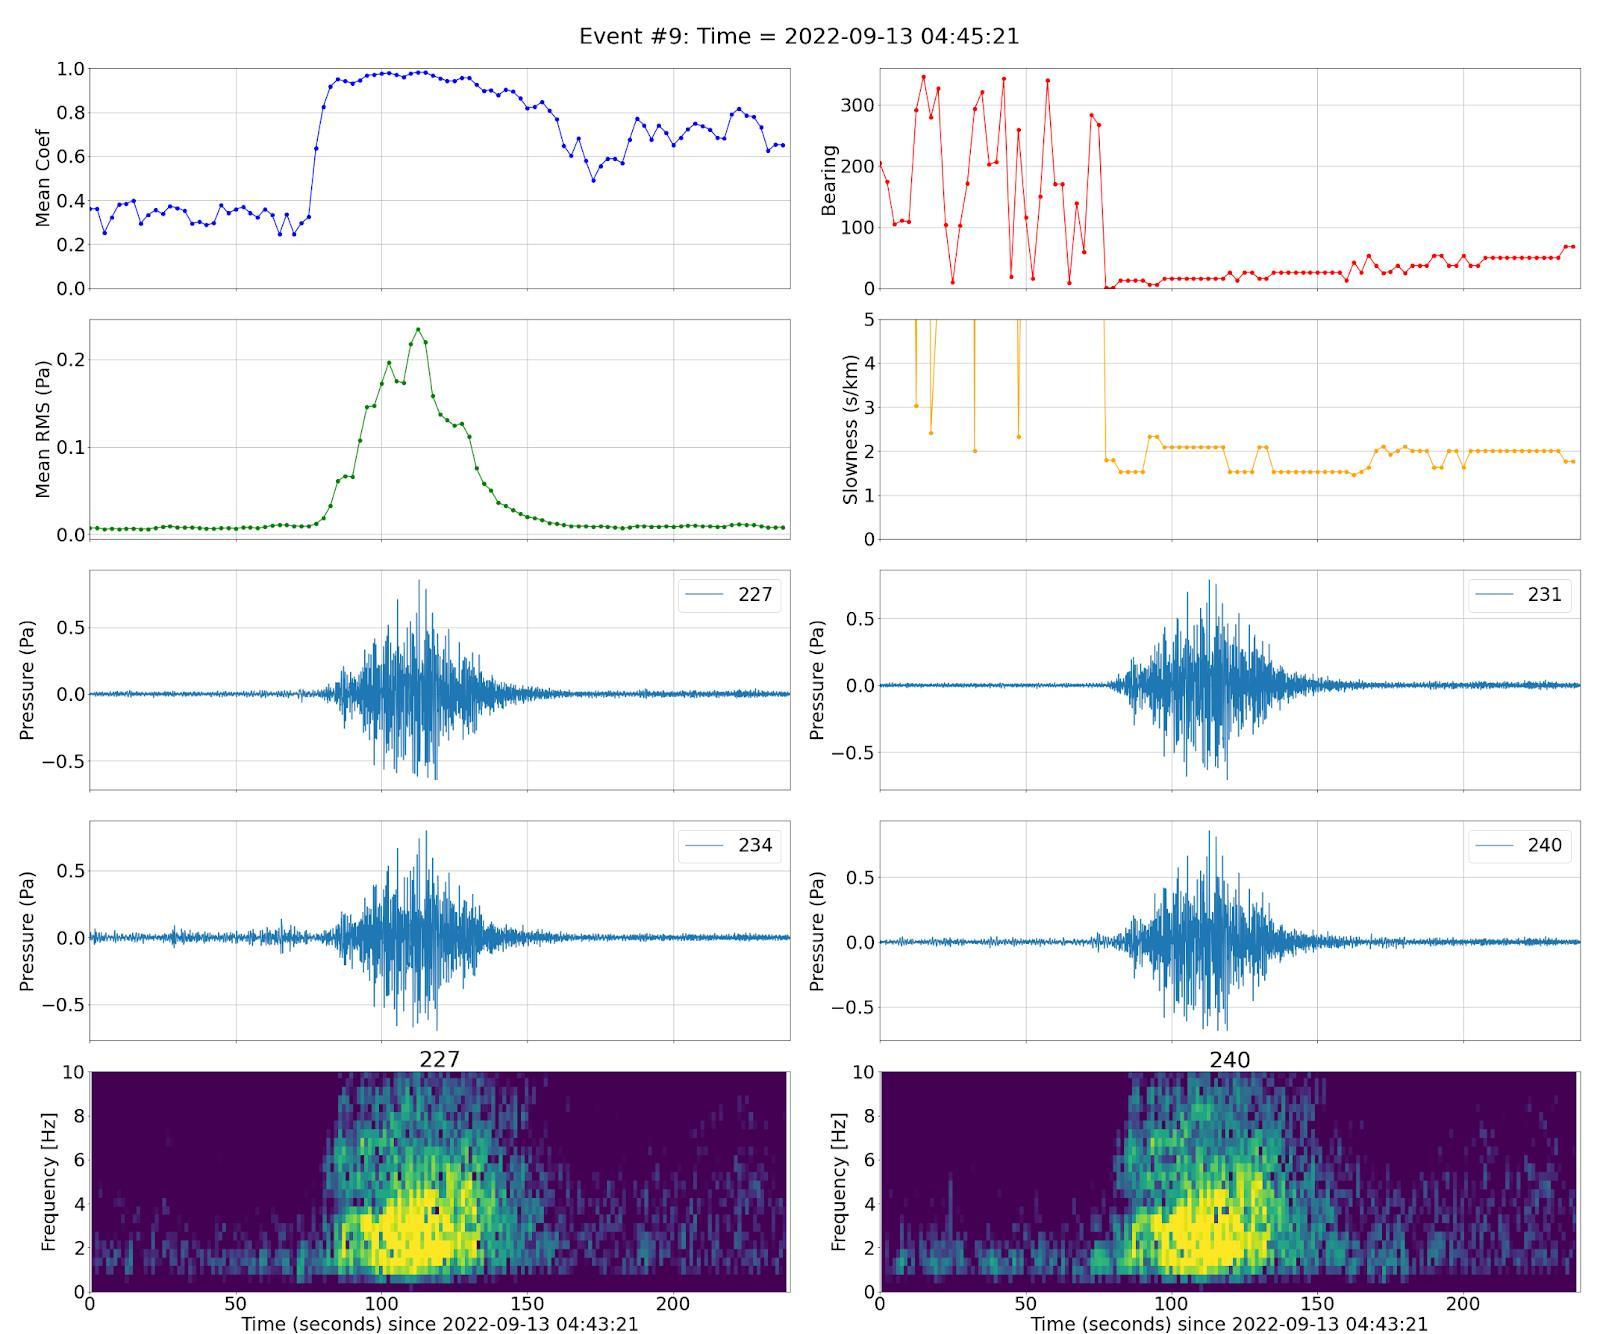
We apply the data processing to the infrasound data to detect potential avalanche events during snowstorm on 13 Sept 2022
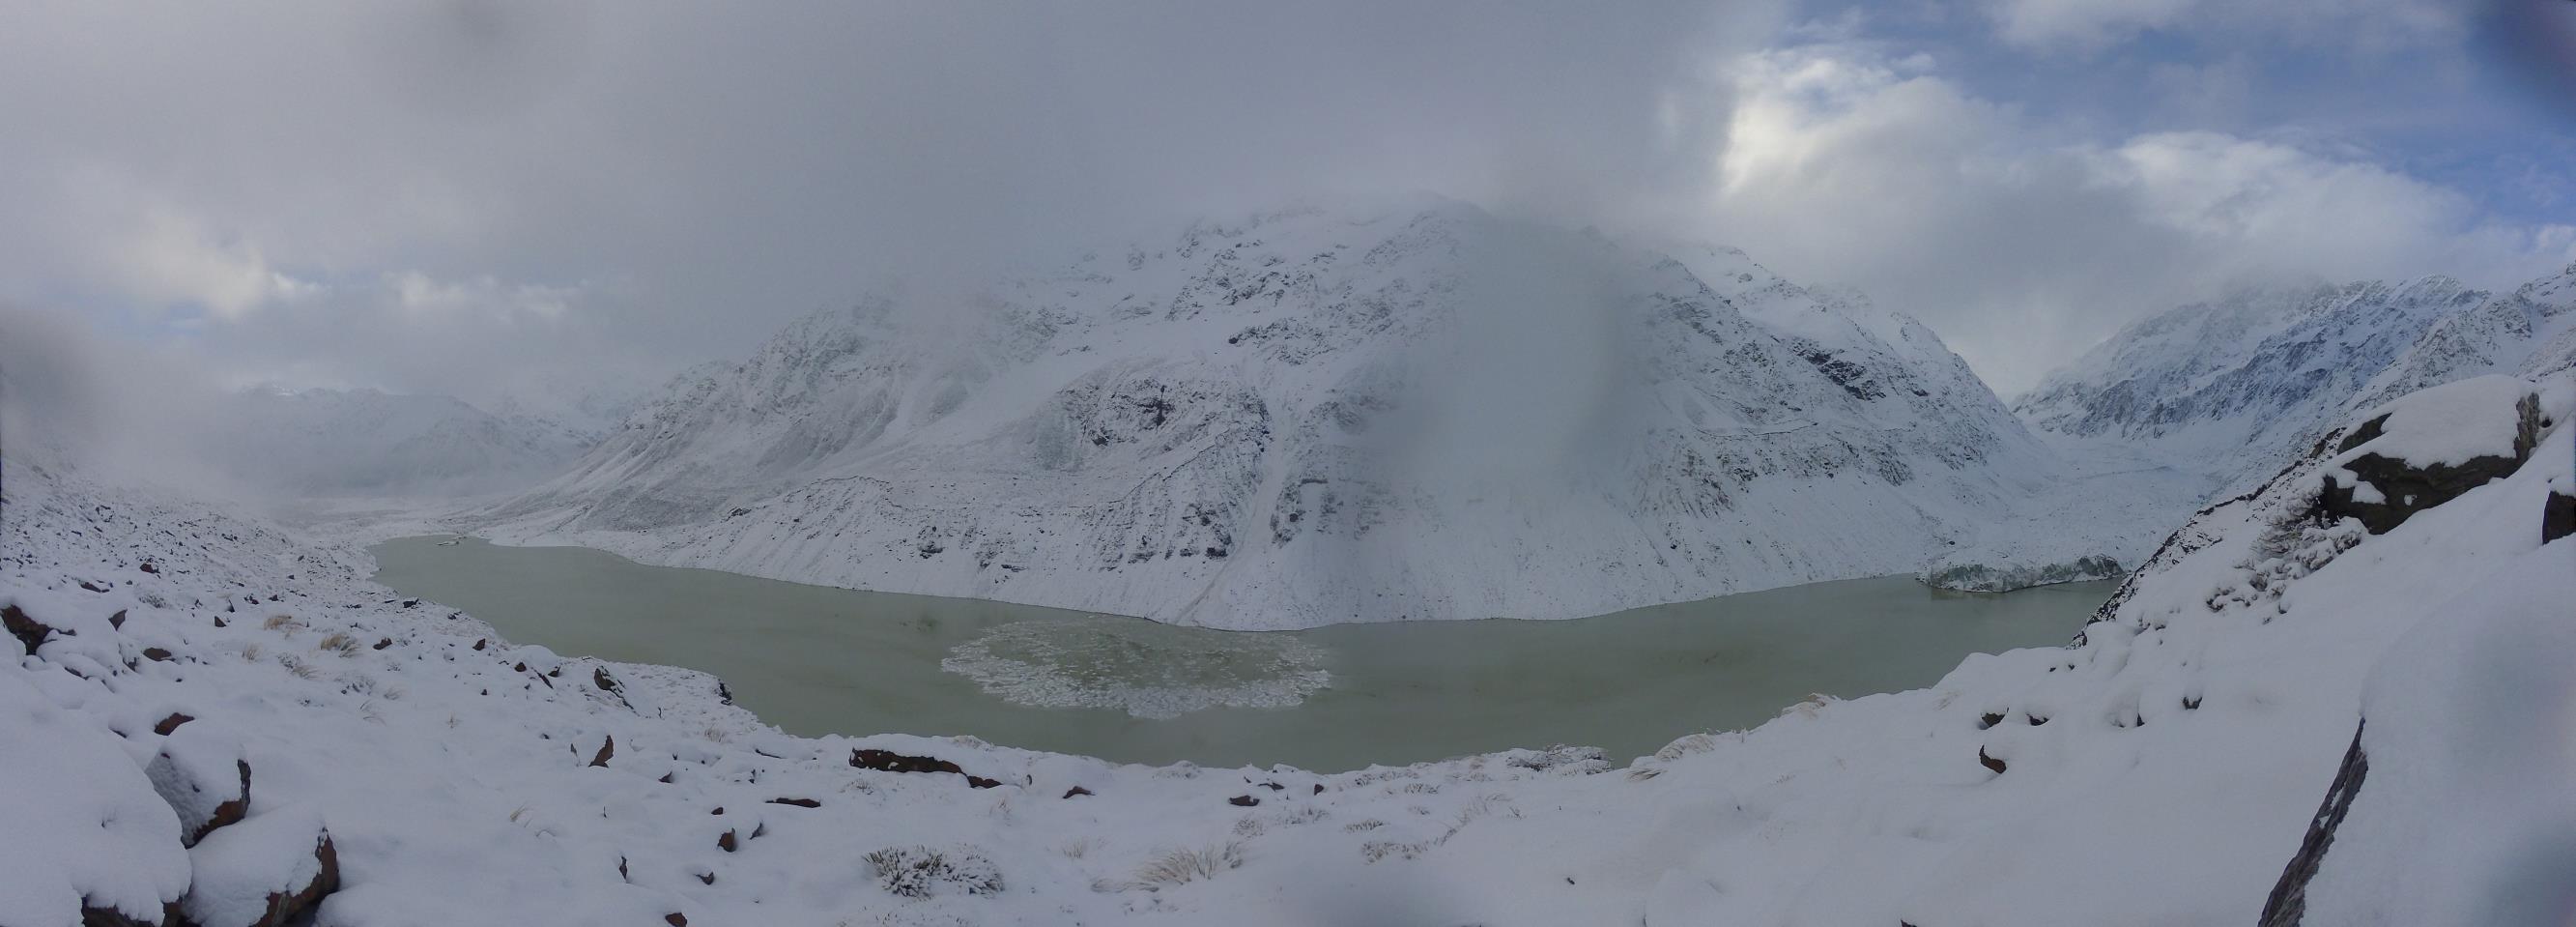
Time lapse observation of avalanche activity at 04:59:59 UTC on 2022-09-13
We apply the data processing to the infrasound data to detect potential avalanche events during snowstorm on 13 Sept 2022
• Detect event observed by cameras
• Recorded by infrasound 15 minutes before observed by cameras
Time lapse observation of avalanche activity at 04:59:59 UTC on 2022-09-13
Average pressure amplitude
Cross correlation coefficient Slowness
Pressure recorded at microphone
Pressure recorded at microphone
Pressure recorded at microphone
Pressure recorded at microphone
Spectrogram
Spectrogram
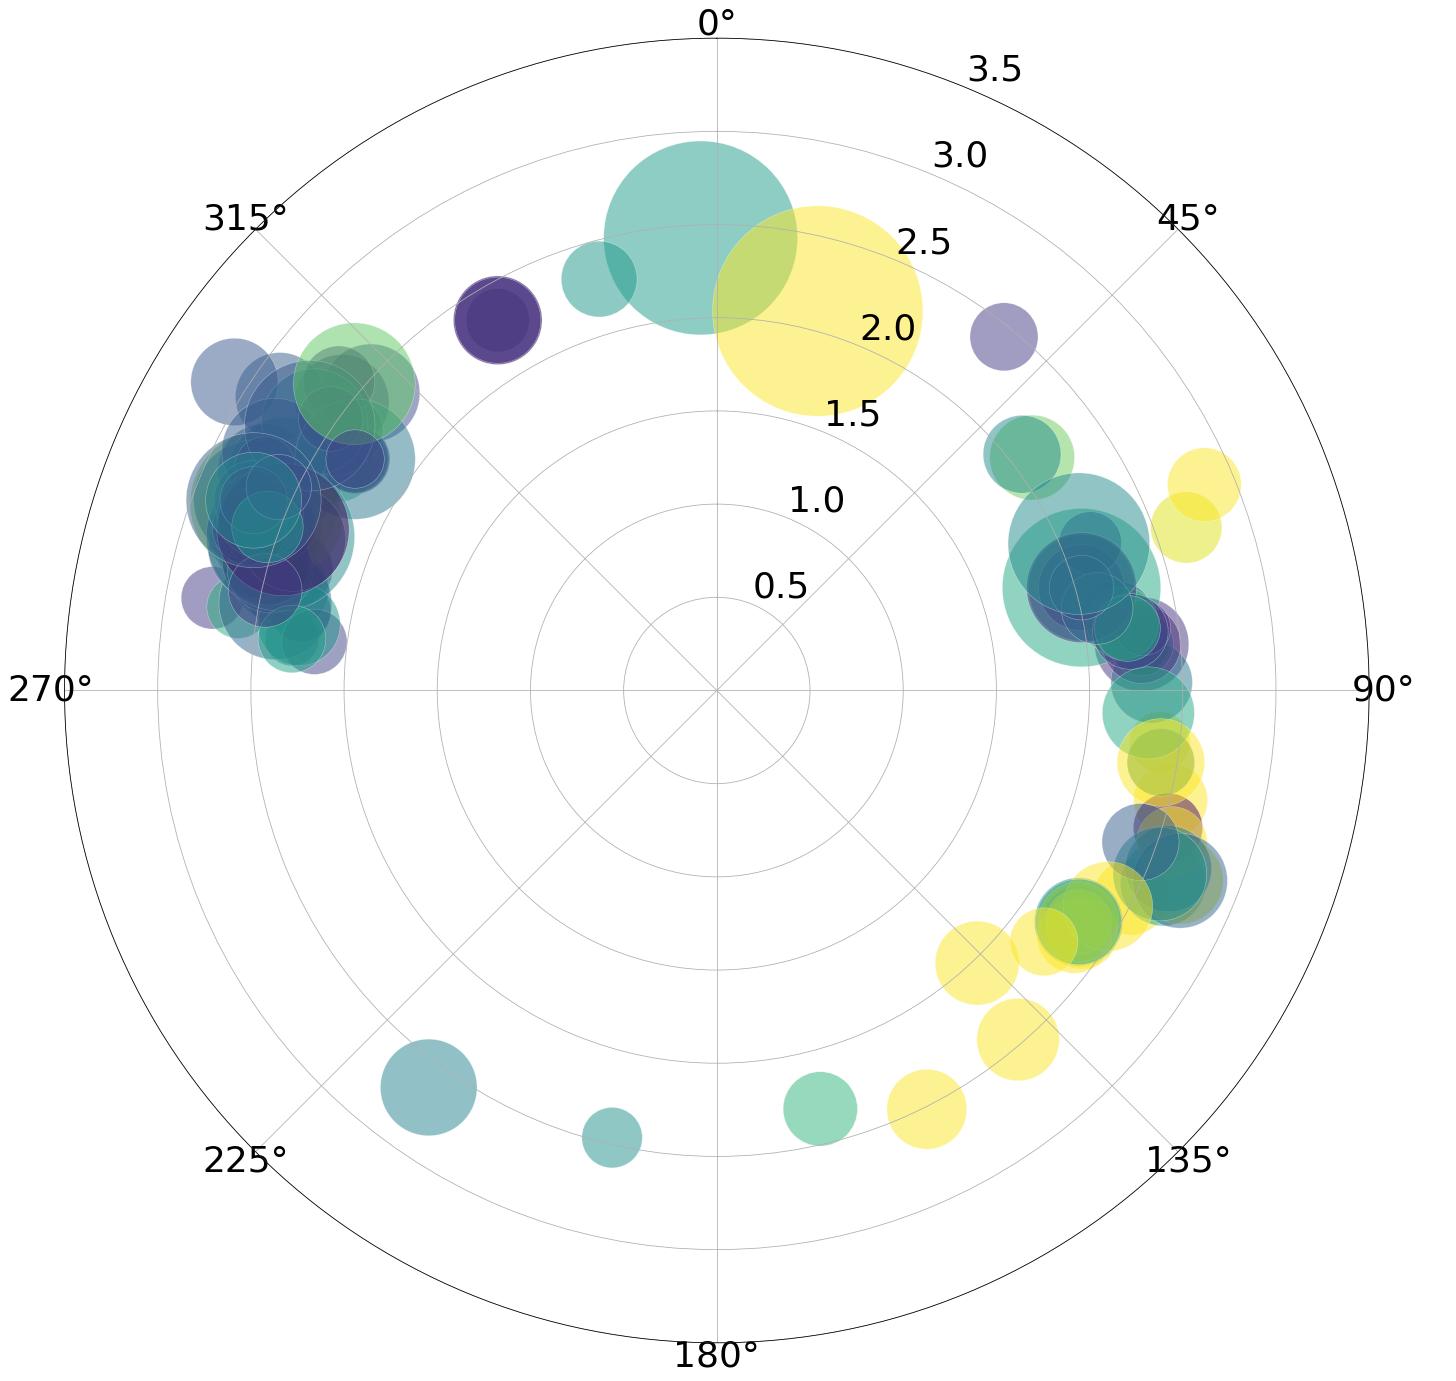
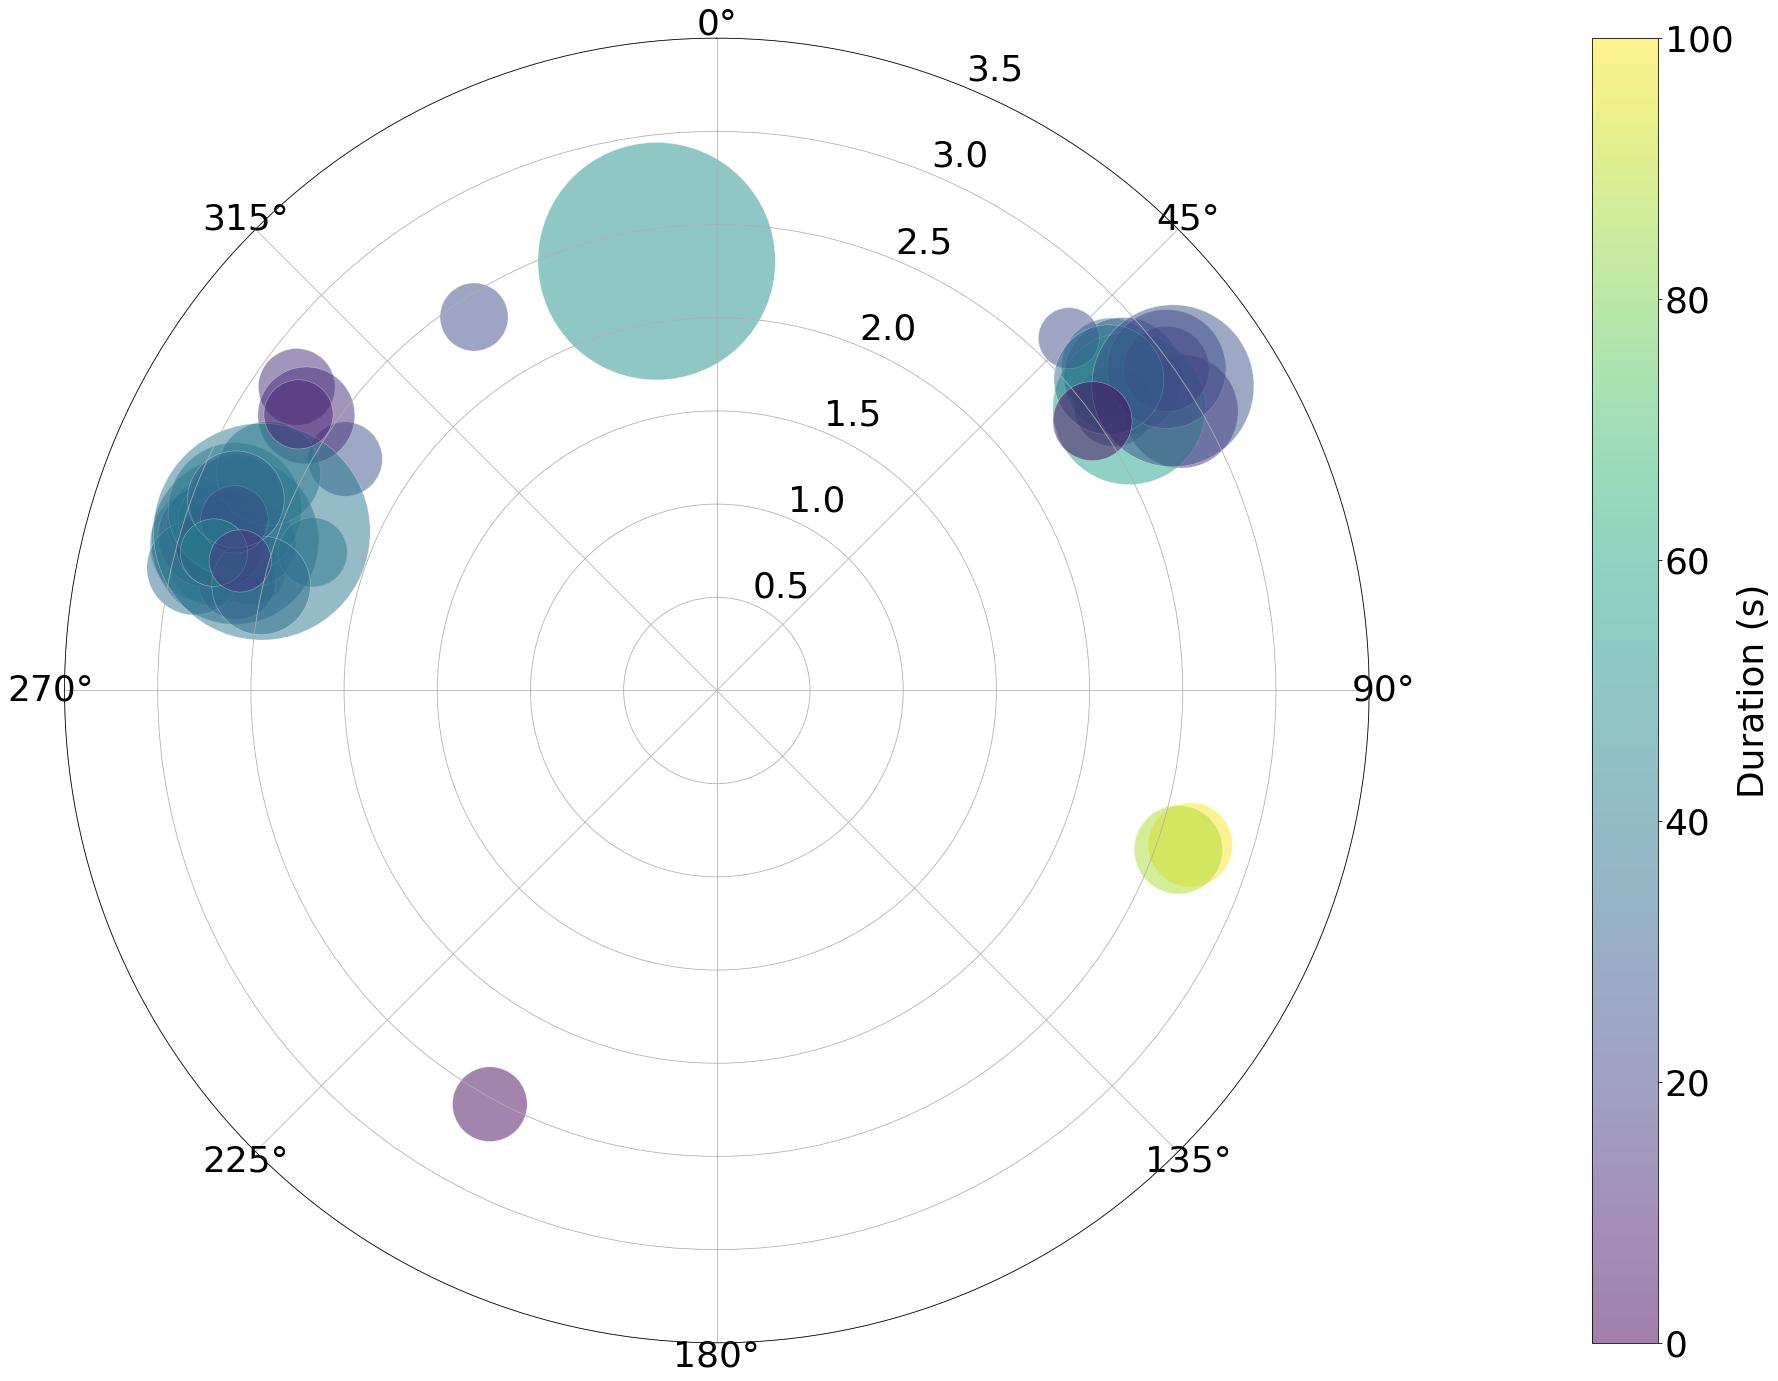
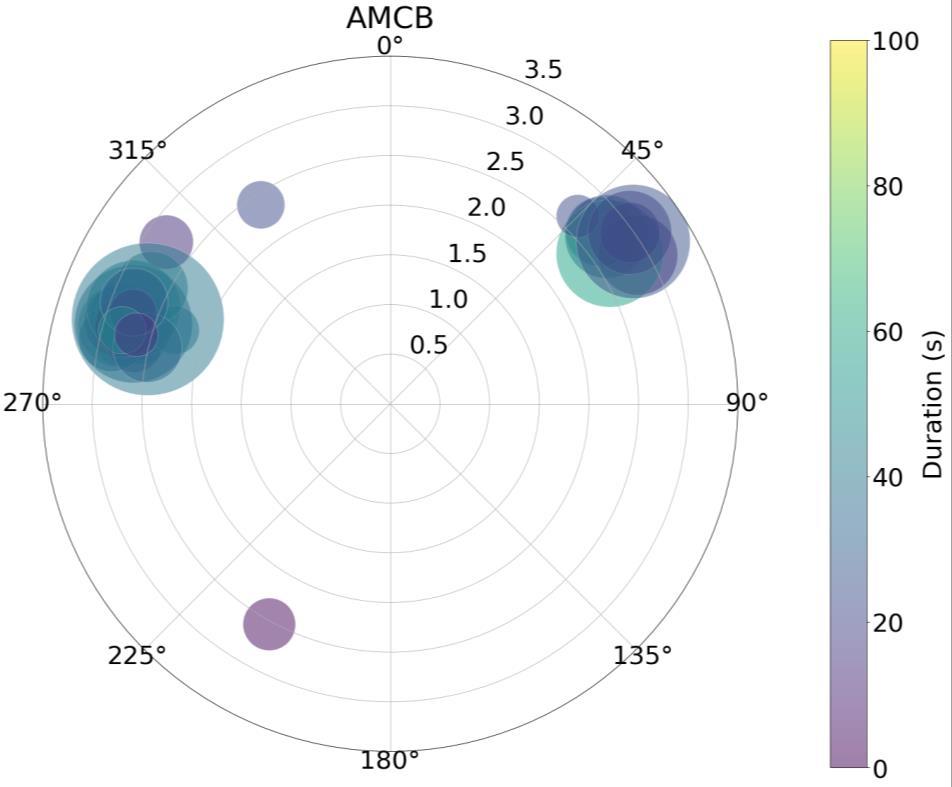
Detected nine other potential signals of avalanches
Only event observed by camera Detecting avalanches on 13 Sept 2022
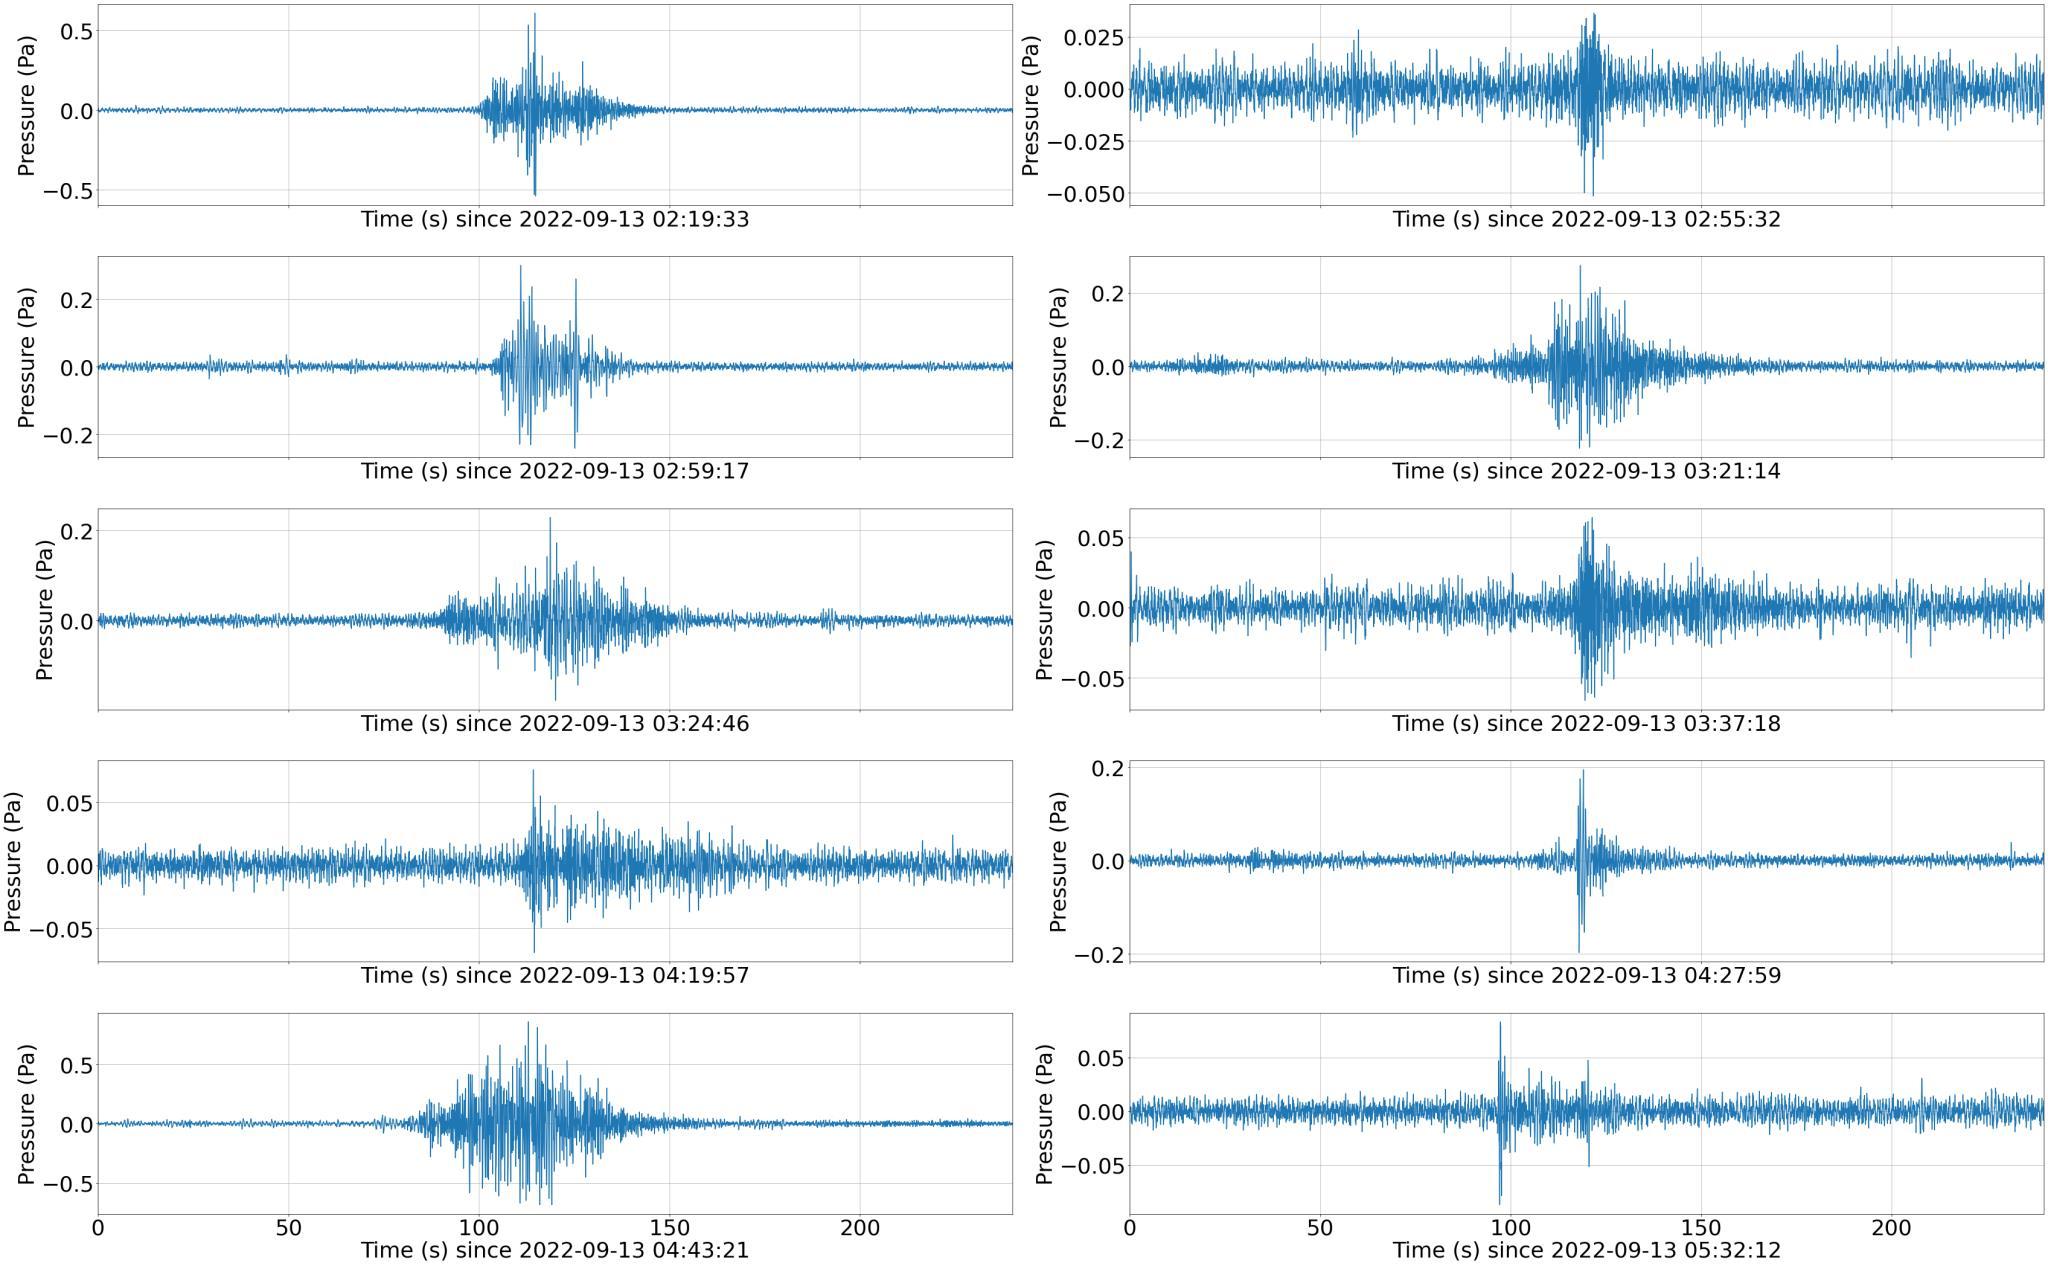
Detected nine other potential signals of avalanches
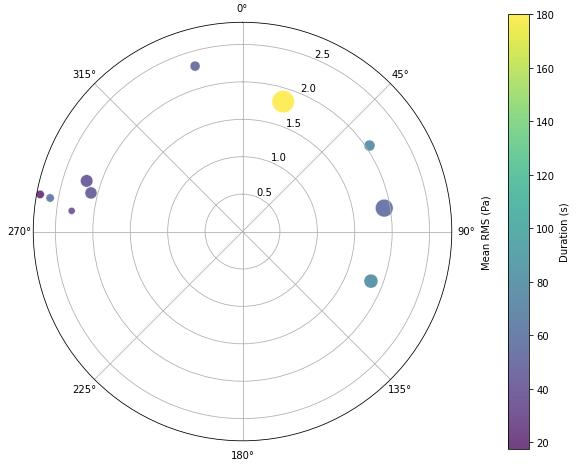
Circle size indicates amplitude of event
Colour-coded by event duration
Radius shows slowness
Detected nine other potential signals of avalanches
Future work: Are these signals all avalanches or other types of mass movements?
Circle size indicates amplitude of event Colour-coded by event duration
Radius shows slowness
Cameras observed seven avalanches while infrasound microphones were deployed. Only one of the avalanches was observed with infrasound.
Cameras observed seven avalanches while infrasound microphones were deployed. Only one of the avalanches was observed with infrasound.
Cameras observed seven avalanches while infrasound microphones were deployed. Only one of the avalanches was observed with infrasound. Event #3
Lots of wind noise
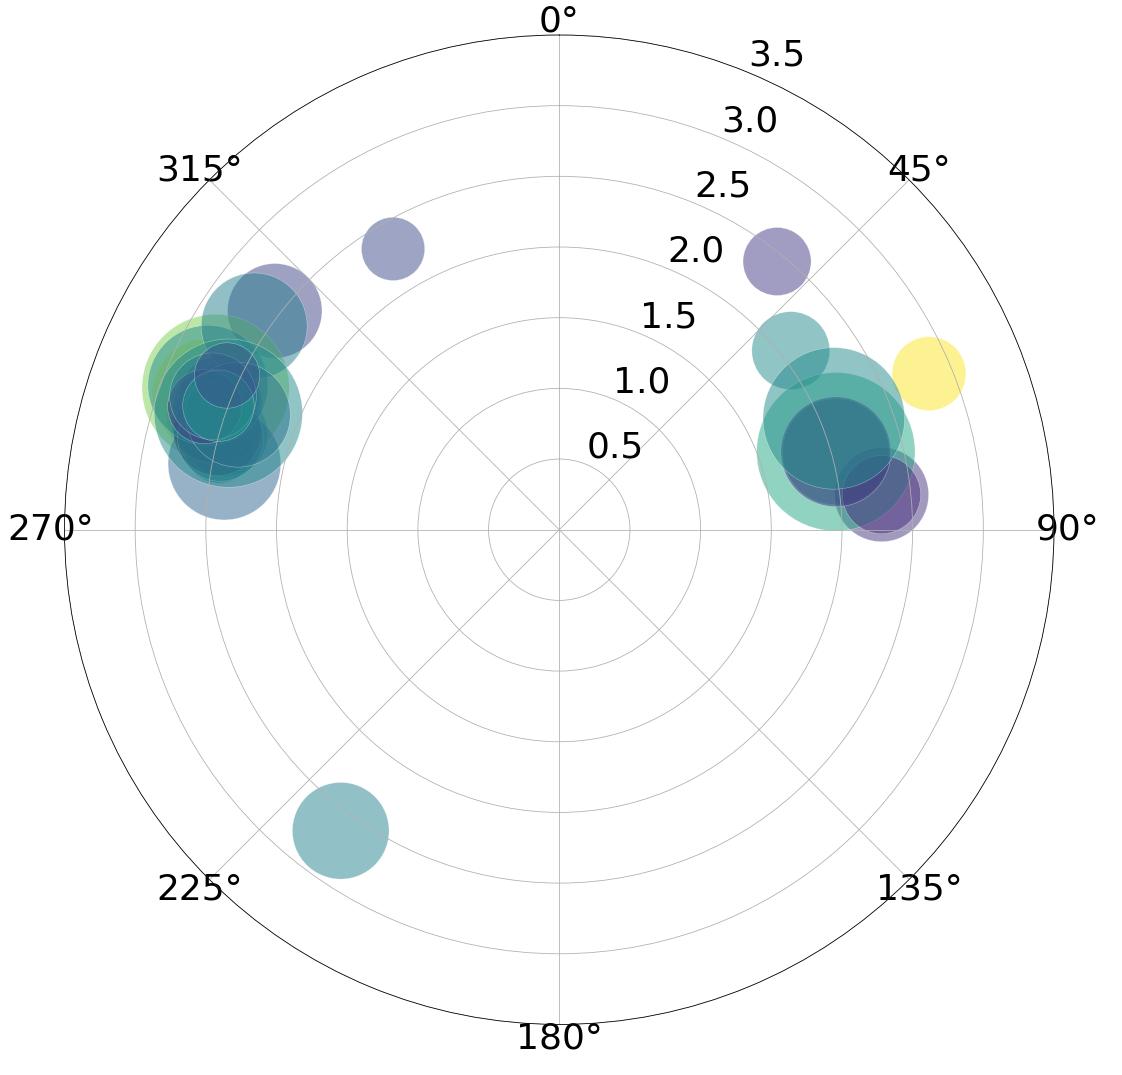
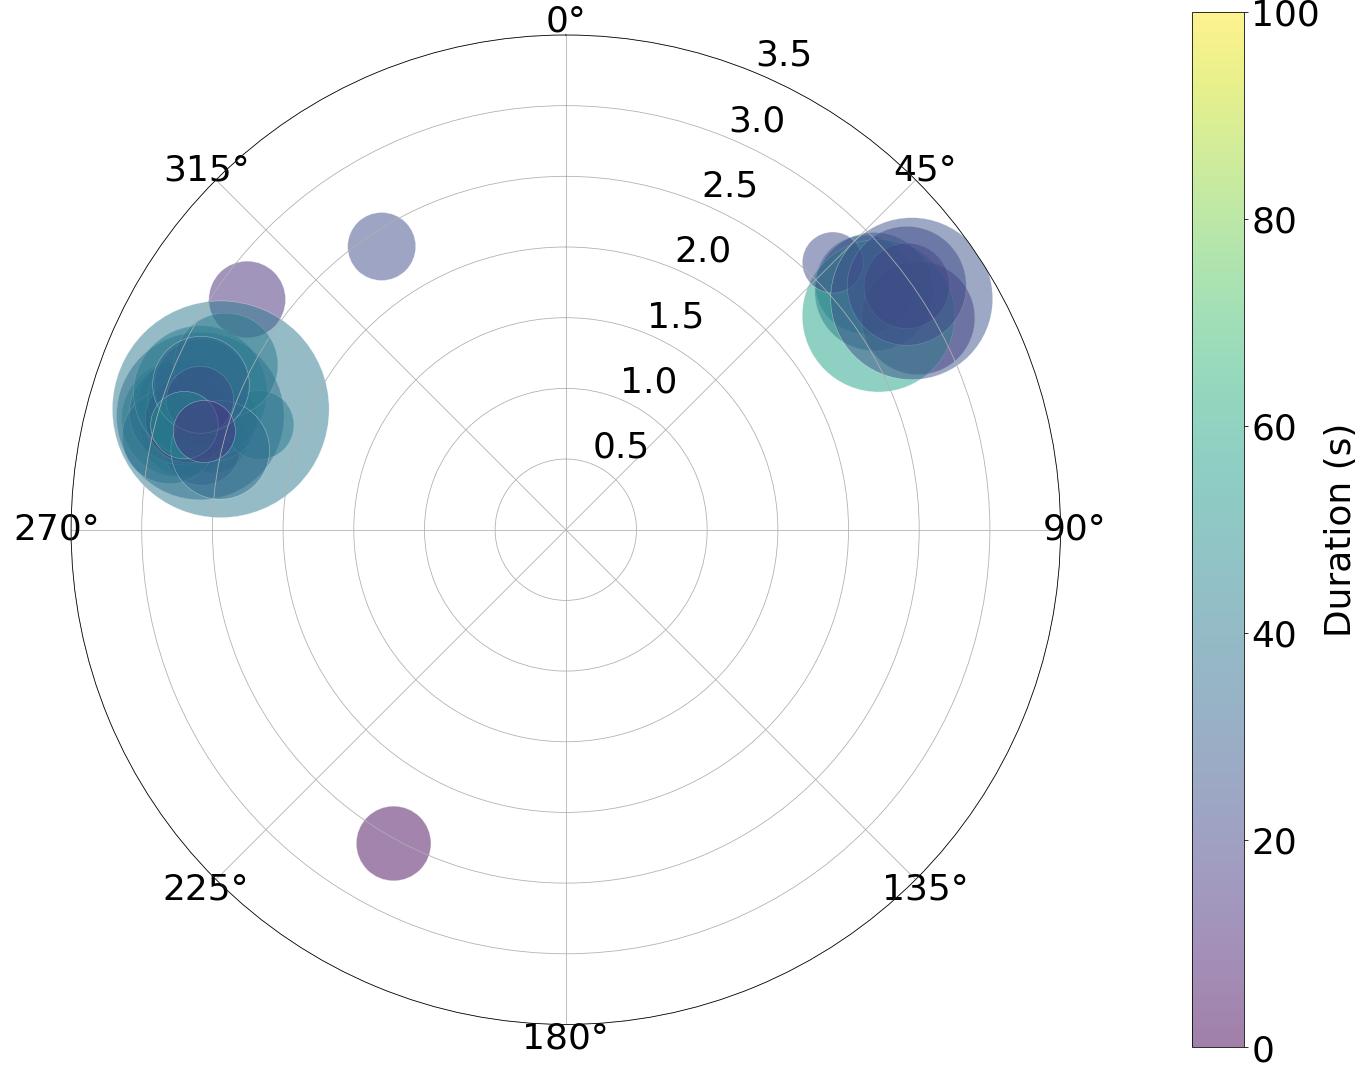
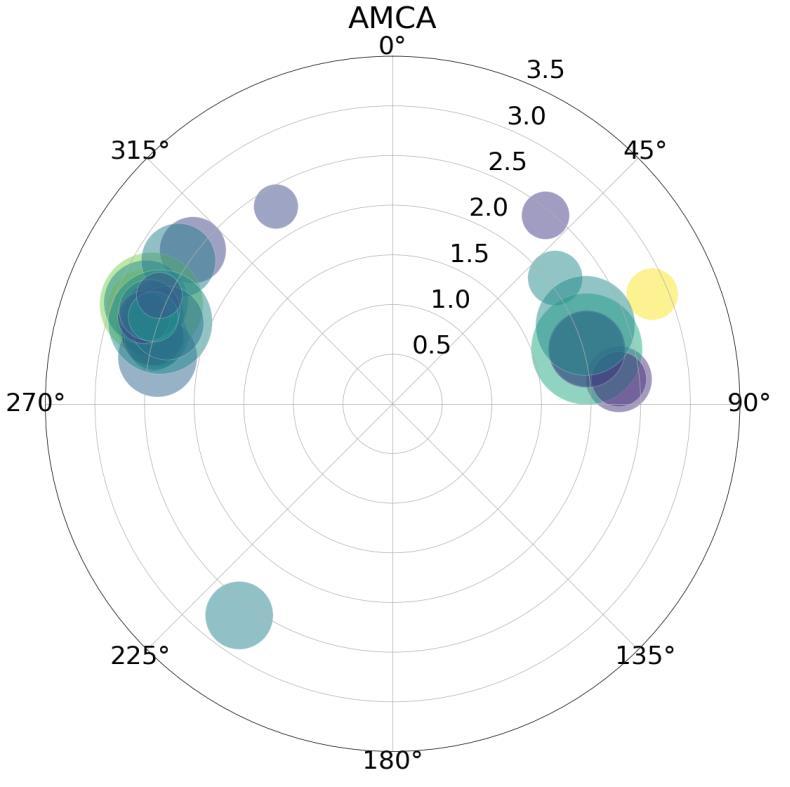
Detecting avalanches throughout campaign (13 Sept – 1 Nov 2022)
Detected AMCA = 134 and AMCB = 43 potential avalanche events.
Circle size indicates amplitude of event
Colour-coded by event duration
Radius shows slowness
Detecting avalanches throughout campaign (13 Sept – 1 Nov 2022)
Detected AMCA = 134 and AMCB = 43 potential avalanche events.
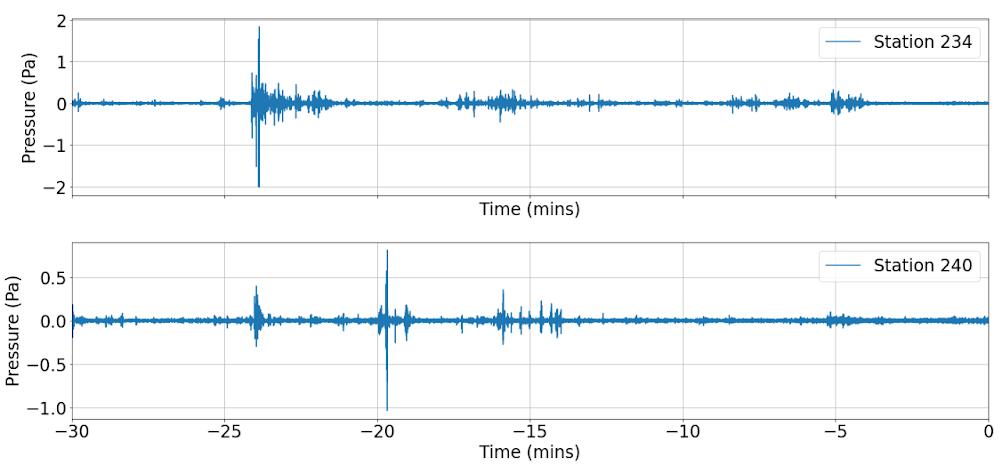
Circle size indicates amplitude of event Colour-coded by event duration Radius shows slowness 34 events were recorded by both arrays with events on both side of valley.
Detecting avalanches throughout campaign (13 Sept – 1 Nov 2022)
Detected AMCA = 134 and AMCB = 43 potential avalanche events.
Circle size indicates amplitude of event
Colour-coded by event duration Radius shows slowness 34 events were recorded by both arrays with events on both side of valley.
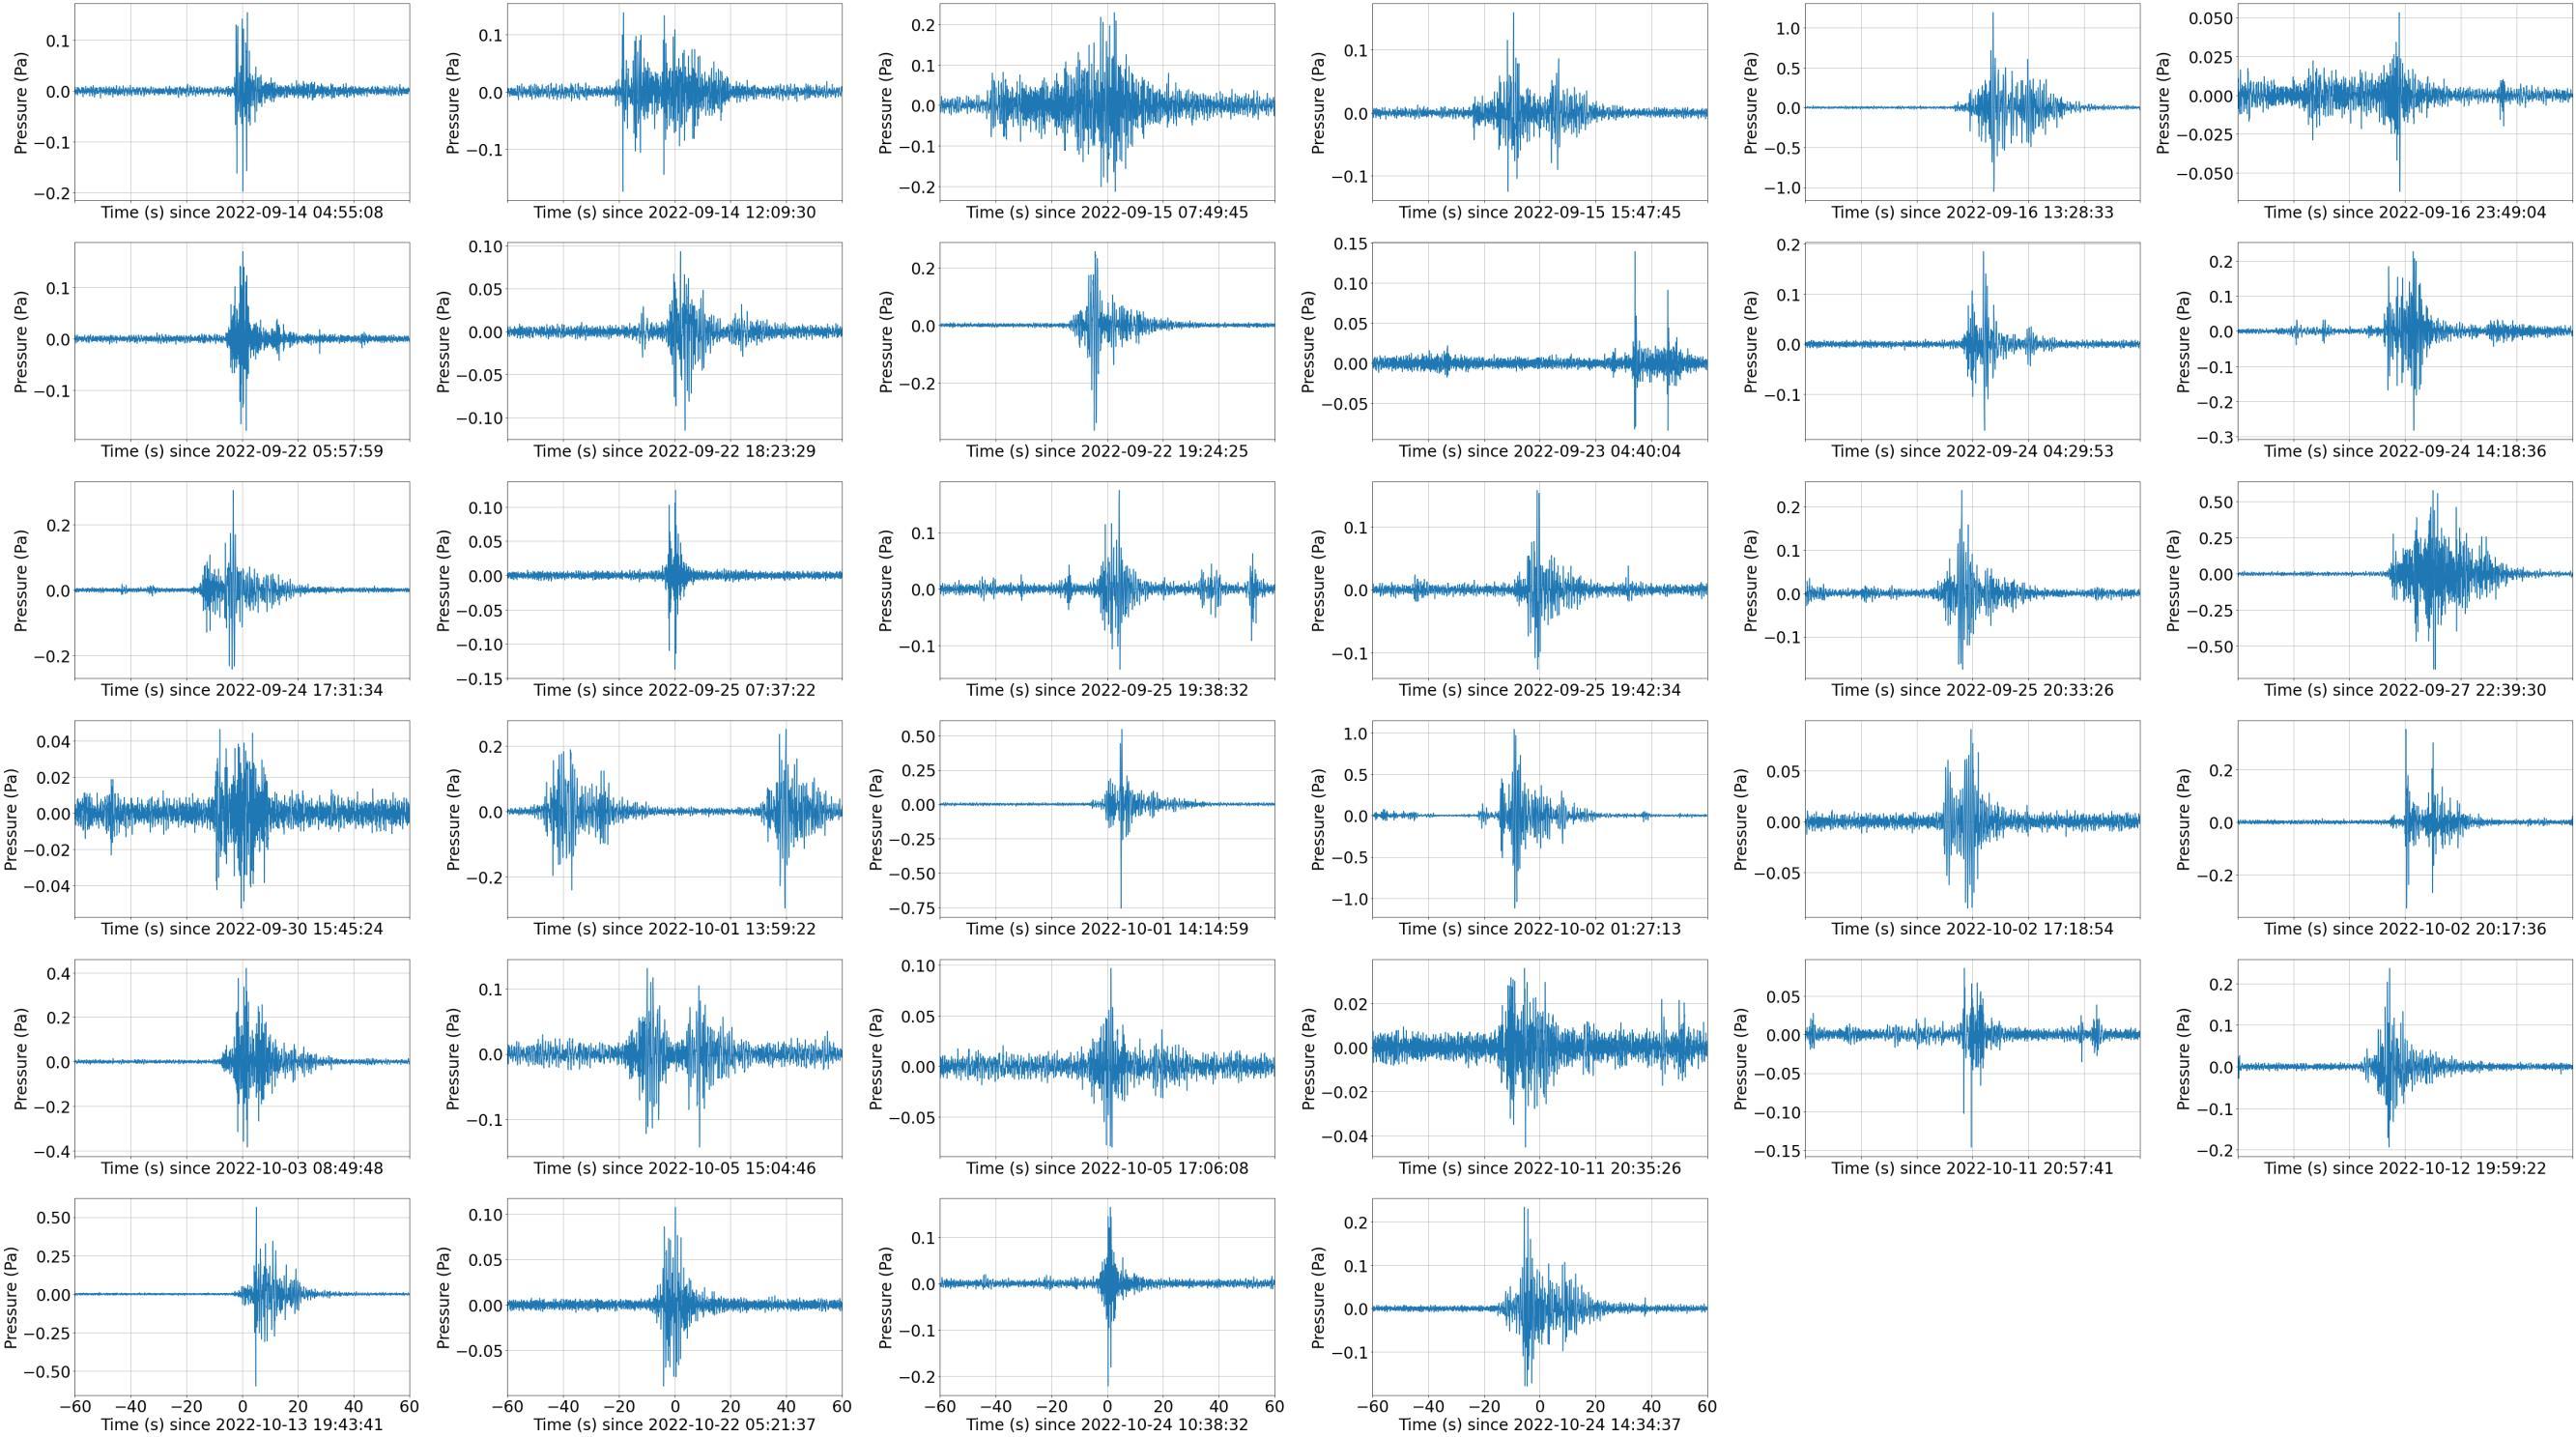
Pressure time series of the 34 events recorded by both arrays
Infrasound is a useful tool for detecting avalanches
• Easy to deploy
• Can develop automated processing workflows
More work is needed on:
• Wind noise reduction
• Relating infrasound observations to physical characteristics of mass movements e.g., type of event, size, velocity


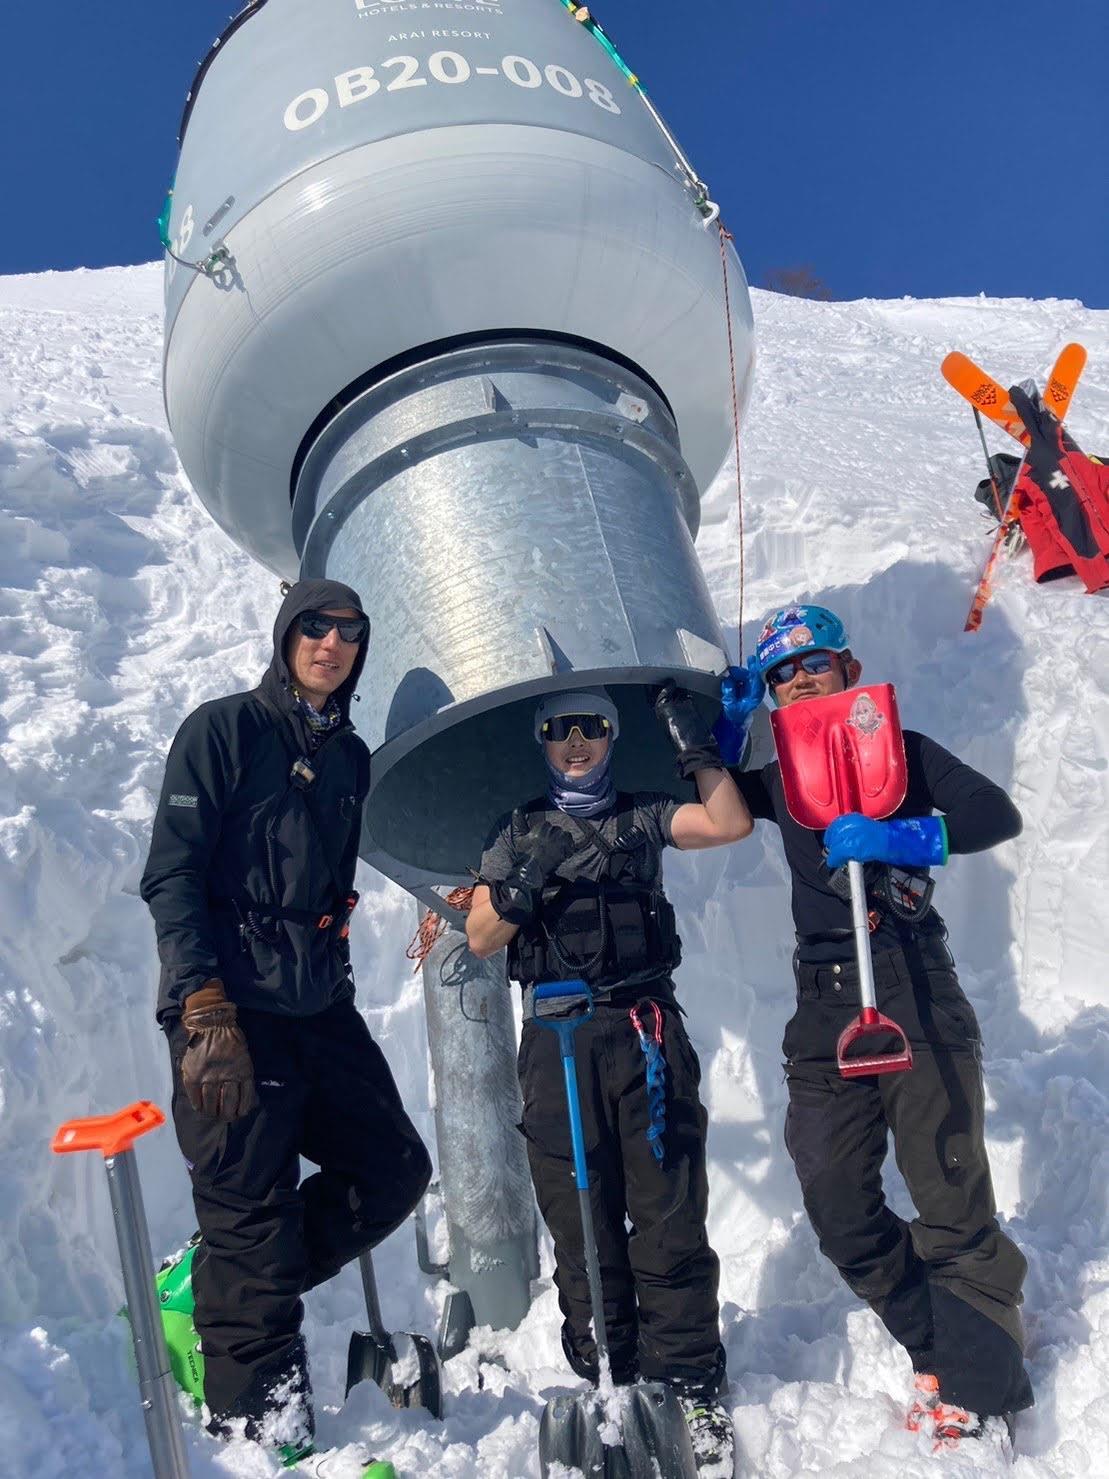

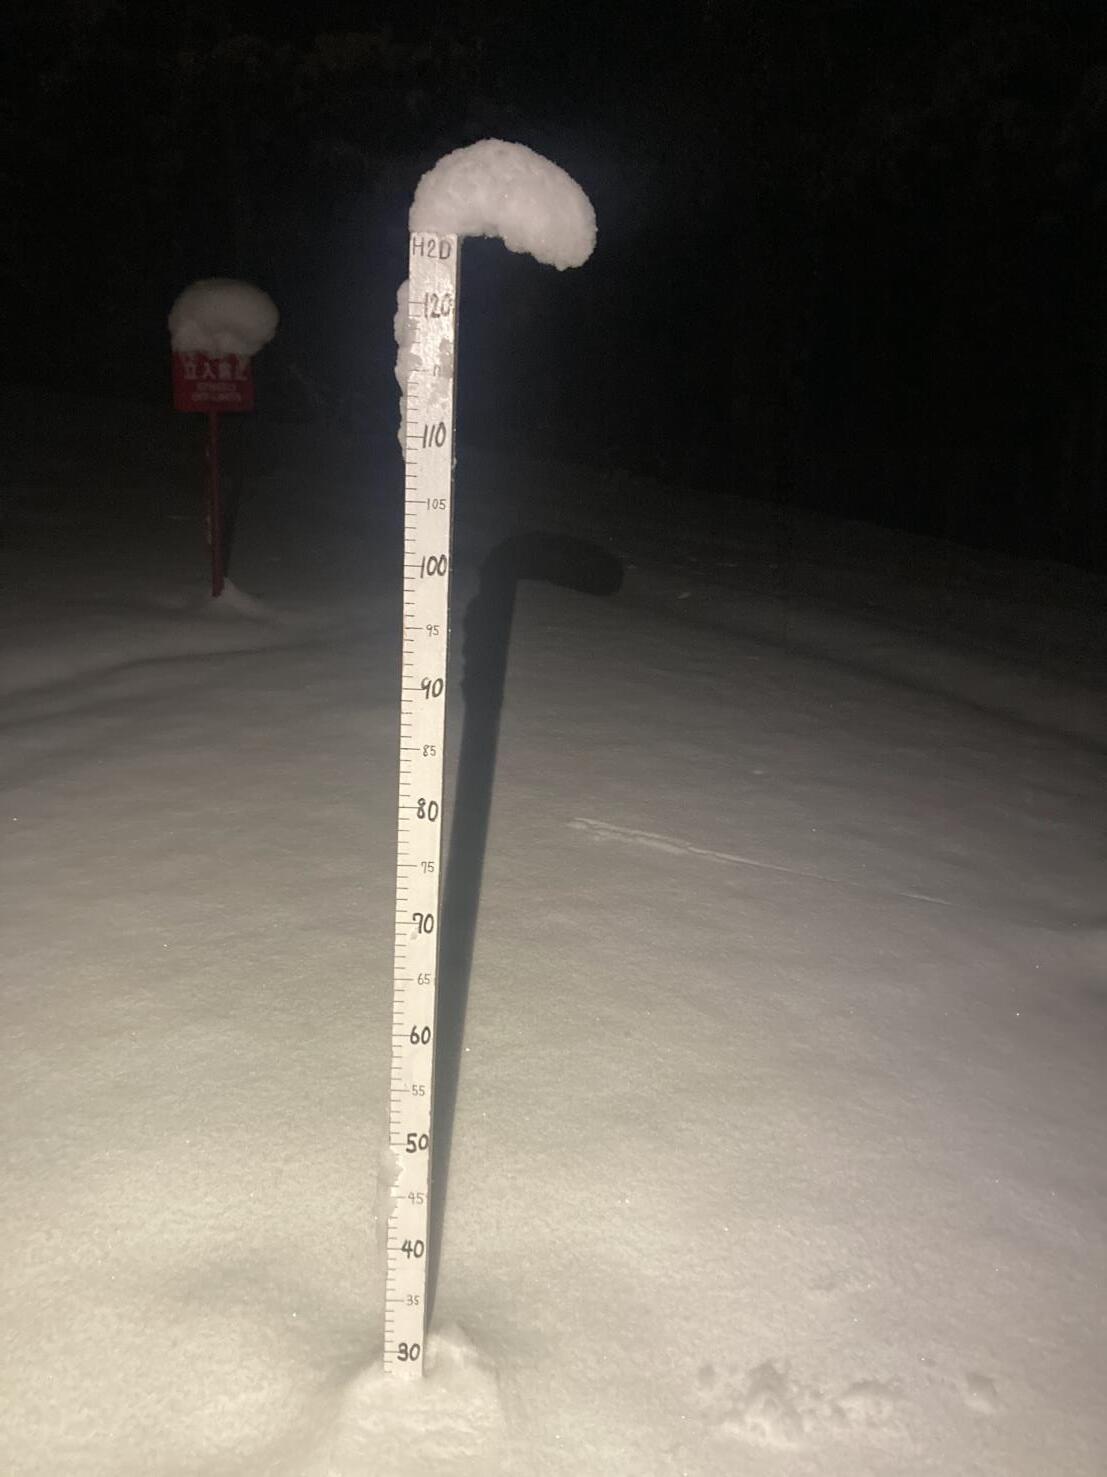
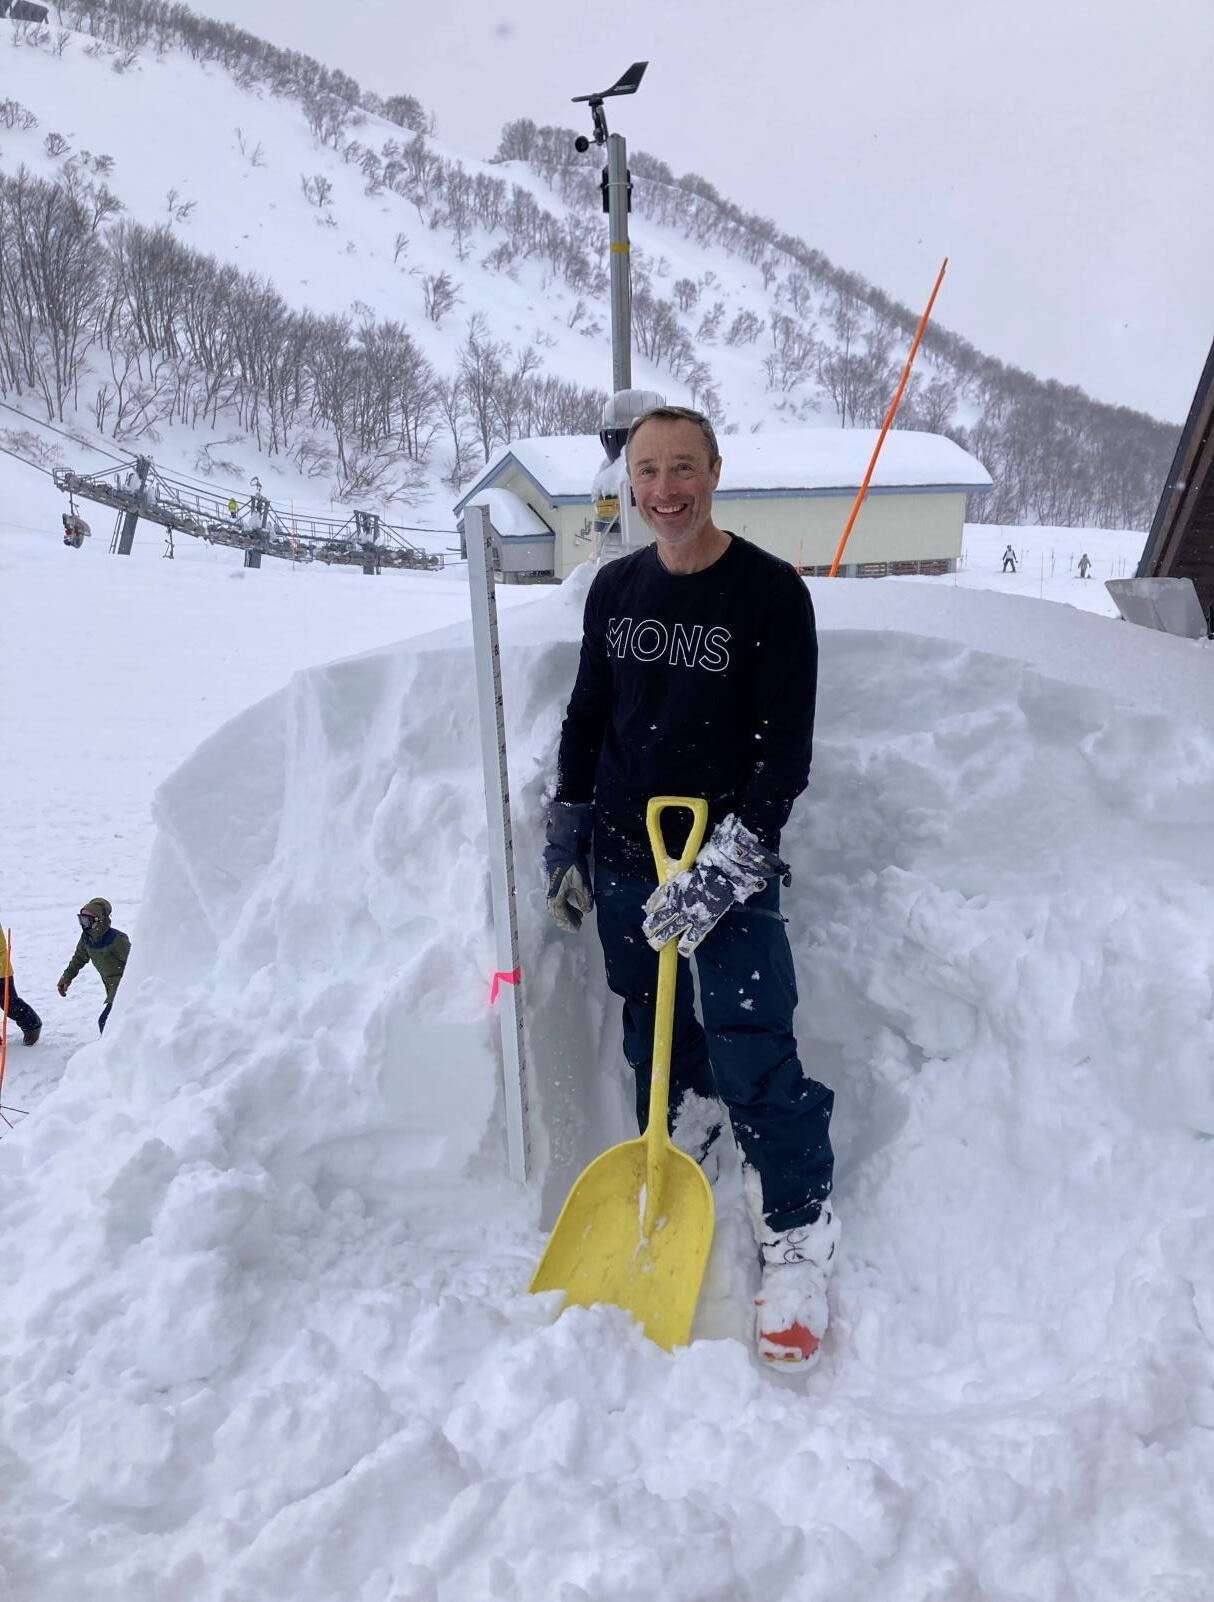
- Upper mountain: Wind, Temp, RH
- Mid Mountain: Wind, Temp, RH, HS, Webcam pointing at H2D, HN24, HST
- Base: Wind, Temp, Wx plot (HS, H2D, HN24, HST)
• Don’t get complacent!
• Make decisions and plans based on what you think it should do (from the data) – not what is usually does...
• When the snowpack is changing, be outside.
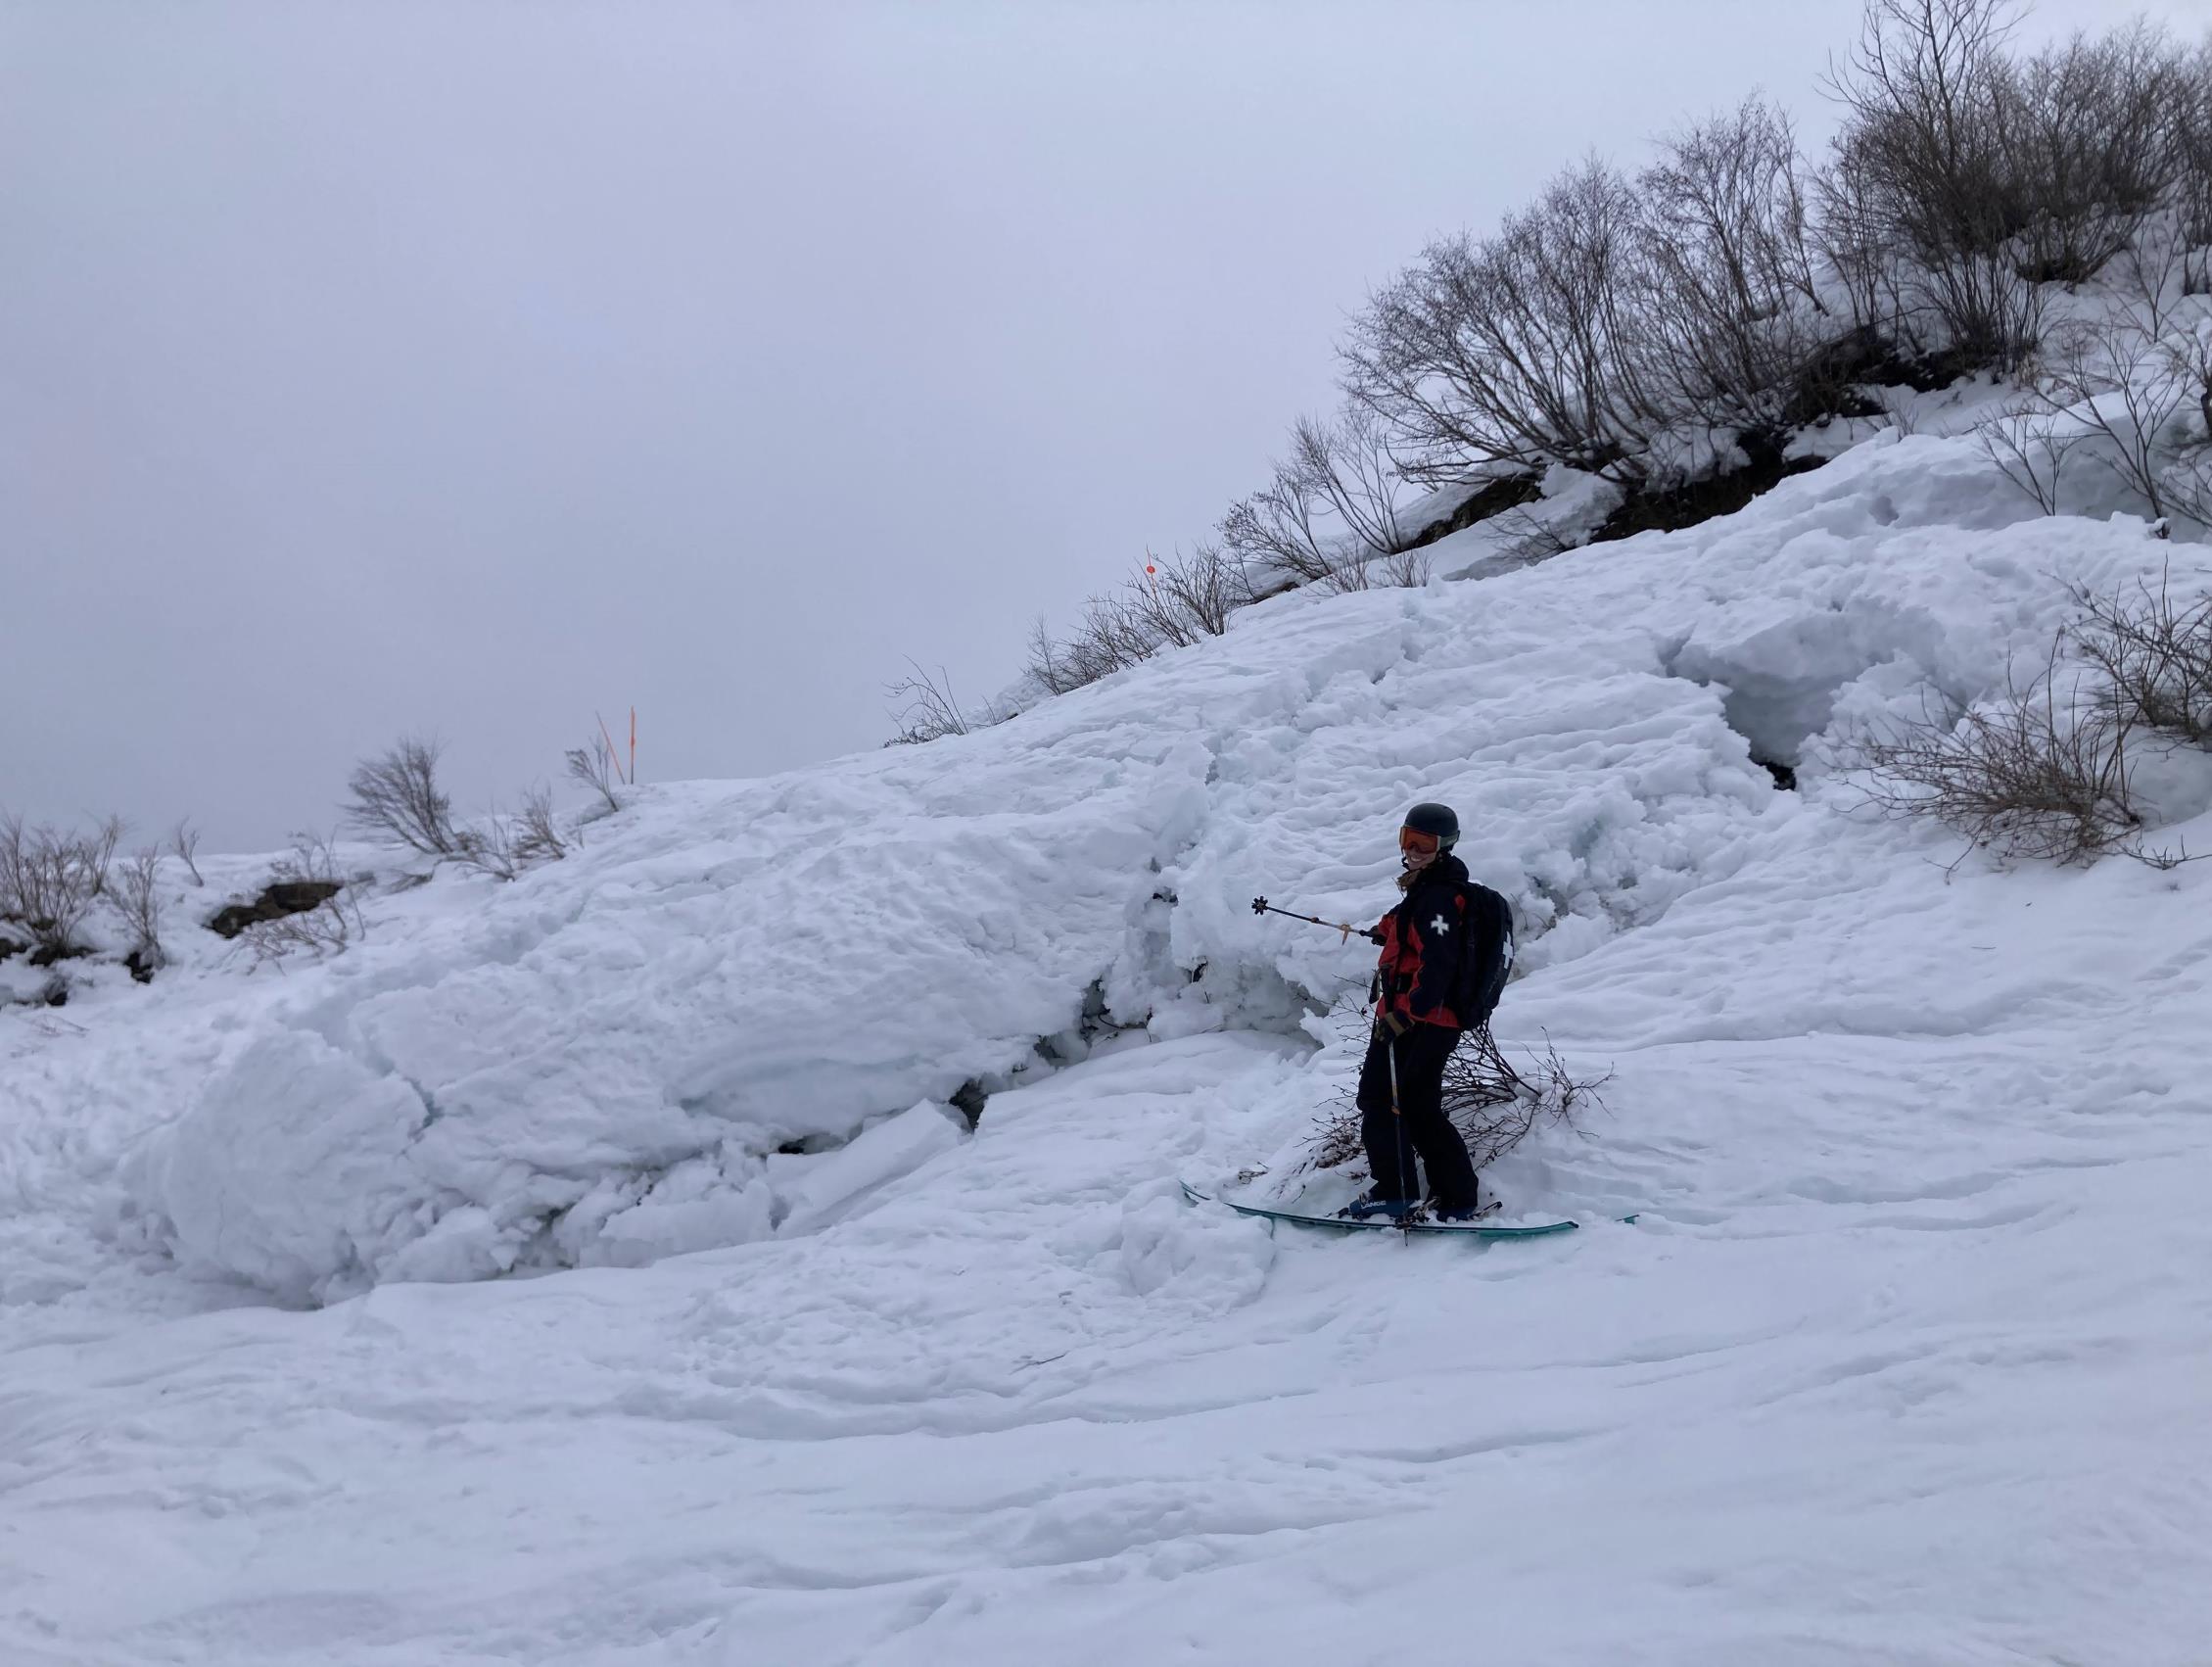
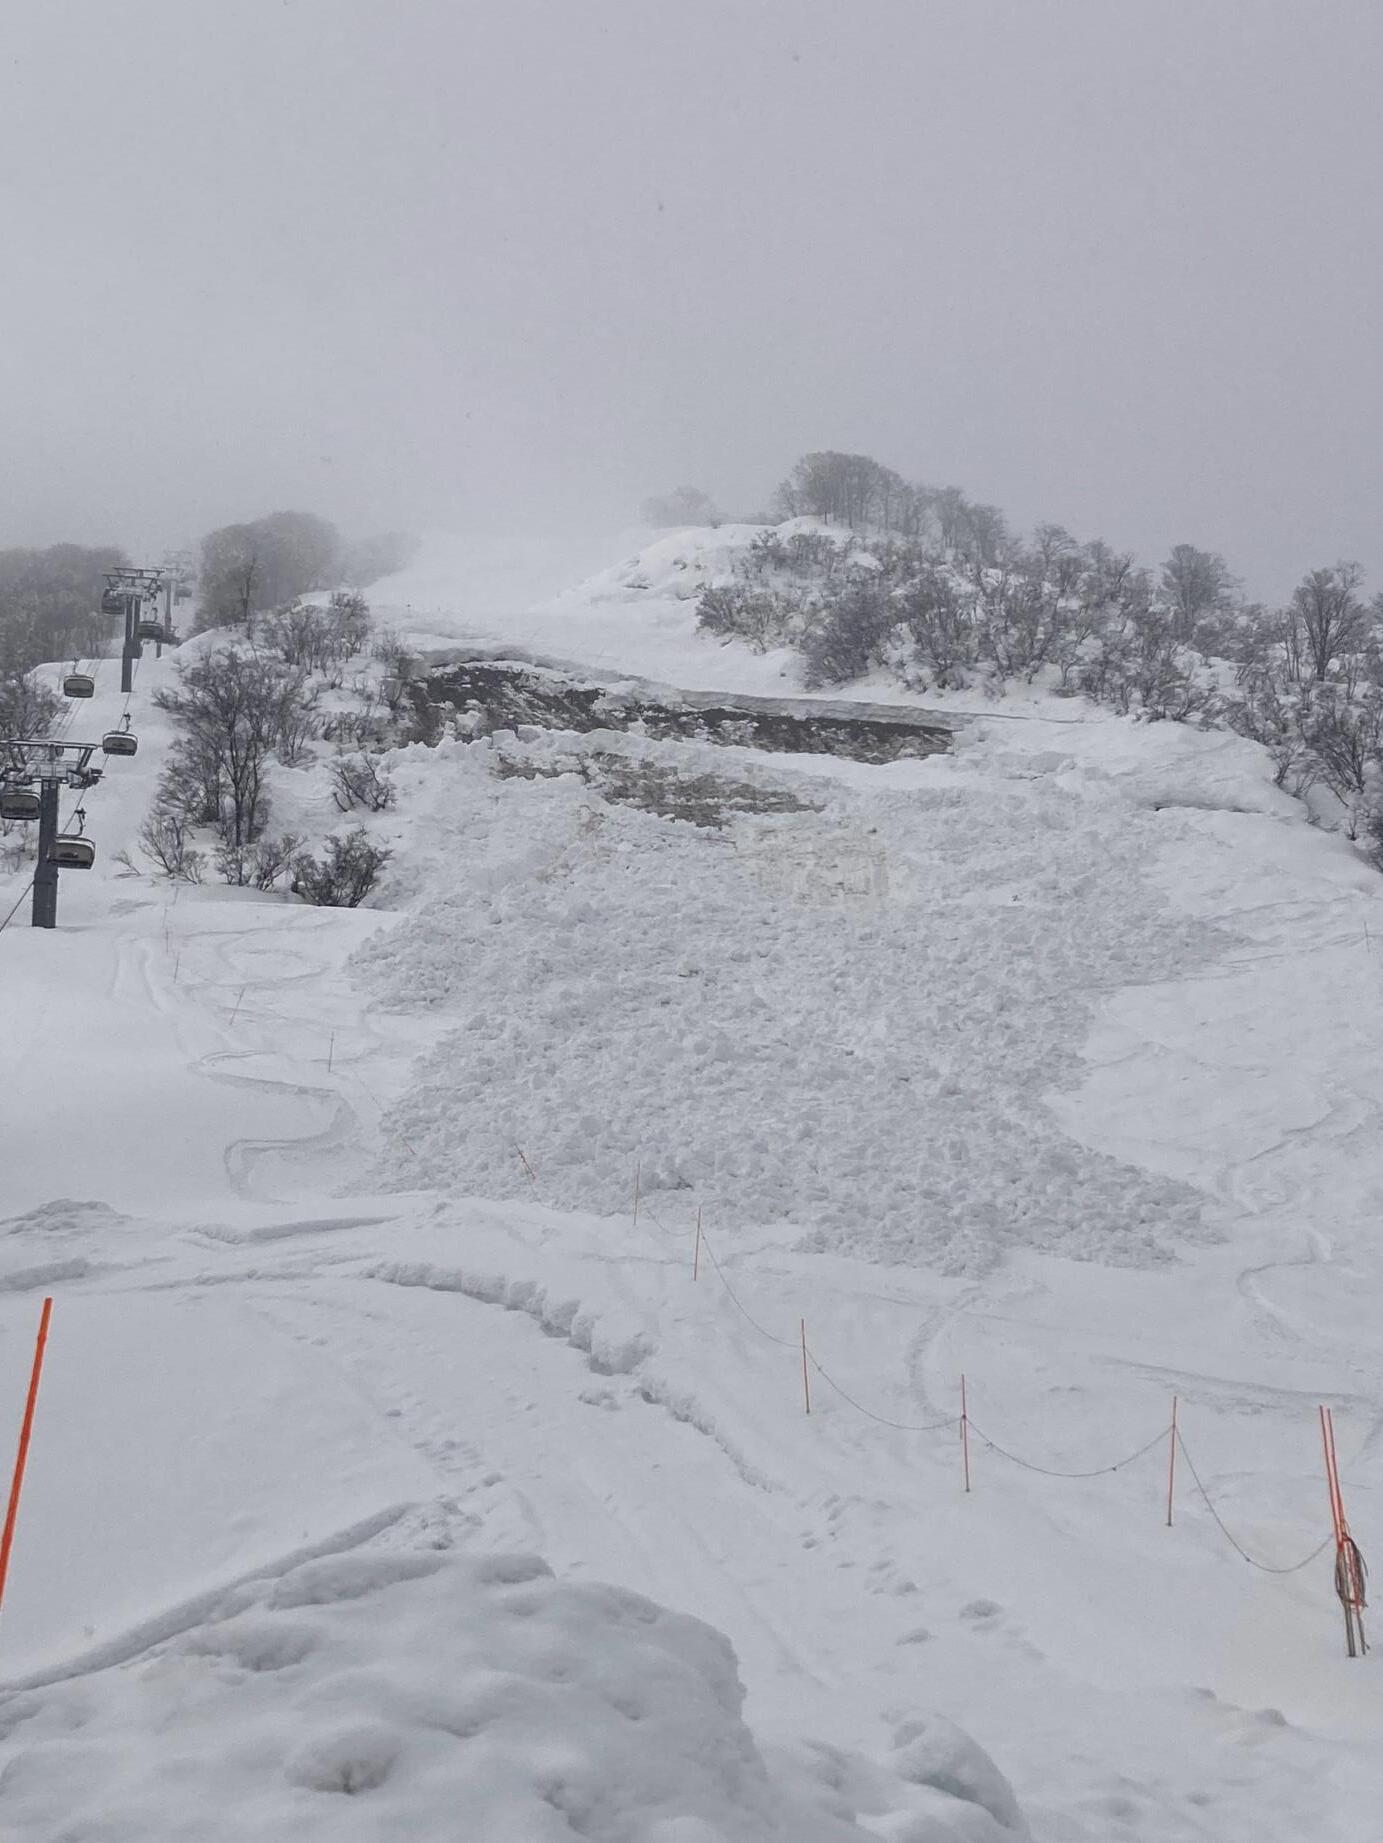
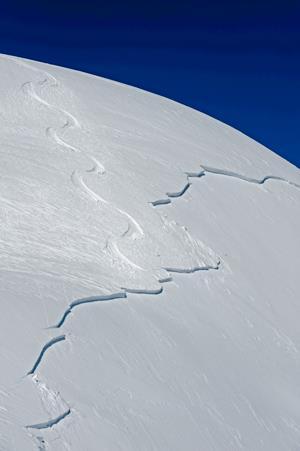
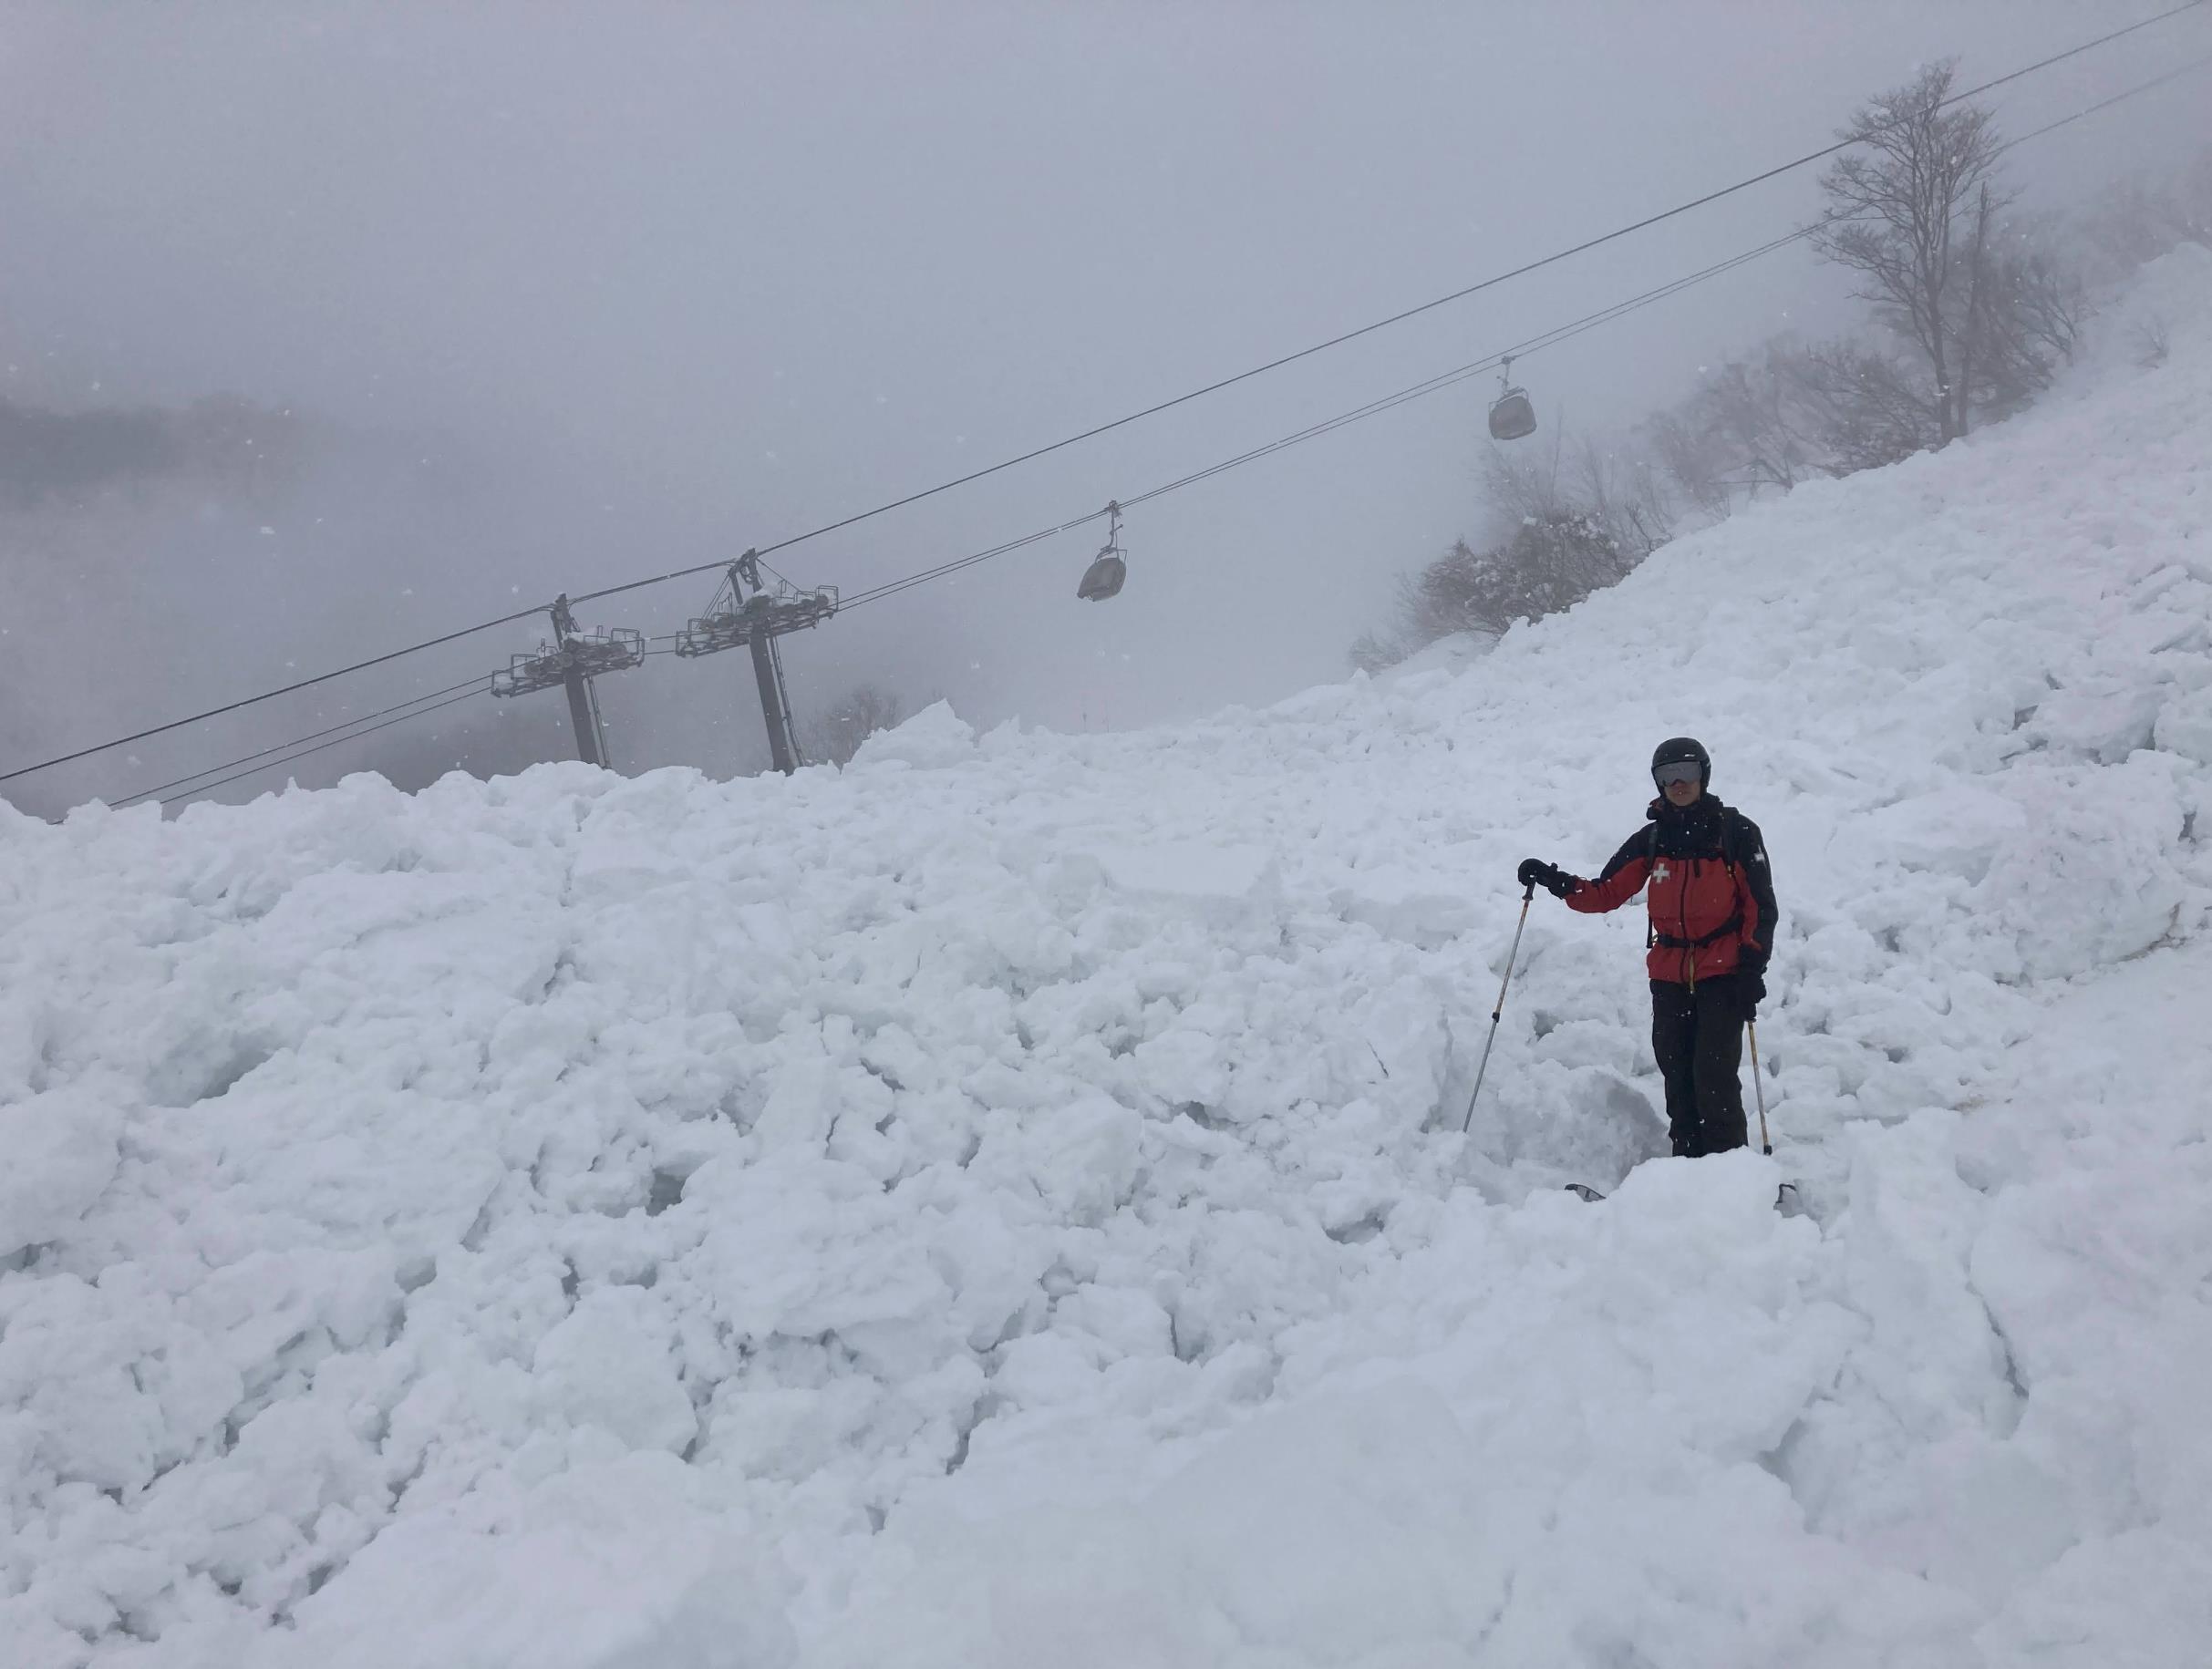
• Cracks appearing and growing
• Bulging at the lower boundary of the slab
• Warming
• Indicator glide slabs in the near backcountry
• History of the slope
• Cooling of the snowpack
• Reduced glide speed
• Glide slab avalanche activity slowing down / stopped
• Watch for bias!!!
• Rule based decision making
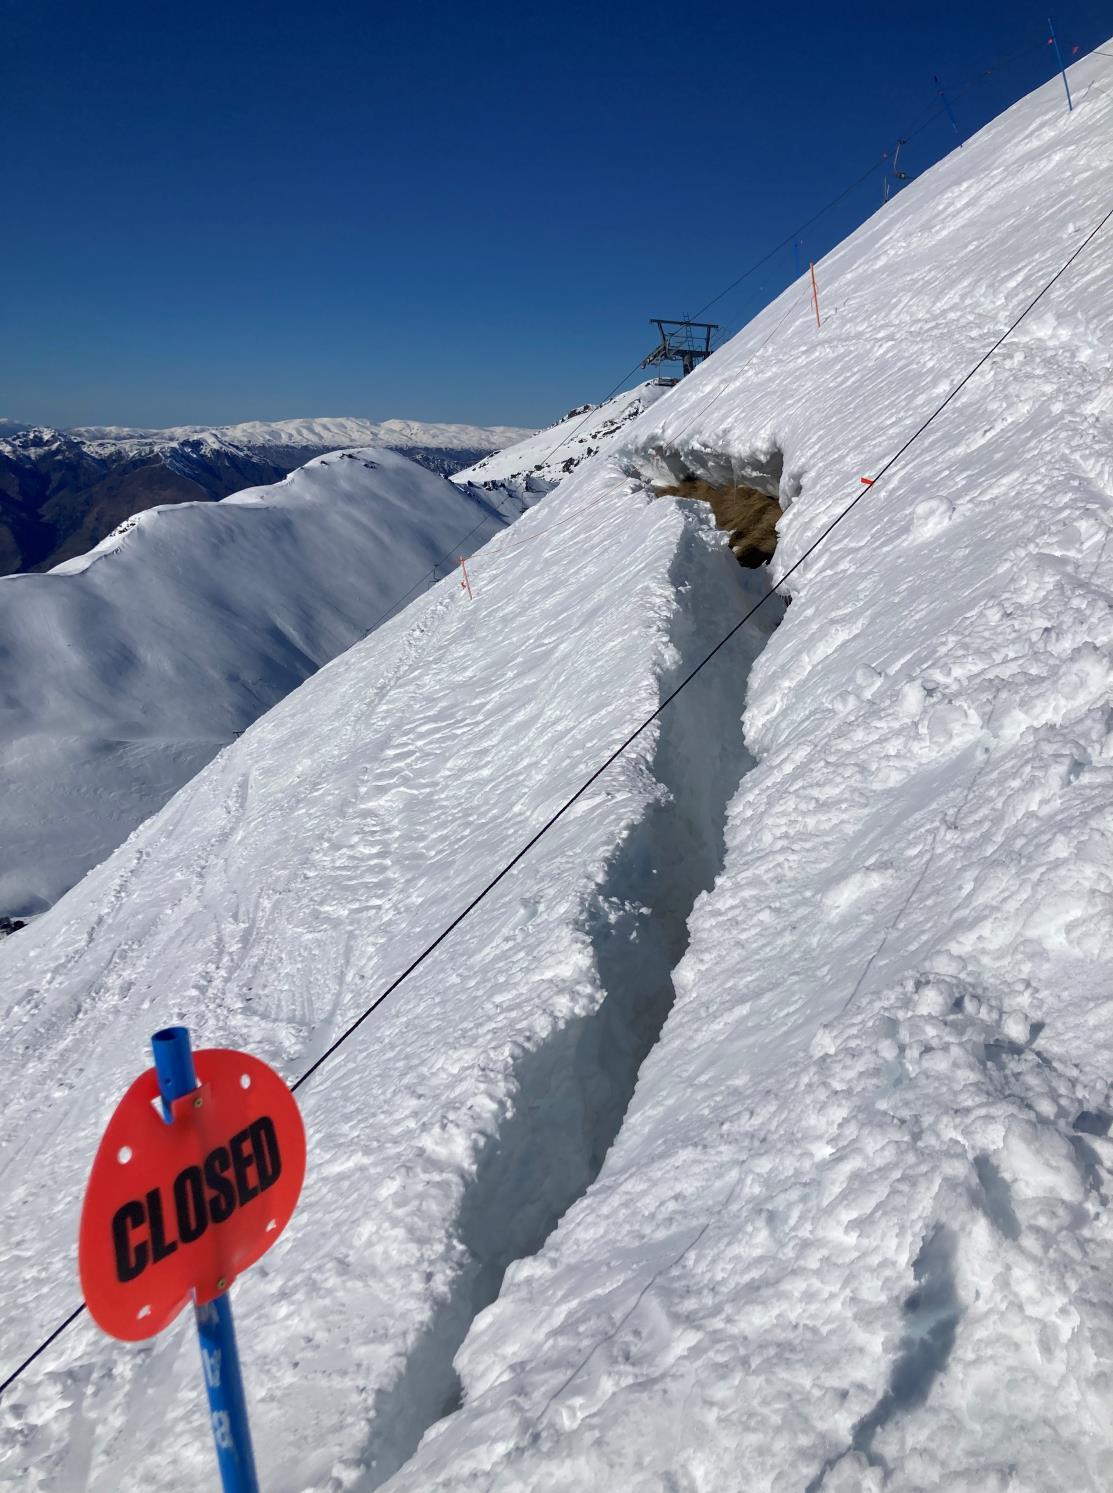
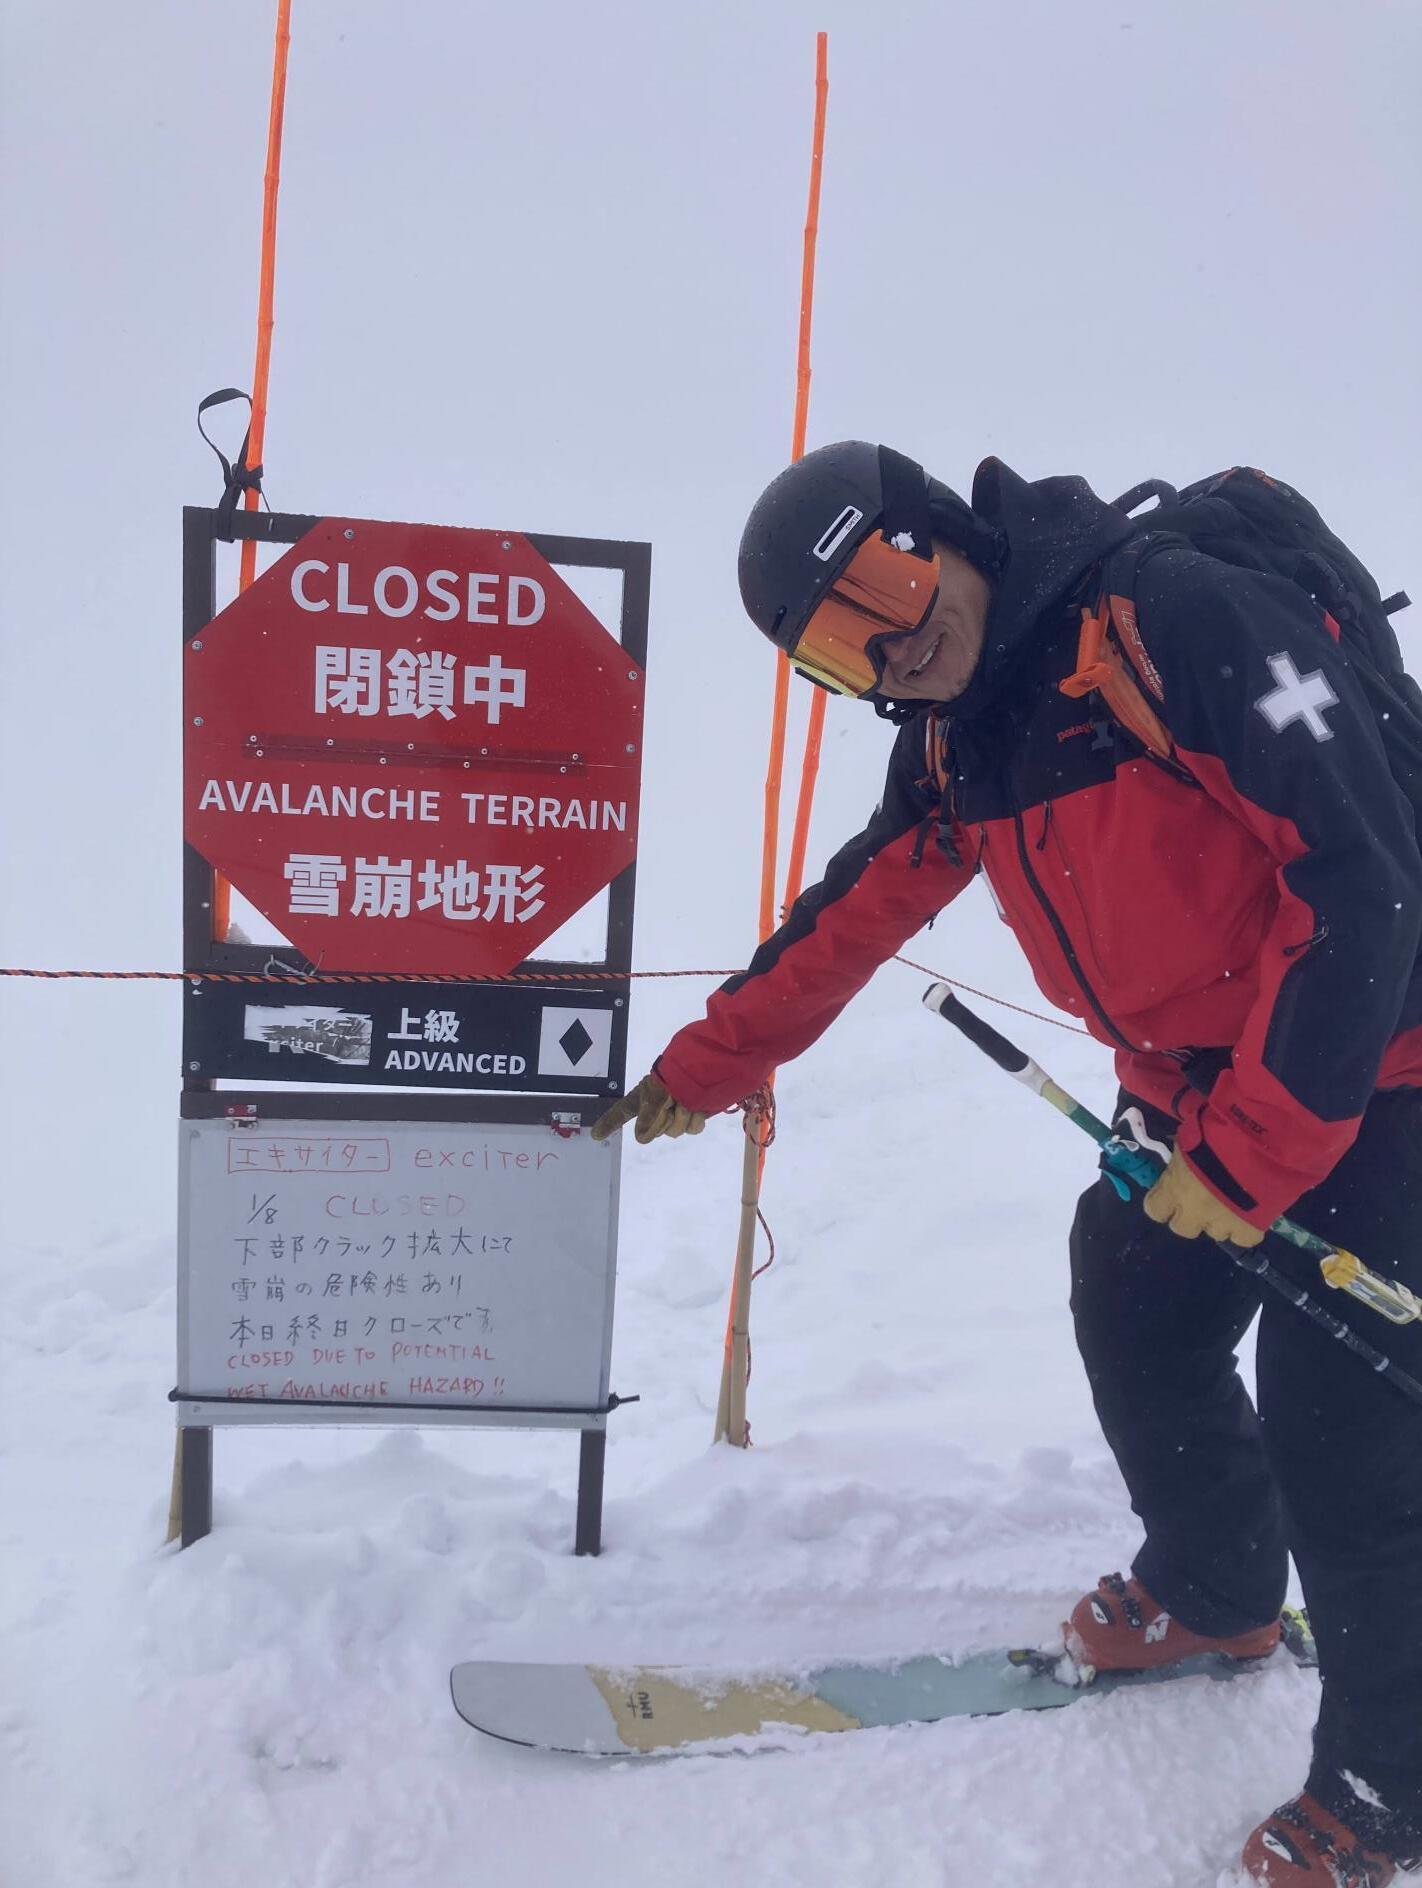
• If in doubt.... CLOSE
If you drop in here and push hard on the convex, you should trigger it. Might propagate to the right, so hold your speed and aim for the ridge on the left... You, ski there.... Fast.... Watch for avalanche....
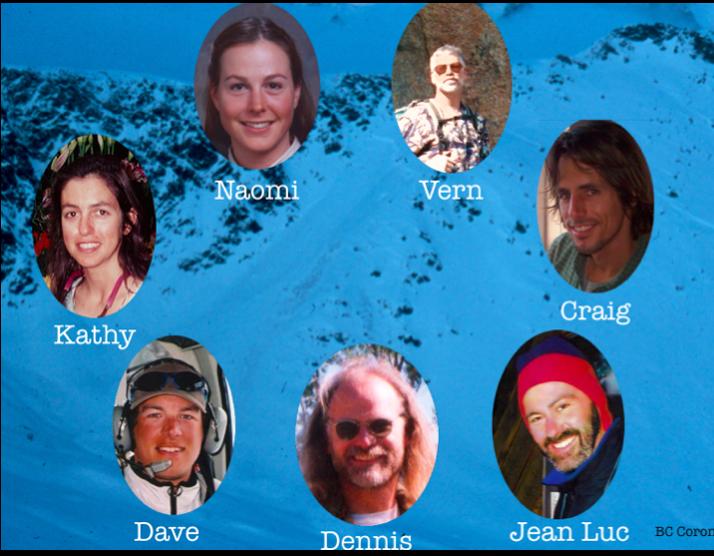
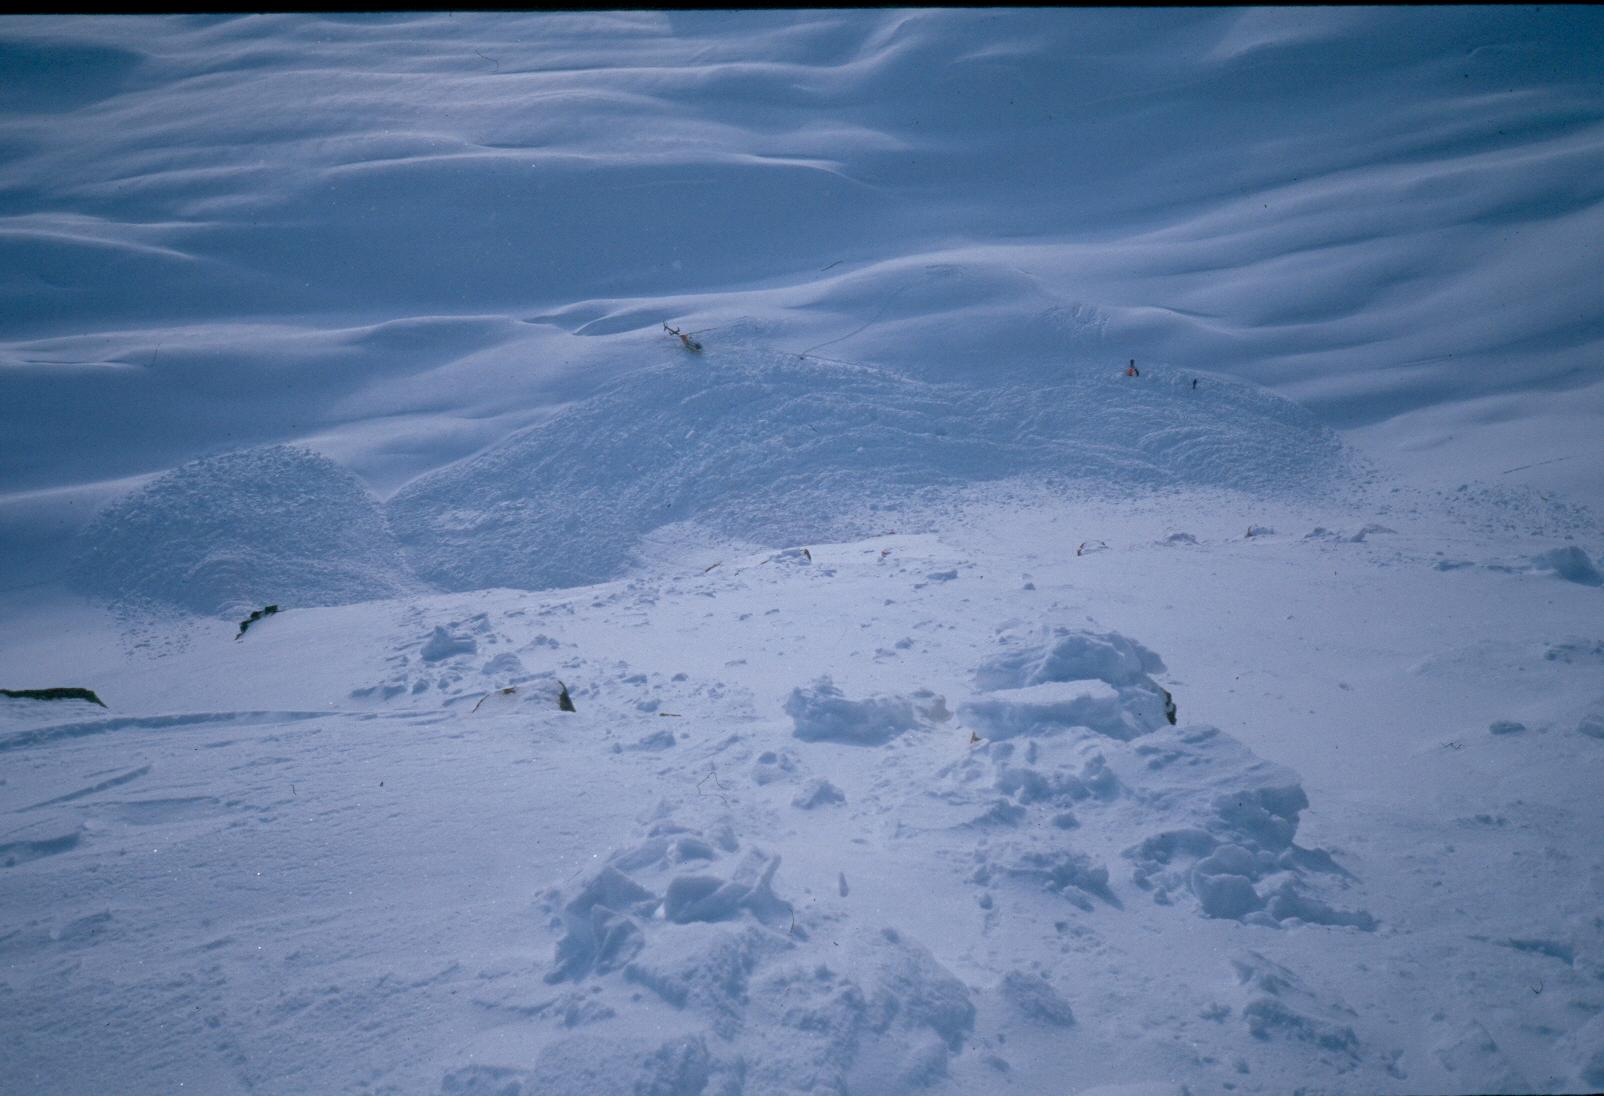
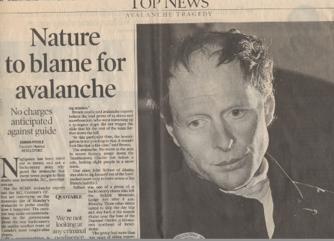
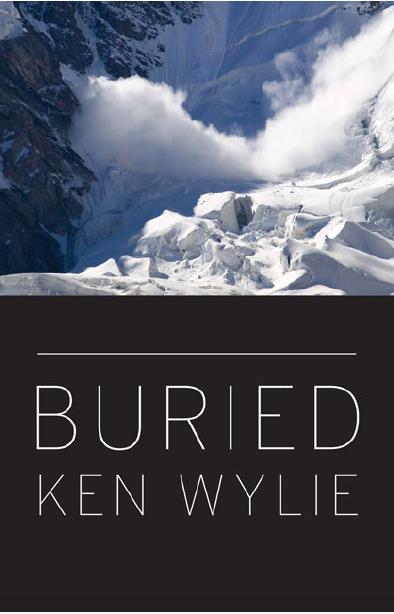
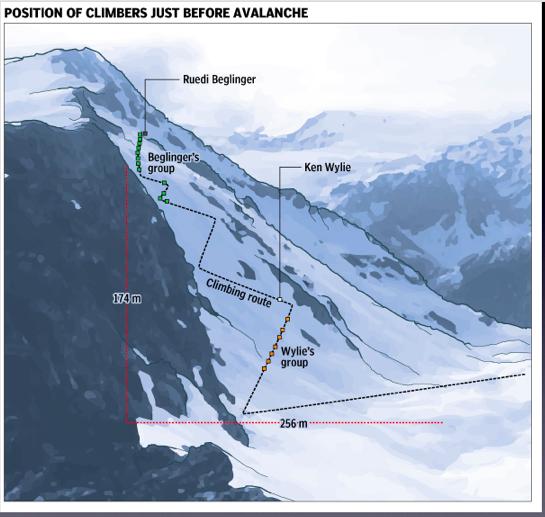
Presenter Ken Wylie


• Put yourself in our shoes and see yourself in our position
• Minute seemingly inconsequential choices
• Connect to your experiences
• La Traviata 2003 nuts and bolts.
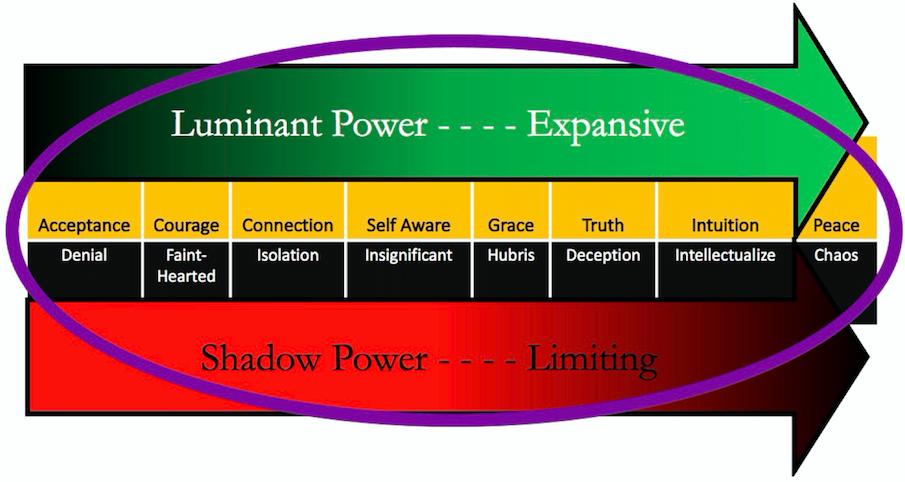
• Human Hazard Management Model:
• Expansive
• Limiting
• 4 Limiting Aspects
• PWL
• December V
• November Rain Crust
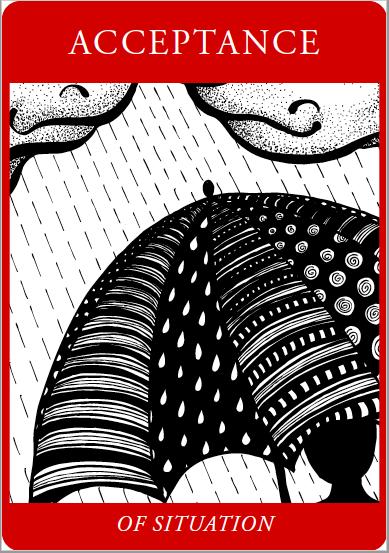
1) Acceptance
2) Courage
3) Connection
4) Self Awareness
5) Truth
6) Intuition
7) Peace

1) Acceptance
2) Courage
3) Connection
4) Self Awareness
5) Grace
6) Truth
7) Intuition
8) Peace
1) Denial
2) Faint-Hearted
3) Isolation
4) Insignificance
5) Hubris
6) Deception
7) Intellectualize
8) Chaos
•
•
• Situation
• Conscience / Intuition
• Self Acceptance
• Seeking Acceptance
• Risk Tolerance
• Vern
• Frighten Guests
• Snowpack Features
• Terrain
• Group Management
• Social • Intellectual • Moral
• Morally

• Excessive Pride
• Strode Forward
• Morally