13 minute read
Maintaining momentum
Although using site areas as intensively as possible to meet minimum capacity density requirements may increase the overall energy production, there are downsides: increased turbine interaction energy losses (internal and external wakes and global blockage effects); as well as increased wake-induced fatigue loads for downstream turbines may lead to reduced lifetimes and/or premature damage of the asset. In other words, any marginal gains may be lost, and there may be an increased levelised cost of energy (LCOE).
This issue could be further compounded by the ever-increasing turbine rotor blade size. Given the timescale of projects, it is highly likely that the first offshore wind farms in Poland will use larger turbines than those already installed at existing projects, or planned for projects in more advanced stages of development. These larger turbines are trending towards a lower specific power,meaning that although they have longer blades and greater swept areas, the nameplate capacity is not increasing proportionately.4
The trend of decreasing turbine-specific power in the UK offshore wind market has previously been assessed.5 It has been shown to result in better low-wind performance and better capacity factors for offshore wind farms (i.e., the ratio of net energy yield production to the maximum possible energy yield production). Whilst this explains the latest trend in decreasing turbine-specific power, it has exciting implications for layout design and resulting capacity densities.
Table 2. Future turbine technology assumptions and resulting project scenario assumptions
Scenario one Scenario two Scenario three
Turbine nameplate rated power (MW) 15 20 25 Hub height (m above mean sea level) 140 160 180 Rotor dia. (m) 236 270 300 Wind farm capacity (MW) 1200 1200 1200 Number of turbines 80 60 48
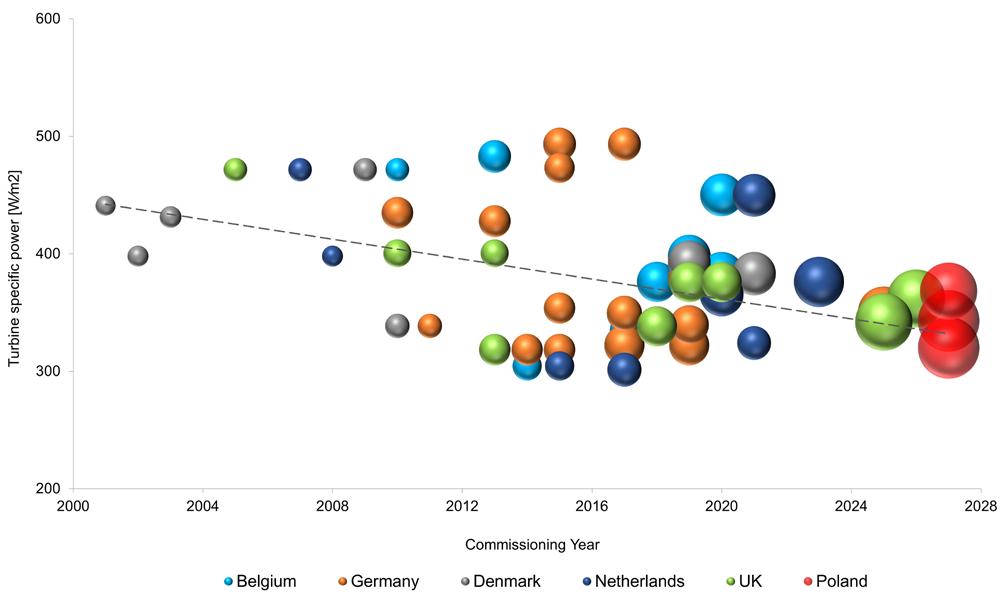
Figure 3. Trend of turbine specific power observed in Europe from 2000. Each sphere refers to a turbine model, and the size of the spheres depicts the rotor dia.

Figure 4. Layout scenarios considered. Ellipses illustrate the 7D by 4D turbine spacing assumed.
Further analysis with potential scenarios
As a result of this thinking, Wood Thilsted have investigated this further by analysing potential scenarios that consider how the following factors might impact offshore wind farm layout design in Poland: F The trend in future turbine technology.
F How this translates to project capacity density for
Poland’s regulatory approach.
F What this means for the resulting impact on turbine interaction effects.
Three scenarios have been modelled based on a theoretical project with the following parameters: F Site area of approximately 110 km2, seen to be representative of typical offshore project development areas in Poland.
F 1200 MW installed capacity, in order to achieve the minimum 8 MW/km2 capacity density set by Polish regulators.6
F Regular turbine spacing of approximately 7 rotor dia. in the prevailing wind direction (assumed to be westerly) and 4 dia. in the transverse directions in a rectangular grid.
F Approximately 10.0 m/sec mean wind speed at the proposed turbine hub heights.
The three scenarios have considered future turbine technology assumptions as shown in Table 2.
The turbine rotor dia. have been determined to obtain a turbine-specific power of between 340 W/m2 and 360 W/m2, a range defined based on the trend observed in Figure 3. Using the above assumptions, the theoretical turbine layouts shown below have been put forward as working scenarios.
The company has also calculated the turbine interaction effects for the scenarios considered using the Eddy Viscosity wake model, within WindFarmer Analyst, with large wind farm correction, including an assessment of the blockage effects. The results are shown in Figure 5.
This study indicates that, in this situation (fixed site area, fixed project installed capacity, and minimum capacity density of 8 MW/km2), increasing the turbine size from 15 MW to 25 MW could achieve lower turbine interaction losses, despite the larger rotor dia.
However, it appears that there is a sweet spot in terms of turbine size (MW and rotor dia.) for the Polish offshore
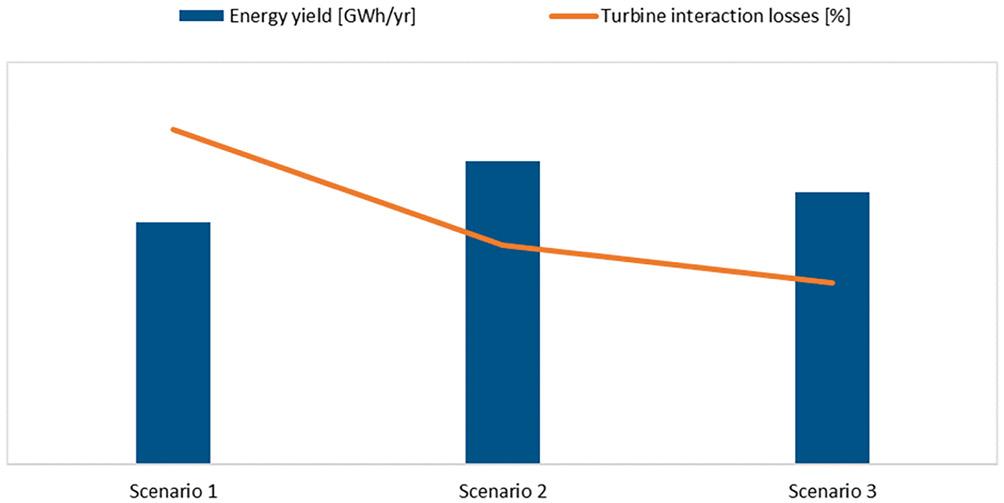
wind market. A balance must be reached between the additional energy yield that comes from using larger turbines, and the reduction in yield that comes from having fewer turbines (with larger swept areas but with proportionally lower nominal capacities). In this example, the drop in number of turbines from 60 x 20 MW turbines (in scenario two) to 48 x 25 MW turbines (in scenario three), is not compensated by the additional yield that can be generated by the 25 MW turbine. It should be noted that this study does not take into account any other technical loss factors such as availability and electrical efficiency, which will also be impacted by the project configuration. Nor does it consider alternative turbine layout design techniques such as edge-packing or irregular grids, which will have some impact on the resulting turbine interaction effects (both internal wakes and blockage effects). Notwithstanding this, depending on the specific market, this study still serves to illustrate that perhaps ever-larger turbine models may not always be the obvious choice in achieving an ever-lower cost of energy for offshore wind farms.
Taking everything into consideration, it seems likely that Poland will not see the large spread of project capacity densities seen elsewhere. When designing layouts, developers will try to maximise energy yield and asset life by spacing the turbines out as much as possible – whilst still sticking to the minimum turbine density set. As is, simply by complying with the minimum capacity density requirements of 8 MW/km2 , developers will already see increased turbine interaction effects in their projects, and all the issues that come with it (increased energy losses and increased turbine loading primarily). Therefore, logically, they will seek to avoid capacity densities above the minimum prerequisite.
Intriguingly, another possible outcome of the regulatory conditions in Poland may be that developers buck the trend of adopting turbine models with increasing rated power, and use turbine models that deliver higher energy yield output, whilst accepting the higher turbine interaction effects that will bring. Implementation of wake management techniques (for example wake steering or axial induction control) could be a solution to mitigate those higher wake effects, reduce structural loads, extend project lifetime, and consequently decrease LCOE.
Careful layout design will also have a key role to play in the successful optimisation of offshore wind farm projects in Poland, whilst meeting regulatory requirements. Though this can help minimise turbine interaction effects, there are multiple factors that impact the overall optimal design of a layout. These include bathymetry, soil and metocean conditions (impacting feasibility of certain foundation types, foundation design, and cost), as well as electrical system
Figure 5. Indicative energy yield production (after turbine interaction effects) and turbine interaction effect losses estimated for the three scenarios considered. Figure 6. According to Wood Thilsted, developers – when choosing the best solution for Poland – may buck the trend of adopting turbine models with increasing rated power and instead use turbine models that deliver higher energy yield output. design (impacting electrical efficiency and balance of plant cost). A holistic approach to all these aspects will be crucial to delivering an optimised project. Finally, as turbine technology continues to evolve, the industry may see more tailored turbines and solutions offered by manufacturers to adapt to specific market requirements. Developers should try to take advantage of the relatively low wind and wave extremes seen in this part of the Baltic Sea, and push the design envelope to focus on addressing high waked-turbulence conditions, rather than other design drivers.7 This might assist developers of Polish projects to overcome the many technical challenges. Overall, the relatively benign conditions of the southern Baltic Sea may come to be of great benefit to the offshore wind industry there.
References
1. Act of 18 December 2020 on the Promotion of Electricity Generation in Offshore Wind Farms. 2. The ratio of the wind farm’s rated capacity to the wind farm’s site area in MW/km2 3. Baltic LINes, ‘Capacity Densities of European Offshore Wind Farms’, Report conducted by Deutsche WindGuard GmbH, (June 2018). 4. The ratio of turbine nameplate rated power to turbine rotor swept area [W/m2] 5. GOV.UK, ‘Potential to improve load factor of offshore wind farms in the UK to 2035’ (September 2019). 6. The wind farm area used to derive the capacity density has been calculated using Delaunay Triangulation, as proposed by the Danish Energy Agency. 7. ALARI, V., ‘Multi-Scale Wind Wave Modeling in the Baltic Sea’, (September 2013).
Borbala Trifunovics, Director, Arup, UK, describes how port infrastructure and supply chains are key for floating offshore wind, but highlights that it requires careful management to create the right conditions for the industry to thrive.
With huge wind resource potential located offshore in deep waters around the world, floating wind power is expected to play an increasing role in meeting net zero targets. Developing the port infrastructure and supply chain required for building commercial scale floating wind farms is both the biggest barrier to rapid roll-out and one of the greatest opportunities for the supply chain and domestic economies.
Such has been the success enjoyed by offshore wind power around the world that some countries, including the UK, have all but used up their supply of suitable near-shore sites in shallow waters. Other countries, such as Japan, have access mainly to deep-water locations. In fact, 80% of the world’s offshore wind resource potential lies in waters deeper than 60 m. A dramatic acceleration in the deployment of floating offshore wind is expected to help developers realise opportunities in these areas.
The Global Wind Energy Council (GWEC) predicts that floating offshore wind will reach full commercialisation by 2030 with at least 6 GW installed globally. In its report, Floating Offshore Wind – a Global Opportunity – the council identifies five countries – Ireland, Italy, Morocco, the Philippines, and the US – with significant floating wind potential. The report predicts that they, together with the most mature markets in the UK, South Korea, France, and Japan, could spearhead the next wave of floating wind.
However, this dash for floating wind will be from a standing start. While the UK leads the world in terms of installed capacity, its Kincardine and Hywind developments – at 2 MW and 30 MW respectively – are on a demonstration scale. And the country does not yet have its own supply chain and port infrastructure tailored to the needs of large scale floating wind, which differ significantly from those of fixed developments. The floating substructures for both Kincardine and Hywind were manufactured by the Navantia-Windar alliance in Spain and shipped from their Fene shipyard to Rotterdam, the Netherlands, to have turbines mounted before being towed to the installation site from there.

Substructure products and materials
Globally, there have been approximately 10 such pilot projects, but nobody is yet building at the larger scale required to make floating wind commercial. Whereas fixed foundations are jacket or monopile structures designed individually, with a standard template adjusted for local conditions, floating substructures are designed by technology providers (as products that can be deployed across geographies).
The technologies under development by different companies fall into four key types: F Semi-submersible: a truss structure that relies on the buoyancy of its hulls and units for stability, meaning it has a wide footprint of up to approximately 100 m.
F Spar: a long, slender substructure with a large draft of up to 100 m, with stability provided by ballast within its structure.
F Barge: a single-hull structure with buoyancy and stability provided by its overall structure, its dia. is typically 50 - 70 m.
F Tension-leg: a lighter-weight structure that relies on tensioned cables attached to the seabed for stability.
The products with high technology readiness levels include a mix of topologies and materials: F Principle power (semi-submersible, three hulls).
F Stiesdal (tetra semi-submersible, suspended weight spar, tension-leg platform).
F Olav olsen (concrete semi-submersible).
F Saitec (concrete, barge).
F Ideol (concrete, or steel barge).
So, it is clear there is not a one-size-fits-all solution. While semi-submersible and barge-type substructures have been the most widely used on pilot projects to date, all the different systems have their merits in different met ocean conditions. For example, spars have been used for demonstrator projects in Norway, where the deep water enables the spar to be fabricated in the vertical position.
Then there is the question of the material used to fabricate the substructures: steel or concrete. It is likely, at least initially, that steel substructures will be built in areas where the necessary skills are concentrated – for example, in areas of shipbuilding expertise, such as South Korea. Skills in concrete are much more widely distributed, with transferable expertise from the building and infrastructure sectors, and so fabrication is less likely to be tied to particular areas.
In addition, while building ships one at a time over a long period is not the same as mass producing dozens of floating wind substructures, the shipbuilding industry is well suited to fabricating steel substructures: it has sophisticated, automated welding techniques and a well-developed supply chain. With concrete, there is more room for innovation and new entrants to the market. This could come from players such as Spanish and Italian companies experienced in large concrete caissons.
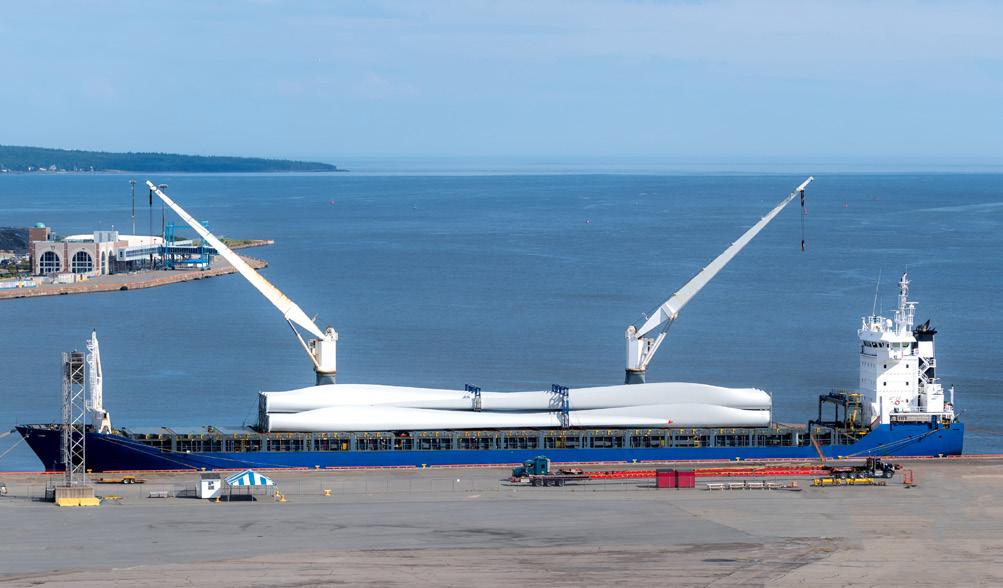
Figure 1. Ports need to prepare quickly and efficiently for the influx of floating offshore projects.
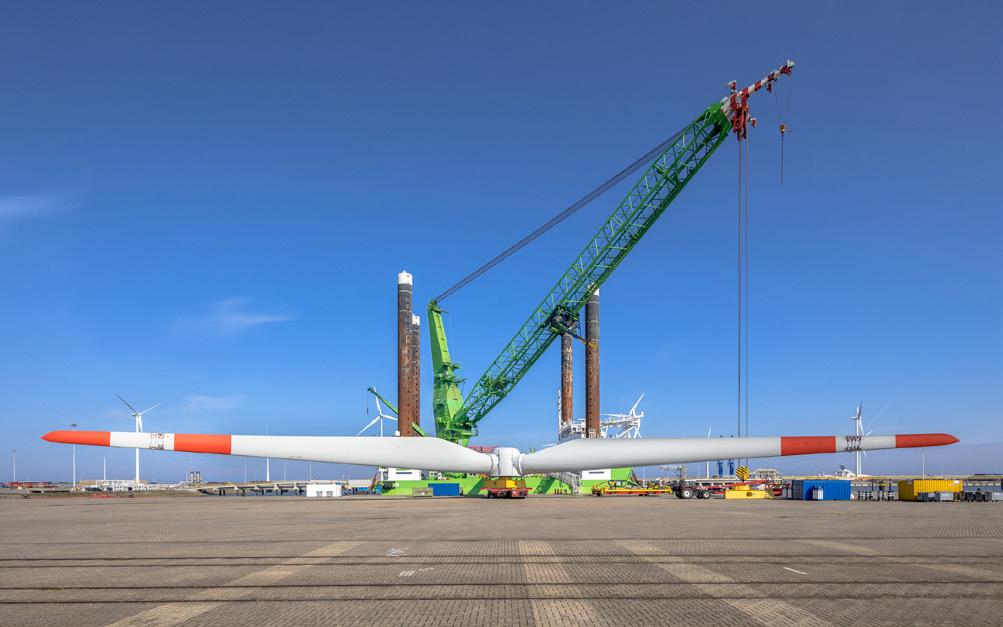
Figure 2. Countries around the world have ambitious offshore wind targets but lack the port infrastructure required to meet demand.
Port infrastructure requirements
For ScotWind, the first round of offshore wind leasing in Scottish waters for a decade, approximately 50% of developers bid for floating solutions, and they are likely to use semi-submersible or barge substructures. These are designed to be launched at berth and then towed out for installation. This means that, to some extent, the logistical sequence can be designed around the available port infrastructure – for example, by making use of buoyancy devices where port depth is shallower than the optimum.
However, there is no getting away from the fact that building commercial scale floating offshore wind installations requires enormous sites with port access, and supply chains established around these sites. As the team at Arup works with clients on port and supply chain appraisals, they have established a clearer picture about what port infrastructure should consist of for a typical project.
Ports for marshalling and construction logistics need to be close to installation sites, typically within three days towing time for tugs to ensure they reach the site safely in a suitable weather window. The location of these ports will therefore be dictated by the location of installation sites, and they are likely to be dotted around the coast. For the UK, this means along the coastlines serving the areas of focus in Scotland, North-east England, and the Celtic Sea.
Then there is fabrication. Building, for example, 50 or 80 units for a commercial scale floating wind project within a couple of years will require a few centralised facilities that can manufacture cost-effectively and on a high-utilisation basis. Whoever can establish such facilities first is likely to grab the lion’s share of the market in a particular country.
This will not be an easy task, though. Countries do not have ports sitting idle, without an existing customer base, and with sufficient hardstanding space with the bearing capacities required, as well as wet and dry storage alongside


