13 minute read
Expanding the degrees of freedom

Dr Joey Walker, EffecTech, UK, looks at how to improve and optimise existing sampling systems for LNG inspection.

LNG production and trade has been on a significant growth curve over the past decade. In 2020, global LNG demand reached 360 million tpy and this is expected to double by the year 2040.1 The success of LNG as a key contributor to the energy mix can be attributed to its flexibility and resilience, especially during the 2020 economic hardship caused by the COVID-19 outbreak.
What remains an unknown is how accurately LNG volume and physical properties can be measured, which, when combined, produces a final total energy value for custody transfer agreements. A small error in final energy measurement can translate to significant financial risk on both sides of the contractual agreement. The general practices of measurement adopted by the natural gas industry are difficult to apply to LNG because it is a cryogenic liquid. Industry has responded to this issue by producing equipment and instrumentation suitable for measurement in the cryogenic liquid phase, however the development, calibration, and testing of such apparatus requires many years of research and collaboration. Industrial operators are likely to remain conservative in their approach to new measurement technology, therefore existing sampling system installations are expected to remain unchanged or replaced, unless they are proven to be inadequate. EffecTech, which already offers performance evaluations for natural gas instruments to ensure confidence in measurement, has focused on how to improve and optimise existing sampling


systems using a combination of thermodynamic modelling and Monte-Carlo simulations, as part of the development of a sampling system inspection service for LNG customers.
How to sample and measure LNG
When LNG is loaded onto a cargo ship and is transported over significant distances, it undergoes a natural boiling process as a result of the natural heat influxes that penetrate the storage vessel, generally referred to as ‘ageing’.2 This boiling process produces a vapour phase that is rich in lighter hydrocarbons, therefore having a different composition to the liquid phase. Consequently, the quality characteristics of the LNG have changed. This necessitates the requirement to measure the LNG composition during onloading and offloading processes to account for the difference in composition, such that the correct monetary value can be allocated. The more accurately the composition is determined, the lower the risk that is incurred on both sides of the contractual agreement.
The current method for measuring LNG composition requires taking a sample, vaporising it, and measuring it with a gas chromatograph. This is a very challenging process since the LNG must undergo a phase transition from a cryogenic phase to room temperature conditions suitable for chromatographic analysis. The complexity of LNG sampling systems has resulted in the development of international standards and guidelines that provide best practices from industry. ISO 8943-20073, BS EN 12838 – 20004, and the GIIGNL custody transfer handbook5 are the leading reference materials that cover methods for LNG sampling, conditioning, and measurement.
The main components that make up an LNG sampling system include: the sampling line, vaporiser, gas homogeniser, sample cylinders, gas chromatograph (GC), and auxiliary equipment such as control valves, compressors, and temperature sensors. The most common way to take an LNG sample is with a sampling probe which is inserted directly into the LNG loading/unloading transfer lines. Once the LNG is sampled and vaporised, the gas is either continuously fed into gas sample holders for offline analysis, known as continuous sampling, or the gas is continuously fed into a constant pressure floating piston (CP/FP) cylinder and partly directed to a GC for real-time measurements, known as intermittent sampling. The choice of sampling procedure is stipulated in contractual agreements; however, the intermittent sampling method has become more obsolete for custody transfer since it has more moving parts.
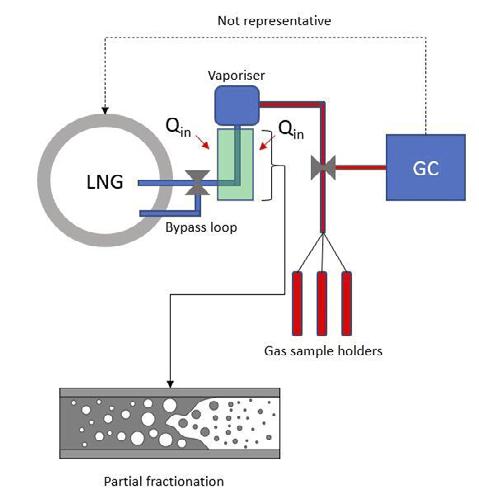
Figure 1. Illustrating the partial fractionation of LNG as it absorbs heat (Qin) from the surroundings.
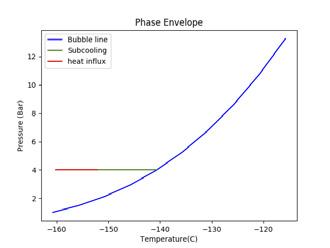
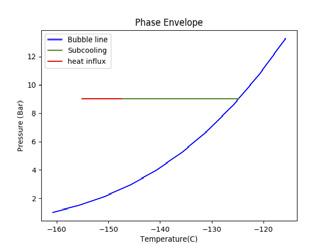
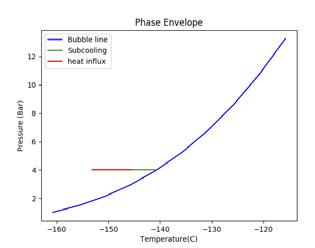
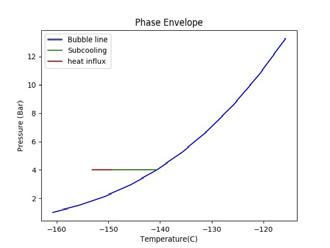
Figure 2. Illustrating the impact of pressure and temperature on subcooling capacity of LNG. A generic LNG composition and general sampling parameters have been selected for this illustration. (A) shows a high sampling temperature, low pressure case that fractionates; (B) shows a high pressure case; (C) shows a low temperature, low pressure case.
What type of sampling issues can be encountered?
LNG sampling probes require suitable insulation to prevent external heat from penetrating the cryogenic liquid. Some heat may be absorbed by the sampling line from the surroundings as the LNG is sampled, however the amount of heat should never exceed that which would increase the temperature of the LNG to beyond its bubble point. Sampling probes are normally combined with an in-line vaporiser which is responsible for fully converting the cryogenic LNG to ambient temperature gas. If the LNG is permitted to boil before it reaches the vaporiser, lighter hydrocarbons and nitrogen will preferentially boil-off resulting in a partially fractionated liquid, as illustrated in Figure 1. Fundamentally, the LNG composition has changed and this will be reflected in the measured gas composition. At this point, the LNG is not representative of the source from where it was sampled.
Reducing the likelihood of LNG prevaporisation
There are a number of ways to mitigate the pre-vaporisation of LNG. Primarily, the aim is to maximise the degree of subcooling
A B C

(or degrees of freedom) the LNG has to combat various heat influxes. Combining the sampling probe with a high-quality insulation material, or ideally vacuum insulation, can help reduce the natural heat influx. However, heat leakage may present itself at critical isolation points and flange connections along the sampling system, which is an unfortunate inevitability, though not likely to have the greatest impact.
To increase subcooling, the LNG can be pressurised to increase its bubble point or reduced in temperature to maximise the difference between the bubble point and sampling point. Figure 2 demonstrates the impact of altering pressure and temperature on the subcooling capacity of LNG. The blue line shows the bubble line (liquid phase on the left hand side of the blue line and two-phase vapour/liquid on the right hand side of the blue line). The green line shows the degree of subcooling the LNG has before it reaches its bubble point (the intersection of the green and blue line). The red line shows the amount of heat influx, as a proportion of the subcooling, that is absorbed into the LNG. The beginning of the red line is the sampling point.
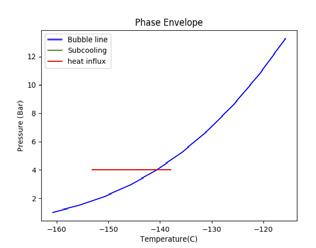
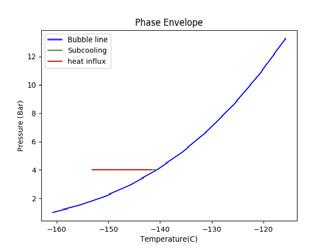
Adjusting sample line length can provide higher degrees of subcooling. Shorter sample lines provide better insulation since they have a smaller surface area that reduces heat transfer from the surroundings to the flowing LNG. Figure 3 demonstrates the impact of four different sampling line lengths, (A) 0.5 m, (B) 1 m, (C) 1.5 m, and (D) 2 m, on LNG subcooling capacity. The figures shown are only for demonstration purposes. Optimal sample line length can only be determined on a case-by-case basis since sampling system parameters can vary significantly.
It is clear from Figures 2 and 3 that higher sampling pressures, lower sampling temperatures, and shorter sample line lengths provide the largest subcooling capacity. There are numerous sampling system parameters that can be investigated. For example, the type of insulation used around the sampling line/probe has a substantial impact on the heat transfer taking place at the interface between the LNG and the surroundings.
From sampling parameters, expected parameter ranges, and expected LNG compositions, it is possible to create a performance profile to pinpoint system vulnerabilities. A Monte-Carlo simulation, already used by EffecTech for performance evaluations of natural gas instruments, has proven to be a robust approach since numerous scenarios may be evaluated.
Figures 4 and 5 show examples of subcooling capacity dependence on pressure and LNG sampling temperature for 2000 simulated scenarios covering a wide range of LNG compositions and sampling conditions. Subcooling residual is defined here as the remaining heat capacity of the LNG following heat absorption through the sampling line. A subcooling residual of less than zero indicates that the subcooling capacity of the LNG has become depleted and it therefore has reached its bubble point. It is clear from Figures 4 and 5 that for this specific scenario, LNG temperatures below 107.5 K and LNG pressures above 5.5 bara are required to prevent LNG pre-vaporisation.
Furthermore, modelling multiple LNG sampling scenarios can help uncover boundary conditions for optimal sampling. In addition, maximising the LNG subcooling capacity can provide
MICRO SCALE LNG PRODUCTION
Integrated purifi cation & liquefaction up to 30 ton/day

• Plug and play modular design • Turn-key projects • Power consumption as low • Easy scalable for future growth
Stirling Cryogenics BV
Science Park Eindhoven 5003 5692 EB Son, The Netherlands T +31 40 26 77 300 info@stirlingcryogenics.eu
extra protection against heat influx sources or sudden changes in system parameters, for example sudden pressure drops. However, there must be a trade-off with the vaporiser power output since more energy is required to fully vaporise a lower temperature liquid.
C D
Is LNG composition an important consideration in LNG sampling?
LNG import terminals may be subject to a wide range of compositions as cargoes are supplied from different locations which have different compositions and liquid characteristics. Each component present in LNG has a different boiling point and therefore contributes a different weighting to the overall bubble point of the LNG. Table 1 provides three typical LNG compositions and their corresponding Figure 3. Illustrating the impact of different sampling line lengths on LNG bubble points at pressures between 1 bara subcooling capacity. (A) 0.5 m; (B) 1 m; (C) 1.5 m; and (D) 2 m. and 9 bara. It is clear from Table 1 that there is a noticeable difference in bubble point, Table 1. Difference in bubble points (BP) for a lean, medium, and which is greater at lower pressures. Given a scenario rich LNG composition at between 1 - 9 bara where a sampling system is designed to sample at 120 K at 2 bar, these parameters would be suitable for a rich Amount fraction (%mol/mol) LNG composition since the difference between the sampling point (120 K) and bubble point (117 K) is 3˚ . Lean Medium Rich However, the same system would have a negative degree 1 2 3 of subcooling for the lean and medium compositions, leading to almost certain pre-vaporisation if accounting Nitrogen 0.10 0.50 1.60 for various heat influxes. Knowledge of the imported composition prior to LNG Methane 99.74 89.40 77.88 unloading is crucial for sampling system design. Ethane 0.10 7.00 13.80 Optimisation using a Monte-Carlo approach described hitherto can provide insight into how different LNG Propane 0.00 2.00 3.80 compositions behave and how the system parameters Iso-butane 0.02 0.50 1.30 described above can be fine-tuned to reduce heat influx and maximise the degree of subcooling.
N-Butane 0.02 0.50 1.30
Iso-pentane 0.01 0.05 0.16
N-pentane 0.01 0.05 0.16
Maximum difference (K)
BP at 1 Bara (K) 111.24 110.86 106.68 4.56
BP at 2 Bara (K) 120.25 120.37 117.23 3.13
BP at 3 Bara (K) 126.27 126.70 124.17 2.53
BP at 4 Bara (K) 130.94 131.61 129.51 2.09
BP at 5 Bara (K) 134.81 135.68 133.93 1.75
BP at 6 Bara (K) 138.15 139.20 137.73 1.47
BP at 7 Bara (K) 141.11 142.32 141.10 1.22
BP at 8 Bara (K) 143.78 145.13 144.14 1.36
BP at 9 Bara (K) 146.21 147.71 146.91 1.50
Assessing vaporiser performance
LNG vaporisers come in all shapes and sizes; however, the thermodynamic principles are the same. A sample of cryogenic liquid needs to be fully converted to its gaseous phase to prevent residual liquid forming at the vaporiser outlet. This process may be achieved at low pressure or at supercritical conditions. Supercritical vaporisers reduce the likelihood of residual liquid formation significantly as the conversion from liquid to gas does not proceed through the two-phase region of the phase envelope as shown in Figure 6.
For non-supercritical sampling, higher sampling flowrates require a higher heat output from the vaporiser to fully convert from cryogenic temperature to ambient temperature. Similarly, at lower sampling temperatures, more heat is required for the phase conversion as the absolute difference in temperature is greater. The required heat output from the vaporiser can be calculated from heat transfer equations. By combining mass flowrates, latent heats, and heat capacities, the required
energy output from the vaporiser can be determined. By comparing the required heater output to the actual heater output, an assessment of the vaporiser performance can be made. Temperature monitoring on the inlet and outlet of the vaporiser should be in place to confirm successful phase conversion. In addition, physical checks of ice formation on the external surface of the vaporiser can provide an indication of heat loss or a faulty unit.
Financial impact
From the aforementioned demonstrations, it is clear that sampling representatively for accurate measurement is needed. Since calorific value and density are determined from composition and are crucial in the calculation of total energy content for custody transfer, even a small mismeasurement in composition due to unrepresentative sampling can have a substantial financial impact. Conservative estimates of LNG measurement uncertainty which take into account LNG sampling, vaporisation, and measuring equipment hover at approximately 1%.5 Given the size of the LNG market and heavily fluctuating spot prices, a 1% uncertainty translates to hundreds of millions of dollars in financial risk. Improvements made in LNG sampling and vaporisation can help to reduce this risk, ultimately providing greater confidence in measurement.
Summary
The complexity and variability of sampling systems and LNG cargoes highlight the need to ensure sampling systems are capable of making error-free representative measurements. Thermodynamic modelling and Monte-Carlo simulations can be used to ensure that there is adequate subcooling to prevent pre-vaporisation and to ensure that the vaporiser is sufficiently powerful to completely vaporise the liquid sample. Modelling multiple sampling scenarios can expose vulnerabilities in the system and highlight significant parameter sensitivities. Optimising LNG sampling systems can provide higher confidence in complete liquid conversion and measurement and consequently reduce the financial risk during custody transfer.
To make sure all potential risks can be identified and assessed, EffecTech provides UKAS-accredited LNG sampling system inspections in-line with ISO 8943. Site-specific data is used to generate Monte-Carlo simulations using in-house software developed by EffecTech that allows the identification of safe operating envelopes and provides detailed recommendations for improvements. EffecTech is also accredited by UKAS for performance evaluations and as a producer of reference materials.
References
1. Royal Dutch Shell, Shell LNG Outlook 2021, (2021). 2. WOOD, D.A., and KULITSA, M., ‘Weathering /Ageing of
LNG Cargoes During Marine Transport and Processing on
FSU and FSR’. 10, Journal of Energy Resources Technology,
Vol 140, (2018). 3. BSI, ‘ISO 8943:2007 Refrigerated light hydrocarbon fluids – Sampling of liquefied natural gas – Continuous and intermittent methods’, (2007). 4. BSI, ‘BS EN 12838:2000 – Installations and equipment for liquefied natural gas. Suitability testing of LNG sampling systems’, (2000). 5. GIIGNL, LNG custody transfer handbook, (2017). Figure 4. Subcooling dependence on LNG temperature for 2000 simulated scenarios.
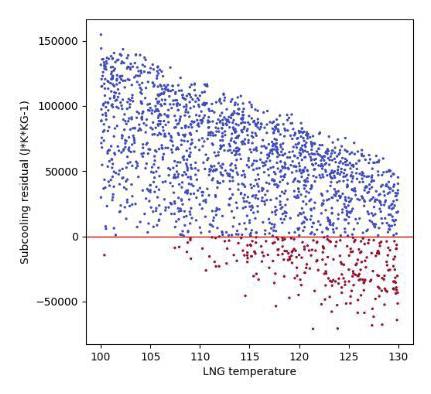
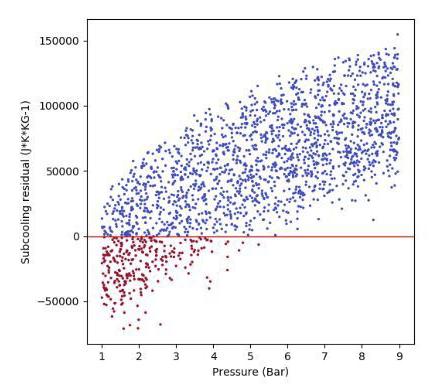
Figure 5. Subcooling dependence on LNG pressure for 2000 simulated scenarios.
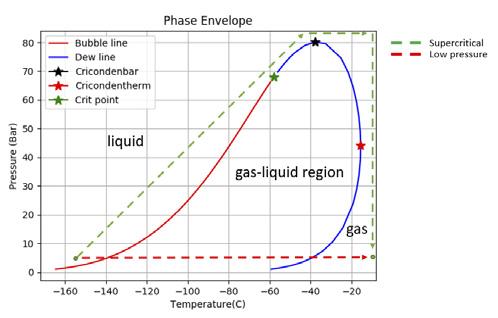
Figure 6. Phase envelope of a generic LNG composition demonstrating the different thermodynamic paths of LNG vaporisers.
