
14 minute read
Canadian LNG's last best chance?


Tom Choi and Chris Goncalves, Berkeley Research Group, USA, examine whether a net zero energy policy in the US will be Canadian LNG’s last best chance to scale up exports.


The Canadian natural gas industry faces the dilemma that its one export customer, the US, has diminished need of its supplies as US domestic shale gas production continues to surge. Despite rapidly growing US gas demand and rising volumes of US pipeline and LNG exports, US imports of Canadian gas have declined sharply during the past decade. Due to diminished demand, Canadian prices have languished with the benchmark AECO-C Hub price often trading well below US$2/million Btu, and at a steep discount to the US benchmark Henry Hub.
The obvious solution for Canadian gas producers is to develop access to alternative markets, which for Canada means LNG. With declining demand from its one neighbour, the only hope for Canada to monetise its vast natural gas resources is to convert it to LNG for shipment to foreign markets that offer much higher prices. Led by ravenous appetite for energy in China, India, and Southeast Asia, global LNG demand has grown approximately 50% over the past decade.
To be sure, Canada has formidable competition. During the last decade, several other countries with sufficient gas supplies to develop world-scale LNG plants have done so to seize the opportunity to capture a piece of the growing and lucrative LNG market. Australia has emerged as a global LNG export leader by developing LNG terminals in Queensland, as well as further development in the Northwest Shelf. The US has six LNG export terminals already fully operational, with two more under construction. Russia developed LNG liquefaction capacity in the Arctic region to complement its Sakhalin terminals so that Russian LNG can competitively reach both European and Asian markets. Australia and the US are now challenging Qatar to be the top LNG exporter, with Russia aspiring to join these industry leaders. Not to be outdone, Qatar announced a major expansion of its massive LNG export capacity to firmly entrench its primacy in global LNG. The tiny country has a built-in competitive advantage based upon its access to the North Field – the world’s largest non-associated natural gas field.
Meanwhile, numerous Canadian LNG projects have struggled to reach Final Investment Decision (FID) and Canada has yet to export any LNG. In efforts to connect LNG terminal locations to gas-producing areas, numerous Canadian LNG developers have been hamstrung by national and provincial regulations, negotiations with First Nations tribal groups, and infrastructure challenges. While Canada has an extensive natural gas infrastructure system, there is limited pipeline capacity from the gas producing areas to the planned coastal LNG sites. Expansion of the pipeline system would require clearing the daunting and costly challenge of crossing the Rocky Mountains which separates the producing areas from the British Columbia coastline. Thus far, only LNG Canada has managed to achieve FID.
Canadian LNG’s lack of success comes despite Canada being strategically well positioned for LNG exports to Pacific Basin markets. It offers all the prerequisites to develop a successful LNG project: abundant low-cost natural gas supply, available infrastructure (not just gas infrastructure, but also roads, electricity, and accommodations), established regulatory structure, access to


skilled labour, and political stability. The importance of the last point is underscored by the recent troubles that Total has encountered in Mozambique.
Above all, Canada is blessed with prolific, low-cost, natural gas-rich formations, such as the Montney, Duvernay, and Horn River basins. Including all types of resources, the Canada Energy Regulator (CER) estimates that Canada holds almost 1400 trillion ft3 of marketable gas. Natural gas producers in Canada are sitting on massive resources that they cannot monetise because low demand has depressed Canadian gas prices to the point that production is economically difficult to justify. One exception is the Montney formation, located in northeast British Columbia, which has experienced explosive growth during the past decade and now comprises almost half of the total natural gas production in Canada. A combination of tight gas and shale, the Montney formation is estimated by the CER to hold 567 trillion ft3 marketable gas, equivalent to approximately 100 years’ worth of supply at Canada’s current production rate. The significant resource volume of the Montney dwarfs the much better-known Marcellus/ Utica and Haynesville/Bossier formations in the US (Figure 1).
Furthermore, Western Canada has a significant geographic advantage to Asian markets as compared to the US Gulf Coast (USGC). For example, the shipping voyage from Kitimat, British Columbia to Shanghai, China takes approximately 10 days less than it does from the USGC, even using the most efficient route through the Panama Canal. The time savings translates to not only reduced shipping costs but also increased ability to respond to the region’s dynamic short-term market needs.
In fact, by the time a tanker from the USGC reached Asia to meet a supply shortage, the need and opportunity might have dissipated. For example, Asia was hit with a colder than average winter this past January that shot up prices well over US$20/million Btu for a brief period. Canadian LNG could respond to such Asian market needs and sales opportunities more quickly than US LNG supplies.
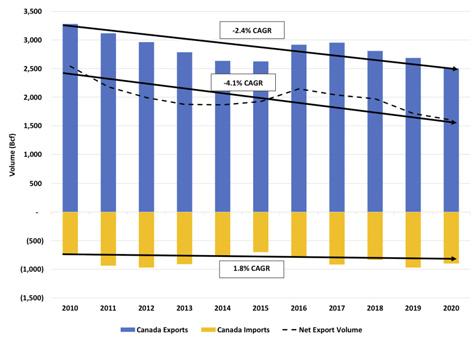
The urgency for developing LNG export terminals for Canadian producers is clear from examining Canadian exports to the US. Canada continues to be a net natural gas exporter to the US, but the volumes are on a downward trajectory, as shown in Figure 2. While Canadian gas exports declined by 2.4% per annum during the decade from 2010 to 2020, Canadian imports increased by 1.8% per annum. Not only is less Canadian gas needed in the US, but some regions of Canada have imported more US gas and displaced Canadian gas. For example, sharply rising gas production from the Marcellus and Utica formations in the Eastern US has reversed the pipeline flow and reached Canadian markets. The result is that net Canadian exports have declined steeply to the tune of 4.1% per annum.
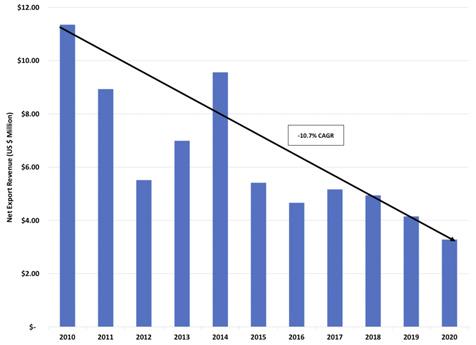
Compounding the pain, natural gas prices have simultaneously plummeted, producing a precipitous drop in Canadian gas export revenues, which fell by 10.7% per annum from 2010 to 2020, as shown in Figure 3. Of course, 2020 was a particularly painful year with the outbreak of the coronavirus, but it only continued the downward trend of the previous years.
Sharply higher prices in 2021, including the JKM spiking to an all-time high in January, indicate that the market is finally emerging from an extended period of market oversupply and price malaise. The price recovery could be attributed to some countries’ initial rebound from the coronavirus pandemic, as well as the resiliency of natural gas and LNG demand during the pandemic, and supply impacts wrought by the pandemic such as substantial delay in the FID and COD scheduled for new LNG projects, upstream production declines, and increased capital discipline for oil and gas producers. However, the price rebound may prove fleeting due to the massive new LNG export on the horizon. For example, Qatar, the global leader in LNG, is poised to reassert its dominance by expanding its export capacity by 33 million tpy and also is partnering in the Golden Pass LNG terminal, which will add another 16 million tpy.
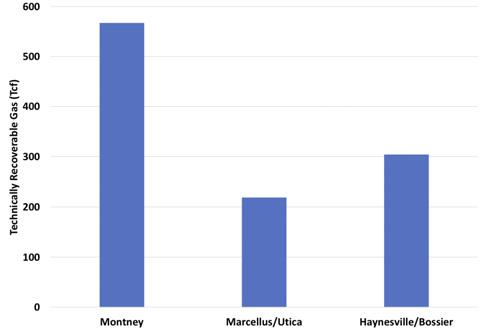
Figure 1. Estimated resource potential by formation. Sources: Canada Energy Regulator and US Geological Survey.
Figure 2. Canadian natural gas exports and imports. Source: BRG analysis and US Energy Information Administration (EIA).
Figure 3. Canadian gas export revenues. Source: BRG analysis and US EIA.
Is it too late for Canada? Has the window closed?
Although late to the party, Canada may soon be presented with its last best chance to scale up LNG exports in the form of US net zero energy policies. The new Biden administration fulfilled a campaign promise on day one of its administration by rejoining the Paris Agreement, signalling the beginning of an aggressive ‘all of government’ approach to tackling climate change imperatives. Among other policies, the new US administration is promoting a policy for net zero power generation by 2035, which over the coming few decades would gradually eliminate the use of natural gas for power generation.
To analyse implications of US net zero policy on Canadian gas markets, BRG used its LNG Horizon™ model to forecast global natural gas and LNG markets under three scenarios: Base Case: A business-as-usual scenario, which assumes only those global energy and environment policies that have already been adopted (e.g. the European Green Deal). US Net Zero: The US alone adopts a net zero policy for electricity generation by 2035. Global Net Zero: The US policy sparks intensified climate efforts in Europe and adoption of more stringent climate policies in the major Asian economies, such as those described in the IEA’s Sustainable Development scenario.
LNG Horizon is well suited for this analysis because it provides detailed representations of the US and Canadian markets, including supply basins, gas processing, pipeline infrastructure, LNG terminals, and demand regions to forecast prices and volumes. Most importantly for this analysis, the model can project infrastructure capacity additions given the capital costs, variable operating costs, and projected prices.
Table 1 shows the implied compounded annual growth rates (CAGR) for demand by region under the stated policies, which was used in BRG’s Base Case, and the sustainable development scenario, which is used in the Global Net Zero case. The sustainable development scenario lowers global gas demand by approximately 3 trillion ft3 in 2030 and 8.5 trillion ft3 by 2040, compared to the stated policy scenario. BRG notes that in the sustainable development scenario, most countries reduce their natural gas consumption, but India increases consumption over the current decade as natural gas displaces coal and other more carbon intensive fuels.
As shown in Figure 4 for the Base Case, Canadian net exports to the US continue their downward spiral over the next decade, falling 50% from 2016 to almost 1 trillion ft3. The decline is steady, with only a minor rebound in the later part of this decade as new US LNG export terminals, including Golden Pass and Calcasieu Pass, come into operation.
Figure 5 shows that in the Base Case, North American LNG export volumes are dominated by US LNG exporters. Canadian LNG exports are forecast to eventually enter the market in 2025 when LNG Canada’s 1.8 billion ft3/d of capacity becomes operational. The export volumes reach 5.8 billion ft3/d by 2032, with 4.0 billion ft3/d of additional capacity forecast to be economically viable. The forecast capacity additions indicate that two additional large scale LNG terminals would be economic to build in Western Canada, although the Canadian LNG exports are still dwarfed by the projected 14.2 billion ft3/d of US LNG exports. A US net zero policy could significantly enhance the prospects for Canadian LNG exports. The gradual elimination of US natural gas consumption for power generation will cause North American natural gas prices to drop, making US and Canadian LNG exports more cost-competitive in global markets. As shown in Figure 6, LNG Horizon forecasts US (Henry Hub) and Canadian (Alberta) prices to both
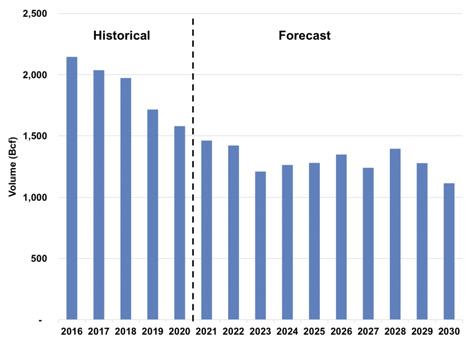
Figure 4. Forecast of net Canadian exports to the US. Source: BRG LNG Horizon™ forecast and EIA.
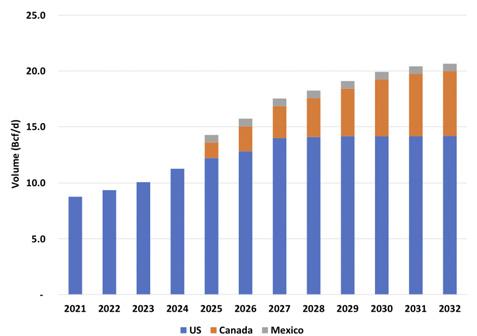
Figure 5. North American LNG exports. Source: BRG LNG Horizon forecast.
Table 1. Gas demand growth rates (CAGR) by scenario. Source: BRG analysis of IEA 2020 World Energy Outlook scenarios
Region Stated policies Sustainable development 2020 - 2025 2025 - 2030 2030 - 2040 2020 - 2025 2025 - 2030 2030 - 2040
EU 1.2% -1.2% -1.3% 0.6% -4.2% -4.2%
Japan -2.0% -1.6% 0.3% -1.0% 0.0% -2.8%
China 4.6% 3.1% 2.5% 3.1% 2.4% 1.4%
India 8.5% 5.6% 4.4% 8.7% 7.3% 3.9%

decrease, but the impact is more acute in the US because it is directly affected by the natural gas demand decline. Alberta prices decline by a lesser amount because they are already depressed in the Base Case and Canada is only indirectly affected by the US policy and demand reductions. Overall, the North American price declines make US LNG more competitive in Europe and Canadian LNG more competitive in Asia.
In the US Net Zero case, North American LNG exports are more competitive in global markets and LNG Horizon indicates market demand for additional LNG liquefaction capacity in both Canada and the US, as shown in Figure 6. The total North America LNG export volume increase represents an approximately 15% increase compared to the Base Case. Interestingly, the first beneficiary is Canada, which adds 0.8 billion ft3/d of capacity, bringing Canada’s total LNG export capacity up to 6.6 billion ft3/d. US capacity expansion follows later, growing by an additional 3 billion ft3/d in 2032 because of the net zero policy.
Canadian LNG projects on the west coast have an advantage to premier markets in Asia while US Gulf Coast LNG projects have an advantage to Europe and fast growing Latin American markets. Which projects eventually come to fruition will depend on factors such as marketing ability, personal relationships, and terms developers are willing to accept, as well as the economic merit of the projects. Therefore, the most pertinent number is the total North American LNG exports because it represents how much volume is projected to be available for the various North American LNG projects.
But what if the US does not act alone on net zero policies and rather sets off a wave of global commitments to comparable net zero polices among all the world’s major economies and gas and LNG consumers? This question is addressed in the Global Net Zero scenario based upon the IEA’s Sustainable Development scenario, which assumes Europe and the major Asian countries all pursue net zero emissions for the power sector by 2035 and net zero emissions for the overall economy by 2050. Under this scenario, global gas markets begin to shrink albeit inconsistently over time and by regions. The impact of this scenario on North American LNG exports is a decline of 1.5 billion ft3/d by 2032, with most of the decrease hitting Canadian LNG exports, as shown in Figure 8. Whereas in the Base Case, 4.0 billion ft3/d of Canadian greenfield LNG capacity was built; with the global natural gas demand decline in the Global Net Zero scenario, only 2.5 billion ft3/d of Canadian LNG capacity is added. In comparison, US LNG exports are minimally affected because most of the US volumes come from existing and projected brownfield terminal expansions, which are less costly than greenfield projects. The results emphasise the point that greenfield LNG projects are the marginal sources of global LNG supply and thus highly sensitive to market conditions.

Figure 6. Price impact from US Net Zero scenario. Source: BRG LNG Horizon forecast.

Figure 7. Impact of US Net Zero case on North American LNG export capacity. Source: BRG LNG Horizon forecast.

Figure 8. Impact of Global Net Zero case on North American LNG export capacity. Source: BRG LNG Horizon forecast.
Conclusion
In summary, a stringent US net zero policy would boost the prospects for Canadian LNG by lowering feed gas prices and enhancing the competitiveness of Canadian exports in the Asian markets. However, if Asian countries also aggressively pursue net zero type policies over the coming decades, the lower demand could significantly limit development of the greenfield Canadian LNG projects. In other words, an aggressive US net zero policy that runs in advance of Asian market commitments could be Canadian LNG’s last best chance to capture a significant share of the Asian LNG market, but that chance could also be compromised by an accelerated global push for net zero policies.
Note
The views and opinions expressed in this article are those of the authors and do not necessarily reflect the opinions, position, or policy of Berkeley Research Group, LLC or its other employees and affiliates.


