Inventory, Demand, and Planned Projects
County Provided Facilities and Services
County provided capital facilities and services include general government, law enforcement (including courts, enforcement, and corrections and detention), emergency management, transportation (streets/roads, active transportation facilities, airports, and ferries), parks and recreation, surface water management, and wastewater. LOS revisions proposed as part of the Comprehensive Plan Periodic Update, and used in this analysis, are detailed in Exhibit 1 under Sources and Assumptions.
General Administration Buildings
Overview
Facilities Management maintains the County’s inventory of general administration buildings and a number of select buildings from non-general fund departments. These buildings serve numerous general administration departments and agencies, including:
• Assessor-Treasurer
• Assigned Council
• Auditor
• Communications
• County Council
• County Executive
• District Court
• Economic Development
• Emergency Management
• Facilities Management
Inventory
• Finance
• Health Department
• Human Resources
• Human Services
• Medical Examiner
• Parks Administration
• Planning and Public Works Administration
• Prosecuting Attorney
• South Sound 911
• Superior Court
Pierce County has a number of buildings that house municipal services across the county. Most of these general administration buildings are located around the downtown Tacoma area, such as the County-City Building (CCB) on Tacoma Avenue and the Annex campus at 2401 S 35th Street.
See Exhibit 39. Additional County-owned capital facilities specific to providers discussed in this CFP are described in the sections that follow, including law enforcement facilities (the Sheriff’s Foothills, Thun, and Peninsula substations, the Main and New Jail, and Remann Hall Juvenile Detention Facility), parks and recreation facilities. The Facilities Management Department manages County-owned facilities and real property.
Exhibit 39. General Administration Buildings Current Facilities Inventory (2023)
General Administration
901 Tacoma Building (Hess Building)
This building is being used for storage pending the property being sold or demolished.
920 Fawcett Building Houses Prosecuting Attorney.
925 Tacoma Building Houses the District Court Resource Center
933 Tacoma Building
This building is being used for staging construction projects taking place in the County-City Building, storage and parking.
945 Tacoma Building
Temporary location for staff from the Clerk’s Office and a Superior Court Commissioner conducting video hearings.
950 Fawcett Building
901 Tacoma Ave S Tacoma, WA 98402
920 Fawcett Ave S Tacoma, WA 98402
925 Tacoma Ave S Tacoma, WA 98402
27,800 ft2
Three story office building built in 1900 has a daylight basement staff parking garage. The 901 building was slated for demolition in the 2020-21 budget, but that project has been postponed pending discussions on declaring multiple parcels as surplus to the County’s need
21,020 ft2 Built in 1982. Pierce County purchased this building in 2022 and constructed improvements to allow the Prosecutor to move in February 2023.
12,000 ft2
One story office building with a daylight basement parking garage. Built in 1968 and in fair condition.
933 Tacoma Ave S Tacoma, WA 98402 12,053 ft2 Built in 1965 and in fair condition. The building is not ADA accessible and would need significant improvements to be occupied on a regular basis.
945 Tacoma Ave S Tacoma, WA 98402
Houses the Finance Department and the Prosecuting Attorney Family Support Division. 950 Fawcett Ave Tacoma, WA 98402
Annex Campus (3 Buildings)
Annex (Public Services Building)*
Houses the Assessor / Treasurer, Auditor, Board of Equalization, Fire Marshal, and Planning and Public Works Development Services and Long Range Planning functions.
Annex West (Emergency Management)*
Houses the Auditor, Elections Center, Emergency Management, and Pierce County Sheriff.
South Sound 911
2401 S 35th St Tacoma, WA 98409
ft2 One story office building with partially occupied daylight basement, tenant storage, and staff parking. Built in 1931 and in fair condition.
ft2 Three story office building with a partial below grade basement and freight elevator. Built in 1971 and in average condition.
Single story office building with mezzanines that was converted from a large retail store occupancy. Built in 1959 and in average condition.
2501 S 35th St Tacoma, WA 98409
2415 S 35th St Tacoma, WA 98409
Single story mixed use building with mezzanines providing general office uses and warehousing/storage. Shop built in 1966 and office space built in 1975, both in average condition.
Single store call center (formerly the LESA Communications Building). Built in 1990 and in average condition. Pierce County
Facility Location Size Notes
Houses back-up communications center for South Sound 911.
Central Maintenance Facility
Houses Pierce County Planning and Public Works, Road and River Maintenance, Airport Management and Equipment Services functions
County-City Building (CCB)* Campus
Houses the City of Tacoma Municipal Court, Clerk of Superior Court, County Executive, County Council, Pierce County District Court, Facilities Management, Prosecuting Attorney, Pierce County Sheriff, Pierce County Law Library, and Superior Court
4812 196th St E Spanaway, WA 98387
930 Tacoma Ave S Tacoma, WA 98402
181,241 ft2
Crisis Recovery Center
Provides a safe alternative for individuals in need of support when faced with a mental health and or substance use crisis
Environmental Services Building*
Houses Pierce County Planning and Public Works Sewer, Sustainable Resources, Ferry Management, and Pierce County Parks
Fleet Garage
Houses Fleet Services and the garage used to maintain and repair County-owned vehicles.
Health Department Building
Houses Tacoma-Pierce County Health Department.
Medical Examiner Building Houses the Medical Examiner.
11405 Bob Findlay Rd E Tacoma, WA 98445
694,042 ft2
Includes 334,537 ft2 of courthouse and office space and 359,505 ft2 of jail/inmate functions.
owns the land under the building. The building itself is jointly owned with the City of Tacoma. South Sound 911 leases the building from Pierce County.
Buildings include one main two-story administrative and crew support building and six single story storage/maintenance buildings on a 34-acre site. Facilities were built in 2008 (except for one materials storage shed built in 2015) and are in average condition.
Composed of three distinct buildings/wings referred to as A-Wing, BTower, and C-Wing with on-site paid public parking, as well as the County’s two jails. AWing houses mixed use of courtroom and jury assembly occupancies and general government offices. B-Tower houses courtroom assembly occupancies and general office uses C-Wing houses a mixed use occupancy of general office, courtroom assembly, and jail inmate detention and medical functions. Public entry is by the B-Tower 1st and 2nd floor lobbies. All buildings were built in 1959 and are in average condition.
9850 64th St University Place, WA 98466
9,666 ft2
Facility opened in 2021 and is owned by Pierce County and leased to/operated by RI International. Referrals to the center must be made by law enforcement, EMS, First Responders, or community providers Built in 2020 and in average condition.
49,980 ft2 Located at Chambers Creek Regional Park Facility includes administration offices and assembly space for a variety of public and private events. Built in 2007 and in average condition.
2406 Pacific Ave Tacoma, WA 98402 7,400 ft2
One story vehicle repair garage with supporting office space. Built in 1985 and in average condition.
3629 S D St Tacoma, WA 98418 55,475 ft2 Built in 1976 and in average condition.
3619 Pacific Ave Tacoma, WA 98418 19,638 ft2
Two story office and forensic medical examination facility segregated with general office occupancy and autopsy suites with associated refrigeration/freezer rooms. Both public and secure staff parking are on site. Medical offices and
Facility Location Size Notes parking built in 1992 and in average condition.
Mid-County Community Center
10205 44th Ave E Tacoma, WA 98446
Sewer and Traffic Operations Facility
Houses Pierce County Planning and Public Works Sewer and Traffic Operations and Maintenance functions.
Soundview Building
Houses Human Services, WSU Extension, and the Pierce County Sheriff.
9200 122nd St E
Puyallup, WA 98373
3602 Pacific Ave
Tacoma, WA 98418
Yakima Garage*
910 S Yakima Ave Tacoma, WA 98402
*Electric vehicle (EV) charging station(s) available.
Building is owned by Pierce County and leased to the Mid County Community Center non-profit who provides support and services to seniors in Pierce County Built in 1977 and in average condition.
Campus-style maintenance and operations facility on 28 acres that includes administration offices, shipping and receiving areas, maintenance areas, a warehouse, a vehicle storage area, and fuel/wash bays. Consists of seven separate buildings built in 2014 all in average condition.
29,912 ft2 Two story office building with a daylight basement. The upper floor serves the general public and contains the building’s main entrance, as well as a large conference room for multipurpose use. The lower floor is occupied by the Sheriff serving general law enforcement administrative activities. Built in 1977 and in average condition.,
2 Three story public parking garage. Built in 1999 and in average condition.
Note: Does not include leased office space managed and maintained by other entities.
Sources: Pierce County Facilities Management Deferred Maintenance Prioritization, 2017; Pierce County Parks & Facilities, 2023; Pierce County Assessor, 2023 (condition); BERK, 2023
Level of Service Standards
Pierce County has historically calculated the LOS for general administration buildings using the most currently available population growth for incorporated Pierce County to calculate and project future office space needs for the general administrative function of the County. Given the dynamic nature of the workforce today and in the future and the variety of workspace utilization (such as hoteling, job sharing, teleconferencing, telecommuting, and remote computer connectivity), an LOS calculation based on population growth is no longer relevant and there is no adopted square feet of facility space per capita in the Comprehensive Plan. Instead, extensive planning and analysis of general administration operations and public services continues through an assessment of program needs and the associated office space in determining overall office space utilization and needs for the County (see Exhibit 1)
Project Summary
Recent and Ongoing Major Accomplishments
Extensive work continues in accommodating office space needs and assessing capital needs related to aging and obsolete buildings and systems in current County-owned General Administration Facilities. Recent capital accomplishments include:
• Updates and improvements across multiple facilities per the ADA Transition Plan are underway.
• Purchased a new 920 Fawcett building and associated parking lots. Designed and constructed modifications for tenant space requirements including connection to the County network and security system installations.
• Co-located divisions of Finance into fewer buildings via building space modifications at the 950 Building. Modifications included new tenant space requirements in an area on the 2nd Floor including connection to the County network.
• Co-located divisions of the Prosecuting Attorney's Office into fewer buildings via building space modifications at the 955 Building.
• Remodeling the Annex to accommodate Human Resources, training programs, and changes to adjacent spaces including Board of Equalization and common areas. Improvements underway include tenant space improvement, updating building systems for current code, security, parking lot improvements, HVAC improvements, removal of abandoned wiring, lighting updates, and exterior door improvements.
• Began improvements at the Annex West building including HVAC improvements, lobby renovation, controls and building management system upgrades, tenant improvements, and loading dock.
• Remodeled the County-City Building 7th floor for law and justice functions. Remodeled the 10th floor for office and meeting locations including modifications for tenant space requirements, updating building systems for current code, and updating finishes. Replaced the emergency generator and started installing fire alarm systems and updating equipment at the County-City Building.
• Installing new equipment, improving the parking lot, replacing the sewer pipes, and updating the network room at the Medical Examiner Building.
• Tenant improves at the Soundview building for Human Services, changes to the building systems and finishes, and parking lot improvements.
• Started design and construction modifications for the Auditor’s Election Center at the Annex West including network and security systems.
Non-Capital Alternatives
Non-capital alternatives the County could pursue to relieve pressure on general administration facilities and meet LOS standards include facility consolidation, shared services or building amenities amongst various departments, telework options, and flextime. The County will continue to consider non-capital alternatives and shifting space requirements as needs change over time.
Capital Projects
Exhibit 40 contains a list of general administration building projects identified by the County to meet the demands of growth over the next six years (2024-2029). No general administration capital projects are currently identified beyond the six year planning period. Priorities may change over time and new funding sources may become available or existing funding sources may be eliminated or shifted. The County will continue to regularly assess program needs and the associated office space in determining overall general administration office space utilization and needs for the County.
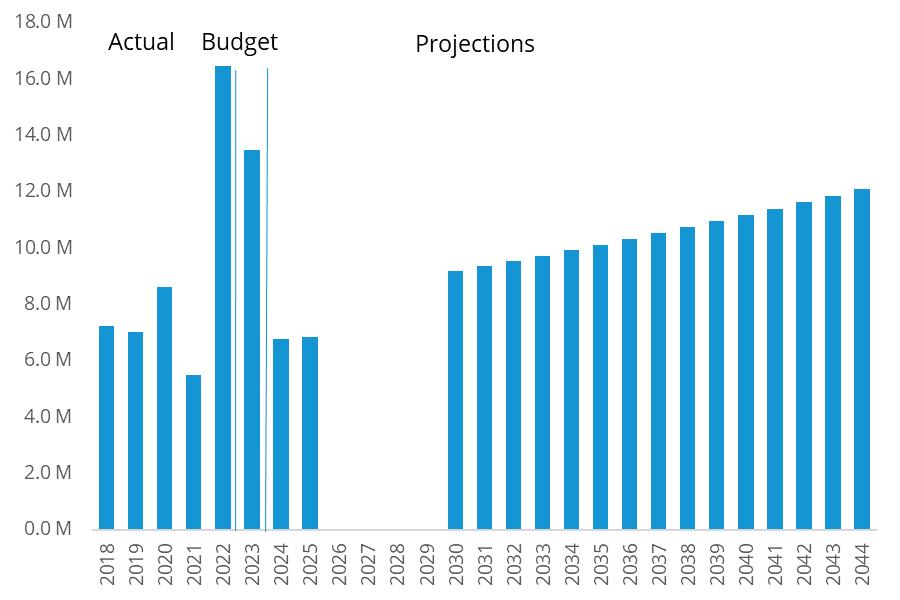
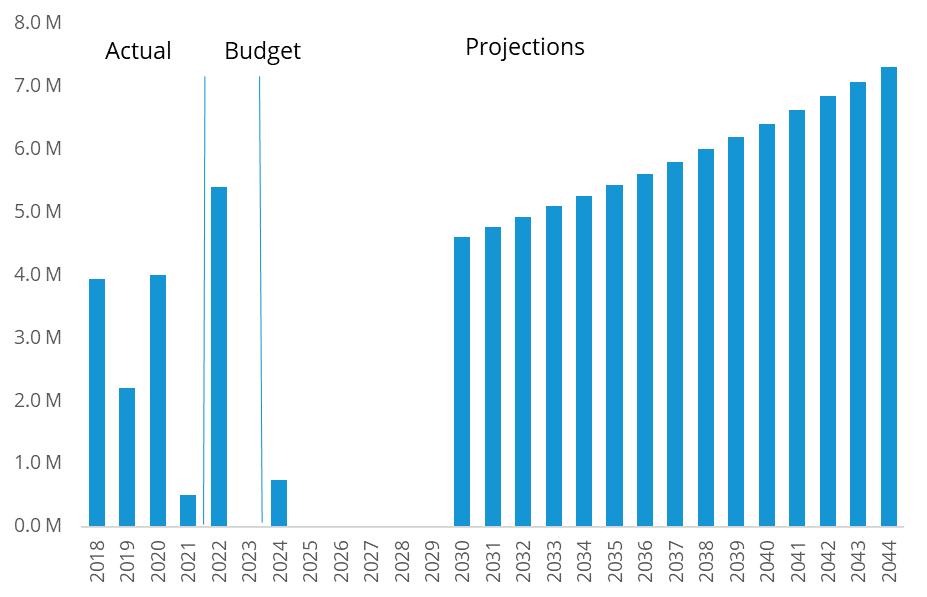
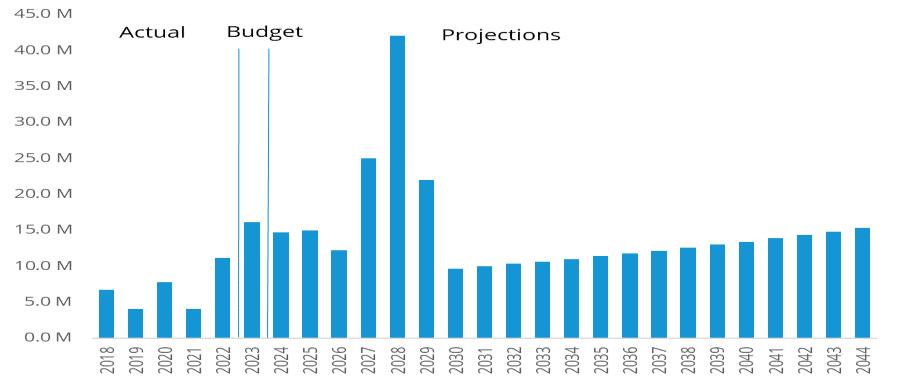
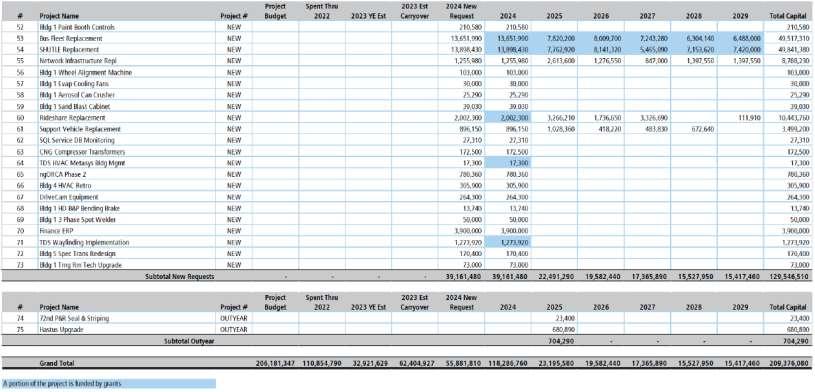
Exhibit 40. General Administration Buildings—Planned Capital Projects, 2024-2044
Note: Priorities may change over time and new funding sources may become available or existing funding sources may be eliminated or shifted.
Sources: Pierce County Finance Department, 2023; Committee of the Whole Amendment No. 1 Proposal No. 2023-63, Passed 11/8/2023; Council Amendment No. 1 Proposal No. 2023-63s, Passed 11/14/2023; BERK, 2024.
Law Enforcement and Corrections
Courts: District Court, Superior Court, and Juvenile Court
Overview
Pierce County provides District, Superior, and Juvenile Court services to Pierce County residents, including both incorporated and unincorporated areas:
• The District Court is a court of limited jurisdiction hearing cases related to anti-harassment protection orders, civil claims ("small claims") for recovery of money not to exceed $5,000, civil matters for damages for injury to individuals or personal property and contract disputes no greater than $100,000, criminal and criminal-traffic misdemeanors and gross misdemeanors, name changes, and traffic and non-traffic infractions.
• The Superior Court is the highest level trial court in state government and the only trial court of general jurisdiction. Superior courts are called general jurisdiction courts because there is no limit on the types of civil and criminal cases heard Superior courts also have authority to hear cases appealed from courts of limited jurisdiction.
• The Juvenile Court is a division of the Superior Court and has jurisdiction over those juveniles within Pierce County who violate the criminal laws of this state or who are in need of protection and/or advocacy as a result of abuse, neglect, or abandonment. The Juvenile Court is responsible for the provision of probation, dependency, truancy, at-risk youth, court, detention, adoption, and support services. To facilitate the operation of these statutory mandates, the agency is organized into specific departments: Administrative Services, Court Services, Dependency, Detention, and Probation.
Inventory
The Pierce County District and Superior Court are primarily run out of the County-City Building (CCB) in Tacoma. The District Court currently has nine courtrooms and eight judicial positions. The Superior Court is organized into as many departments as there are judges authorized by law (currently 23). Each departmental judge employs a fulltime judicial assistant and court reporter. Ten full-time court commissioners are also employed by the court the commissioners preside over and decide matters in various divisions such as civil, juvenile, civil mental health, and adoptions. See Exhibit 41.
All programs for the Pierce County Juvenile Court are currently located at Remann Hall in Tacoma, including four Juvenile courtrooms and five pods with a 65-person capacity (see Exhibit 41). These facilities are in poor condition and are not well suited for the program Remann Hall
delivery. The Justice Center Planning Committee has analyzed the feasibility of consolidating and co-locating justice programs onto the downtown County campus on Tacoma Avenue.
Exhibit 41. Pierce County Courts Current Facilities Inventory, 2023 Facility Location
District Court
Superior Court
County-City Building
930 Tacoma Ave S, Room 239
Tacoma, WA 98402
County-City Building
930 Tacoma Ave S
Tacoma, WA 98402
Juvenile Court Remann Hall 5501 6th Ave Tacoma, WA 98406
9 courtrooms
21 permanent courtrooms
10 commissioner court rooms
198,400 ft2 building built in 1969
4 courtrooms,
5 pods (65 person capacity)
Two of the wings are former detention wings that have been vacated and are not able to be occupied per code.
Note: The District and Superior Courts are housed in the County-City Building. The Courts account for 189,510 ft2 of the total 694, 042 ft2 campus (see Exhibit 39).
Sources: Pierce County, 2023; BERK, 2023.
Level of Service Standards
The adopted LOS for the District, Superior, and Juvenile courts, as identified in the Pierce County Comprehensive Plan, are (see Exhibit 1):
• District Court: 1 courtroom per judicial position.
• Superior Court:
1 permanent courtroom in the County-City Building for each Superior Court judge.
1 hearing room per commissioner assigned to the County-City Building.
1 courtroom/hearing room per judicial officer when serving at locations away from the County-City Building.
• Juvenile Court: 0.132 beds per 1,000 population
Exhibit 42 details the existing and future LOS for Juvenile Court beds based on 6- and 20-year population growth projections. The County would need a total of 158 beds for the Juvenile Court to serve the anticipated 2044 population, 93 beds more than are currently available. Courtrooms and hearing rooms to support the District and Superior Court are assigned within the County-City Building consistent with the number of judicial positions and adopted LOS standards above. Space needs for the District and Superior Court will continue to be evaluated as part of general administration facility needs.
Exhibit 42. Pierce County Juvenile Court Existing and Future LOS Analysis
Notes: The 2020 Census and 2044 population projection are consistent with the adopted CPPs. The 2023 population estimate is from OFM’s “April 1, 2023 Population of Cities, Towns and Counties” and the 2024-2029 population estimates are based on the CAGR from 2023-2044.
Sources: Pierce County CPPs Appendix A, 2022; OFM, 2023; Pierce County, 2023; BERK, 2023.
Project Summary
Recent and Ongoing Major Accomplishments
• The County continues to fund additional legal positions to support the backlog of court cases due to the pandemic as well as positions and program costs to support an additional Mental Health Therapeutic Court.
• The Juvenile Court continues to reimagine youth justice by increasing opportunities for young people to be diverted from formal processing, decreasing the use of out of home placement to state facilities and using probation as a purposeful intervention to support growth, behavior change and long-term success. The following programs were developed in partnership with community-based organizations to increase opportunities and support for young people: Tacoma Community Boat Builders, ARTS Connect, Alchemy Skateboarding, Culinary Arts, Mountaineers, 2nd Cycle, mentoring, yoga, and Changing Reign.
• Probation staff identify risk factors that lead youth to commit crimes through a standardized and validated statewide risk assessment. Case management is focused on engaging and motivating youth and families to change those behaviors that lead to offending. The County provides evidenced based programs to reduce recidivism consistent with research, such as aggression replacement training, functional family therapy, coordination of services, girls only active learning, education and employment training, sexual offender program, mental health program, chemical dependency program, family first (family violence cases), opportunity based probation, and pathways to success.
Non-Capital Alternatives
Non-capital alternatives the County could pursue to achieve and maintain LOS standards for the District and Superior courts are discussed under general administration buildings.
Non-capital alternatives the County could continue to pursue to achieve and maintain LOS standards for the Juvenile Court encompass programs intended to ensure public safety and hold
youth accountable but in a non-secure detention environment. These include positive youth development programs, curfew monitoring programs, electronic home monitoring, weekend work crews to provide restorative services to the community, and evidence based probation services to reduce recidivism.
Capital Projects
Capital projects to support the District and Superior Court are included under General Administration Buildings above. See Exhibit 40.
Exhibit 43 contains a list of juvenile court projects identified by the County to meet the needs of growth over the next six years (2024-2029). No juvenile court projects are currently identified beyond the six-year planning period. Priorities may change over time and new funding sources may become available or existing funding sources may be eliminated or shifted. The County will continue to regularly review and revise its juvenile court capital projects to meet the needs of future growth.
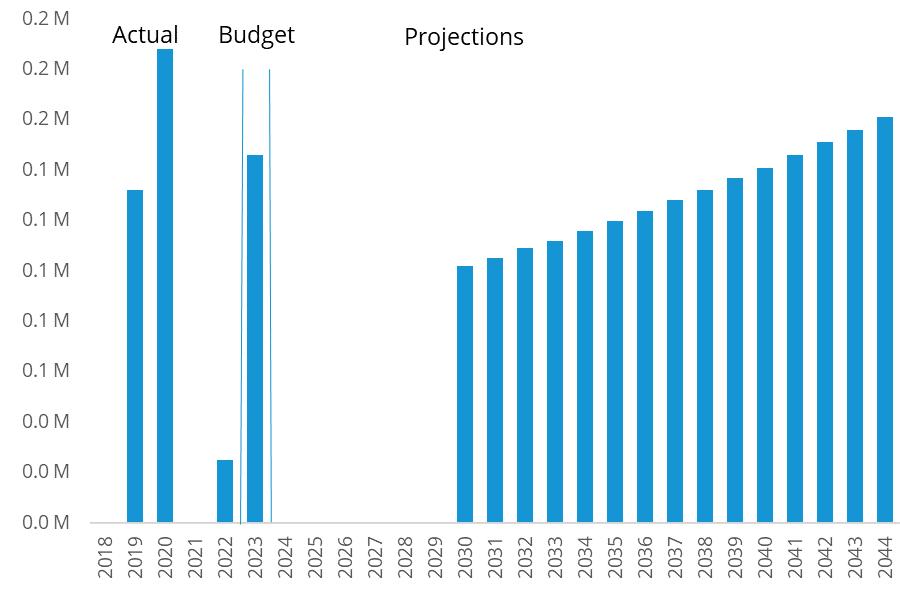
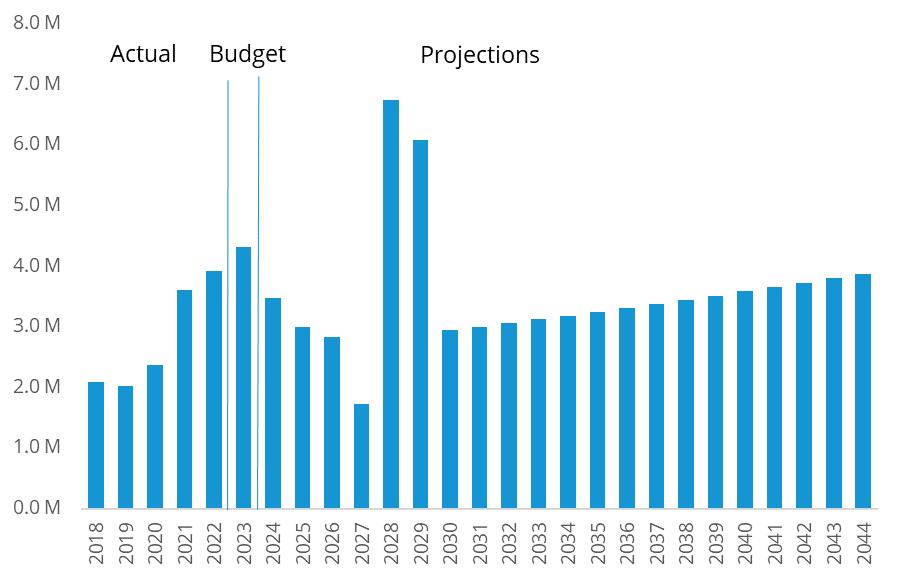
Exhibit 43. Pierce County Juvenile Court—Planned Capital Projects, 2024-2044
Note: Priorities may change over time and new funding sources may become available or existing funding sources may be eliminated or shifted.
Sources: Pierce County Finance Department, 2023; BERK, 2024
Sheriff Overview
The mission of the Pierce County Sheriff’s Department is to protect life and property, to uphold rights, and work in partnership to build stronger, safe communities. The Sheriff’s Department is a full-service law enforcement agency which provides a variety of services throughout the county to include patrol, traffic, and investigative services in unincorporated Pierce County. In total, the Sheriff’s Department serves an area of over 1,540 square miles (although a large portion of their service area is National Forest land) and includes 13 sheriff patrol districts. The following services are provided to both incorporated and unincorporated areas: jail, property room, and civil process services. Additional specialty services of Forensics Investigations, Search and Rescue, Marine Patrol, Dive Rescue, Air Support, Special Weapons and Tactics, and Narcotics, are provided throughout the county.

In addition to unincorporated Pierce County, the Sheriff’s Department is currently contracted to provide full law enforcement services to the cities of University Place and Edgewood and provides enhanced service contracts with several city policy and other agencies in the county, including:
• Specialized Services (for Air Operations, SWAT, Marine Services, Dive Team, Investigations and Forensics): The cities may choose to contract on a per incident or per capita basis and may choose to contract for one, a portion or all of these services. The cities currently contracting for these services are Fife, Fircrest, Sumner, Buckley, South Prairie, Ruston, and Gig Harbor.
• School Resource Officer Program: Bethel, Franklin Pierce, Peninsula, and Puyallup school districts contract for the services of school resource officers to work in these districts addressing issues of school safety and outreach to young people by the Sheriff's Department. There are currently eight school resource officers assigned to these various school districts.
• Pierce County Alliance: Through a grant to address drug abuse, Pierce County Alliance has contracted for the service of a deputy to assist in monitoring program participants and administering sanctions including re-arrests and jail bookings.
• Marine Patrol: Tacoma Public Utilities contracts for the services of marine patrol during the summer months at Alder Lake Park.
• Pacific Lutheran University: The Sheriff's Department assigns a sergeant in the capacity of campus safety director' to provide the day-to-day operations for campus safety and reporting to the vice president of Student Life for work assignments.
• Pierce Transit: The Sheriff's Department provides two sergeants as Pierce Transit deputy chiefs and eleven deputies for the provision of law enforcement services that include a full-range of
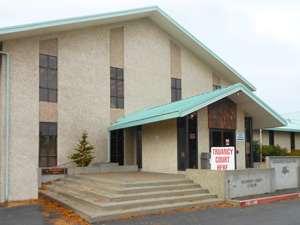
South Hill Precinct
law enforcement activities in a transit environment. These activities include crime prevention, enforcement of laws and regulations relative to law enforcement and specific to transit policing and working in conjunction with Pierce Transit security and staff to ensure safety and security for Pierce Transit employees and riders. The system encompasses all of Pierce County and portions of Mason and Kitsap County.
Inventory
The Sheriff’s Department is headquartered in the County-City Building (CCB) and personnel are deployed around the County from a South Hill Patrol Precinct, a Parkland Spanaway Patrol Precinct, three Detachment offices, four contract agency offices, and other facilities. See Exhibit 44.
44. Pierce County Sheriff—Current Facilities Inventory, 2023
Sheriff’s Headquarters* County-City Building 930 Tacoma Ave S Tacoma, WA 98402
Sheriff’s Training Center* Includes warrants, IA, background, and IT units Soundview Office 3602 Pacific Ave Tacoma, WA 98418
South Hill Precinct Includes K-9 training and kennels
Thun Facility 10411 John Bananola Way E South Hill, WA 98374
8th Ave S Roy, WA 98580
Property Warehouse*
West 2501 S 35th St, Suite A Tacoma, WA 98409
D-10 Mountain Substation Leased from City of Eatonville 201 Center St W Eatonville, WA 98328
D-12 Foothills Substation 11107 214th Ave E Bonney Lake, WA 98391
D-14 Peninsula Substation
6006 133rd St NW Gig Harbor, WA 98332
Thun Airfield Hangars 16715 Meridian E South Hill, WA 98375
*Facility square footage is included in other general administration buildings as noted (see Exhibit 39).
Sources: Pierce County, 2023; BERK, 2023
As of 2022, the Sheriff’s Department employs over 300 employees, of which 252 are commissioned law enforcement officers, and serves a population of approximately 441,420 in
Exhibit
unincorporated Pierce County. Another 12 commissioned officers serve the City of Edgewood and 15 commissioned officers serve the City of University Place through contracted services. The Sheriff’s Department also provides 2 sergeants and 11 deputies to Pierce Transit for the provision of law enforcement services in the transit environment. As of 2023, the Sheriff’s Department is budgeted for 434 full-time personnel, including the Sheriff, 202.5 Deputy Sheriffs, 42.5 Detectives or Detective Sergeants, 12 Lieutenants, and 23.5 Sergeants serving unincorporated Pierce County.
Level of Service Standards
The adopted LOS for the Sheriff’s Department, as identified in the Pierce County Comprehensive Plan, is 0.5 square feet of facility space per population (see Exhibit 1). The LOS was carefully examined in 2004 and adjusted to a more realistic square footage need a reduction in 2008 to the current LOS of 0.5 square feet per population occurred as a result of the Department of Emergency Management being separated from the Sheriff’s Department CFP.
Exhibit 45 details the existing LOS and future LOS based on 6- and 20-year population growth projections. As of 2023, the Sheriff’s Department has approximately 0.34 square feet of facility space per population, below the adopted LOS. The County would have a deficit of 77,809 square feet of facility space in 20239 and would need a total of 242,720 square feet of facility space to serve the anticipated 2044 population, 93,041 square feet more than is currently available.
Exhibit 45. Pierce County Sheriff Existing and Future LOS Analysis
Notes: The 2044 population projection is consistent with the adopted CPPs for unincorporated Pierce County (not including JBLM). The estimated 2022 population served is as reported by the Washington Association of Sheriffs and Police Chiefs (WASPC) and the 2023-2029 estimates of population served are based on the CAGR from 2022-2044.
Sources: Pierce County CPPs Appendix A, 2022; OFM, 2023; Washington Association of Sheriffs and Police Chiefs, 2023; Pierce County, 2023; BERK, 2023
Project Summary
Recent and Ongoing Major Accomplishments
• Expanded the property room at Annex West into the Election Center being vacated to provide additional evidence storage.
• Upgraded the electrical system and armory parking surfacing, addressed safety deficiencies on walls/berms, installed ADA compliant walks and ramps, installed a fence security system, and upgraded gate security at the main vehicle gate at the firing range.
• Improved access drive drainage, parking conditions, and re-roofed both buildings at the Parkland Spanaway Sheriff Precinct.
• Replaced rooftop HVAC units, replaced roofing, addressed drainage, repaired flashing, and replaced parapet siding at the South Hill Precinct.
• Implemented a solution for an equipment storage building for dry secure storage, replaced the HVAC system, and installed a fire alarm system, elevator, and tenant improvements at Thun Field facility.
• Purchased land for a new Mountain Detachment.
Non-Capital Alternatives
The Sheriff’s Department continues to evaluate resource and space needs as law enforcement demands shift throughout the county. Non-capital alternatives the County could pursue related to facility space for the Sheriff’s Department are discussed under general administration buildings.
Capital Projects
Exhibit 46 contains a list of projects for the Sheriff’s Department identified by the County to meet the demands of growth over the next six years (2024-2029). No projects are currently identified beyond the six-year planning period. Priorities may change over time and new funding sources may become available or existing funding sources may be eliminated or shifted. The County will continue to regularly review and revise its capital projects for the Sheriff’s Department to meet the needs of future growth.
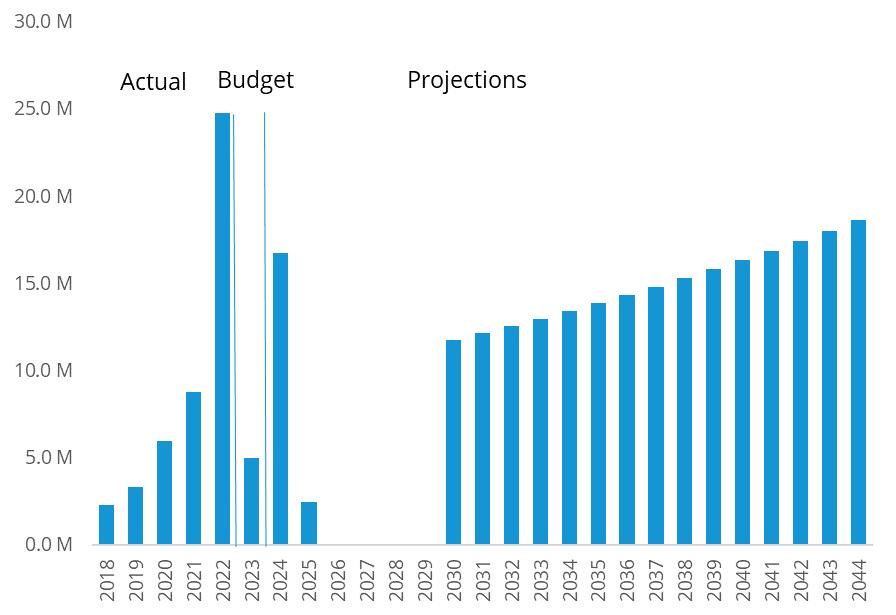
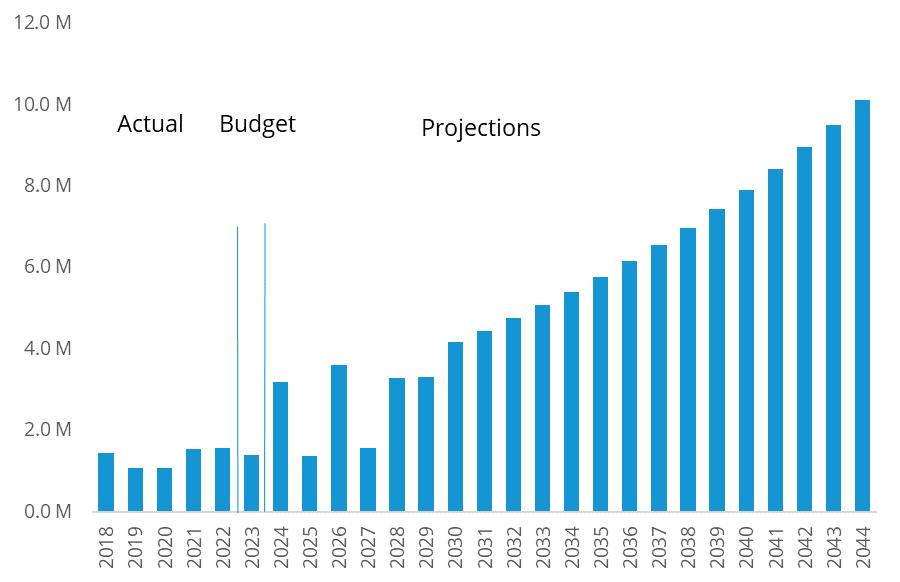
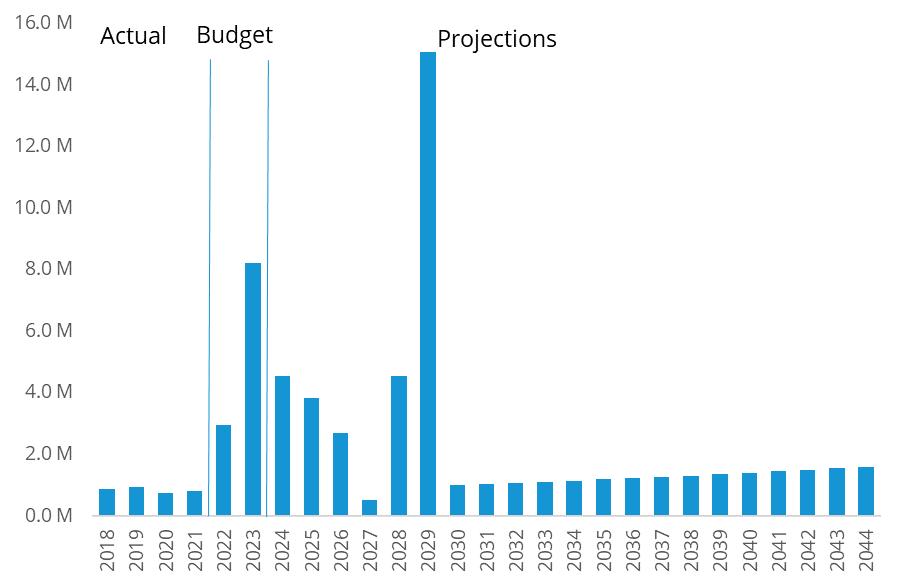
Note: Priorities may change over time and new funding sources may become available or existing funding sources may be eliminated or shifted.
Sources: Pierce County Finance Department, 2023; BERK, 2024.
Exhibit 46. Pierce County Sheriff—Planned Capital Projects, 2024-2044
Sheriff’s Corrections Bureau and Detention Center
Overview
The mission of the Pierce County Detention and Corrections Center is the management, in a safe and secure manner, of persons who have been charged with or convicted of offenses. The County recognizes that, for sentenced prisoners, confinement in itself is punishment. For pre-trial prisoners, confinement is to ensure the safety of the public and the individual. The Center serves the entire criminal justice system.
The Center confines persons in a responsible and humane manner that maintains self-dignity. It is hoped that prisoners can expect to leave the facility in no worse condition physically or psychologically—than when they entered. With the belief that change is always possible, the Pierce County Detention and Corrections Center shall make available opportunities for prisoners to become involved in community-based programs which strive to promote change, self-esteem, and a positive approach to a law-abiding lifestyle.
Inventory
The Sheriff’s Corrections Bureau is responsible for operating two large jail facilities with a total budgeted bed count of 1,296 (Exhibit 47). The Corrections Center houses both pre-trial misdemeanor and felony defendants, those sentenced to jail, and rents bed space for offenders from the federal and state Departments of Corrections and other agencies. Inmates may be sentenced up to one year in the County Jail and may be in the jail on misdemeanor and/or felony charges. As of 2023, the Corrections Bureau of the Sheriff’s Department is budgeted for 323 fulltime personnel, including 239.5 staff responsible for care and custody, 70.5 for programs and services, and 13 for administrative duties. The Sheriff’s Department is responsible for the management of the County Jail.
*The New Jail includes 1,008 beds; however, based on funding levels, only seven 84-bed units (or 588 beds) are available. The Sheriff continues to work with the Jail Facility Master Plan Committee to ensure as many beds as possible are available. Note: Juvenile facilities are detailed under “Courts: District Court, Superior Court, and Juvenile Court.” The square footage of both jails are included in the total square footage of the County-City Building (see Exhibit 39)
Sources: Pierce County, 2023; BERK, 2023.
Exhibit
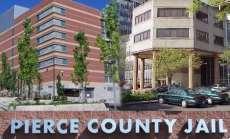
Pierce County Main Jail
Level of Service Standards
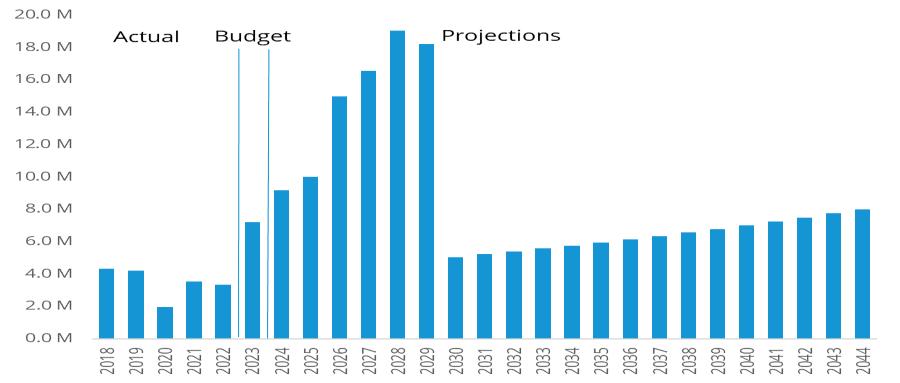
The adopted LOS for the corrections and detention, as identified in the Pierce County Comprehensive Plan, is 2 beds per 1,000 population (see Exhibit 1). Exhibit 48 details the existing LOS and future LOS based on 6- and 20-year population growth projections. As of 2023, the County has approximately 1.4 available beds per 1,000 population, below the adopted LOS. Assuming 1,298 beds remain available, the County would have a deficit of 726 beds in 2029 and would need a total of 2,394 beds to serve the anticipated 2044 population, 1,096 beds more than are currently available. If all 1,718 beds became available, the County would have a deficit of 306 beds in 2029 and 676 beds in 2044 under the 2 beds per 1,000 population LOS.
Notes: The 2020 Census and 2044 population projection are as reported in the adopted CPPs. The 2023 population estimate is from OFM’s “April 1, 2023 Population of Cities, Towns and Counties” and the 2024-2029 population estimates are based on the CAGR from 2023-2044.
Sources: Pierce County CPPs Appendix A, 2022; OFM, 2023; Pierce County, 2023; BERK, 2023.
Project Summary
Recent and Ongoing Major Accomplishments
• The Sheriff’s Department has spent the last several years working with the Criminal Justice Task Force and Prosecutor’s Office to address the backlog of cases within the jail. This has improved the current case backlog but does not address future population levels.
• Building and site improvements at both jails were started, including security fencing alarm system and cameras; correcting water intrusion into secure walking path connecting jails; replacing the camera, monitoring, and recording system, physical security duress alert, PLC system, and security intercom/elevator systems; securing lobby entries; replacing kitchen equipment including blast chiller and dishwasher (Health Department regulated system); adding cell toilets; installing shower controls and water shut-offs; correcting plumbing issues; recoating the outdoor courtyard; structural repairs; HVAC re-commissioning and balancing; exterior repainting and sealing; updating lighting; ADA modifications; and sealing windows.
Non-Capital Alternatives
The Pierce County Jail is working with public and private organizations to establish educational and treatment programs that will help offenders smoothly reintegrate back into the community
Exhibit 48. Pierce County Sheriff Correction Bureau Existing and Future LOS Analysis
and reduce recidivism. Non-capital alternatives the County could continue to pursue to maintain LOS standards for the corrections and detention encompass programs intended to relieve pressure on the jail and the courts by expanding or adding non-capital alternatives. These include increasing electronic home monitoring programs, expanding the District Court day reporting program to other courts within pierce county, expanding offender education and programs within the jail and assisting with job placement, financing the “chronic minor offender program”; expanding evening programs and community centers for constructive activity after hours, expanding “avoidance programs” (both within the jail and the community), expanding the pre-trial screening unit to release and monitor felons, continuing the alternatives to incarceration with deputy involvement, continuing the DWI program 24-hour confinement in lieu of jail time, and partnering with other jails to provide unduplicated jail services and programs.
Capital Projects
Exhibit 49 contains a list of projects for the Sheriff’s Corrections Bureau identified by the County to meet the demands of growth over the next six years (2024-2029). No projects are currently identified beyond the six-year planning period. Priorities may change over time and new funding sources may become available or existing funding sources may be eliminated or shifted. The County will continue to regularly review and revise its capital projects for the Sheriff’s Corrections Bureau to meet the needs of future growth.
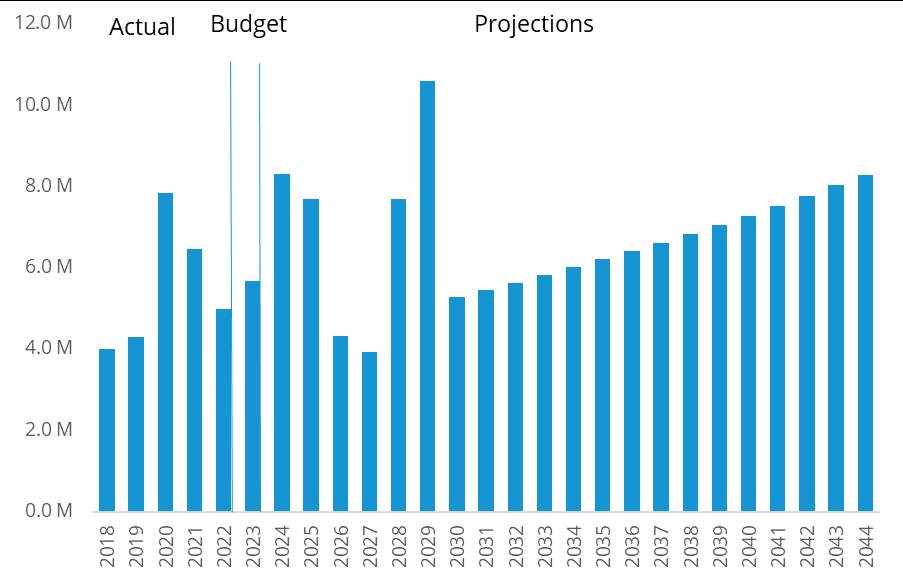
Exhibit 49. Pierce County Sheriff Correction Bureau—Planned Capital Projects, 2024-2044
Note: Priorities may change over time and new funding sources may become available or existing funding sources may be eliminated or shifted.
Sources: Pierce County Finance Department, 2023; BERK, 2024.
Emergency Management
Overview
The mission of the Department of Emergency Management (DEM) is the preparation of Pierce County for disaster through public education, training, and planning; the support of a system of emergency medical and trauma care; the prevention of fires through inspection, plan review, education, and investigation; and the administration of radio communication needs; including subscriber equipment, public safety vehicle installations, and radio infrastructure.


DEM provides a variety of services to both unincorporated and incorporated areas within Pierce County. Those services consist of emergency preparedness training, hazard mitigation, fire prevention activities, County radio communications, and administration of emergency medical services. DEM operates the Emergency Operations Center (EOC) during incidents and events, such as major flooding, windstorms, earthquakes, and other emergency incidents. Additionally, DEM provides contract services for emergency management activities to cities and towns within Pierce County which require additional administrative and programmatic support.
Inventory
Pierce County currently maintains 65,333 square feet of DEM facilities, primarily located in Tacoma (Exhibit 50). The Urban Search and Rescue (US&R) warehouse houses the logistical support staff and the full cache of the Pierce County-sponsored Task Force. The Fire Prevention Bureau is in the Pierce County Annex and is responsible for conducting fire inspections, inspections of business, issuance of permits, reviews of plans, and providing a public education program on fire safety and prevention for the benefit of all in the county.
*Facility square footage is included in other general administration buildings as noted (see Exhibit 39).
Sources: Pierce County, 2023; BERK, 2023.
Exhibit 50. Emergency Management—Current Facilities Inventory, 2023
Annex West Building
Level of Service Standards
The adopted LOS for emergency management, as identified in the Pierce County Comprehensive Plan, is 0.077 square feet of facility space per population (see Exhibit 1). Exhibit 51 details the existing LOS and future LOS based on 6- and 20-year population growth projections. As of 2023, the County has approximately 0.099 square feet of facility space per population, above the adopted LOS. Assuming 65,333 square feet of facility space remains available, the County would have a surplus of 11,952 square feet in 2029 and 4,912 square feet in 2044.
Exhibit 51. Emergency Management Existing and Future LOS Analysis
Notes: DEM’s service area includes the countywide population projections minus the cities of Tacoma and Lakewood. The 2020 Census and 2044 population projection are as reported in the adopted CPPs. The 2023 population estimate is from OFM’s “April 1, 2023 Population of Cities, Towns and Counties” and the 2024-2029 population estimates are based on the CAGR from 2023-2044.
Sources: Pierce County CPPs Appendix A, 2022; OFM, 2023; Pierce County, 2023; BERK, 2023
Project Summary
Recent and Ongoing Major Accomplishments
• Implemented an antenna system connected to the 700 MHz radio system to expand coverage on the CCB campus.
• Upgraded multiprotocol label switching to a 700MHz system at 19 radio communication tower sites throughout the county in order to accept communication system upgrades.
Non-Capital Alternatives
Non-capital alternatives the County could pursue related to facility space for the Emergency Management Department are discussed under general administration buildings.
Capital Projects
Exhibit 52 contains a list of projects for the Department of Emergency Management identified by the County to meet the demands of growth over the next six years (2024-2029). No projects are currently identified beyond the six-year planning period. Priorities may change over time and new funding sources may become available or existing funding sources may be eliminated or shifted. The County will continue to regularly review and revise its capital projects for the Department of Emergency Management to meet the needs of future growth.
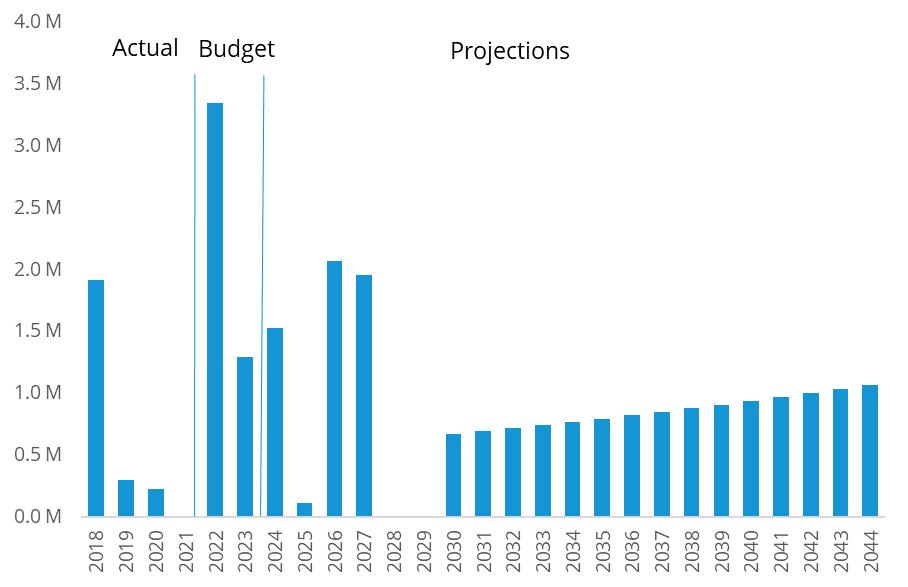
Exhibit 52. Emergency Management Planned Capital Projects, 2024-2044
Note: Priorities may change over time and new funding sources may become available or existing funding sources may be eliminated or shifted.
Sources: Pierce County Finance Department, 2023; BERK, 2024.
Transportation
Transportation-Related Facilities
Overview
According to Title 36 RCW, Pierce County as a government is responsible for planning, constructing, operating, preserving, and maintaining over 1,600 miles of roads and 150 bridges within unincorporated areas. These public roads are under the jurisdiction of the Pierce County Engineer and are supported by various funding sources such as federal, state, and local taxes, as well as private capital.
To ensure that arterial road facilities are available to new developments, the County aims to provide adequate public facilities in accordance with the GMA and the PCC. However, the development of these facilities can be a complex and time-consuming task, which is why the County provides a six-year "grace period" after a road has failed concurrency to bring it back within concurrency standards.
Inventory
As of 2024, Pierce County maintains approximately 710 miles of arterial roadway in the unincorporated area, with urban arterials comprising about two-thirds of the total and rural arterials making up the remainder. The transportation system of Pierce County heavily relies on its Interstate and State freeways and highways, which provide essential intrastate and interstate connections.
The county is crossed by several State surface highways, such as I-5 and I-705, and State Highways 7, 16, 99, 123, 161, 162, 163, 165, 167, 302, 410, 507, 509, 512, 702, and 706. State highway performance is evaluated using the V/S ratio, similar to the arterial roads. In Pierce County, segments of State Highways with daily V/S ratios of 1.0 or higher account for over 55% of the vehicle miles traveled (VMT). The regional freeways notably I-5, SR 167, and SR 512 experience congestion, as do many segments of the surface highways such as SR 7, SR 161, SR 162, and SR 410.
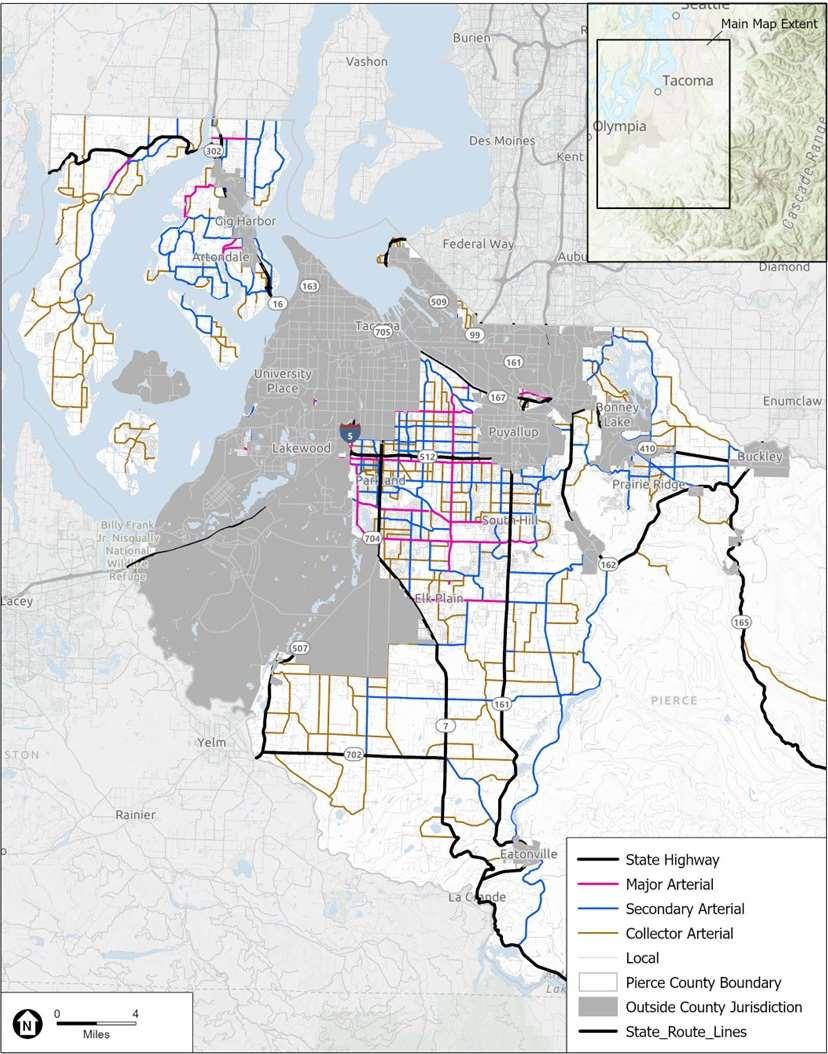
The County classifies the approximately 1,600 miles of road and bridges that it maintains based on the functional classifications summarized in Exhibit 53 this summary includes the quantity of centerline miles (both urban and rural) for each of these classifications. A map of functional classification of roadways maintained by the County is provided in Exhibit 54. State highways and private roads are not included in the County’s functional classification system. A more detailed geospatial inventory of current road facilities is on file electronically in the County’s Department of Planning and Public Works, in the “GIS-Mo” database.1 The “GIS-Mo” database is a requirement of the Washington State County Road Administration Board (CRAB).
Exhibit 53. County Roadway Miles by Functional Classification, 2023
*Rounded to the nearest mile.
Sources: Pierce County, 2024; Fehr & Peers, 2024
Exhibit 54. Functional Classification of County Roadways, 2024
Sources: Pierce County, 2024; Fehr & Peers, 2024.
Level of Service Standards
The LOS for County arterials is based on transportation concurrency and is detailed in the Transportation Concurrency Management System Annual Report, the TIP, the Transportation Element of the Comprehensive Plan, and this document. The RCW requires that the TIP be published separately from the budget and capital improvement plan. There is no LOS specific to local roads, buildings, and facilities.
To uphold the quality of road facilities in a consistent manner, the County uses the Service Standard (volume over service threshold, or V/S) to evaluate the condition of its arterials. Service Standard is a measure that quantifies an acceptable traffic congestion. If the Service Standard is exceeded, the road segment has violated the concurrency standards. Upon the violation of the road segment, mitigation must be implemented within the six years of grace period, otherwise, development permit will no longer be approved in the area that contributes traffic impact.
For an arterial road to fail the road concurrency standards, the Service Standard (V/S) ratio for a road segment must be greater than the adopted Service Standard. If the Service Standard is exceeded on an arterial road segment, the arterial road segment has “failed” or “violated” the concurrency standards. This is also known simply as a road segment that has failed concurrency. If the concurrency standards have been violated on an arterial road segment, mitigation must be implemented within six years of the failed concurrency date in order for development permits to continue to be approved in areas that are contributing to the traffic impact upon the failed arterial road segment.
Existing (2018) Conditions
County Arterials
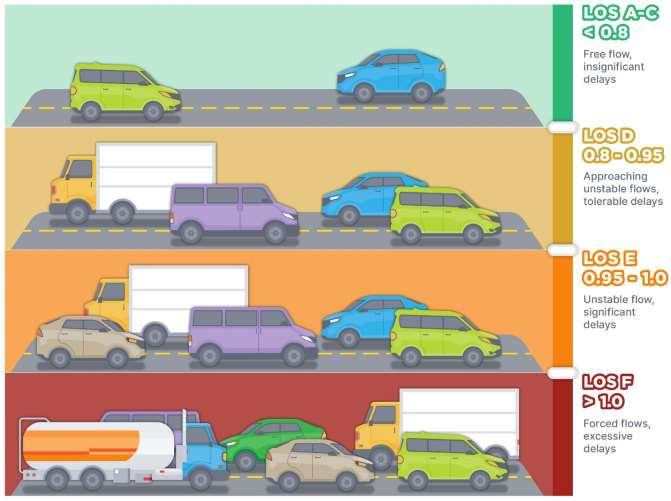
The Service Standard is calculated by the traffic volume over the service thresholds of the transportation facility, measured by letter grade (as shown in Exhibit 55). Service Standard set at 1.1 roughly equates to a level of service “F” in urban area and “E” in rural areas. The adopted Service Thresholds are as shown in Exhibit 56.
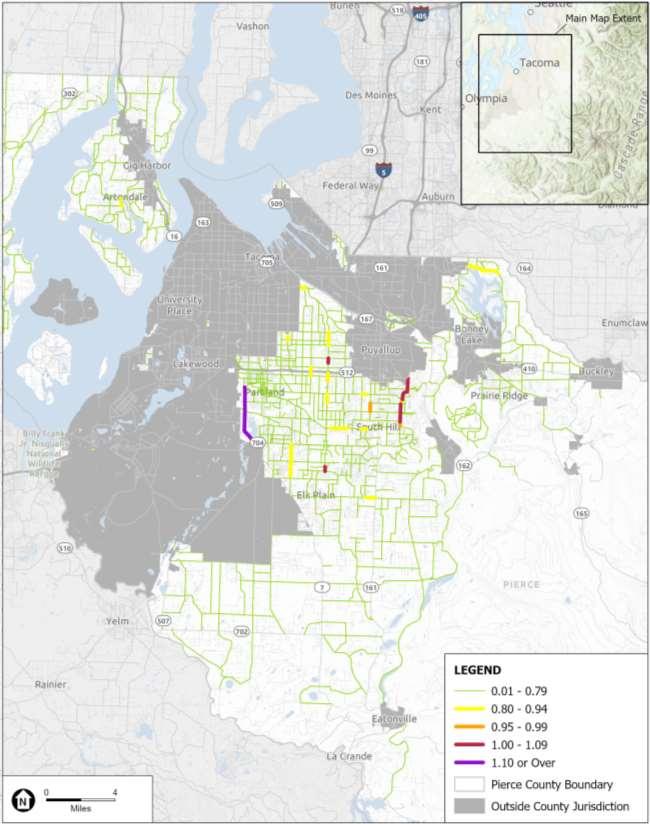
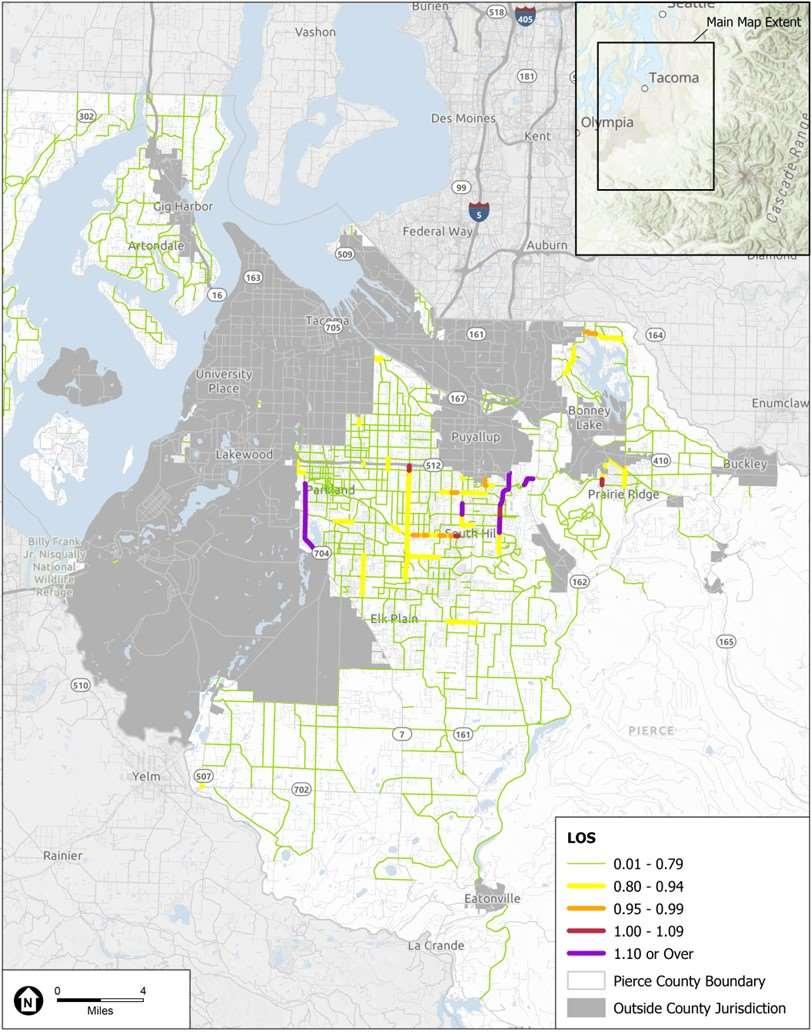
The 2018 roadway performance measurement is determined by the ratio of daily traffic counts and the assumed arterial capacity. These daily traffic counts were provided by PSRC as part of its most recent SoundCast model. In comparing these data to 2022 data obtained at spot locations, the volume was similar between 2018 and 2022 conditions. The count was calculated for every modeled County classified arterial in the unincorporated area. Exhibit 57 maps 2018 daily V/S ratios on all County arterials. Exhibit 58 shows the nine segments with daily V/S ratios of 1.0 or over in 2018 Exhibit 59 provides a summary of vehicle miles traveled grouped by daily V/S ranges. The arterials that exceed the 1.0 V/S standard account for approximately 2.9% of vehicle miles travelled in the county.
Exhibit 55. County V/S Letter Grade Thresholds
Sources: Pierce County, 2024.
Exhibit 56. Service Threshold (S)1
Notes: Three-lane thresholds pertain to uneven three-lane arterials, which have one lane in one direction and two lanes in the other. Assumes 60 percent of a two-lane capacity is in the direction with one lane (e.g., 0.6*17,600=10,560), plus 40 percent of a four-lane capacity in the direction with two lanes (e.g., 0.4*35,200=14,080). Example total = 10,560+14,080=24,640 or 24,600. If turn channelization is present, the service threshold increases to 30,800.
An additional capacity service threshold of 47,400 was derived for four-lane arterials possessing access control. This capacity is applied to 176th Street E after completion of capacity improvement.
1 The currently adopted service thresholds are divided into urban and rural classifications. Under future alternatives, service thresholds for both rural and urban classifications are consolidated into one set of service thresholds.
2 Turn channelization consists of a roadway having a center two-way left-turn lane or exclusive turn pockets at key locations.
3 Urban classifications include arterials with Federal Urban Arterial status and/or within the County's Urban Growth Area.
4 Rural classifications include arterials that are not classified as Urban per the above definition.
Sources: Pierce County Transportation Concurrency Management System, 2023.
Sources: Pierce County, 2024; Fehr & Peers, 2024
Exhibit 57. Existing (2018) County Roads Daily V/S Ratios
Exhibit 58. County Segments with Daily V/S Greater than or Equal to 1.0 in 2018
Spanaway Loop Road Tule Lake Road to 176th Street S (Northbound side)
Sources: Pierce County, 2024
Exhibit 59. Summary of Daily Statistics for County Roads in 2018
Sources: Pierce County, 2024.
State Highways
According to RCW 47.01.260, the Washington State Department of Transportation (WSDOT) has statutory authority and responsibility for the planning, locating, designing, constructing, improving, repairing, operating, and maintaining of the state highway system. While Pierce County is responsible for maintaining, operating, and monitoring its own local network of roadways, state highways also perform a critical role in carrying traffic within and outside the county. It is important to understand the operations of the state highway network when assessing the overall performance of the transportation system.
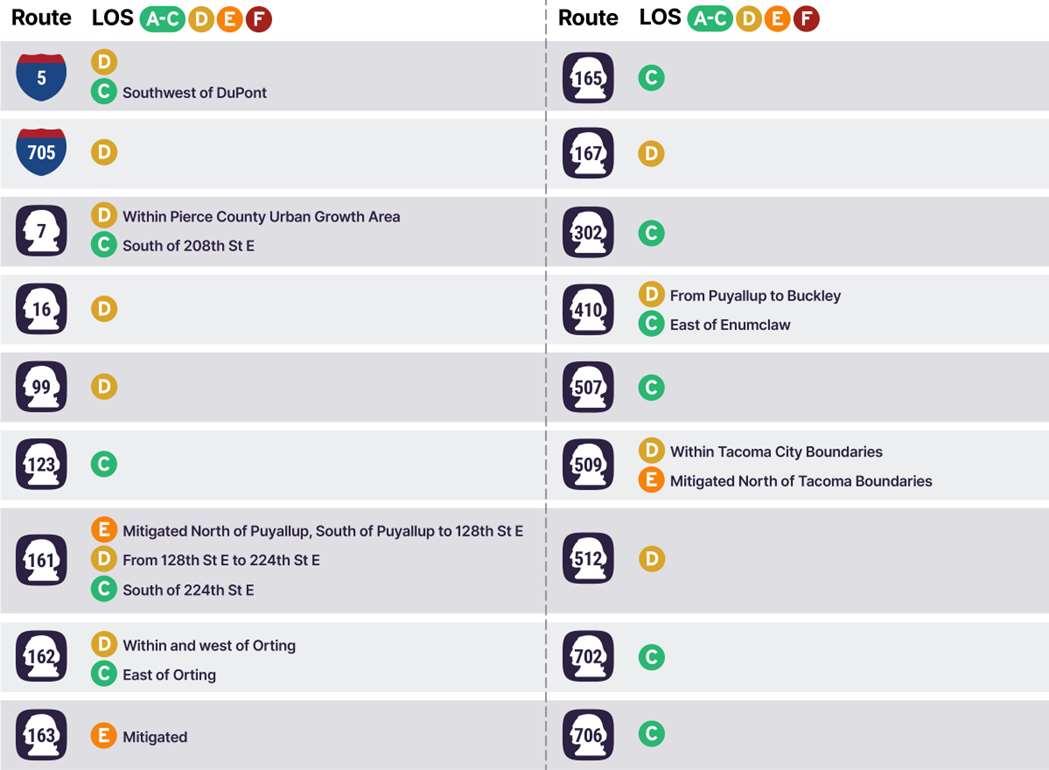
LOS standards, as defined by WSDOT on a route basis, are summarized in Exhibit 60. It should be noted that WSDOT does not provide specific service capacities to measure segment-level level of service. To account for this, the County’s methodology references the Florida Department of Transportation (FDOT) quality level of service (QLOS) methodology, which was developed based on Highway Capacity Manual 6th Edition methodologies. This analysis uses the maximum service volumes, as defined for different letter grades and facility types in the FDOT QLOS methodology, and applies these service volumes for the relevant letter grade set by WSDOT as its LOS standard. Any instance where the maximum service volume is exceeded (i.e., a V/S of 1.0) on a given corridor represents a failure of the letter grade for that corridor. Exhibit 61 shows the FDOT QLOS Capacities assumed for each facility type. WSDOT facilities assumed for each facility type are provided in the table. These capacities are summarized in more detail in Appendix B of the FDOT QLOS Handbook, with most recent publication in 2023.

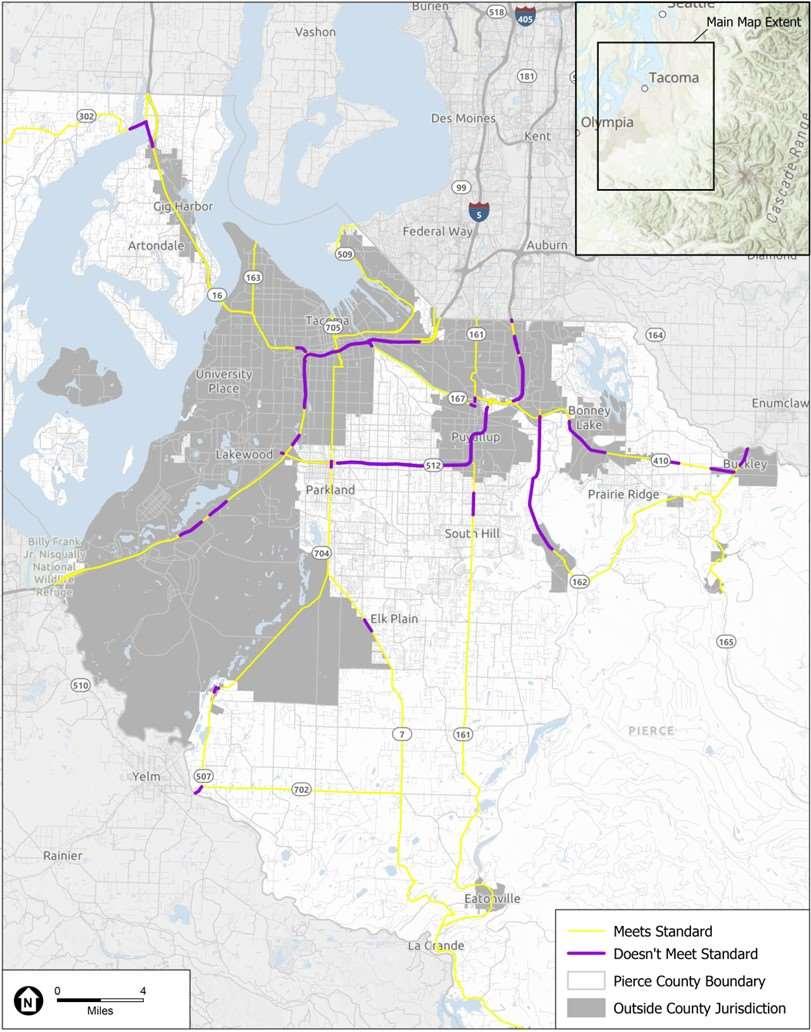
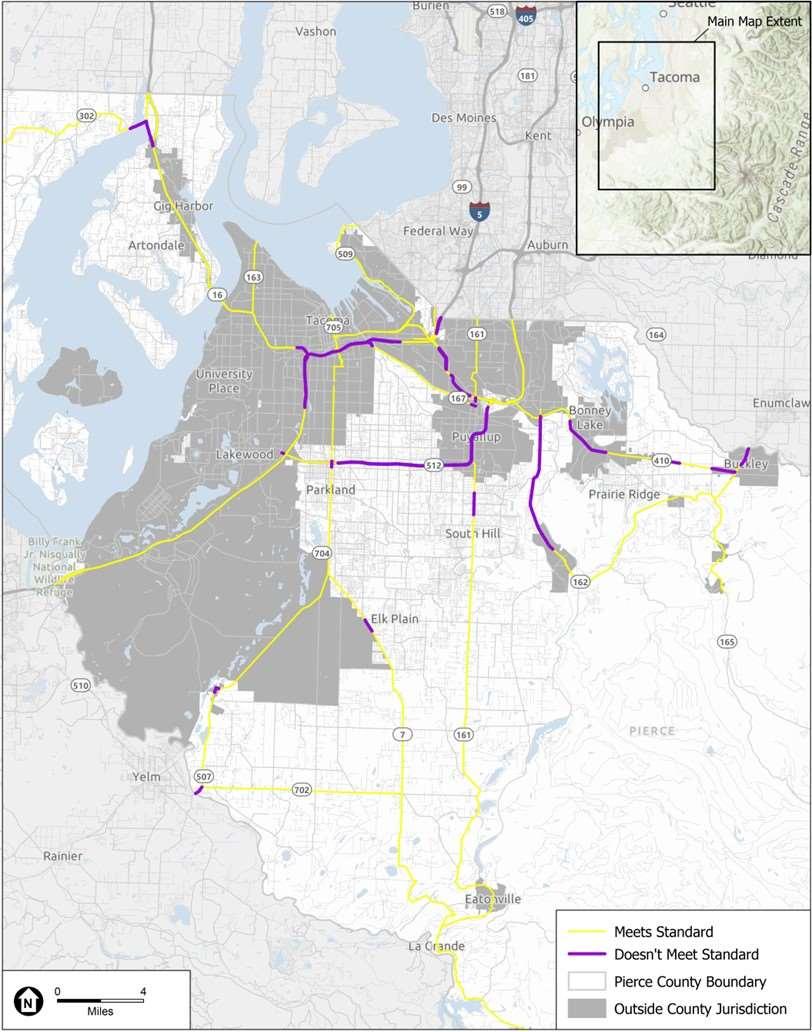
Exhibit 62 summarizes 2018 State Highway performance in terms of daily V/S ratios, while Exhibit 63 maps the daily V/S ratios on State Highways whether the given segment meets or does not meet WSDOT V/S standards. A total of 14 State Highway segments are exceeding WSDOT LOS standards under existing conditions. These include:
• I-5:
Between 72nd Street and 54th Avenue E
Near the SR 512 Interchange
Between Woodbrook Road and Berkeley Avenue SW
• SR 7:
At SR 512 interchange
Between 224th Street E and 232nd Street E
• SR 512:
Between SR 7 and SR 167
• SR 161 between 128th Street E and 152nd Street E
• SR 162 between SR 410 and downtown Orting
• SR 167 between North County boundary and SR 410
• SR 302 between SR 16 and 118th Avenue
• SR 410:
Near Bonney Lake downtown
From east Bonney Lake through Buckley to the County boundary
• SR 507:
Near Roy downtown
Approaching McKenna to the South County boundary
LOS Standards by State Route
Notes:
1 PSRC has set a LOS E Mitigated standard for non-HSS routes. Any letter grade noted as “E Mitigated” means that congestion should be mitigated when pm peak hour level of service falls below LOS E.
2 WSDOT has set a LOS D standard for HSS routes in urban areas and a LOS C standard for HSS routes in rural areas. These corridors include SR 16, 99, 167, 509 (within Tacoma City Limits), and 512 as well as I-5 and I-705.
Sources: Washington Department of Transportation, 2024
Exhibit 61. FDOT QLOS Capacities Used for State Highway LOS Travel Lanes (both directions)
Urbanized (SR 7, 167, 410 & 509 on freeway segments; SR 16 & 512; I-5 & I-705)1
– Rural (SR 7, 123, & 410 within State Park Boundaries)2
Exhibit 60.
Notes:
1 Adjust capacities by factor of 1.05 for locations with ramp metering present.
2 Adjust capacities by: 1.05 for 2-lane segments with channelization; 0.95 for multi-lane segments with channelization; 0.75 for multi-lane segments without channelization.
3 Adjust capacities by: 1.05-1.1 for segments with left- and/or right-turn storage lanes; 0.80 for 2-lane segments with no channelization; 0.80 for multi-lane segments with no channelization (assumes that most if not all of these segments have shoulders for right-turn storage).
4 In reviewing the C2 classification, it was determined that the capacities given more fit national and state park capacities than typical rural segments in Pierce County. As such, C3R was used to represent the majority of rural segments in Pierce County.
5 C3C does not give capacities for an LOS E grade. As such, SR 161 and 163 were classified as C4 in any segments with an “LOS E Mitigated” standard.
Sources: Adapted from FDOT Multimodal Quality Level of Service Handbook, 2023
62. Summary of Daily Statistics for State Highways in 2018
Sources: Pierce County, 2024
C4 – Urban General (SR 161 & 163 along LOS E Mitigated Segments)3,5
Exhibit
Sources: Pierce County, 2024; Fehr & Peers, 2024.
Exhibit 63. Existing (2018) State Highways Daily V/S Ratios
2044 Conditions
County Arterials
Under the future analysis, no rural segments are projected to operate below LOS E, so this discussion focuses on urban arterials. Exhibit 66 summarizes the V/S ratios of arterial segments under 2044 conditions assuming only expected and committed projects. Additionally, Exhibit 64 shows the urban arterial segments with daily V/S ratios of 1.1 or greater in 2044. Exhibit 65 provides summary statistics for vehicle performance on the County arterial network. Assuming all projects listed in the expenditures table (presented later in Exhibit 70) are constructed, all LOS failures would be mitigated. Mitigated results are summarized in Exhibit 67.
Sources: Pierce County, 2024.
Exhibit 65. Summary of Daily Statistics for County Roads Under 2044 Conditions
Sources: Pierce County, 2024.
Exhibit 64. County Segments with Daily V/S Greater than or Equal to 1.1 in 2044 Conditions
66. 2044 County Roads Daily V/S Ratios, Assuming Expected and Committed Projects
Sources: Pierce County, 2024; Fehr & Peers, 2024.
Exhibit
Sources: Pierce County, 2024; Fehr & Peers, 2024.
Exhibit 67. 2044 County Roads Daily V/S Ratios with Mitigations
State Highways
The County assessed State Highways under 2044 conditions consistent with the methodology outlined for the Existing (2018) conditions Exhibit 69 summarizes state facilities that are projected to meet or not meet WSDOT LOS standards (defined by corridor), while Exhibit 68 provides a summary of vehicle miles traveled grouped by daily V/S ranges under 2044 conditions Approximately 19 percent of vehicle miles traveled for State facilities occur on segments that exceed a V/S of 1.0. A total of 16 state route segments are anticipated to exceed WSDOT LOS standards under 2044 conditions:
• I-5:
Between 72nd Street and 54th Avenue E
Between SR 167 Extension and North County boundary
Near the SR 512 Interchange
Between Woodbrook Road and Berkeley Avenue SW
• SR 7:
At SR 512 interchange
Between 224th Street E and 232nd Street E
• SR 512: between SR 7 and SR 167
• SR 161
Between 128th Street E and 152nd Street E
Between Valley Avenue NE and River Road
• SR 162 between SR 410 and downtown Orting
• SR 167 (Extension) between SR 161 and I-5
• SR 302 between SR 16 and 118th Avenue
• SR 410:
Near Bonney Lake downtown
From east Bonney Lake through Buckley to the County boundary
• SR 507:
Near Roy downtown
Approaching McKenna to the South County boundary
Exhibit 68. Summary of Daily Statistics for State Highways Under 2044 Conditions
Sources: Pierce County, 2024
Sources: Pierce County, 2024; Fehr & Peers, 2024.
Exhibit 69. 2044 State Highways Daily V/S Ratios
Project Summary
Prior Year and Ongoing Major Accomplishments
• $13.7 million of grant funds were acquired from State and Federal agencies
• 13 new projects went through the project initiation process.
• 69 projects were active in design phases.
• 35 right-of-way acquisitions.
• $3.6 million was spent on land acquisitions for roadway improvements.
• 8 projects were advertised for construction.
• 10 projects were substantially complete.
• $12 million was spent on payments to contractors
Non-Capital Alternatives
The following non-capital alternatives include strategies, programs, technologies, and other alternatives that do not require capital improvement projects to achieve the level of service standards for transportation capital facilities. Non-capital traffic reduction measures may include Transportation Demand Management (TDM) programs, including Commute Trip Reduction (CTR) programs; Transportation System Management (TSM) programs; improved transit services; and other measures to reduce the V/S ratio below the Service Standard.
Capital Projects
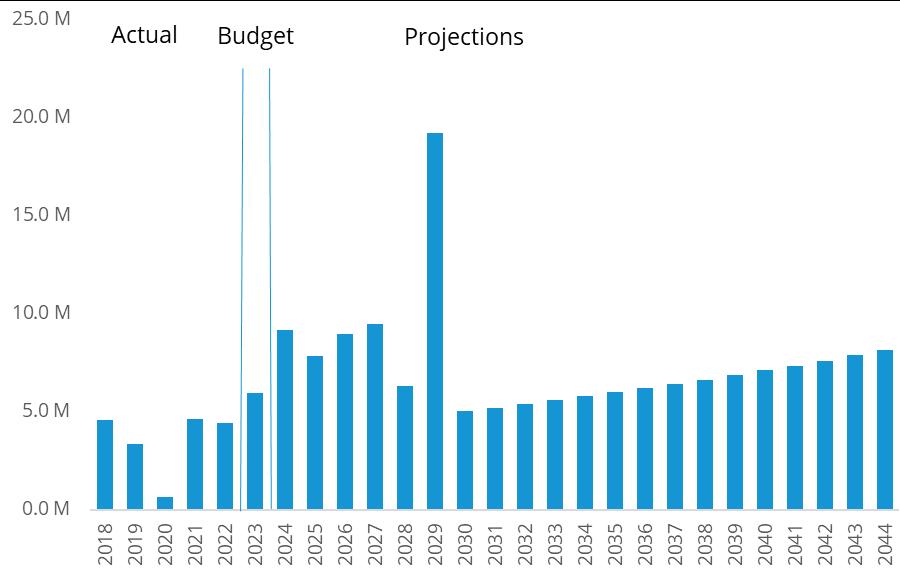
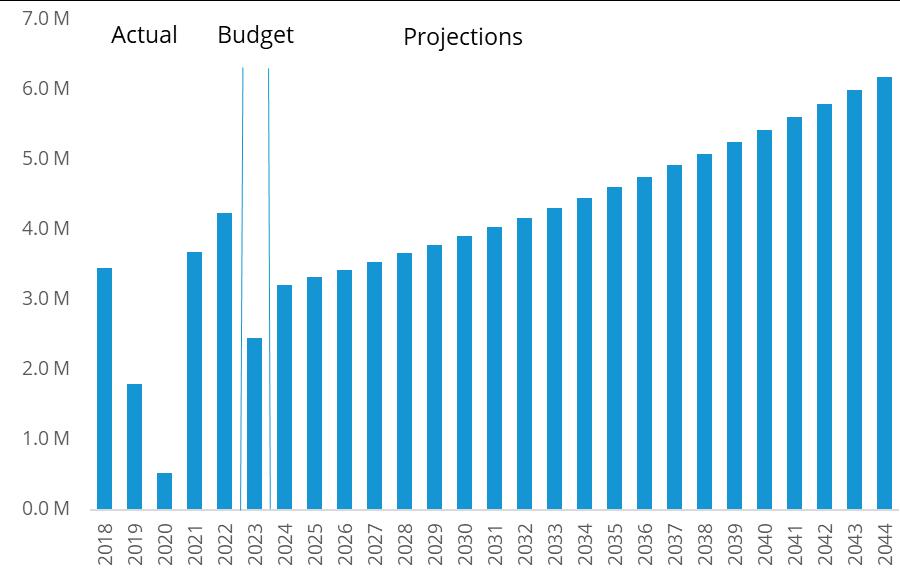
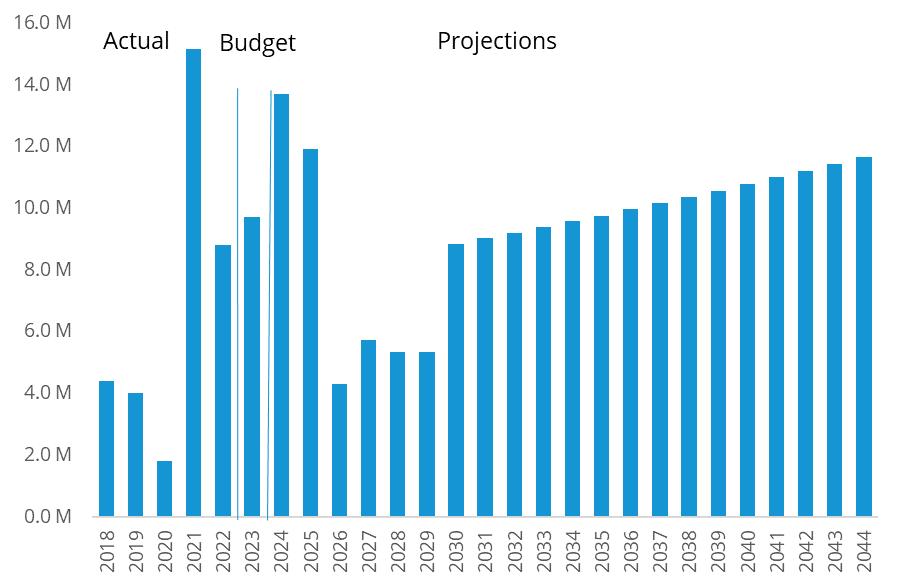
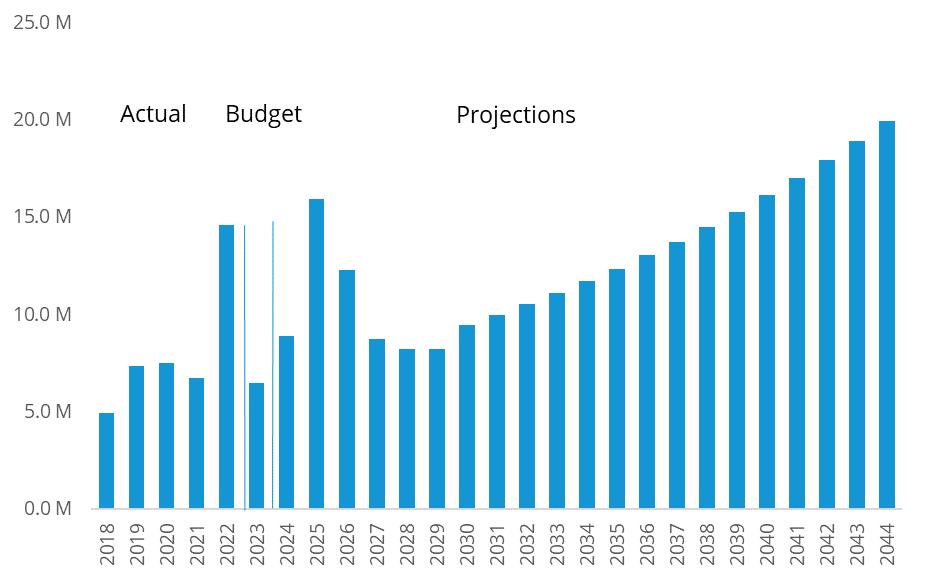
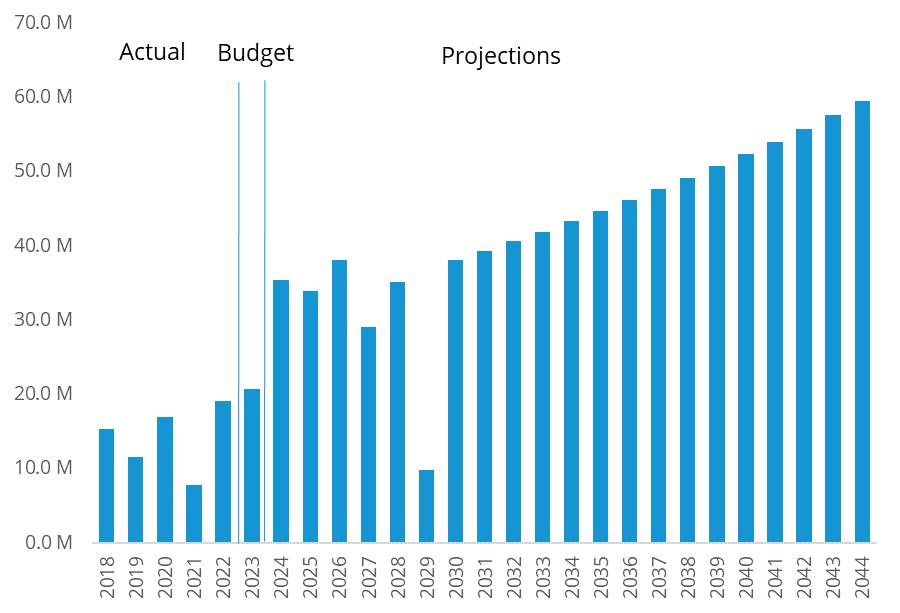
The projects found in the County’s 2024-2029 Six-Year Transportation Improvement Program (TIP) represent concurrency-related “Capacity Projects,” other “Capacity Projects,” “Non-Capacity” road and bridge projects, and “Miscellaneous Programs.” These projects represent the County's best estimate of capital related investment (including preliminary, final engineering, right-of-way acquisition, and construction) in its road system over the next six years. The total estimated cost for this effort, not including active transportation projects, is $281,731,000 from 2024-2029, as can be seen in Exhibit 70. The CFP adopts by reference the TIP, as amended. An additional $1,500,000 is anticipated in 2024 for road building and facilities projects per the adopted 2024-2029 CFP, as can be seen in Exhibit 71. Exhibit 70 also identifies projects with costs from 2030-2044. In addition, there are intersection projects and other roadway projects funded in the 2018 TIF Program. Some of these TIF projects are included in the TIP while other projects are identified in Ordinance No. 2018-71s which is incorporated by reference in this CFP. Active transportation projects identified from 2024-2029 are discussed under Active Transportation and included in Exhibit 85.
The County budgets, administers, and delivers the road and bridge projects through the Public Works Construction Fund. The Construction Fund includes federal funding programs, state funding programs, County road funds, traffic impact fees, SEPA-based developer mitigation fund, and other miscellaneous funds.
Exhibit 70. Expected and Committed Roadway Projects, 2024-2044
038 AV NW (36 Av NW to Gig Harbor City Limits), [MapID 630]
046
122
('C' St S to 'A' St S), [MapID 682]
E (146 St Ct E to 136 St E), [MapID 569]
BR #18204-A PUYALLUP RIVER (SR 167 to North Levee Rd E), [MapID 840] $3,500,000
BR #19185-A / ORVILLE RD E / KAPOWSIN CK SCOUR REPAIR (Orville Rd E to Kapowsin Ck), [MapID 796]
BR #26211-A / FOX IS BR RD GIRDER REPAIRS (Fox Island Bridge Rd over Hale Passage), [MapID 801]
BR #26211-A FOX IS BR RD - VARIOUS REPAIRS (Fox Island Bridge Rd over Hale Passage), [MapID 800]
BR #26211-A / FOX ISLAND BRIDGE RD - TS&L Study (Fox Island Bridge Rd over Hale Passage), [MapID 631]
BR #26211-A / Fox Island BR RD – Replacement Crossing (Fox Island Bridge Rd over Hale Passage)
BR #29202-A - CHAMBERS CREEK BRIDGE REPLACEMENT (Chambers Ck Rd W (MP 2.2-2.35)), [MapID 776]
BR #31221-A / CRAMER RD NW (Cramer Rd NW over Glencove Ck), [MapID 277] $3,803,000
BR #34195-A / PATTERSON RD E (110ft Southeast of 212 Av E from MP.10 to MP.20), [MapID 692]
BR #6193-A / HARTS LAKE RD S (At Horn Creek) (At Horn Creek (MP 3.94)), [MapID 711]
BR #7195-A / 128 ST E (At Puyallup River / McCutcheon Rd E), [MapID 671] $20,000
BR #7195-F / MCCUTCHEON RD E (At Canyon Falls Creek), [MapID 678] $110,000 $180,000
BR #8173-C / SCHUDY RD S (Lacamas Creek) (At Lacamas Ck 150 ft N/O 20 Av S (MP 1.60) .), [MapID 829]
BR #SUM1204-A / STEWART RD (Stewart Rd over White / Stuck River ), [MapID 5]
BRIDGE DECK REHAB - MASHEL RV, PUYALLUP RV, KAPOWSIN CK (BR #26164-A at Mashel RV / BR #6195-A at Puyallup RV / BR #5175-C at Kapowsin CK), [MapID 802]
BRIDGE DECK REHABILITATIONS - CLOVER CREEK, LITTLE MASHEL (BR #17193-D and BR #25164-A), [MapID 785]
BRIDGE PAINTING - COUNTYWIDE (BR #17173-A; BR #24164-B; BR #5174-A; BR #16205-A), [MapID 784]
BRIDGE REPAIR PROGRAM (Countywide), [MapID 775]
C ST S - TRAFFIC CALMING (120 St S to Layfette St S), [MapID 843]
C ST S (Garfield St to 120 St S), [MapID 820]
RD E - ASPHALT OVERLAY (160 St E to 138 St E), [MapID 798]
CANYON RD E - N EXT / BR #19204-H / 52 ST E / 70 AV E (52 St E / 62 Av E to Puyallup River SR-167 to N Levee Rd E / 70 Av E), [MapID 321]
CANYON RD E - NORTHERLY EXT (1,500 FT S/O Pioneer Wy E to 52 St E / 62 Av E), [MapID 446]**
CANYON RD E - SOUTHERLY EXT (208 St E to 200 St E), [MapID 573] $7,134,000 $4,000
CANYON RD E (72 St E to Pioneer Wy E), [MapID 470]
$1,726,000
$7,214,000
COUNCIL TRAFFIC AND SAFETY IMPROVEMENTS- 2024-2029 (Various locations), [MapID 719]
EAST BAY DR NW / 25 ST NW / 34 AV NW (Wollochet Dr NW to Point Fosdick Dr), [MapID 836]
REPAIR - 264 ST E (MP 2.3 to MP 2.5), [MapID 811]
FAIRFAX FOREST RESERVE RD (0.92 mi E/O Zavitski Rd to Mt. Rainier National Park), [MapID 689]
WATER BV E (Tehaleh Bv E to 181 Av E), [MapID 672]
GIVEN RD E / 99 ST E (Intersection), [MapID 726]
/ DEVELOPER MATCHING PROGRAM (Various locations), [MapID 257]
- 2023 (Various locations), [MapID 738]
- 2024 (Various locations), [MapID 823]
PROGRAM - 2025 (Various locations), [MapID 824]
[MapID 200]
[MapID 837]
RD E / 122
SAFETY - CLRS / SE / HFST
Note: Priorities may change over time and new funding sources may become available or existing funding sources may be eliminated or shifted. 2024-2029 totals include road projects listed in the TIP. As noted in the Pierce County Road Fund Sustainability Evaluation Report (September 29, 2023), the CFP does not address long-term maintenance and replacement needs for some large projects like the Fox Island Bridge; these large projects will have their own financial strategy that may include funding options specific to these projects.
Sources: Adopted 2024-2029 Transportation Improvement Program (TIP), 2023; Pierce County Finance Department, 2024; Pierce County, 2024; Fehr & Peers, 2024; BERK, 2024.
Exhibit 71. Road Buildings/Facilities—Additional Planned Capital Projects in the Adopted 6-Year CFP, 2024-2044
Note: Priorities may change over time and new funding sources may become available or existing funding sources may be eliminated or shifted. 2024-2029 totals include roads buildings and facilities projects in the 6-year CFP but not in the TIP.
Sources: Pierce County Finance Department, 2024; Pierce County, 2024; BERK, 2024.
Active Transportation Systems
Overview
Active transportation (nonmotorized) systems include sidewalks, trails, bicycle lanes, and roadway shoulders to accommodate pedestrians, bicyclists, and skaters for both transportation and recreational purposes. Within Pierce County, these systems include sidewalks, trails, bicycle lanes, and roadway shoulders that are designed to meet the needs of both transportation and recreational purposes.
Inventory
A detailed geospatial inventory of current road facilities (including an inventory of existing pedestrian and bicycle facilities) is on file electronically in the County’s Department of Planning and Public Works in the “GIS-Mo” database.2 The “GIS-Mo” database is a requirement of the Washington State County Road Administration Board (CRAB).
Pedestrian
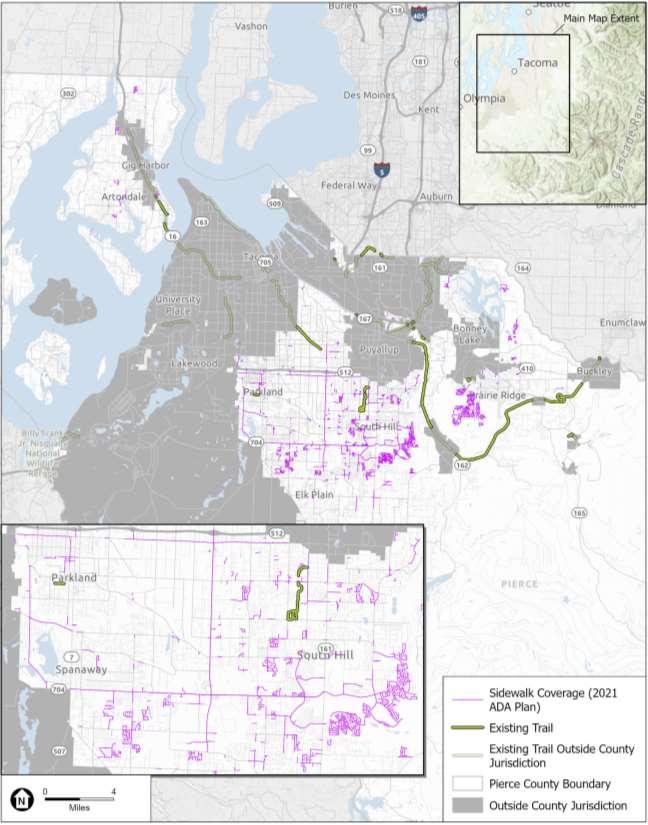
Pierce County conducted an inventory of County-owned sidewalks as part of its updated Transition Plan for compliance with the American with Disabilities Act (ADA). Based on this inventory, the County maintains approximately 244 miles of sidewalk and 7,019 curb ramp locations. These facilities are shown in Exhibit 72. In addition to locations with sidewalks, the County maintains approximately 284 miles of roadway where a shoulder of 4 feet or more exists on at least one side of the road. Although these locations do not have sidewalk, their wide shoulders can facilitate mobility for active mode users.
Bicycle
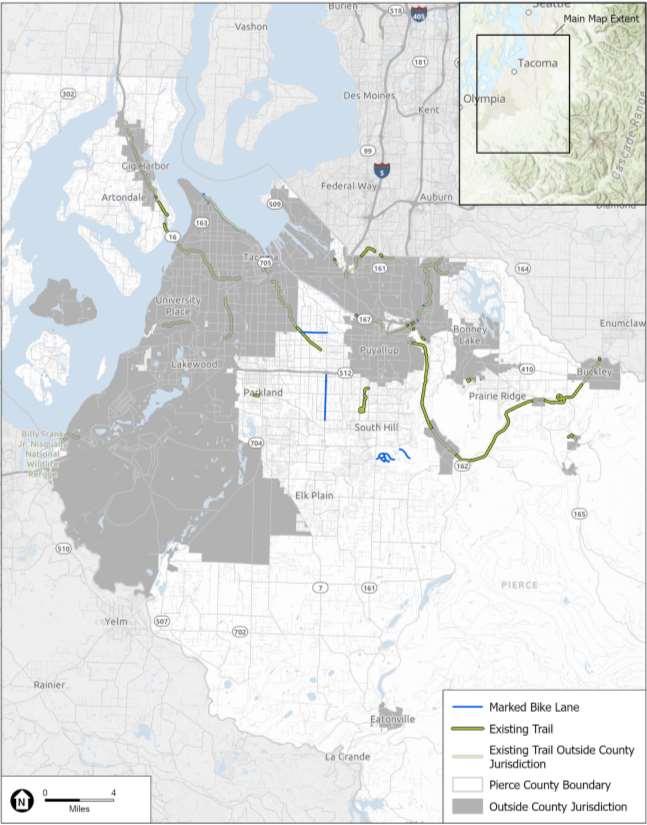
There are currently 18 miles of striped bicycle lanes along arterial roadways maintained by Pierce County. These facilities are shown in Exhibit 73. The County also maintains approximately 123 miles of roadway with shoulders 4 feet or wider on at least one side of the road, which could feasibly serve bicyclists
Trails
In addition to pedestrian and bicycle facilities maintained by the County, the County also maintains approximately 23.5 miles of paved trails, classified as Regional and Connector Trails. These trails range in terms of surface type and grade, and connect both local and regional centers. The County has also planned several other Regional and Connector Trails to further expand trail access throughout the County. A map of trails included in the Regional Trails Plan is shown in Exhibit 74.
2 GIS-Mo” database.
Exhibit 72. County-Maintained Pedestrian Facilities, 2024
Sources: Pierce County, 2024; Fehr & Peers, 2024.
Exhibit 73. County-Maintained Bicycle Facilities, 2024
Sources: Pierce County, 2024; Fehr & Peers, 2024.
Sources: Pierce County, 2024; Fehr & Peers, 2024
Exhibit 74. Pierce County Regional Trails Plan
Level of Service Standards
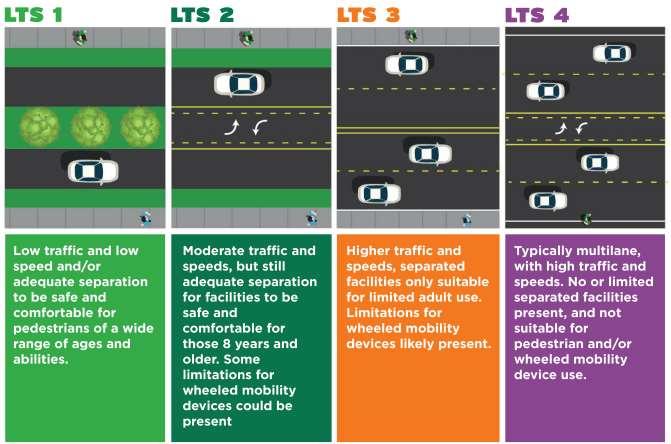
In line with the County’s transition towards a multi-modal transportation approach, the County has adopted a level of traffic stress metric to use as a performance measure for pedestrian and bicycle facilities along roadway segments. These metrics were developed based on extensive research and similar procedures that are used in many jurisdictions throughout the nation.
Level of traffic stress (LTS) is used to assess conditions of pedestrian and bicycle facilities in unincorporated Pierce County between intersections. LTS is split into four levels, summarized in Exhibit 75 for pedestrian LTS and Exhibit 76 for bicycle LTS. LTS is calculated based on the following inputs:
• Type of active transportation facility.
• Arterial traffic daily volume.
• Speed limit in miles per hour.
Exhibit 77 and Exhibit 78 provide thresholds for pedestrian and bicycle Level of Traffic Stress (LTS) as established by the County staff. Considering the type of facility, traffic volume, and speed limit, LTS facilitates informed decision-making for pedestrian and bicycle transportation planning.
Source: Pierce County, 2024; Washington Department of Transportation, 2024.
Exhibit 75. Pedestrian Level of Traffic Stress
Source: Pierce County, 2024; Washington Department of Transportation, 2024.
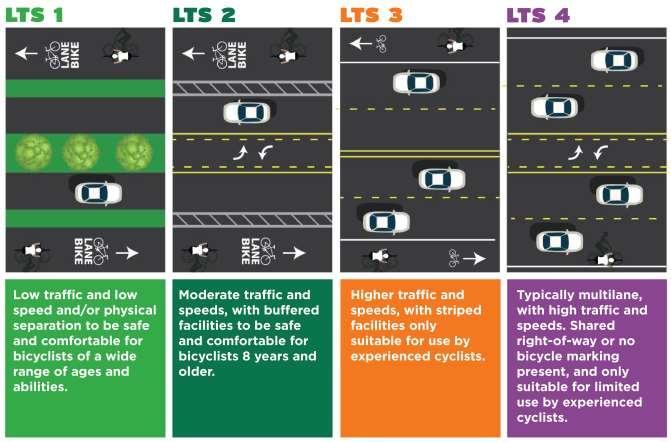
Exhibit 76. Bicycle Level of Traffic Stress
Exhibit 77. Pedestrian LTS Thresholds
Abbreviations: AADT =
Source: Pierce County, 2024.
Exhibit 78. Bicycle LTS Thresholds
Abbreviations: AADT = annualized average daily traffic; LTS = level of traffic stress; mph= miles per hour, k = 1,000. *Paved shoulder measures at least 4 feet wide from edge line to pavement end.
Source: Pierce County, 2024.
Pedestrian
Existing (2018) Conditions
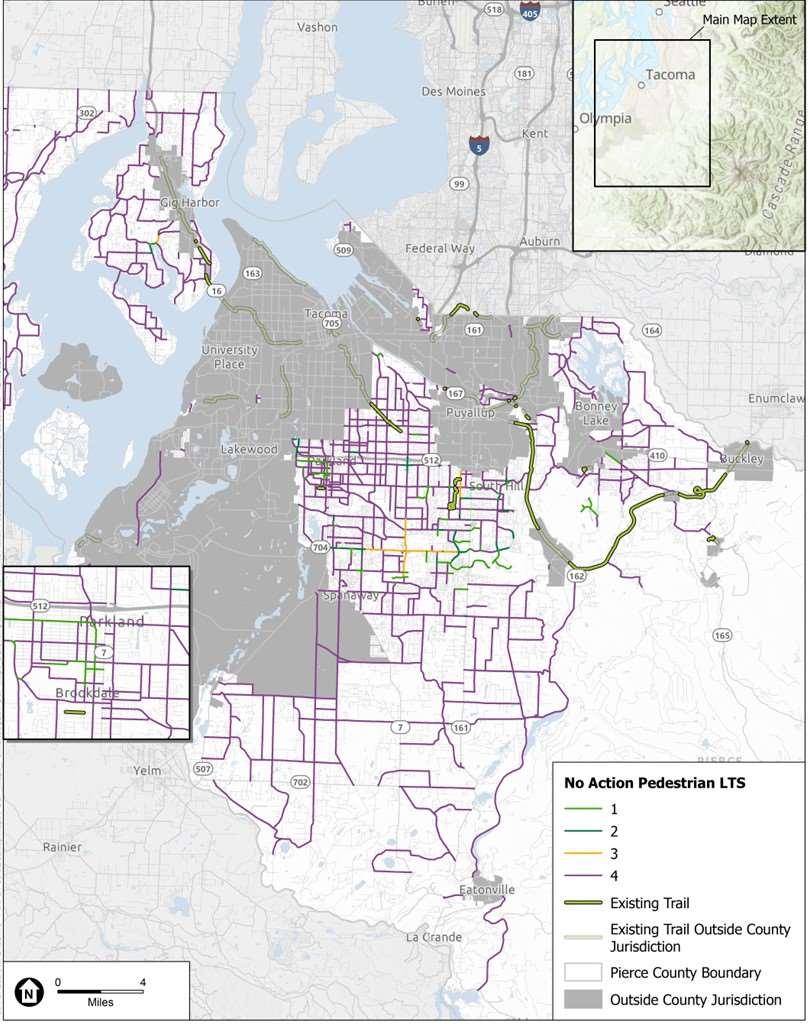
Exhibit 79 shows pedestrian facility LTS on arterials within unincorporated Pierce County. The County recognizes that some trip-making requires walking on roads due to necessity, regardless of conditions. This underscores the importance of understanding the current LTS experienced on all arterial facilities, irrespective of whether facilities currently exist. LTS trends show that most arterial segments are LTS 4, meaning they are not suitable for pedestrian use. Although not shown in Exhibit 79, most local roadways are either LTS 1 or LTS 2.
2044 Conditions
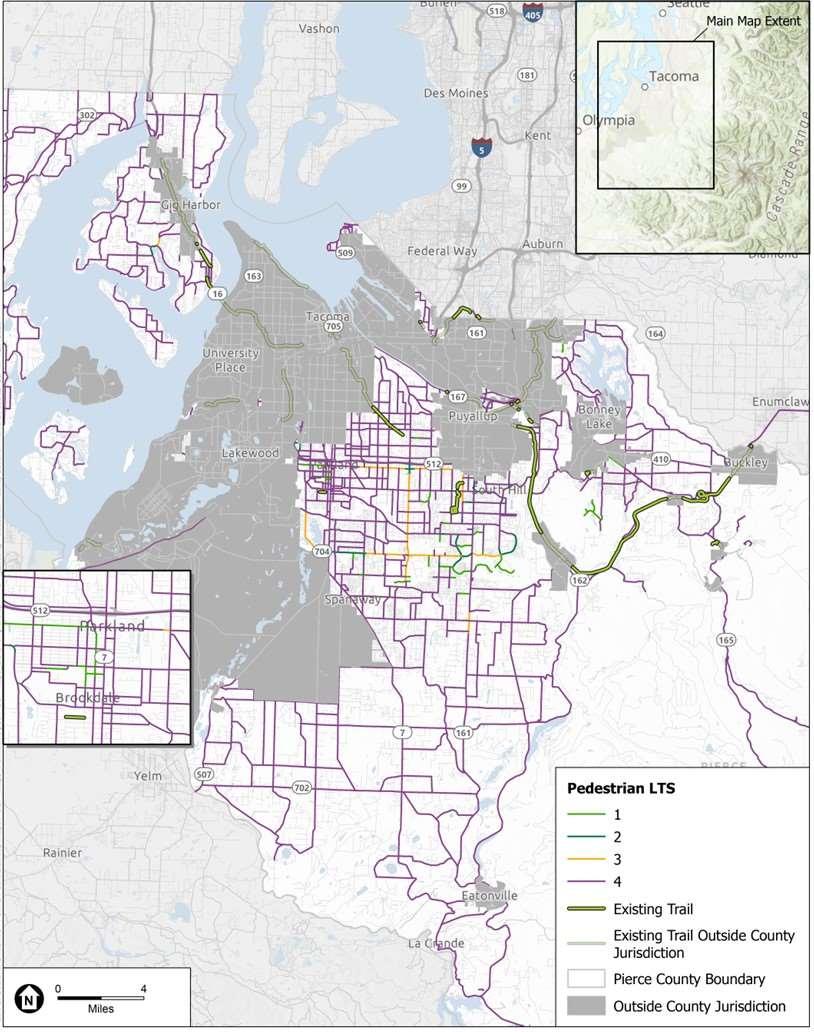
The level of traffic stress presented in Exhibit 80 represents the pedestrian facility performance under 2044 conditions. As part of its most recent Transportation Element update, the County defined a pedestrian priority network that shows the aspirational level of traffic stress along key County arterials. The County also performed prioritization scoring to identify segments that would be a high priority for investment by 2044. Segments considered a high priority for investment by 2044 are provided in Exhibit 81.
Exhibit 79. Pedestrian LTS on Arterial Network (2018)
Sources: Pierce County, 2024; Fehr & Peers, 2024.
Sources: Pierce County, 2024; Fehr & Peers, 2024.
Exhibit 80. Pedestrian LTS on Arterial Network (2044)
81. LTS Standards on High-Priority Segments for Pedestrian Investment
Sources: Pierce County, 2024; Fehr & Peers, 2024.
Exhibit
Bicycle
Existing (2018) Conditions
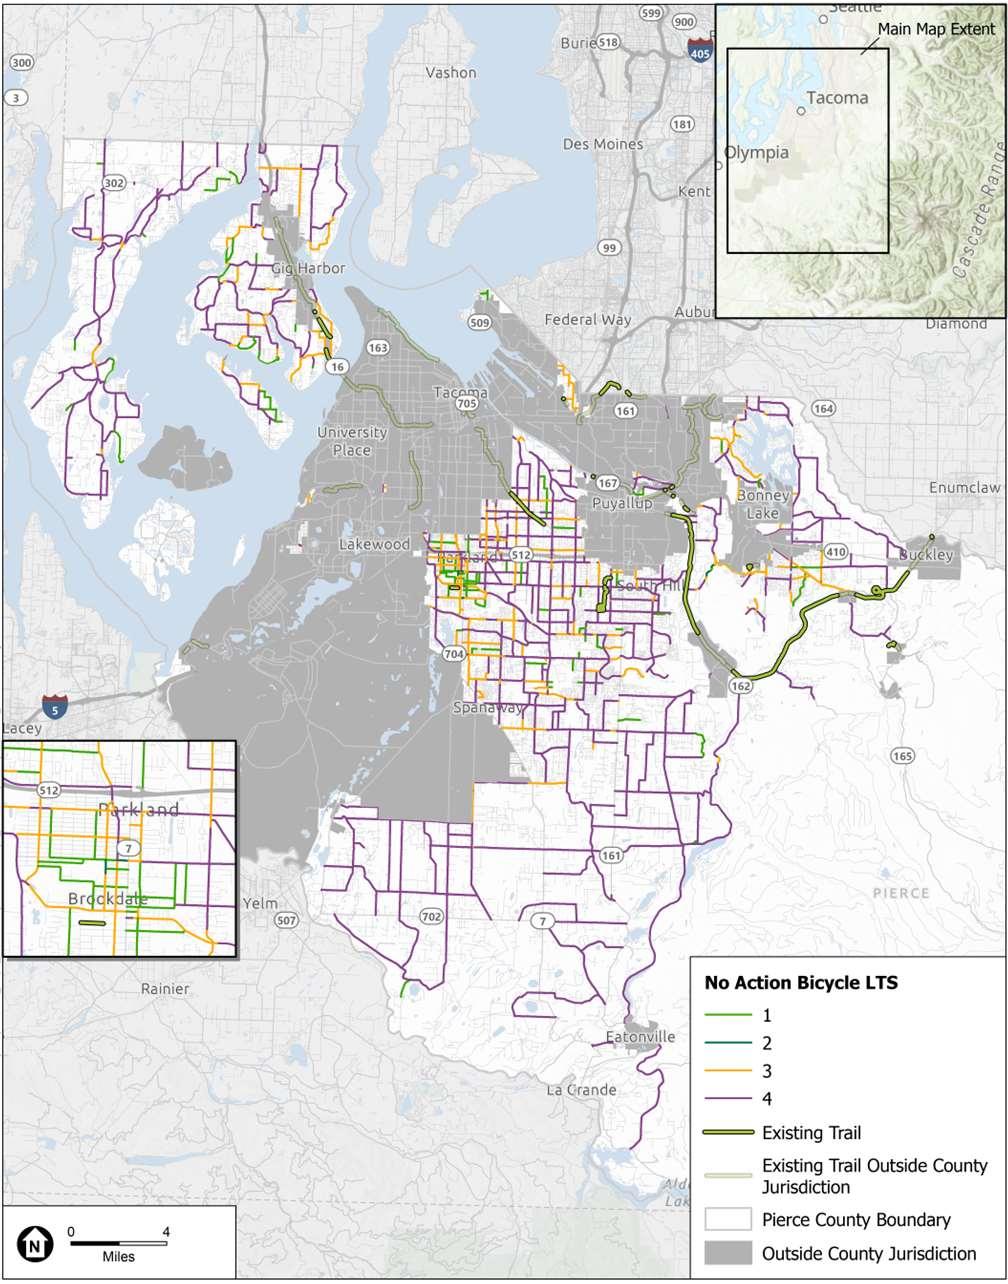
Exhibit 82 shows bicycle facility LTS on arterials within unincorporated Pierce County. The County recognizes that some trip-making requires biking on roads due to necessity, regardless of conditions. This underscores the importance of understanding the current LTS experienced on all arterial facilities, irrespective of whether facilities currently exist. LTS trends show that most arterial segments are LTS 4, meaning they are uncomfortable for most bicyclists. Although not shown in Exhibit 82, most local roadways are either LTS 1 or LTS 2.
2044 Conditions
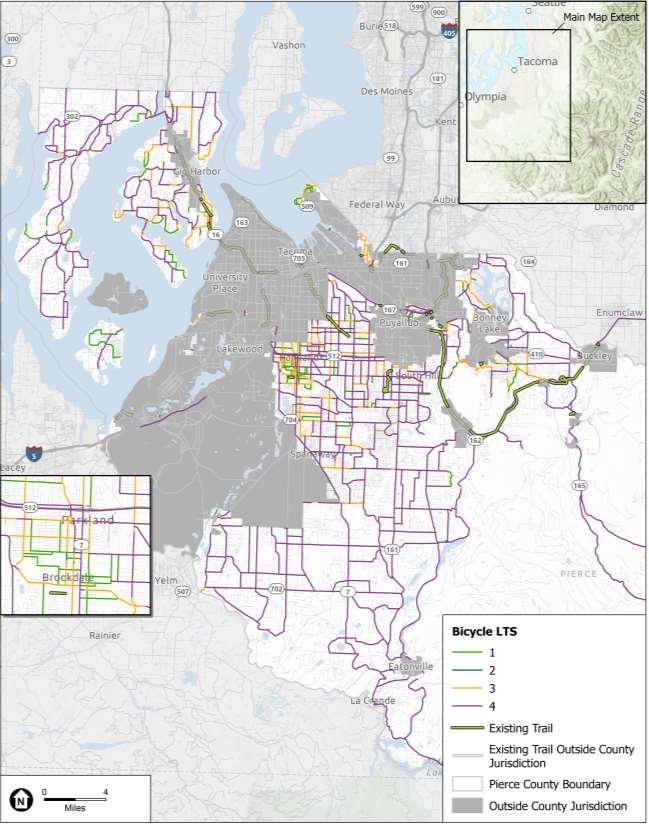
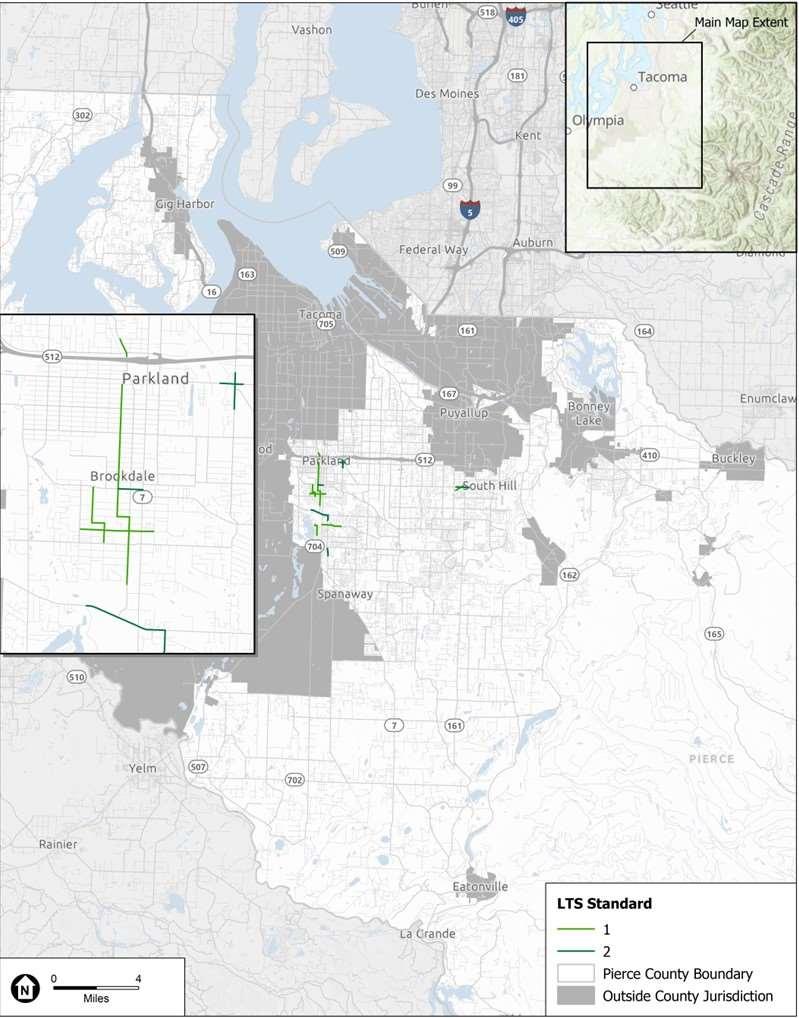
The level of traffic stress presented in Exhibit 83 represents the bicycle facility performance under 2044 conditions. As part of its most recent Transportation Element update, the County defined a bicycle priority network that shows the aspirational level of traffic stress along key County arterials. The County also performed prioritization scoring to identify segments that would be a high priority for near-term investment by 2044. Segments considered a high priority for investment by 2044 are provided in Exhibit 84
82. Bicycle LTS on Arterial Network (2018)
Sources: Pierce County, 2024; Fehr & Peers, 2024.
Exhibit
Sources: Pierce County, 2024; Fehr & Peers, 2024.
Exhibit 83. Bicycle LTS on Arterial Network (2044)
84. LTS Standards on High-Priority
Segments for Bicycle Investment
Sources: Pierce County, 2024; Fehr & Peers, 2024.
Exhibit
Project Summary
Recent and Ongoing Major Accomplishments
• In 2020, the County completed an Americans with Disabilities Act (ADA) Transition Plan to identify facilities within the public right-of-way that need to comply with the ADA. The plan outlines how facilities will be assessed/prioritized; how much it will cost and how it will be funded; a timeline for improvements; and updates to design standards and procedures so that new facilities comply.
• The County updates its GIS-Mo database annually to have an up-to-date inventory of sidewalk, bicycle, and other active transportation infrastructure. This informs current and future investment in active transportation facilities.
• The County is currently in the process of developing a countywide Vision Zero Action Plan, with the goal of attaining zero fatalities and serious injury collisions among all modes of transportation in unincorporated Pierce County by 2035. As part of this plan, the County will identify active transportation improvements to improve pedestrian and bicycle safety.
Non-Capital Alternatives
The following non-capital alternatives include strategies, programs, technologies, and other alternatives that do not require capital improvement projects to achieve the LOS standards for active transportation capital facilities. Non-capital measures to encourage pedestrian and bicycle infrastructure use may include Transportation Demand Management (TDM) programs and improved transit services.
Capital Projects
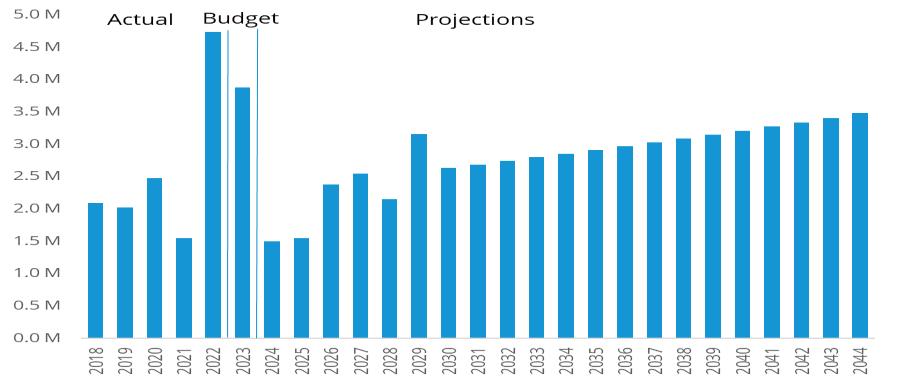
A portion of projects found in the County’s 2024-2029 Six-Year TIP represent the County's best estimate of capital-related investment (including preliminary, final engineering, right-of-way acquisition, and construction) in its active transportation system over the next six years. The total estimated cost for this effort, not including other road system projects from the 2024-2029 TIP in Exhibit 70, is $45,029,000 from 2024-2029. See Exhibit 85. The CFP adopts by reference the TIP, as amended. Exhibit 85 also identifies projects with costs from 2030-2044. There are also two projects from the Parks and Recreation portion of the Capital Facilities Plan that will play a role in meeting active transportation concurrency (see the Parkland Community Trail projects in Exhibit 85 and Exhibit 106 under Parks and Recreation). Road system projects from the 2024-2029 TIP are discussed under Error! Reference source not found. (see Exhibit 70).
The County budgets, administers, and delivers the active transportation projects through the Public Works Construction Fund. The Construction Fund includes federal funding programs, state funding programs, County road funds, traffic impact fees, SEPA-based developer mitigation fund, and other miscellaneous funds.
I-5 / JBLM SHARED USE PATH (Steilacoom Dupont Rd/East Dr/Huggins Meyer Rd(Wharf Rd to Lakewood City Limits)
TO
- 104 ST E (East of 16 Av E to Portland Av E)
Note: Priorities may change over time and new funding sources may become available or existing funding sources may be eliminated or shifted. 2024-2029 totals include active transportation projects listed in the TIP. For 2024, 2029, combined annual costs listed here and in Exhibit 70 are equal to the total annual costs in the TIP.
Sources: 2024-2029 Transportation Improvement Program (TIP), 2024; Pierce County Finance Department, 2024; Pierce County, 2024; Fehr & Peers, 2024; BERK, 2024.
Airports
Overview
Pierce County has multiple airports to serve its residents and visitors. Along with the SeattleTacoma International Airport in south King County, there are two military base airports, as well as several smaller public and private airports.
The largest airports in Pierce County are the military air facilities located on Joint Base Lewis McChord (JBLM) - McChord Field and Gray Field. General aviation is served by the County-owned Tacoma Narrows Airport (TIW) and Thun Field (PLU), along with several other small public and private airports. The CFP adopts by reference, as amended, the Tacoma Narrows Airport Master Plan and Thun Field Airport Master Plan.
Inventory
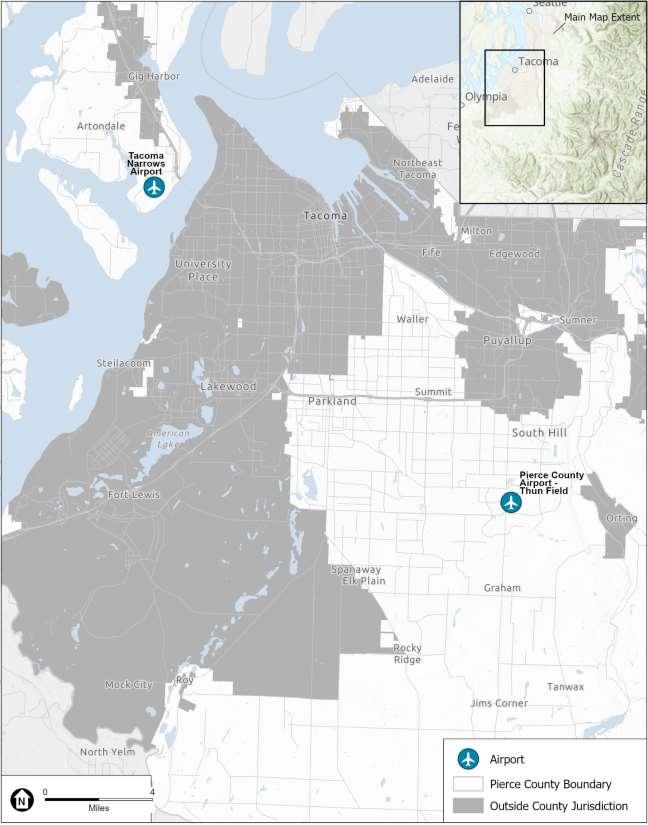
The two County airports provide general and corporate aviation access to the east of Pierce County and extreme western parts of the Puget Sound near Gig Harbor. These airports remain open 24 hours a day, 365 days a year, and are available for day-to-day general aviation service and emergency response/search and rescue support as needed. A summary of the current facility inventory for these two County airports, including the number of hangar units, tie-downs (anchor points for non-hangered smaller aircraft), and an estimate of annual operations (number of flights), is provided in Exhibit 86. A map showing the locations of these facilities is provided in Exhibit 87.
Source: Pierce County, 2023; Fehr & Peers, 2023.
Exhibit 86. Pierce County Airport System Current Facilities Inventory, 2022
Sources: Pierce County, 2023; Fehr & Peers, 2023.
Exhibit 87. Pierce County Airport System Current Facilities Locations, 2023
Level of Service Standards
The GMA recognizes general aviation airports as essential public facilities and requires that the capital needs of these facilities be considered in the Comprehensive Plan and CFP. The Pierce County Comprehensive Plan adopts the LOS for County-owned airports detailed in the Tacoma Narrows Airport Master Plan Update and Thun Field Airport Master Plan, as amended (Exhibit 1).
Adopted LOS for these two airports is currently based on annual aircraft operations and the capacity of runways to serve these operations. Exhibit 88 shows the annual aircraft operations and operational capacity for both airports, including estimates for 2023, 2024, 2029 and 2044. Existing capacity at both airports is anticipated to sufficiently support population growth through at least 2044. The aircraft operations forecasts were derived based on the following assumptions:3
• Linear population growth rate of approximately 1.10% annually, countywide.
• Operations per Based Aircraft (OPBA) of approximately 670 OPBA for TIW and 507 for PLU.4
• 2023 operations estimates, as provided in the most recently adopted 6-year CFP.
Exhibit 88. Pierce County Airports Existing and Future LOS Analysis (Takeoffs and Landings)
Notes: The 2020 Census and 2044 population projection are consistent with the adopted CPPs. The 2023 population estimate is from OFM’s “April 1, 2023 Population of Cities, Towns and Counties” and the 2024-2029 population estimates are based on the CAGR from 2023-2044.
Source: Pierce County CPPs Appendix A, 2022; OFM, 2023; Pierce County, 2023; BERK, 2023; Fehr & Peers, 2023.
3 These assumptions are consistent with the assumptions used to develop previous forecasts in the most recently adopted TIW Airport Master Plan (2015). Growth rates were updated based on the most recently derived population growth rates, in addition to the most up-to-date FAA estimates for GA and Taxi aircraft growth.
4 These were derived from based aircraft and annual operations numbers obtained from the most recent FAA 5010-1 Airport Master Records for both TIW and PLU (2019).
Project Summary
Recent and Ongoing Major Accomplishments
• Removed obstruction surrounding the airports consistent with FAA requirements.
• Relocated/removed stormwater facility and relocated/expanded several taxiways at Tacoma Narrows Airport to meet FAA standards.
• Expand the pump house capacity and added two water reservoirs, two fire pumps, additional water meters, and three booster pumps at Tacoma Narrows Airport.
Non-Capital Alternatives
The Airport Master Plans detail alternatives considered for each airport to meet general aviation user demand and site constraints and to comply with FAA airport design standards consistent with the County’s resources and strategic development. These include considerations related to runway length and width, taxiway systems, landside facilities, airport supporting facilities, airport access, and land use and property. Both plans include an alternatives analysis accepted by the FAA.
Capital Projects
Exhibit 89 and Exhibit 90 contain a list of capital projects for the airports identified by the County to meet the demands of growth over the next six years (2024-2029). Additional projects planned beyond the six-year period are also included as available from the Airport Master Plans. Projects at Tacoma Narrows Airport and Thun Field are estimated to cost $23,067,510 and $7,801,670, respectively, over the next six years (2024-2029) Priorities may change over time and new funding sources may become available or existing funding sources may be eliminated or shifted. Changes in the aviation industry, economic environment, and numerous other factors may also require adjustments in timing of planned improvements. The County will continue to regularly review and revise its airport capital projects to meet the needs of future growth and will update this section periodically as appropriate.
Exhibit 89. Tacoma Narrows Airport—Planned Capital Projects, 2024-2036
Note: Projects for 2030-2044 are the total estimated costs for Airport Master Plan Phase III (2027-2036) projects not already listed in the 2024-2029 CFP (in $2015). Capital projects in the Airport Master Plan are organized in phases and not broken down by individual year. Priorities may change over time and new funding sources may become available or existing funding sources may be eliminated or shifted.
Sources: Tacoma Narrows Airport Master Plan (Table 7A, Pierce County costs), April 2016; Pierce County Finance Department, 2023; BERK, 2024.
Exhibit 90. Thun Field—Planned Capital Projects, 2024-2036
Note: Estimated project costs for 2030-2044 are total estimated costs from the Airport Master Plan (in $2020). Priorities may change over time and new funding sources may become available or existing funding sources may be eliminated or shifted.
Sources: Thun Field Airport Master Plan (Table 5-4, local share), 2021; Pierce County Finance Department, 2023; Committee of the Whole Amendment No. 1 Proposal No. 2023-63, Passed 11/8/2023; BERK, 2024.
Ferry System
Overview
Pierce County is connected by two ferry routes. One operated by the County and the other by Washington State Department of Transportation (WSDOT). The WSDOT ferry route connects Point Defiance in Tacoma to Vashon Island. These ferry routes provide a critical transportation option for commuters and travelers looking to access these locations. In addition to this, the Pierce County Ferry System operates a ferry service that connects the town of Steilacoom, Anderson Island, and Ketron Island.
The CFP adopts by reference the Fourteen-Year Ferry Program, as amended.
Inventory
Pierce County’s Ferry System is designed to provide a reliable and efficient public transportation option to the residents and visitors of Steilacoom, Anderson Island, and Ketron Island. The primary performance objectives of the Pierce County Ferry System are to ensure that scheduled ferry runs operate on time with a 90-plus percent success rate and to comply with all safety and maritime security regulations. The current inventory of ferry facilities is provided in Exhibit 91, while a map of county-maintained facilities is shown in Exhibit 92.
Exhibit 91. Pierce County Ferry System Current Facilities Inventory, 2023
Facility/Equipment
Steilacoom, Anderson Island, and Ketron Island ferry terminals/landings
Christine Anderson
Current Capacity
One landing per hour at the Steilacoom and Anderson Island landings and three per day at Ketron Island, by request. Capacity could be increased using the second vessel with no impact to facilities.
The vessel can carry up to 54 cars and 150 passengers. Built in 1994. Steilacoom II
The vessel can carry up to 54 cars and 299 passengers. Built in 1994.
Source: Pierce County, 2023; Nichols Brother Boat Builders, Christine Anderson and Steilacoom II, 2023
Sources:
Exhibit 92. Pierce County Ferry System Current Facilities Locations, 2023
Pierce County, 2023; Fehr & Peers, 2023.
Level of Service Standards
Pierce County ferry system’s adopted LOS standard is to maintain daily ferry service with the capacity to serve the Anderson Island population (see Exhibit 1). The analysis below is based on ferry capacity during peak winter weekday demand. Exhibit 93 shows the demand (in terms of vehicles) on a peak winter weekday, as well as the total capacity for the system between the three ferry locations maintained by the County. This is based on one 54-car capacity boat at 213 runs per week (inclusive of service to Anderson Island). Based on current ridership trends and population growth, it is expected that weekly ridership will grow at a rate of approximately 2.5% annually. Under these conditions, current capacity (assuming one ferry operating at a time) is designed to maintain the ferry capacity at 100% up until 2044 and would adequately serve the Anderson Island population
Exhibit 93. Ferry System Existing and Future LOS Analysis
Notes: The 2020 Census and 2044 population projection are consistent with the adopted CPPs. The 2023 population estimate is from OFM’s “April 1, 2023 Population of Cities, Towns and Counties” and the 2024-2029 population estimates are based on the CAGR from 2023-2044.
Sources: Pierce County CPPs Appendix A, 2022; OFM, 2023; Pierce County, 2023; BERK, 2023; Fehr & Peers, 2023.
Project Summary
Recent and Ongoing Major Accomplishments
• Installed new non-skid surface on the Anderson Island, Ketron Island, and Steilacoom ferry landing aprons, rehabilitated the existing hinge assemblies at the Anderson Island Ferry landing apron, replaced three bearings at the Anderson Island and Steilacoom ferry landing transfer span, replaced the transfer span main hydraulic cylinder and bearings at the Steilacoom Ferry landing (2021), and resurfaced and restored ferry vehicle loading lanes and the parking lot at the Anderson Island Ferry.
• Began replacing the Ketron Island Ferry landing dolphins to ensure safe vessel landing.
• The Christine Anderson and Steilacoom II underwent a dry dock maintenance and inspection at Everett Ship Repair in 2022 and 2023, respectively.
Non-Capital Alternatives
Capacity could be increased using the second vessel with no impact to facilities. The County will continue to observe actual demand to determine if running the two ferry vehicles concurrently is needed beyond the peak season weekends.
Capital Projects
Ferry capital projects are detailed in the County’s 2024-2037 Fourteen-Year Ferry Program. The Steilacoom II and Christine Anderson have both been accepted into the Coast Guard’s Underwater Inspection in Lieu of Dry Docking (UWILD) program. Each boat is dry docked every fourth year unless the UWILD uncovers an issue requiring work in the shipyard. Engine overhaul, vessel painting, hull repairs, and other major and minor repairs occur during the dry docking.
Minor maintenance is continual on the ferries, landings, aprons, and waiting facilities. The costs, frequency and extent of the work may be unpredictable and, emergency issues may need immediate resolution. Routine maintenance activities such as oil changes or engine overhauls are more predictable and scheduled in advance. The maintenance budget takes into consideration both preventative and emergent repair work.
Exhibit 94 details proposed projects from the Fourteen-Year Ferry Program over the next six years (2024-2029), as well as additional projects planned beyond the six-year period. Identified projects are estimated to cost $5,675,000 over the next four years. No major ferry capital projects are currently identified past 2027. Priorities may change over time and new funding sources may become available or existing funding sources may be eliminated or shifted.
The CFP adopts by reference the Fourteen-Year Ferry Program, as amended. The County will continue to regularly review and revise its ferry capital projects to meet the needs of future growth and will update this section periodically as appropriate.
Exhibit 94. Pierce County Ferry System—Planned Capital Projects, 2024-2037
Note: Priorities may change over time and new funding sources may become available or existing funding sources may be eliminated or shifted.
Source: 2024-2037 Fourteen-Year Ferry Program, 2023; Pierce County Finance Department, 2023; BERK, 2024.
Parks and Recreation
Overview
Pierce County Parks and Recreation Department (Pierce County Parks)provides park and recreation services to the residents of Pierce County, focusing on the unmet needs of residents living in unincorporated areas. The Department was created in 1958 and is divided into three divisions: Resource Stewardship, Parks and Recreation, and Administrative Services. Pierce County Parks is the primary provider of park services in the unincorporated areas and works in partnership with municipal park departments and park districts in the incorporated areas in Pierce County. Park districts serving unincorporated Pierce County are discussed under NonCounty Provided Facilities and Services. Pierce County Parks primarily serves unincorporated areas of the County; however, as a regional provider, the park system also includes regional facilities located within cities and park districts.
The current Pierce County Parks, Recreation, and Open Space (PROS) Plan was adopted by the Pierce County Council in February 2020 and is adopted by reference, as amended, in the Pierce County CFP.
Inventory
Pierce County Parks serves the largest population and is the largest land manager in the countywide system of park providers. The Department owns and manages about 5,215 acres dedicated to parks, open space, and trails that are subject to LOS under the GMA. Pierce County Parks manages diverse and unique facilities—from small, local playfields to nationally recognized golf courses and trails and is the primary provider of regional trails, public golf courses, open spaces, tournament quality ballfields, ice rinks, equestrian facilities, disc golf courses, and BMX tracks within the county. Countywide, Pierce County Parks manages 2,781 acres of regional parks, 664 acres of county parks, 72 acres of local parks, 120 acres of special use parks, 911 acres of resource conservancy parks, 533 acres of linear parks/trails, 126 acres of unclassified sites, and 7 acres of cemeteries (see Exhibit 95, Exhibit 96, and the following sections).
Exhibit 95. Pierce County Parks Total, All Park Facilities, 2023
Sources: Pierce County PROS Plan, 2020; Pierce County GIS, 2023; BERK, 2023.
Exhibit 96. Pierce County Parks Classification, 2023
Sources: Pierce County GIS, 2023; BERK, 2023.
Pierce County Parks also manages 41.2 miles of trails (including the 21-mile-long Foothills Trail in east Pierce County). The Planning and Public Works Department’s Surface Water Management Division also owns two properties which allow passive recreation: the South Fork Preserve (an 85acre salmon-habitat and floodplain restoration site along the Puyallup River just north of the McMillin Trailhead) and Woodland Pond (a 6.4-acre stormwater pond that functions as a neighborhood park with a walking trail during the dry season).
Regional Parks
Regional Parks serve the whole county, providing a variety of unique recreation facilities that attract visitors from the entire region, which may include formal and informal recreation areas, specialty facilities, and significant habitat and historical resource protection areas. Regional parks are generally greater than 200 acres in size. Pierce County has 2,781 acres of regional parks. See Exhibit 97.
Exhibit 97. Pierce County Parks Regional Parks, 2023
*Partially developed. Developed park acres are calculated by property; however, in some cases only a portion of the property may be developed.
**Building is managed by the County’s Facilities Management Department, but the Parks and Recreation Department is responsible for all capital planning and improvements.
Sources: Pierce County PROS Plan, 2020; Pierce County GIS, 2023; BERK, 2023.
County Parks
County Parks serve more than one community and are designed to accommodate many activities and people of a wide variety of ages, abilities, and interests. They are developed for both formal and informal recreation activities and for protecting habitat. Recreation features vary by park. County Parks are generally 40 to 200 acres in size. Pierce County has 664 acres of county parks. See Exhibit 98.
Exhibit 98. Pierce County Parks County Parks, 2023
*Partially developed. Developed park acres are calculated by property; however, in some cases only a portion of the property may be developed.
Sources: Pierce County PROS Plan, 2020; Pierce County GIS, 2023; BERK, 2023.
Local Parks
Local Parks serve neighborhoods and communities and are designed to accommodate varying activities and people with a wide variety of ages, abilities, and interests. Recreation features will vary by park and include formal and informal activities. Local Parks are generally 5 to 40 acres in size. Pierce County has 72 acres of local parks. See Exhibit 99
Exhibit 99. Pierce County Parks—Local Parks, 2023
Sources: Pierce County PROS Plan, 2020; Pierce County GIS, 2023; BERK, 2023.
Special Use Parks
Special Use Parks include stand-alone recreation facilities not located within larger parks. These include single-purpose sites that generally serve a regional audience, such as community centers, BMX tracks, and golf courses. Pierce County has 120 acres of special use parks. See Exhibit 100.
Exhibit 100. Pierce County Parks Special Use Parks, 2023
*Partially developed. Developed park acres are calculated by property; however, in some cases only a portion of the property may be developed.
Sources: Pierce County PROS Plan, 2020; Pierce County GIS, 2023; BERK, 2023.
Resource Conservancy Lands
Resource Conservancy Lands are conservation areas designed to protect unique or significant natural features, such as rivers and streams, wetlands and marshes, environmentally sensitive areas, and wildlife habitats. Where appropriate, Resource Conservancy Lands may secondarily support passive, nature-oriented outdoor recreation, such as trails and picnic areas. Pierce County has 911 acres of resource conservancy parks. See Exhibit 101.
Exhibit 101. Pierce County Parks Resource Conservancy Lands, 2023
Sources: Pierce County PROS Plan, 2020; Pierce County GIS, 2023; BERK, 2023.
Linear Parks and Trails
Linear Parks and Trails include built or natural corridors that provide recreation or non-motorized transportation facilities and green buffers between communities. Recreational use is generally passive or trail-related. Linear trail corridors may also include supporting facilities, such as interpretive areas, picnic tables, or trailheads. Pierce County has 533 acres of linear parks/trails. See Exhibit 102.
Exhibit 102. Pierce County Parks—Linear Park/Trails, 2023
Sources: Pierce County PROS Plan, 2020; Pierce County GIS, 2023; BERK, 2023.
Unclassified Sites
Unclassified sites include land that has been acquired by Pierce County Parks but which may not meet Pierce County Parks mission and may be transferred to a more appropriate custodian. These sites receive minimal maintenance. Pierce County has 126.3 acres of unclassified sites. See Exhibit 103.
Exhibit 103. Pierce County Parks—Unclassified Sites, 2023
Sources: Pierce County PROS Plan, 2020; Pierce County GIS, 2023; BERK, 2023.
Cemeteries
Cemeteries are included in the parks classification system because they become the responsibility of the County when they are without caretakers, per RCW. Pierce County has 7.3 acres of cemeteries. See Exhibit 104.
Exhibit 104. Pierce County Parks Cemeteries, 2023
Sources: Pierce County PROS Plan, 2020; Pierce County GIS, 2023; BERK, 2023.
Level of Service Standards
The Pierce County Comprehensive Plan adopts the LOS for park and recreation facilities detailed in the PROS Plan, as amended (see Exhibit 1) The PROS Plan sets the following minimum LOS standard and target rate of investment for park and recreation facilities in Pierce County:5
5 No substantive changes to parks LOS are proposed in the Pierce County Comprehensive Plan (Exhibit 1).
• Minimum LOS: Invest in the system at a similar rate per capita as current residents enjoy and ensure that the current system can be improved to meet demand for parks and recreation caused by new growth. Pierce County Code (PCC) 4A.10.130 directs this rate to be adjusted annually based on the cost of construction and every five years based on a revaluation of the park system, and as such, this rate is anticipated to change over time.6
• Target Rate: Increase the per capita investment by 20%, the same percentage as is anticipated in additional system investment via grants and donations.
The minimum LOS is based on the County’s adopted Fiscal Policy, which identifies an “investment per capita” that allows the park system to provide at least the same LOS per resident as was in place when the policy was adopted in 2016 as population grows. The rate has since been adjusted and is now $3,529 per dwelling unit through January 31, 2024, or $1,411.60 per resident (based on a household size of 2.5). The County recently adopted revised rates of $3,723 per dwelling unit effective February 1, 2024 (or $1,489.20 per resident) and $3,928 per dwelling unit (or $1,571.20 per resident) effective February 1, 2025. This analysis uses the rate effective February 1, 2025, as most growth over the 6-year and 20-year planning period will likely occur after that date.
PROS Plan Exhibit 4-32 also identifies the base and target facility rates based on facilities per 1,000 population. The base rate is the rate in 2019 and includes parks, trails, open space, sports courts and fields, and family activities rates similar to today’s rate to gauge system quality. The target rates provide a rate of service that the department aspires to meet through grant funding, donations, and partnership opportunities with the goal of providing a park system that is 20% above the minimum rate and makes progress toward the average of benchmarked communities. These rates are guiding measures to improve the park system but are not LOS measures.
Exhibit 105 details existing and future LOS under the adopted minimum LOS standard based on the 6- and 20-year population growth projections. The 2020-2044 timeframe is shown for comparison and based on adopted population growth in the CPPs. An additional investment of $22,589,725 will be required to meet minimum LOS over the 6-year period (2024-2029) and an additional investment of $95,048,939 will be required to meet minimum LOS over the 20-year period (2024-2044).
6 This is consistent with language in the adopted PROS Plan. However, PCC 4A.10.130 directs the park impact fee schedule to be reviewed by the Council as it deems necessary and appropriate in conjunction with the update of the CFP (occurs biennially) and for the County to review the fee at least every five years.
Exhibit 105. Parks Existing and Future LOS Analysis
439,323
Notes: Population served includes unincorporated Pierce County minus JBLM. The 2020 Census and 2044 population projection are as reported in the adopted CPPs. The 2024 population estimate is based on the CAGR from 2023-2044.
* Based on impact fees effective February 1, 2025. The impact fee per dwelling unit is currently $3,529, rising to $3,723 effective February 1, 2024 and $3,928 effective February 1, 2025. Most growth from 2020-2044 would likely occur after 2025 so the 2025 rate is used to calculate additional need over the planning horizon. Assumes an average household size of 2.5 people.
Sources: Pierce County CPPs Appendix A, 2022; OFM, 2023; Pierce County (Ordinance 2023-51s effective February 1, 2024), 2023; BERK, 2024
Project Summary
Recent and Ongoing Major Accomplishments
Pierce County Parks & Recreation details ongoing projects on their Projects & Plans website. The following is a brief summary of projects currently undergoing construction, design, and/or engineering:
• Detailed design and engineering of Orangegate Park is currently underway. Construction is anticipated in 2025. Soft-surface trail construction, environmental restoration, and forestry work are taking place in the park now. The park will open in 2026.
• In 2022, Parks completed a full inspection and analysis of the water system at Frontier Park and is working to develop a water system improvement plan for the park. Improvements to the water system will be prioritized according to safety and public benefit in future capital planning.
• The outdoor campus at Sprinker Recreation Center was completely renovated and re-opened to the public in Summer 2024. New features include a regional spray park and playground, a Futsal Court, adult outdoor fitness center, two synthetic turf ballfields, a connection to the Parkland Community Trail, picnic shelters, a renovated park entry, ADA upgrades throughout, and parking and safety improvements. Design of four additional turf fields to complete outdoor renovations will begin in 2025.
• Construction of the Chambers Creek Canyon Trail is underway and will be complete in 2024. This phase of the trail is planned to extend along the north side of the canyon to Philips Road near the Chambers Creek confluence with Leach Creek.
• Meridian Habitat Park outdoor improvements were completed in 2024, including parking and lighting, a picnic shelter, nature trails, and an outdoor classroom.
• Construction of the first phase of Pipeline Trail by Pierce County is underway and expected to be complete by the end of 2024. The trail connects the existing Pipeline Trail, built by City of
Tacoma, from 72nd Street East and Waller Road approximately 1.6 miles to Orangegate Park. The trail will generally follow the existing Tacoma Public Utilities gravel service road. Construction includes a trailhead with restrooms, car and horse trailer parking, and picnic areas at Orangegate Park. Design for future phases of Pipeline Trail that will connect to South Hill are underway.
• Expansion of the Foothills Trailhead at East Puyallup was completed in Spring 2024 along with ADA improvements at all trailheads. This project expanded parking from 26 to 81 stalls and provides EV charging stations, lighting, and landscape and drainage improvements.
• Parkland Community Trail design and permitting are nearing completion, and the project expects to break ground by early 2025. This in right-of-way trail will connect residents to parks and schools from Sprinker Recreation Center to PLU. Negotiations are underway with PLU to extend the trail through campus and connect to Keithly Middle School and Washington High School.
Non-Capital Alternatives
The County anticipates updating the PROS Plan in 2026, including the proposed project lists, cost estimates, project prioritization, and funding plans.
The County could also propose a levy lid lift for the Conservation Futures levy rate to collect additional revenue. The Conservation Futures levy rate could be increased to provide additional funding for open space opportunities, although the County would still need to compete for these funds with other eligible jurisdictions and organizations countywide.
Capital Projects
Exhibit 106 summarizes proposed park projects from the PROS Plan over the next six years (20242029), as well as additional projects planned beyond the six-year period, and notes any currently unfunded amounts from 2024–2029. Projects are located throughout the county at an estimated cost of $275,141,090 over the next six years and $360,051,090 over the next twenty years.
Unfunded capital projects in the 2024-2029 period total approximately $122.6 million. Capital projects that are unfunded are primarily associated with building improvements including but not limited to Sprinker Building and Sports Complex, Meridian Habitat Park, and a future sports complex in partnership with the Bethel School District.
Priorities may change over time and new funding sources may become available or existing funding sources may be eliminated or shifted. Opportunities to acquire land or the option to develop a project may also arise and change the proposed project list. The County anticipates updating the PROS Plan in 2026 at which time proposed project lists, priorities, and funding plans may shift. Exhibit 106 does not include improvements that will be financed and constructed by private parties (e.g., improvements that are conditions of a project approval). The County will continue to regularly review and revise its park capital projects to meet the needs of future growth and will update this section periodically as appropriate.
Exhibit 106. Pierce County Parks—Planned Capital Projects, 2024-2044
Note: Priorities may change over time and new funding sources may become available or existing funding sources may be eliminated or shifted. Unfunded amounts from 2024-2029 are based on revenue projections used in this CFP, including additional projections not in the adopted 2024-2029 CFP as outlined in the Capital Facilities Revenue Analysis section under Parks and Recreation. Unfunded amounts are rounded to the nearest $10,000.
Sources: Pierce County Parks and Recreation Department, 2023; BERK, 2024.
Sewer Division of Planning and Public Works
Overview
The Pierce County Sewer Utility was established in 1969 and is now part of the Planning and Public Works Department. Utility Local Improvement Districts (ULIDs) were formed, and in 1971 the first sewer system came online to protect public health and groundwater resources.
Wastewater in Pierce County consists of domestic and commercial wastes generated by the residents and businesses of Pierce County. They are managed using a combination of municipal sewer systems and onsite wastewater disposal (septic-drainfield) systems. Pierce County’s wastewater (sewer) system serves 314,000 customers over a 117-square mile area. Four drainage basins comprise the area that encompasses wastewater management, with the Chambers-Clover Drainage Basin containing the largest area and greatest population served by County systems. See Exhibit 107
Exhibit 107. Pierce County Sewer Service Area, 2023
Sources: Pierce County GIS, 2023; Robinson & Noble, 2023.
The Sewer Division of the Planning and Public Works Department manages collection and treatment of wastewater, disposition of biosolids and the construction and maintenance of wastewater collection and treatment infrastructure. This is accomplished by four major operational sections including Engineering, Maintenance and Operations, Planning and Programming, and Business Operations.
Inventory
The sewer system is comprised of 715 miles of public sewer pipelines, 103 regional pump stations, 4 odor control facilities (OCF), 1 community drainfield, and 2 wastewater treatment plants (WWTP). See Exhibit 108 and Exhibit 109. The largest of the treatment plants the Chambers Creek Regional Wastewater Treatment Plant discharges to Puget Sound under the authority of a National Pollutant Discharge Elimination System (NPDES) permit. The second treatment plant Cascadia WWTP discharges to groundwater under the authority of State of Washington State Discharge permit issued by the Washington Department of Ecology.
Exhibit 108. Pierce County Sewer Facilities, 2023
Sources: Pierce County GIS, 2023; Robinson & Noble, 2023.
Exhibit 109. WWTP and Odor Control Facilities
Chambers Creek Regional WWTP
Cascadia WWTP
OCF245
OCF246
OCF244
OCF243
10311 Chambers Creek Road 45.25 MGD WWTP
Cascadia Blvd. E, Bonney Lake 1 00 MGD WWTP
Steilacoom Blvd SW N/A Odor Control
Pacific Highway SW N/A Odor Control
Farwest Drive SW N/A Odor Control
Farwest Drive N/A Odor Control
Note: The Sewer utility also owns 2.54 MGD of capacity at the Tacoma Central Wastewater Treatment Plant located at the Port of Tacoma. Flows from the cities of Milton and Edgewood and the unincorporated Browns Point, Dash Point, and Fife Heights areas are or will be sent to this facility. Total available capacity from all locations, including reserves, is 48.79 MGD
*Capacity in millions of gallons per day (MGD).
Sources: Pierce County GIS, 2023; Robinson & Noble, 2023; 2024-2044 Sewer Improvement Program (SIP), 2023 (Ordinance No. 2023-54).
Wastewater management within the Chambers Clover Creek Basin includes the bulk of the Pierce County wastewater infrastructure. The Chambers Clover Creek Basin also includes approximately 15,000 septic systems which are regulated by the Tacoma-Pierce County Health Department. Management within the Puyallup River Basins is integrated with municipal wastewater systems operated by incorporated cities and towns. Rural areas of the basin are predominantly served by onsite septic systems.
Pierce County has no wastewater facilities within the Nisqually River Basin. Rural areas of this basin utilize onsite wastewater systems.
Level of Service Standards
The Pierce County Comprehensive Plan adopts the LOS for sewer detailed in the December 2010 Unified Sewer Plan (USP), as amended (Exhibit 1). The current LOS in the USP is 220 gallons per day per residential equivalent and is based on flow-projections derived from land use. This Average-Dry-Weather Flow (ADWF) represents the base-flow equated to the residential equivalent of 2.6-person household. Commercial or industrial flows are estimated at 1,000 gallons per day for each acre of commercially or industrially zoned land. An additional 1,000 gallons per acre of land per day is included to account for wet weather infiltration.
The County is currently updating the USP concurrent to the Comprehensive Plan update. The population-based flow-estimates used for determining LOS in the USP remain valid regardless of where the Comprehensive Plan shifts the geographic distribution of growth. Two additional projects were identified as a result of proposed growth over the next 20 years in the Comprehensive Plan (see capital projects below). Additional modeling as part of the USP update may identify additional or more specific collection and treatment system capabilities and capacity.
Project Summary
Recent and Ongoing Major Accomplishments
• Parkland / Brookdale Interceptor Phase 3. This is the third in a series of projects needed to increase the capacity of one of the largest pipelines transporting sewage to the Chambers Creek WWTP. This Phase is comprised of constructing a 72-inch interceptor to convey wastewater from the intersection of 131st Street East and A Street South to an existing sewer interceptor at 129th Street South and C Street South. A majority of this phase was completed in 2022 and the remainder is anticipated to be complete by October 2023.
• 144th Street East Extension. This project entailed the installation of 12,360 feet of gravity sewer, 1,150 feet of pressurized sewer pipe and related infrastructure to connect a previously unsewered area. The project was completed in 2022 with the exception of testing and roadway installation.
• B Street Interceptor Phase 3 This is the third of multiple projects designed to install new gravity sewer lines near Mountain Highway (State Route 7). The project started in 2022 and will be completed in 2023. It consists of the construction of 5,500 feet of sewer interceptor line.
Non-Capital Alternatives
The County routinely evaluates non-capital projects that can improve system operations and enhance the ability to respond to increased volume. These include education and awareness programs on the types of wastes acceptable to release into the sewers, industrial pretreatment permit programs that control the nature and volumes of industrial wastes that can be discharged, and inspection programs that evaluate blockages, damage, and infiltration of water into sewage conveyance systems.
Capital Projects
Sewer capital projects are detailed in the County’s 2024-2044 Sewer Improvement Program (SIP). Exhibit 110 details proposed sewer projects from the SIP over the next six years (2024-2029), as well as additional projects planned beyond the six-year period. Two additional projects upgraded pump stations at North Surprise Lake and Lake City were identified as a result of proposed growth over the next 20 years in the Comprehensive Plan. Projects are located throughout the county at an estimated cost of $212,930,000 over the next six years and approximately $934,350,000 over the next twenty years. Additional modeling as part of the USP update may identify different or more specific capital needs, particularly over the 2030-2044 timeframe. Exhibit 110 does not include improvements that will be financed and constructed by private parties (e.g., improvements that are conditions of a project approval).
The CFP adopts by reference the SIP, as amended. The County will update this section periodically as appropriate.
Exhibit 110. Pierce County Sewer—Planned Capital Projects, 2024-2044
Note: Priorities may change over time and new funding sources may become available or existing funding sources may be eliminated or shifted. Additional modeling as part of the USP update may identify different or more specific capital needs, particularly over the 2030-2044 timeframe projects included in this table are based on the County’s current understanding of needs and subject to change. *Growth related projects identified by the Sewer modeling team.
Sources: Pierce County Planning and Public Works Sewer Utility, 2023; 2024-2044 SIP, 2023 (Ordinance No. 2023-54); BERK, 2024
Surface Water Management and River Improvement
Overview
The Pierce County Surface Water Management Division (SWM) of Pierce County Planning and Public Works manages water quality and flooding issues to reduce flood losses, protect and improve water quality and related natural resources. SWM is organized into three workgroups consisting of Engineering Services, Water Quality and Floodplain and Watershed Services. The engineering services workgroup is responsible for the infrastructure that reduces destructive flooding, maintains, and improves water quality, and preserves or restores fish and wildlife habitat.
Managed surface water resources in Pierce County include rivers, named and unnamed creeks, lakes, and marine waterbodies (Exhibit 113). There are 700 miles of shorelines in unincorporated Pierce County including 180 miles of marine shoreline, 145 miles of lake shoreline, and 375 miles of shoreline associated with rivers and streams. Surface water resources within Pierce County are managed in four watersheds with varying estimated populations:11
• Nisqually River population of 65,000
• Chambers-Clover population of 410,000
• Puyallup River population of 420,000
• Key Peninsula, Gig Harbor, and Islands population of 90,000
Pierce County further manages surface water through specific basin management plans for ten surface water basins.
11
Pierce County Watershed Health Scorecard, 2021.
113. Surface Water Resources and Regulated Floodplains
Sources: Pierce County GIS, 2023; Robinson & Noble, 2023.
Inventory
Stormwater facilities are located throughout Pierce County, including 500+ publicly owned ponds and 2 pump stations in addition to open and closed stormwater collection and conveyances. See Exhibit 114.
Exhibit
Exhibit 114. Unincorporated Pierce County Drainage and Stormwater System Features, 2023
Sources: Pierce County GIS, 2023; Robinson & Noble, 2023.
Level of Service Standards
The County separates surface water LOS into LOS related to flooding and LOS related to water quality and natural resource protection. The Pierce County Comprehensive Plan adopts the LOS for stormwater facilities and flood management detailed in the Pierce County Stormwater and Site Development Manual (including compliance with the NPDES Permit) and Comprehensive Flood Hazard Management Plan, as amended (Exhibit 1).
Flooding related LOS are based on protection against certain levels of flooding (100-year, 200-year etc.) and location. Water quality standards are imposed via state and federal regulations. Flood related LOS are risk-based on the criteria of life-safety and economic damage potential. As noted in the 2016 Draft Pierce County System Wide Improvement Framework, certain levees are designed and maintained to protect from a 200-year flood, while others (including new levees) are designed to protect at the 100-year flood level. Other levees are maintained to offer lesser levels of protection.
Water quality and natural resource protection LOS are fairly heterogenous and driven by Washington State Department of Ecology (Ecology) and US Environmental Protection Agency (EPA) regulations. Water quality regulations for commercial and industrial stormwater discharges are the basis of LOS related to water quality. Revisions to the future land use map to support proposed growth in the Comprehensive Plan update will require further evaluation to ensure compliance with these regulations and thus maintain an appropriate LOS Project Summary
Recent and Ongoing Major Accomplishments
• Rody Creek Channel Stabilization near 80th Street E The project reduced the transport of soil and earth materials along the channel to stabilize the base of the ravine slopes along approximately 2,580 feet of Rody Creek channel between 80th and 72nd Streets East. This project helped stabilize the channel bed from further downcutting and stabilize areas at the base of the ravine slopes. This project also helped address Pierce County’s goal to improve water quality in the Clarks Creek stream system, as required by the Clarks Creek Total Maximum Daily Load (TMDL) set by the Department of Ecology.
• Horsehaven Creek Culvert aet 150th Avenue This project raised 188th Street East to accommodate the new box culvert (bridge) that has a 19.5-foot span and 8-foot in height. This project improved fish passage and addressed flooding issues on Horsehaven Creek, where it crosses under 188th Street East near Orting. The new culvert meets current fish passage requirements and reduces the likelihood of the area experiencing water over the roadway.
• Clear Creek Habitat Restoration The Clear Creek Habitat Restoration project improved access to salmon habitat and expanded the flood storage capacity by removing sections of an existing access road that separated Clear Creek from an adjacent wetland, which is owned by the Port of Tacoma. This 16-acre site within the Puyallup River watershed is home to many wildlife and fish species, including chinook, coho, and chum salmon, as well as bull trout, cutthroat trout, coyote, and deer.
Non-Capital Alternatives
Non-capital alternatives the County could pursue to achieve and maintain LOS standards for surface water management and river improvement facilities include privatization (where private developers can build stormwater facilities with excess capacity that can be sold to other developers to reduce on-site stormwater facilities for new developments), floodplain acquisition, elevation of structures, stricter floodplain and stormwater management regulations and additional monitoring/enforcement, monitoring to ensure proper source control techniques, promoting flood-compatible land uses in flood prone areas, County-provided inspection and technical assistance for private stormwater facilities, requiring older developments to retrofit inadequate facilities, flood warning programs, additional public education and outreach to better
inform and prepare citizens for flooding, or modifying (through Congressional Action), the operations of Mud Mountain Dam by the U.S. Army Corps of Engineers.
Capital Projects
Surface water management and river improvements capital projects are detailed in the County’s 2024-2029 Surface Water Improvement Program (SWIP) and 2023 Comprehensive Flood Hazard Management Plan.12 Exhibit 115 details proposed surface water and river improvement projects over the next six years (2024-2029) as well as additional projects planned beyond the six-year period. Projects are located throughout the county at an estimated cost of $180,319,000 over the next six years and $292,007,190 over the next twenty years. Exhibit 115 does not include improvements that will be financed and constructed by private parties (e.g., improvements that are conditions of a project approval).
The CFP adopts by reference the SWIP and Comprehensive Flood Hazard Management Plan, as amended. The County will update this section periodically as appropriate
12 The nine Pierce County basin plans, water quality plans, and the Pierce County Comprehensive Flood Hazard Management Plan are the foundation of capital improvement projects and programs to protect people, infrastructure, and the environment. The projects in these plans were ranked for flood risk reduction, water quality, habitat, and other factors. Funding availability and mandatory obligations are added layers of review when selecting capital project for implementation.
Exhibit 115. Surface Water Management and River Improvement—Planned Capital Projects, 2024-2044
Note: Priorities may change over time and new funding sources may become available or existing funding sources may be eliminated or shifted.
Sources: Adopted 2024-2029 Surface Water Improvement Program (SWIP), 2023; Draft 2023 Comprehensive Flood Hazard Management Plan, March 2023; BERK, 2024.
Non-County Provided Facilities and Services
Capital facilities and services in Pierce County owned or primarily operated by other entities include fire/emergency medical services (EMS), transit, libraries, schools, and water.13 Several of these (fire/EMS, schools, and water) are operated by a network of various providers (see below). LOS revisions to the County’s standards proposed as part of the Draft Comprehensive Plan Update are detailed in Exhibit 1 under Sources and Assumptions
13 Drinking water is supplied by a large number of public water systems, as well as single-domestic systems which serve a single connection. More than 99% of drinking water supplied by public water systems in unincorporated Pierce County comes from non-County owned public water purveyors. The County owns five water systems that serve two County parks, the Tacoma Narrows Airport, the Anderson Island Ferry Landing, and South Pierce Fire and Rescue (PCFD 17). In total, the five County-owned water systems serve a total resident population of only 9 people and a non-resident population of 1,650 people. Most of the non-residential population served is due to the two parks and the airport. See the Water section below.
Fire/Emergency Medical Services
Fire suppression and emergency medical services are provided in Pierce County through a collection of 26 municipal fire departments, regional fire authorities, and fire districts. These service providers operate 93 fire stations throughout the county with 54 in Pierce County’s unincorporated planning area. Many of the fire districts and fire departments have established mutual aid agreements with adjacent districts that allow them to provide and receive additional assistance when necessary, such as in the event of a particularly large and/or dangerous fire. The various departments and districts have also developed training programs and conduct disaster drills to prepare for the possibility of a countywide interagency response. Exhibit 116 shows the fire district boundaries and location of fire stations in Pierce County.
Exhibit 116. Fire District Boundaries and Location of Fire Stations, 2023
Sources: Pierce County GIS, 2023; BERK, 2023
Staffed and volunteer stations for the regional fire authority and fire district that serve unincorporated Pierce County are summarized in Exhibit 117 and detailed in the following sections.
Exhibit 117. Staffed and Non-Staffed Fire Stations in Fire Districts Serving Unincorporated
* Fire and EMS services for PCFD 10, including the City of Fife as well as urban unincorporated Pierce County to the north, are provided via contract with the Tacoma Fire Department (TFD). PCFD 10 is served by TFD Station 12 (which is owned by PCFD 10 but operated by TFD).
Sources: CPFR Fire Stations, 2023; EPFR Fire Stations, 2023; SPFR Station Information, 2023; WPFR Station Locations, 2023; Gig Harbor Fire & Medic One Station Locations, 2023; City of Tacoma Capital Facilities Program, 2021-2026; PCFD 13 Stations, 2023; About Riverside Fire & Rescue, 2023; Key Peninsula Fire District Stations, 2023; Orting Valley Fire and Rescue Fire Stations, 2023; Graham Fire and Rescue Stations, 2023; Anderson Island Fire and Rescue, 2023; Pierce County Assessor, 2023; BERK, 2023.
Calls for fire and EMS across Pierce County are dispatched by one regional communication center: South Sound 911. South Sound 911 occupies a new unified, regional 911 communications center in Tacoma which serves communities and first responders countywide (see General Administration Buildings above).
Level of Service Standards
Key terms used to describe LOS for fire and EMS across the districts include:
• Turnout time measures how quickly crews can respond to the initial notification of an incident and begin traveling to the scene. Several factors can affect turnout performance, such as station design, cross-staffing apparatus, and other physical elements.
• Travel time is the elapsed time from when a unit begins to respond until it’s arrival on scene.
• Response time is the combined total of turnout and travel time.
The minimum LOS for fire service, as adopted in the Pierce County Comprehensive Plan, is for the provision of sufficient fire flow in order to provide protection commensurate with planned intensities of future development adopted in the Comprehensive Plan pursuant to the County's adopted version of the International Fire Code. Fire flow standards shall be established by county development regulations (see Exhibit 1).”
Every fire protection district and regional fire protection service authority in the state is also required to establish time objectives for the following measurements (RCW 52.33.030):
• Turnout time.
• Response time for the arrival of the first arriving engine company at a fire suppression incident and response time for the deployment of a full first alarm assignment at a fire suppression incident.
• Response time for the arrival of a unit with first responder or higher level capability at an emergency medical incident.
• Response time for the arrival of an advanced life support unit at an emergency medical incident, where this service is provided by the fire department.
To meet these standards and objectives, the total response times must be achieved on 90% of the responses within a jurisdiction. Each district may establish its own level of standard based on its location and resources. Pierce County does not require fire protection districts to meet a particular response time standard, but state law requires response time monitoring. RCW 52.33 requires fire districts staffed primarily by career firefighters to monitor their response times to emergency calls and disclose this information in an annually published report. Compliance with County fire code and minimum fire flow requirements are administered by the Pierce County Fire Marshal and as part of County development permit review. Municipalities are also responsible for enforcing fire flow requirements and fire code regulations in their jurisdiction. The response time objectives set by each district are summarized in Exhibit 118 and are adopted by reference, as amended.
Regional Fire Authority/District Response Time Objective
Regional Fire Authorities
Central Pierce Fire & Rescue
Fire-Suppression Incident:
– First arriving engine company: 6:35
– Full first alarm assignment on scene: 16:00
Emergency Medical Incident
– BLS: first arriving unit with first responder or higher medical training: 7:15
– ALS: first arriving unit with paramedic: 6:00
Special Rescue Incident
– First arriving unit with special operations technician: 10:30
East Pierce Fire & Rescue
– EPFR does not currently have any adopted performance benchmarks but tracks response time in relation to standards from the National Fire Protection Association (NFPA) 1710 and the Commission on Fire Accreditation
Exhibit 118. Response Time Objectives for Fire Districts Serving Unincorporated Pierce County, 2023
Regional Fire Authority/District Response Time Objective
International (CFAI). The January 2023 Standards of Cover proposed a 2:00 benchmark turnout time for all call types.
South Pierce Fire & Rescue Unknown
West Pierce Fire & Rescue Unknown
Pierce County Fire Districts (PCFD)
#5 Gig Harbor Fire and Medic One
Turnout time: 2:20 for fire and 1:30 for EMS
First arrival
– Municipal (municipal boundaries of the City of Gig Harbor and areas lying within 1.5 miles of a staffed station): 9:00 for fire and 8:00 for EMS
– Rural (all other areas outside of the Municipal Response Zone and connected to the Kitsap Peninsula): 12:00 for fire and 11:00 for EMS
– Remote (Fox Island, Raft Island, Tanglewood Island): 16:00 for fire and EMS
#10 Fife*
#13 Browns Point
#14 Riverside
Call processing times: 1:04 for priority fire incidents and 1:30 seconds for priority EMS and specialty incidents (e.g., Technical Rescue, Hazardous Materials)
Turnout times: 1:00 for priority EMS incidents and 1:20 for priority fire and specialty incidents
Travel time first arriving unit: 4:00 for a priority fire or EMS incident and 20:00 for marine response
Total response time: 6:24 for priority fire incidents, 6:30 for priority EMS, and 6:50 for specialty incidents
Arrival of an effective response force with a minimum of 15 firefighters at the scene of a structure fire: 10:30
Arrival of an ALS unit with two firefighter/paramedics: 10:30
Total response time (consistent with Rural II benchmarks):
– First unit: 14 minutes, 20 seconds
– Second unit: 19 minutes, 32 seconds
– Balance of first alarm: 19 minutes, 32 seconds
Primarily volunteer department
#16 Key Peninsula Unknown
#18 Orting Unknown
#21 Graham
#23 Ashford
#25 Crystal Mountain
#26 Greenwater
#27 Anderson
Graham Fire and Rescue compares its current LOS against the National Fire Protection Association (NFPA) 1710 and the Commission on Fire Accreditation International (CFAI). The District’s 2021 Standard of Cover recommends establishing and adopting separate performance benchmark objectives for the urban and rural areas.
Primarily volunteer department
Primarily volunteer department
Primarily volunteer department
Primarily volunteer department
* Fire and EMS services for PCFD 10, including the City of Fife as well as urban unincorporated Pierce County to the north, are provided via contract with the Tacoma Fire Department (TFD). PCFD 10 is served by TFD Station 12 (which is owned by PCFD 10 but operated by TFD).
Sources: CPFR Capital Facility Plan, 2020; EPFR Standards of Cover, 2023; SPFR Station Information, 2023; WPFR Station Locations, 2023; Gig Harbor Fire & Medic One 2022 Annual Performance Report, 2023; TFD Annual Report, 2022; PCFD 13 Capital Facilities Plan, 2020; Graham Fire and Rescue Standards of Cover Study, 2021; BERK, 2023.
Regional Fire Authority: Central Pierce Fire and Rescue (Pierce County Fire District 6)
Overview and Inventory
Central Pierce Fire and Rescue (CPFR) was formed in 1996 following a merger of Fire District 6 (Parkland/Midland), Fire District 7 (Spanaway), and Fire District 9 (Summit/South Hill). CPFR currently provides 24-hour emergency medical and fire suppression protection to approximately 230,000 citizens and covers an 84 square mile area encompassing the communities of Parkland, Midland, Spanaway, South Hill, Puyallup, Summit, and Frederickson as well as portions of urban and rural unincorporated Pierce County. CPFR is also known as Pierce County Fire District 6.

In addition to fire suppression and emergency medical services, CPFR provides hazardous materials response and technical rescue services. Technical rescue involves any situation where life is in danger (drowning, climbing accident, building collapse, etc.). CPFR also provides training and information to the public on fire and injury prevention, CPR, first aid, fire extinguisher usage and other safety related topics. CPFR provides free smoke alarms (with installation) and low-cost bicycle and multi-sport helmets to the community.
CPFR operates 12 fire stations, 11 of which are staffed 24 hours a day by career personnel Fire Station 70 provides 24-hour fire and EMS to the Washington State Fairgrounds during events. Eight of the stations house paramedic units to provide EMS medical services (both basic and advanced life support) and transport patients to emergency care centers. Equipment consists of 13 engines/ladder trucks, 8 paramedic units, 1 utility vehicle, 1 rehab vehicle, 2 brush trucks, 1 hazardous materials units, 1 special operations rescue unit, 2 marine rescue units, 1 water tender, and 1 command vehicle. See Exhibit 119.
Staffed Stations
Fire Station 60
(Headquarters & Administrative Offices)
Built in 1979 with a major remodel in 1987, new remodel began in 2015
Fire Station 61
Built in 1969, remodeled to present status in 1985
100 114th St S Parkland, WA 98444
Houses one engine, one paramedic unit, one utility vehicle, one rehab vehicle, and one brush truck. A training tower and classroom are also on site.
Currently houses administrative offices for the Battalion Chiefs. The station operates one engine, one ladder truck, one paramedic unit, and one command (Battalion Chief) vehicle.
Exhibit 119. Central Pierce Fire and Rescue Current Facilities Inventory, 2023
Station 72
Fire Station 63
Newly constructed in 2017 (replaced the old Midland fire station)
Fire Station 64
Built in 1986
Fire Station 65
Built in 2006
Fire Station 67
Built in 2008
Fire Station 68
Built in 2006
Fire Station 69
Built in 1984
Fire Station 71
Built 1992
1704 97th St E Midland, WA 98445
3421 224 St E Elk Plain, WA 98387
301 146th St S Tacoma, WA 98444
8005 Canyon Rd E Puyallup, WA 98371
5401 136th St E Puyallup, WA 98373
17210 110 Ave E Puyallup, WA 98374
902 7th St NW Puyallup, WA 98371
ft2 (10,334 ft2 with training center)
Houses one fire engine and one paramedic unit.
Houses one engine.
Houses one engine and one paramedic unit. A water rescue unit is available as needed.
Houses one engine, one paramedic unit, and one water tender. The Training Division office and the training tower are adjacent to this station.
Houses one engine and one part-time paramedic unit.
(+2,880 ft2 maintenance shop)
13,329 ft2
Fire Station 72
Built 2020, replaced stations 72 and 66
Fire Station 73
Built in 1968 with a major remodel in 1993
Special Event Station
Fire Station 70 (Puyallup Fair Fire Station)
Built 1985
3809 5th St SE Puyallup, WA 98374 16,449 ft2
311 W Pioneer Puyallup, WA 98371
Houses one engine, the hazardous materials unit, and a brush truck. The vehicle maintenance shop is located next to the station.
Houses one engine, one paramedic unit, a special operations rescue unit, and a marine rescue unit Prevention & Education and Community Government Relations are also run form this station.
Equipment unknown.
5,000 ft2
110 9th Ave SW Puyallup, WA 98371
Unknown
Building is primarily operated by the Puyallup Police Department, but CPFR personnel occupy 5,000 ft2 of the building. One engine operates out of this station.
Has two engine bays. Provides fire and EMS to those who visit the various events hosted at the Washington State Fairgrounds.
Sources: CPFR Fire Stations, 2023; Pierce County Assessor, 2023; BERK, 2023.
As of December 2021, CPFR had 311 full-time personnel, including 250 uniformed personnel (suppression firefighters, EMTs, and paramedics), 7 shift battalion chiefs, 17 day shift uniformed personnel, and 37 non-uniformed personnel. Uniformed personnel include the Fire Chief, Deputy Chief of Operations, Deputy Chief of Administration, suppression firefighters, EMTs, and paramedics.
CPFR’s logistics division provides management services including planning, supervising, and evaluating facility needs, vehicle maintenance and replacement, communications infrastructure,
and centralized purchasing operation. This Assistant Chief, with the support of the Captain, also coordinates the installation and maintenance of all emergency communication equipment in vehicles as well as those used by front-line personnel. Another function of the logistics division is the purchasing and maintenance of equipment and vehicles owned and operated by CPFR. This includes emergency apparatus, automobiles, suppression, and communication equipment. Equipment and vehicles are purchased through a variety of methods including utilization of the Washington State Purchasing Cooperative contracts, inter-local governmental bids, as well as advertising and bidding for equipment as a sole purchaser.
The facilities division is responsible for the facilities owned by CPFR; specifically, nine Districtowned fire stations, three leased stations owned by the City of Puyallup, one technology office, two training towers, one training center, and one vehicle maintenance shop. Facilities has one Facilities Maintenance Technician and Landscape Technician to support building repair, maintenance, and landscape needs for all of these facilities.
Project Summary
Recent and Ongoing Major Accomplishments
• CPFR was one of five agencies to sign an interlocal agreement in 2022 to participate in the Pierce County Fire Training Consortium (along with East Pierce Fire and Rescue, West Pierce Fire and Rescue, Orting Valley Fire and Rescue, and Graham Fire and Rescue). The Pierce County Fire Training Consortium provides training service to over 800 firefighters in Pierce County to improve operational consistency across the districts and allow firefighters to operate safely and efficiently on a scene regardless of the location of the incident. The Consortium also includes a recruit academy.
• In March of 2023, CPFR and Orting Valley Fire and Rescue Fire Chiefs, the Firefighters Union, and Fire Commission Board Chairs met to look at other opportunities for further cooperative efforts. Beginning in April 2023, the two agencies will explore what opportunities exist to improve services to both agencies. All areas will be examined to determine how to best reduce duplication of administrative services and improve services to the citizens.
Capital Projects
CPFR conducts its own capital facilities planning process to identify projects needed to serve the district. CPFR’s most recent Capital Facility Plan from January 2020 is for the 2020–2025 time frame and includes 20-year projects through the year 2039. The 6-year plan is funded with general obligation bonds, grant funds, CPFR revenues, and (in part) impact and/or mitigation fees. CPFR anticipates placing a general obligation bond on the ballot in 2024 for an estimated $80.7 million that will project out ten years for major capital facilities cost (2024-2033). Exhibit 120 and Exhibit 121 show CPFR’s planned capital project costs and revenues from 2024-2039. The County will continue to coordinate with CPFR on future capital planning efforts.
Exhibit 120. Central Pierce Fire and Rescue Planned Capital Projects, 2024-2039
Sources: CPFR 2020-2025 CFP (Table 8 for years 2024-2025 and Appendix F for years 2026-2039), 2020; BERK, 2023.
Exhibit 121. Central Pierce Fire and Rescue—Planned Capital Revenues, 2024-2039
Sources: CPFR 2020-2025 CFP (Table 8 for years 2024-2025 and Appendix F for years 2026-2039), 2020; BERK, 2023.
Regional Fire Authority: East Pierce Fire and Rescue (Pierce County Fire District 22)
Overview and Inventory
East Pierce Fire and Rescue (EPFR) was created when the City of Bonney Lake Fire Department, Pierce County Fire District 22/Lake Tapps Fire and Pierce County Fire District 24 merged in 2000 with the goal of providing a seamless response to emergency situations. Today, East Pierce serves a population of approximately 100,500 residents living in and around Bonney Lake, Sumner, Lake Tapps, the Ridge Communities, South Prairie, Tehaleh, Edgewood and Milton (encompassing approximately 153 square miles) and includes portions of urban and rural unincorporated Pierce County. EPFR is also known as Pierce County Fire District 22.
EPFR protects residents from ten facilities six staffed and two volunteer stations (including one facility on Lake Tapps for the marine rescue unit) and two other stations that don’t provide emergency response (Station 115 occupied by the Training Division and Station 121 for logistics and storage). See Exhibit 122.
Exhibit 122. East Pierce Fire and Rescue Current Facilities Inventory, 2023 Facility Location
Staffed Stations
Station 111, Bonney Lake (Headquarters) Built in 1994
Station 112, Prairie Ridge Built in 1979
Station 113, Sumner Built in 1991
Station 114, Lake Tapps Built in 1960, remodeled in 1970, 1980s, and 1991
Station 116, Foothills Built in 1979, addition in 1988
Station 118, Edgewood Built in 1948, replaced in 2023
12006 214th Ave E Bonney Lake, WA 98391
800 Harrison St Sumner, WA 98390
3206 W Tapps Dr E Lake Tapps, WA 98391
10515 234th Ave E Buckley, WA 98321
10105 24th St E Edgewood, WA 98371
Houses three fire engines, two medic units, and one battalion chief Station 111 is leased by EPFR and owned by the City of Bonney Lake. EPFR currently shares as a lessee with the Bonney Lake Police Department
one engine, one medic unit, and one tender.
one rescue unit, one medic unit, one ladder truck, and EPFR’s Technical Rescue trailer.
one engine, one medic units, one rescue unit, and two brush units, and one support
18421 Veterans Memorial Dr E Bonney Lake, WA 98391
18,000 ft2 occupied by EPFR
Station 111
Station 124, Milton Built 1960
Volunteer Stations
Station 119, South Prairie Built 1986, remodeled in 2000
Laurel St Milton, WA 98354
SR 162 South Prairie, WA 98385
Station 122, Water Rescue Facility Built in 1992 2905 Sumner-Tapps Hwy E Bonney Lake, WA 98391
Other Facilities
Station 115, East Lake Tapps Built in 1980
Station 121, Buckley Built in 1993
27723 Sumner‐Buckley Hwy Buckley, WA 98321
Houses one engine Building is used by EPFR and the City of Milton.
Houses one reserve engine. EPFR leases the station from South Prairie the station also serves as a community center for South Prairie and houses EPFR’s vehicle maintenance program.
Houses a marine service unit. Serves Lake Tapps in conjunction with water rescue trained crews housed at stations 114 and 111.
Currently used for logistics and storage only, with no emergency response.
Sources: EPFR Capital Facilities Plan, 2018; EPFR Strategic Plan, 2021; EPFR Community Risk Assessment: Standards of Cover, January 2023; EPFR Fire Stations, 2023; Pierce County Assessor, 2023; BERK, 2023.
As of December 2021, EPFR had 91 career firefighter-emergency medical technicians (EMTs), 59 career firefighter-paramedics, and 7 volunteer firefighters. All full-time EPFR firefighters are crosstrained as either EMTs or paramedics and can respond to both medical emergencies and fires. The logistics division deals with the procurement, storage, distribution, maintenance, and replacement of the District’s materials and equipment and maintains the fire stations inside and out.
Project Summary
Recent and Ongoing Major Accomplishments
• EPFR was one of five agencies to sign an interlocal agreement in 2022 to participate in the Pierce County Fire Training Consortium (along with CPFR, West Pierce Fire and Rescue, Orting Valley Fire and Rescue, and Graham Fire and Rescue). The Pierce County Fire Training Consortium provides training service to over 800 firefighters in Pierce County to improve operational consistency across the districts and allow firefighters to operate safely and efficiently on a scene regardless of the location of the incident. The Consortium also includes a recruit academy.
• Per EPFR’s January 2023 Standards of Cover, the following capital changes are underway as part of a 2018 bond approved by voters:
Purchase of a new Ladder Truck, six Fire Engines, and three Medic Units.
Replacement of Stations 112, 114, and 118.
Construction of a new headquarters Station 111 in Bonney Lake to replace the existing leased facility shared with Bonney Lake Police Department.
Addition of a new Station 117 which will provide much needed service and protection of the Tehaleh development. Station 117 (scheduled to be complete in early 2024) will be in the Tehaleh community in unincorporated Pierce County. Tehaleh is a preplanned community with an expected population of 35,000 citizens when completed. The station will be staffed 24 hours per day, seven days a week, with three career firefighters and will house one engine and one brush truck.
Capital Projects
EPFR conducts its own capital facilities planning process to identify projects needed to serve the district. EPFR’s most recent Capital Facility Plan from July 2018 includes an assessment of existing stations, programmatic requirements for new and remodeled facilities, conceptual drawings, and a comprehensive cost projection for all of the contemplated building elements. Capital projects were prioritized into two phases with Phase 1 projects identified by the District as having the highest priority. All Phase 1 projects are currently underway per the January 2023 Standards of Cover as part of the 2018 bond approved by voters. Phase 2 projects are estimated to cost approximately $31.1 million (with no escalation from $2018):14
• Renovating and upgrading Station 113 in Sumner, $6.7 M
• Renovating and upgrading Station 115 on the east side of Lake Tapps, $6.0 M
• Renovating and upgrading Station 116 in the Foothills, $8.6 M
• Constructing a new Fire Station 124 in Milton in replacement of the leased facilities from the City of Milton, $9.7 M
No target bid date is identified for any of the Phase 2 projects. The specific content of any part of a bond measure will be at the discretion of the District’s staff and commissioners.
Additional priorities identified in the CFP include continued consideration for additional space and/or improvements for the District’s Logistics Division, improvements and/or replacement of leased Station 119, continued pursuit of training opportunities (including the possibility of constructing a training campus, and improvements to the District’s facility and vehicle maintenance facilities and long-term storage needs.
The County will continue to coordinate with EPFR on future capital planning efforts.
14 No escalation was provided for the Phase 2 projects as it is intended that those projects will be revisited and updated when their schedules are more definitive.
Regional Fire Authority: South Pierce Fire and Rescue (Pierce County Fire District 17)
Overview and Inventory
South Pierce Fire and Rescue (SPFR serves the areas southeast of JBLM including the cities of Roy and Eatonville as well as primarily rural portions of unincorporated Pierce County
SPFR operates eight fire stations, three staffed and five volunteer, and an administrative headquarters. Equipment consists of 8 engines/ladder trucks, 3 brush trucks, 3 on duty medic units, and 3 tenders. See Exhibit 123. Exhibit 123. South Pierce Fire and Rescue Current Facilities Inventory, 2023
WA 98328
WA 98328
Sources: SPFR Station Information, 2023; Pierce County Assessor, 2023; BERK, 2023
Training Tower
As of May 2023, SPFR had 33 full-time personnel, including Chiefs and administrative staff, 12 career firefighter-EMTs, 15 career firefighter-paramedics, and 6 volunteer firefighters. Staffed stations 170, 171, and 84 are staffed by a minimum of six career firefighters per shift.15 SPFR is governed by a board of five commissioners elected by the public to serve a 6-year term. The Board of Fire Commissioners is responsible for the District’s overall strategic planning and long term vision and, working closely with the administrative staff, they guide the District via adoption of policies and procedures.
Project Summary
SPFR conducts its own capital facilities planning process to identify projects needed to serve the district and recently released an updated Strategic Plan in April 2023. Key goals related to capital facilities include:
• Goal 1B: Research and identify land for future station locations.
• Goal 1D: Develop and implement a maintenance and replacement plan for response apparatus.
• Goal 1E: Improve facilities in a manner that provides for firefighter health and safety.
In keeping with the Strategic Plan, SFPR has identified lists of needed equipment, station, and facility improvements over the short- and long-term Voters also recently restored SPFR’s regular tax levy for fire and EMS to the previous voter-approved rate of $1.50 per $1,000 of assessed value (passed in August 2023). The County will continue to coordinate with SPFR on future capital planning efforts.
15 Personal communication with Chief Wernet, May 2023.
Regional Fire Authority: West Pierce Fire and Rescue (Pierce County Fire District 3)
Overview and Inventory
West Pierce Fire and Rescue (WPFR) was formed in 2011 with the merger of the Lakewood and University Place Fire Departments. WPFR provides numerous services to the community including fire response, Emergency Medical Services (EMS) and transport, technical rescue, hazardous materials response, special operations, fire prevention, inspections, code enforcement, and fire and life safety education—and protects several bodies of water. The District currently provides service to the cities of Lakewood and University Place as well as portions of urban unincorporated Pierce County and contracted emergency services to the Town of Steilacoom, serving a population of more than 100,000 over 31 square miles. WPFR is also known as Pierce County Fire District 3.

WPFR currently has six staffed fire stations that operate 24 hours a day, 7 days a week. Equipment consists of several engines/ladder trucks, five medic units, two squad units, and three fire boats. Each of the five medic units has at least one paramedic and one EMT. Fireboat Endeavor is moored at Narrows Marina for incidents occurring on Puget Sound and is a regional asset to surrounding jurisdictions and two other boats are in service for incidents occurring on any of the many lakes. Due to the different types of water responses, WPFR has specialized teams, including marine pilots, divers, and rescue swimmers. See Exhibit 124.
Exhibit 124. West Pierce Fire and Rescue Current Facilities Inventory, 2023
Facility Location Size Equipment
Training Ground Unknown Includes a training tower and other training facilities.
Sources: WPFR Strategic Plan, 2021; WPFR Station Locations, 2023; Pierce County Assessor, 2023; BERK, 2023.
All full-time WPFR firefighters are cross-trained as EMTs (and nearly one quarter are trained to the level of Paramedic) and can respond to both medical emergencies and fires. The District also has firefighters specially trained in technical rescue, hazardous materials response, water, and dive rescue. WPFR restructured its staffing in January 2021 to establish a fifth advanced life support (ALS) medic unit 24-hours a day. This represented a 25% increase to the District’s ALS services and resulted in a full-time medic unit in five of the six stations. WPFR is governed by a Board of five elected Fire Commissioners who serve 6-year terms. The Board appoints a Fire Chief to oversee day-to-day operations.
The workforce at WPFR is categorized into eight divisions: administrative services/finance, communications and planning, emergency management, EMS, information technology, legislative, logistics, operations/suppressions, prevention, and training. The logistics division manages WPFR’s fleet, facilities, and supply purchasing. The vehicle and facility maintenance divisions are currently housed in a small facility that was designed 20 years ago to support only the Lakewood Fire Department. Supplies are also located in multiple locations (including shipping containers stored outside of multiple fire stations) as WPFR lacks sufficient room in any one facility.
Project Summary
Recent and Ongoing Major Accomplishments
16
• A second battalion chief (Battalion 31) was reinstated in April 2022 to enhance overall scene and firefighter safety. WPFR has seen great success with overall span of control on large-scale incidents since Battalion 31 went in service.
• In 2021, WPFR obtained $394,000 in federal grant funding for specialized equipment and training for all their firefighters to fight large fires in wildland/urban interface (WUI) areas. WUI zones are locations where heavily wooded areas border residential neighborhoods. As of June 2022, all firefighters completed wildland firefighting training through a grant-funded program. The grant also funded additional “brush-style” rigs (passenger truck-sized vehicles outfitted to deliver water through hose lines). These are smaller vehicles that provide an off-road capable platform far more maneuverable than traditional fire engines.
• A new, partially grant-funded technical rescue apparatus (Rescue 20) was placed in service in September 2022 to respond county-wide to high-risk responses.
16 WPFR Annual Reports, 2021 and 2022; WPFR The Monitor Community Newsletter, July 2023.
• A second squad unit (Squad 31) was placed in service in October 2022 to enhance service delivery. Squad units are small, two-person vehicles that responds to a variety of minor emergency calls typically handled by a fire engine. Squad 31 operates out of Station 31.
• In 2022, WPFR implemented a Connected Community Access, Referral and Education (CARE) program which works to identify and assist those in need of services but not the 911 system. The goal of this program is to address commonly identified barriers to appropriate healthcare access, improve community health and reduce the utilization of emergency medical resources whenever possible. The program is staffed by a nurse trained to connect people in need with the appropriate community services.
• WPFR was one of five agencies to sign an interlocal agreement in 2022 to participate in the Pierce County Fire Training Consortium (along with CPFR, EPFR, Orting Valley Fire and Rescue, and Graham Fire and Rescue). The Pierce County Fire Training Consortium provides training service to over 800 firefighters in Pierce County to improve operational consistency across the districts and allow firefighters to operate safely and efficiently on a scene regardless of the location of the incident. The Consortium also includes a recruit academy.
• A second Battalion Chief was re-established in 2023 to manage the day-to-day field operations of all fire and medical personnel and serve as an Incident Commander, providing direction and safety of firefighters at a structure fire or major incident.
• In August 2023, voters replaced WPFR’s four-year Maintenance and Operations Levy with $16.9 million annually.17
Capital Projects
WPFR conducts its own capital facilities planning process to identify projects needed to serve the district. In 2001, the communities of Lakewood and University Place both funded bonds for new stations and equipment. Those bonds expired in 2021 and WPFR is now in the process of determining capital infrastructure needs for the next 20 years. Major areas of focus as identified by WPFR will include:18
• Station 32 in University Place was closed in 2014 and sold with the intent of placing a new station closer to the border between the cities of Lakewood and University Place. A new station at this location would improve distribution of resources and response times in historically isolated areas of the fire district. Planning for this new station as well as other station and facility improvements will represent a significant area of focus over the coming year.
• WPFR is focused on housing their logistics division services in a single location. This would include vehicle maintenance, personnel and equipment required for facility maintenance across the fire district, and supply distribution.
17 WPFR News Archive, May 2023.
18 WPFR Annual Reports, 2021 and 2022; WPFR The Monitor Community Newsletter, July 2023.
• WPFR is evaluating their training tower. The tower is over 50 years old and was designed for live fire training using combustible materials on fire inside the tower. This type of burning, even for training firefighters, is no longer allowed. Current standards require the use of natural gas fires, something the training tower was never designed for.
• Some facilities require seismic retrofitting, sprinkler systems, and remodeling to accommodate increases in staffing.
The County will continue to coordinate with WPFR on future capital planning efforts.
Pierce County Fire District 5: Gig Harbor Fire and Medic One
Overview and Inventory
Gig Harbor Fire and Medic One was created in 1945 as a volunteer fire department, with the first paid personnel being hired in 1973. The department offers a variety of services such as fire suppression, EMS, wildland firefighting, community risk reduction, and public education. Additionally, the department provides fire prevention, hazardous materials response, and technical rescue. Gig Harbor Fire and Medic One currently serves a population of a little over 51,000 (about 12,000 of its residents live within the City of Gig Harbor) over 54 square miles in suburban and rural areas including portions of unincorporated Pierce County. Gig Harbor Fire and Medic One is also known as Pierce County Fire District 5 (PCFD 5).


Gig Harbor Fire and Medic One operates nine fire stations, five staffed and four volunteer stations. Equipment consists of five engines, three staffed medic units, a BC, one technical rescue vehicle, and one hazardous materials vehicle. The Swede Hill training campus includes staffed Station 58, District headquarters at Station 50, and an auto extrication area. See Exhibit 125.
Exhibit 125. Gig Harbor Fire and Medic One Current Facilities Inventory, 2023
Firefighters Outside Station 51
Station 55, Rosedale Built in 1988
7710 Rosedale St NW Gig Harbor, WA 98335
Station 57, Crescent Valley Built in 1978, renovated in 2011 10521 Crescent Valley Dr NW Gig Harbor, WA 98332
Other Facilities
Station 50, Headquarters Built in 1996, remodeled in 2009
District Shop Built in 2002
10222 Bujacich Road NW Gig Harbor, WA 98332
2 None assigned. Station supports the wildlands team.
14201 54th Ave NW Gig Harbor, WA 98332
ft2
Serves the administrative needs of the District and houses the training, operations, logistics, and fire prevention functions. Part of the Swede Hill training campus.
Provides facility and vehicle maintenance.
Sources: Gig Harbor Fire & Medic One Capital Facilities Plan, 2021; Gig Harbor Fire & Medic One Station Locations, 2023; BERK, 2023.
As of December 2022, Gig Harbor Fire and Medic One had 139 career members, including 123 uniformed and 16 non-uniformed personnel. Gig Harbor Fire and Medic One is governed by a Board of five elected Fire Commissioners, each representing the entire District.
Station 51 is Gig Harbor Fire and Medic One’s busiest station and is typically staffed by six or seven firefighters/officers and one Battalion Chief. Stations 58 and 59 are each typically staffed by five or six firefighters and one officer, and stations 52 and 56 are each typically staffed by three firefighters. The District’s wildlands team is supported at volunteer Station 55. The Maintenance Shop provides space for repair shops, offices, and general storage, together with dedicated storage for automotive parts and facility materials and is staffed by three vehicle mechanics and two full-time and one part-time facility maintenance staff.
Project Summary
Recent and Ongoing Major Accomplishments
• Voters approved a facilities bond in August 2022 to fund several of the projects listed below under project summaries. The bond will last for 20 years and is projected to cost $9.90 per month for the owner of a $500,000 home. The District began collecting the tax revenue in January 2023
• Voters renewed Gig Harbor Fire and Medic One’s EMS levy in November 2022 and fire levy in August 2023. Neither of these are a new tax and must be renewed by voters every 6 years.
Capital Projects
Gig Harbor Fire and Medic One conducts its own capital facilities planning process to identify projects needed to serve the district. Projects funded as part of the August 2022 facilities bond include:
• Station 51 is scheduled to be replaced on its current property. A Logistics Support Building will be included on the new Station 51 property to serve as a centralized warehouse for distributing supplies throughout the district and specifically to each fire station. Construction on both Station 51 and the Logistics Support Building are planned to start in 2026 and are funded by the August 2022 bond.
• Proposed conceptual improvements to fire stations 52, 54, 55, 56, 58, and 59 would increase their overall size to 10,622 ft2. The living area improvements would accommodate seven firefighters with private sleeping quarters and an apparatus bay addition that could accommodate two additional vehicles. A planned addition adjacent to the apparatus bays would provide space for appropriate decontamination of their equipment and bunker gear, additional storage, and improved facilities for the care and maintenance of their equipment. Construction on stations 58 and 59 are planned to start in 2025 and are funded by the August 2022 bond. Construction is planned to start on Station 52 in 2027, on Station 56 in 2028, on Station 55 in 2029, and on Station 54 in 2030.
• The Swede Hill training campus currently includes staffed Station 58 and District headquarters at Station 50 Gig Harbor Fire and Medic One plans to expand within the existing property boundary to include a new 17,000 ft2 5-story training tower, 11,400 ft2 support building with training classrooms, offices, and vehicle storage, an expanded auto extrication area, and additional parking for members training at the campus. Improvements to Station 58 are described above and no improvements are planned for Station 50. The District currently has an approved conditional use permit (CUP) issued by Pierce County for this property that is set to expire in August 2024. Construction of the training tower, support building, and site improvements are planned to start in 2024 and are funded by the August 2022 bond.
• Proposed renovations to fire stations 53 and 57 include a modest addition adjacent to the apparatus bay for modern decontamination facilities and storage for bunker gear. Construction on stations 53 and 57 are planned to start in 2028 and are funded by the August 2022 bond.
• Proposed improvements to the Shop Building include a modest building addition and site improvements. Construction is planned to start in 2029.
The County will continue to coordinate with Gig Harbor Fire and Medic One on future capital planning efforts.
Pierce County Fire District 10: Fife
Overview and Inventory
Fire and EMS services for Pierce County Fire District 10 (PCFD 10), including the City of Fife as well as urban unincorporated Pierce County to the north, are provided via contract with the Tacoma Fire Department (TFD) Overall, TFD’s contract area includes 72.1 square miles of land, 44 miles of shoreline, and 25 square miles of saltwater with a population of about 220,000 in Tacoma and another 18,000 in Fircrest, Fife, and PCFD 10. TFD is organized under an Operations Bureau and Administrative Bureau with corresponding divisions. Fire suppression, EMS, special operations, and the fire communications center are all part of the Operations Bureau.
TFD operates 24 facilities, nearly all of which are located in the City of Tacoma. PCFD 10 is served by Station 12 which houses a ladder truck, engine, hazardous materials unit, and EMS vehicle. Station 12 is owned by PCFD 10 but operated by TFD. See Exhibit 126.
Exhibit 126. Pierce County Fire District 10 Current Facilities Inventory, 2023
Facility Location Size Equipment
12
Sources: City of Tacoma Capital Facilities Program, 2021-2026; Pierce County Assessor, 2023; BERK, 2023.
As of 2023, TFD includes 511 budgeted positions, including 451 commissioned and 60 noncommissioned personnel. In 2022, the minimum staffing was 79 fire station personnel 24 hours a day, seven days a week. All TFD firefighters are trained to the Hazmat Operations level, with 27 firefighters certified to the Technician level.
The Fire Garage is the vehicle maintenance facility responsible for repairing and maintaining all TFD ladder trucks, fire engines, medic units, fireboats, and light-duty vehicles (including those housed at Station 12). Fire Garage personnel are also responsible for ordering, stocking, and delivering supplies to all TFD facilities via a messenger and supply delivery service and maintaining all small tools and equipment used by TFD.
Project Summary
Recent and Ongoing Major Accomplishments
• Hired two new firefighter recruit classes.
• Expanded the basic life support transport program.
• Completed the rollout and full implementation of the ImageTrend Electronic Patient Care Reporting software system.
Houses one ladder truck, one engine, one hazardous materials
Station 12
• Upgraded nine fire stations to new USDD dispatch equipment, which isolates lights and audio in the dorms to only alert the crew that needs to respond.
Non-Capital Alternatives
• TFD’s plan of action is to continue to identify and implement operational efficiencies to offset unit availability. One example is the concentrated effort to reduce non-emergency response. The TFD CARES program intervention reduces high-utilizer participants’ use of the 911 system by about 90% per year.
• TFD is considering an EMS levy “lid lift” sometime in 2023 to return the EMS levy to the amount previously approved by voters ($0.50/$1,000). Lid lifts help TFD keep up with higher call volumes and costs to provide service. The renewal would allow TFD to hire additional firefighters to add three EMS units and cover BLS ambulance transport costs.
• A TFD Facilities Master Plan is partially funded in the City of Tacoma’s 2021-2026 Capital Facilities Program and is identified as a Tier 1 priority (the highest tier). TFD’s facilities have an average age of 67-years and many are in need of seismic enhancements, are inefficient or obsolete, and lack capacity for future growth. This project would develop a comprehensive long-term facilities plan.
Capital Projects
TFD concluded the following predictable results in the 2022 Annual Report given current response time performance:
• TFD expects continuing increases in the demand for department services as the population grows.
• TFD expects that response times will remain constant or slow, not meeting all of the overall performance goals given current level of resources.
• The geographical and road network challenges that delay travel time responses in Northeast Tacoma will continue until additional resources are added in that area.
TFD conducts its own capital facilities planning process to identify projects needed to serve the district. Fire facilities improvements are identified as an unfunded future project in Tacoma’s 2021-2026 Capital Facilities Program. The County will continue to coordinate with the City on future capital planning efforts needed to serve PCFD 10.
Pierce County Fire District 13: Browns Point
Overview and Inventory
Pierce County Fire District 13 (PCFD 13), also known as Browns Point Fire, serves the communities of Browns Point and Dash Point in urban unincorporated Pierce County.
PCFD 13 covers around 5 square miles of land northeast of Tacoma and southwest of Federal Way and extends halfway into Commencement Bay. The District runs mutual aid calls with Tacoma Fire, South King Fire & Rescue, and Riverside Fire Department and uses the services of American Medical Response, Falck, and Airlift Northwest.
PCFD 13 operates two fire stations, the Browns Point Fire Station that is staffed 24/7 with fire command employees and volunteers and a secondary Dash Point station that is not staffed 24/7.
Equipment consists of two engines trucks, one aid car, two battalion units, one rescue truck with trailer, one rescue boat, one support car, and one brush truck. See Exhibit 127.
Exhibit 127. Pierce County Fire District 13 Current Facilities Inventory, 2023
Facility Location Size Equipment
a storage garage large enough to hold the marine response vessel.
Sources: PCFD 13 Capital Facilities Plan, 2020; PCFD 13 Stations, 2023; BERK, 2023
PCFD 13 has four paid staff including the Fire Chief, Fire Captain, and two firefighters/EMTs and 40 volunteer personnel who are a combination of Washington State EMTs and certified firefighters. Over 97% of the Primary Response Area is accessible by PCFD 13’s apparatus within 5 minutes from the nearest station if the station is staffed and crews are in the station at the time of the call.
PCFD 13 is governed by a Board of three elected Fire Commissioners who serve 6-year terms.
Project Summary
PCFD 13 conducts its own capital facilities planning process to identify projects needed to serve the district. Per PCFD 13’s 2020 CFP, several capital facility investments are needed to serve existing development regardless of whether new development occurs, including:
• 1 new fire engine
Houses one engine, one BLS aid car, two battalion units, one rescue truck with trailer, one rescue boat, and one support car. Includes
2,808 ft
Houses one fire engine and one brush truck (wildland fire apparatus). Station 76 is not staffed 24/7
Station 77
• Replace several command vehicles
• Station 77: crew quarters modifications, increased office space, and additional storage equipment
• Station 76: upgrades (includes driveway replacement)
Significant residential, commercial, or industrial development within the PRA could move PCFD 13 into a deficiency mode of operation unless appropriate capital facility improvements are provided. The following capital facilities are identified in the District’s CFP to serve and support expected new growth and development:
• Additional aid / ambulance vehicle
• 1 new fire engine (might require specialized dimensions & configuration)
• Station 77: rebuild apparatus bays, bring up to code standards for exhaust emissions and safety clearances
• Specialized training equipment to treat higher level of care residents
• Specialized medical equipment for higher level of care residents
• Develop specialized emergency access to Town Center development
The County will continue to coordinate with PCFD 13 on future capital planning efforts.
Pierce County Fire District 14: Riverside Fire District
Overview and Inventory
Riverside Fire District began as an all-volunteer force of community members in 1952. Today, the District serves urban and rural unincorporated Pierce County spanning from the City of Puyallup to the City of Tacoma along the Puyallup River to the north, and along Pioneer Way to the south. This includes emergency services to the Puyallup Tribal Community at Chief Leschi schools, fish hatcheries, local businesses, and residential properties. Riverside Fire District provides public education and prevention, fire suppression, EMS, and technical rescue including water rescue, rope rescue, and hazardous materials. The District has operating agreements with the City of Tacoma, EPFR, and PCFD 13, and Riverside firefighters work side by side with local law enforcement agencies such as Washington State Patrol, Pierce County Sheriff’s Office, and Puyallup Tribal Police. Riverside Fire District is also known as Pierce County Fire District 14 (PCFD 14).

Riverside Fire District operates one fire station which is staffed every day with a minimum of two and maximum of six firefighters on duty at all times. See Exhibit 128.
Exhibit 128. Riverside Fire District—Current Facilities Inventory, 2023
Sources: About Riverside Fire & Rescue, 2023; Pierce County Assessor, 2023; BERK, 2023
The District remains primarily staffed by volunteer firefighters who work alongside career fire chiefs. All of the District’s firefighters are trained to the standards set in place by the Washington State Fire Marshal’s office and must maintain the minimum of Washington State EMT. Riverside Fire District is governed by a Board of three elected Fire Commissioners who serve 6-year terms.
Project Summary
Riverside Fire District conducts its own capital facilities planning process to identify projects needed to serve the district. In 2018, after completing an electronic tracking system of all owned assets, the District started focusing on needed repairs, maintenance, and replacement of its capital facilities and equipment. Voters also recently restored PCFD 14’s regular tax levy for fire and EMS to the previous voter-approved rate of $1.50 per $1,000 of assessed value (passed in August 2023).19 The County will continue to coordinate with PCFD 14 on future capital planning efforts.
19 Ballot Measure, 2023.
engine, one water
BLS
unit, one reserve BLS aid unit, one marine unit, one brush unit, and two command staff units
Firefighter at Station 74
Pierce County Fire District 16: Key Peninsula
Overview and Inventory
Key Peninsula Fire Department was incorporated in 1952 and is a combination fire department providing fire protection, rescue, emergency medical services, and prevention services to 65 square miles of rural unincorporated Pierce County on the Key Peninsula (including more than 70 miles of shoreline that wrap around the peninsula). The geography of the Key Peninsula and the distribution of population density make it challenging to provide firefighting and medical aid coverage Key Peninsula is approximately 16 miles long and is just under 2 miles wide at its narrowest point. Key Peninsula Fire is also known as Pierce County Fire District 16 (PCFD 16).

Key Peninsula Fire operates six fire stations, three staffed and three volunteer (including the headquarters station in Key Center staffed with a mix of administrative personnel and volunteer firefighters). Equipment consists of six engines, three medic units, three tenders, one rescue unit, two marine units, one squad, one battalion, one chief, and two brush units. Stations 44, 47, and 49 are staffed 24 hours per day, 7 days per week by 9 full time career firefighters each shift. See Exhibit 129.
Sources: Key Peninsula Fire District Stations, 2023; Pierce County Assessor, 2023; BERK, 2023
Exhibit 129. Key Peninsula Fire Current Facilities Inventory, 2023
Station 46
Key Peninsula Fire employs 27 full time career firefighters who staff stations 44, 47, and 49 all of the District’s career firefighters are either EMTs or paramedics. Three Chief Officers also provide response assistance from volunteer Station 46 during the weekdays. Within this staff, there is a 24-hour per day Battalion Chief and Duty Chief. The District employ's five additional personnel including a Fire Prevention Specialist, an Executive Assistant, two Administrative Assistants, and a Facilities Maintenance Technician and typically has between 12-16 active volunteers who supplement the District’s paid staff on shift and with responses from home. Key Peninsula Fire also plans to staff Station 45 with live-in volunteers once the station has a response-ready fire engine or ambulance.
Project Summary
PCFD 16 conducts its own capital facilities planning process to identify projects needed to serve the district and is currently working towards devising an active Capital Facilities Plan that will update current buildings, build new facilities, and address the ageing fleet. Key Peninsula Fire’s current fleet is on average 20 years old with the oldest engine on Herron Island almost 40 years old. Since 2019, the District’s deployment model has a staffed engine responding on all fire and EMS related calls which has vastly increased the wear and tear on the District’s already ageing fleet. On average, increased demand put 2,000 miles per month on Engine 47 throughout 2022 and, by the end of 2023, Engine 47 was expected to have close to 100,000 miles on a 20-year old chassis. The County will continue to coordinate with PCFD 16 on future capital planning efforts.
Pierce County Fire District 18: Orting Valley Fire and Rescue
Overview and Inventory
Orting Valley Fire and Rescue is a combination fire district comprised of career and volunteer members. The District serves an area of approximately 31 square miles with a population of nearly 14,000 including the City of Orting and surrounding rural areas in unincorporated Pierce County. Orting Valley Fire and Rescue provides public education and prevention, fire suppression, EMS, and technical rescue. The District has interlocal agreements with numerous providers, including CPFR, Graham Fire and Rescue, and the Washington State Department of Natural Resources (for wildfire and forestland fire response) Orting Valley Fire and Rescue is also known as Pierce County Fire District 18 (PCFD 18).
Orting Valley Fire and Rescue operates three fire stations staffed 24 hours per day, 7 days per week. Equipment consists of three engines (including one reserve), three medic units (including one reserve), two tenders, two brush trucks, and two swift water boats and trailers. See Exhibit 130.
Exhibit 130. Orting Valley Fire and Rescue—Current Facilities Inventory, 2023
40, Headquarters
Station 42
Built in 2002
Station 43
Built in 1999
19207 Patterson Rd Orting, WA, 98360
19503 150th Ave E Orting, WA, 98360
Houses one engine, one tender, one medic unit, two brush trucks, two swift water boats and trailers, one reserve engine, and one reserve medic unit.
Houses one engine and one medic unit.
Sources: Orting Valley Fire and Rescue Fire Stations, 2023; Pierce County Assessor, 2023; BERK, 2023
Orting Valley Fire and Rescue currently has 34 employees, including 3 new firefighters hired in 2023.
Project Summary
Recent and Ongoing Major Accomplishments
• Voters approved a Fire Benefit Charge in 2021 that allowed Orting Valley Fire and Rescue to add additional staffing (this replaced a previous Maintenance & Operations levy as well as $0.50 per thousand of the fire levy). As of August 2022, Station 43 is now staffed 24/7 with a paramedic and lieutenant. Passage of the Fire Benefit Charge also aligned Orting Valley Fire and Rescue’s tax structure to that of CPFR and Graham Fire and Rescue.
Station 42
• Orting Valley Fire and Rescue was one of five agencies to sign an interlocal agreement in 2022 to participate in the Pierce County Fire Training Consortium (along with CPFR, EPFR, WPFR, and Graham Fire and Rescue). The Pierce County Fire Training Consortium provides training service to over 800 firefighters in Pierce County to improve operational consistency across the districts and allow firefighters to operate safely and efficiently on a scene regardless of the location of the incident. The Consortium also includes a recruit academy.
• In March of 2023, CPFR and Orting Valley Fire and Rescue Fire Chiefs, the Firefighters Union, and Fire Commission Board Chairs met to look at other opportunities for further cooperative efforts. Beginning in April 2023, the two agencies will explore what opportunities exist to improve services to both agencies. All areas will be examined to determine how to best reduce duplication of administrative services and improve services to the citizens.
Capital Projects
PCFD 18 conducts its own capital facilities planning process to identify projects needed to serve the district. The County will continue to coordinate with PCFD 18 on future capital planning efforts.
Pierce County Fire District 21: Graham Fire and Rescue
Overview and Inventory
Graham Fire and Rescue was established in December 1961 and is a full spectrum fire and life safety organization. The District is a combination agency with full-time and volunteer emergency personnel that provide fire suppression, BLS and ALS EMS, hospital transports, technical rescue, hazardous materials response, and fire and life safety education. Graham Fire and Rescue serves a population of roughly 70,000 across 70 square miles in south central urban and rural unincorporated Pierce County, including the communities of Graham, Kapowsin, Spanaway, Frederickson, and South Hill. Graham Fire and Rescue is also known as Pierce County Fire District 21 (PCFD 21).

Graham Fire and Rescue operates six fire stations, five that are staffed 24 hours per day, 7 days per week and one volunteer station. Equipment consists of one ladder truck, six engines (including two reserves), five medic units (including one reserve), two tenders, one battalion, one hazardous material trailer, two marine units, and one brush truck. Stations 91, 94, 95, and 96 serve primarily urban/suburban areas and stations 92 and 93 serve primarily rural areas. See Exhibit 131.
Exhibit 131. Graham Fire and Rescue
Facilities Inventory, 2023
in 1998
Houses one engine, one medic unit, one battalion, the hazardous material trailer, one reserve engine, and one reserve medic unit. Station 95
one engine, one medic unit, and one brush truck. Station 96
in 2011
Houses one engine and one medic unit. Also functions as the central logistics hub and contains an extended bay for maintenance and repair.
Houses one tender and one marine unit.
Sources: Graham Fire and Rescue Standard of Cover Study, 2021; Graham Fire and Rescue Stations, 2023; Pierce County Assessor, 2023; BERK, 2023.
Station 93
Graham Fire and Rescue employs numerous personnel, including 106 firefighters and paramedics. Workload and risk are most heavily concentrated in the northern portion of the district and resources are deployed proportionally to this demand pattern. Stations 91 and 94 are staffed with at least 5 personnel and can sleep up to 8 each The duty Battalion Chief, Chief Officers, and administrative support staff also operate out of Station 94. Station 91 is know as the “Workhorse Station” with the highest call volume of all the District’s stations. Stations 95 and 96 are staffed with at least 5 personnel and can sleep up to 6 each and Station 93 is staffed with at least 3 personnel and can sleep up to 6. Firefighters at Station 92, the District’s only all-volunteer station, respond from home when a call is dispatched. Graham Fire and Rescue is governed by a Board of five elected Fire Commissioners who serve 6-year terms.
Project Summary
Recent and Ongoing Major Accomplishments
• Graham Fire and Rescue was one of five agencies to sign an interlocal agreement in 2022 to participate in the Pierce County Fire Training Consortium (along with CPFR, EPFR, WPFR, and Orting Valley Fire and Rescue). The Pierce County Fire Training Consortium provides training service to over 800 firefighters in Pierce County to improve operational consistency across the districts and allow firefighters to operate safely and efficiently on a scene regardless of the location of the incident. The Consortium also includes a recruit academy.
• Voters recently restored Graham Fire and Rescue’s regular EMS levy for fire and EMS from $0.39 to the previous voter-approved rate of $0.50 per $1,000 of assessed value (passed in August 2023).
Capital Projects
Graham Fire and Rescue conducts its own capital facilities planning process to identify projects needed to serve the district and is currently working towards devising an active Capital Facilities Plan.20 As identified in the December 2021 Standard of Cover, the District is currently welldeployed to meet its current service demand but future growth may result in over-utilization of the District’s resources, particularly medic units. The County will continue to coordinate with Graham Fire and Rescue on future capital planning efforts.
20 2022-2026 Strategic Plan (Strategy D), 2022.
Pierce County Fire District 23: Ashford
Overview and Inventory
Pierce County Fire District 23 (PCFD 23), also known as Ashford Fire or Pierce 23 Fire & Rescue, was established in 1967 with stations in Ashford and Elbe. In 2009, PCFD 23 purchased the old Department of Natural Resources compound near Alder and converted it into an additional fire station to better serve citizens in the west end of the district. In 2010, PCFD 23 began providing service to the citizens of Lewis County Fire District 17 (Big Creek) by contract utilizing the Big Creek station and apparatus. PCFD 23 covers an area of 67 square miles, including the communities of Ashford, Elbe, Alder, and Big Creek in rural unincorporated Pierce County The District responds to calls including structural fires, medical emergencies, vehicle collisions, water rescues, technical rescues, wildland fires, and other citizen assistance and provides fire and injury prevention and education services to members of the community. The District also provides and receives mutual aid with the surrounding areas of SPFR, Eatonville Fire Department, Mineral Fire Department, and Mount Rainier National Park.

PCFD 23 operates four volunteer fire stations. Equipment consists of 18 apparatus, including BLSlevel ambulances, engines, tenders, and utility vehicles. One of the buildings at Station 85 is currently being renovated to serve as the department’s training center. When completed, the training center will have an office for the Training Officer, as well as a large classroom and storage. Onsite training equipment currently includes a multi-pitch roof prop, a customizable search & rescue maze, and a rescue/bail-out prop, with more to come in the future. See Exhibit 132
Exhibit 132. Pierce County Fire District 23—Current Facilities Inventory, 2023 Facility
Station 85
Built in 1929, renovations in the 1970s-1990s and currently underway
Station 86
Built in 1981
Station 87, Headquarters
Built in 1982, relocatable office added in 1992
Station 88
50602 Mountain Hwy E Eatonville, WA 98328
ft2
18109 541st St E Elbe, WA 98330
29815 SR 706 East Ashford, WA 98304
136 Osborn Rd Ashford, WA Unknown
Acquired in 2009 and is a former Washington DNR work center. Houses one engine, one tender, one marine unit, one aid unit, and one utility truck. A 3-bedroom house (currently being upgraded) houses resident firefighters.
Houses one engine, one tender, one aid unit, and one brush truck.
Houses one engine, one tender, one aid unit, and one utility vehicle.
Houses one engine, one tender, and one aid unit. Station 88 and the associated apparatus are owned by Lewis County Fire District 17 and operated under contract with PCFD 23.
Sources: PCFD 23 Stations, 2023; Pierce County Assessor, 2023; BERK, 2023
Station 86
PCFD 23 is a combination department with a paid full-time Fire Chief and a part-time administrative assistant and approximately 30 volunteer members, including a Training Captain, 4 lieutenants, a Safety Officer, a Chaplain, firefighters, EMTs, and support personnel. Members make themselves available to respond to calls for service 24 hours a day, 7 days a week by either responding from home/work or by working standby shifts at the stations. PCFD 23 is governed by a Board of three elected Fire Commissioners who serve 6-year terms.
Project Summary
PCFD 23 conducts its own capital facilities planning process to identify projects needed to serve the district. The District typically responds to approximately 280 calls for service per year but call volumes have generally been above 300 calls per year since 2015 and increased 24% from 20152022.21 The County will continue to coordinate with PCFD 23 on future capital planning efforts.
21 PCFD 23 Response Details, 2023.
Pierce County Fire District 25: Crystal Mountain
Overview and Inventory
Pierce County Fire District 25 (PCFD 25), also known as Crystal Mountain Fire, provides fire protection and EMS to about 3.6 square miles in eastern rural unincorporated Pierce County near Crystal Mountain (to the east of Mount Rainier National Park). In addition to responding to fires, PCFD 25 also responds to medical emergencies, motor vehicle accidents, rescue calls, and incidents involving hazardous materials.
PCFD 25 operates one volunteer fire station near Crystal Mount Ski Resort at 32004 Crystal Mountain Blvd, Enumclaw, WA 98022.
Project Summary
PCFD 25 conducts its own capital facilities planning process to identify projects needed to serve the district. The County will continue to coordinate with PCFD 25 on future capital planning efforts.
PCFD 25 Station (Google Street View)
Pierce County Fire District 26: Greenwater
Overview and Inventory
Pierce County Fire District 26 (PCFD 26), also known as Greenwater Fire, provides fire protection and EMS to about 2 square miles in eastern rural unincorporated Pierce County near the Green River. In addition to responding to fires, PCFD 26 also responds to medical emergencies, motor vehicle accidents, rescue calls, and incidents involving hazardous materials.
PCFD 26 operates two fire stations, one staffed and one volunteer. See Exhibit 133.
Exhibit 133. Pierce County Fire District 26—Current Facilities Inventory, 2023
Sources: Pierce County Assessor, 2023; BERK, 2023.
Project Summary
PCFD 26 conducts its own capital facilities planning process to identify projects needed to serve the district. The County will continue to coordinate with PCFD 26 on future capital planning efforts.
Station 1 (Google Street View)
Pierce County Fire District 27: Anderson Island Fire and Rescue
Overview and Inventory
Anderson Island Fire and Rescue providers fire and EMS service to the unincorporated community of Anderson Island, the southernmost island in the Puget Sound. The District serves a fulltime population of approximately 1,500 that swells to approximately 4,000 during the summer season.22 Anderson Island is only accessible by ferry or private boat which presents its own unique challenges for fire and EMS (for example, the nearest medical facility is over 20 minutes away). Anderson Island Fire and Rescue is also known as Pierce County Fire District 27 (PCFD 27).
PCFD 27 operates one volunteer station. See Exhibit 134.
Exhibit 134. Pierce County Fire District 27—Current Facilities Inventory, 2023
Facility Location Size
Station 27 Built in 1981 12207 Lake Josephine Blvd Anderson Island, WA 98303
6,400 ft2
Sources: Anderson Island Fire and Rescue, 2023; Pierce County Assessor, 2023; BERK, 2023.
Anderson Island Fire and Rescue is governed by a Board of three elected Fire Commissioners who serve 6-year terms.
Project Summary
PCFD 27 conducts its own capital facilities planning process to identify projects needed to serve the district. Capital Project to build firefighter quarters have been underway since 2020 and voters recently approved two levy lid lifts in August 2023 to restore previously approved levies to fund Anderson Island Fire and Rescue. The Levy Lid Lifts restored the regular fire and EMS levy rates to the previously approved $1.50 and $0.50 per $1,000 of assessed property value (the rates had fallen to less than $1.06 and $0.35 per $1,000 of assessed property value, respectively; PCFD 27 Propositions No. 1 and No. 2). Per the District, voter approval will allow Anderson Island Fire to maintain the staffing and equipment needed to respond to emergencies.23 The County will continue to coordinate with the District on future capital planning efforts.
22 Anderson Island Fire & EMS, About, 2023.
23 Anderson Island Fire & EMS Levy Lid Lifts, 2023.
Marine Unit
Public Transit
Transit service in Pierce County is provided by Pierce Transit, Intercity Transit, and Sound Transit. The services provided by each of these transit agencies is summarized in Exhibit 135. Pierce Transit is the agency that provides local transit service within the county including 32 bus routes. Sound Transit provides express bus service, Sounder commuter rail, and the Tacoma light rail. Intercity Transit provides bus service between Pierce and Thurston County. Existing facilities serving Pierce County are shown in Exhibit 136, including the Pierce Transit Public Transit Benefit Area (PTBA), which represents the transit area coverage for Pierce Transit. In addition to these local and regional transit agencies, Greyhound buses and Amtrak rail also serve Pierce County. Both companies provide service south to Portland.
Source: Fehr & Peers, 2023.
Exhibit 135. Transit Agencies by Services Provided
Exhibit 136. Existing Transit Facilities Serving Pierce County
Sources: Pierce County, 2019; WA DNR, 2022; Pierce Transit, 2023. Esri, 2023; Fehr & Peers, 2023.
This section focuses on Pierce Transit as it is the primary provider of transit service in the unincorporated county. Additional capital and service delivery details for Intercity Transit, Sound Transit, and Amtrak are available in each providers long-range plans, linked below:
• Intercity Transit: Short and Long Range Plan (2018), 2025-28 Transportation Improvement Program
• Sound Transit: Regional Transit Long-Range Plan (2014), Transit Development Plan 2024-2029
• Amtrak: Amtrak Connects Us (2021), FY24-29 Five Year Service and Asset Line Plans, Conceptual Long Distance Expansion Plan (2024, part of the Long-Distance Service Study)
Pierce Transit
Overview and Inventory
Pierce Transit is Pierce County’s local public transportation service provider. In 2019 they provided more than 9 million rides to people headed to work, medical appointments, entertainment, grocery shopping, visits with friends and other destinations. In 2020, even at the height of the COVID-19 pandemic, Pierce Transit was still providing more than 9,000 rides each weekday, proving that transit is an essential service even when many avoided face-to-face contact. Pierce Transit improves people’s quality of life by providing safe, reliable, innovative, and useful transportation services that are locally based and regionally connected.
Fixed Route Services
Prior to the COVID-19 pandemic, Pierce Transit’s fixed route services were budgeted at 500,000 service hours, with actual service levels of 491,882 service hours and 8,376,891 boardings in calendar year 2019. Over the next six years, Pierce Transit will be looking to recover these preCOVID- 19 service levels on its bus network through increased frequencies, including on weekends. These service improvements are expected to be rolled out during quarterly service changes. The following table provides budgeted service hours and projected ridership for fixed route services. Note that rolling out any service hour increases is currently constrained by Transit Operator labor shortages. For example, while service hours for 2023 were budgeted at 475,000, actual service levels for 2023 were 422,985 service hours and 6,096,759 boardings. Fixed route service levels between 2024 and 2029 are summarized in Exhibit 137.
Pierce Transit’s sustainability goals factor significantly into its fixed route bus services. The Agency plans to undergo a full zero emissions fleet transition by 2042.
Exhibit 137. Pierce Transit Fixed Route Service Levels, 2024-2029
Sources: Pierce Transit, 2024
Bus Service Recovery Plan
In December 2023, Pierce Transit’s Board of Commissioners adopted a Bus Service Recovery Plan to strategically recover service across the system as staffing becomes available. The first phase of the plan was implemented with the March 2024 service change with the launch of the Stream Community Line enhanced bus service on SR-7/Pacific Avenue. Due to low performance, Routes 425, 63, 13, and a portion of Route 409 were retired, and Pierce Transit Runner, the agency’s ondemand transit service, was expanded to provide service to affected riders. Future phases include increased frequency on core routes, additional weekend service, as well as increased hours of service. More details are available on the agency’s website at https://www.piercetransit.org/bussystemrecoveryplan/
SHUTTLE ADA Paratransit
The Agency’s SHUTTLE service directly correlates to service areas and service spans of fixed route services by matching operating hours and providing on-call rides within ¾ mile of any bus route. Route retirements and adjustments associated with the adopted Service Recovery Plan may affect existing and potential SHUTTLE customers. The agency’s Board of Commissioners directed staff to work closely with existing SHUTTLE customers impacted by the route retirement associated with phase one of the plan and transition them to Runner service or identify an alternate solution, such as formally grandfathering them into the program. SHUTTLE operating hours will need to be adjusted as a result. SHUTTLE service levels between 2024 and 2029 are summarized in Exhibit 138, which shows that SHUTTLE service is not expected to increase or decrease in the future.
Pierce Transit is updating its SHUTTLE operations management software in 2024. Through this software update, the agency aims to improve service options for its customers, including sameday service, on-demand and app- based ride booking, and allocating some rides to non-dedicated providers if demand warrants.
138. Pierce Transit SHUTTLE Service Levels, 2024-2029
Sources: Pierce Transit, 2024.
Rideshare
Demand for Pierce Transit’s Rideshare program continues to increase in lockstep with returning worker commutes, with projected growth of approximately 34% over the next six years. There is currently a waitlist for the agency’s Rideshare services. In response to demand, the program intends
Exhibit
to request agency funding to expand the current fleet of 271 vehicles to 362 vehicles by 2029. The program is also diversifying its fleet to include SUVs and electric vehicles. In addition to expanding rideshare capacity, the program plans to enhance marketing and outreach to improve adoption and use of the program, getting more single-occupancy vehicles off the road. The Rideshare program also expects to create an app for customers to more conveniently manage and reserve vanpool rides.
Runner On-Demand
Over the next six years, Pierce Transit’s on-demand Runner service is expected to continue to evolve. Spanaway Runner and the original Tideflats Runner zone are currently operating using grant funds from WSDOT, which are expected to fund portions of the operations until mid-2025. The Puyallup Runner was launched late in 2023 using WSDOT grant funds through mid-2027. The agency expanded the Tideflats Zone in early March 2024 to include a new area that is not grant funded. Gig Harbor Runner started as Pierce Transit’s sixth and final zone at the end of March 2024. Runner service levels between 2024 and 2029 are summarized in Exhibit 139.
Exhibit 139. Pierce Transit Runner Service Levels, 2024-2029
* Tideflats grant funded and non-grant funded combined above. After 2024, showing just non-grant funded zone. ** Grant funding expected to end; future funding and service to be determined Sources: Pierce Transit, 2024.
Other Runner service areas and service characteristics may be adjusted based on demand and customer needs. In 2023, Tideflats, Ruston, Spanaway, and Puyallup Runners began grouping riders into single trips to improve service efficiency and rider convenience. With software being central to the on-demand service experience, the ability to book rides in these areas through a smartphone app provides significant convenience for customers; this ability may be expanded to JBLM Runner in the future. Additionally, all Runner riders can now pay for their trips using the Transit app, which is endorsed by Pierce Transit. All Runners are currently operated using contracted service.
Level of Service Standards
Pierce Transit is preparing a “Destination 2045” plan to provide a vision of how the Agency’s transit service could look through horizon year 2045. The new plan is scheduled for finalization and adoption in September 2024, and will include measures of effectiveness for gauging performance of transit. Pierce County is committed to being a partner with Pierce Transit in supporting a transit network that meets the needs of its citizens.
Project Summary
Non-Capital Alternatives
Staffing and Recruitment
Like most public transportation providers nationwide, Pierce Transit dedicates much of its budget training staff to operate and maintain its bus fleet. For its 2023 budget, the Agency dedicates 19% of its budget to Maintenance while 69% is dedicated to Service Delivery & Support. This means that 88% of Pierce Transit’s budget is dedicated to either moving or maintaining buses every day. However, the new norm in the recruitment world is a shortage of qualified applicants for all jobs, including bus operators and mechanics. This staffing shortage has been and will continue to be a constraint on providing transit service. The Agency provides full training for new bus operators, including for the attainment of a Commercial Driver License. Pierce Transit will continue seeking ways to further incentivize hiring new employees and keeping existing employees.
A major focus for the Agency is retraining staff to manage and operate a zero-emissions bus fleet. In addition, the Maintenance Division will be evolving apprenticeship programs to handle the zeroemission bus fleet transition. The Agency’s three apprenticeship programs will also help to support a steady stream of qualified technicians and tradespeople.
Marketing, Commute Trip Reduction, Community Engagement
Pierce Transit partners with Sound Transit, King County Metro, Community Transit, Everett Transit, Kitsap Transit, and City of Seattle on joint regional marketing of the Free Youth Transit Pass and ORCA/ORCA LIFT passes. Partners will learn from current campaign efforts, further refine and focus messaging to reach youth and families and continue to implement innovative strategies to build youth ridership, particularly where needs are greatest across the region. In addition, a future phase of the Free Youth Transit Pass regional campaign will allow partners to implement additional transportation demand management strategies, including messaging, outreach and education to deepen relationships with school districts and youth-serving organizations, expand desired behavior changes, build confident young riders, and continue to build the next generation of strong and committed transit users and advocates across the region.
Transit agencies across the region transitioned to the new ORCA fare payment system in May 2022. While the new system provides greater flexibility and convenience, partner transit agencies continue to identify opportunities for improvements and to seek enhancements to improve the passenger experience and administrative efficiency. This scalable project would provide
enhancements to the ORCA/ORCA LIFT systems in these areas: 1) Integration of ORCA LIFT with the new ORCA system 2) Development of Regional ORCA LIFT outreach materials and 3) Automated Ticket Distribution for ORCA.
Safety, Security, and Technology
Pierce Transit aims to partner with University of Washington-Tacoma to develop a pilot program to field a Hardship Assistance Response Team consisting of Pierce Transit Public Safety staff and contracted behavioral health professionals. This team would assist individuals using Pierce Transit services, on or near Pierce Transit property, that experience mental health, substance abuse, and/or insecure housing issues in the Pierce County service area.
Customer Experience
• ORCA LIFT. In 2023, Pierce Transit joined its regional transit partners in offering ORCA LIFT to eligible riders. ORCA LIFT is a reduced adult fare program available to individuals with incomes below or equal to 200% of Federal Poverty Level guidelines. Those who qualify pay $1 per one-way trip, $2.50 for a local all-day pass, $4 for a regional all-day pass, $31 for a local monthly pass, and $36 for a regional monthly pass.
• Destination 2045. In 2016, Pierce Transit finalized and adopted its first Long Range Plan, Destination 2040. Its objective was to create “a comprehensive guiding document of the Agency’s vision for providing dependable, safe, efficient, and fully integrated public transportation services throughout the South Sound Region of today, tomorrow, and beyond.” In December 2020, the Agency prepared a minor update to reflect a plan for future transit service constrained by existing funding mechanisms (i.e., a 0.9% sales tax rate within the service area boundaries).
Within a few years, a decade will have passed since the original long-range plan. So, in 2023, Pierce Transit is preparing a “Destination 2045” plan to provide a vision of how the Agency’s transit service could look through horizon year 2045. The new plan is scheduled for finalization and adoption in September 2024.
• Thriving Communities at “Four Corners” Planning Area. The US Department of Transportation will be providing technical support to Pierce Transit and its partners the Tacoma Housing Authority, the City of University Place, and other local jurisdictions. This planning, technical assistance, and capacity-building support will enable disadvantaged and underresourced communities to advance a pipeline of transformative infrastructure projects that will increase mobility, reduce pollution, and expand affordable transportation options, connecting communities to the essential opportunities and resources that will help them thrive.
Capital Projects
Pierce Transit’s 2024-2029 Six-Year Capital Plan, as adopted in the 2024 Budget, is shown in Exhibit 140. Some notable capital projects are discussed in more detail in this section.
Exhibit 140. Pierce Transit Six-Year Capital Plan
Source: Pierce Transit 2024 Budget.
Rolling Stock and Battery Electric Bus Fleet Transition
Pierce Transit’s rolling stock and revenue vehicles are replaced on a regular cycle, which meets or exceeds FTA useful life benchmarks. For fixed route buses, routine replacement occurs when the 40-foot vehicles reach their 16-year lifespan or 640,000 miles. Replacement of 25-foot cutaway (body-on-chassis) vehicles is done at eight years or 150,000 miles. Routine replacement for SHUTTLE vehicles follows a 10-year or 150,000 miles limit; whichever comes first. New and replacement rolling stock planned for 2024-2029 is shown in Exhibit 141.
Exhibit 141. Pierce Transit New and Replacement Rolling Stock
Sources: Pierce Transit, 2024.
Maintenance and Operations Base Improvements (MOBI) $62.8M
Pierce Transit’s maintenance and operations facility was constructed in 1986 and designed to serve a fleet of 200 revenue vehicles. Today it supports a fleet of 300 buses, plus additional SHUTTLE vehicles, Vanpool vehicles, and non- revenue service and support vehicles. The facility maintains and houses both Pierce Transit and Sound Transit vehicles but is operating at capacity and no longer meets industry standards. Buses are now built wider and fleet styles have changed dramatically since 1986. The fleet maintained on the base currently includes 60-foot articulated buses and BEBs. Current facilities are not capable of servicing additional articulated or electric buses. They also cannot support Sound Transit Express double-decker buses.
While the MOBI project initially included the construction of a new Maintenance building to service articulated and double-decker buses, the scope was adjusted in 2023 and the project will be completed after final improvements are made in 2024. Work completed to date includes a new Fuel and Wash, renovated Facilities building, and the demolition of buildings 2 and 3, as well as parking lot restoration. Agency staff are currently evaluating what other improvements may be needed in the future to accommodate the agency’s long-term plans and Sound Transit service, with the intention of proposing a new capital project in the coming year.
Stream Community Line Bus Stop and Intersection Improvements $5.6M
Investments are underway along Pacific Avenue/SR-7 to support Pierce Transit’s new enhanced bus service, sponsored by MultiCare. Transit signal priority, new shelters, concrete pylons, and real-time arrival information are among the upgrades and amenities being installed to improve the customer experience and speed up travel in the corridor. Also included in this project is the
installation of a new bus stop in Spanaway across from Walmart that will increase access to this high-capacity transit service.
Stream Community Line Speed and Reliability Improvements
$48M
Using funding from the voter approved Sound Transit 3 package (ST-3), Pierce Transit intends to complete additional speed and reliability investments along Pacific Avenue/SR-7 to support the Stream Community Line enhanced bus service and better prepare the corridor for an eventual Bus Rapid Transit project. Upgrades include multiple business access transit lanes, queue jumps, and infrastructure to support the new Spanaway Transit Center.
Spanaway Transit Center
$24.7M
The new Spanaway Transit Center, which broke ground in 2022, is be located at 20712 Mountain Highway East in the unincorporated community of Spanaway. It is expected to be open in late 2024. It will serve as the southern terminus for the current Route 1 and the Agency’s first Stream BRT line. This will be Pierce Transit’s first new transit center since 1998, recognizing the increased need for services to support the significant growth in South Pierce County. The Transit Center project component, currently under construction, will feature a bus turnaround, an approximately 40-stall Park & Ride lot, a comfort station for bus operators, and a passenger drop-off area. The Transit Center Parking Lot Expansion component, currently in planning, will increase parking to 250 stalls and include enhanced entrance/exit infrastructure.
Bus Shelter Replacement Project—$3.1M
In October 2023, Pierce Transit’s Board of Commissioners approved a project to replace existing bus shelters throughout the service area. The new shelter style will be black with smaller, stronger, and less costly panels of glass which are more resistant to vandalism. The style was also endorsed by the agency’s Community Transportation Advisory Group. Solar lighting will be integrated where feasible to increase rider safety and comfort. The first round of replacements will take place late in 2024, with approximately 100 of the 500 remaining shelters replaced each year after as funding allows. The agency was recently awarded a $2.5M federal grant to support the project.
Battery Electric Buses and Chargers
$4.4M
A project is in progress to expand zero emission infrastructure on the agency’s main base from nine to 12 ChargePoint Chargers to support the battery electric fleet. In addition to the chargers, three 40 ft coaches will be replaced with battery electric vehicles. This effort is supported in part by a $3.8M Bus and Bus Facilities grant.
Multiyear Financial Plan
While ridership is trending toward pre-pandemic levels, the lingering effects of the post-COVID economic disruption continue to impact Pierce Transit on multiple fronts. Controlling the overall cost of services and projects remains a significant concern. The agency anticipates that the
challenges posed by inflation, including uncertainties related to future fuel and vehicle prices, will impact the cost-of-service delivery over the next few years. Moreover, supply chain disruptions and prolonged delivery times are still adding complexity to capital projects. Pierce Transit’s annual budget planning process considers these challenges while assessing services, staffing, and financial resources, alongside various economic forecasts, to develop a comprehensive financial outlook.
The agency’s primary revenue source, sales tax, is closely tied to local economic conditions and retail spending. While sales tax collections are projected to increase above 2023 levels, uncertainty exists around future collections. Therefore, the six-year plan shows a modest 3.65% average annual increase, well below the agency’s historical average annual increase of 5.7%. With costs continuing to escalate faster than in prior years, employees are focusing their efforts on improving productivity, reducing costs, and obtaining grants for service and projects.
Recruitment challenges persist, particularly for operators and maintenance roles Returning to previous service levels depends on increased workforce availability and funding that aligns with escalating service costs.
The Six-Year Financial Plan is sustainable for operations. Reserves and operating transfers will be used over the next six years to provide capital infrastructure that supports service plans. Reserves comply with the required levels established by the Board of Commissioners. Reserves provide the ability to deal with adverse economic conditions, emergencies, and exposure to casualty and legal risks. Additional grants and/or other funding sources will be required to fully implement the planned capital program.
Future Revenue Sources
Most of Pierce Transit’s operating revenue comes from local sales taxes, currently being collected at a rate of 0.6%. The maximum sales tax levy allowed under state law is 0.9%. A component of the agency’s newly adopted Strategic Plan is to build a business case and action plan for expanding funding to the full extent provided by state law. If successful, this initiative would provide a muchneeded revenue source for the agency. Exhibit 142 summarizes 2024 operating revenue and Pierce Transit’s typical revenue sources.
Source: Pierce Transit 2024 Budget
Pierce Transit also participates in Washington’s new Clean Fuel Standard, a market-based compliance program designed to reduce the carbon intensity of transportation fuels in the state. Under the umbrella of the Washington State Transit Association and working with a credit trading company, transit agencies in the state may earn credits related to the “fuels” they use (Compressed Natural Gas, electricity or hydrogen). Those credits will be sold to higher-polluting organizations that need to purchase credits to stay on balance, and the earned funds (minus administrative fees) will be returned to the transit agencies in proportions equal to how many credits each agency generated.
By offering free service to riders 18 years of age and younger, Pierce Transit receives $8.3M per year as a result of Washington State’s 2022 Move Ahead Washington transportation package. The package utilized funding generated by the 2021 Climate Commitment Act, which implemented a cap and invest program for carbon emissions managed by the state’s Department of Ecology. In 2024, Initiative 2117, which aims to repeal the Climate Commitment Act, will be on the ballot and presents a major financial challenge if passed. Revenue from the free youth transit pass program and Move Ahead Washington has been integrated into the agency’s six-year financial plan and would require Pierce Transit to significantly scale back service improvements if removed as a result of Initiative 2117.
Six-Year Financial Plan and Cash Flow Analysis
Exhibit 143 contains the Agency’s multiyear financial plan and cash flow analysis. The operating financial plan is sustainable and generally balanced for each year.
Exhibit 142. Pierce Transit Revenue Sources
Exhibit 143. Pierce Transit Six-Year Financial Plan and Cash Flow Analysis
2024-2029 Six-Year Plan Revenues & Expenditures
2024-2029 Six-Year Plan Ending Balances
Source: Pierce Transit 2024 Budget.
Pierce County Library System
Overview and Inventory
The Pierce County Library System (PCLS) has been serving customers since 1946. Today, PCLS is the state's fourth largest library system with 19 libraries serving over 650,000 people across 1,800 square miles throughout unincorporated Pierce County and the 15 cities and towns that have annexed into the District (see Exhibit 144) PCLS offers more than 1 million books, CDs, DVDs, ebooks, audiobooks and more. It also offers computers with high-speed Internet access and Wi-Fi. Residents may use any of the facilities in the District for access to PCLS materials and services, as well as its online branch. In addition, cardholders are able to request books and other materials from any location through the library catalog and have them delivered to their preferred library location for pick up.
Exhibit 144. Pierce County Library Locations, 2023
Sources: Pierce County GIS, 2023; BERK, 2023.
Library services include access to physical and downloadable books, movies, music, magazines, audio-books and other resources; help finding answers and information or building skills; homework and reading support and other services to youth and teens; classes and events for all
ages; support and resources for job seekers and for soldiers, veterans and military families; access to technology, the internet, and digital literacy support; individual and group study space; and community meeting rooms. The Library also delivers services, books, and other resources beyond the Library’s physical facilities both in the community and online.
The Pierce County Rural Library District is a public corporation established under RCW 27.12, serving all unincorporated areas within Pierce County as well as annexed cities and towns. As a junior taxing district, all operations and capital improvements are funded by a dedicated property tax levy with a maximum mill rate of 50 cents per $1,000 of assessed property value. Property tax provides 94-97% of the Library’s revenue.
Level of Service Standards
The Pierce County Comprehensive Plan adopts the LOS for libraries detailed in the Pierce County Library facility plan, as amended (see Exhibit 1). PCLS conducts its own capital facilities planning process to identify projects needed to serve its customers The current Pierce County Library 2030: Facilities Master Plan was updated in 2017 and is adopted, by reference, in the Pierce County CFP. The 2017 update of Pierce County Library 2030 revised service level targets to 0.40 to 0.50 square feet per district resident by 2030. The recommendation is based on current best practices for library design and space both nationally and within the West Coast region and supports the Library’s 2023 Strategic Plan. Pierce County Library 2030 also identifies the need to regularly evaluate and revise target service levels to reflect changes in communities, technology, and service directions.24
PCLS’s service area includes unincorporated Pierce County plus the 15 annexed cities and towns within the Pierce County Rural Library District (Bonney Lake, Buckley, DuPont, Eatonville, Edgewood, Fife, Gig Harbor, Lakewood, Milton (both the Pierce and King portions), Orting, South Prairie, Steilacoom, Sumner, University Place, and Wilkeson). As of 2023, PCLS serves an estimated population of 662,155 and is planning to serve 717,800 residents by 2030 per the Facilities Master Plan. This is slightly higher than the projected population of 701,993 in the service area by 2030 but below the projected 789,003 residents by 2044.
Exhibit 145 details current, 2030, and 2044 service levels for the library service area overall per the County’s 2022-23 CFP and compares these to updated 2023 OFM population estimates and adopted 2044 growth targets in the CPPs. In 2023, PCLS provided 0.28 square feet of library space per district resident. Based on the targeted service level of 0.40 to 0.50 square feet per district resident, there will be a deficit of approximately 73,000 – 142,000 square feet in 2029 and 110,000 – 189,000 square feet in 2044. Without additional facility space beyond the interim Lakewood Library and new Sumner Library, service levels would be between 0.29 – 0.30 square feet per capita in 2029 and 2030 and 0.26 square feet per capita in 2044.
24 PCLS is currently updating the Facility Master Plan.
Exhibit 145. Pierce County Library Existing and Future Systemwide LOS Analysis
a The 2023 population estimate is from OFM’s “April 1, 2023 Population of Cities, Towns and Counties” for communities in the PCLS service area (includes unincorporated Pierce County plus the 15 annexed cities and towns within the Pierce County Rural Library District (Bonney Lake, Buckley, DuPont, Eatonville, Edgewood, Fife, Gig Harbor, Lakewood, Milton (both the Pierce and King portions), Orting, South Prairie, Steilacoom, Sumner, University Place, and Wilkeson). The 2044 population projection is as reported in the adopted CPPs; estimated 2044 population served in the King County portion of Milton is based on an adopted growth target of 50 housing units by 2044, an average household size over the last 5 years (2019-2023) of 2.39 people per household (per OFM estimates), and OFM’s 2023 population estimates. The 2030 population estimate is based on the CAGR from 2023-2044 within the Library District.
b. Population and square footage are as reported in Pierce County Library 2030: Facilities Master Plan.
c. The Lakewood Library was closed in June 2022 (reducing facility space from the 2022-23 CFP estimate by 32,592 ft2) an interim space with 7,000 – 10,000 ft2 is planned to open in 2024. The new Sumner Library is anticipated to be up to 20,000 ft2 per the August 2023 ballot measure (to replace the existing 10,600 ft2 facility).
d. Rounded to the nearest 1,000.
Sources: Pierce County Library 2030: Facilities Master Plan, 2010 (amended 2017); King County CPPs, 2021 (amended 2023 per Growth Management Planning Council Motion 23-1); Pierce County CPPs Appendix A, 2022; OFM, 2023; Pierce County, 2023; BERK, 2023
The Pierce County Rural Library District is a public corporation established under RCW 27.12, serving all unincorporated areas within Pierce County as well as annexed cities and towns. As a junior taxing district, all operations and capital improvements are funded by a dedicated property tax levy with a maximum mill rate of 50 cents per $1,000 of assessed property value. Property tax provides 94–97% of the Library’s revenue.
PCLS’s operating levy supports ongoing operations and capital maintenance. The Library’s capital improvement strategies are used to determine projects and priorities. Current strategies are:
• Preserve our facilities as an asset (stewardship).
• Efficiency: Spend to save (efficient operations).
• Stay relevant and up-to-date (customer focus).
• Build critical infrastructure to support responsive services.
Additional funds will be required to support the costs of new or expanded facilities. In 2016, the Library’s Board of Trustees created a Special Purpose fund to begin setting aside funds for future land and facility needs. PCLS estimates total revenue from all sources for the Library in 2023 to be $44 million, of which $44 million is budgeted for 2023 services, operations, and materials. PCLS plans to fund capital investments of $6.5 million through carryforwards, available cash in the Capital Fund, and transfers from the General Fund. PCLS projects the remaining property tax revenue at approximately $2 million and $400,000 in investment income, which it will deposit into the Levy Sustainability Fund in 2023. This will bring the Levy Sustainability Fund balance to
approximately $15.3 million, building upon the $12.8 million in the fund in 2022. The target for the Levy Sustainability Fund is $14-15 million. The Library will continue to work with communities to determine when the timing is best to begin plans to approach voters or seek other funds for improvements recommended in Pierce County Library 2030.
Recent and Ongoing Major Accomplishments
• The Sumner area is planning toward a new Sumner Library with potential funding primarily through a Library Capital Facility Area and bond. The centrally located library will be inclusive and local, with books, materials, and all services accessible for the diverse residents of the Sumner area. PCLS purchased the property planned to house the Sumner Library in 2021.
• PCLS is continuing to offer pop-up libraries and services with community partners throughout Lakewood and plans to provide a new, modern, interim library facility in an accessible area residents can use until a permanent library facility is built. The Library’s Board of Trustees is reviewing recommendations from the Lakewood Libraries Building Community Advisory Committee and determining next steps for quality long-term library service in Lakewood.
• PCLS installed a new roof on the Bonney Lake Library building in 2022, made possible from restored levy funds helping to address deferred maintenance and update services to serve the growing and changing community. Additionally, the Library will also see updated restrooms, new furniture, and interior paint.
• PCLS is improving infrastructure with a siding replacement at the Fife Pierce County Library, and door replacements at Gig Harbor, Key Center, South Hill, and Steilacoom libraries. The parking lot at Graham Library is also being repaved and public and staff areas of the building are being updated.
• PCLS is starting contamination mitigation and a landscape refresh at Buckley Pierce County Library.
• Pierce County Library 2030: Facilities Master Plan was completed in 2010 with input and collaboration from over 5,000 individuals and organizations throughout Pierce County. A 2017 update to the plan reflected changes in the community, technology, and service expectations of the public. PCLS is conducting another update to the Facilities Master Plan to reflect current facilities planning more accurately. The Library continues to conduct architectural building assessments for all of its locations. In 2023, the effort was increased to include comprehensive engineering assessments to create a long-range plan, which establishes priorities for future capital building projects as well as needs.
Project Summary
Non-Capital Alternatives
The Library seeks to provide convenient and accessible services in innovative ways that take its services outside of physical facilities. Non-capital alternatives are critical for serving residents in isolated or remote locations and can include:
• Community locations: PCLS provides services outside library facilities, including service to daycares, home-based childcare, adult care facility residents and the homebound; school visits; summer mobile service; and classes and services at community locations and events, and in schools.
• Digital services: PCLS offers a wide variety of online services that allow residents to access library resources remotely 24/7 or at library locations during open hours. Resources available electronically include:
Downloadable books, audiobooks, and magazines
Electronic reference resources, research databases
Portals for audiences such as military families, job seekers, small businesses, STEM learning
Electronic language learning programs
Online live homework tutors
Online technology and other classes (lynda.com, Universal class)
Free technology certifications for Adobe, Microsoft, and QuickBooks
Online summer reading program for all ages
Access to the internet through public PCs and laptops for use in branches
Print, copy, and fax services
Public Wi-Fi
• Reciprocal borrowing: PCLS provides its residents with free, convenient access to libraries outside the PCLS service area, including Tacoma, Puyallup, King County, Kitsap County, and Thurston County.
• Service in partner spaces: A book drop is located at the PCFD 23’s Station 87 located at 29815 SR 706 E in Ashford to provide Ashford and Elbe residents with a convenient, local location to return library materials.
Capital Projects
The Pierce County Rural Library District conducts its own capital facilities planning process to identify projects needed to serve the district. Pierce County Library 2030 identifies new libraries, upgrades/expansions, and other capital facility investments needed to support anticipated population growth and meet 2030 service level targets. This includes some of the prior year/ongoing projects listed above (e.g., the new Sumner Library) as well as a proposed new library in Frederickson. In 2010, PCLS estimated that implementing Pierce County Library 2030 would cost $310 million (2010 dollars) for facilities and new service delivery methods. PCLS plans to continue to work with communities to determine when the timing is best to begin plans to fund the facilities master plan. PCLS is also planning to create a new strategic plan and update the Facility Master Plan in 2024. The County will continue to coordinate with PCLS on future capital planning efforts.
Schools
Public primary and secondary education services in Pierce County are provided by a collection of 15 school districts operated by locally elected school boards, and two 2 school districts (Auburn and Yelm) that mostly operate in neighboring counties (King and Thurston, respectively). Auburn and University Place school districts only provide service within the incorporated cities and are not discussed below. School districts and schools are mapped in Exhibit 146.
146. School District Boundaries and Location of Public Schools, 2023
Sources: Pierce County GIS, 2023; BERK, 2023.
The summaries below rely on each district’s adopted CFP, the Pierce County Comprehensive Plan, and the Office of the Superintendent of Public Instruction (OSPI) in Washington. The individual school district CFPs provide information on average yearly enrollment, student percentage of the total population, projected student enrollment, and permanent capacity within each school district. The Pierce County Comprehensive Plan provides information on estimates of permanent capacity for school districts that do not submit biennial capital facilities plans and do not report planning information to Pierce County. OSPI assembles the Washington State Report Card resource with information on each school district’s enrollment for 2019-2020 and the number of teachers from 20212022. Summaries by planning area rely on geospatial data from Pierce County, generally from 2023.
Exhibit
Level of Service Standards
The Pierce County Comprehensive Plan adopts the LOS standards determined by individual school districts. Currently adopted LOS standards for each district are summarized in Exhibit 147.
Exhibit 147. School Districts Serving Unincorporated Pierce County Adopted LOS Standards
School District Adopted LOS Standard
Bethel Elementary: capacity for 700 students in all new elementary schools, district-wide average classroom size of 20 students or less
Middle/High: district-wide average classroom size of 28 students or less for middle and high schools. Capacity for 900 students in new middle schools, capacity for 1,800 students in new high schools.
Carbonado Historical Maximum of 25 students per classroom.
Clover Park Unknown, District does not collect impact fees and has no published CFP
Dieringer Elementary: 24 students/classroom (PK), 19 students/classroom (K-3), 27 students/classroom (4-5), 14 students/classroom (self-contained SPED)
Middle: 27 students/classroom (6), 28 students/classroom for grades (7-8), 28 students/classroom (PE & music teaching stations), 14 students/classroom (self-contained SPED), 25 students/classroom for PE & art, classroom utilization rate of 83%
Eatonville Elementary: 21 students (17 students for grades K-3 and 25 students for grades 4-5)
Middle: 27 students
High: 27 students
Fife Elementary and Primary: max = 25 students/class and target = 17 students/class
Middle and Junior High: max = 25 students/class and target = 25 students/class
High: max = 25 students/class and target = 25 students/class
Franklin Pierce Elementary: 121.0 ft2 classroom space/student
Middle: 132.0 ft2 classroom space/student
High: 147.6 ft2 classroom space/student
Orting Kindergarten – Grade 3: 20 students/class at 95% scheduling factor
Grades 4-5: 25 students/class at 95% scheduling factor
Grades 6-8: 28 students/class at 83% scheduling factor
Grades 9-12: 28 students/class at 83% scheduling factor
Special Education: 15 students/class
Title I, Resource: 15 students/class
Peninsula
Grades K-1: 22 students/class average, 124.5 permanent ft2/student
Grades 2-3: 23 students/class average, 124.5 permanent ft2/student
Grades 4-5: 28 students/class average, 124.5 permanent ft2/student
Grades 6-8: 32 students/class average (83% Utilization), 120.4 permanent ft2/student
Grades 9-12: 32 students/class average (80% Utilization), 132.3 permanent ft2/student
Puyallup
K-6th grade schools: 22 students per general education classroom
K-5th grade schools: 21 students per general education classroom
Junior High: 30 students per general education classroom x 83% utilization factor
High School: 32 students per general education classroom x 83% utilization factor
Steilacoom Historical Elementary: 20 students/classroom
School District Adopted LOS Standard
Middle: 25 students/classroom
High: 25 students/classroom
Sumner-Bonney Lake Kindergarten: average class size of 19
Grade 1: average class size of 21
Grade 2: average class size of 22
Grade 3: average class size of 22
Grades 4-5: average class size of 27
Grades 6-12: average class size of 30
Tacoma Unknown, District does not collect impact fees and has no published CFP
White River Elementary: 21 students per classroom
Middle and High: 25 students per classroom
Yelm
Grades K-5: average class size of 23 students
Grades 6-8: average class size of 25 students
Grades 9-12: average class size of 25 students
Source: Bethel School District CFP, 2023-2028; Carbonado School District CFP, 2022-2028; Clover Park School District 2020 Facility Condition Assessment, 2021; Dieringer School District Long Range Facility Plan, 2021; Eatonville School District CFP, 2022-2027; Fife School District CFP, 2022-2028; Franklin Pierce School District CFP, 2022-2028; Orting School District CFP, 2022-2028; Peninsula School District CFP, 2022-2028; Puyallup School District CFP, 2023-2028; Steilacoom Historical School District CFP, 2023-2028; Sumner-Bonney Lake School District CFP, 2021-2027; Tacoma Public Schools, 2023; White River School District CFP, 2018-2024; Yelm Community Schools CFP, 2022-2027; BERK, 2024
Exhibit 148 includes a comparison of existing permanent capacity and projected enrollment for the 2027–2028 school year as reported by the individual districts. All of the districts with a projected deficit during the 2027–2028 school year already have a deficit as of the 2022-2023 school year (except for Dieringer School District).
Notes: Permanent capacity and projected enrollment are from the individual school district CFPs. Enrollment for 20222023 is from OSPI.
a. Projected enrollment is from the individual school district CFPs. Enrollment projections are for the 2024–2025 school year for the White River School District and for the 2026–2027 school year for the Sumner-Bonney Lake School District. All others are for the 2027–2028 school year.
b Franklin Pierce School District reports total capacity including portables (permanent and temporary).
c. Capacity and enrollment are reported only for the three schools in Yelm School District serving Pierce County (McKenna Elementary School, Yelm Middle School, and Yelm High School)
Sources: Bethel School District CFP, 2023-2028; Carbonado School District CFP, 2022-2028; Clover Park School District 2020 Facility Condition Assessment, 2021; Dieringer School District Long Range Facility Plan, 2021; Eatonville School District CFP, 2022-2027; Fife School District CFP, 2022-2028; Franklin Pierce School District CFP, 2022-2028; Orting School District CFP, 2022-2028; Peninsula School District CFP, 2022-2028; Puyallup School District CFP, 2023-2028; Steilacoom Historical School District CFP, 2023-2028; Sumner-Bonney Lake School District CFP, 2021-2027; Tacoma Public Schools, 2023; White River School District CFP, 2018-2024; Yelm Community Schools CFP, 2022-2027; OSPI, 2023; BERK, 2024.
Bethel School District
Overview and Inventory
Bethel School District covers over 215 square miles in southeast Pierce County and is the fourteenth largest school district in Washington State and the third largest in Pierce County per 2022-23 annual average full-time enrollment.25 As of the 2022-23 school year, the District serves 21,168 students between 17 elementary schools, 6 middle schools, 3 comprehensive senior high schools, and several alternative educational facilities. These alternative educational facilities include an alternative high school, an online virtual academy, a K-8 School of Choice, and Pierce County Skills Center, which is open to students throughout Pierce County and operated as a county-wide consortium but owned by the District. Exhibit 149 and Exhibit 150 summarize information about the existing schools and other capital facilities
The current Bethel Public Schools CFP was adopted by the Bethel School Board in September 2021 and is adopted by reference, as amended, in the Pierce County CFP.
149. Bethel School District Schools, 2022/23
25 OSPI Preliminary School District Personnel Summary Reports 2022–23 School Year (Table 47).
Exhibit
* Reflects projected permanent utilization capacity in the 2023/24 school year as reported in the District’s 2023-2028 CFP (see Tables 5-8). Bethel School District compares utilization capacity to student enrollment to determine excess or deficit capacity.
** Size reflects completion of the new school in September 2023. Permanent capacity at utilization is expected to increase to 624 in the 2028/29 school year as reported in Appendix I, Table 17 of the District’s 2023-2028 CFP.
*** Size reflects expansion completed in 2023. Permanent capacity at utilization is expected to increase to 1,656 in the 2028/29 school year as reported in Appendix I, Table 19 of the District’s 2023-2028 CFP.
Sources: Bethel School District CFP, 2023-2028 (size and capacity); OSPI, 2023 (enrollment and class size); BERK, 2024
Exhibit 150. Bethel School District—Other Capital Facilities (2017)
Art Crate Field and Stadium N/A
This facility provides the home field and stadium for all District high schools. 3,500-person capacity and an 8-lane track. Part of the campus that includes Shining Mountain Elementary School, Bethel Middle School, Bethel High School, the Bethel Learning Center and the District’s Operation Support Center
Bethel Early Learning Center 12,000 Former church in the Spanaway community area converted into a sevenclassroom early learning center.
Bethel Learning Center 62,218 141 Students served in two buildings with one portable classroom
New Bethel High School
80 acres of land 40 acres known as the Crate site and in 2010 purchased the adjacent 40 acres for a future high school site.
Learning Assessment Building 3,679 Houses the District’s transition program which provides life skills education to students between the ages of 18 and 21
Support Facilities
Bethel Support Annex 24,652 District warehouse, print shop, Technology, Community Connections, and Operation and Construction and Planning Department
Educational Service Center N/A
Instructional Material Center and main offices for the District
Operation Support Center 24,142
Transportation and Central Kitchen Complex
Operational center for the District
60,330 includes a central kitchen building, a transportation maintenance building that includes shop space and offices, a bus washing area and parking areas
Sources: Bethel School District CFP, 2023-2028; BERK, 2024
Level of Service Standards
The most recent LOS standards for Bethel School District are established in the 2023-2028 CFP:
• Elementary Schools
New elementary school facilities require capacity for 700 students
The district-wide average elementary school classroom size should not exceed 20 students by 2020. Individual schools will be below the district-wide standard if they are designated high poverty schools, some non-high poverty schools may be above the district-wide standard.
• Middle and High Schools
New middle school facilities require permanent capacity for 900 students.
New high school facilities require permanent capacity for 1,800 students.
The district-wide average middle school and high school classroom size should not exceed 28 students. Individual schools will be below the district-wide standard if they are designated high poverty schools, and some non-high poverty schools may be above the district-wide standard.
Bethel School District’s projected permanent capacity at utilization is for 17,333 students in the 2022/23 school year and 17,613 students in the 2028/29 school year. The District projects enrollment will reach 21,461 students by the 2027/2028 school year and 23,275 by the 2041/2042 school year, above current permanent capacity at utilization See Exhibit 148 Bethel School District conducts its own capital facilities planning process to identify projects needed to serve its students. The County will continue to coordinate with the District on future capital planning efforts.
Project Summary
Recent and Ongoing Major Accomplishments
Voters approved a school construction bond in 2019 to build new schools, renovate and expand old schools, and improve safety for the District’s students. The 2019 bond projects were estimated to cost $324.9 million for capacity projects and $211 million for non-capacity projects between 2021-2029. Projects recently completed as part of this bond include:
• The Bethel Hope Early Learning Center, a seven-classroom early learning center, opened in 2021/2022 in the Spanaway community area.
• Construction of Katherine G Johnson Elementary finished in 2022 and was the first completed school funded by the 2019 bond.
• Phase II of the Challenger High School project was completed in 2022. The new 39,000-square foot schools includes 27 new classrooms, common areas, and sports facilities.
• Construction of a New Naches Trail Elementary was completed in September 2023. The school is approximately 77,000 square feet with 42 classrooms.
• The Graham-Kapowsin High School Expansion was completed in 2023. The 54,035 square foot expansion added a new two-story addition with 14 classrooms and a new school-based health clinic, an auxiliary gym and weight room, remodel of the main entrance, expansion of the existing commons area, relocation of the career center to the second floor, administrative area and counseling center, a physics lab, and a music room
• Construction is underway on the New Elementary School #19. The 68,000 square foot school will house about 500 students and is located in the Lipoma Firs Community. The project prioritizes pedestrian spaces to create the District’s first “walking school.”
Capital Projects
Other projects not yet completed or underway but funded by the 2019 bond are listed in Exhibit 151, including:
• The Evergreen Elementary project will expand and modernize the current building originally built in 1979. This includes a 15,000 square foot expansion to the existing school (including 810 new classrooms) with a final square footage of 62,958 and capacity for 650 students (increased from 391). The old Naches Trail Elementary will become home to Evergreen Elementary staff and students while their school is renovated and expanded.
• Construction on the new Bethel High School is scheduled to begin in 2024 as. The new school consists of a 281,723 square foot facility that will house approximately 1,800 students upon occupancy with capacity for an additional 200 students in four future portables.26
• The Cedarcrest Middle School expansion and modernization will increase square footage from 77,793 to 92,793 and capacity to 900 students.
Capacity projects include the new Bethel High School, Elementary #19, Evergreen Elementary modernization and expansion, Cedarcrest Middle School expansion, property purchases, and modular classrooms. Non-capacity projects include the Cedarcrest Middle School modernization, Elk Plain School of Choice modernization, Kitchen modifications at Bethel Middle & Roy Elementary, security camera upgrades, energy efficiency improvements projects, and the existing Bethel High School remodel.
26 New Bethel High School SEPA Action to Proceed, 2023.
Exhibit 151. Bethel School District—
Note: Amounts are reported in millions and are based on the February 2019 bond package per the 2023-2028 CFP.
Source: Bethel School District CFP, 2023-2028 (Table 10 and 11); Bethel School District Bond Projects, 2023; BERK, 2024.
In addition to the 2019 bond projects, the 2023-2028 CFP identifies future improvements at numerous schools between 2032-2056. See Exhibit 152.
Exhibit 152. Bethel School District Long-Term Building Program, 2032-2056
Rocky Ridge Elementary School 2032
Camas Prairie Elementary School 2033 Elementary No. 20 2034
Roy Elementary School 2036
Graham Elementary School 2039
Bethel Middle School 2039
Centennial Elementary School 2040
Frontier Middle School 2042
Pioneer Valley Elementary 2043
North Star Elementary 2044
Kapowsin Elementary 2045
Cougar Mountain Middle School 2045
Graham Kapowsin High School 2045
Thompson Elementary 2049
Spanaway Middle School 2049
Frederickson Elementary School 2050
Nelson Elementary School 2051
Liberty Middle School 2052
Spanaway Lake High School 2053
Spanaway Elementary School 2054
Clover Creek Elementary School 2055
Shining Mountain Elementary School 2056
Note: Improvements includes modernization, replacement, expansion, and new facilities.
Source: Bethel School District CFP, 2023-2028 (Table 9)
Carbonado Historical School District
Overview and Inventory
Carbonado Historical School District encompasses 148 square miles that includes the entire City of Carbonado and a small area outside of the city in unincorporated Pierce County. The district is made up of a single K-8 Historical School with four classrooms (Exhibit 153). Students from this school attend White River High School in the White River School District after eighth grade. Additional capital resources include the gymnasium, the library and computer lab, as well as office facilities. The current Carbonado Historical School District CFP was adopted by the Carbonado School Board in July 2022 and is adopted by reference, as amended, in the Pierce County CFP.
Sources: Carbonado School District CFP, 2022-2028 (area and capacity); OSPI, 2023 (enrollment and class size); BERK, 2023.
Level of Service Standards
Carbonado Historical School District’s adopted LOS are for a maximum of 25 students per classroom. This District is currently meeting this LOS based on 2021/2022 class size estimates and the addition portable capacity. The District projects enrollment will reach 187 students by the 2027/2028 school year, nearly double permanent capacity at the District’s single school. See Exhibit 148. Carbonado Historical School District conducts its own capital facilities planning process to identify projects needed to serve its students. The County will continue to coordinate with the District on future capital planning efforts.
Project Summary
Capital Projects
The Carbonado Historical School District is currently planning for a capital improvement project in 2028 to add a 20,000 square foot facility to the existing school structure to replace portable classroom facilities. The new structure will include eight classrooms, ADA restrooms, septic, water, and a new cafeteria facility. This project is slated for 2028 and based on current construction costs is estimated to cost $8,365,600 (adjusted for an estimated inflation rate of 3% to cost $9,998,965 in 2028 dollars). The project will be funded through a currently unknown combination of state assisted funding, sale of bonds, and other local revenue services such as impact fees. See Exhibit 154
Exhibit 154. Carbonado Historical School District Capital Finance Plan, 2024-2028 (in millions)
Sources: Carbonado School District CFP, 2022-2028; BERK, 2023.
Exhibit 153. Carbonado Historical School District—Schools, 2022/23
Clover Park School District
Overview and Inventory
Clover Park School District is located immediately south of Tacoma and encompasses 68 square miles in the western end of the county, serving the Lakewood and Joint Base Lewis-McChord (JBLM) communities. Approximately one-quarter of students in the district live on military bases. The District is currently the twenty-seventh largest school district in Washington and the fourth largest in Pierce County per 2022-23 annual average full time enrollment.27 As of the 2022-23 school year, the District serves 12,606 students across 16 elementary schools, 3 middle schools, 2 comprehensive high schools, 1 International Baccalaureate high school, and several special programs (see Exhibit 155).
In addition, the District maintains several auxiliary service centers, Harry Land Stadium, and a student service center. In total, Clover Park School District has about 2 million square feet of building space of which 471,140 square feet are on JBLM. The District employs 1,778 staff including 953 certificated staff and 825 support staff.
Clover Park School District does not publish a CFP the District does not charge impact fees and so is not required to by state law.
Exhibit 155. Clover Park School District Schools, 2022/23
27 OSPI Preliminary School District Personnel Summary Reports 2022–23 School Year (Table 47).
*Within JBLM.
**Clover Park Early Learning Program is hosted at Beachwood, Custer, Evergreen, Hillside, and Tillicum elementary schools the square footage listed here is separate from those facilities The Open Doors Program is hosted at Clover Park High School.
Sources: Clover Park School District 2020 Facility Condition Assessment, 2021 (size); OSPI, 2023 (enrollment and class size); BERK, 2023.
Level of Service Standards and Project Summary
Clover Park School District’s enrollment projections and LOS standards are unavailable at this time. However, the District conducts its own capital facilities planning process to identify projects needed to serve its students. The District conducted a facility condition assessment in 2020 which calculated estimated costs for short-term observed deficiencies and modeled costs for long-term predicted renewals. The costs in the detailed reports show direct costs plus typical construction markups as well as project development markups (design, management, etc.). The County will continue to coordinate with the District on future capital planning efforts.
Dieringer School District
Overview and Inventory
Dieringer School District was established in 1890 and consolidated with Lake Tapps School District in 1936. The district is primarily located in unincorporated Pierce County, bounded on the east by the White River, on the west by the Stuck River, on the north by the City of Auburn, and on the south by the cities of Bonney Lake and Sumner. The district surrounds the northern two-thirds of Lake Tapps and covers approximately 5.5 square miles. Dieringer School District operates two elementary schools and one middle school and supports 500 high school students who may elect to attend any public high school the majority chose to attend Auburn Riverside and SumnerBonney Lake High Schools. As of the 2022-23 school year, the district had 1,530 students and the capacity to serve 1,522 students in its permanent facilities. The schools each have a gym facility and music room. Elementaries contain one special education classroom while North Tapps Middle School has three special education classrooms. See Exhibit 156
The current Dieringer School District Long Range Facility Plan was adopted by the Dieringer School Board in January 2021 and is adopted by reference, as amended, in the Pierce County CFP.
Exhibit 156. Dieringer School District Schools, 2022/23
Tapps Middle School (Grades 6-8)
Sources: Dieringer School District Long Range Facility Plan, 2021 (area and capacity); OSPI, 2023 (enrollment and class size); BERK, 2023.
Level of Service Standards
Dieringer School District sets the following LOS standards for its elementary and middle schools:
• Elementary Schools:
24 students per classroom for PK (based on 1/2-day programs, 12 students per session).
19 students per classroom for grades K-3.
27 students per classroom for grades 4-5
14 students per classroom for self-contained SPED classes.
• Middle Schools:
27 students per classroom for grade 6
28 students per classroom for grades 7-8
28 students per classroom for P.E. and music teaching stations
14 students per classroom for self-contained SPED classes. 25 students per class for P.E. and art.
Classroom utilization rate of 83%
The District has identified a number of needs based on project growth in the next 10 years through its CFP Steering committee. The District expects to grow by roughly 7.5% between now and the 2029-2030 school year. Most of these gains are anticipated in the age groups not currently served by schools in the district but rather by area high schools that fall outside of the district purview. The most notable increase that will impact the District’s facilities is in the age group served by the elementary schools. Kindergarten thought fifth grade student enrollment is forecasted to increase by roughly 41 students which would place a burden on elementary facilities that are already currently over capacity. Notably, because Dieringer Heights Elementary is a twostory facility, fire code states that only 4th and 5th grade classrooms are permitted on the second floor which may put a slight strain on classrooms depending on student distributions in the coming years.
North Tapps Middle School is currently over capacity as well and anticipates the needs for additional classroom space to meet the levels of service standards in coming years. The District has chosen not to include portable classrooms at this facility and has elected to levy a 4-classroom addition on the building that would prevent overcrowding and allow the school to prepare for the projected enrollment increases.
The committee has identified the need for a new Early Learning Center for the District as well that could provide a necessary service for families of Pre-kindergarten and Kindergarten students in the community.
Dieringer School District’s current permanent capacity is for 1,522 students. The District projects enrollment will reach 2,286 students by the 2027/2028 school year, above current permanent capacity. See Exhibit 148. Dieringer School District conducts its own capital facilities planning process to identify projects needed to serve its students. The County will continue to coordinate with the District on future capital planning efforts.
Project Summary
Recent and Ongoing Major Accomplishments
• Water heater replacement at North Tapps Middle School & Lake Tapps Middle School (2023)
• Fixed major domestic water leak at North Tapps Middle School (2023)
• Landscaping upgrades at Lake Tapps Elementary School (2023)
Capital Projects
Proposed capital improvement per the January 2021 Dieringer School Long Range Facility Plan are identified in Exhibit 157. Voters in the Dieringer School District approved a capital levy in the Fall of 2022 to fund these projects.
Exhibit 157. Dieringer School District
New Early Learning Center
Construction of new Early Learning Center (300 PK-K students, 37,500 SF)
Dieringer Heights Elementary
$24,148,125 Planning Phase
$2,001,110 Planning Phase
$1,144,800
$1,431,000
Field
Gravel
$1,144,800 Planning Phase
$2,879,888
Gravel
Demolish existing building / convert to parking
Note: Includes projects from 2021-2031 in the District’s Long Range Facilities Plan and ongoing projects listed online. Sources: Dieringer School District Long Range Facilities Plan, 2021; Dieringer School District Website – Capital Levy Projects, accessed 2023; BERK, 2023.
Eatonville School District
Overview and Inventory
The Eatonville School District is in the southern portion of Pierce County to the west of Mount Rainier National Park and is mostly rural in nature. As of the 2022/23 school year, enrollment is approximately 1,941 students across five schools: Eatonville High School (grades 9-12), Eatonville Middle School (grades 6-8), Columbia Crest Elementary (grades PK-8), Eatonville Elementary School (grades PK-5), and Weyerhaeuser Elementary School (K-5). It also runs two alternative learning experiences with a 2022/23 enrollment of 16 students the virtual Eatonville Online Academy (grades 6-10) and the Mount Rainier Parent Partnership (grades K-5) that supports families who homeschool. See Exhibit 158. In addition, the District owns several auxiliary properties and undeveloped parcels (Exhibit 159).
The current Eatonville School District CFP was adopted by the Eatonville School Board in November 2022 and is adopted by reference, as amended, in the Pierce County CFP.
Other Schools
Sources: Eatonville School District CFP, 2022-2027 (area and capacity); OSPI, 2023 (enrollment and class size); BERK, 2023.
Exhibit 159. Eatonville School District—Auxiliary Property and Land Inventory (2022)
Facility Type Location
District Administrative Office 200 Lynch St, Eatonville, WA 98328
District Office and High School Parking Lot 219 Orchard Ave W, Eatonville, WA 98328
Exhibit 158. Eatonville School District Schools, 2022/23
Facility
Type
Aux Building
Aux Building Parking
6.775 ft2 Unimproved Lot
Maintenance and Operations
6,000 ft2 Unimproved Lot
Transportation Center
Baseball Field
Football Stadium
211 Rainier Ave N, Eatonville, WA 98328
198 Lynch St W, Eatonville, WA 98328
209 Rainier Ave N, Eatonville, WA 98328
203 Lynch St, Eatonville, WA 98328
211 Orchard Ave N, Eatonville, WA 98328
410 Center St E, Eatonville, WA 98328
357 Lynch Creek Rd E, Eatonville, WA 98328
265 Orchard Ave N, Eatonville, WA 98328
Sources: Eatonville School District CFP, 2022-2027.
Level of Service Standards
The District’s average class size guidelines for the elementary, middle, and high school grade levels as established in the 2022-2027 CFP are:
• Elementary: 21 students (17 students for grades K-3 and 25 students for grades 4-5)
• Middle Schools: 27 students
• High Schools: 27 students
The District’s schools are currently below these LOS class size maximums despite being over permanent capacity in several schools. Eatonville School District’s current permanent capacity is for 1,989 students. The District projects enrollment will reach 2,306 students by the 2027/2028 school year, above current permanent capacity. See Exhibit 148. Eatonville School District conducts its own capital facilities planning process to identify projects needed to serve its students. The County will continue to coordinate with the District on future capital planning efforts.
Project Summary
The District has identified two capital projects to be completed between 2022 and 2028. The first is an addition to the Middle School to add capacity for 150 students. The second is the construction of a new elementary school with capacity for 500 students. A significant majority of funding for these capital projects will come from general obligation bonds. Other identified potential sources of funds are School Construction Assistance Program Funds (SCAP) or school impact fees assessed on residents in the district. See Exhibit 160.
Exhibit 160 Eatonville School District Capital Finance Plan 2022-2027
Source: Eatonville School District CFP, 2022-2027; BERK, 2023.
Fife School District
Overview and Inventory
Fife School District is a school district within the Cities of Fife, Milton, Edgewood, Tacoma, Pacific as well as unincorporated census-designated places Lakeland South and Fife Heights. It serves 3,868 students across 6 schools including 1 primary school, 2 elementary schools, 1 middle school, 1 junior high school, 1 senior high school, and 1 nontraditional high school. Another 28 students are enrolled in the open doors program. The District’s other facilities include the Educational Services Center and Transportation Center. See Exhibit 161.
The current Fife School District CFP was adopted by the Fife School Board in August 2022 and is adopted by reference, as amended, in the Pierce County CFP.
Exhibit 161. Fife School District Schools, 2022/23
*Fife School District uses program capacity for planning purposes. Program capacity assumes a standard LOS as adopted by the District during their annual budget approval process while also trying to maximize state allocations of support. Capacity at Fife High School includes capacity for 695 students per the 2022-2028 CFP plus additional capacity for 330 added in 2022 from the expansion.
Sources: Fife School District CFP, 2022-2028 (area and capacity); OSPI, 2023 (enrollment and class size); BERK, 2023.
Level of Service Standards
Maximum and target class size for each school type as established in the District’s 2022-2028 CFP are as follows:
• Elementary and Primary Schools: Max = 25 students/class & Target = 17 students/class
• Middle and Junior High Schools: Max = 25 students/class & Target = 25 students/class
• High School: Max = 25 students/class & Target = 25 students/class
Fife School District is below its maximum class size based on 2021 enrollment but exceeds its target class size in schools serving Pierce County students. Capital facility upgrades discussed below are intended to alleviate capacity concerns and anticipated growth in student population.
The District’s current permanent capacity is for 3,904 students. The District projects an enrollment of 3,831 students by the 2027/2028 school year, above 2021/22 enrollment reported in the 2022-
2028 CFP but below 2022/23 enrollment per OSPI and below current permanent capacity. See Exhibit 148. Fife School District conducts its own capital facilities planning process to identify projects needed to serve its students and is in the process of expanding and maintaining its facilities in the coming years to plan for an anticipated growth in student population. The County will continue to coordinate with the District on future capital planning efforts.
Project Summary
Recent and Ongoing Major Accomplishments
A voter approved general obligation construction bond was the majoring funding source for the following major capital facilities improvements in the Fife School District. Other funds identified in the 2022 CFP include state matching funds and impact fees.
• The new Fife Elementary School opened in the fall of 2021 to accommodate student growth at the K-5 level. With the addition of Fife Elementary School, the District readjusted attendance boundaries and reconfigured grades at the elementary school level.
Total cost (2022): $78,495,790
• The District Educational Service Center was relocated to the former Endeavour Intermediate School site to allow for the siting of the new Fife Elementary School (Endeavour closed following the opening of the larger new Fife Elementary School).
Total cost (2022): $18,227,155
• Surprise Lake Middle School was replaced and reopened in the fall of 2021. The replacement school included an expansion of total capacity to 650 students to allow for growth and possible grade reconfiguration in the future with grades 6-8 split between Surprise Lake Middle School and Columbia Junior High. The Fife High School addition and modernization is intended to provide for possible grade reconfiguration to include capacity for 9th grade, currently at Columbia Junior High, and growth for grades 10-12. The grade reconfiguration as part of both projects Surprise Lake and Fife High provides capacity for grades 6-12 throughout the three schools. Grade reconfigurations are not included as part of the current CFP but will be discussed in future CFPs if applicable.
Total cost (2022): $62,956,152
• A new addition to Fife High School opened on the west side of the high school campus in fall of 2022. This added classrooms to accommodate student growth through building a new career and technical education STEAM (science, technology, engineering, arts, and math) Center of Excellence. These additional classrooms provide for an estimated increase of 330 students.
Cost estimated before completion (2022): $28,745,126
Capital Projects
Fife School District has identified district-wide infrastructure and safety improvements at a cost of $10,524,063 as funded by the 2018 general obligation bond. These are the only ongoing capital projects identified in the 2022 Fife School District Capital Facilities Plan. The County will continue to coordinate with the District on future capital facilities planning efforts and future CFPs.
Franklin Pierce School District
Overview and Inventory
The Franklin Pierce School District is located south of Tacoma and west of Puyallup in central Pierce County and includes the areas of Midland, Summit, and Parkland. A portion of the district is situated along SR 512. The Franklin Pierce School District currently has eight elementary schools, two middle schools, two senior high schools, and one alternative high school. As of the 2022-23 school year, the District had 7,465 students and the capacity to serve 8,464 students in its permanent facilities with reserve capacity across all its elementary, middle, and high schools. See Exhibit 162 and Exhibit 163.
The current Franklin Pierce Schools CFP was adopted by the Franklin Pierce School Board in November 2022 and is adopted by reference, as amended, in the Pierce County CFP.
Exhibit 162. Franklin Pierce School District—Schools and Other Capital Facilities, 2022/23
*Benchmark capacity includes capacity in both permanent and portable space per the Franklin Pierce Schools CFP. Sources: Franklin Pierce Schools CFP, 2022-2028 (size and capacity); OSPI, 2023 (enrollment and class size); BERK, 2023.
Exhibit 163. Franklin Pierce School District Other Capital Facilities, 2022/23
Facility Size Notes
Other Educational Facilities
Agricultural Resource Center (The Farm)
Hewins Early Leaning Center
Support Facilities
Jo Anne Matson
Administration Complex
Support Services / Nutrition Services / Purchasing / Facilities / Information Technology
2,105 ft2 (9.7 acres of farmland)
28,428 ft2 on 1.8 acres
15,748 ft2 on 1.5 acres
2.5 acres
Includes crop areas, instructional facilities, greenhouses, community gardens, a barn, and storage buildings. It provides students with handson learning opportunities in agriculture, nutrition, and environmental science. The farm also provides spaces for community gardening and small group meetings.
Houses the Head Start, Early Childhood Education and Assistance Program (ECEAP), and community preschool programs.
Houses the Franklin Pierce School District administrators and staff.
Houses offices for the maintenance/custodial, nutrition services, facilities/purchasing, and information technology departments, as well as an electrical shop, maintenance shop, four warehouses, and nutrition service freezers/coolers
Transportation Complex 1.8 acres
Houses the bus fleet and is located adjacent to Franklin Pierce High School. There is a total of 1.8 acres with two structures consisting of offices/repair shop and a vehicle washing and fueling station. The District looks to eventually relocate the transportation complex to another location to incorporate the existing site as part of Franklin Pierce High School.
Sources: Franklin Pierce School District CFP, 2022-2028; BERK, 2023.
The District also owns several undeveloped sites of various sizes, including:
• A 5-acre site between Washington High School and Keithley Middle School. It is anticipated that this site will eventually be used as an athletic field complex.
• A 3-acre undeveloped site on the east side of 18th Avenue next to Franklin Pierce High School. The current plan is to use this parcel for parking as part of a future redevelopment of the Franklin Pierce High School campus.
• Collins Elementary School is constructed on a 22-acre site. The 7.5-acre school site is isolated from the rest of the parcel due to a bisecting band of protected wetlands and wetland buffers. The balance of the property is heavily wooded and crossed by several seasonal streams. This area of the property would be well-suited for a cross-country course, passive recreation, and nature studies.
Level of Service Standards
Adopted and current level of service standards as established in the 2022-2028 Franklin Pierce School District CFP are listed in Exhibit 164.
Exhibit 164. Franklin Pierce School District Adopted vs. Current LOS, 2022
Sources: Franklin Pierce School District Capital Facilities Plan, 2022-2028; BERK, 2023.
Per the most recently adopted LOS standard, schools in the district are below the minimum LOS given new school facilities. Franklin Pierce County School District’s current permanent capacity is for 8,464 students. The District projects enrollment will reach 8,197 students by the 2027/2028 school year, below current permanent capacity. See Exhibit 148. Meeting minimum LOS and being above capacity, however, do not equal quality of education nor does it account for educational advancements in the last 20 years. This is likely why despite being above adopted service standards, the District is still considering new additions and facilities.
Franklin Pierce County School District conducts its own capital facilities planning process to identify projects needed to serve its students. The County will continue to coordinate with the District on future capital planning efforts.
Project Summary
Recent and Ongoing Major Accomplishments
Prior and ongoing major capital projects were most recently funded by two voter approved bonds in 2012 and 2016. The $27.5 million 2012 bond was to be spent between 2013 and 2017 whereas the $157 million 2016 bond was to be spent between 2017 and 2023. Other sources of funding include impact fees, state matching grants, and direct appropriation.
• The District’s newest facilities include Brookdale and Central Avenue Elementary Schools which were opened in 2022. The new Collin’s Elementary School, Harvard Elementary School, James Sales Elementary School were opened in the beginning of the 2020-2021 school years. While there are no new secondary schools in the district, the GATES Alternative High School will be relocated to the site of the historic Collin’s school in the beginning of the 2023-2024 school year after a major renovation.
2016 bond funded
• Over the last few years, major retrofitting projects have occurred throughout the district to increase capacity and improve existing facilities. Christiansen, Elmhurst, and Midland elementaries all received new play sheds.
2016 bond funded
• Both Keithley and Ford Middle School received a major cafeteria renovation in 2016 and Ford Middle School also received a new gymnasium in 2018.
2012 & 2016 bond funded
• The high schools have also undergone major changes in recent years. Since 2013, Franklin Pierce High School has had a turf and track renovation at the stadium and is currently undergoing construction on a new performing arts center that is slated for completion in 2023. Washington High School also received a new track surface in 2015 and completed its new STEM laboratory in 2019 that required the renovation of existing school facilities. 2012 & 2016 bond funded
• The Farm’s new permanent classroom space is scheduled to open in August 2023. Direct appropriations funded
Capital Projects
The 2022-2028 Franklin Pierce School District CFP does not identify ongoing or planned future capital projects. The County will continue to coordinate with the District on future capital planning efforts.
Orting School District
Overview and Inventory
The Orting School District is located within eastern Pierce County and serves students in the City of Orting as well as parts of Graham, South Prairie, and Sumner. The district consists of two elementary schools, one middle school, and one high school. The District’s other facilities include the Administration Building, the Maintenance/Transportation Building, two parcels totaling 65 acres within the City of Orting boundaries, and 23 acres of undeveloped land south of Orting (known as the Orville Road property). County ordinances make the Orville Road property unsuitable for a school facility due to Pierce County zoning regulations prohibiting construction of school buildings in the Mount Rainier Lahar Designated Zone and wetlands area. As of the 202223 school year, the District had 2,790 students and capacity to serve 2,039 students in its permanent facilities. See Exhibit 165.
The current Orting School District CFP was adopted by the Orting School Board in June 2022 and is adopted by reference, as amended, in the Pierce County CFP.
Exhibit 165. Orting School District—Schools, 2022/23
Sources: Orting Bond 2023, 2023 (size); Orting School District CFP, 2022-2028 (capacity); OSPI, 2023 (enrollment and class size); BERK, 2023
Level of Service Standards
Orting School District sets the following capacity and LOS standards:
• Kindergarten – Grade 3: 20 students/class at 95% scheduling factor
• Grades 4-5: 25 students/class at 95% scheduling factor
• Grades 6-8: 28 students/class at 83% scheduling factor
• Grades 9-12: 28 students/class at 83% scheduling factor
• Special Education: 15 students/class
• Title I, Resource: 15 students/class
Nearly all schools within the Orting School District are currently over capacity and enrollment is anticipated to increase in coming years. Orting School District’s current permanent capacity is for 2,049 students. The District projects enrollment will increase to 4,234 students by the 2027/2028 school year, more than double current permanent capacity. See Exhibit 148 A notable staff deficit is present at Ptarmigan Ridge Elementary School that falls above the Washington State maximum elementary school class size of 17 students per classroom per RCW 28A.150.260 Portables serve to alleviate this deficit and have increased the standard of service but are not viewed as a permanent capacity solution by the District.
Orting School District conducts its own capital facilities planning process to identify projects needed to serve its students. The County will continue to coordinate with the District on future capital planning efforts.
Project Summary
Recent and Ongoing Major Accomplishments
The District recently purchased two separate parcels of land totaling 65.08 acres within the City of Orting to increase its capacity to accommodate increase in enrollment. The District intends for these parcels to accommodate future District needs and the expansion of school facilities discussed below.
Capital Projects
The Citizens Facilities Advisory Committee has recommended a number of major projects to increase student capacity and alleviate overcrowding in Orting Public Schools. The $150 million bond vote was rejected by voters on April 25, 2023. The District plans to seek out alternative funding sources for future capital projects to alleviate overcrowding.
Proposed capital projects pending future funding are listed in Exhibit 166, including:
• The main elementary School rebuild will include a new Orting Primary School on the site that is shared with Orting High School. This new facility will be able to house 600-700 students and serve grades K-5 rather than grades PK-3 which would alleviate capacity issues at Ptarmigan Ridge Elementary. The current facility is significantly below capacity and based on enrollment projections the new school should remain below capacity until 2027 at the earliest.
• Ptarmigan Ridge Elementary School would not be completely rebuilt but would instead receive an eight-classroom addition that includes an improved food service space and gymnasium as well as other recreation and parking improvements on the site. There will also be cosmetic upgrades as well as technological upgrades to ensure that there is parity between the quality of facilities and education between the two improved schools.
• The proposed upgrades to the District’s capital facilities would be improved Orting High School campus. This would result in the school taking over the existing primary school site and adding permanent capacity for roughly 250 students in the first phase and even more in subsequent
phases. They also plan to add a new gymnasium and convert the current gym to an auxiliary. Subsequent phases of construction will improve security on the new campus.
• The middle school’s proposed improvements would update the HVAC system and provide additional basketball court for the school. Cardinal Stadium is housed on the middle school campus and serves as the main track and stadium for the District would also receive a new track, turf, and lighting if this resolution were to pass.
Source: Orting School District CFP 2022-2028; BERK, 2023
Exhibit 166. Orting School District Proposed Capital Projects, 2022-2028
Peninsula School District
Overview and Inventory
The Peninsula School District is located on the Puget Sound across the Narrows Bridge from Tacoma it extends throughout the Gig Harbor and Key Peninsulas covering approximately 120 miles with over 100 miles of waterfront. As of the 2022-23 school year, the District currently serves a population of approximately 9,080 students across 17 schools consisting of 2 comprehensive four-year high schools, 1 alternative high school, 4 middle schools, and 10 elementary schools. Elementary schools provide educational programs for students in preschool through grade 5. Middle schools serve students in grades 6 through 8 and high schools serve students in grades 9 through 12. The Community Transition Program, an individualized secondary program serving students ages 18–21, is offered in an off-campus facility owned by the District with capacity for an additional 42 students. See Exhibit 167.
The current Peninsula School District CFP was adopted by the Peninsula School District Board of Directors in August 2022 and is adopted by reference, as amended, in the Pierce County CFP.
Exhibit 167. Peninsula School District—Schools, 2022/23
Sources: Peninsula School District CFP, 2022-2028 (size and capacity); OSPI, 2023 (enrollment and class size); BERK, 2023.
Level of Service Standards
Peninsula School District’s adopted LOS standards are outlined in Exhibit 168.
Exhibit 168. Peninsula School District Adopted LOS Standards (2022)
Source: Peninsula School District CFP, 2022-2028; BERK, 2023.
*These levels of service are above current maximum class sizes per RCW 28A.150.260 due to only permanent capacity included in class size calculations.
Peninsula School District’s current permanent capacity is for 10,285 students. The District projects enrollment will decrease to 9,028 students by the 2027/2028 school year, below current permanent capacity. See Exhibit 148. However, the District has identified school enrollment capacity as a growing need to be addressed by the 2019 funded elementary school renovations and upgrades and the imminent middle school upgrades. Projections estimate a 7.4% increase in student enrollment across the District between the 2021/2022 and 2028/2029 school years.
Peninsula School District conducts its own capital facilities planning process to identify projects needed to serve its students. The County will continue to coordinate with the District on future capital planning efforts.
Project Summary
Recent and Ongoing Major Accomplishments
Peninsula School District is currently rebuilding or renovating four new schools: Artondale, Evergreen, Pioneer, and Swiftwater. When these projects were completed to improve the quality of education and smaller class sizes, the board recognized that any cost savings from the 2019 bond should be directed towards anticipated middle school growth as a result of elementary school growth in the coming years.
Key Peninsula Middle School and Kopachuck Middle School both received leftover funding from the 2019 bond measure to fund major renovations that will be completed for the 2024 school year. These renovations should increase the overall student capacity and help to modernize the schools and align their design with the rest of the District.
Capital Projects
No additional capital projects have been identified between 2024 and 2029 as part of the 2022-2028 Peninsula School District Capital Facilities Plan. The County will continue to coordinate with the District on future capital facilities projects including renovations, additions, and construction of new facilities.
Puyallup School District
Overview
The Puyallup School District is located within eastern Pierce County and serves a population of over 122,000 over approximately 54 square miles within its boundaries. It is situated along the intersection of SR 512 and SR 167 in the heart of the Puyallup Valley. Puyallup School District employs approximately 1,560 certificated staff, 1,450 classified staff, and 570 substitute personnel. The district is currently the seventh largest school district in Washington and the second largest in Pierce County per 2022-23 annual average full time enrollment.28 As of the 2022-23 school year, it serves 23,104 students across 22 elementary schools, 7 junior high schools, 3 comprehensive senior high schools, 1 alternative high school, and a digital learning program (Exhibit 169). The District also owns and operates four specialized instruction facilities and six support facilities. In total, Puyallup School District maintains over 2.6 million square feet of building space and owns over 600 acres of property (of which about 485 acres are devoted to existing schools and 122 acres are undeveloped or underdeveloped).
The current Puyallup School District CFP was adopted by the Puyallup School Board in September 2023 and is adopted by reference, as amended, in the Pierce County CFP.
28 OSPI Preliminary School District Personnel Summary Reports 2022–23 School Year (Table 47).
Exhibit 169. Puyallup School District—Schools, 2022/23
*Not all used as classrooms. Includes portable moves completed or planned through 2023. Sources: Puyallup School District CFP, 2023-2028 (size and capacity); OSPI, 2023 (enrollment and class size); BERK, 2023.
Level of Service Standards
Puyallup School District has adopted the following LOS standards in its 2023-2028 CFP:
• K-6th grade schools: 22 students per general education classroom.
• K-5th grade schools: 21 students per general education classroom.
• Junior High: 30 students per general education classroom x 83% utilization factor.
• High School: 32 students per general education classroom x 83% utilization factor.
Puyallup School District’s current permanent capacity is for 20,579 students. The District projects enrollment will reach 23,427 students by the 2027/2028 school year, above current permanent capacity. See Exhibit 148. Several elementary, junior high, and high school facilities are already at or over permanent capacity. Instructional space within portable classrooms is considered temporary instructional space and not included in the District’s capacity analysis. Puyallup School District conducts its own capital facilities planning process to identify projects needed to serve its students. The County will continue to coordinate with the District on future capital planning efforts.
Project Summary
Recent and Ongoing Major Accomplishments
• The November 2015 Capital Bond financed six major capital bond projects for elementary schools in the district. Firgrove, Northwood, and Sunrise were replaced with significantly larger schools in 2019. Dessie Evans Elementary was a newly added elementary school in the 2019 school year with 44 classrooms.
• Both Pope and Hunt Elementary Schools were added to and expanded. Pope underwent a full remodel that provided a new gym/cafeteria, additional traffic space, and new special education classrooms as well as preschool classrooms that were opened in the 2020-2021 school year. Hunt Elementary was given a 12 classroom addition that was opened in the 2018-2019 school year. Ballou, Stahl, and Ferrucci Junior High Schools also received classroom additions and were opened in 2021,2021, and 2022 respectively.
Non-Capital Alternatives
• Proposed projects for a future capital levy would provide needed infrastructure improvements that address safety, security, and technology access throughout PSD schools and facilities. The most recent vote on this levy failed but these projects will need to be completed as funds become available.
Capital Projects
• Elementary
Stewart Elementary is currently the smallest school and will likely require additional classrooms. Staff are looking to purchase adjacent properties when they become available to construct a 2-story addition.
Spinning Elementary has been identified by the Citizens Facilities Advisory Committee as being eligible for replacement and expansion when the adjacent properties become available.
• Secondary
Puyallup High School is currently very undersized for the needs of the students and the District is currently in the process of acquiring additional land on adjacent properties to increase parking and athletic field space.
Sparks Stadium is currently in the process of purchasing surplus adjacent property to serve as a practice field to support the stadium and the three comprehensive high schools in the district that utilize it.
Exhibit 170 includes a full list of projects (divided into specific subtasks) adapted from the Puyallup School District 2023-2028 CFP.
Exhibit 170. Puyallup School District—Six-Year Financing Plan, 2023-2028 (in millions)
1 Shaded cells represent the planned design and construction timeline for each major capital project. Although costs will occur throughout said timeline, the total cost of the project is displayed in the year of project completion. Future project costs are adjusted for expected inflation, utilizing the mid-point of construction cost estimate. Numbers are rounded to the Tenth Million.
2 2015 Bond Program projects were front-funded by the bond issues. When state matching funds are received, bond funds are released and reallocated at the Board’s discretion.
3 Includes growth-related projects only. Year of project completion or projected completion in parenthesis for major capital projects.
4 Growth-related projects completed prior to 2023 will remain in the finance plan for 10 years after completion, or until the growth portion of the project has been reimbursed in full by impact fee revenue.
5 District-wide Infrastructure (Life Cycle) and Bond Contingency funds from 2015 Bond Program not included.
6 The project budget will provide for limited portable building moves each year. The number and location of portable moves, if any, is determined on a year-byyear basis.
Sources: Puyallup School District CFP, 2023-2028; BERK, 2023.
Steilacoom Historical School District No. 1
Overview and Inventory
Steilacoom Historical School District No. 1 is the oldest organized school district in Pierce County and was established in 1854. The District serves the communities of Steilacoom, DuPont, Anderson Island, and Ketron Island, plus portions of Lakewood and unincorporated Pierce County. As of the 2022-23 school year, 3,137 students are enrolled in the District's Pre K-12 programs at six facilities including a remote and necessary Pre K-3 on Anderson Island and five mainland schools. The mainland schools include Cherrydale Primary School (preK-3), Chloe Clark Elementary (preK3), Saltar's Point Elementary (grades 4-5), Pioneer Middle School (grades 6-8), and Steilacoom High School (grades 9-12). See Exhibit 171. The District also owns three undeveloped parcels totaling 38.25 acres, the District Office Annex, and a Maintenance Facility
The current Steilacoom Schools CFP was adopted by the Steilacoom School Board in November 2022 and is adopted by reference, as amended, in the Pierce County CFP.
*Considered adequate for interim classroom space or supplement programs only. Not calculated into standard of service.
Sources: Steilacoom Historical School District CFP, 2023-2028 (size and capacity); OSPI, 2023 (enrollment and class size); BERK, 2023.
Exhibit 171. Steilacoom Historical School District—Schools, 2022/23
Level of Service Standards
Steilacoom Historical School District’s adopted LOS standards per the 2023-2028 CFP are:
• High school: 25 students/classroom
• Middle school: 25 students/classroom
• Elementary school: 20 students/classroom
The current capacity of each school in the district is based on these LOS standards. Portable classrooms, which are neither intended for nor function as long-term educational space, are excluded from the District’s LOS calculations. Three schools are currently over capacity (Cherrydale Primary, Chloe Clark Elementary School, and Saltar’s Point Elementary School).
Steilacoom Historical School District’s current permanent capacity is for 3,020 students. The District projects enrollment will reach 3,815 students by the 2027/2028 school year, above current permanent capacity. See Exhibit 148. Demographic projections indicate that all but Anderson Island Elementary will be over capacity by the 2027/2028 school year. Future facilities are planned to alleviate overcrowding and the need for portable classrooms facilities.
Steilacoom Historical School District conducts its own capital facilities planning process to identify projects needed to serve its students. The County will continue to coordinate with the District on future capital planning efforts.
Project Summary
Recent and Ongoing Major Accomplishments
Steilacoom School District acquired a parcel of land in the City of Steilacoom to house an addition to the maintenance and transportation center per the 2018 Board of Directors’ recommendations and has constructed this addition. This improved the operational capacity of the District and can help support the projected increase in enrollment. Ongoing major accomplishments include the planning and acquisition of the site of a fifth elementary school in the district.
Capital Projects
To address projected long-term growth in the district, SHSD is planning future capital projects all within the six-year planning period of this 2023-2028 Capital Facilities Plan. Future projects and their funding plans are available in the SHSD 2023-2028 Capital Facilities Plan as well as below in Exhibit 172 Aside from these permanent capacity building projects, the District may also add portable facilities as needed to provide interim capacity at all grade levels or other ongoing noncapacity building projects
Sources: Steilacoom Historical School District CFP, 2023-2028; BERK, 2023.
Exhibit 172. Steilacoom Historical School District Capital Finance Plan, 2022-2028
Sumner-Bonney Lake School District
Overview and Inventory
The Sumner-Bonney Lake School District encompasses the cities of Bonney Lake, Sumner, Edgewood, Pacific, and unincorporated areas of Pierce County. As of the 2022-23 school year, Sumner-Bonney Lake School District has 16 schools, 2 performing arts centers, a community swimming pool, and public gymnasiums. As of the 2022-23 school year, the District serves 10,633 students across 9 elementary schools, an Early Learning Center housing pre-kindergarten and kindergarten students, 3 middles schools, 2 high schools, and the Elhi Hill Education Program housed in remodeled former medical offices (see Exhibit 173). The District currently serves grades K-5 in the early learning center and elementary schools, grades 6-8 in middle schools, and grades 9-12 in high schools and expects to keep this grade configuration in effect for the foreseeable future. In addition, the District owns five administrative/support facilities and one 26.8-acre undeveloped property adjoining Lakeridge Middle School. The Sumner Early Learning Center, Performing Arts Centers at Bonney Lake High School, Community Swimming Pool at Sumner High School, and Robert Miller Gymnasium are partially open to members of the public. The District employs over 1,000 staff members, including over 650 certificated employees.
The current Sumner-Bonney Lake School District CFP was adopted by the Sumner-Bonney Lake School Board in October 2021 and is adopted by reference, as amended, in the Pierce County CFP.
Exhibit 173. Sumner-Bonney Lake School District Schools, 2022/23
(Grades 6-8)
(Grades 9-12)
*Sumner Early Learning Center includes students in kindergarten. Those students are accounted for in enrollment calculations in their home schools, either Maple Lawn or Daffodil Valley.
**Mountain View Middle School expansion increased capacity in the 2022/23 school year by 155 students over what is listed in the District’s 2021-2027 CFP.
***Anticipated to increases to 1,660 in 2023 following modernization and expansion upgrades.
Sources: Sumner-Bonney Lake School District CFP, 2021-2027 (area and capacity); OSPI, 2023 (enrollment and class size); BERK, 2023.
Level of Service Standards
The Sumner-Bonney Lake School District adopted the following LOS standards in its 2021-2027 CFP:
• Kindergarten: average class size of 19
• Grade 1: average class size of 21
• Grade 2: average class size of 22
• Grade 3: average class size of 22
• Grades 4-5: average class size of 27
• Grades 6-12: average class size of 30
Per the 2021-2027 six-year capital facilities plan, Sumner-Bonney Lake School District enrollment has surpassed projections in the 2022-2023 school year and have gone well past the net capacity of most schools in the district, particularly in the southeastern area (including the Tehaleh community) where new home construction has accelerated. Sumner-Bonney Lake School District’s current permanent capacity is for 8,915 students. The District projects enrollment will reach 10,739 students by the 2026/2027 school year. See Exhibit 148. Per the District, additional schools and expansions will be required to meet the LOS standards. In general, the District seeks to design new schools to have the following student capacity:
• Elementary School: 500-650 Students
• Middle School: 750-950 Students
• High School 1,700-1,800 Students
Sumner-Bonney Lake School District conducts its own capital facilities planning process to identify projects needed to serve its students. The County will continue to coordinate with the District on future capital planning efforts.
Project Summary
Recent and Ongoing Major Accomplishments
Voters approved a $145.2 million capital projects bond in February 2016 which funded several capital projects. Many of these are already complete or ongoing, including:
• Modernization and expansion of Sumner High School is ongoing under a phased Master Plan Project. Phase 1 of the Master Plan started construction Fall 2021 and includes 18 classrooms, a common area with outdoor courtyard, library, kitchen, vestibule, technology upgrades, and administrative services. Modernization and expansion of Sumner High School which started construction in 2021 and was completed in May 2023.
• Mountain View Middle School completed a major expansion to expand capacity and upgrade track and field facilities in late 2022.
Capital Projects
The District identified capital projects in the 6- and 20-year time horizon. Projects the District is hoping to have completed by 2027 include an expansion to Bonney Lake High School, Expansion of capacity at multiple elementary schools and/or the construction of a new elementary school, and the purchase of new portable classrooms, as needed.
In the next twenty years, the District plans to acquire land for additional school facilities, upgrade fields at Crestwood Elementary School, upgrade Liberty Ridge Elementary School, expand existing elementary school facilities as needed, build one new elementary school and middle school, assess the need for new high school or to expand existing high school facilities, expand support facilities as needed. Support facilities improvements include athletics, transportation, maintenance and operations, technology, and administrative facilities. Aside from these major capital facility needs, the District anticipates most schools that have not yet been modernized will need upgraded electrical and mechanical systems due to aging facilities.
Exhibit 174 details the District’s capital finance plan for each of these projects. All future capital improvements will be aimed at alleviating overcrowding and ensuring LOS meets growing enrollment.
Source: Sumner Bonney Lake School District Capital Facilities Plan 2021-2027; BERK, 2023
Exhibit 174. Sumner-Bonney Lake School District—Capital Finance Plan, 2022-2027
Tacoma Public Schools
Overview and Inventory
Tacoma Public Schools was established in 1869. The District is currently the fourth largest school district in Washington and the largest in Pierce County per 2022-23 annual average full time enrollment.29 As of the 2022-23 school year, the District serves 28,455 students across 36 elementary/preschools, 12 junior high schools, 6 comprehensive senior high schools, and 4 alternative high school as well as online school options at all grade levels. See Exhibit 175.
Tacoma Public Schools does not publish a CFP the District does not charge impact fees and so is not required to by state law. Tacoma Public Schools conducts its own capital facilities planning process to identify projects needed to serve its students.
29 OSPI Preliminary School District Personnel Summary Reports 2022–23 School Year (Table 47).
Exhibit 175. Tacoma School District Schools, 2022/23
1Capacity at old Fawcett and Grant Elementary School Buildings that have been demolished. New buildings will be ready in 2024.
2Includes multiple sites (Ted Brown Building, Pacific Ave Building, and 9th & Broadway Building).
Sources: Schools and Learning Sites, 2023; Tacoma Public Schools, 2023 (size, capacity, class size); OSPI, 2023 (enrollment); BERK, 2023
Level of Service Standards and Project Summary
Tacoma Public School’s current permanent capacity is for over 40,000 students. District projections and LOS standards are unavailable at this time. However, the District conducts its own capital facilities planning process to identify projects needed to serve its students. The County will continue to coordinate with the District on future capital planning efforts.
White River School District
Overview and Inventory
The White River School District is located in the northeast portion of Pierce County to the north of Mount Rainier National Park. The majority of the population is located in the very western portion of the district between the City of Buckley and the portion of the City of Bonney Lake that is within White River School District. The District also serves the towns of South Prairie and Wilkeson. White River High School also serves high school students from the Carbonado School District. There are currently four elementary schools, one middle school, one early learning center, and one comprehensive high school in the district serving just under 4,500 students. See Exhibit 176 and Exhibit 177.
The current White River School District CFP was adopted by the White River School Board in July 2018 and is adopted by reference, as amended, in the Pierce County CFP.
*Construction completed in 2019 but there is no final capacity in the adopted White River Public Schools CFP. **Thirteen elementary portables are available but not utilized as general classroom space or homerooms and therefore do not contribute to student capacity and not assigned to a single school.
Sources: White River School District CFP, 2018-2024 (size and capacity); OSPI, 2023 (enrollment and class size); BERK, 2023.
Sources: White River School District CFP, 2018-2024; BERK, 2023.
Exhibit 176. White River School District—Schools (2022-23)
Exhibit 177. White River School District—Other Capital Facilities (2018)
Level of Service Standards
White River School District specifies minimum LOS by school level:
• Elementary School level of service is 21 students per classroom.
• Middle and High School levels of service are 25 students per classroom.
In addition, all special education classrooms should not exceed 8 students per classroom. Based on these LOS standards, all but one of the District’s schools meet or exceed the minimum LOS despite several schools being at or over permanent capacity. White River School District’s current permanent capacity is for 3,822 students. The District projects enrollment will reach 4,762 students by the 2024/2025 school year, above current permanent capacity. See Exhibit 148 White River School District conducts its own capital facilities planning process to identify projects needed to serve its students. The County will continue to coordinate with the District on future capital planning efforts.
Project Summary
Recent and Ongoing Major Accomplishments
Multiple schools were recently upgraded and renovated as part of the 2016 bond project that approved by voters and mostly completed in 2020, including:
• The most extensive renovations were at Glacier Middle School to replace portable classrooms with permanent classroom space. Glacier also received basic building upgrades, improved safety and security resources, and renovations to their auditorium, gym, and the historic Sheets field complex.
• Wilkeson Elementary underwent an interior renovation, a new kitchen, historic restoration, addition of classrooms, upgraded technology and security resources, and playground equipment.
• Foothills Elementary and Mountain Meadows Elementary underwent similar renovations that included new roofing, basic fire system and HVAC upgrades, painting, upgraded technology resources, and upgraded playground equipment.
• Elk Ridge Elementary underwent the largest elementary school renovation as it required a 30,000-foot addition to accommodate 200 additional students.
• A new stadium was built at White River High School.
Changes to permanent space were not completed when the most recent White River School District CFP was completed and are therefore not reflected in Exhibit 176.
Capital Projects
No additional capital projects are identified between 2024 and 2029 in the 2018-2024 White River School District CFP. The County will continue to coordinate with the District on future capital planning efforts including renovations, additions, and construction of new facilities.
Yelm Community Schools
Overview and Inventory
Yelm is a growing and thriving rural community with easy access to mountains, rivers, beaches, as well as urban and cultural events. Yelm is the fourth largest district in Thurston County serving the communities of Yelm, McKenna, the Bald Hills (Clear Lake), the Lawrence Lake area, the Nisqually Indian Reservation, and parts of the Lacey suburbs. A portion of the district’s 192 square miles extends into Pierce County and serves 2,724 students at McKenna Elementary School, Yelm Middle School, and Yelm High School (see Exhibit 178). Yelm High School also has a transition program known as SITE (Supporting Independence Through Employment) for students ages 18 to 21 whose graduation is determined by Individual Education Plans. Current enrollment districtwide is 5,698 students across six elementary schools, two middle schools, one high school, and one alternative school. The District also has several support service facilities as seen in Exhibit 179. including the Assessment and Student Learning Building, District Office, Maintenance and Facilities Office, and Support Operations and Transportation Center.
The current Yelm Community Schools CFP was adopted by the Yelm School Board in September 2022 and is adopted by reference, as amended, in the Pierce County CFP.
Sources: Yelm Community Schools CFP, 2022-2027 (size and capacity); OSPI, 2023 (enrollment and class size); BERK, 2023.
Source: Yelm Community Schools CFP, 2022-2027
Exhibit 178. Yelm Community Schools—Schools Serving Pierce County, 2022/23
Exhibit 179. Yelm Community Schools Additional Facilities
Level of Service Standards
Yelm Community School District’s current LOS is based on grade level and class size. The average class sizes the District targets are as follows:
• Grades K-5: Average class size of 23 students
• Grades 6-8: Average class size of 25 students
• Grades 9-12: Average class size of 25 students
Based on these standards, two of the three schools that serve Pierce County have additional capacity to serve additional students in permanent facilities while Yelm High School is dependent on portables to meet the District’s LOS
Yelm Community School’s current permanent capacity at the three schools serving Pierce County is for 2,206 students. The District projects enrollment will reach 3,038 students by the 2027/2028 school year at these three schools, above current permanent capacity. See Exhibit 148. Yelm Community Schools conducts its own capital facilities planning process to identify projects needed to serve its students. The County will continue to coordinate with the District on future capital planning efforts.
Project Summary
Recent and Ongoing Major Accomplishments
• New ball fields along Yelm Avenue are under construction since the demolition of the old Yelm Middle School.
• Southworth Elementary School construction was completed in Fall 2022
Capital Projects
Yelm Community Schools identified future capital projects as well as their funding sources in the 2022-2028 CFP. These projects are all funded by general funds or by school impact fees imposed on those who live within the district. There are no capacity building projects currently planned although Yelm Middle School is listed in the CFP (without any associated costs). See Exhibit 180.
Exhibit 180. Yelm Community Schools Six-Year Capital Finance Plan, 2022/23 – 2027/28 (in thousands)
Source: Yelm Community Schools CFP, 2022-2027
Special Park Districts
Overview and Inventory
Four special parks tax districts pursuant to RCW 36.69 and RCW 36.68.400 are currently located in unincorporated Pierce County (see Exhibit 181):
• Anderson Island is served by the Anderson Island Park & Recreation District.
• Key Peninsula is served by Key Peninsula Metropolitan Park District (Key Pen Parks).
• Gig Harbor Peninsula, including the City of Gig Harbor, is served by the Peninsula Metropolitan Park District (PenMet Parks).
• Tacoma and some parts of the Tacoma potential annexation area are served by Metropolitan Park District of Tacoma (Metro Parks).
Exhibit 181. Park Service Providers and Distribution of Pierce County Parks, 2019
Sources: Pierce County PROS Plan (Exhibit 3-1), 2020; BERK 2023.
The Anderson Island Park & Recreation District was established by the voters of Anderson Island in May 1968. The District currently supports eight developed and three undeveloped parks (almost
10% of the island) that provide a variety of recreational opportunities for residents and visitors.30 Key Pen Parks was formed in May 2004 to provide locally governed parks and recreation facilities for the citizens of the Key Peninsula and currently provides approximately 1,337 acres of public parks and recreation facilities distributed among nine sites.31 PenMet Parks was formed in May 2004 and currently includes 652 acres of park land across 22 parks and trails.32 Metro Parks is one of the oldest parks districts in Washington State formed less than a month after the Washington State Legislature passed a law in 1907 allowing cities to form separate park disticts. As of 2022, the Metro Parks system includes 65 parks, 2,907 total acres, 87 trail miles, 8.2 miles of publicly accessible beach and shoreline, 46 playgrounds, 10 spraygrounds, 8 community gardens, 7 community, cultural, and environmental centers, 5 pools, 5 skate parks, and 4 off-leash dog parks.33 Park properties owned and operated by each of these providers are mapped in Exhibit 182
Exhibit 182. Distribution of Parks on the Peninsulas and Islands, 2019
Sources: Pierce County PROS Plan (Appendix D Exhibit 1), 2020; BERK 2023.
30 The Parks, 2023.
31 Key Pen Parks took the place of the previous 30-year-old Key Peninsula Parks and Recreation District, and in October 2004, Key Pen Parks acquired the already-existing Volunteer Park, as well as the Home Park property, from the prior park district. A History of Key Pen Parks, 2023; Comprehensive Parks & Recreation Plan 2020-2025, 2020.
32 History: Then and Now, 2023; PenMet Parks Strategic Plan: 2023-2027, 2023.
33 Community Impact Report, 2022; Our History, 2023.
Park districts are formed by a vote of the people within the district and become a taxing authority. Park districts can be formed anywhere there is public support to do so. Formation of park districts often results in more investment in local parks and services within the park district boundaries. Pierce County Parks coordinates with these park districts and, in some cases, has transferred properties to their management to improve operations and maintenance efficiencies.
Level of Service Standards
Anderson Island Park and Recreation District and PenMet Parks do not currently have any adopted LOS standards. The mission of the Anderson Island Park and Recreation District is “to preserve open space, wildlife habitat and natural greenbelt, to provide recreational opportunities for island residents and visitors, and to preserve and maintain facilities for the benefit of the public.”34 PenMet Parks has developed strategic themes to provide direction, including: 35
• Community: Delight and Engage the Community
• Financial: Balanced Financial Accountability
• Internal Business: Operational Excellence
• Learning and Growth: Inspired and Accountable District
Key Pen Park’s adopted LOS standards and current (2020) and projected LOS (2030) as discussed in the 2020-2025 Comprehensive Parks & Recreation Plan are shown in Exhibit 183. The District is currently below its adopted standard for all facility types.
Source: Key Pen Parks Comprehensive Parks & Recreation Plan 2020-2025 (Figure 6), 2020.
*Key Peninsula Civic Center included in Neighborhood Parks.
Metro Parks’ mission is “Creating healthy opportunities to play, learn and grow.” The Department also has eight values: innovation, excellence, equity, inclusiveness, sustainability, accountability, safety, and fun. These values are echoed in the 2023-2024 Operating & Capital Budget priorities: access and inclusion; conservation, preservation, and sustainability; engagement; health, wellness, and safety; partnerships, and racial equity. MetroParks does not have a quantifiable adopted LOS standard but assesses service adequacy and needs to help prioritize projects.
36
34 About the Park District, 2023.
35 PenMet Parks Strategic Plan: 2023-2027, 2023.
36 2023-2024 Biennium Operating & Capital Budget, 2022.
Exhibit 183. Key Pen Parks Adopted LOS Standards (2020)
Project Summary
Anderson Island Park and Recreation District, Key Pen Parks, PenMet Parks, and MPT conduct their own capital facilities planning process to identify projects needed to serve users of each parks systems. The County will continue to coordinate with each district on future capital planning efforts.
Anderson Island Park and Recreation District
Recent and Ongoing Major Accomplishments
• Guthrie Center Acquisition: The District is acquiring the Lutheran Church property and building adjacent to the Lowell Johnson Park to be developed as the Guthrie Center. A sale agreement is in place and is fully funded through a state grant. The Lutheran Church will be leasing the basement of the building from the District as they begin construction on the upper floor in early 2024.37
Capital Projects
Anderson Island Park and Recreation District receives revenue from property taxes of between $157,000 and $160,000 a year. This operating levy comes up for public vote every six years. Except for special projects, donation income has typically been small (a few hundred dollars a year). The District has received grants for acquisitions and special projects.
Anderson Island Park and Recreation District has no paid employees, but the Park District does engage two vendors year-round: a CPA firm to handle execution of financial responsibilities and a maintenance contractor to execute regular park maintenance. For all other activities, the District relies heavily on volunteer work from the Commissioners and others to apply for grants and to get special projects done. The District also has the authority to put special purpose levies for capital projects up for public vote.
The District will continue to rely on volunteers to accomplish specific projects. The District will pursue grants and work with non-profit conservation groups to acquire property identified as significant for conservation or public use. A special levy will be requested for any large capital projects.38
Key Pen Parks
Recent and Ongoing Major Accomplishments
• Trust Land Transfer Project: Key Pen Parks leases 360 Trails from the Department of Natural Resources (through 2059). Key Pen Parks has full responsibility for 360 Trails for recreational purposes, along with responsibilities to manage forest health; however, because they do not currently own the land, DNR is able to facilitate timber harvests as they see fit. A trust land transfer to Key Pen Parks will ensure outdoor recreational opportunities without the impacts of timber harvesting.
37 November 2023 Park News, 2023.
38 About the Park District, 2023.
• Disc Golf Course Project: Key Pen Parks is currently considering ways to update the disc golf course at Volunteer Park.
Capital Projects
Key Pen Parks most recent Capital Improvement Plan is for 2020-2025 as identified in the 2020 Comprehensive Park and Recreation Plan. Projects identified over the 2024-2026+ timeframe are estimated to cost approximately $3,190,000. See Exhibit 184.
Exhibit 184. Key Pen Parks—Planned Capital Improvements, 2024-2026+
Source: Key Pen Parks Comprehensive Parks & Recreation Plan 2020-2025, 2020.
PenMet Parks
and Ongoing Major Accomplishments
• Community Recreation Center (CRC): A new recreation center with 58,000 square feet of indoor space on a 17.23 acre site. Once completed, this facility will support many activities and programs, including pickleball, basketball, lacrosse, volleyball, soccer, kickball, dodgeball, field hockey, and other recreational program sports. It will also include an elevated walking track and community spaces. The event lawn will accommodate U10 soccer, plus a variety of outdoor events like vendors, music, and more. Phase I includes community and administrative space and Phase II includes an indoor recreation center. Construction is in progress on both phases of the project.
• Rosedale Hall Renovation: Improvements to Rosedale Hall will focus on accessibility improvements including exterior entry access, restroom accessibility and total renovation of the interior and interior finishes. Along with repair of exterior walls and roof trusses, and repair and leveling of the c. 1940 addition, a catering kitchen will be added as well as essential
39 Current Projects, 2023.
storage for classes, camps, and other community programs. Construction work is in progress and anticipated for completion in 2024.
• Dedicated Senior Space Feasibility Study: PenMet Parks is studying the feasibility of developing and operating a dedicated space for seniors in the community. A series of four community meetings were held in 2023 and final reports were presented to the Board of Park Commissioners in the Fall.
• Community Aquatic Facility Feasibility Study: PenMet Parks is exploring how to develop and operate an aquatics facility for the community. A series of four community meetings were held in 2023 and final reports were presented to the Board of Park Commissioners in the Summer.
Capital Projects
The PenMet Parks District began its first collection of property tax in 2006 enabling it to fund capital projects and on-going maintenance and operations. The District’s proposed 2024 budget includes funding for a little over $29 million of capital projects, including $1.5 million for land and land improvements, $1.1 million for structures, and $21.4 million for construction.40
Metro Parks
Recent and Ongoing Major Accomplishments
• In 2014, voters passed a $198 million bond (the largest bond measure in Metro Parks’ history) to fund improvements throughout the park district. Major projects in the 2014 bond included, infrastructure improvements at Point Defiance Park and expanded access to recreation districtwide. Metro Parks currently has one bond funded capital project in unincorporated Pierce County at Dash Point Park & Pier. Metro Parks is renovating Dash Point Park & Pier and re-envisioning this scenic park, which provides access to 700 feet of sandy, saltwater beach, plus a fishing pier, playground, picnic area, and basketball/tennis court. The fishing pier is currently closed due to falling conditions.41
• Metro Parks is currently conducting an updated needs assessment for parks and facilities systemwide as they work toward a 2024 update to the 6-year strategic plan.
Capital Projects
Metro Parks has identified numerous capital improvement projects in the 2023-2024 Operating & Capital Budget over the 2023-2028 timeframe that could serve unincorporated Pierce County. Capital spending at regional parks, for example, is anticipated to total about $8.8 million from 2024-2028. While many of these facilities are located in the City of Tacoma, they are designed to serve users throughout the region (including those in unincorporated Pierce County). Metro Parks will continue to prioritize projects based on available funding and priorities identified in the District’s Strategic Plan.
40 Proposed 2024 Budget, November 2023.
41 Capital Projects, 2023.
Water
Drinking water is supplied by a large number of public water systems, as well as single-domestic systems. By definition, public water systems are divided into two categories:
• Group A systems have 15 or more service connections, or regularly provide service to 25 or more people at least 60 days per year.
• Group B systems serve less than 15 connections and fewer than 25 people per day, or 25 or more people per day for less than 60 days per year.
Single-domestic systems serve a single connection.
More than 99% of drinking water supplied by public water systems in unincorporated Pierce County comes from non-County owned public water purveyors. According to Washington State Department of Health (DOH) on-line records, the County owns and operates three Group A water systems and two Group B water systems within unincorporated Pierce County these Countyowned water systems and their water sources, all wells, are listed in Exhibit 185.
Exhibit 185. Pierce County Owned Water Systems Current Facilities Inventory in Unincorporated Pierce County, 2023 Facility No. of Connections
Sources: Washington State Department of Health, 2023; Robinson & Noble,
The County-owned Group A and B water systems serve two County parks, the Tacoma Narrows Airport, the Anderson Island Ferry Landing, and South Pierce Fire and Rescue (PCFD 17). The remaining County-owned properties within the area are served by non-County owned water systems. In total, the five County-owned water systems serve a total resident population of only 9 people and a non-resident population of 1,650 people. Most of the non-residential population served is due to the two parks and the airport.
In addition to these five County-owned water systems, DOH records indicate there are 273 other Group A systems with service areas fully inside the planning area, an additional 25 Group A systems with service areas partially in the planning area, and 1,469 other Group B water systems. It is also estimated there are over 33,000 single-domestic water systems. The Group A service areas that are either in or partially in unincorporated Pierce County are shown on Exhibit 186.
2023.
Exhibit 186. Group A Water System Service Areas, 2023
Sources: Pierce County GIS, 2023; Robinson & Noble, 2023.
As mentioned above, more than 99% of water supplied from public water systems within unincorporated Pierce County is derived from non-County-owned water systems. Most of these water systems are small (less than 1,000 connections). There are only 15 large public water systems (1,000 connections or more) in unincorporated Pierce County, while there are 1,757 small public water systems (including both Group A and B systems). None of the 15 large water systems are owned by the County; five of the small systems are County-owned as described above.
Facility inventories for the 15 largest public water systems operating in unincorporated Pierce County are detailed below.
Level of Service Standards
The LOS for water, as adopted in the Pierce County Comprehensive Plan, is for fire flow consistent with the Coordinated Water System Plan (CWSP) and International Building and Fire Codes (see Exhibit 1).
LOS standards for individual water purveyors are typically set to ensure adequate water quantity, water pressure, and water quality. Generally, water pressure and quantity standards are set to ensure adequate fire-fighting flow rates, while water quality standards are set for the protection of human health.
Water quality LOS regulations are established and enforced by the Washington State Department of Health and the Tacoma-Pierce County Health Department. Fire flow requirements are set in Pierce County code as listed in Exhibit 187.
Exhibit 187. Pierce County Minimum Fire Flow Requirements
a Water systems serving multiple properties shall provide a minimum of 1,500 gallons per minute (gpm).
b This table represents the minimums for compliance with land subdivision. Building and facility development on subdivided land may require fire flow in the range of 1,500 to 3,500 gpm.
Source: Pierce County CWSP, 2021 Update.
As the population of Pierce County grows, the County’s role in providing an umbrella of coordination actions to ensure consistency of services provided by Pierce County’s water purveyors will be important. Water systems in the county have varying levels of water demands and supply availability and future needs will depend on where and at what rate growth occurs. Exhibit 188 from the CWSP shows the compiled water system demand for the county in 2025, 2030, 2035, and 2040 (CWSP Table 7-5).
Exhibit 188. Water Demand Projections (in mgd) from the CWSP
Note: Demands for the more distant forecast years (e.g., 2040) for certain systems are estimated from the growth rates, extrapolated through the planning horizon in the CWSP. Typically, MDD will not occur on the same day for every system; these values represent the absolute maximum forecasted MDD. In reality, total county MDD will likely be smaller. Source: Pierce County CWSP (Table 7-5), 2021 Update.
Based on individual water system planning, county water demands are projected to increase to 114.5 million gallons ped day (mgd) average day demand (ADD) and 239.2 mgd maximum day demand (MDD) by 2040 and the 15 largest systems are forecasted to represent 86% of countywide ADD and 83% of MDD in 2040. The CWSP also describes design and performance policies adopted as minimum standards for new and expanding public water systems operating in Pierce County. These standards are also codified in PCC Chapter 19D.130, titled “Pierce County Coordinated Water System Plan Minimum Standards and Specifications for Public Water System Planning, Design, and Construction.” Individual water systems are required by WAC Chapter 246-290 to develop and implement a capital improvement plan (CIP) to address existing and future needs of their district.
Tacoma Water
Overview and Inventory
Tacoma Water’s service area is partially inside unincorporated Pierce County. It has facilities both inside and outside the planning area. The water system serves a population of over 300,000 people. The 2018 Tacoma Water System Plan Update (Tacoma Water, 2019) lists a population served of 326,763 in 2017 and projects service population of 338,866 for 2023. According to Department of Health records, the residential population served is 317,224 (WDOH, 2023). It is estimated the current population served in unincorporated Pierce County by Tacoma Water is about 60,000.42
In addition to serving its own customers with water, Department of Health records indicate Tacoma Water maintains 19 interties with 13 public water systems that are either completely or partially in the unincorporated County (Exhibit 186).43 As such, Tacoma Water’s water sources outside the planning area likely provide a significant additional quantity of water to people in the unincorporated County other than its own customers.
Tacoma Water produces water from a diversion dam and intake on the Green River; a wellfield along the North Fork of the Green River (both in King County); 29 other wells (24 of which are actively maintained)44 in various locations in Pierce County; and from one developed spring source. Those believed to be located within the planning area are listed on Exhibit 189. The largest source is the Green River intake, with a total capacity of 291 million gallons per day (MGD); the North Fork Wellfield can provide an additional 84 MGD. Other currently active wells and the developed spring have a total additional capacity of about 67 MGD (Tacoma Water, 2019).
Water from both the Green River intake and the North Fork Wellfield is treated to applicable federal and state standards at the Green River Filtration Facility prior to being piped to the service area through Pipeline 1 and Pipeline 5 (also known as the Second Supply Project Pipeline). Pipeline 1 provides water supply to much of Tacoma Water’s service areas in unincorporated Pierce County (as well as a small area in King County) before reaching Tacoma Water’s main storage facility, the McMillin Reservoirs. Pipelines 2 and 4 source water from the McMillin Reservoirs and serve additional areas of the unincorporated County before entering the City of Tacoma proper. A small portion of Pipeline 5 traverses through unincorporated Pierce County, but most of its length is in King County.
Tacoma Water stores water in a variety of reservoirs, tanks, and standpipes. While most of these storage facilities are not located in unincorporated Pierce County, the water system’s two largest storage facilities are: the McMillin Reservoirs #1 and #2, both with a capacity of 33.8 million gallons. Additionally, four other storage facilities are located in the planning area. These are listed on Exhibit 189
42 The 2018 Water System Plan indicates 17.7% of the water systems demand comes from unincorporated Pierce County.
43 It has three additional interties with other water systems fully located within incorporated areas of Pierce County, as well as interties with some water systems in King County.
44 The other five are either not connected to the system or are for emergency use only (Tacoma Water, 2019).

According to the water system plan (Tacoma Water, 2019), the system operates six primary service areas with a total of 51 pressure zones. Three of the primary service areas (Prairie Ridge, with four pressure zones; Fennel Creek, with a single pressure zone; and Sunrise Standpipe, with three pressure zones) are completely in unincorporated Pierce County. Two others are partially in the unincorporated County (McMillin Gravity, with ten pressure zones in the planning area, and Indian Hill, with two2 pressure zones in the planning area). Other infrastructure operated by Tacoma Water includes several additional pipelines (besides those shown on Exhibit 189), 28 pump stations (12 which are in the planning area), and over 1,200 miles of distribution mains with diameters generally between 2 and 30 inches (it is not possible to determine from the water system plan how much of the distribution system is within the planning area).
Exhibit 189. Tacoma Water Current Facilities Inventory in Unincorporated Pierce County, 2023
Firgrove WSP rates capacity at 775 gpm; Intertie 1A is a small emergency intertie near intertie 1 Firgrove
Abbreviations: FT = feet, GRFF = Green River Filtration Facility, MG = millions of gallons, MGD = millions of gallons per day, NL = not listed, WSP = water system plan.
a Depths as listed by WDOH (2023); the water system plan does not list depths for the wells.
b Capacities as listed in the water system plan unless as noted. Capacities in the water system plan are listed to the nearest 0.1 MGD (69 GPM), so values listed here are approximate. Capacity values listed by WDOH are generally different.
c Capacities as listed by WDOH (2023), the water system plan does not discuss the interties in detail
Sources: BHC Consultants, 2020; Tacoma Water, 2019; WDOH, 2023
Project Summary
Recent and Ongoing Major Accomplishments
• 2013–2016 Groundwater treatment improvements including corrosion control to protect public health, fluoridation at the Hood Street Reservoir, and disinfection improvements.
• 2015 Tacoma Water’s Green River water supply officially became a filtered surface water supply on May 1, 2015 with the completion of the Green River Filtration Facility (GRFF).
• 2018 The Water Yield, Supply and Demand Model (WYSDM) was developed together with an Integrated Resource Plan (IRP). These tools will help Tacoma Water balance water production with customer needs, both in annual operations and long-term resource planning.
• Ongoing Activation of a formal Asset Management program to help to control the life-cycle costs of owning, operating, and maintaining infrastructure and equipment.
Non-Capital Alternatives
On-going maintenance projects, water quality education, and conservation programs are in place to maximize the efficiency of water supply management and delivery to customers.
Capital Projects
Water systems are required by WAC Chapter 246-290 to develop and implement a capital improvement plan (CIP). Capital projects identified in Tacoma Water’s most recent CIP include:
• Lead Gooseneck Replacement The goal of this project is to find and replace lead goosenecks throughout the water system to reduce water quality risks. Lead goosenecks will be replaced with non-lead piping.
• Puyallup River Crossing—Between the Green River Filtration Facility and the McMillin Reservoirs, Pipeline 1 crosses the Puyallup River through two parallel 39- inch-diameter pipelines supported by a truss bridge structure. The bridge structure is vulnerable to seismic and flood events, and is difficult to maintain. Tacoma Water has been exploring options to replace the crossing. Installing it on a new proposed county road bridge is currently considered the best option.
• Corrosion Control at Gravity Pipeline Wells—This project includes the design, permitting, and construction of a new corrosion control treatment facility, connecting pipeline(s) between the two gravity pipeline wells, provisions for chemical truck deliveries, and related appurtenances.
• Tehaleh Main Extension To better serve the growing Tehaleh community, Pierce County Public Works and Utilities is planning a 2017 road widening project along 198th Avenue East. Tacoma Water has previously installed 24-inch mains in some sections of this roadway. The project would install additional 24-inch pipe segments in coordination with Pierce County’s road project.
• Main Replacement Projects The CIP includes several categories of main replacement projects. These include those identified from the economic and hydraulic models; mains that can be economically replaced during roadway improvements; and older galvanized steel mains that may be subject to failure. The CIP also provides funds for immediate response to main breaks wherever they occur.
The County will continue to coordinate with Tacoma Water on future capital planning efforts for water service.
Southwood Water
Overview and Inventory
Southwood Water’s service area is generally south of Frederickson and north and west of Graham, though an extension of it does run along 224th Street east of Graham (Exhibit 186). The water system serves an estimated population of about 42,000 people across 22 miles (WDOH, 2023), making it the second largest water purveyor in unincorporated Pierce County behind Tacoma Water. Southwood Water serves predominantly residential areas with some limited commercial and neighborhood shopping areas. Schools represent the only other larger-than-residential users. All connections in the system are metered (Apex Engineering, 2019).
The water system plan (Apex Engineering, 2019) indicated Southwood Water provides water from 31 wells (WDOH records list 39 with 11 for emergency use only and 2 as seasonal) and three interties (Exhibit 190). The water system operated in five pressure zones. Other infrastructure operated by Southwood Water includes 20 storage tanks (Exhibit 190), 10 pressure reducing valve facilities, 17 booster pump facilities, and approximately 233 miles of transmission pipes ranging in diameter from 2 to 16 inches (Apex Engineering, 2019).
Exhibit 190. Southwood Water Current Facilities Inventory in Unincorporated Pierce County, 2023 Facility
Abbreviations: FT = feet, GPM = gallons per minute, MG = millions of gallons, NL = not listed, WSP = water system plan. a Depths and capacities as listed in the water system plan; values listed by WDOH may vary.
Source: Southwood WSP (Table 1-1 and Table 1-2), 2019; WDOH, 2023.
Project Summary
Non-Capital Alternatives
On-going maintenance projects, water quality education, and conservation programs are in place to maximize the efficiency of water supply management and delivery to customers.
Capital Projects
Water systems are required by WAC Chapter 246-290 to develop and implement a capital improvement plan (CIP). Southwood Water identified the following capital projects from 20242039 in their 2019 CIP (Table 9.1):
• Meters to cell read conversion, $1,500,000 (ongoing)
• 224th water main replacement from Meridian to 84th St E, $750,000 (with design by Pierce County)
• System evaluation and scheduling of older facilities for replacement, $1,000,000 (2020-2026, bi-annual)
• Fire hydrant maintenance, $350,000 (2021-2026)
• Cleaning and painting standpipes, $2,00,000 (2023-2031)
• Mixer installation in Thrift Tanks, Southwood Tank, Silver Creek Tank and Behm Tanks, $400,000 (2025)
• Orting Kapowsin Highway Loop to Blue Horizon, $1,00,000 (2030)
• Upgrade Country Park #1 Booster Station, $150,000 (2039)
Install Sound–Lost Creek Booster Station, $400,000 (2039)The County will continue to coordinate with Southwood Water on future capital planning efforts for water service.
Parkland Light and Water
Overview and Inventory
Parkland Light and Water is a mutual cooperative that provides water service to the Parkland area, mostly south of Highway 512 (Exhibit 186). More than 95 percent of its service area is inside the planning area, with only the portion west of Steel Street, north of JBLM, and south of Highway 512 and Interstate 5 being outside the planning area. The system’s water system plan lists the 2018 population served at 27,640, with an estimated 2023 population of 30,517 (Gray & Osborne, 2020). WDOH records indicate a somewhat smaller residential population of 25,473 (WDOH, 2023). It is estimated the water system serves a population between 25,000 and 30,000 in unincorporated Pierce County.
The water system plan (Gray & Osborne, 2020) indicated Parkland Light & Water provides water from 12 active wells and 7 interties (WDOH records only list 6 interties), though all of the interties are for emergency use only (Exhibit 191).
The water system operated in a single pressure zone. Other infrastructure operated by Parkland Light & Water includes five storage tanks (Exhibit 191), four booster pump stations, and approximately 134 miles of transmission pipes ranging in diameter from 2 to 24 inches (Gray & Osborne, 2020).
indicates this well is currently out of
and Parkland Light & Water is seeking to move its water right to Well 14
Exhibit 191. Parkland Light & Water—Current Facilities Inventory in Unincorporated Pierce County, 2023 Facility
Tacoma
Tacoma 3
Tacoma 4
Abbreviations: FT = feet, GPM = gallons per minute, MG = millions of gallons, NL = not listed, WSP = water system plan. a Depths and capacities as listed in the water system plan; values listed by WDOH may vary.
Sources: BHC Consultants, 2020; WDOH, 2023.
Project Summary
Recent and Ongoing Major Accomplishments
Recent accomplishments include replacement/expansion of mains, construction of booster pump stations, and standpipe storage construction:
• Booster station and emergency generator at 128th St Well Yard (2020) Build a booster station and emergency generator to access the existing dead storage in Tank T-6, the 2.7 MG. Estimated project cost in 2019 dollars: $1,050,000.
• 110th St S and Alaska St S (2019), new water main: 870 LF Replace existing 2-inch PVC and 2-inch galvanized steel water main with approximately 650 LF of 6-inch ductile iron water main on 110th Street South between Ainsworth Avenue South and the Alaska Street South right-ofway extension. Estimated project cost in 2019 dollars: $87,000.
• Ainsworth Ave S (2019), approximate total length of new water main: 4,180 LF Replace approximately 930 LF of 4-inch and 6-inch asbestos-cement water main along Ainsworth Avenue South. Estimated project cost in 2019 dollars: $540,000.
Non-Capital Alternatives
On-going maintenance projects, water quality education, and conservation programs are in place to maximize the efficiency of water supply management and delivery to customers.
Capital Projects
Water systems are required by WAC Chapter 246-290 to develop and implement a capital improvement plan (CIP). Parkland’s current CIP includes improvements to transmission and storage components of the water system. Notable planned projects include:
• 2.3 MG Standpipe and Booster Station at Yakima Well Yard (2020 – 2025)—The recommended alterative calls for removing both tanks on the site and replacing them with a 2.3 MG standpipe. Estimated project cost in 2019 dollars: $7,316,000.
• Reservoir Cleaning (Annual)—Reservoirs are inspected on a regular basis. Interior and exterior cleaning is conducted as needed based on regular inspections. This is an annual ongoing program. Estimated project cost in 2019 dollars: $10,000 annually
• Spanaway Loop Well Yard Emergency Generator (2026)—An emergency generator capable of running the wells and ancillary equipment at the Spanaway Loop Well Yard. Estimated project cost in 2019 dollars: $500,000.
The County will continue to coordinate with Parkland Light and Water on future capital planning efforts for water service.
Spanaway Water Company
Overview and Inventory
The fourth largest water purveyor in unincorporated Pierce County is Spanaway Water Company. Its service area is entirely within the planning area (Exhibit 186), basically encompassing the area around Spanaway, located between Parkland Light and Water’s service area to the north and Southwood’s service area to the southeast. The system serves an estimated population of about 28,000 people (WDOH, 2023).
The water system plan for Spanaway Water was not available for review, but WDOH records indicate Spanaway Water provides water sourced from 11 active wells (2 of which are seasonal) and 2 interties (one for emergency-use only) as listed in Exhibit 192. Without a water system plan to review, the number of pressure zones, storage facilities, pump stations, and miles of distribution line could not be determined.
192. Spanaway Water Company—Current Facilities Inventory in Unincorporated Pierce County, 2023
Abbreviations: FT = feet, GPM = gallons per minute. Source: WDOH, 2023.
Project Summary
Recent and Ongoing Major Accomplishments
• Well No. 5R Replacement (2016)
• Well No. 5R 16" Transmission Main (2012)
• Well No. 6 with Manganese Filtration (2010)
• Well No. 6 Redevelopment (2012)
Exhibit
• 176th St E 12" Water Mains (2011-14)
• A Street 12" Water Mains (2010-12)
• 168th St S and Park Ave 12" water mains (2011)
• 8th Ave E 12" water main (2015)
• Tank No. 2 altitude/seismic valve installation (2012)
• Tank No. 2 interior and exterior re-coating (2015-16)
• Wells No. 3 and 9 Lowry Deep Bubble pH adjustment pilot study (2015)
• Tank No. 5 Site acquisition (2010 & 16
• Water Right consolidation and Well No. 11 permit (2015)
• USGS Chambers/Clover Creek Basin Model and Update (2010-present)
• Completion of AMR system metering (2011-present)
• Well and Tank security improvements (2010-present)
Non-Capital Alternatives
On-going maintenance projects, water quality education, and conservation programs are in place to maximize the efficiency of water supply management and delivery to customers.
Capital Projects
Water systems are required by WAC Chapter 246-290 to develop and implement a capital improvement plan (CIP). Upcoming capital projects identified by Spanaway Water in their most recent CIP include:
• Annual Water Main Replacement Program
• Tank #1 Seismic/Altitude Valve
• Rainier View Emergency Intertie
• 152nd Street Main
• 22nd Ave Main
• Well #11
• Well #12
• Military Road 12-inch Main
• Waller Road E 12-inch Main
• 196th 12-inch Main
The County will continue to coordinate with Spanaway Water Company on future capital planning efforts for water service
Firgrove Mutual
Overview and Inventory
The Firgrove Mutual service area encompasses much of the South Hill area south of the Puyallup (Exhibit 186). It is entirely inside the planning area. The water system serves an estimated population of approximately 28,000 people according to WDOH online records. The 2020 Water System Plan Update gives an actual 2018 population of 25,997 and estimates the 2023 population at 31,550 (BHC Consultants, 2020).
WDOH records indicate Firgrove Mutual’s water sources include 17 active wells. The water system plan lists 21 wells, but only 16 of them are active production wells (2 are monitoring wells and the others have been decommissioned). The water system plan also lists nine interties: one as a primary supply, three as backup sources, and four as emergency sources. WDOH records only list eight interties (missing one of emergency-use interties). See Exhibit 193
The water system operates in five pressure zones. Firgrove Mutual’s infrastructure also includes 11 storage facilities, 7 major pump stations, and a distribution system with approximately 140 miles of 2- to 18-inch water mains.
Exhibit 193. Firgrove Mutual—Current Facilities Inventory in Unincorporated Pierce County, 2023
Southwood
Southwood
Abbreviations: FT = feet, GPM = gallons per minute, MG = millions of gallons, NL = not listed.
a Depths and capacities as listed in the water system plan; values listed by WDOH may vary.
Sources: BHC Consultants, 2020; WDOH, 2023.
Project Summary
Recent and Ongoing Major Accomplishments
• Site 950 A new 2.9 mg standpipe for Zone 2 storage was brought online. A booster station and fixed generator at the site serve to re-elevate dead storage volumes and improve system reliability.
• 16- and 12-inch watermains were constructed south from the Paul Bunyan Rifle & Sportsman’s Club property to the Site 500 Zone 2A Booster Pump Station to improve the intake pressures at the station.
• Analyzers were installed at source locations tomonitor water quality and chlorine residual.
• Springfield Mains Phases 1 and 2 approximately 10,000 feet of 8-inch distribution watermain was constructed within this development in the eastern portion of Zone 1. The
new mains were located in an area where repeated pipe failures had been experienced. These failures have significantly decreased since the new watermains were installed.
Non-Capital Alternatives
On-going maintenance projects, water quality education, and conservation programs are in place to maximize the efficiency of water supply management and delivery to customers.
Capital Projects
Water systems are required by WAC Chapter 246-290 to develop and implement a capital improvement plan (CIP). The current CIP identifies improvements to water sources, transmission, and storage components of the water system, including:
• Project S-3, Site 975 Tacoma Intertie 4 Construction of Tacoma Intertie 4 began in the summer of 2019. The Tacoma Intertie 4 Pump Station will serve Zone 1 and will have a capacity of 2,500 gpm. This project will improve system reliability and local fire flow capacities.
• Project S-4, Site 600 Wells 13 and 18 Transmission Pipeline This project includes the construction of 3,700 feet of 16-inch diameter watermain to connect Site 600 to the southern portion of the Zone 2 distribution system. The main will help to avoid exacerbation of over pressurization issues occurring in the northern portion of Zone 2.
• Project S-5, Site 600 Wells 13 and 18 Hydraulic Improvements Project S-5 provides for improvements to Site 600 (Wells 13 and 18) to allow the wells to pump directly into Zone 2.
• Project S-6, Lipoma Communities Development Well This project includes the purchase and transfer of wells and associated water rights from the Lipoma Firs Golf Course, construction of a new well building, and pumping upgrades. Water rights from Wells 6 and 19B may be transferred to the Lipoma Firs Golf Course wells.
• Project S-7, Lakewood Intertie Transmission Main—Designated monies represent Firgrove's participation in the design and construction of the Lakewood Intertie wholesale transmission facilities being constructed.
• Project S-9, Site 650 Wells 7 and 17 Improvements Under this project, the 650 Tank and Booster Pump Station will be demolished, and higher capacity pumps will be installed in Wells 7 and 17 to allow the wells to pump directly to Zone 2.
• Project ST-2, Annual Tank Maintenance This project includes funding to recoat, clean, and inspect Firgrove’s steel reservoirs based on Firgrove’s preventative maintenance schedule The County will continue to coordinate with Firgrove Mutual on future capital planning efforts for water service
Summit Water & Supply Company
Overview and Inventory
Summit Water & Supply’s service area is entirely within the planning area located south of Highway 167 between Tacoma and Puyallup (Exhibit 186). Based on WDOH (2023) records, the system serves an estimated population of about 16,000 people.
The water system plan for Summit Water & Supply was not available for review. However, WDOH records indicate Summit Water & Supply provides water sourced from 11 active wells and 4 interties (Exhibit 194). One of the wells provides seasonal supply, five are for emergency supplies, and the others provide primary supplies. One intertie is for primary supply, one for seasonal supply, and the other two for emergencies. Without a water system plan to review, the number of pressure zones, storage facilities, pump stations, and miles of distribution line could not be determined.
Abbreviations: FT = feet, GPM = gallons per minute, NL = not listed
Source: WDOH, 2023.
Exhibit 194. Summit Water & Supply Company Current Facilities Inventory in Unincorporated Pierce County, 2023
Project Summary
Non-Capital Alternatives
On-going maintenance projects, water quality education, and conservation programs are in place to maximize the efficiency of water supply management and delivery to customers.
Capital Projects
Water systems are required by WAC Chapter 246-290 to develop and implement a capital improvement plan (CIP). The current CIP was not available for review. However, these plans usually include improvements to supply, transmission, and/or storage components of the water system. The County will continue to coordinate with Summit Water & Supply on future capital planning efforts for water service.
City of Bonney Lake
Overview and Inventory
The service area for the City of Bonney Lake’s water system extends north of the city limits to encompass the area around Lake Tapps, as well as slightly south of the city limits (Exhibit 186). The portion of the service area outside the city limits is within the planning area except for the Lakeland Hills area (on the northwest corner of the Lake Tapps Upland), which is in the City of Auburn. The City’s water system plan (RN2, 2020) states the 2018 water system population was 38,797, of which 19,562 lived outside of the city. Based on this number, it is estimated the 2018 population within the planning area is about 15,000 people. It does not provide an estimated population for 2023. This is somewhat higher than the residential population of 37,780 listed by WDOH (2023).
The water system plan lists 8 wells, 2 springs, and 11 interties, though 3 of the wells are listed as dry (RH2, 2020). None of the wells or springs appear to be located within the planning area.45 WDOH records indicate Bonney Lake’s water sources include six active wells, two springs, and one intertie. The one well listed by WDOH that is not in the water system plan is an emergency supply well; it also is not within the planning area. Seven of the interties are within the planning area and are listed on Exhibit 195.
The water system operates in 15 pressure zones (9 of which are at least partially in the planning area). Firgrove Mutual’s infrastructure also includes five storage facilities,46 seven pump stations (only one, at the Prairie Ridge intertie, is located within the planning area), and a distribution system with approximately 205 miles of 2- to 48-inch water mains.
Tacoma Connells
Winchester Heights
Tapps Island Water
Abbreviations: GPM = gallons per minute, NL = not listed.
Source: RH2, 2020.
only, manual operation
only, manual operation
only, manual operation
45 The water source locations are all within the Bonney Lake city limits, often in small parcels not contiguous with the main part of the city. They are, therefore, not in the planning area though they may be surrounded by unincorporated lands.
46 Like the water source locations, the storage facilities are all located on small non-contiguous parcels within the city limits and, therefore, not in the planning area.
Exhibit 195. City of Bonney Lake—Current Facilities Inventory in Unincorporated Pierce County, 2023
Project Summary
Recent and Ongoing Major Accomplishments
• Emergency Power Generator Grainger Springs, Source, $75,000
• SCADA and Telemetry System Upgrades, System Wide, $300,000
• Water System Rate Analysis, System Wide, $100,000
Non-Capital Alternatives
On-going maintenance projects, water quality education, and conservation programs are in place to maximize the efficiency of water supply management and delivery to customers.
Capital Projects
Water systems are required by WAC Chapter 246-290 to develop and implement a capital improvement plan (CIP) The current CIP includes improvements to transmission and storage components of the water system including the following:
• Lakeridge 748 Zone Water Reservoir, 2024, $2,660,000
• Pump Replacement Program, 2025, $50,000
• Victor Falls Upgrades, 2025, $1,000,000
• Interlake Island/Inlet Lake Bed Crossing Water Main Replac, 2025, $500,000
• 192nd Water Main Replacement, 2025, $560,000
• 12" Water Main Replacement Myers Road to City Limits, 2025, $800,000
• 16" Replacement Sumner Buckley Highway, 2026, $1,020,000
The County will continue to coordinate with the City of Bonney Lake on future capital planning efforts for water service.
Fruitland Mutual Water Company
Overview and Inventory
Fruitland Mutual’s service area is roughly half in and half out of the planning area. It is located generally southwest of the City of Puyallup, adjacent to Summit Water to the west and Firgrove Mutual to the south (Exhibit 186). Based on WDOH (2023) records, it is estimated that the system serves an estimated population of about 8,000 people within unincorporated Pierce County.
The water system plan for Fruitland Mutual was not available for review. However, WDOH records indicate Fruitland Mutual provides water sourced from five active wells and an intertie; one well and the intertie are within the planning area (Exhibit 196). The intertie provides seasonal supply, and the wells provide primary supplies. Without a water system plan to review, the number of pressure zones, storage facilities, pump stations, and miles of distribution line could not be determined.
Abbreviations: FT = feet, GPM = gallons per minute.
Source: WDOH, 2023.
Project Summary
Non-Capital Alternatives
On-going maintenance projects, water quality education, and conservation programs are in place to maximize the efficiency of water supply management and delivery to customers.
Capital Projects
Water systems are required by WAC Chapter 246-290 to develop and implement a capital improvement plan (CIP) The current CIP was not available for review. However, these plans usually include improvements to supply, transmission, and/or storage components of the water system. The County will continue to coordinate with Fruitland Mutual Water Company on future capital planning efforts for water service.
Exhibit 196. Fruitland Mutual Water Company Current Facilities Inventory in Unincorporated Pierce County, 2023
Peacock
Hill
Overview and Inventory
The Peacock Hill service area is on the Gig Harbor Peninsula, generally north and east of the City of Gig Harbor (Exhibit 186). Approximately 90 percent of the service area is located in the unincorporated County. Based on WDOH (2023) records, the water system serves about 7,400 people in the planning area.
The water system plan for Peacock Hill was not available for review, but WDOH records indicate the water system’s sources include 30 active wells and one intertie (Exhibit 197). The intertie is for emergency use, as are three of the wells. Without a water system plan to review, the number of pressure zones, storage facilities, pump stations, and miles of distribution line could not be determined.
Exhibit 197. Peacock Hill—Current Facilities Inventory in Unincorporated Pierce County, 2023 Facility
Abbreviations: FT = feet, GPM = gallons per minute.
Source: WDOH, 2023.
Project Summary
Non-Capital Alternatives
On-going maintenance projects, water quality education, and conservation programs are in place to maximize the efficiency of water supply management and delivery to customers.
Capital Projects
Water systems are required by WAC Chapter 246-290 to develop and implement a capital improvement plan (CIP). The current CIP was not available for review. However, these plans usually include improvements to supply, transmission, and/or storage components of the water system. The County will continue to coordinate with Peacock Hill on future capital planning efforts for water service.
Artondale Water
Overview and Inventory
The Artondale Water service area is entirely in unincorporated Pierce County, located at the southern end of the Gig Harbor Peninsula, generally west of Wollochet Bay (Exhibit 186). The water system serves a population of approximately 5,000 (WDOH, 2023).
The water system plan for Artondale Water was not available for review. WDOH records indicate the water system provides water from 16 active wells (Exhibit 198), six of which are for emergency use only. Without a water system plan to review, the number of pressure zones, storage facilities, pump stations, and miles of distribution line could not be determined.
198. Artondale Water—Current Facilities Inventory in Unincorporated Pierce County, 2023
Abbreviations: FT = feet, GPM = gallons per minute. Source: WDOH, 2023.
Project Summary
Non-Capital Alternatives
On-going maintenance projects, water quality education, and conservation programs are in place to maximize the efficiency of water supply management and delivery to customers.
Exhibit
Capital Projects
Water systems are required by WAC Chapter 246-290 to develop and implement a capital improvement plan (CIP) The current CIP was not available for review. However, these plans usually include improvements to supply, transmission, and/or storage components of the water system The County will continue to coordinate with Artondale Water on future capital planning efforts for water service.
City of Puyallup
Overview and Inventory
The City of Puyallup water service area extends slightly into unincorporated Pierce County along its western, northeastern, and southern boundaries, such that perhaps 10 to 20 percent of the it is in the planning area (Exhibit 186). Based on WDOH (2023) records, it is estimated the water system serves about 3,600 people in the planning area.
The water system plan (Gray & Osborne, 2019) indicated the City of Puyallup provides water from two springs, four active wells (WDOH records indicate five active wells), and an intertie (see Exhibit 199). The primary sources of supply are Salmon Springs and Maplewood Springs and none of the sources appear to be located in unincorporated Pierce County. The intertie is with Tacoma Water. The water system operated in four pressure zones. Other infrastructure operated by the City of Puyallup includes 9 storage tanks (Exhibit 199), 18 pressure reducing valves, 8 booster stations, and 195 miles of transmission pipes ranging in diameter from 2 to 24 inches (Gray & Osborne, 2019).
City of Puyallup WSP (Table 1-2, Table 1-3, Table 1-5),
Exhibit 199. City of Puyallup Current Facilities Inventory in Unincorporated Pierce County, 2023
Project Summary
Non-Capital Alternatives
On-going maintenance projects, water quality education, and conservation programs are in place to maximize the efficiency of water supply management and delivery to customers.
Capital Projects
Water systems are required by WAC Chapter 246-290 to develop and implement a capital improvement plan (CIP). The City of Puyallup identified approximately $14,765,000 of capital projects from 2024-2027 (in 2018$) in their 2019 CIP. See Exhibit 200 Additional system improvements planned beyond 2027 include new water mains and replacements as well as recoating and seismic retrofits at various reservoirs. The County will continue to coordinate with the City of Puyallup on future capital planning efforts for water service.
Exhibit 200. City of Puyallup Capital Improvement Project Summary, 2024-2027
Note: All costs in 2018$ assuming a 1.8% inflation rate. Costs marked TBD to be determined during project development. Source: City of Puyallup WSP (Table 8-1 and Table 8-2), 2019.
Lakewood Water District
Overview and Inventory
Lakewood Water District serves the Lakewood area of Pierce County and, as of 2018, served approximately 16,942 service connections via 265 miles of water main. Most of the District’s service area is incorporated, except for a small portion near Steilacoom. This unincorporated area makes up an estimated 5% of the total service area (Exhibit 186). Based on WDOH (2023) records, it is estimated the water system serves a population of about 3,000 in unincorporated Pierce County. The water system plan (Murraysmith, 2019) indicated Lakewood Water provides water from 30 active wells (WDOH records indicate 36 active wells) and 3 normally operated interties (Exhibit 201). None of the sources or interties appear to be located in unincorporated Pierce County. The interties are with the Town of Steilacoom and Summit Water and Supply Company The water system operated in six pressure zones. Other infrastructure operated by Lakewood Water includes 13 active storage tanks (Exhibit 201), 12 pump stations, 6 pressure reducing stations, and approximately 266 miles of transmission pipes ranging in diameter from less than 2 inches to 20 inches (Murraysmith, 2019).
Exhibit 201. Lakewood Water Current Facilities Inventory in Unincorporated Pierce County, 2023 Facility
Abbreviations: FT = feet, GPM = gallons per minute, MG = millions of gallons, MGD = million gallons per day, NL = not listed, WSP = water system plan.
a Depths and capacities as listed in the water system plan; values listed by WDOH may vary.
Sources: Lakewood Water WSP (Table 2-2 and Tabel 2-4), 2019; WDOH, 2023.
Project Summary
Recent and Ongoing Major Accomplishments
• Constructed approximately 91,000 linear feet of water main
• Constructed approximately 200 linear feet of 12-inch transmission main in Gravelly Lake Drive.
• Abandoned approximately 5,100 linear of aging, undersized main.
• Constructed approximately 1,200 linear feet of 12-inch transmission main in Pacific Hwy.
• Constructed approximately 4,300 linear feet of 12- and 16-inch transmission main in Pacific Hwy and S Tacoma Way, and abandoned approximately 2,300 linear of aging, undersized main.
• Constructed approximately 3,800 linear feet of 16-inch transmission main in Steilacoom Blvd.
• Constructed approximately 500 linear feet of 12-inch transmission main I-5/Seattle Street
Non-Capital Alternatives
On-going maintenance projects, water quality education, and conservation programs are in place to maximize the efficiency of water supply management and delivery to customers.
Capital Projects
Water systems are required by WAC Chapter 246-290 to develop and implement a capital improvement plan (CIP). Lakewood Water identifies the following capital projects from 2024-2039 in their 2019 CIP:
• Fire flow improvements to water mains (2024-2039).
• Transmission main improvements at various locations (2024-2029 and 2030-2039).
• Storage tank maintenance and coating (2024, 2027-2029, and 2030-2039) and seismic retrofits (2024 and 2027-2029).
• Replace 88th St & Pine Tank (2025-2026)
• Replace Farwest Drive Tank (2030-2039)
• Replace 88th St & Pine Pump Station (2026)
• Well rehabilitation and maintenance (2024-2029 and 2030-2039), drilling 11 new wells/replacing 8 failed wells (2025-2027, 2029, and 2030-2039), and well treatment and 3 new and 2 existing wells (2024, 2026, 2028, and 2030-2039)
• Other miscellaneous improvements, such as operation and control adjustments, Water Wise Usage Program and Leak Detection, and updating the Comprehensive Water System Plan every 6-10 years (2024-2029 and 2030-2039)
In addition to cash financing, Lakewood Water uses general facilities charges, government grants and bonds, and bond financing to pay for capital improvements. The County will continue to coordinate with Lakewood Water District on future capital planning efforts for water service.
Minterbrook
Overview and Inventory
Minterbrook serves a portion of Key Peninsula west of Purdy. Its service is entirely in unincorporated Pierce County (Exhibit 186). The water system serves a population of approximately 3,600 people (WDOH 2023).
The water system plan for Minterbrook was not available for review. WDOH records indicate the water system provides water from 15 active wells (Exhibit 202), 1of which is for emergency use only. Without a water system plan to review, the number of pressure zones, storage facilities, pump stations, and miles of distribution line could not be determined.
Exhibit 202. Minterbrook—Current Facilities Inventory in Unincorporated Pierce County, 2023
Abbreviations: FT = feet, GPM = gallons per minute, NL = not listed. Source: WDOH, 2023.
Project Summary
Non-Capital Alternatives
On-going maintenance projects, water quality education, and conservation programs are in place to maximize the efficiency of water supply management and delivery to customers.
Capital Projects
Water systems are required by WAC Chapter 246-290 to develop and implement a capital improvement plan (CIP) The current CIP was not available for review. However, these plans usually include improvements to supply, transmission, and/or storage components of the water system The County will continue to coordinate with Minterbrook on future capital planning efforts for water service.
Fox Island Mutual Water
Overview and Inventory
All of Fox Island except for its southern tip make up the service area for Fox Island Mutual Water (Exhibit 186). WDOE records indicate Fox Island Mutual Water serves a population of approximately 3,200 people (WDOH, 2023).
The water system plan (Anchor QEA, 2017) indicated Fox Island Mutual Water provides water from eight active wells in Zone I (WDOH records indicate 14 active wells) (see Exhibit 203). Other infrastructure operated by Fox Island Mutual Water includes six active reservoirs (four in Zone I and two in Zone II, see Exhibit 203), four booster stations, and 6- to 8-inch distribution mains (Anchor QEA, 2017).
Abbreviations: FT = feet, GPM = gallons per minute, NL = not listed
Source: Fox Island Mutual Water Association WSP, 2017 (Table 1-2, Table 1-3), WDOH, 2023.
Exhibit 203. Fox Island Mutual Water
in Unincorporated Pierce County (2023)
Project Summary
Non-Capital Alternatives
On-going maintenance projects, water quality education, and conservation programs are in place to maximize the efficiency of water supply management and delivery to customers.
Capital Projects
Water systems are required by WAC Chapter 246-290 to develop and implement a capital improvement plan (CIP). Fox Island Mutual Water identifies approximately $159,299 of capital expenditures from 2024-2026 in their 10-year operating budget (2017-2026), including $19,200 for connections, $33,011 for pumps and tanks, and $107,088 for watermains. This would include returning the Kamus Reservoir to service (assumed in 2025) and additional pumping capacity for Zone II North (assumed in 2026). The County will continue to coordinate with Fox Island Mutual Water on future capital planning efforts for water service.
Point Evans
Overview and Inventory
The Point Evans water system is located on the southern end of the Gig Harbor Peninsula adjacent to the Tacoma Narrows (Exhibit 186). The entire service area, except for an estimated 30 acres, is within the planning area. Department of Health records indicate the Point Evans system serves a population of approximately 3,400 people (WDOH, 2023), almost all of which live in the planning area.
The water system plan for Point Evans was not available for review. WDOH records indicate the water system provides water from eight active wells, six of which are in the planning area (Exhibit 204). All the wells are listed as primary supply wells (WDOH, 2023). Without a water system plan to review, the number of pressure zones, storage facilities, pump stations, and miles of distribution line could not be determined.
204. Point Evans—Current Facilities Inventory in Unincorporated Pierce County, 2023
Abbreviations: FT = feet, GPM = gallons per minute Source: WDOH, 2023.
Project Summary
Non-Capital Alternatives
On-going maintenance projects, water quality education, and conservation programs are in place to maximize the efficiency of water supply management and delivery to customers.
Capital Projects
Water systems are required by WAC Chapter 246-290 to develop and implement a capital improvement plan (CIP). The current CIP was not available for review. However, these plans usually include improvements to supply, transmission, and/or storage components of the water system The County will continue to coordinate with Point Evans on future capital planning efforts for water service.
Exhibit
Capital Project Summary: County Provided Facilities and Services
Exhibit 205 shows consolidated 6-year and 20-year planned capital costs by facility/service category for County provided facilities and services, particularly projects planned for the 20302044 timeframe and for external service providers. As a result, estimated capital costs for the 20year planning period may not represent the full costs of future projects, and additional capital planning efforts will be necessary over the coming years.
Exhibit 205. Total Estimated Capital Project Costs by Category, County Provided
*Capital projects to support the District and Superior Court are included under General Administration Buildings Sources: Pierce County Finance Department, 2024; Fehr & Peers, 2024; BERK, 2024
Appendix A References
General
King County. 2021. Countywide Planning Policies. Amended 2023 per Growth Management Planning Council Motion 23-1). https://kingcounty.gov/en/legacy/depts/executive/performancestrategy-budget/regional-planning/cpps.
OFM (Washington State Office of Financial Management). 2023. April 1 official population estimates. https://ofm.wa.gov/washington-data-research/population-demographics/populationestimates/april-1-official-population-estimates
Pierce County Assessor. 2023. “Assessor-Treasurer Information Portal.” https://atip.piercecountywa.gov/app/v2/parcelSearch/search.
Pierce County. 2021. 2022-2023 Capital Facilities Plan. Adopted December 1, 2021 via Ordinance No. 2021-110s3. https://www.piercecountywa.gov/363/Capital-Facilities-Plan.
Pierce County. 2021. Comprehensive Plan: Honor the Past, Look Ahead. Effective October 1, 2021. https://www.piercecountywa.gov/950/Comprehensive-Plan.
Pierce County. 2022. Countywide Planning Policies. Adopted May 17, 2022. https://www.piercecountywa.gov/DocumentCenter/View/92170.
Pierce County. 2023. 2024-2025 Biennial Budget, 2024-2029 Capital Facilities Plan. https://www.piercecountywa.gov/363/Capital-Facilities-Plan
Pierce County. 2023. Countywide Planning Policies Appendix A: Adopted 2044 Population/Housing/Employment for Pierce County and its Cities and Towns. Adopted July 2022 with revised housing targets adopted June 2023. https://www.piercecountywa.gov/DocumentCenter/View/23902/Appendix-A-CPPs.
Pierce County. 2023. Pierce County Code. Current through Ordinance 2023-11s, passed May 2, 2023. https://pierce.county.codes/.
Washington State Legislature. 2023. Revised Code of Washington. https://apps.leg.wa.gov/rcw/.
Washington State Legislature. 2023. Washington Administrative Code. https://apps.leg.wa.gov/wac/.
General Administration Buildings
Pierce County. 2017. Facilities Management Deferred Maintenance Prioritization. https://www.piercecountywa.gov/DocumentCenter/View/112767/FM-DeferredMaintenance-Prioritization-2017.
Pierce County. 2023. “Parks & Facilities.” https://www.piercecountywa.gov/Facilities?clear=True. Law Enforcement and Corrections
Pierce County. 2023. “Courts & Law.” https://www.piercecountywa.gov/242/Courts-Law.
Washington Association of Sheriffs and Police Chiefs. 2023. 1980-2022 Full-Time Law Enforcement Employees. https://www.waspc.org/cjis-statistics reports.
Washington Courts. 2023. “Washington State Court Directory: Pierce County.” https://www.courts.wa.gov/court_dir/orgs/286.html.
Transportation
Nichols Brother Boat Builders. 2023. “Christine Anderson.” https://www.nicholsboats.com/portfolio/project/christine-anderson
Nichols Brother Boat Builders. 2023. “Steilacoom II.” https://www.nicholsboats.com/portfolio/project/steilacoom-ii.
Pierce County. 2016. Tacoma Narrows Airport Master Plan. https://www.piercecountywa.gov/7216/Tacoma-Narrows-Airport-Master-Plan.
Pierce County. 2018. Pierce County Traffic Impact Fee Program – Rate Study, Appendix D. https://www.piercecountywa.gov/1740/Traffic-Impact-Fees.
Pierce County. 2020. Thun Field Airport Master Plan. https://www.piercecountywa.gov/plumasterplan#:~:text=Pierce%20County%20initiated%20 the%20Pierce,Field%20to%20accommodate%20community%20growth
Pierce County. 2023. “GIS-Mo database.” https://gisdatapiercecowa.opendata.arcgis.com/search?collection=Dataset&q=Roads%2Frails&source=pie rce%20county%20planning%20%26%20public%20works%20%20traffic%20division%2Cpierce%20county%20planning%20%26%20public%20works%20%20traffic%20division%20.
Pierce County. 2023. 2024-2029 Transportation Improvement Program and Fourteen-Year Ferry Program. https://www.piercecountywa.gov/2977/Transportation-Improvement-Program
Parks and Recreation
Andreson Island Park & Recreation District. 2023. “About the Park District.” Accessed November 2023. https://andersonislandparks.org/about-the-park-district.
Andreson Island Park & Recreation District. 2023. “The Parks.” Accessed November 2023. https://andersonislandparks.org/parks-overview.
Key Pen Parks. 2020. Comprehensive Parks & Recreation Plan. Accessed November 2023. https://www.keypenparks.com/uploads/4/5/0/8/45082793/keypen_cprp_final.pdf.
Key Pen Parks. 2023. “A History of Key Pen Parks.” Accessed November 2023. https://www.keypenparks.com/history.html.
Metro Parks Tacoma. 2018. Strategic Plan. Accessed March 2023. https://www.metroparkstacoma.org/about/agency-plans-partnerships/strategic-plan/.
Metro Parks Tacoma. 2022. 2023-2024 Biennium Operating & Capital Budget. Accessed November 2023. https://www.metroparkstacoma.org/about/budget-funding/.
Metro Parks Tacoma. 2023. “Capital Projects.” Accessed November 2023. https://www.metroparkstacoma.org/about/capital-projects/.
Metro Parks Tacoma. 2023. “Our History.” Accessed November 2023. https://www.metroparkstacoma.org/about/history-of-metro-parks/.
Metro Parks Tacoma. 2023. 2022 Community Impact Report. Accessed November 2023. https://www.metroparkstacoma.org/about/.
PenMet Parks. 2023. “Current Projects.” Accessed November 2023. https://penmetparks.org/current-projects/.
PenMet Parks. 2023. “History: Then and Now.” Accessed November 2023. https://penmetparks.org/history/.
PenMet Parks. 2023. PenMet Parks Strategic Plan: 2023-2027. Accessed November 2023. https://penmetparks.org/penmet-parks-strategic-plan/.
PenMet Parks. 2023. Proposed 2024 Budget (November 2023). Accessed November 2023. https://penmetparks.org/category/financial-planning-and-reports/.
Pierce County Parks. 2020. Parks, Recreation, & Open Space Plan 2020-2030. Adopted February 11, 2020. https://www.piercecountywa.gov/1488/Park-Recreation-Open-Space-Plan.
Pierce County Parks. 2023. “Projects & Plans.” https://www.piercecountywa.gov/5340/ProjectsPlans.
Pierce County. 2023. “Conservation Futures Program.” Accessed March 2023. https://www.piercecountywa.gov/1477/Conservation-Futures-Program
Pierce County. 2023. Pierce County Code Tilte 4A: Impact Fees. Adopted via Ordinance 2023-51, passed November 14, 2023, effective February 1, 2024.
Sewer
Pierce County. 2010. Unified Sewer Plan. https://www.piercecountywa.gov/3108/Unified-SewerPlan-Update
Pierce County. 2021. Unified Sewer Plan (USP) Update: Envisioning our Future Sewer System. January 2021. https://www.piercecountywa.gov/DocumentCenter/View/99794/Unified-Sewer-PlanUpdate-Envisioning-our-Future-Sewer-System.
Pierce County. 2023. 2024-2044 Sewer Improvement Program. Adopted via Ordinance No. 2023-54. https://www.piercecountywa.gov/1681/Plans-Reports-Publications.
Solid Waste
City of Tacoma and Pierce County. 2021. Tacoma-Pierce County Solid and Hazardous Waste Management Plan: 2021-2040 https://www.piercecountywa.gov/1585/Plans-andAgreements.
Pierce County and LRI. 2008. 2008 Pierce County – PCRCD dba LRI Waste Handling Agreement. https://www.piercecountywa.gov/1585/Plans-and-Agreements.
Surface Water
Pierce County. 2023. 2024-2029 Surface Water Improvement Program. Adopted via Ordinance No. 2023-60s
Pierce County. 2023 Comprehensive Flood Hazard Management Plan. https://www.piercecountywa.gov/7037/2023-Comprehensive-Flood-Hazard-Manageme.
Fire/Emergency Medical Services
Anderson Island Fire and Rescue (PCFD #27). “Levy Lid Lifts.” https://www.andersonislandfire.org/about-4.
Anderson Island Fire and Rescue (PCFD #27). 2023. “About Us.” https://www.andersonislandfire.org/about.
Anderson Island Fire and Rescue (PCFD #27). 2023. “Home.” https://www.andersonislandfire.org/.
Ashford Fire (PCFD #23). 2023. “Response Details.” https://www.pcfd23.org/responseDetails.php.
Browns Point Fire (PCFD #13). 2020. 2019 Annual Report. https://www.pcfd13.org/reports.php.
Browns Point Fire (PCFD #13). 2021. 2020 Annual Report. https://www.pcfd13.org/reports.php.
Browns Point Fire (PCFD #13). 2022. 2021 Annual Report. https://www.pcfd13.org/reports.php.
Browns Point Fire (PCFD #13). 2023. “Stations.” https://www.pcfd13.org/locations.php.
Browns Point Fire (PCFD #13). January 2020. Capital Facilities Plan. https://www.pcfd13.org/plans.php
Central Pierce Fire & Rescue (PCFD #6). 2020. 2019 Annual Report. https://www.centralpiercefire.org/about-us/annual-reports/.
Central Pierce Fire & Rescue (PCFD #6). 2021. 2020 Annual Report. https://www.centralpiercefire.org/about-us/annual-reports/.
Central Pierce Fire & Rescue (PCFD #6). 2022. 2021 Annual Report. https://www.centralpiercefire.org/about-us/annual-reports/.
Central Pierce Fire & Rescue (PCFD #6). 2023. “Fire Stations.” https://www.centralpiercefire.org/fire-stations/
Central Pierce Fire & Rescue (PCFD #6). January 2020. Capital Facilities Plan. https://www.centralpiercefire.org/help-center/capital-facility-plan/
City of Tacoma. 2021. 2021-2026 Capital Facilities Program. https://www.cityoftacoma.org/government/city_departments/planning_and_development_s ervices/planning_services/capital_facilities_programming#:~:text=What%20is%20the%20Ca pital%20Facilities,the%20One%20Tacoma%20Comprehensive%20Plan
East Pierce Fire & Rescue (PCFD #22). 2018. Capital Facilities Plan. https://www.eastpiercefire.org/about/.
East Pierce Fire & Rescue (PCFD #22). 2020. 2019 Annual Reports. https://www.eastpiercefire.org/resource/annual-reports/.
East Pierce Fire & Rescue (PCFD #22). 2021. 2020 Annual Reports https://www.eastpiercefire.org/resource/annual-reports/.
East Pierce Fire & Rescue (PCFD #22). 2022. 2021 Annual Reports. https://www.eastpiercefire.org/resource/annual-reports/.
East Pierce Fire & Rescue (PCFD #22). 2023. “Fire Stations.” https://www.eastpiercefire.org/firestations/
East Pierce Fire & Rescue (PCFD #22). 2023. 2022 Annual Reports. https://www.eastpiercefire.org/resource/annual-reports/.
East Pierce Fire & Rescue (PCFD #22). January 2023. Community Risk Assessment: Standards of Cover. https://www.eastpiercefire.org/about/.
Gig Harbor Fire and Medic One (PCFD #5). 2023. “Station Locations.” https://www.gigharborfire.org/about/station-locations/
Gig Harbor Fire and Medic One (PCFD #5). 2023. 2022 Annual Performance Report. https://www.gigharborfire.org/about/documents-resources/.
Graham Fire and Rescue (PCFD #21). 2021. Standard of Cover Study. https://grahamfire.org/standard-of-cover-study/
Graham Fire and Rescue (PCFD #21). 2023. “Historic Call Volumes.”. https://grahamfire.org/callvolumes/.
Graham Fire and Rescue (PCFD #21). 2023. “Stations.” https://grahamfire.org/fire-stations/.
Key Peninsula Fire Department (PCFD #16). 2023. “Stations.” https://www.keypeninsulafire.org/operations
Key Peninsula Fire Department (PCFD #16). 2023. 2022 Annual Report https://www.keypeninsulafire.org/.
Orting Valley Fire and Rescue (PCFD #18). 2023. “Chief’s Message.” http://www.ovfr.org/read-me.
Orting Valley Fire and Rescue (PCFD #18). 2023. “Fire Stations.” http://www.ovfr.org/projects.
Riverside Fire & Rescue (PCFD #14). “About Riverside Fire & Rescue.” https://piercefire14.org/about/.
South Pierce Fire & Rescue (PCFD #17). 2023. “Station Information.” https://spfr.org/stationinformation/.
South Pierce Fire & Rescue (PCFD #17). August 2019. Strategic Plan. https://spfr.org/wpcontent/uploads/2019/10/spfr-strategic-plan-8-02-19.pdf.
Tacoma Fire Department. 2023. 2022 Annual Report. https://www.cityoftacoma.org/government/city_departments/fire/About/annual_report.
Wernet, Todd. May 2023. Personal email communication with Chief Wernet.
West Pierce Fire & Rescue (PCFD #3). 2019. 2020-2025 Strategic Plan. https://www.westpierce.org/publications/.
West Pierce Fire & Rescue (PCFD #3). 2020. 2019 Annual Report. https://www.westpierce.org/annual-report/.
West Pierce Fire & Rescue (PCFD #3). 2021. 2020 Annual Report. https://www.westpierce.org/annual-report/.
West Pierce Fire & Rescue (PCFD #3). 2022. 2021 Annual Report. https://www.westpierce.org/annual-report/
West Pierce Fire & Rescue (PCFD #3). 2023. “About.” https://www.westpierce.org/about/
West Pierce Fire & Rescue (PCFD #3). 2023. “Station Locations.” https://www.westpierce.org/locations/
West Pierce Fire & Rescue (PCFD #3). 2023. 2022 Annual Report. https://www.westpierce.org/annual-report/.
Public Transit
Amtrak. 2021. Amtrak Connects Us. https://media.amtrak.com/amtrak-connects-us/.
Intercity Transit. 2018. Short and Long Range Plan. https://www.intercitytransit.com/aboutus/publications/Short-%20and%20Long-Range%20Plans
Intercity Transit. 2024. 2025-28 Transportation Improvement Program. https://www.intercitytransit.com/about-us/publications/Transit%20Improvement%20Plan
Pierce Transit. 2020. Destination 2040 Long Range Plan Update https://www.piercetransit.org/longrangeplans/.
Pierce Transit. 2023. 2024-2029 Transit Development Plan. https://www.piercetransit.org/documents/.
Pierce Transit. 2024. Destination 2045 Long Range Plan Fact Sheet. https://www.piercetransit.org/longrangeplans/.
Sound Transit. 2014. Regional Transit Long-Range Plan. https://www.soundtransit.org/sites/default/files/documents/2015123_lrpupdate.pdf.
Sound Transit. 2023. Transit Development Plan 2024-2029. https://www.soundtransit.org/sites/default/files/documents/sound-transit-transitdevelopment-plan-20242029.pdf.
Sound Transit. FY24-29 Five Year Service and Asset Line Plans,
USDOT Federal Railroad Administration. 2024. Meeting Series 4 Presentation: Conceptual Long Distance Expansion Plan. Part of the Long-Distance Service Study. https://fralongdistancerailstudy.org/meeting-materials/
Pierce County Library System
Pierce County. 2023. 2024-2025 Biennial Budget, 2024-2029 Capital Facilities Plan. https://www.piercecountywa.gov/363/Capital-Facilities-Plan.Pierce County Library System
Pierce County Library System (PCLS). 2010, amended 2017. Pierce County Library 2030: Facilities Master Plan.” https://www.piercecountylibrary.org/about-us/pierce-countylibrary/Default.htm.
Pierce County Library System (PCLS). 2023. “Lakewood Library.” https://mypcls.org/lakewoodpierce-county-library/.
Pierce County Library System (PCLS). 2023. “Sumner Library.” https://mypcls.org/sumner-piercecounty-library/.
Schools
Bethel School District. 2023. Capital Facilities Plan, 20231-20286. Adopted October 2023.
Carbonado Historical School District. Capital Facilities Plan, 2022-2028. Adopted July 18, 2022.
Clover Park School District. 2021. 2020 Facility Condition Assessment.
Dieringer School District. 2021. Long Range Facility Plan.
Eatonville School District. 2022. Capital Facilities Plan, 2022-2027. Adopted November 2022.
Five School District. 2022. Capital Facilities Plan, 2022-2028. Adopted August 29, 2022.
Franklin Pierce School District. 2022. Capital Facilities Plan, 2022-2028. Adopted November 2022.
Jorgensen, Joshua (Strategic Operations). 2023. 2023. Personal Communication (email with attachment) regarding school size, capacity, and class size. Tacoma Public Schools.
OFM (Washington State Office of Financial Management). 2022. Small Area Estimate Program https://ofm.wa.gov/washington-data-research/population-demographics/populationestimates/small-area-estimates-program.
Orting School District. 2022. Capital Facilities Plan, 2022-2028. Adopted June 2, 2022.
Orting School District. 2023. “Bond Overview.” Accessed March 2023. https://www.ortingschools.org/Page/855.
OSPI (Office of the Superintendent of Public Instruction). 2022 and 2023. “Washington State Report Card.” Accessed March – June 2023. https://washingtonstatereportcard.ospi.k12.wa.us/.
OSPI (Office of the Superintendent of Public Instruction). 2023. Preliminary School District Personnel Summary Reports 2022–23 School Year.” Updated February 7, 2023. Access March – June 2023. https://www.k12.wa.us/policy-funding/school-apportionment/schoolpublications/personnel-summary-reports.
Peninsula School District. 2022. Capital Facilities Plan, 2022-2028. Adopted August 2022.
Pierce County. 2023. Pierce County Code Section 4A.30.030: School Impact Fee Schedule. Adopted via Ordinance 2023-64s, passed November 14, 2023, effective December 8, 2023.
Puyallup School District. 2022. Capital Facilities Plan, 2022-2027. Adopted October 3, 2022.
Puyallup School District. 2023. Capital Facilities Plan, 2023-2028. Adopted September 18, 2023.
Steilacoom Historical School District No. 1. 2022. Capital Facilities Plan, 2023-2028. Adopted November 2022.
Sumner-Bonney Lake School District. 2021. Capital Facilities Plan, 2021-2027. Adopted October 2021.
Tacoma Public Schools. 2023. “Schools and Learning Sites.“ Accessed March – June 2023. https://tacomak12waus.finalsite.com/schools-and-learning-sites.
White River School District. 2018. Capital Facilities Plan, 2018-2024. Adopted July 2018.
Yelm Community Schools. 2022. Capital Facilities Plan, 2022-2027. Adopted September 22, 2022. Water
Anchor QEA, LLC. 2017. Fox Island Mutual Water Association Water System Plan: 2017 Update.
Apex Engineering. 2019. Water Sytem Plan Part B – Southwood Water System Plan.
BHC Consultants. 2020. Firgrove Mutual 2020 Water System Plan Update.
Gray & Osborne. 2019. City of Puyallup Water System Plan.
Gray & Osborne. 2020 Parkland Light and Water Water System Plan.
Murraysmith. 2019. Lakewood Water District Comprehensive Water Plan.
Pierce County. 2021. Coordinated Water System Plan and Regional Supplement, 2021 Update. https://www.piercecountywa.gov/951/Coordinated-Water-System-Planning.
RH2. 2020. City of Bonney Lake Water System Plan. https://www.ci.bonneylake.wa.us/government/departments/public_services/planning_building/comprehensive_pl an
Tacoma Public Utilities. 2018. Water System Plan. https://www.mytpu.org/wpcontent/uploads/tacoma-water-system1.pdf.
Washington State Department of Ecology (Ecology). 2023. Washington State Well Report Viewer. https://appswr.ecology.wa.gov/wellconstruction/map/WCLSWebMap/default.aspx.