13 minute read
Joseph Sukinik, Rosh Bharthi, Sarah Hemler, Kurt Beschorner
Relationship between center of pressure and contact region during gait: implications for shoe wear and slipping risk
Joseph Sukinik, Rosh Bharthi, Sarah Hemler, Kurt Beschorner
Human Movement and Balance Laboratory, Department of Bioengineering
Joseph Sukinik Joseph Sukinik is a senior bioengineering student originally from North Bethesda, Maryland. He is interested in biomechanics and medical device development. He hopes to attend medical school in the future.
Kurt Beschorner, Ph.D. Kurt Beschorner is an Associate Professor of Bioengineering at the University of Pittsburgh. He utilizes techniques in tribology, biomechanics and ergonomics to generate understanding and interventions for falling accidents.
Significance Statement
The shoe contact region is relevant to its friction and the shoe’s response to wear. This study aimed to determine if ground reaction forces could predict this region.
Category: Experimental Research
Keywords: COF, contact region, slip and fall accidents
Abstract
One of the leading sources of occupational injuries, and injuries among the elderly, are slip and fall accidents. These accidents are initiated by a low coefficient of friction (COF) between the shoes and floor. Flooring and footwear products that offer good friction can improve safety and yield a competitive advantage for companies. As shoes become worn, the tread blocks degrade, reducing their friction capability and increasing slip risk. However, wear is uneven, and some parts remain completely intact. This study focuses on generating a method to guide shoe tread design and reduce slip risk through prediction of the contact region with ground reaction forces. Using force plates and a frustrated total internal reflection (FTIR) device embedded in the floor, we generated ground reaction force data and shoe contact images to measure center of pressure (COP) and the contact region centroid, respectively. The contact region (from FTIR) and COP (from the force plate) was quantified during the moment of maximum friction requirements. Correlation analysis was performed. Mediolateral COP was shown to have a strong correlation with the mediolateral centroid (r = 0.933, p < 0.001), while the anteroposterior COP showed a weak correlation to the anteroposterior centroid (r = 0.397, p = 0.115). This study provides rationale that the COP can be used to predict the contact region in the mediolateral direction. Results from this study can be used to expand this analysis to consider additional types of shoes and generalize this method of determining wear location on any footwear.
1. Introduction
Slip and fall accidents are a serious problem that plagues both occupational environments and the lives of the elderly. In general, falls (which are commonly caused by slipping) are defined as “an event which results in a person coming to rest unintentionally on the ground or other lower level, not as a result of a major intrinsic event (such as stroke) or overwhelming hazard” [1]. In 2012 alone, the Liberty Mutual Workplace Safety Index showed that the cost of disabling injuries due to falls in the workplace is around $9.19 billion and accounts for approximately 15% of total injury costs in the US [2]. While falls typically yield worse outcomes for elderly patients, falls occur at similar rates regardless of age [3, 4, 5]. One of the leading causes of falls is slip, which can occur as treads begin to wear on the shoes. According to Courtney et al. approximately 40-50% of all fall-related injuries involved slipperiness [6]. Additionally, Berg et al. found that among the elderly, approximately 59% of falls were due to slipping, and approximately 5% resulted in fractures, while an additional 9% caused significant soft tissue damage [7]. Lastly, previous work has shown good linearity between predicted contact pressures from contact mechanics and measured contact pressure from FTIR [8]. Thus, previous research studies show the potential of this technique to measure mechanics and demonstrate the need for increased research into tread design.
Slipping risk is often the result of a reduced coefficient of friction (COF) between the shoe tread and the floor. This risk can be influenced by the condition of the floors (e.g., when wet after being mopped) or the shoes (e.g., worn tread on shoe outsoles). The contact region of shoe tread influences its friction performance [9, 10]. As the shoe tread becomes worn, their friction decreases, and slip risk increases [11]. However, understanding of shoe tread wear and its interaction with the individual is emerging. As such, footwear products that offer good and durable friction performance can improve safety and yield a competitive advantage for companies. To properly develop footwear that can provide good traction, the relationship between the biomechanics of gait and wear region must be determined. The goal of this project is to quantify whether the location of shoe tread contact can be predicted based on a person’s center of pressure during stance. This will be accomplished by attempting to correlate COP to the contact region at the point believed to contribute most to wear, the point where the required coefficient of friction (RCOF) occurs.
2. Materials and Methods
2.1 Data Acquisition
Seven participants (6 male, 1 female) were recruited to participate in the study, approved by the Institutional Review Board Protocol (University of Pittsburgh #19050285). Participants were instructed to wear a pair of slip resistant shoes (SR Max, Greensboro, NC) for an initial gait assessment and then in their workplace for one month at a time. Inclusion criteria included regularly wearing treaded shoes in the workplace, working on their feet for at least four hours in a typical day, having a BMI below 35, and no recent history of musculoskeletal injury in the last two years. For this study, an additional criterion for data collection is that participants have walked at least 100 km, measured via a pedometer, and guarantees adequate wear for visual comparison of contact region to wear region for an adjacent study. Participants provided informed consent prior to study participation. Participant demographics are stated in Table 1.
Age Height Weight Shoe Size Males Females
45.8 ± 12.3 years 26 ± 0.0 years
185.3 ± 10.0 cm 175 ± 0.0 cm
100.9 ± 8.3 kg 76.8 ± 0.0 kg
12.4 ± 1.7 Men’s US 7.5 ± 0.0 Men’s US
Table 1: Demographic data for participants involved in the study.
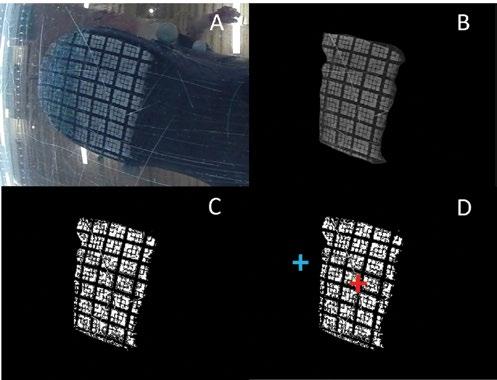
Each participant was instructed to walk across a walkway that was instrumented with a force plate to collect COP in the x- and y-directions and three-dimensional force data. They each completed five trials. They were also instructed to complete five trials of walking over a clear plexiglass plate that collected Frustrated Total Internal Reflection (FTIR) images to capture the contact region of the shoe tread (Figure 1). 2.2 Data Processing
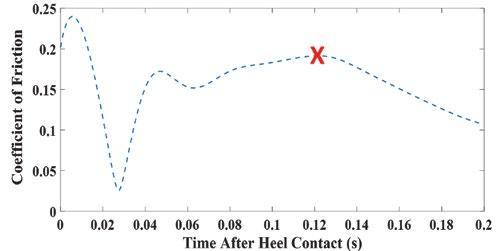
Data processing, image analysis, and statistical analysis was performed using custom code (MATLAB Version 2019a, Mathworks, Natwick, MA). Anteroposterior (AP) and mediolateral (ML) COP points were extracted from the force plate data at the time of RCOF since this is the time of the gait cycle believed to be most relevant to slipping [12] Both COP and centroid location were identified based on their relative location to the most posterior heel marker. Data was processed for the right and left shoes individually to avoid creating any confounding data with regards to differences in gait between the right and left legs. RCOF can be defined as the maximum friction point that halts forward motion and was calculated as the peak ratio of the vector sum of the shear forces to the normal force when other criteria were also met [11]. Only the first 200 ms after heel contact were considered in identifying the time of RCOF. Furthermore, only braking force that halts forward motion was considered [13], and the normal force needed to be greater than 100 N (Figure 2). Heel contact was defined as the point where the normal force first exceeded 10 N.
Figure 1: Procession of transforming an FTIR image into an analyzable image. (A) is the original image, (B) is the grayscale image isolated contact region, (C) is black and white converted image, and (D) is the final image with contact region centroid (red) marked relative to the posterior heel marker (blue). This demonstrates the method used to isolate contact region centroids.
2.3 Image Processing
The individual FTIR video frame at the time of RCOF was isolated, converted to grayscale, and the pixels were dichotomized into contact/non-contact states based on the brightness of the pixel. These pixels were selected to include the range of brightness in the illuminated tread blocks while attempting to exclude any pixels that might be associated with the non-contact region or any scratches on the plexiglass [14]. The contact region centroid was determined, and its center was calculated relative to the heel marker.

Figure 2: Plot depicts the ratio of friction to normal forces during 200ms following heel contact. RCOF is indicated by the red ‘X’ at local maximum and used for data processing. This forms the basis for which time points should be isolated and indicates other potential options, such as the peak around 50 ms.
2.4 Statistical Analysis
The relationship between the contact region center location and the COP was assessed using Pearson’s bivariate correlation analyses. One linear regression was performed comparing the ML location of the COP and the center of contact and another using the AP location. Centroids and COP values were averaged across trials for each participant-shoe. Only trials where the shoe was near the center of the image were included to minimize edge-distortion effects, meaning that 2-5 FTIR trials were averaged for each foot of each participant. An alpha value of 0.05 was used for the correlation.
3. Results
Data Type Direction Foot Mean (Standard Deviation) Minimum Maximum
COP AP R 86.4 (10.7) mm 69.2 mm 109.3 mm
L 83.8 (16.6) mm 60.6 mm 115.1 mm
ML R 15.7 (8.55) mm 0.3 mm 32.2 mm L -14.8 (8.24) mm -26.9 mm 1.2 mm
FTIR AP R 71.7 (16.7) mm 52.6 mm 93.74 mm
L 67.1 (15.8) mm 47.0 mm 93.9 mm
ML R 18.5 (5.5) mm 9.8 mm 27.2 mm
L -11.83 (8.2) mm -25.3 mm -1.9 mm
Table 2: Data collected from both FTIR and COP collection techniques prior to bivariate correlation.
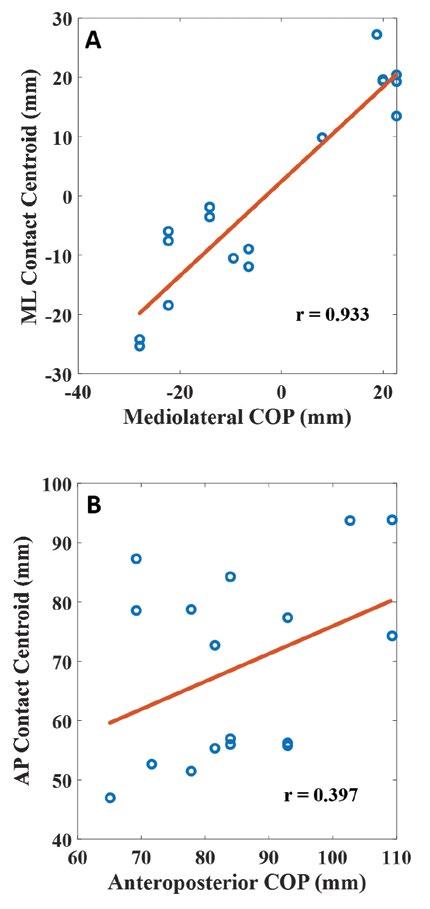
Descriptive statistics are presented as mean (standard deviation) and data maxima and minima, as depicted in Table 2. The ML locations between COP and center of contact were well correlated (r = 0.933, t15 = 10.1, p < 0.001) (Figure 3A). The AP correlation of the contact region centroid was not well correlated with the AP COP location at RCOF (r = 0.397, t15 = 1.7, p = 0.115) (Figure 3B), where the t subscript represents the degrees of freedom. Here, since we would expect the centroid values and COP values to be equivalent, as they both reference the same point (the heel marker), a slope close to one would indicate greater accuracy. The ML slope (0.796) is much closer to one than the AP slope (0.467). Thus, the AP COP is a poor predictor of the AP contact centroid while the ML COP is a much better predictor of the ML contact centroid.

Figure 3: COP vs Contact Region Centroid at the time of RCOF for the ML position (A) and the AP position (B). R-values are included in the bottom right corner of each plot to quantify fit.
4. Discussion
The results show that the ML contact region is better captured by the COP position than the AP component. This indicates that the COP in the ML direction may be more useful for predicting the contact location at the time of RCOF than its position in the AP direction. Most participants had a lateral COP and contact indicating that their feet were inverted at the time of RCOF.
A few limitations should be stated as to why the center of the FTIR images may be inconsistent with the center of pressure. First, due to the nature of the RCOF and the size of the camera lens, often the foremost portion of the tread was cropped out of the image. Thus, this region did not factor into the center of contact. Also, the center of contact from the FTIR images were not weighted by pressure on each tread. Force is differentially distributed across shoe tread, which contributes to center of pressure but not our calculation of center of area [15].
The contact region is defined as the portion of the shoe tread that is touching the ground at the specified time point. As such, we can assume that the contact region is also the same region that will eventually begin to wear away. This makes contact area a necessary component for predicting the wear region. As we could not find any previous literature to compare contact region during gait with center of pressure or contact region versus wear area, this study will form the basis for future work in predicting shoe tread wear locations and any improvements will be based off the limitations of this work. This study provides the rationale for expanding the use of FTIR to capture medial-lateral COP or to use COP to capture the medial-lateral center of the contact region. We aim to expand this analysis to consider additional types of slip-resistant and non-slip-resistant shoes to establish the generalizability of the results. We also intend to expand this method to consider other time points that may be relevant to slipping or the occurrence of wear.
5. Conclusion
Overall, the AP and ML COP locations were compared to the contact region centroid. While the ML COP locations were well correlated with the contact centroid (r = 0.933, p < 0.001), a similar relationship was not observed in the AP direction (r = 0.397, p = 0.115). A more comprehensive study is required in which we will assess numerous different time points for their ability to predict wear location as well as find a good time point that minimizes the risk for lens distortion in the AP direction. Based on these results, we believe that the COP can be used to estimate the ML contact region and presumably the ML location of tread wear. This may enable the use of COP in estimating the critical contact region of the shoe. In future work, we hope to accurately predict contact region and wear region over time. Wear prediction for footwear remains an emerging area and predictions from this paper may assist in when center of pressure may offer value in predicting contact region and subsequent wear locations.
6. Acknowledgements
We would like to thank the Swanson School of Engineering, the Office of the Provost at the University of Pittsburgh, and the National Institute for Occupational Safety and Health (R01OH010940) for providing the funding for this project.
7. References
[1] Tinetti ME, et al., Risk factors for falls among elderly persons living in the community. N Engl J Med. 1988 Dec 29; 319(26):1701-7. [2] Chang, Wen-Ruey et al. State of science: occupational slips, trips and falls on the same level. Ergonomics. 2016 vol. 59,7: 861-83. [3] Rubenstein LZ, et al. The epidemiology of falls and syncope. Clin Geriatr Med. 2002 May; 18(2):141-58. [4] Dionyssiotis Y, et al. Analyzing the problem of falls among older people. Int J Gen Med. 2012;5:805-813 [5] Lockhart TE, et al. Effects of aging on the biomechanics of slips and falls. Hum Factors. 2005;47(4):708729.
[6] Courtney, T. K., et al. “Occupational slip, trip, and fall-related injuries can the contribution of slipperiness be isolated?.” Ergonomics 44, no. 13 (2001): 1118-1137. [7] Berg, W. P., et al. “Circumstances and consequences of falls in independent community-dwelling older adults.” Age and ageing 26, no. 4 (1997): 261-268. [8] Sharp, J.S., et al., 2018. Optical measurement of contact forces using frustrated total internal reflection. Physical Review Applied, 10(3), p.034051. Appl. Ergon., 2001, 32, pp. 127-134 [9] Moghaddam, S. R. M., et al. (2018). Predictive multiscale computational model of shoe-floor coefficient of friction. Journal of biomechanics, 66, 145-152. [10] Iraqi, A., et al., 2020. Prediction of coefficient of friction based on footwear outsole features. Applied Ergonomics, 82, p.102963. [11] Sundaram, et al., Journal of Biomechanics, Vol. 105, pp. 109797. [12] Iraqi, A., et al., 2018. Coefficient of friction testing parameters influence the prediction of human slips. Applied ergonomics, 70, pp.118-126. [13] W. Chang, et al. The Effect of Transverse Shear Force on the Required Coefficient of Friction for Level Walking. Human Factors. Vol 53, No. 5, pp.461-473. 2011. [14] R. Bharthi, et al. Abstract: Correlation Between the Locations of Shoe Wear Region and Center of the Contact Region at Peak Friction. BMES National Conference. 2020. [15] Yamaguchi, T. Distribution of the local required coefficient of friction in the shoe–floor contact area during straight walking: A pilot study. Biotribology, 19, 100101. 2019.


