
1951 December 2022 Heimtextil 2023 / Annual Fact File 2022
Established
INTEX SOUTH ASIA 2022
Dates: December 8th to 10th 2022. Venue: New Delhi, India.
Index 2023
Dates: April 18th to 21st, 2023. Venue: Palexpo, Geneva, Switzerland.
IGATEX Pakistan 2023, Karachi
Dates: September 7st to 9th 2023.
Venue: Expo Centre, Karachi.
Techtextil 2023 North America

Dates: May 10th to 12th, 2023 Venue: Georgia USA.
ITME INDIA 2022

Dates: December 8th to 13th 2022. Venue: India Expo Centre & Mart. Noida, India.

DOMOTEX asiaCHINAFLOOR 2023

Dates: May 29th to 31st 2023. Venue: NECC, Shanghai, China. Heimtextil 2023, Frankfurt

Dates: January 10th, to 13th, 2023 Venue: Frankfurt am Main.
FESPA 2023

DOMOTEX Hannover 2023


Dates: January 12th to 15th 2023. Venue: Hannover, Germany.
Dates: May 23rd to 26th 2023. Venue: Munich, Germany.
iCADEX Pakistan 2023, Karachi
Dates: September 7st to 9th 2023. Venue: Expo Centre, Karachi.
Istanbul Yarn Fair
Dates: February 16th to 18th 2023. Venue: Istanbul, Turkey.
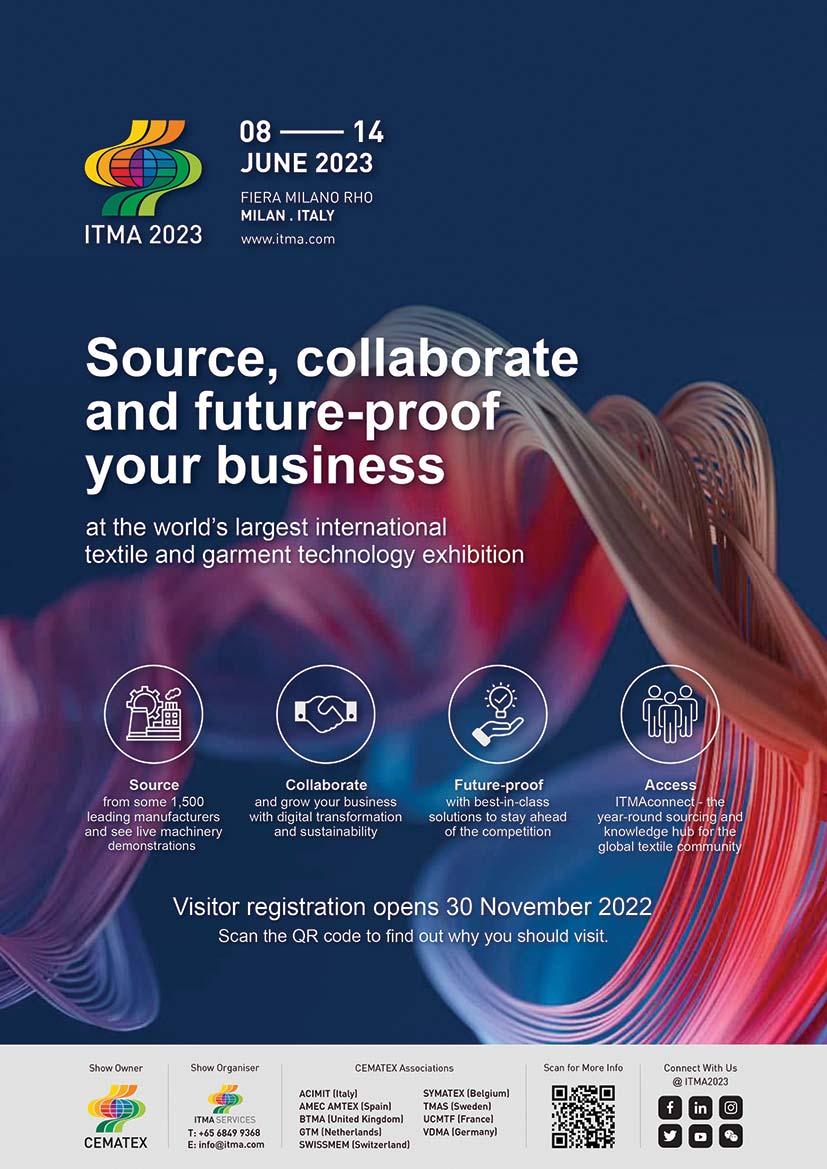
ITMA 2023
Dates: June 8th to 14th, 2023. Venue: Milan, Italy.
62th Dornbirn GFC Global Fiber Congress

Dates: September 13th to 15th 2023. Venue: Dornbirn Austria.
ITM 2024
Dates: June 4th to 8th, 2024. Venue: Istanbul, Turkey.
HIGHTEX 2024

Dates: June 4th to 8th, 2024. Venue: Istanbul, Turkey.
Textile Asia 2023, Karachi
Dates: March 11th to 13th 2023. Venue: Expo Centre, Karachi.
ITMA ASIA + CITME 2023
Dates: November 19th to 23rd, 2023. Venue: NECC, Shanghai, China.
JIAM 2024 OSAKA
Dates: Nov. 27th to Nov. 30th 2024. Venue: Osaka, Japan.
2 Calendar of Events
PAKISTAN TEXTILE JOURNAL - December 2022
Founded in 1951 by Mazhar Yusuf (1924-2009)
Publisher Nadeem Mazhar
Editor in Chief Amina Baqai
Associate Editor Nimrah Nadeem
Associate Editor
Shahnawaz Khan
Production Manager Mazhar Ali
Hony-Editorial Board


Dr. Hafizur Rehman Sheikh Ph.D (UK) F.T.I. (UK)
Syed Mahfooz Qutab C.TEX, F.T.I (U.K), B.Sc. Fellow I.C.T.T Atlanta, GA; (USA)
Mian Iftikhar Afzal B.S.N.C State, M.Sc. (Leeds) C.TEXT.F.T.I (UK)

Dr. Zubair Bandukda PhD (Textiles), CText ATI
Editorial & Advertising Office B-4, 2nd Floor, 64/21, M.A.C.H, Miran M. Shah Road, Karachi - Pakistan Tel: +92-21-34311674-5 Fax: +92-21-34533616 Email: info@ptj.com.pk URL: http://www.ptj.com.pk
PTJ Europe Ltd. Correspondence & Mailing address: 93 Fleming Place, Bracknell, RG12 2GN, United Kingdom Tel: +44 792 2228 721


Available on Gale and Factiva affiliated international databases through Asianet Pakistan

Printed at: Color Plus Korangi, Karachi.
Published by Nadeem Mazhar from D-16, K.D.A. Scheme No.1. Karachi.
Vol. LXXI No. 12 December 2022 Rs. 565.00
EDITOR’S PAGE . . . . . . . . . . . . . . . . . . . . . . . . . . .7


2022 was a year of uncertainty and full of challenges for the textile industry
TEXTILE BRIEFS . . . . . . . . . . . . . . . . . . . . . . . . . . .8

NEWS & VIEWS . . . . . . . . . . . . . . . . . . . . . . . . . .10

AROUND THE WORLD . . . . . . . . . . . . . . . . . . . . . .14
SPECIAL CORPORATE NEWS Archroma and Panatronix embark on close partnership towards eco-conscious denim cleaning . . . . . . . . . . . . . . . . . . . . . . . . . . . . . . . . . . . . . . . . . . . . .18 FEATURES The LYCRA Company introduces THERMOLITE® EVERYDAY WARMTH technology . . .20 Autoconer X6: Excellent splice quality with open prism technology . . . . . . . . . . .22 Heimtextil 2023 Heimtextil 2023 experiences strong international demand . . . . . . . . . . . . . . .24 Pakistani student wins prestigious competition for textile designers . . . . . . . .26 Exhibitors from Pakistan at Heimtextil 2023 . . . . . . . . . . . . . . . . . . . . . . . . .28
REPORTS 18 24


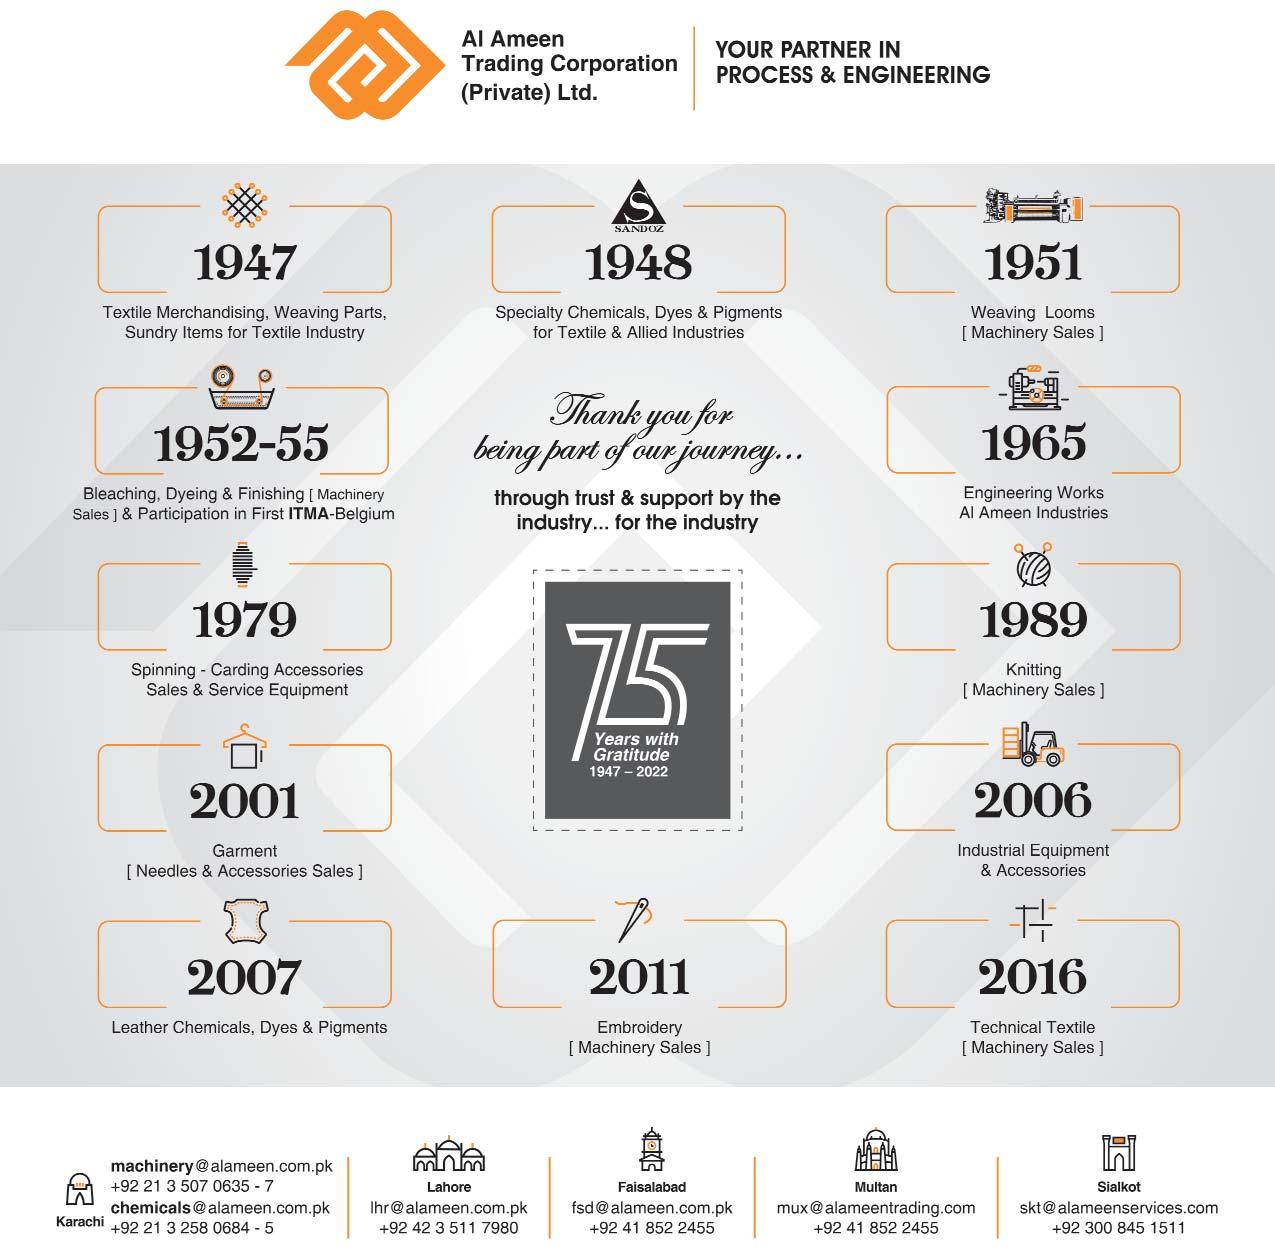
Registered Office: Dairy House, Money Row Green, Holyport, Maidenhead, Berkshire, SL6 2ND, UK Registered no. 09141989 Artistic Milliners’ Cotton Projects team wins Ryan Young Climate + Award 2022 . .30 Al Ameen celebrates 75th Anniversary with a commitment to transparency and satisfying services . . . . . . . . . . . . . . . . . . . . . . . . . .21
ANNUAL FACT FILE 2022
Table 1: World Cotton Supply, Use and Trade . . . . . . . . . . . . . . . . . . . . . . . . .39
Table 2: World Merchandise Trade and Textile & Clothing Exports . . . . . . . . . .40
Table 3: Merchandise Trade, Textile & Clothing Exports . . . . . . . . . . . . . . . . .40
Table 4: World Export of Textiles & Clothing . . . . . . . . . . . . . . . . . . . . . . . . .40
Table 5: World Export of Textiles . . . . . . . . . . . . . . . . . . . . . . . . . . . . . . . . .41
Table 6: World Import of Textiles . . . . . . . . . . . . . . . . . . . . . . . . . . . . . . . . .41
Pakistan
Table 1: Facts About Pakistan Textile Industry . . . . . . . . . . . . . . . . . . . . . . . .42
Table 2: Share of Pakistan Textile Industry Exports . . . . . . . . . . . . . . . . . . . . .43
Table 3: Pakistan Textile Industry 2020 – 2021 . . . . . . . . . . . . . . . . . . . . . . . .43
Table 4: Export of Pakistan Textiles . . . . . . . . . . . . . . . . . . . . . . . . . . . . . . .43
Table 5: Export of Raw Cotton . . . . . . . . . . . . . . . . . . . . . . . . . . . . . . . . . . .44
Table 6: Country-wise Export of Cotton Yarn . . . . . . . . . . . . . . . . . . . . . . . . .45
Table 7: Country-wise Export of Cotton Fabrics . . . . . . . . . . . . . . . . . . . . . . .46
Table 8: Country-wise Exports of Textile Made-ups . . . . . . . . . . . . . . . . . . . . .47
Table 9: Country-wise Export of Readymade Garments . . . . . . . . . . . . . . . . . .48
Table 10: Country-wise Export of Knitwear (Hosiery) . . . . . . . . . . . . . . . . . . .49

Table 11: Country-wise Export of Towels . . . . . . . . . . . . . . . . . . . . . . . . . . . .50
Table 12: Country-wise Export of Bedwear . . . . . . . . . . . . . . . . . . . . . . . . . .51
Table 13:Import of Viscose Fibre in Pakistan . . . . . . . . . . . . . . . . . . . . . . . . .52
Table 14: Country wise Imports of Viscose Fibre in Pakistan . . . . . . . . . . . . . .52
Table 15: Country-wise Export of Textile Made-ups (Excl. Bedwear and Towels) .52
Table 16: Textile Exports by Major Categories . . . . . . . . . . . . . . . . . . . . . . . .53
Table 17: Pakistan Cotton Textile - Average Unit Value . . . . . . . . . . . . . . . . . .54
Table 18: Imports of Textile Machinery . . . . . . . . . . . . . . . . . . . . . . . . . . . . .55
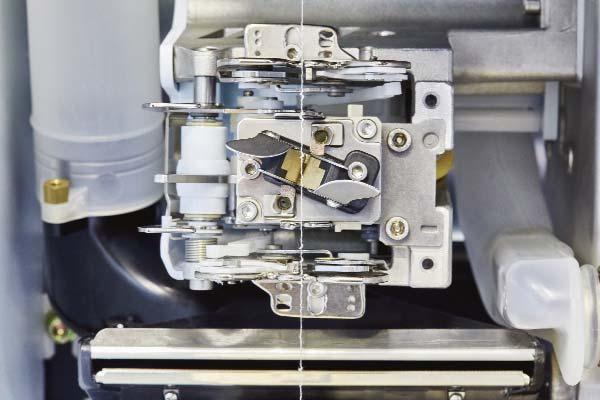
Table 19: Import of Textile Machinery in Pakistan (Major Items) . . . . . . . . . . . .56
Bangladesh
Table 1: Bangladesh Garment Factories and Employment . . . . . . . . . . . . . . . .57
Table 2: Share of Export of RMG and Total Export of Bangladesh . . . . . . . . . . .58
Table 3: Main Apparel Items Exported from Bangladesh . . . . . . . . . . . . . . . . . .59
Table 4: Total Apparel Export from Bangladesh (Fiscal Year Basis) . . . . . . . . . .59
Table 5: Total Value of Apparel Exports from Bangladesh . . . . . . . . . . . . . . . .60
India
Table 1: India’s Exports of Cotton Textile . . . . . . . . . . . . . . . . . . . . . . . . . . .61
Table 2: India’s Country wise Exports of Cotton Textile . . . . . . . . . . . . . . . . .61
Table 3: India’s Exports of Cotton Yarns . . . . . . . . . . . . . . . . . . . . . . . . . . . .62
Table 4: India’s Exports of Cotton Fabrics . . . . . . . . . . . . . . . . . . . . . . . . . . .62
Table 5: India’s Exports of Cotton Made-ups . . . . . . . . . . . . . . . . . . . . . . . . .63
Table 6: India’s Exports of Raw Cotton . . . . . . . . . . . . . . . . . . . . . . . . . . . . .63
European Union
Table 1: EU (28) Imports of Textile and Clothing . . . . . . . . . . . . . . . . . . . . . .64
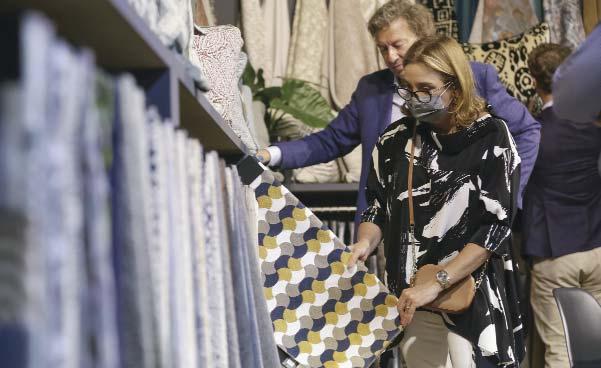
Table 2: EU (28) Export of Textiles and Clothing . . . . . . . . . . . . . . . . . . . . . .64
Table 3: EU (28) Export of Textiles . . . . . . . . . . . . . . . . . . . . . . . . . . . . . . . .65
USA
Table 1: USA Imports of Textile and Clothing . . . . . . . . . . . . . . . . . . . . . . . . .66
Table 2: USA Export of Textiles and Clothing . . . . . . . . . . . . . . . . . . . . . . . . .66
Table 3: USA Export of Textiles . . . . . . . . . . . . . . . . . . . . . . . . . . . . . . . . . .67
Table 4: USA Import of Textile and Apparel . . . . . . . . . . . . . . . . . . . . . . . . . .68
Table 5: USA Export of Textile and Apparel . . . . . . . . . . . . . . . . . . . . . . . . . .70
30 32
20 22 24
32

2022 was a year of uncertainty and full of challenges for the textile industry


Pakistan’s textile industry witnessed remarkable growth and record-breaking export performance in 2021. One of the main reasons for this outstanding performance was the successful management of the Covid 19 pandemic by the government against competing countries such as India and Bangladesh. But, unfortunately, the performance in 2022 has been disappointing. Since the beginning of the current fiscal year, textile exports have continued to fall, down by 5 per cent to $7.35 billion in July-November and by 15 per cent and 25 per cent in October and November.
While the global recession and the war in Ukraine can be attributed to the decline in the global demand for textiles, Pakistan’s textile industry issues are mostly indigenous. Primarily, Pakistan is facing a severe shortage of the primary raw material cotton due to the loss of the crop due to devastating floods. To exacerbate the situation, because of the declining value of the Pakistani Rupee and the dwindling exchange reserves, the State Bank of Pakistan imposed restrictions on imports to curb the unabated outflow of foreign exchange.
Because of the potential demand, Pakistan’s textile players have invested heavily in the last 2-3 years due to the TERF (temporary economic refinance facility) and LTTF (long-term financing facility) long-term concessionary loans provided to the textile sector. Despite significant investments by the textile industry, the recent fall in exports has resulted in an excess capacity that has significantly reduced margins. Furthermore, the precarious energy situation and its increasing cost are playing havoc with the industry. Making an already difficult situation worse, the State Bank of Pakistan has severely hampered imports to curb the flight of exchange reserves, creating a severe shortage of all imported inputs and a steep increase in their cost. Shortage of chemicals, spare parts and other imported inputs has created a crisis for the industry. It is impossible to run the factories efficiently due to the lost orders, energy crisis and hyper inflation. Many mills are temporarily closed due to these shortages and crises. Hundreds and thousands of workers stand to lose their jobs if the situation is not arrested soon. The Pakistani Rupee has lost more than 27% of its value in the last 12 months alone.
On the other hand, working capital for export refinance, which is needed to keep the engine running, is out of reach and expensive due to the SPB increase in the policy rates to curb inflation. As a result, limits on export refinance schemes remain static despite the increasing costs for textile firms. The situation is alarming, and no immediate solution seems to exist.
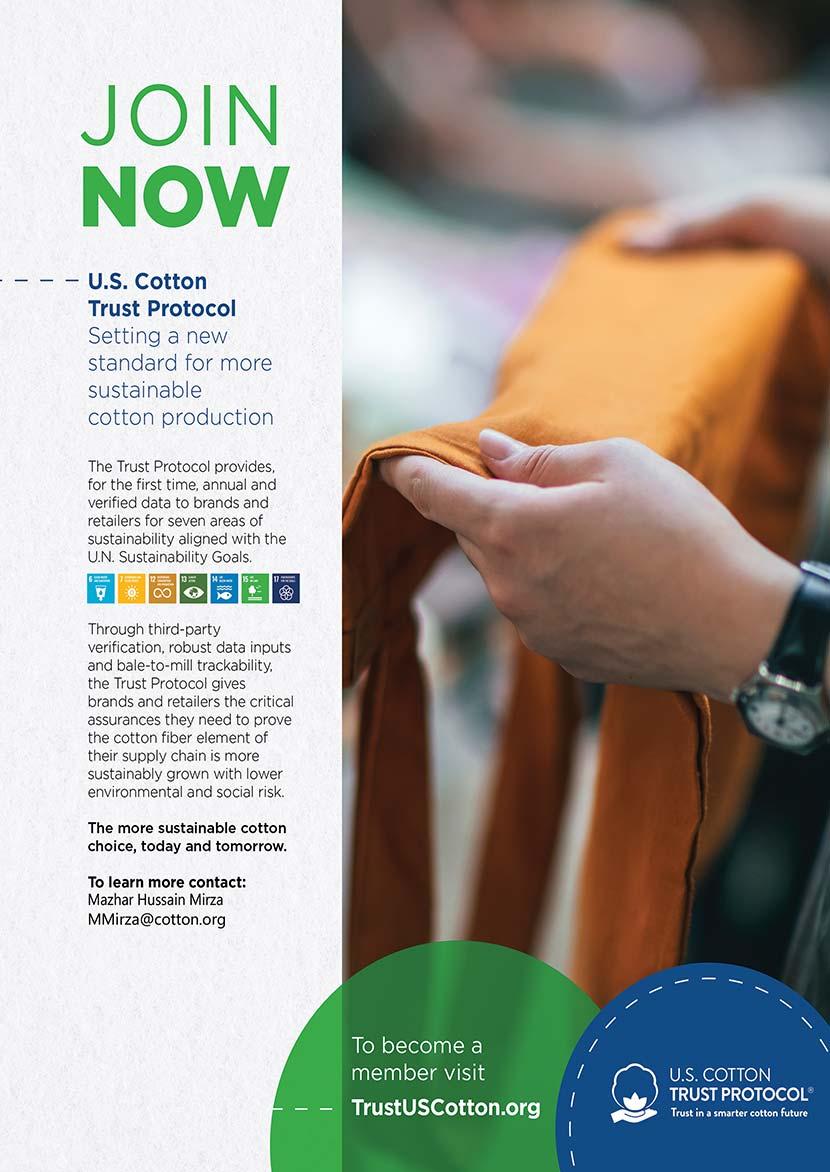
That is why it is remarkable that a record number of home textile manufacturers are exhibiting at the Heimtextil exhibition organised by Messe Frankfurt, Germany, from January 10-13. More than 267 Pakistani exhibitors, an all-time high, shall be present at the Heimtextil exhibition to display their wide range of home textile products. This participation will be a barometer for the future of the textile industry. The world’s leading buyers will be present at Heimtextil to access the capacity of Pakistani exporters to meet the global demand for textiles. In many ways, this will indicate the direction for the industry and the policymakers in Pakistan. Pakistan Textile Journal will be present at the Heimtextil to inform our readers of the current situation in the global markets. An exclusive report will ensue in our next issue to share our findings with our readers in Pakistan and abroad. We wish exhibitors from Pakistan at Heimtextil the best and congratulate them for their record-breaking participation despite incredible odds.
7 Established 1951 December 2022 Heimtextil 2023 / Annual Fact File 2022 December 2022
EDITOR’S PAGE
Jan 10-13 2023 Frankfurt
1Pakistan textile exports registered a decline of over 11 per cent Month on Month (MoM) basis in October 2022 to $1.36 billion due to global economic slowdown.
2APTMA has urged Prime Minister for intervention to save export-oriented textile industry of Sindh and Balochistan from total closure due to unavailability of gas.
3Pakistani textile manufacturers met global brands to explore solutions to boost supply chain resilience in Pakistan. The meeting took place on the sidelines of the Sustainable Apparel Coalition Annual
Meeting 2022 currently being held in Singapore.
4According to statistics Pakistani men’s apparel exports to China amounted to $21.03million, up more than 17% in the first 10 months of 2022 as compared with the same period in 2021.
5Textile exporters in Pakistan hope for revival after dull Christmas season as a buying freeze abroad has hit all segments, from apparel, denim and knits to home textiles, though they hope things will get better in the coming months.
6Pakistan’s textile exports in October 2022 have slashed by 15.2 percent to $1.357 billion over the corresponding month a year ago. Over the previous month too, its exports declined by 11.1 percent, with major decline in cotton cloth, knitwear, bedwear, towels, and readymade garments.
7German company Kik has signed a Bangladesh-style international accord for the protection of industrial workers in Pakistan. The agreement envisages mechanism to file complaints against lack of safety rules in industrial units.
8Canada is an importoriented country and the business community of Pakistan has a good opportunity to tap this potential market for trade and exports. The Pakistani private sector can set up a base in Canada and capture the North American market.
9PCGA has reported that cotton production remained 40.28pc less than the last year’s harvest by Dec 1, an alarming drop of 2.9m bales. Last year, Pakistan produced over 7.168m bales before the start of December against 4.28m bales this year.
1Wool prices strongly rebounded recently at Australian wool auctions. After many months of selling under uncertain demand and weak prices, the abandonment of the COVID zero policy this week in China had immediate effect.


2Readymade garment (RMG) exports from Bangladesh increased by 15.61 per cent to $18.331 billion in the first five months of fiscal 2022-23 (July-June) compared to exports of $15.856 billion in JulyNovember 2021, as per provisional data by the Export Promotion Bureau.
3The (BGMEA), in partnership with Bangladesh Apparel Exchange (BAE), has launched the first ever Made
in Bangladesh Week – a global event to help boost equitable growth in the apparel industry.
4The Bangladesh government is trying to raise annual export earnings from leather and leather products to $10 billion by 2030. The financial institutions of the country are supporting the development of such industries. The government also is providing necessary support.
5China’s textile industry posted stable revenue growth in the first three quarters of the year. Textile companies with an annual main business revenue of at least 20 million yuan (about 2.76 million U.S. dollars) raked in 3.86 trillion yuan in revenue in the period.
6The growth momentum picked up by the Indian manufacturing sector in the last few months is likely to be sustained for the next six to nine months, as assessed by the Federation of Indian Chambers of Commerce & Industry (FICCI).
7Tens of thousands of Indonesian textile workers are on the chopping block as the industry faces a steep drop in exports while imported clothing eats away at its domestic market share.
8In the January–October 2022 period, Turkiye’s exports increased by 15.4 per cent and exceeded $209 billion and then $253 billion in the last 12 months. The ready-to-wear clothing
segment ranked as the third sector with the most exports at $1.7 billion, preceded by chemicals and automotive.
9Innovate UK, part of UK Research and Innovation (UKRI), is leading a new £4 million (US$4.75m) project that aims to accelerate ‘closed-loop recycling’ in the apparel and textile sectors.
The value of US apparel imports from the ASEAN countries is steadily increasing and by September this year it surpassed the last year’s shipment figure. The value of import during January-September 2022 stood at $24.455 billion compared to $23.958 billion in calendar year 2021.
10
8 PAKISTAN TEXTILE JOURNAL - December 2022
Textile Briefs National
Textile Briefs International
International Accord on Health & safety offers services to Pakistan textile industry
International Accord on Health and Safety in the Textile and Garment Industry Executive Director Joris Oldenziel offered services to the textile industry of Pakistan without charging the local textile manufacturers. There is no fee for participation in the Accord programme by the local suppliers. The Accord charges fee from the international brands and buyers.
Joris Oldenzie heading a trade delegation to the All Pakistan Textile Mills Association (APTMA), including Ms. Veronique Cremer, Head of Policy and Advocacy, and Zulfiqar Shah, consultant of International Accord.
Oldenziel said the Accord was created to ensure that workers operate in a safe working environment without fearing building safety accidents and other workplace safety issues.
He said the programme was started in Bangladesh in 2013. It was followed by the establishment of International Accord programmes in other countries based on key principals of accountability, transparency, independence, workers participation and inclusive governance. He said more than 180 international brands are signatory to the Accord at present.
Association’s Chairman (Northern Zone) Hamid Zaman said that APTMA
member mills were 100 per cent compliant corporate entities and the performance of industries was strictly monitored by international and national agencies. He said the textile industry in Pakistan was fully compliant to the international and local sustainability standards like SA 8000, Oeko Tex made for green, Step etc.
He added, the textile mills were contributing to the implementation of Sustainable Development Goals besides ensuring compliance with 27 conventions of GSP plus status relating to social, gender, environment, and other aspects.
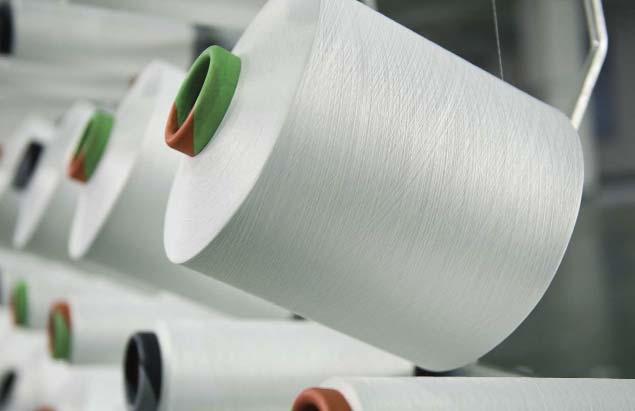
PYMA rejects 5% duty on yarn
The Pakistan Yarn Merchants Association (PYMA), rejected the Economic Coordination Committee’s (ECC) decision to impose 5% regulatory duty (RD) on Polyester Filament Yarn, the primary raw material of textile industry.
Blaming the government for taking this anti-industry measure, PYMA warned that the move will lock around 0.8 million power looms, the lifeline of Pakistan’s textile industry. PYMA Senior Vice Chairman Sohail Nisar strongly protested against ECC’s decision to impose RD on yarn and appealed to Prime Minister Shehbaz Sharif and Finance Minister Ishaq Dar to suspend the ECC’s decision to save the Small and Medium Enterprises (SME)’s from destruction.
Speaking to the media, A Research Analyst on Textile, Nasheed Malik said, “The government is imposing the RD on
yarn in a bid recover its lost revenue caused by the shrinking demand for textile from major buyers Europe, the UK and US. This is challenging for the textile industry’s competitiveness.
“The EU and UK are suffering from inflation while the US has excessive inventory,” observed Malik, adding that, “The US had already made procurements keeping in view the international supply chain disruptions on account of Covid-19. However, the supply chain has corrected itself with the course of time.”
The textile exports dropped by 19% year-on-year to $1.40 billion during November 2022, however, it grew 3% month-on-month. During the five months of fiscal year 2023, Pakistan’s textile exports were recorded at $7.4 billion, a decrease of 4% year-on-year.
The PYMA leaders warned that they will continue their protest against the ECC’s imposition of 5% RD on yarn until the decision is withdrawn. PYMA, along with the power loom owners of Karachi, Hyderabad, Tando Adam, Lahore, Multan, Faisalabad and the Pakistan Art Silk Factories of Gujranwala, are protesting the imposition of RD.
Export-oriented textile sector sends out an ‘SOS’
All Pakistan Textile Association (APTMA) has urged Prime Minister for intervention to save export-oriented textile industry of Sindh and Balochistan from total closure due to unavailability of gas.
PAKISTAN TEXTILE JOURNAL - December 2022 10 News & Views
Zahid Mazhar, Chairman APTMA Southern Zone has urged the Prime Minister Mian Shehbaz Sharif and Chief Minister of Sindh Syed Murad Ali Shah for their intervention to save export-oriented textile industry of Sindh and Balochistan from the closure due to denial of gas from November 15, 2022 to February 28, 2023.
He said the export-oriented textile industries of Sindh and Balochistan, contributing more than 54 percent in total exports of Pakistan, have been served notices of gas closure without taking in confidence the real stakeholders in respect of gas closure for three and half months even though the two provinces are producing more than 80 percent of gas produced in the country.

He further said: “Almost all of our member mills are using natural gas as fuel for generation of electricity to meet their energy requirements and or to run their processing units. Hence if they will be forced to consume only 50 percent of
their load, they will not be able to run their mills smoothly and fulfil their export commitments on time resultantly they would lose their hard-earned foreign buyers while foreign exchange earned by the country through exports would also be curtailed,” he concluded.
Global textile brands discuss achieving net-zero
A delegation of Pakistani textile manufacturers met global brands like
H&M and Gap to explore solutions to boost supply chain resilience in Pakistan. The meeting took place on the sidelines of the Sustainable Apparel Coalition Annual Meeting 2022 held in Singapore.
The session was hosted by Net Zero Pakistan, which is an initiative of the Pakistan Environment Trust (PET). The Net Zero Pakistan programme aims to form a national coalition of pioneering companies, public institutions, and sectoral experts that are banding together
News & Views
Zahid Mazhar, Chairman APTMA Southern Zone
to deliver the goal of net zero carbon for Pakistan by 2050.
The meetings come just a few days before a Pakistani delegation is set to travel to Egypt for the 2022 United Nations Climate Change Conference (COP27). Given this year’s devastating climate related floods in Pakistan, COP27 may be the most important climate conference in Pakistan’s history. The delegation to COP27 will be fighting for immediate climate assistance, and will make the case for climate reparations to third world countries, and Pakistan’s recent climate disaster will be a central talking point.
In this context, the Sustainable Apparel Coalition Annual Meeting is a significant indicator of how far private industry in Pakistan is willing to commit to the idea of net-zero. While world leaders are expected to be sympathetic to Pakistan’s plight at COP27, they will also demand that Pakistan cut down emissions. The textile industry will also be looking closely given the floods also resulted in a large segment of Pakistan’s cotton crop suffering earlier in the year.
About 30% of Pakistan’s textile production capacity for exports has been hampered because of cotton and energy shortages. Pakistan’s textile sector, which exports about 60% of its production, is also facing poor demand in the domestic market due to fragile economic conditions.
Men’s apparel export to China from Pakistan goes up by 17%
Pakistani men’s apparel exports to China amounted to $21.03million, up more than 17% in the first 10 months of
2022 as compared with the same period in 2021, as per the General Administration of Customs of the People’s Republic of China (GACC).
According to the GACC, men’s or boys’ apparel increased by 15.29% worth $11.85 million while last year in the same period it was $ 10.28 million. Data further showed that men’s or boys’ trousers, and breeches, made of cotton increased by 6.42% and crossed $6.49 million in the first 10 months of 2022, whereas in the same period last year it was $5.58million.
The bilateral trade in textile sectors improved very fast. Women’s garments exports from Pakistan to China crossed $8.32 million while home textiles crossed $6.74 million, witnessing an increase of 29% as compared with last year in the same period which was $5.25 million.
Asif Muhammad Sulehri CEO of Brizbane Group of Companies and textile exporter told China Economic Net that three major factors are behind the increasing export of Men’s clothing to China.
Pakistan is a major producer of cotton crops, and it is cheaper as compared to China so it has a benefit over them, he said, adding that Pakistan has cheap labor compared to China which is costeffective for men’s apparel exports to China. In January 2020, Pakistan and China entered into the second phase of the China-Pakistan Free Trade Agreement (CPFTA2), under which China has eliminated tariffs on 313 priority tariff lines of Pakistan’s export and out of the 313 high-priority products that Pakistan can now export without duty payments to China, 130 are from the textiles sector.
The reduced tariffs on textile products, an expected surge in Chinese investment into Pakistan, and the potential shift of production base from China to Pakistan, may change the regional dynamics of textiles trade.
“Under the CPFTA2, many Pakistani textile products will now enjoy duty-free access to China, which has extended similar tariff reductions to other trading partners. Tariffs on readymade cotton garments (HS codes 61, 62, and 63), have been massively reduced, and men’s ensembles of cotton (HS code –62032200). Pakistan’s top world export, were traded with China at 17.5 percent (MFN rate) which was reduced to 12 percent under Phase-I of FTA and has dropped to 0 percent in Phase-II of FTA,” Asif concluded.
Textile exports drop 15.2pc to $1.357 billion in October
Pakistan’s textile exports in October 2022 have slashed by 15.2 percent to $1.357 billion over the corresponding month a year ago. Over the previous month too, its exports declined by 11.1 percent, with major decline in components including cotton cloth, knitwear, bedwear, towels, and readymade garments. In October 2021, textile group exports were $1.6 billion, while in the previous month of September 2022, it was at $1.53 billion, the Pakistan Bureau of Statistics (PBS) said recently.
In July-October 2022/23, the textile sector’s total exports declined by 1.34 percent to $5.94 billion from last year’s exports of $6.02 billion. During the month under review, cotton cloth exports reduced by 16.5 percent to $169.6 million against $203.1 million in September 2022, while compared with October 2021’s exports of $183.6 million, it went down by 7.65 percent.
Over the previous month, knitwear exports in October 2022 were down by 10.25 percent to $391.7 million, bedwear by 18.8 percent to $217 million, towels 8.8 percent to $79.58 million, readymade garments by 0.5 percent to $275.6 million, and cotton yarn sales by over 35 percent to $49.1 million.
Likewise, over the corresponding month of last year (October 2021), cotton cloth exports shed 7.65 percent,
News & Views 12 PAKISTAN TEXTILE JOURNAL - December 2022
knitwear 14.32 percent, bedwear 24.6 percent, towels 3.04 percent, readymade garments 7.4 percent and cotton yarn exports declined 53.8 percent. The energy shortage and its high tariffs, high financing costs, and a slowdown in the global economy were a few key challenges facing the sector. The recent devastating floods have also destroyed cotton crops and it could be a challenge for the industry.
Textile sector’s exports in the last financial year (July-June FY2021-22) were at a historic high of $19.35 billion, with an increase of over 25 percent against FY21’s exports of $15.4 billion.
German firm inks deal on workers’ safety
German company Kik has signed a Bangladesh-style international accord for the protection of industrial workers in Pakistan. The agreement envisages mechanism to file complaints against lack of safety rules in industrial units.
The agreement was signed by Kik CEO Patrick Zahn and representatives of Pakistan’s textile industry, labor protection organizations, Employers Association of Pakistan and other stakeholders at a ceremony held at a local hotel recently. Germany’s Consul General in Karachi Dr. Ruediger Lotz was also graced the occasion.
Besides providing training to workers and making the supply chain safe for them, the international accord also envisages a mechanism to file complaints against non-implementation of safety rules. Workers and laborers would be able to report violations directly to Kik’s representatives. Moreover, health and safety committees will also be formed in industrial units to provide safe and healthy environment to workers.
Consul General Dr. Ruediger Lotz said that the international agreement between Pakistan’s textile industry and Kik is an important milestone that would help speed up development of
Pakistan’s textile and garment sector and ensure the safety of workers associated with this industry.
“This is an important development for Pakistan in the context of Germany’s new Supply Chain Act and that Kik is committed to achieving long-lasting results in coordination with its partners in Pakistan,” he said.

Kik CEO Patrick Zahn said that his company has been operating in Pakistan since 2017 for workers safety. However, seeing the best results of the international accord in Bangladesh, an agreement of this type has been made with the industrial sector of Pakistan, which is an independent and legal agreement with Pakistan’s textile industry and trade associations. Its aim is to make Pakistan’s textile and garment industry safe, socially responsible, and strong.

Cotton production plunges to just 4.8 million bales
Cotton production has dropped by more than 40 per cent mainly because of climate change and floods. The foreign exchange-starved Pakistan will have to import about 7 million cotton bales to meet the textile industry’s demand this season. Total white lint production is expected to be barely 4.8m bales this year, raising the cotton import demand to 7m bales, while so far import contracts of around 5m bales have been signed.
The Pakistan Cotton Ginners Association (PCGA) has reported that cotton production remained 40.28pc less than the last year’s harvest by Dec 1, an
alarming drop of 2.9m bales. Last year, Pakistan produced over 7.168 m bales before the start of December against 4.28 millo bales this year. During this period, the export of cotton was 4,900 bales, which is 11,100 bales or 69.38 pc less than the export of 16,000 bales in the same period last year. Textile mills bought over 3.568 m bales against 3.19 m bales or 46.56pc less than last year’s purchases of around 6.7m bales.
Ginners have a stock of 0.767 m bales, 49.25pc higher than last year’s stock of 0.473m bales.
Karachi Cotton Brokers Forum chairman Naseem Usman told to media that the country will be able to produce barely 4.8m bales this season and 6 to 7m bales will have to be imported to keep the textile factories running. Quoting cotton importers, he said that so far import agreements for about 5m bales had been made.
PCGA leader Javaid Suhail blames climate change, particularly heavy rains and floods in monsoon, for the drastic decline in cotton production. “At least 79pc cotton area, especially in Sindh, was hit by floods as gates of ginning factories could not open there this year.”
Only 2.01m hectares could be brought under the crop both in Punjab and Sindh against the combined 2.53m hectares target this season. Khalid Mahmood Khokhar, a farmers’ leader, said that cotton growers also didn’t follow good agriculture practices, while extension staff also misguided them about the use of herbal pesticides leading to a drop in crop output.
News & Views 13
Patrick Zahn, Kik CEO
Consul General Dr. Ruediger Lotz
AUSTRALIA
Wool prices strongly rebound

Wool prices strongly rebounded recently at Australian wool auctions. After many months of selling under uncertain demand and weak prices. The COVID zero policy in China had immediate effect, which saw many Chinese factories push bids into traders for consideration. This made selling of local buyer stocks much easier but as enquiry continued at volumes well above those local stocks, exporters were then faced with the conundrum of forward selling with market risk exposure, the Australian Wool Innovation (AWI).
“This policy decision by the Chinese central government was the first step needed to recover that nation to the dominant demand destination and price setter in the Australian market. For many months, other wool using countries have been helping the larger four or five Chinese users lead the spot price making and taking a higher than normal percentage of wools on offer into their inventory. With exception of some good Italian orders for the best 15-19-micron wools, and some low spec and quality types, this week was dominated by the Chinese purchasing activity,” AWI commentary said.
To give impetus to this week’s good gains, it remains to be seen if the consumers of China deem it safe enough to hit the retail shops and choose to spend.

BANGLADESH

Garment exports increase upto 15.61% in July-Nov 2022
Readymade garment (RMG) exports from Bangladesh increased by 15.61 per cent to $18.331 billion in the first five months of fiscal 2022-23 (July-June) compared to exports of $15.856 billion in July-November 2021, as per provisional data by the Export Promotion Bureau. Exports were 4.36 per cent higher than the target of $17.566 billion for JulyNovember 2022.
Knitwear (Chapter 61) exports witnessed a lower growth compared to woven RMG exports. Exports of knitwear increased by 12.55 per cent to $10.113 billion in July-November 2022, as against exports of $8.985 billion during the same months of the previous fiscal. Exports of woven apparel (Chapter 62) increased by 19.61 per cent to $8.217 billion during the period under review, compared to exports of $6.870 billion during JulyNovember 2021, as per the data.
Home textile exports (Chapter 63, excluding 630510) decreased by 7.98 per cent to $518.63 million during the period under review, compared to exports of $563.6 million during July-November 2021.
Woven and knitted apparel, clothing accessories and home textile exports together accounted for 88.24 per cent of Bangladesh’s total exports of $21.946 billion during July-November 2022.
RMG exports from Bangladesh had witnessed an increase of 35.47 per cent to $42.613 billion in fiscal 2021-22 compared to exports of $31.456 billion in fiscal 2020-21. Bangladesh had achieved an all-time high in terms of value of RMG exports in 2021-22. The total exports also breached the target of $43.500 billion with 19.73 per cent rise during the period. However, the growth in textile exports slowed down during the recent months due to global economic challenges. Bangladesh succeeded to out perform in terms of textile exports despite economic challenges during November 2022.
Bangladesh aims $10bn annual export revenue from leather items by 2030
The Bangladesh government is trying to raise annual export earnings from leather and leather products to $10 billion by 2030, Commerce Minister, Tipu Munshi recently told an international trade show on leather in Dhaka. The figure is around $1 billion now.
Product diversification and maintaining high quality has become essential now in the ongoing global situation. The leather industry is being shifted from countries such as Vietnam and China. It is an opportunity for Bangladesh, and leather industry should be taken forward through the production of quality goods. The financial institutions of the country are supporting the development of such industries. The government also is providing necessary support.
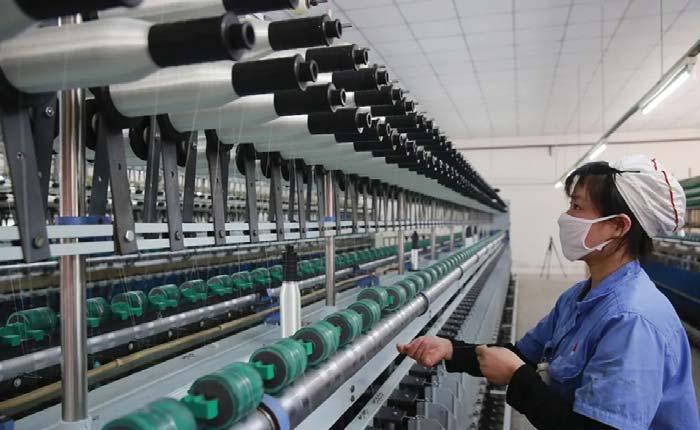
CHINA
Textile sector logs growth in first 9 months
China’s textile industry posted stable revenue growth in the first three quarters of the year. Textile companies with an annual main business revenue of at least 20 million yuan (about 2.76 million U.S. dollars) raked in 3.86 trillion yuan in revenue in the period, up 3.1 percent year on year, according to the Ministry of Industry and Information Technology. The total value-added output of these companies went down 0.4 percent year
Around the World 14 PAKISTAN TEXTILE JOURNAL - December 2022
on year during the period. The combined sales of main retailers amounted to 12.38 trillion yuan in the January-September period, up 3 percent from a year earlier.
The country’s textile and garment exports totaled 248.4 billion U.S. dollars in the same period, an increase of 9.1 percent year on year.
INDIA

Average capacity utilisation for manufacturing over 70% says FICCI
The momentum picked up by the Indian manufacturing sector in the last few months is likely to be sustained for the next six to nine months. The Federation of Indian Chambers of Commerce & Industry (FICCI) reveals that existing average capacity utilisation in manufacturing is over 70 per cent, which reflects a sustained economic activity in the sector.
The future investment outlook also slightly improved as compared to the previous quarter as close to 40 per cent respondents reported plans for capacity additions in the next six months, by as much as over 15 per cent on an average, according to a press release by the FICCI.
The FICCI’s latest quarterly survey on manufacturing reveals that after experiencing revival of the Indian economy in FY 2021-22, momentum of growth continued in subsequent quarters of Q1 (April-June 2022-23) and Q2 JulySept (2022-23) with over 61 per cent respondents reporting higher production levels in Q2 (July-Sept 2022-23). This is significantly more than the percentage of respondents experiencing higher growth in Q2 of the last few years including preCOVID years. This assessment is also reflective in order books as 54 per cent of the respondents in Q2 (July-Sept 202223) had higher number of orders.
High raw material prices, increased cost of finance, cumbersome regulations and clearances, shortage of working capital, high logistics cost due to rising fuel prices and blocked shipping lanes, low domestic and global demand, excess capacities due to high volume of cheap imports into India, unstable market, high power tariff, shortage of skilled labour,
highly volatile prices of certain metals, and other supply chain disruptions are some of the major constraints which are affecting expansion plans of the respondents.
TURKIYE
Ready-to-wear clothing exports valued at $1.7 bn in 2022
In the January to October 2022 period, Turkiye’s exports increased by 15.4 per cent and exceeded $209 billion and then $253 billion in the last 12 months. The ready-to-wear clothing segment ranked as the third sector with the most exports at $1.7 billion, preceded by chemicals and automotives. Exports in October reached $21.3 billion, increasing by 2.8 per cent, as per the General Trade System (GTS) records.
The Turkish Exporters Assembly (TIM) announced the export data for October in Istanbul with the participation of trade minister Mehmet Mus. TIM chairman Mustafa Gultepe said that despite the contraction signals in global economies, the export family showed a successful performance in October.
“With this result, we have achieved the highest October export of all time. Our exports exceeded $209 billion in 10 months and $253 billion in 12 months. We see a 15.4 per cent increase in 10month exports compared to last year. We have broken monthly export records in all of the last 12 months. In October, our top five sectors were automotive with $2.7 billion, chemicals with $2.6 billion, ready-to-wear with $1.7 billion, steel with $1.4 billion, and electrical and electronics with $1.3 billion,” said TIM chairman Mustafa Gultepe.
Gultepe reported that 38 cities increased their exports in October, and the top five cities with the most exports were Istanbul, Kocaeli, Bursa, Izmir, and Gaziantep.
Turkiye exported to 217 countries and regions in October. The top three export countries were Germany, Iraq, and the US. In October, 1,806 new companies joined export family. The increase in

Around the World 15
average kilogramme unit export value continues. Compared to October last year, the kilogramme unit value increased by 18.7 per cent to $1.64.
Gultepe reminded that contraction continue to come from global economies, especially Europe and the US, which are Turkiye’s largest markets. Explaining that import demand was suppressed in these markets due to reasons such as high energy prices, inflationary pressure, interest rate policies, and cutting household expenditures and the euro/dollar parity reflected negatively on our exports.
UNITED KINGDOM

Innovate UK project targets textile recycling Premium Article
Innovate UK, part of UK Research and Innovation (UKRI), is leading a new £4 million (US$4.75m) project that aims to accelerate ‘closed-loop recycling’ in the apparel and textile sectors.
The government research body is inviting applications from companies with solutions that can feasibly reduce landfills waste by increasing the proportion of post-consumer textiles that are recycled and fed back into fashion supply chains.
“The aim of this competition is to fund a research and development activity demonstrator. This will demonstrate new technologies, services, processes and business models capable of addressing the recycling and sorting challenges,” UKRI said in a statement.
USA US' Textile Exchange Conference 2022 prioritizes climate change

The Textile Exchange Conference 2022, which was held from November 14–18, 2022 in Colorado Springs, aimed to map out a ‘pathway to positive impact’ which included reducing the textile industry’s emissions enough to help limit global warming to 1.5°C. The event also focused on delivering beneficial outcomes for soil health, water, and biodiversity.
The event, which was attended by 984 people in-person and 829 online, was hosted by Los Angeles-based environmentalist Leah Thomas, founder of the non-profit Intersectional Environmentalist. The three-day event offered many key takeaway for participants to consider regarding the future of the textile industry, according to a press release by the organiser.
There were discussions on how brands can prioritize biodiversity beyond the sourcing gate and ensure due diligence in supply chains as climate, nature, and community can no longer be seen through separate lenses.
Data was recognized as a powerful ally for guiding decisions, but needs to be framed with on-the-ground experience. “There really is no substitution for going out into the field and seeing what is happening on the ground. Only then can you put data in the frame of reality and start to see where things don’t add up,” Textile Exchange’s COO Claire Bergkamp said in the session Responsible Use of Data.
Sessions at the conference explored how policy and non-financial disclosure can regulate the industry but defining what these systems should look like will require input from stakeholders across the sector. It was noted that the goal of full transparency requires the buy-in and cooperation from all players in the supply chain, and attention should be paid to ensure that no one is harmed or put at a disadvantage by disclosure.
Climate change was recognized as a business risk, and it was agreed upon that solution building required stakeholders from all backgrounds, geographies, cultures, and stages of the supply chain. The importance of scalability, especially for known solutions like textile-to-textile recycling and regenerative agriculture, was highlighted.
US importing more apparel from ASEAN; value over $24 billion
The value of US apparel imports from the ASEAN countries is steadily increasing and surpassed the last year’s shipment figure. The value of import during January-September 2022 stood at $24.455 billion compared to $23.958 billion in calendar year 2021, which could be an indication of shift in apparel sourcing from China.
Cambodia, Vietnam, Thailand, Indonesia, and Malaysia are major apparel exporters among ASEAN countries.
The US apparel import from ASEAN countries was $20.464 billion in 2017, which increased to $21.473 billion in 2018 and further to $23.033 billion in 2019. However, it slipped to $21.126 billion during the COVID year 2020, according to survey.
On a quarterly basis, the US apparel import from ASEAN nations crossed the $8-billion mark for the first time in JulySeptember 2022. The value was $5.488 billion in Q2 2021, $6.524 billion in Q3 2021, and $6.341 billion in Q4, 2021. This year, the figure jumped to $7.583 billion in Q1, $7.996 billion in Q2, and $8.875 billion in Q3, as per research data.
In terms of monthly imports, the value breached the $3-billion mark in August and September this year.
Around the World 16 PAKISTAN TEXTILE JOURNAL - December 2022
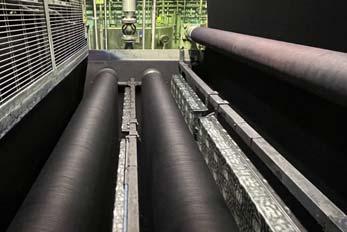
Archroma and Panatronix embark on close partnership towards ecoconscious denim cleaning
Archroma, a global leader in specialty chemicals towards sustainable solutions, and Panatronix, an Italian leader in ultrasonic cleaning for the textile denim industry, joined forces to launch an eco-advanced alternative to the denim fabric washing process.
Water use and wastewater are some of the biggest sustainability challenges in denim manufacturing. The industry uses billions of liters of water throughout the whole textile processing from dyeing to specialty chemical finishes that are applied to textiles in multiple water baths.
The denim industry is therefore working very fast to reduce its water consumption. To combat these issues, Archroma and Panatronix have decided to team up and develop an alternative to the traditional yarn washing process and its subsequent high-water consumption and contamination.

Thanks to the use of our pre-reduced aniline-free* Denisol® Pure Indigo and low sulfite-content Diresul® RDT liq, followed by Panatronix ultra sonic technology on the washing boxes in the denim process, customers will be able to save huge amounts of water.

This partnership will also allow to create a final garment with no impurity, aiming to achieve compliance with major eco-regulations, with the same level of fastness and properties.
The breakthrough alternative to the fabric cleaning concept presented by Panatronix technology and Archroma combines the use of the following systems that will provide big saves of water and will reduce the water footprint.
PURE INDIGO ICON – an anilinefree* indigo system that produces authentic denim without compromising our planet
PURE UNDERTONES - A sulfur bottoming system that brings a new layer of color creativity to your aniline-free* indigo denim
DENIM VIBE - A sulfur-based system to efficiently create bright
ocean blue denim without wasting an ocean of money and water
INDIGO REFLECTION - A coloration system that behaves like indigo but with a more sustainable and efficient process
*Below limits of detection, according to industry standard test methods
Candiani has been the first denim mill to take up this challenge and use the new Panatronix innovative machine and technology together with Archroma Diresul® RDT dyes.
18 PAKISTAN TEXTILE JOURNAL - December 2022
Panatronix machinery installed on slasher washing box at Candiani (Photo: Candiani)

The LYCRA Company introduces THERMOLITE® EVERYDAY WARMTH technology for socks
Solutions that help keep feet warm
The LYCRA Company, a global leader in developing sustainable and innovative fiber and technology solutions for the apparel and personal care industries, today announced the launch of THERMOLITE® EVERYDAY WARMTH technology for socks. The company’s latest innovation will transform how brands deliver an everyday sock solution that provides functional performance and offers lightweight warmth and comfort for consumers.
THERMOLITE® EVERYDAY WARMTH technology for socks is unique in that it traps the wearer’s body heat and stores it in hollow fibers in the sock to provide warmth without excess weight. Consumers will appreciate the key benefits that this warming technology can bring to their garment-wearing experience.
The LYCRA Company has defined fiber blends for the everyday sock to help
keep the wearer comfortable while temperatures drop indoors or outdoors. Through a proprietary, standardized measurement technique, values have been established that measure the degree of warmth for socks, helping to ensure that consumers’ feet stay warm.

“We’re laser-focused on producing high-quality fibers that empower our customers to create comfortable garments that deliver lasting performance,” Sybille Bald, Legwear Strategic Marketing Director at The LYCRA Company. “As the temperatures drop and people lower their thermostats to save energy, socks that help keep feet warm will become a critical component of daily attire. The launch of THERMOLITE® EVERYDAY WARMTH technology for socks enables brands to differentiate their products while providing consumers in colder environments the warmth they require.”
About The LYCRA Company
The LYCRA Company innovates and produces fiber and technology solutions for the apparel and personal care industries. Headquartered in Wilmington, Delaware, The LYCRA Company is recognized worldwide for its innovative products, technical expertise, sustainable solutions, and unmatched marketing support. The LYCRA Company owns leading consumer and trade brands: LYCRA®, LYCRA HyFit®, LYCRA® T400®, COOLMAX®, THERMOLITE®, ELASPAN®, SUPPLEX®, and TACTEL®. The LYCRA Company’s legacy stretches back to 1958 with the invention of the original spandex yarn, LYCRA® fiber. Today, The LYCRA Company focuses on adding value to its customers’ products by developing unique innovations designed to meet the consumer’s need for comfort and lasting performance.
THERMOLITE® is a trademark of The LYCRA Company.
20 PAKISTAN TEXTILE JOURNAL - December 2022
Features
The LYCRA Company introduces THERMOLITE® EVERYDAY WARMTH technology for socks.
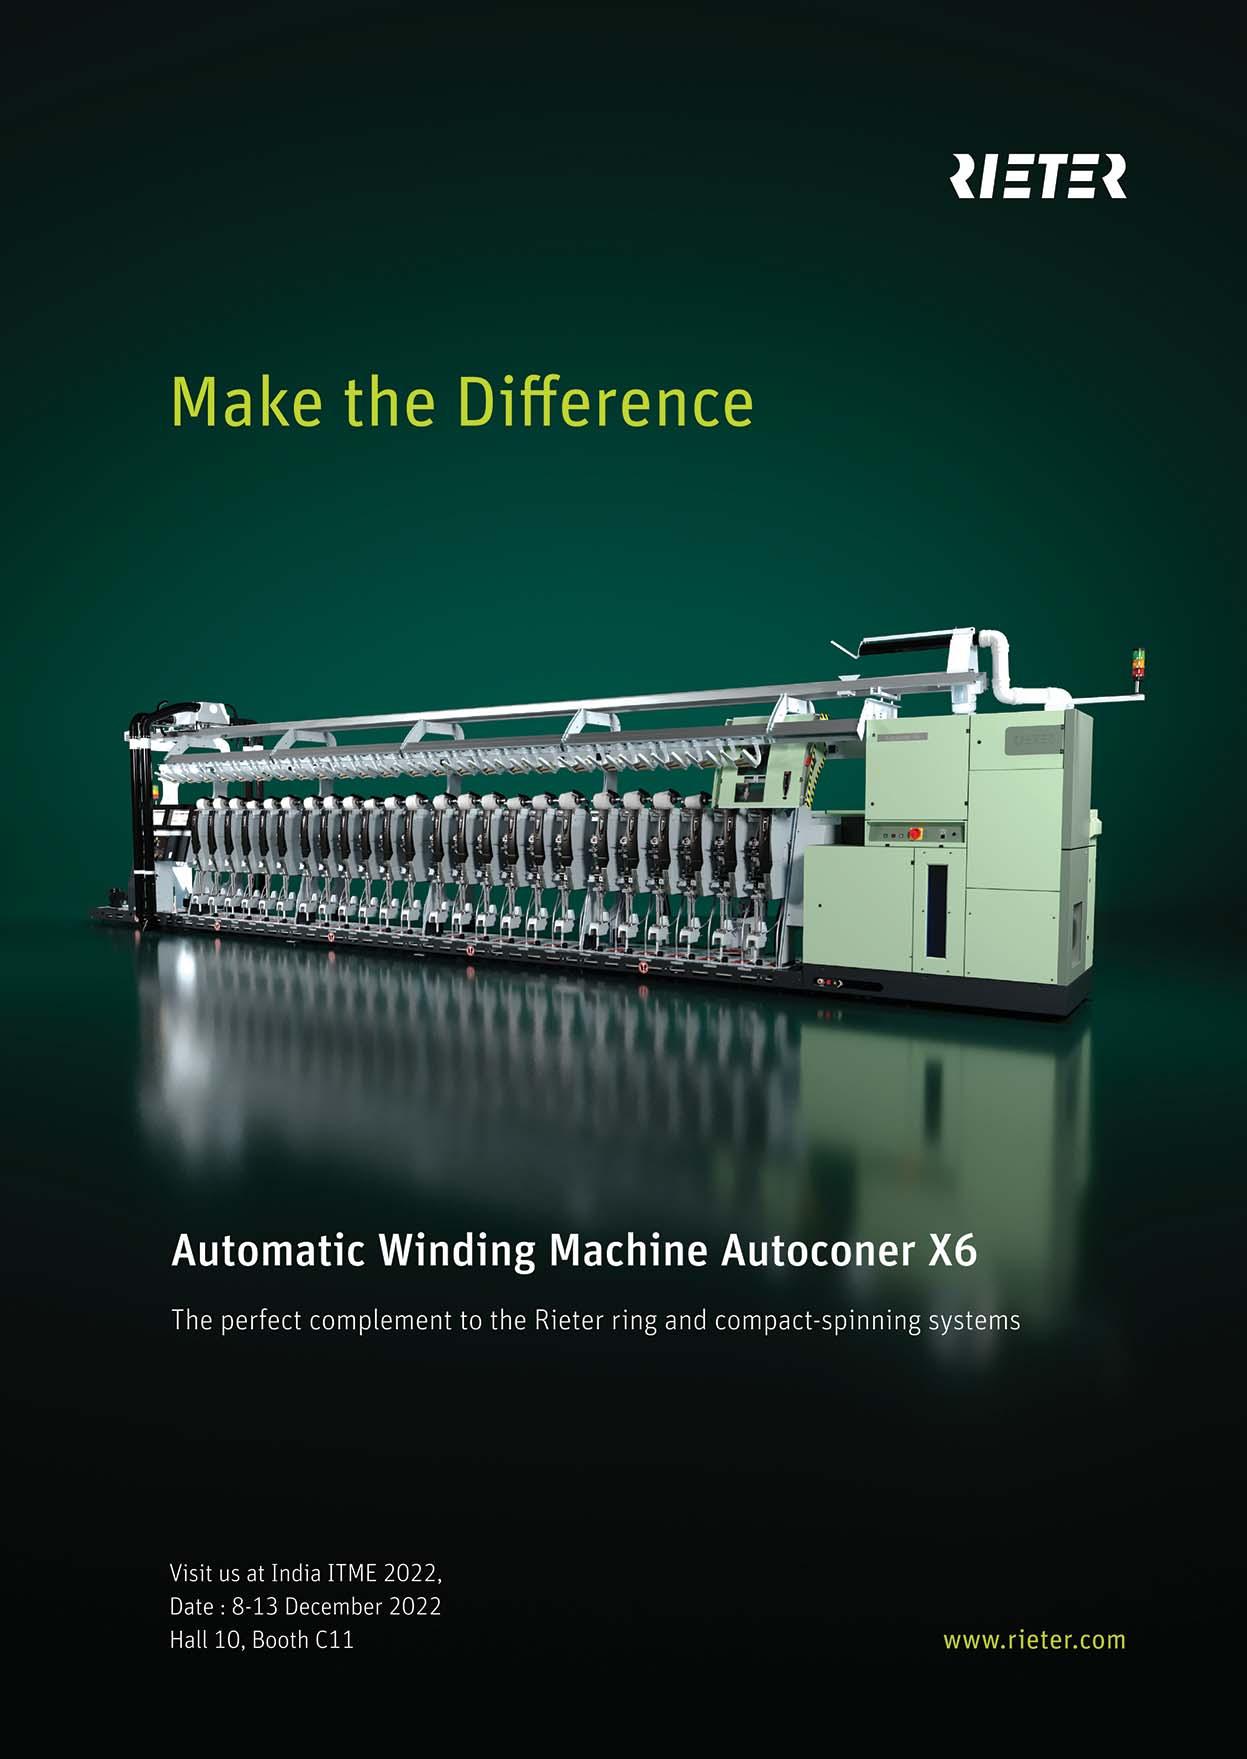
Autoconer X6: Excellent splice quality with open prism technology
The latest open prism technology for splicing covers a universal range of applications. It is easier to handle, as fewer time-consuming adjustments are needed. Splices are more even and possess greater strength. This is also good news for elastic yarns. For customers the real highlight comes at the end, when the splice zone exhibits an impressive elasticity in the fabric.
Yarn splicing is one of the central functions of the winding machine. Splicing takes place not only when a quality cut is made, but also every time a cop is changed. For this reason, splice quality and process reliability are key issues in spinning mills. The latest open prism technology in the automatic winding machine Autoconer X6 represents a big step forward in this regard.
The main advantage of the open prism technology is that it can be applied universally. With only two prisms spinning mills can splice the entire spectrum of cotton yarns – carded, combed or compact – as well as blends The prism OZ1 covers the count range from Ne 30 to Ne 120 and finer, the prism OZ2 mainly covers the coarser count range from Ne 3 to Ne 40. These two open prisms are also used for the splicing of

cotton-based elastic core, duo-core and multi-core yarns in combination with the Elastosplicer.
Excellent splice quality
The open prisms OZ1 and OZ2 ensure strong splice joints for warping, weaving and knitting with yarn-like appearance. Compared to conventional covered prisms the average splice strength is higher and more even. Using the new open prism a Turkish customer increased the average splice strength by approximately 7% for his 100% cotton yarn with count Ne 24. The splice process itself is more stable while the fault rate and number of splice cuts are reduced. This results in an efficient process and optimum splice quality.
Special advantages for elastic applications
Customers producing cotton based elastic core, duo-core and multi-core yarns benefit particularly from the open prisms in combination with the Elastosplicer. Great improvements have been achieved both in splice quality and in the splice process. An Indian customer achieves an average splice strength of 89% for a cotton/elastane yarn Ne 14 with fully embedded Lycra ends and
elastic splice zone with open prism dry splicing. These improvements can be measured up to the final fabrics: customers positively highlight the elasticity of the splice zone in the fabrics. In addition, the splice joints could be dyed well for a uniform appearance. Most elastic yarns have been spliced without the usage of water or only using little water.
Easy handling and less maintenance
The system is easy to handle for operators. The settings are nearly the same for a wide yarn count range. Mechanical and central adjustments are reduced, and the open design requires less cleaning and maintenance. Customers are successfully working with only one scissor distance ‒ this means that no time-consuming settings per spindle are necessary. However, if minor adjustments are still necessary, these can be made centrally on the operating unit at the touch of a button. The universality of the Autoconer splicing principle allows the new open prism technology to be used as a retrofit for machines up to the winding machine Autoconer 338. As a result, customers with older models also have the possibility to boost their splicing performance.
22 PAKISTAN TEXTILE JOURNAL - December 2022
Features

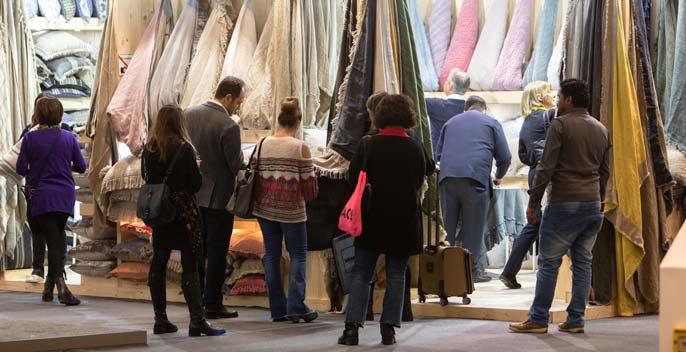
Back on track: Heimtextil 2023 experiences strong international demand

Planning for the next Heimtextil in January 2023 is in full swing. The industry expects an internationally unique platform for home and contract textiles, interior design and trends at the start of the 2023/24 season.
During the one-time Heimtextil Summer Special that just ended, the industry's great need for personal encounters, tactile impressions and creative input became apparent. The next Heimtextil, leading international trade fair for home and contract textiles, will start the new season as the first event of the year from January 10 to 13, 2023.
Over 2,200 international exhibitors from 50 countries have registered for the event. The internationality of the event is also remains high. Among the participating companies are promising names from all over the world, such as ADVANSA Marketing GmbH (D), Alfred Apelt GmbH (D), Aznar Textil, SL (E), Essenza Home (NL), Gul Ahmed Textile Mills Ltd. (PK), Lameirinho - Indústria Têxtil, S.A. (PT), Lenzing AG (A),
Marburger Tapetenfabrik (D), Norvigroup Denmark A/S (DK), Microcotton Inc (US), OBB Oberbadische Bettfedernfabrik GmbH (D), Standard Fiber LLC (US), Tanriverdi Mensucat San. A.S.(TR), Trendart (CH), Trevira GmbH (D), Trident Limited (IND), Velamen S.A. (E) or Zorel Tekstil (TR).

The industry participants are courageously meeting the major challenges and are using Heimtextil to further internationalize their clientele. Under the current market challenges, the industry shows a great desire for inspiration and new approaches to solutions, as well as for creating new customer relationships all over the world. Heimtextil 2023 provides the perfect range of relevant market players and complements the benefits for buyers with an extensive supporting program.
Highlights at Heimtextil 2023
Thematically, the overarching theme of sustainability will also be clearly visible at Heimtextil 2023. With the exhibitor
guide, "Green Directory" as well as the "Green Village", that offers a platform for discussion with the seal providers, Heimtextil offers important points of orientation in the jungle of the many sustainable offers. The popular trade fair tours "Green Tours" will also once again take interested visitors to curated exhibitors to learn more about their sustainability strategy and their products.
Last but not least, the impressive "Future Materials Library" will be presented again as part of the Trend Space at Heimtextil 2023. The international collection of material innovations in the interior sector is curated by the future agency FranklinTill, which is also responsible for the conception of the Trend Space at Heimtextil 2023. The spectacular design and trend area will set the scene there for Heimtextil Trends 23/24, which will be developed beforehand by the international design offices stijlinstituut amsterdam (Netherlands), FranklinTill (Great Britain) and SPOTT Design & Business (Denmark).
24 PAKISTAN TEXTILE JOURNAL - December 2022
Heimtextil 2023
Under the title "Textiles Matter", Heimtextil Trends 23/24 sets standards for the future-oriented and sustainable textile furnishings of tomorrow. The focus is particularly on the subject of the circular economy. By adding materials to a utilization cycle again and again, the need for new raw materials is reduced on the one hand and the production of waste on the other. In the technical cycle, inorganic materials, such as nylon, polyester, plastic and metal, can be recycled with no loss of quality. In the biological cycle, organic materials, such as linen and bast fibres, are returned to nature at the end of their useful life. This is the basis of the four trend themes: ‘Make and Remake’, ‘Continuous’, ‘From Earth’ and ‘Nature Engineered’.
A new feature is that the Trend Space will be presented in Hall 9.0. Circular economy also characterizes the staging of Heimtextil Trends 23/24 itself: With the "Material Manifesto", the responsible trend office FranklinTill commits itself to a design of the area that is as sustainable as possible with predominantly recycled materials and elements as well as a strict waste avoidance strategy.
Interior.Architecture.Hospitality, the specialist program for interior designers, architects and hospitality experts, will once again take place at Heimtextil 2023 on a large scale and in the usual high quality. The program includes the Interior.Architecture.Hospitality

LECTURES, in which renowned architects and well-known hotel experts will present their work and discuss current industry topics such as sustainability, as well as the
Interior.Architecture.Hospitality TOURS, which will take participants to curated highlights and innovative textile solutions from the contract sector. The Interior.Architecture.Hospitality DIRECTORY will once again list all the suppliers of contract textiles. In addition, the identification of the respective trade show booths ensures an effective trade show visit for the target group.
Another highlight is the Interior.Architecture.Hospitality LIBRARY. Launched in 2020, it is a material library for functional textiles. The library can also be found online at www.textile-library.de. A brand new edition will be published for Heimtextil 2023. The jury of the library will be expanded to include application experts or interior designers. Exhibitors with products for use in the property can submit them for the respective property,
which will be selected by a panel of experts. The concrete naming and labeling of these 15 functional properties ensures an even more precise highlighting of the objects on offer in 2023.
DecoTeam, the community of interests of German home textile suppliers, is offering a far reaching event program as part of Heimtextil 2023. The focus will be on the topic of online marketing, with keynote speeches by Monika Winden and a subsequent YouTube workshop. A panel discussion with interesting discussion partners will also provide exciting insights into the topics of sustainability and social media marketing.
With the Heimtextil Conference Sleep & More, visitors* in 2023 will again be offered a top-notch lecture program for the areas of health, sustainability and the hotel industry. Over the course of four days, experts will speak about the latest findings, developments and trends in the field of healthy sleep from various perspectives of the industry.
With the "New & Next" program for young talents, young talents and start-up companies are given the opportunity to present themselves in the environment of the international industry. The fresh ideas and products of the New & Next exhibitors make a valuable contribution to the multi-faceted Heimtextil spectrum.

Heimtextil 2023 25
Heimtextil 2023: Pakistani student wins prestigious competition for textile designers at Heimtextil exhibition
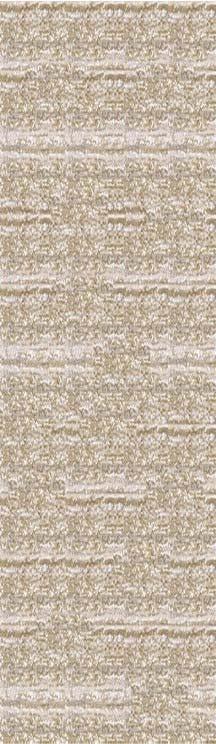
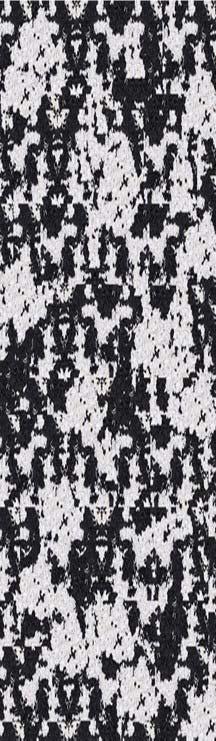
Ume Kulsum Ali Akber student of Indus Valley School of Art and Architecture Karachi Pakistan, is one of the three winners of this prestigious competition this year. Her project “Discarded Treasures” is based on converting textile waste that eventually goes into landfills into beautiful traditional rugs “Dhurries.” Ume Kulsum will display her work at the New & Next Area in Hall 9.0.
Heimtextil takes place every year in Frankfurt and is the world´s largest trade fair for home and contract textiles. Exhibitors from all over the world present their latest ideas and textile products to the international trade press and trade visitors. The perfect chance to present your university and the best student designs in our Newcomer Competition!
Heimtextil has organized the "New & Next University Competition" exclusively
for national and international universities with a focus on textile design. The winners will present their university and selected student work exclusively and free of charge at Heimtextil in Frankfurt.
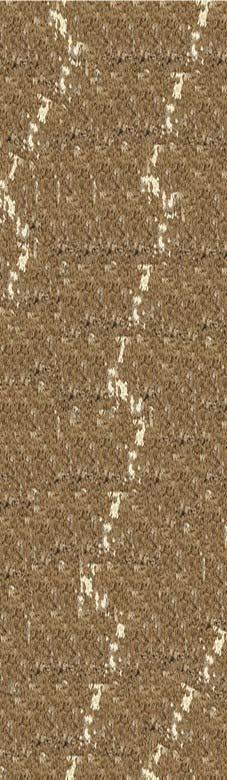
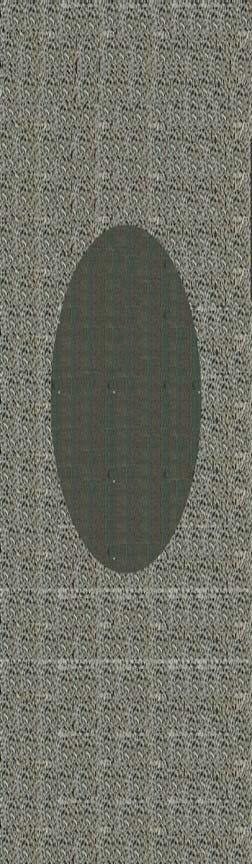
‘Discarded Treasures’
by Ume Kulsum Ali Akber
Pakistan is the hub of the textile industry and the sheer volume of industries results in a significant amount of textile waste that goes largely unused/scrapped or contributes to the pollution in the country by being thrown into landfills. “We must realize that not only plastic, but textile waste is a major contributor of waste in our environment. Most synthetic fabrics may also not decompose at all and can pollute our Earth forever. Therefore, I decided to make use of textile waste that may be overlooked as a ‘harmful waste material,” said Ume Kulsum.
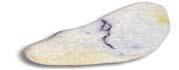
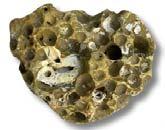
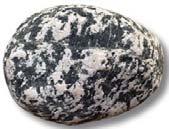
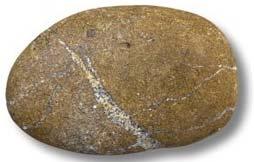
“My concept of this project is recycling and the source of inspiration are the textures of different kinds of stones that I have found in nurseries, beaches, streets, parks and gardens. Being a developing country, Pakistan also faces the burden of having to deal with waste sent from other developed countries. This abundance of textile waste, therefore, presents a unique and interesting opportunity, whereby I can fulfil my social responsibility of sustainability while creating inexpensive exclusive home-based products such as dhurries (traditional rugs).”
She said, “I have specifically focused on pre-consumer waste for my thesis. The factories produce 7% waste of the total production of woven cloth and another 10% is wasted from the remaining material that goes for other processes such as dyeing and stitching. Upon further investigation in multiple


26 PAKISTAN TEXTILE JOURNAL - December 2022 Heimtextil 2023
factories, I have also found out that there are three different categories of cloth i.e. A, B and C. The ”C” quality cloth, being the lowest quality cloth owing to defects such as rips, colour blemishes, and weave pattern irregularities, is thrown away in landfills or is given to labourers who make use of this cloth to make rag rugs, that are often sold in places such as Sunday Bazaar.”
This is not only an environmentally friendly option for the textile mill owners to make use of the waste but also carries an economical incentive. The beauty of utilizing this waste for production is in the fact that textile waste has several color variations. This range of colors in the waste allows the user to utilize an aesthetically pleasing palette without the need for much dyeing.
Ume Kulsum Ali Akber said,”It was due to this reason that I have only dyed 10% of the fabrics used in my dhurries, whereas the remaining 90% was already dyed. Further adding to the socially responsible aspect of my products, the warp on the handloom (khadi) is also made of recycled materials namely the left-over threads of the previous batches of students at my university. I believe that if these textile owners had more
awareness to make use of even tiny “qatrans” (meaning small fabric pieces) it would be largely beneficial for them to look into utilizing this waste. Furthermore, my other samples consist of waste t-shirt yarn in both warp and weft.”

Ume Kulsum Ali Akber has visited Liberty Textile Mills, MJ Textile Mills, Creative Knits, Adamjee Textile Mills, and Zadaf Pvt Ltd. She added, “I have experimented with the jersey fabric for my dhurries since it will lead to a more refined dhurrie owing to the fact that jersey material sheds the least number of threads when cut into yarn. My products are home based because people might not be comfortable wearing something made from waste. My products are different from the ordinary rag rugs through experimentation and exploration of colors, textures, and weave structures.”
She revealed: “The dhurries do not utilize the traditional dhurrie making techniques. Instead, they are made on a handloom consisting of larger loops of threads that replace the needles of the hand loom. This has allowed me to easily use thick t-shirt yarn as the warp and streamline a process that would generally take four times as long.”
This economical set up can easily be replicated by textile owners resulting in economic gain for factories while helping to save the environment by reducing the waste that goes into landfills. Warp inside Loops of threads instead of needles (Loops playing the role of the eye of the needle)

She concluded: ”My goal is to create awareness of the waste that is affecting our environment and as a responsible citizen and textile student, I hold myself responsible to protect the environment while providing economic benefits to the country and bringing out better and aesthetically pleasing designs. It is absolutely essential to take these steps before we further damage our environment. I am grateful to Messe Frankfurt for giving me the opportunity to display my work at Heimtextil exhibition. This opportunity and recognition are very important to me. My mentors were my teachers at the Indus Valley School of Design and Architecture, Ms. Imrana Shahryar and Mrs Shahnaz Ismail who kept pushing me to do my best and never allowed me to give up. It is a privilege to represent my institution, IVS and my country Pakistan at Heimtextil.”
Heimtextil 2023 27
Exhibitors from Pakistan at Heimtextil 2023
Exhibitor Name Location
A. Essak & Sons Home Textiles
Exhibitor Name Location
10.1, C58 Decent Textiles 10.1, C40
A.B. Export Pvt. Ltd. 10.3, C49 Delin Tex 10.3, E22
A.E. Fabrics (Pvt.) Ltd. 10.3, D59 Dhedhi Brothers 10.0, D35
A.I.Textiles 10.1, D51 Diamond Export Industries (Pvt.) Ltd 10.3, E45
A.N. Textiles 10.1, D10 DIN Textile Mills Ltd. 10.0, C29
A.R.M Textile 10.3, F61 Elegant International Corporation 10.3, D31
AA Fabrics (Pvt.) Ltd. 10.0, D23 Ellahi Fabrics 10.0, C29
Aamir Enterprises 10.3, D31 Esmail Towels & Textiles 10.3, F56
Abdul Ahad Textile Mills (Pvt) Ltd. 10.3, F22 Esquire Garments 10.3, D31
Abdur Rahman Corporation (Pvt.) Ltd. 10.1, C77 ESS ARR Exports (Pvt.) Ltd 10.0, D23
Abubakar Ali Textiles 10.3, F31 Essatex Industries 10.1, E20
Adamjee Textile Mills (Pvt) Ltd. 10.3, A41 Eurotex 10.3, F69
Adnan Apparel 10.3, F21 F.B Industries 10.3, E41
Afino Textile Mills (Pvt.) Ltd 10.3, D31 Faisal Fabrics Ltd. 10.0, A74
Afroze Textile Industries (Pvt) Ltd. 10.2, C21 Faisal Mustafa Textile Mills (Pvt) Ltd. 10.0, C20
Ahmad Weaving 10.0, B80 Faisal Spinning Mills Ltd 10.2, C91
Ahmed Fine Textile Mills Limited 10.3, F63 Fashion Art International 10.2, C30
Al Barka Fabrics (Pvt) Ltd. 10.1, A21 Fashion Knit Industries 10.1, A51
Al Ghani Terry Mills (Pvt.) Ltd. 10.0, B60B Fatima Towel Industries (Pvt) Ltd. 10.3, F41
Al Hadi Textile (Pvt.) Ltd. 10.3, B39 Fatima Weaving Mills (Pvt) Ltd. 10.2, C31
Al Karam Towel Industries (Pvt) Ltd. 10.1, B56 Fazal Sardar Textile Mills 10.0, C23
Al Quresh Fabrics (Pvt) Ltd. 10.1, D57 Feroze1888 Mills Limited 10.2, C13
Al Raheem Textile 10.3, E44 Fine Towels 10.0, C29
Alfalah Textiles 10.0, D10 Friends Cotton Products 10.1, E27
Al-Ghousia Industries 10.0, C29 Gadoon Textile Mills Limited 10.3, F50
Ali Textiles 10.0, B18 Ganitex International 10.3, E49
Ali Textiles 10.0, D23 General Textile Corporation 10.0, B61B
Al-Karam Textile Mills (Pvt) Ltd. 10.2, A51 Genius Textiles Network 10.3, F59
Al-Rahim Textile Industries Ltd. 10.2, C35 Ghazali Textile Industries 10.0, B77B
Al-Rehman Exporters 10.0, C29 Ghia Industries 10.0, D23
Al-Rehman Global Tex (Pvt.) Ltd. 10.3, E35 Gohar Textile Mills (Pvt) Ltd. 10.1, A55
Anwartex Industries Pvt. Ltd. 10.1, E24 Grace Knitwear (Pvt) Limited 10.1, A76
Arham Enterprises 10.3, E29 Gul Ahmed Textile Mills Ltd. 10.2, A41
Arshad Corporation (Pvt) Ltd. 10.1, B40 H.A.R. Textile Mills (Pvt) Limited 10.0, B60A
Arzoo Textile Mills Limited 10.1, B33 Habib Calico Weaving Ind. (Pvt) Ltd. 10.1, C83
Asacotex 10.1, C63 Haji Rafiduddin Waliuddin 10.0, A61C
Asad Enterprises 10.3, F40 Hamza Textile 10.1, E08
As'habi Textile Mills 10.2, B35 Hamza Weaving Factory 10.3, F41
Ashar International (Pvt) Ltd. 10.1, C10 Haroon Corporation (Pvt.) Ltd. 10.0, A22
Ashraf Textile Industries 10.3, D41 Haroon Fabrics (Pvt) Ltd. 10.1, A85
Asia Tex Corporation 10.3, D31 Hasham Towel 10.1, C23
Aspen Textile (Pvt.) Ltd 10.0, B61A Hassan Textile Mills Pvt. Ltd 10.3, D31
Ayaan Textile Industries 10.0, C29 Hassan Textiles 10.3, E35
Ayoob Textiles Mills Ltd. 10.3, E50 HBR Textile Industries 10.1, D50
Azam Textiles 10.1, E25 Hilton Enterprises 10.0, C29
Aziz Sons 10.0, B29 Home Fusion 10.3, E40
B.A Textile 10.3, F75 Homecare Textiles 10.1, B69
Bari Textile Mills (Pvt) Ltd. 10.2, B25 Hometex Corporation 10.3, F33
Best Exports (Pvt) Ltd. 10.0, A51C Hudabia Textile 10.3, E59
Bilal Textile 10.0, C29 Huqas Apparel 10.3, F27
Bilaltex 10.3, E46 Hussain Home Textile 10.0, A61B
Bismillah Textiles Ltd. 10.1, B20 Hussain Textiles 10.1, E24
Canariatex Private Limited 10.1, E44 IBL Frontier Markets Pvt. Ltd. 6.0, D70
Castle Industries 10.3, F56 Ideal Fashion Industries 10.3, E57
Chaudhry Fabrics 10.0, C29 Ihsan Cotton Products (Pvt.) Ltd. 10.1, D21
Chawala Enterprises 10.0, A61D Iman Home Textiles (Pvt.) Ltd. 10.0, C29
Classique Textile (Pvt.) Ltd. 10.3, E23
Imperial Towel Industries (Pvt) Ltd. 10.1, C02
Colony Textile Mills Limited 10.0, C29 Indus Home Limited 10.3, B41
Continental Home Textiles (Pvt) Ltd. 10.1, D65 Indus Valley School of Art and Architecture 9.0, E52
Continental Towels (Pvt) Limited 10.3, F17
International Textile Limited 10.3, B45
Cotton Empire (Private) Limited 10.3, B63 Ismail Fabrics 10.3, F41
Dalal Industries (Pvt) Ltd. 10.1, A17 J. Sons Industries 10.3, D31
Danial Fabrics (Pvt) Ltd. 10.0, C29 J.K. Group of Companies 10.0, A61A
28 Heimtextil 2023 PAKISTAN TEXTILE JOURNAL - December 2022
Exhibitors from Pakistan at Heimtextil 2023
Exhibitor Name
Location
Exhibitor Name
Location
Jamal Fabrics (Pvt) Ltd. 10.3, B21 Polani Textiles 10.3, C27
Kam International 10.2, A85 Popular Fabrics Limited 10.0, D23
Kamal Ltd. 10.2, A71 Qasim Weaving 10.0, C29
Kamal Mills Pvt. Ltd. 10.2, C70 Rainbow Hosiery Pvt. Ltd. 10.3, E58
Kamal Textile Mills 10.1, D83 Rainbow Industries 10.0, A30
Kausar Processing Industries (Pvt) Ltd. 10.1, C20 Ranyal Textiles 10.0, B58A
KB Enterprises 10.0, A51B Rehbar Majeed Textiles Private Limited 10.0, C29
Khurshid Textiles 10.1, E58 Reliance Weaving Mills Ltd 10.3, E19
KN Terry Tex 10.3, E48 Riaz Enterprises (Pvt) Ltd. 10.3, F28
Kohinoor Textile Mills Limited 10.2, B61 Rizwan Enterprises 10.3, B31
Laiq Rehman Textile Mills Pvt. Ltd. 10.3, F05 Rizwan International Pvt. Ltd. 10.0, D24
Lakhany Silk Mills (Pvt) Ltd. 10.1, C67 Roomi Fabrics Ltd 10.3, A09
LAL Industries 10.1, B64 Roomi Tex 10.2, B71
Latif International (Pvt) Ltd. 10.0, C29 Rustam Towel (Pvt) Ltd. 10.1, C52
Latif Textile Mills (Pvt.) Ltd. 10.0, D40 S & S International 10.0, C29
Liberty Mills Ltd. 10.2, B30 Saad Textile Mills (Pvt) Ltd. 10.1, B50
Linen Home Ltd. 10.0, D24 Sadaqat Limited 10.2, A61
Lucky Impex 10.3, C43 SAH Enterprise Inc. 10.3, E21
Lucky Textile Mills Limited 10.2, C13 Sajid Textile Industries (Pvt) Ltd. 10.1, B83
M Hassan Din and Sons 10.0, C29 Salam Textile 10.3, F20
M. Yahya M. Yousuf Bari 10.2, C26 Saleem Textile 10.0, C32
M.K. International 10.3, C21 Salman Textiles 10.0, D23
M.K. Sons (Pvt) Ltd. 10.2, C71 Samaavia Industries 10.0, C29
M/S Wamzak Corporation 10.3, D53 Samira Fabrics (Pvt) Ltd. 10.0, A51A M/s.GPS Pakistan (Global Product Solutions) 10.1, D53 Sapphire Textile Mills Ltd 10.2, C34
Magna Processing Industries (Pvt) Ltd. 10.0, A59 Saya Weaving Mills (Pvt) Ltd. 10.2, B75
Maguari Textile 10.3, F42 SBES Enterprises 10.3, F26
Mahee International 10.0, D31 Shaddan Enterprises 10.0, A78
Maheen Textile Mills (Pvt.) Ltd. 10.1, D61 Shahab Textiles 10.3, F44
Mahmood Textile Mills Ltd. 10.0, B61C Shehzad Enterprises 10.3, E11
Maltex Exports 10.0, C29 Shiwani Textile 10.0, B60C
Mega Cotton Textiles 10.3, E43 Siddiqsons Limited 10.0, B60D
Meher Spring Pvt Ltd 10.1, E84 Silver Textile Factory Private Limited 10.1, B83
Mestex Linens (Pvt) Ltd. 10.0, C76 SilverFox Textiles Private Limited 10.0, C29
Mian Ghous Bux (Pvt.) Ltd. 10.1, E31 Sitara Textile Industries Ltd. 10.1, B61
Mirtex International Company 10.0, C29 Sky Industries 10.1, B11
MNH Textiles 10.3, D31 Sohail Weaving Industries 10.0, B77A
Mount Fuji Textiles Limited 10.1, C85 Star Fabrics 10.3, F71
MRC Textiles (Pvt.) Ltd 10.0, D40 Subhan Textiles 10.3, D31
Mubashar Corporation (Pvt) Ltd. 10.3, F57 Subhantex Pvt. Ltd. 10.3, D31
Mubeen Maqbool Industries 10.0, B58B Sublime International 10.3, F67
Multan Industries 10.3, E17 Sufi Weaving Industries (Pvt) Ltd. 10.1, E18
Multimat Int. 10.0, D39 Sylvana Pakistan 10.0, C29
Mustaqim Dyeing & Printing Industries. 10.2, B13 Tee Zee Textile 10.0, C29
Nael Textiles Pvt. Ltd. 10.3, E35 Terry Tex International 10.0, D40
Naseem Fabrics 10.1, E77 Tex World - Bath Fashion 10.1, C32
Naveed Brothers Textile Mills 10.0, C29 Texcot International 10.3, C65
Naveena Industries Ltd. 10.3, F15 Texlynx Global Pvt. Ltd. 10.1, B33
Nawaz Fabrics 10.1, E40 Textile Channel 10.1, D55
Nazeer Dyeing & Bleaching 10.1, B79
Three Stars Hosiery Mills (Pvt) Ltd. 10.1, D18
Nazu International 10.0, D24 Towellers Limited 10.1, A63
Neelum Fabrics 10.0, C29
New Zeenat Textile Mills 10.1, E56
Niagara Mills (Pvt) Ltd. 10.1, B48
Nimra Textile (Pvt) Ltd. 10.2, C50
Nishat Chunian Limited 10.2, C93
Nishat Mills Limited 10.2, C14
Nishitex Enterprises 10.1, C47
UMMI Textile (Pvt.) Ltd. 10.3, F32
Unibro Industries Limited 10.1, A61
Union Fabrics (Pvt.) Ltd. 10.3, A45
Union Textile Industries 10.1, E33
United Textile Printing Industries (Pvt) Ltd. 10.1, C53
United Towel Exporters (Pvt) Ltd. 10.2, B14
Usman & Sons 10.3, D31
Noor Fatima Fabrics (Pvt) Ltd. 10.1, C21 Waqas Textile 10.1, E71
Noorpur Industries 10.1, D40 Weavers International 10.1, C46
Orient Textile Mills (Pvt.) Ltd. 10.2, A31 Wintex (Pvt.) Ltd 10.3, D31
Pak Home Textile 10.0, D23 Wintex Exports (Pvt.) Ltd. 10.1, C08
Patel Exports 10.0, D40
Yunus Textile Mills Ltd. 2 Booths
Patel Towel Industries 10.3, F41 Zafar Fabrics (Pvt) Ltd. 10.1, B15
Paul Textiles & Towel Industries 10.1, C92 Zaman Textile Mills Ltd. 10.3, D43
Pearl Fabrics Company 10.1, D77 ZIS Textile Pvt. Ltd. 10.0, A26
Planet Textile Industries 10.3, E55
29 Heimtextil 2023
Artistic Milliners’ Cotton Projects team wins Ryan Young Climate + Award 2022 in Climate Leader (Team category)
The awards were announced and presented at the 2022 Textile Exchange Conference, in Colorado Springs, U.S. on 15 November, 2022.
Artistic Milliners’ Cotton Projects team has been selected as a winner for Textile Exchange’s Ryan Young Climate+ Award 2022 in the Climate Leader Team category. The team’s collaborative, farmcentric and forward-thinking approach was highlighted as an example in the industry.
The late Ryan Young, (Textile Exchange COO from 2017-2020), is the inspiration behind Textile Exchange’s Climate+ Strategy, which is for the organization to serve as “a driving force for urgent climate action,” with a goal of 45% reduced CO2 emissions from textile fiber and material production by 2030. “Climate Leader” awards are dedicated to individuals, teams, or departments within an organization displaying an overall commitment to meeting the Climate+ strategy goals.
A statement from La Rhea Pepper, CEO, Textile Exchange read, ‘We would
like to recognize the Artistic Milliners cotton team, made up of Mian Saqib Sohail, Akbar Ali and Anum Zahid for their work in building strong partnerships through the Milliner Cotton Initiative (MCI). The initiative includes partnering with WWF to create projects to improve soil health and promote better land management practices, as well as two mobile apps used by more than 500 farmers and 6 ginners which help them more easily collect transaction data between the parties involved, improving transparency and communication. They demonstrate progressive thinking ahead of their time – one comment we heard in the application process is that if someone is thinking about implementing something, Artistic Milliners is likely already doing it.’

‘Being planet-positive is a value that Artistic Milliners lives by and is intrinsic to all initiatives by our Cotton Projects team.’ says Mr. Omer Ahmed, CEO, Artistic Milliners. ‘We thank Textile Exchange for recognizing our efforts, as we continue to foster an inclusive ecosystem conducive to climate positive actions and social fairness.’
Saqib Sohail, Lead Cotton Projects team adds, ‘We would like to thank Textile Exchange for recognizing our efforts that align with late Ryan Young’s vision in industry transformation. Under the leadership of Mr. Omer Ahmed, our team will continue to play a meaningful role in tackling climate change, and forging better connections with communities.
We would like to express gratitude to our brand partners, and acknowledge the efforts of WWF-Pakistan in on-ground implementation, Retraced (Germany), and Crop2x (Pakistan).’
The Artistic Milliners ecosystem of brands is the conglomerate of the future and strives for excellence in every facet of its vertical operation. The global footprint includes Star Fades International (SFI), a Los Angeles-based custom wash and finishing facility as well as its Mexican Expansion. It also includes Artistic Energy, Artistic Lab and Soho Incubator in New York and Artmill, its first foray into premium wovens.
30 PAKISTAN TEXTILE JOURNAL - December 2022
Special Report
Starting left Anum Zahid, Mian Saqib Sohail, Mr. Omer Ahmed (CEO, Artistic Milliners), & Akbar Ali

Al Ameen celebrates 75th Anniversary with a commitment to transparency and satisfying services
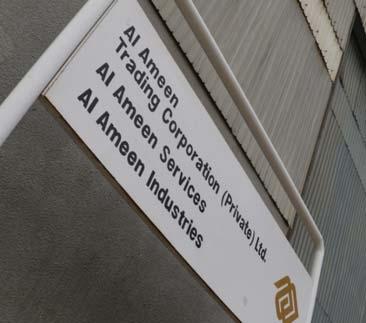
Al Ameen Trading Corporation is one of the most respected names in the textile machinery and chemicals business in Pakistan.The genesis of Al Ameen Trading Corporation can be traced somewhere in the 1920s from the small yarn dye house by the founder Mr Ayub Hashim Khatri (late) and later his cousin Ismail Khatri (late) joins him. From semi-desert Kutch, with not many opportunities at home then, they travelled to far apart corners of India - the green south, in Mangalore and Calicut.
The young sons Mr. K. Ahmed (finance) and Mr. K. M. Hussain (production and sales) further expanded with jacquard hand looms manufacturing bed sheets, kitchen towels and table covers. This successful manufacturing concern faced uncertain times after the World War (1946) due to lack of yarn and other inputs.
Part of the family shifted to Karachi in early 1947 and started as indenters and merchandisers of fabrics, sundry items, accessories, loom parts, springs, gum, etc for handful textile factories then.
The founder late K M Hussain gave hands-on experience / troubleshooting to the industry, and trained new technicians


in the nascent industry, due to his earlier experience of running a family’s weaving and dyeing manufacturing of bed sheets from the late 1920s.
In 1948 K.M. Hussain started the collaboration with Sandoz and in less than ten years, Sandoz and Al Ameen became market leaders in direct, acid dyes and later in the 1960s in textile auxiliaries and optical brighteners. This led to the formation of Sandoz (Pakistan) Ltd. the only multinational company to invest in the size and scale of the production facility with a service network.
This legacy of Al Ameen and Sandoz, now Archroma Pakistan Limited, continues to date with the new generation to serve the industry together.
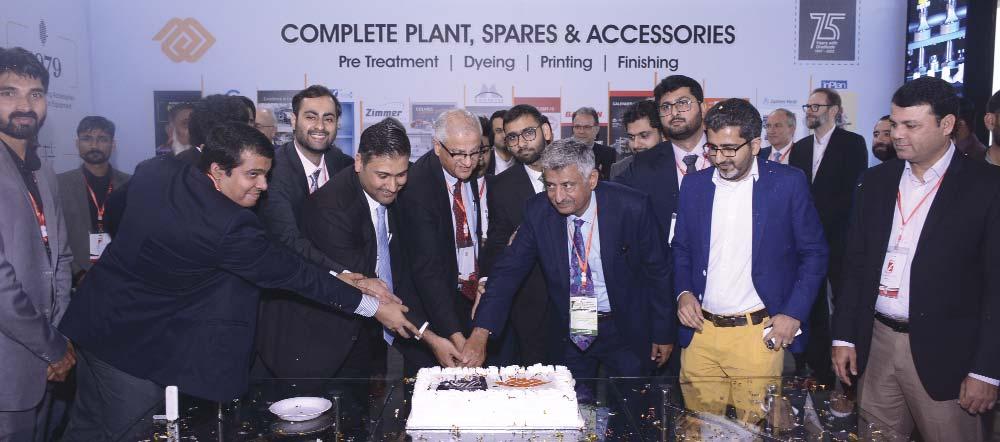
From accessories to machinery sales
The machinery and equipment sales started in the early 50s with weaving followed by wet processing machines.
ITMA 1955 Belgium - First ITMA visited by Mr Hussain gave closer contact with principals and widening of the portfolio.
While representing leading textile machinery suppliers, Mr Hussain to strengthen the local engineering base formed Al Ameen Industries in the mid-60s.
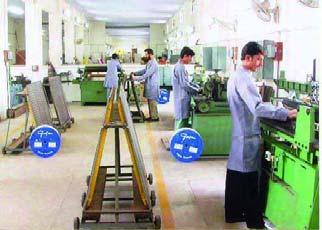
Special Report
32 PAKISTAN TEXTILE JOURNAL - December 2022
K. AhmedK.M. Hussain
With the assistance of his brother Mr K. Jarrar, a successful initiation to manufacture auto warp stop motion for looms and other industrial parts related to weaving and spinning was done. The
following years in the '80s saw collaboration with principals THEN & Goller. Besides manufacturing today, Al Ameen Industries also acts as a service arm for the principals and customers.
It must be mentioned that the success of Al Ameen on one hand was the result of the hard work and integrity of K.M. Hussain as well as the solid support provided to him behind the scene by his elder brother K. Ahmed who managed the financial aspects of the company impeccably as well as the family matters, liberating K.M. Hussain to peruse his marketing efforts wholeheartedly.
The horizon of business was further expanded by the sons of Mr K. Ahmed and Mr K.M. Hussain.
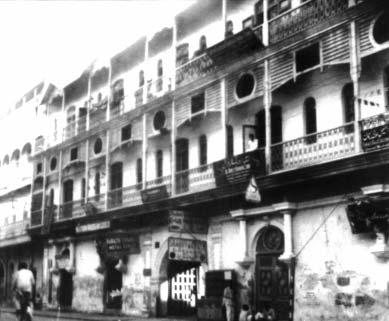
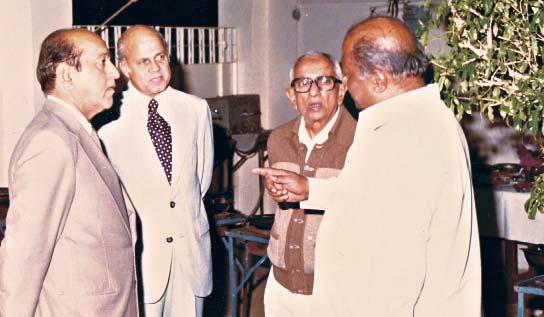
K.M. Khalid, K.M. Pervez, K.M. Khursheed in the machine sales. On the other hand, K.M. Farooq, K.M. lqbal, K.M. Jamshed have been managing the sales of Archroma chemicals business.
New business units
To align with the new challenges and be closer to customers, Al Ameen has divided the responsibilities into three business units.
1. Yarn and Fabric formation (Spinning, Weaving & Knitting)
2. Dyeing, Printing & Finishing
3. Garments
These three machinery divisions are led by the new generation. K.M. Azeem is heading Yarn and Fabric Formation, K.M. Basit for Dyeing, Printing & Finishing while K.M. Zeeshan is responsible for the Garments Division.
More than 50 team members are contributing to the success of machinery sales department. They are supported by the directors, led by respective productline managers in coordination with separate service team for each division.
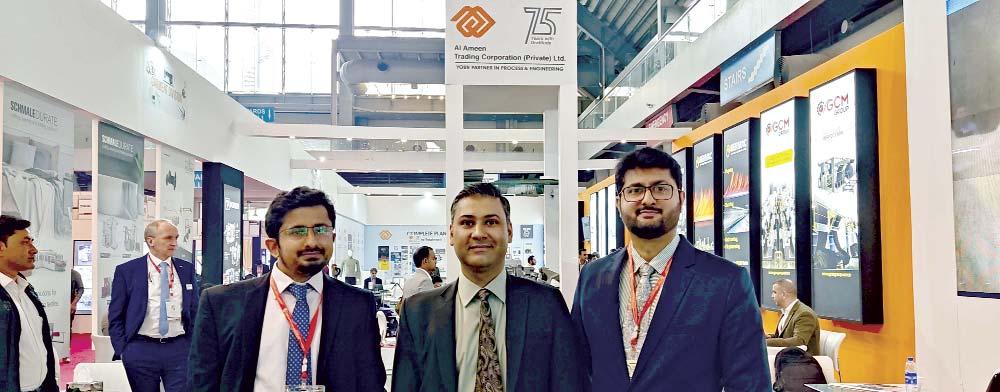
Special Report
33
Mr Usman Yahya, Chairman MFMY Industries, Mr Mahmood Dadabhoy, Director Star Textile Mills with Mr K.M. Hussain and Mr Ismail A. Karim, Spinning Consultant in rapt discussion (Photo circa 1980).
K. Jarrar younger brother with his nephew K.M. Farooq and Mr. Schaller, Chief engineer, GoIler, Mr. Faiz, Chairman & Mr. Naveed Director, H. Nizam Din & Sons. (Photo circa 1979)
K.M. Azeem, Yarn and Fabric Formation; K.M. Basit, Dyeing, Printing & Finishing and K.M. Zeeshan,Garments Division.
Al Ameen office at Serai Road, next to the seat of learning Sindh Madresa where Quaid- e-Azam studied. On Sundays, it was a gathering place on behalf of the Society of Textile Technologists.
SOME MILESTONES/ HISTORICAL GLIMPSES
1. Yarn & Fabric Formation
Weaving
1951: Weaving looms Sales by Harling & Todd. Wide variety of springs locally manufactured (Pakistan Springs, Lahore). Max Spaleck; Warp stop motion devices for looms, Reed making machine.
1955: Warp tying machines by Oscar Fischer (Fischer Poege). Participated in the first national industrialist exhibition with the demo model of Fischer Poege (19551968). Market leader in Pakistan against Exacta & Knotex – A breakthrough technology in knotting at that time.
1960s: Introduction of Kovo looms by Elitex, Prague at Star, Valika and Shalimar Silk Mills, Pakistan.
Spinning
1979: Opening of the first state of the art Card Services country-wide; Graf service stations in Karachi & Lahore. Sales of Rieter rebuilt cards or kits by Graf for conversion to high production to several spinning mills.
Fischer Poege advertisement in Pakistan Textile Journal, August 1961.
1960s: Josef Timmer Trolley, Beams & Pirn strippers for weaving sheds.
1967/68: Foundation laid, Al Ameen Industries for local manufacturing of engineering parts: Automation in Shuttle Looms- Mechanical Warp Stop Motion, Cone adapters for auto winders, Creel for doubling machine, Beam Creel for sizing machine and Helical gears for the spinning mills.
1982: Dornier representation.
2009: PSO Lubricant Oils
2010: The first doublewidth weaving installation by Dornier in the denim sector for considerable savings of space, energy, maintenance and manpower.
2014: Sizing Machines by CHTC.
2014: Batumak Trolleys and Beams.
2017: Weaving; widest loom 5.4m for technical textile by Dornier.
2. Dyeing, Printing and Finishing
Kovo advertisement in Pakistan Textile Journal, August 1964.
The highest number of sales in Pakistan by Goller, Monforts, Fongs and Mahlo in Wet and Dry Processing Machines.
Early 50s: Starting form Harling and Todd Looms, Oskar Fischer warp tying machine (Fischer Poege) and Menzel wet processing line and
2003: Stewarts of America - Pin rollers for blow room and carding.
2011: Lubcon lubricants.
2020: STA Branca; Yarn, Fabric & Fiber Testing and Precision Air Conditioning for Textile Laboratories.
Knitting
2001: Groz Beckert Cylinders, Needles and Sinkers.
2004: Santoni; Large diameter Circular Knitting machines, Seamless garments and Socks knitting machines.
2008: Sugiura Knitting needles.
2010: Jingmei; Circular Knitting Machines. Several installations in Sialkot, Lahore & Karachi.
2018: Memminger IRO; Cutting-edge processing technology for yarn infeeding, control systems and lubrication technology for knitting machines.
2019: Soosan, Socks Knitting Machines.
Bruckner for Stenters having sold many installations in Pakistan. Thomas Bolton (copper printing rolls) and David Bentley (calendar bowls) became market leaders in their times.
Late 50s: Introduction of continuous Dyeing (Goller) at Ahmed Abdul Ghani Textile mills, when Jigger and Winches were standard equipment. 1960s: Goller became household name for bleaching, mercerizing,
washing and pad steam dyeing equipment.
1968- 69: First ever Rotary Printing technique (Zimmer) at Kohinoor Textile Mills, Lyallpur (Faisalabad) replacing Roller printing machine that had limitations on printing width, not beyond 1.8m, brightness of shades, engraving of copper rollers was expensive and cannot be reused.
Groz Beckert advertisement in Pakistan Textile Journal August 1961
Graf Service Station in Lahore, Pakistan
Graf Advertisement in Pakistan Textile Journal, 1980.
PAKISTAN TEXTILE JOURNAL - December 2022 34
Special Report
The late 80s: Quality Control Labs; Consultancy, Design and Supply of Equipment by suppliers such as James Heal, followed by Daelim and Xrite to help the exporting mills maintain and comply with specs and standards.
1990: Continuous Dyeing - Wider Width continuous Thermosol Dyeing; Monforts resolved Side to Centre variation of shades due to precision on air circulation and temperature which was a common problem then in wider width fabrics.
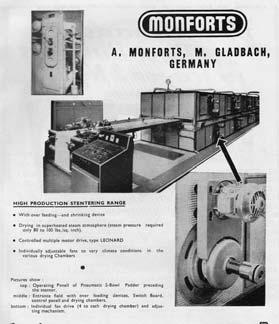
1992: First ever Flashager by Goller in Pakistan for Vat & Vat/Disperse Printing at Al Abid Silk Mills.
1995 -2012: Local manufacturing restarted with Winches, Garment Washing and HT Jet Dyeing Machines at Al Ameen Industries. Along with manufacturing batching equipment and trolleys, it serves as a service arm for the principals and customers including repair/refurbishing of old plants.
1997: by Goller high add-on dip-sat
bleaching range with decisive advantages against conventional process including economical recipe, better whiteness within single stage bleaching, consistency and reproducibility.
2003: Continuous Dyeing on Stenter. - Wider Width dyeing on Stenter through pigment coloration (Monforts). A breakthrough in sustainability to save on utilities like water, energy, and time due to a single-step process instead of the usual pad steam dyeing. It is now a widely adopted process as the new normal.
2004: Inplan Thermal oil Boiler. Many installations in operation today.
2010: Fongs dyeing machinery maker, probably one of the largest in the world has innovated further into series of hydraulic machines with the aim of sustainability on cost and environment. Enjoying largest market share in Pakistan. One of their models HT Airflow Patented Dyeing machine (from THEN former principal since 1967 now part of Fongs group) is a land mark in the history of exhaust dyeing launched in 1979..
2012: Schmale, leaders in terry towels, auto sewing and folding lines.
2014: Mahlo steam saving through moisture management on cylinder dryers by auto adjustments in sync with the fabric grammage.
2016: Finishing - Eco applicator (Monforts) replaced Padder in many articles with a low add-on technique thus increasing the speed of Stenters and savings on energy. Flexibility to apply 2 different finishes on the front and reverse side of the fabric.
2016: Goller Sintensa; Special execution washing range for lawn, sensitive & knitted fabrics at Sapphire Textile.
2017: GCM Inspection, Rolling and Packing machines with several installations all over Pakistan.
2018: First Ever Digital Printing for
pigments by Zimmer. Launch of steamers and flatbed printing on terry towels
2021: Polteks calendar at Ebrahim and Maheen Textiles.
2022: Bejimac singeing machine at Maheen Textiles
2022: Baldwin Spray technology launched to replace padding as an economical option of contactless application of chemicals with minimum wastage, allowing an increase of drying speeds of stenter with substantial savings of energy and water.
Leading processing ancillaries, accessories, spares represented including Dohle, Hansa Mixer, Maier, Forbo, Gerlach, Dollfus & Muller, Rollin, Polytex, Pindarus and Mazza Gianni and the benchmarks in their respective fields globally.

3. Garments

It is the youngest of all divisions, started around the year 2000. Along with industrial leaders/ principals, Al Ameen is trying to contribute to fill the gap in skills, lowering rejections and increase efficiency through technology inputs and hands-on training in the garment sector.
2001: Groz Beckert is the world-class needle manufacturer for knitting and sewing in Germany.

2011: SWF Embroidery machines.
2017: Sprayidea – Aerosol products.
2018: Tonello is the leader in garment finishing technology.
2018: Brother is one of the most respected names in the garment industry with a series of sewing machines in stock.
2022: Hikari launched with a complete range serving high value-added knitwear, activewear and performance wear garments.
Other leading brands represented include KM, Yamato, Stirolux,Perfecta Schmidt and Cosyn Hooks.
Marking 75 years with gratitude is a joyous milestone for us. The core values that our forefathers laid are a testament of today. Al Ameen is different in their approach of presenting solutions to the industry. These solutions from our principals are customer centric and offering values for today and tomorrow. Be it capital equipment, accessories or spare parts, performance is the criterion besides reliability and durability. Gone are the days when customers used to get excited only on the price. Today customers can be credited for their readiness on giving attention to life cycle cost, uninterrupted production and mindfulness about carbon footprint. All in all, sustainability for the customer and ofcourse for Pakistan.
Special Report 35
A message from Al Ameen Trading Corporation
Monforts and Goller vintage advertisements in Pakistan Textile Journal, November 1956.
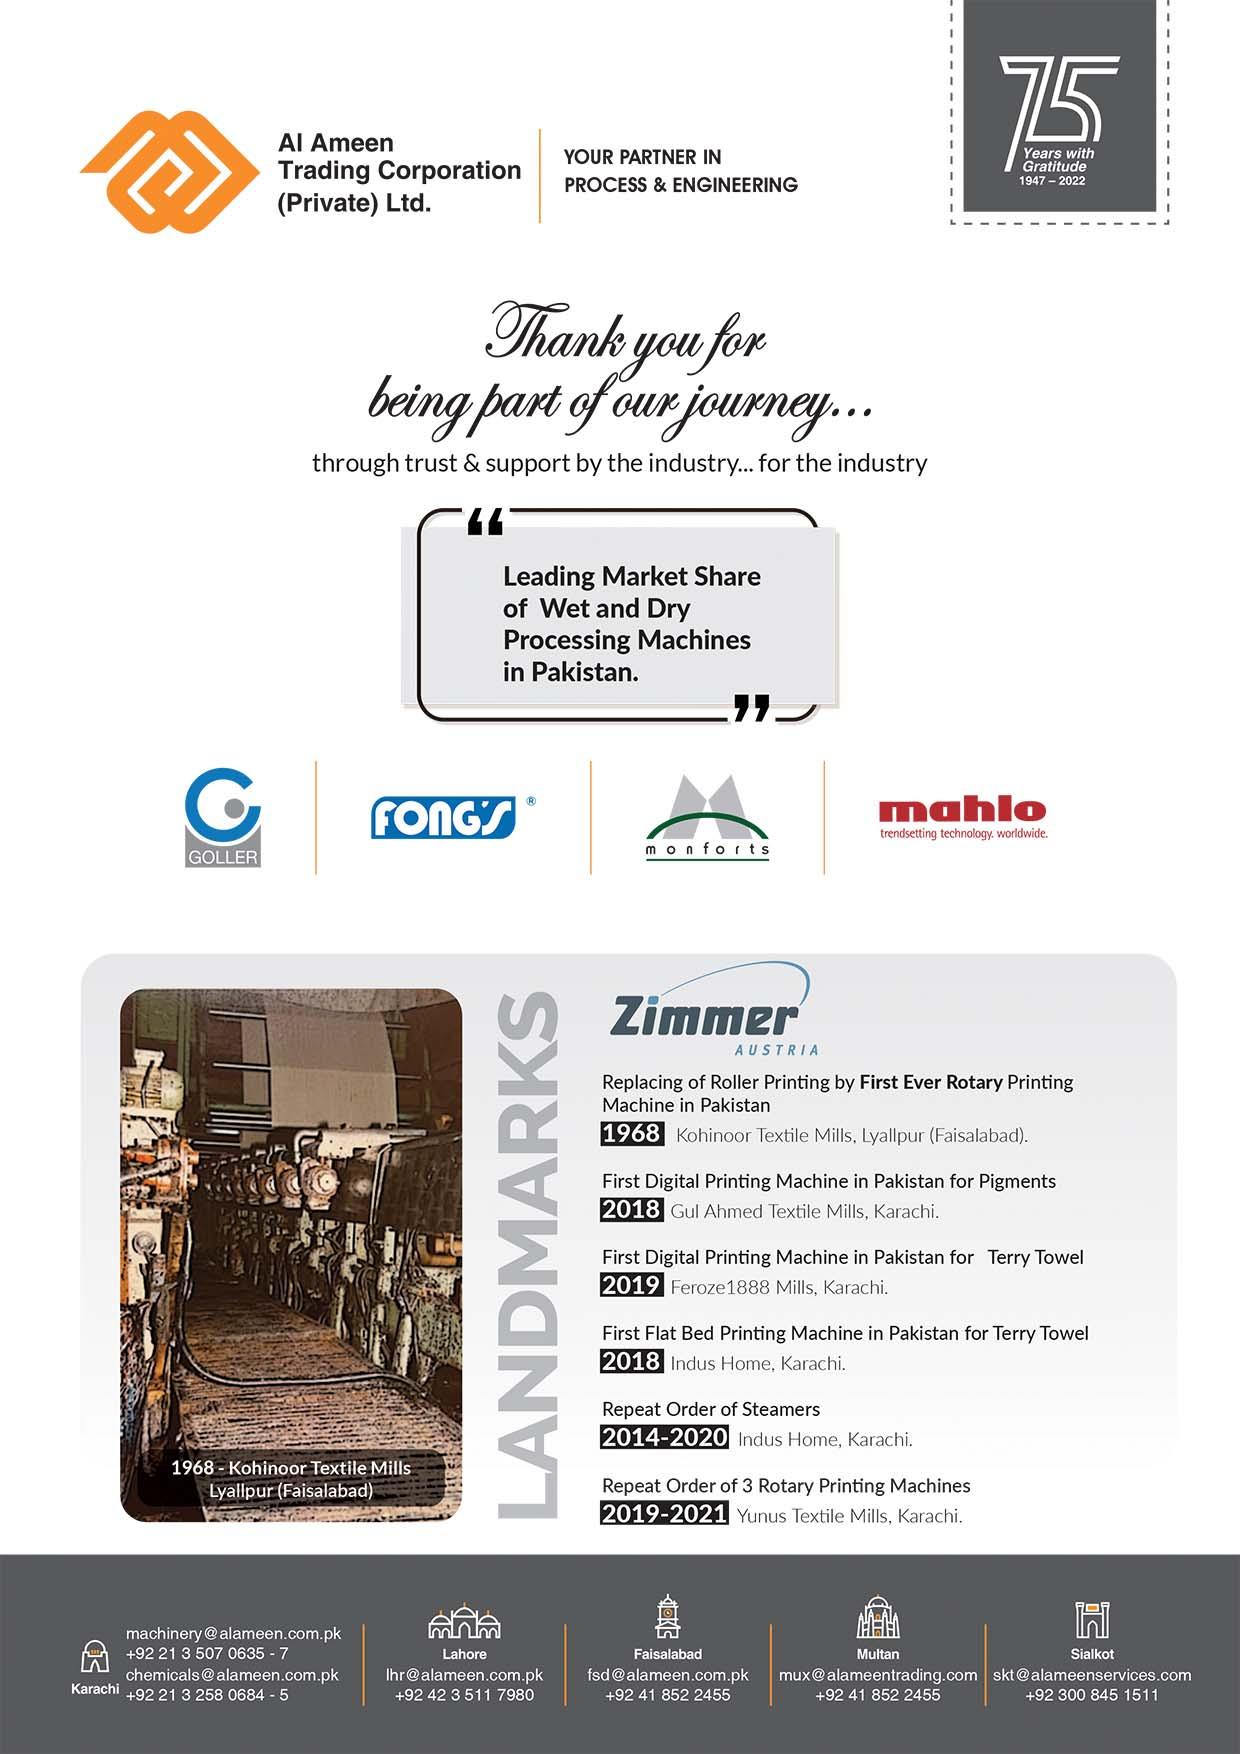
Annual Fact File 2022
In Annual Fact File 2021, PTJ has collected all information/statistics from various institutions/organizations related to the textile industry to our readers. For the interest of our readers we have also included international textile statistics.
For further details please contact PTJ at: info@ptj.com.pk

37
Contents
Table 1: World Cotton Supply, Use and Trade . . . . . . . . . . . . . . . . . . . . . . . . . . . . . . . . . . . . . . . . . . . . . . . . . . . . . . . . . .39
Table 2: World Merchandise Trade and Textile & Clothing Exports . . . . . . . . . . . . . . . . . . . . . . . . . . . . . . . . . . . . . . . . . .40
Table 3: Merchandise Trade, Textile & Clothing Exports . . . . . . . . . . . . . . . . . . . . . . . . . . . . . . . . . . . . . . . . . . . . . . . . . .40
Table 4: World Export of Textiles & Clothing . . . . . . . . . . . . . . . . . . . . . . . . . . . . . . . . . . . . . . . . . . . . . . . . . . . . . . . . . . .40
Table 5: World Export of Textiles . . . . . . . . . . . . . . . . . . . . . . . . . . . . . . . . . . . . . . . . . . . . . . . . . . . . . . . . . . . . . . . . . . . .41
Table 6: World Import of Textiles . . . . . . . . . . . . . . . . . . . . . . . . . . . . . . . . . . . . . . . . . . . . . . . . . . . . . . . . . . . . . . . . . . . .41
Pakistan

Table 1: Structure of Textile Industry . . . . . . . . . . . . . . . . . . . . . . . . . . . . . . . . . . . . . . . . . . . . . . . . . . . . . . . . . . . . . . . . .42
Table 2: Share of Pakistan Textile Industry Exports . . . . . . . . . . . . . . . . . . . . . . . . . . . . . . . . . . . . . . . . . . . . . . . . . . . . . .43
Table 3: Pakistan Textile Industry 2020 – 2021 . . . . . . . . . . . . . . . . . . . . . . . . . . . . . . . . . . . . . . . . . . . . . . . . . . . . . . . . . . .43
Table 4: Export of Pakistan Textiles . . . . . . . . . . . . . . . . . . . . . . . . . . . . . . . . . . . . . . . . . . . . . . . . . . . . . . . . . . . . . . . . . .43
Table 5: Export of Raw Cotton . . . . . . . . . . . . . . . . . . . . . . . . . . . . . . . . . . . . . . . . . . . . . . . . . . . . . . . . . . . . . . . . . . . . . .44
Table 6: Country-wise Export of Cotton Yarn . . . . . . . . . . . . . . . . . . . . . . . . . . . . . . . . . . . . . . . . . . . . . . . . . . . . . . . . . . .45
Table 7: Country-wise Export of Cotton Fabrics . . . . . . . . . . . . . . . . . . . . . . . . . . . . . . . . . . . . . . . . . . . . . . . . . . . . . . . . .46
Table 8: Country-wise Exports of Textile Made-ups . . . . . . . . . . . . . . . . . . . . . . . . . . . . . . . . . . . . . . . . . . . . . . . . . . . . . .47
Table 9: Country-wise Export of Readymade Garments . . . . . . . . . . . . . . . . . . . . . . . . . . . . . . . . . . . . . . . . . . . . . . . . . . .48
Table 10: Country-wise Export of Knitwear (Hosiery) . . . . . . . . . . . . . . . . . . . . . . . . . . . . . . . . . . . . . . . . . . . . . . . . . . . .49
Table 11: Country-wise Export of Towels . . . . . . . . . . . . . . . . . . . . . . . . . . . . . . . . . . . . . . . . . . . . . . . . . . . . . . . . . . . . . .50
Table 12: Country-wise Export of Bedwear . . . . . . . . . . . . . . . . . . . . . . . . . . . . . . . . . . . . . . . . . . . . . . . . . . . . . . . . . . . .51
Table 13: Import of Viscose Fibre in Pakistan . . . . . . . . . . . . . . . . . . . . . . . . . . . . . . . . . . . . . . . . . . . . . . . . . . . . . . . . . . .52
Table 14: Country wise Imports of viscose Fibre in Pakistan . . . . . . . . . . . . . . . . . . . . . . . . . . . . . . . . . . . . . . . . . . . . . . .52
Table 15: Country-wise Export of Textile Made-ups (Excl. Bedwear and Towels) . . . . . . . . . . . . . . . . . . . . . . . . . . . . . . . .52
Table 16: Textile Exports by Major Categories . . . . . . . . . . . . . . . . . . . . . . . . . . . . . . . . . . . . . . . . . . . . . . . . . . . . . . . . . .53
Table 17: Pakistan Cotton Textile - Average Unit Value . . . . . . . . . . . . . . . . . . . . . . . . . . . . . . . . . . . . . . . . . . . . . . . . . . . .54
Table 18: Imports of Textile Machinery . . . . . . . . . . . . . . . . . . . . . . . . . . . . . . . . . . . . . . . . . . . . . . . . . . . . . . . . . . . . . . .55
Table 19: Import of Textile Machinery in Pakistan (Major Items) . . . . . . . . . . . . . . . . . . . . . . . . . . . . . . . . . . . . . . . . . . . .56 Bangladesh
Table 1: Bangladesh Garment Factories and Employment . . . . . . . . . . . . . . . . . . . . . . . . . . . . . . . . . . . . . . . . . . . . . . . . .57
Table 2: Share of Export of RMG and Total Export of Bangladesh . . . . . . . . . . . . . . . . . . . . . . . . . . . . . . . . . . . . . . . . . . .58

Table 3: Main Apparel Items Exported from Bangladesh . . . . . . . . . . . . . . . . . . . . . . . . . . . . . . . . . . . . . . . . . . . . . . . . . .59
Table 4: Total Apparel Export from Bangladesh (Fiscal Year Basis) . . . . . . . . . . . . . . . . . . . . . . . . . . . . . . . . . . . . . . . . . . .59
Table 5: Total Value of Apparel Exports from Bangladesh . . . . . . . . . . . . . . . . . . . . . . . . . . . . . . . . . . . . . . . . . . . . . . . . .60
India

Table 1: India’s Exports of Cotton Textile . . . . . . . . . . . . . . . . . . . . . . . . . . . . . . . . . . . . . . . . . . . . . . . . . . . . . . . . . . . . . .61
Table 2: India’s Country wise Exports of Cotton Textile . . . . . . . . . . . . . . . . . . . . . . . . . . . . . . . . . . . . . . . . . . . . . . . . . .61
Table 3: India’s Exports of Cotton Yarns . . . . . . . . . . . . . . . . . . . . . . . . . . . . . . . . . . . . . . . . . . . . . . . . . . . . . . . . . . . . . . .62
Table 4: India’s Exports of Cotton Fabrics . . . . . . . . . . . . . . . . . . . . . . . . . . . . . . . . . . . . . . . . . . . . . . . . . . . . . . . . . . . . .62
Table 5: India’s Exports of Cotton Made-ups . . . . . . . . . . . . . . . . . . . . . . . . . . . . . . . . . . . . . . . . . . . . . . . . . . . . . . . . . . .63
Table 6: India’s Exports of Raw Cotton . . . . . . . . . . . . . . . . . . . . . . . . . . . . . . . . . . . . . . . . . . . . . . . . . . . . . . . . . . . . . . . .63
European Union

Table 1: EU (28) Imports of Textile and Clothing . . . . . . . . . . . . . . . . . . . . . . . . . . . . . . . . . . . . . . . . . . . . . . . . . . . . . . . .64
Table 2: EU (28) Export of Textiles and Clothing . . . . . . . . . . . . . . . . . . . . . . . . . . . . . . . . . . . . . . . . . . . . . . . . . . . . . . . . .64
Table 3: EU (28) Export of Textiles . . . . . . . . . . . . . . . . . . . . . . . . . . . . . . . . . . . . . . . . . . . . . . . . . . . . . . . . . . . . . . . . . . .65
USA
Table 1: USA Imports of Textile and Clothing . . . . . . . . . . . . . . . . . . . . . . . . . . . . . . . . . . . . . . . . . . . . . . . . . . . . . . . . . .66
Table 2: USA Export of Textiles and Clothing . . . . . . . . . . . . . . . . . . . . . . . . . . . . . . . . . . . . . . . . . . . . . . . . . . . . . . . . . . .66
Table 3: USA Export of Textiles . . . . . . . . . . . . . . . . . . . . . . . . . . . . . . . . . . . . . . . . . . . . . . . . . . . . . . . . . . . . . . . . . . . . .67
Table 4: USA Import of Textile and Apparel . . . . . . . . . . . . . . . . . . . . . . . . . . . . . . . . . . . . . . . . . . . . . . . . . . . . . . . . . . . .68
Table 5: USA Export of Textile and Apparel . . . . . . . . . . . . . . . . . . . . . . . . . . . . . . . . . . . . . . . . . . . . . . . . . . . . . . . . . . . .70


38 PAKISTAN TEXTILE JOURNAL - December 2022
Table 1: World Cotton Supply, Use and Trade (1000 MT)
Country 2018-19 2019-20 2020-21 2021-22 2022-23 (November) Production
China 6,096 5,977 6,445 5,835 6,096 India 5,661 6,205 6,009 5,313 5,987
United States 3,999 4,336 3,181 3,815 3,055 Brazil 2,830 3,000 2,356 2,552 2,830 Australia 479 136 610 1,252 1,197 Turkey 816 751 631 827 958 Pakistan 1,655 1,350 980 1,306 980 Others 4,262 4,409 4,058 4,297 4,245 Total 25,798 26,164 24,269 25,197 25,350
Use Dom. Consumption
China 8.600 7,403 8,927 7,620 7,947 India 5.291 4,463 5,661 5,443 5,225 Pakistan 2.330 2,068 2,351 2,330 2,112 Bangladesh 1.568 1,502 1,851 1,851 1,785 Turkey 1.502 1,437 1,676 1,894 1,807 Vietnam 1.524 1,437 1,589 1,459 1,459 Brazil 740 588 675 697 697 Others 4.525 3,759 4,084 4,268 3,995 Total 26.080 22,658 26,815 25,562 25,027
Imports
Bangladesh 1,524 1,633 1,807 1,785 1,742 China 2,096 1,554 2,800 1,707 1,851 Vietnam 1,509 1,411 1,587 1,444 1,481 Pakistan 621 871 1,176 980 1,089 Turkey 785 1,017 1,160 1,203 1,023 Indonesia 664 547 502 561 533 India 392 496 184 218 337 Others 1,651 1,333 1,386 1,441 1,357 Total 9,243 8,862 10,602 9,338 9,410
Exports
United States 3,230 3,377 3,560 3,184 2,722 Brazil 1,310 1,946 2,398 1,682 1,829 Australia 791 296 344 779 1,350 India 767 697 1,348 815 751 Benin 303 211 342 305 305 Greece 295 319 355 311 267 Mali 294 256 131 283 261 Others 2,044 1,837 2,132 1,974 1,922 Total 9,032 8,939 10,609 9,332 9,406
Ending Stocks
China 7,819 7,913 8,229 8,124 8,108 Brazil 2,668 3,136 2,421 2,599 2,907 India 1,873 3,415 2,599 1,872 2,242 Australia 418 261 546 1,058 945 United States 1,056 1,579 686 816 653 Turkey 369 602 590 602 635 Bangladesh 388 548 534 499 487 Others 3,383 3,970 3,278 3,033 3,024
Total 17,975 21,423 18,882 18,603 19,000
Source: Foreign Agricultural Service,USDA.
39 Annual Fact File 2022 World Textiles
World Cotton
Table
2: World Merchandise Trade and Textile & Clothing Exports Value in US
$ Billion
Category 2019 2020 2021
World Merchandise Trade 19,005 17,645 22,284
World Textile and Clothing Exports 789 755 869
% Share of Textile and Clothing in World Merchandise Trade 4.15% 4.28% 3.90%
% Growth in Merchandise Trade -2.79% -7.15% 26.29%
% Growth in Textile and Clothing Exports -1.98% -4.29% 15.07%
Source: WTO & GTA Estimates
Table
3: Major Regional Flows in World Textile Trade Value in US $ Billion
Region 2018 2019 2020 2021
% of Growth (Y-O-Y)
Intra EU (27) 58.58 43.58 42.73 49.09 14.89%
Intra-Asia 93.00 130.84 119.56 133.86 11.96%
Asia to Europe 31.35 26.53 40.86 31.58 -22.72%
Asia to North America 30.25 28.71 44.99 37.52 -16.60%
Intra - North America 10.88 10.51 9.88 11.15 12.89%
North America to LAC 3.89 8.99 7.07 9.16 29.63%
Source: ITC, UN, COMTRADE
Table 4: World Export of Textiles & Clothing
Country Value in US $ Billion
% Share % Change 2021/2020 2019 2020 2021 2021
World 788.70 754.90 868.64 100.00 15.07
China 260.57 280.91 305.03 35.12 8.59
Bangladesh 42.34 37.11 46.54 5.36 25.41 Vietnam 41.55 39.64 43.96 5.06 10.88
India 35.50 29.69 41.46 4.77 39.67 Germany 38.18 36.99 40.96 4.72 10.73
Italy 36.33 30.98 37.17 4.28 19.99
Turkey 28.57 27.33 34.45 3.97 26.07
United States 26.12 22.77 25.54 2.94 12.20
Netherlands 19.36 19.22 22.91 2.64 19.21
Spain 19.13 15.90 20.09 2.31 26.35
Source: GTA, Texprocil.
40 Annual Fact File 2022
PAKISTAN TEXTILE JOURNAL - December 2022
Table 5: World Export of Textiles
Country Value in US$ Billion
% Share % Change
2021/2020 2019 2020 2021 2021
World 336.97 354.59 386.17 100.00 8.90 China 122.34 156.23 148.26 38.39 -5.10 India 19.25 17.42 26.26 6.80 50.72
United States 20.91 18.66 20.38 5.28 9.23 Turkey 12.51 12.34 16.16 4.18 30.89 Germany 14.37 14.39 15.58 4.03 8.26
Italy 12.17 10.03 12.40 3.21 23.67 Vietnam 8.45 9.21 10.68 2.77 15.95
South Korea 10.74 9.09 10.26 2.66 12.86 Pakistan 7.82 7.42 9.55 2.47 28.81 Taiwan 8.67 7.11 8.52 2.21 19.83
Source: GTA, Texprocil.
Table 6: World Import of Textiles
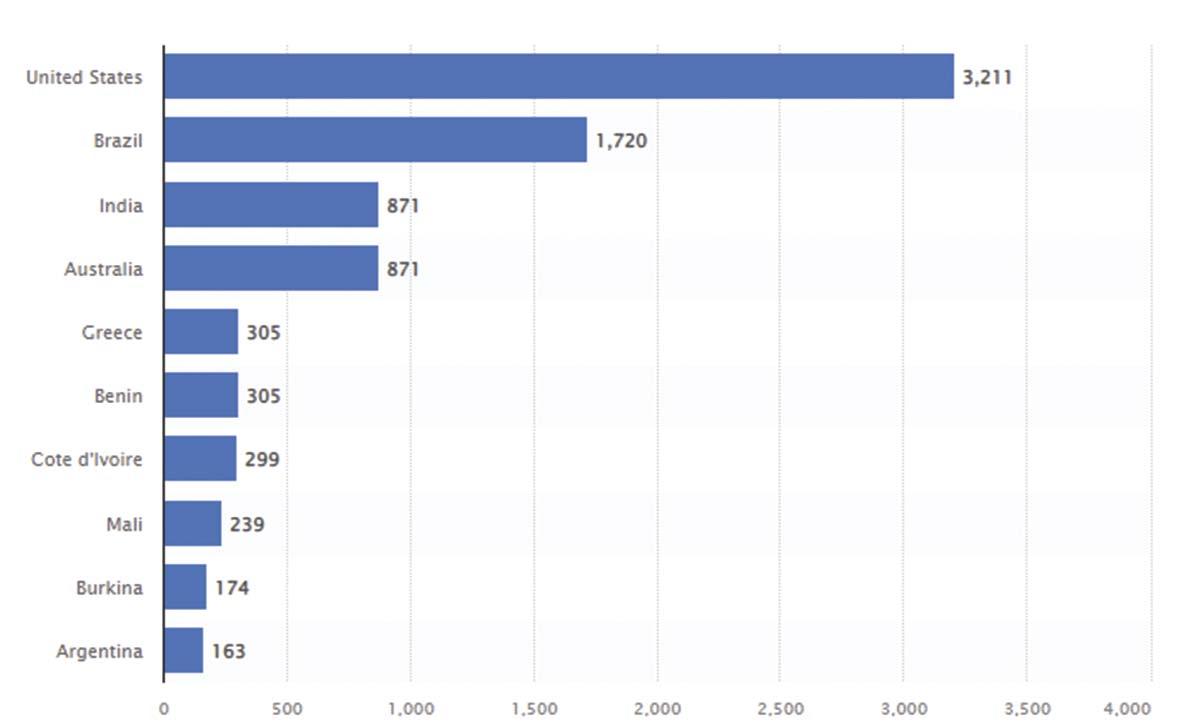
Country Value in US$ Billion
% Share % Change
2021/2020 2019 2020 2021 2021
World 285.24 312.64 325.11 100.00 3.99
United States 30.47 43.79 37.64 11.58 -14.04 Vietnam 23.15 21.24 26.05 8.01 22.62 China 24.05 21.12 24.73 7.61 17.10 Germany 14.30 20.54 17.11 5.26 -16.70 Bangladesh 11.96 10.13 16.45 5.06 62.44 Italy 9.42 10.89 10.32 3.17 -5.26 Turkey 9.03 7.78 9.97 3.07 28.24 Japan 9.16 12.00 9.50 2.92 -20.80 Indonesia 8.52 6.57 8.79 2.70 33.70 France 7.31 12.90 8.78 2.70 -31.96
Source: GTA, Texprocil.
41 Annual Fact File 2022 World
Textiles
Value of the leading 10 textile importers worldwide in 2021-2022. United States Brazil India Australia Greece Benin Cote d’lvoire Mali Burkina Argentina 1,720 3,211 500 0 1,000 1,500 2,000 2,500 3,500 3,000 4,000 871 871 305 305 299 239 174 163
Table 1: Structure of Textile Industry
A. Large Mill Sector
(M. KGs)
Sq. Mt)
B. Small & Medium -Scale Sector
7,989 (M. Sq Mtrs)* 9018 (1,029+7,989) (M.Sq. Mtrs) 3. Finishing 690 4,900 (M.Sq. Mtrs.)** 4. Terry Towels 800 10,000 (Conventional Looms) 700 (Shuttleless Looms) 160.00 M. Kgs 5. Canvas 2,000 Looms 200,000 (Industrial) 55.00 M. Kgs 6. Garments 5,000
450,000 (Domestic) (Sewing Machine) 12,000 Circular 10,000 Flat Source: Textile Commissioner Organisation. *Include Large/small scale independent weaving units & Power Loom sector. ** Include Large/small scale sector
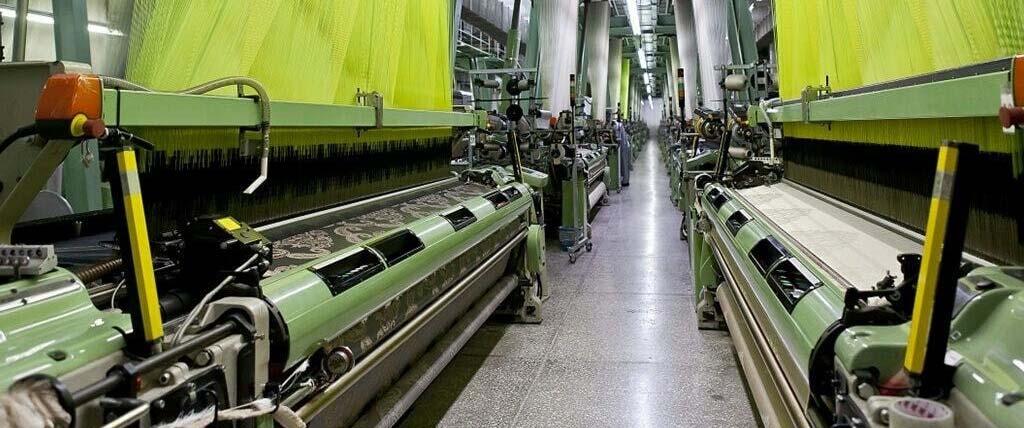
56.00 M. Pcs
7. Knitwear 1,200 18,000 Stock 86.0 M. Dozens
42 Annual Fact File 2022
PAKISTAN TEXTILE JOURNAL - December 2022
Pakistan
Sub-Sector No. of Units Size Prod. 1. Spinning Units 526 a) 13.49 M. Spindles b) 215,000 Rotors 3,159
2. Composite Units 50 7,899 Looms 1,029 (M.
3. Independent Weaving Units 150 38,100 Shuttle Less Looms 4. Finishing Units 115 5. Garments Units 800
Sub-Sector No. of Units Size Prod. 1. Independent Weaving Units 500 11,000 Looms 2. Power Looms 28,900 Looms Total: 369,000 Looms (Conventional Looms)
Table
Year
2: Share of Pakistan Textile Industry Exports
Value: US$ 000
2013-14 25.1 13.8 55 % 2014-15 23.7 13.2 56 % 2015-16 20.8 12.9 58 % 2016-17 20.4 12.5 61 % 2017-18 23.2 13.5 58 % 2018-19 22.9 13.3 58 % 2019-20 21.5 12.5 59% 2020-21 25.3 15.4 61.1% 2021-22 23.3 14.2 61.2%
Source: State Bank of Pakistan of Pakistan. Table
Table 3: Pakistan Textile Industry 2021 - 2022
Exports 57 % Share Manufacturing 46 % Share Employment 40 % Share GDP 8.5 % Share
Market capitalization (Listed Companies) 5.0 % Share
Cotton Production 4th Largest Spinning Capacity 3rd Largest in Asia Bank Credit Share 40 %
Source: Pakistan Economic Survey, SBP, TDAP.
43 Annual Fact File 2022
Pakistan
Total Exports Textile Exports Share of Textile Exports
Textiles
2017-18 2018-19
4: Export of Pakistan
Value: US$ 000 Category 2016-17
2019-20 2020-21 2021-22 Cotton & Cotton Textiles 12,205 13,220 13,031 12,212 15,029 13,891 Synthetic Textiles 187 310 298 315 370 343 Wool & Woolen Textile 78 76 67 54 74 61 Total Textiles 12,529 13,606 13,396 12,580 15,474 14,295 All Exports 20,448 23,222 22,979 21,394 25,304 23,355 Textile as % of Total Exports 61.3% 58.6% 58.3% 58.8% 61.1% 61.2%
Source: (i) Pakistan Bureau of Statistics. (ii) Textile Commissioner Organisation, Government of Pakistan.
Pakistan
Table 5: Export of Raw Cotton
Value: US$ 000
Year Quantity (Tonnes) Value (US $ 000) Unit Value ($/Kg.)
1990-91 281,731 411,812 1.46 1991-92 455,217 518,302 1.14 1992-93 262,918 270,813 1.03 1993-94 74,899 79,461 1.06 1994-95 31,009 62,082 2.00 1995-96 310,930 506,765 1.63 1996-97 20,958 30,749 1.47 1997-98 88,650 126,139 1.42 1998-99 1,748 2,327 1.33 1999-00 82,959 72,560 0.87 2000-01 135,094 138,138 1.02 2001-02 34,926 24,581 0.70 2002-03 55,100 49,016 0.89 2003-04 37,307 47,671 1.28 2004-05 117,084 109,957 0.94 2005-06 62,658 68,151 1.09 2006-07 45,065 50,226 1.11 2007-08 55,932 70,122 1.25 2008-09 78,241 87,382 1.10 2009-10 160,136 195,598 1.22 2010-11 144,272 364,802 2.53 2011-12 256,541 462,274 1.80 2012-13 92,538 153,929 1.66 2013-14 114,671 205,136 1.79 2014-15 95,017 147,060 1.55 2015-16 49,315 76,631 1.55 2016-17 25,462 43,567 1.71 2017-18 35,262 58,227 1.65 2018-19 12,992 20,396 1.57 2019-20 12,778 17,002 1.33 2020-21 594 807 1.36 2021-22 2,753 6,577 2.39
Source: Trade Development Authority of Pakistan
44 Annual Fact File 2022
PAKISTAN TEXTILE JOURNAL - December 2022
Table 6: Country-wise Export of Cotton Yarn
Value: US$ 000
Country 2017-18 2018-19 2019-20 2020-21 2021-22
China 869,780 707,923 676,847 686,044 615,127
Turkey 72,540 44,442 47,839 31,960 53,828
Italy 30,091 24,554 17,667 21,310 43,413
Portugal 56,472 42,808 34,563 43,564 59,600
Germany 12,346 11,502 10,994 9,041 17,012
Korea Republic 34,004 26,602 1,989 22,257 24,543
Russian Federation 4,429 2,649 1,144 1,378 998
Japan 33,791 30,854 24,784 22,299 37,193
Bahrain 9,318 5,306 1,525 202U.S. America 13,532 22,457 18,650 18,553 35,341
Belgium 8,599 6,086 5,000 3,224 5,046
Vietnam 5,914 8,915 6,166 5,043 6,661
Malaysia 6,347 4,515 5,446 6,332 4,563 Philippines 2,275 3,815 1,458 663 2,140
Sir Lanka 1,666 1,815 4,077 8,165 15,726
Egypt 8,428 6,831 3,014 2,103 6,476
United Kingdom 2,054 2,028 1,624 2081 1,994
Spain 5,586 4,589 3,151 2,477 4,829
All others 1,371,919 167,728 118,963 38,273 272,299
Total 1,371,919 1,125,419 984,901 1,016,969 1,206,789
Source: Trade Development Authority of Pakistan.
45 Annual Fact File 2022
Pakistan
Pakistan
Table 7: Country-wise Export of Cotton Fabrics
Value: US$ 000
Country 2017-18 2018-19 2019-20 2020-21 2021-22
Bangladesh 479,254 482,481 430,747 414,741 595,643
Turkey 162,608 125,511 101,165 130,809 159,368
Italy 163,869 144,842 123,294 129,313 177,189
United Kingdom 56,130 49,646 35,228 33,170 50,436
Portugal 86,869 78,567 81,245 99,010 129,820
Netherlands 69,860 75,488 67,788 58,778 90,894
Japan 32,644 30,937 27,968 29,631 26,699
China 122,449 89,744 63,783 62,479 55,006
South Africa 41,021 39,711 37,806 36,148 48,888
Mexico 35,346 34,665 22,797 22,057 32,528
Belgium 58,936 43,897 41,582 37,248 51,116
Korea Republic 35,283 35,773 37,818 54,014 34,184
Spain 85,955 82,296 71,420 70,220 95,228
Egypt 49,835 52,816 48,923 51,701 57,084
U.S. America 90,042 112,414 136,224 180,948 174,214
Thailand 10,897 6,968 4,017 4,376 5,274
Greece 15,228 14,117 11,041 8,767 14,549
Vietnam 36,371 32,680 27,498 27,032 40,403
Indonesia 17,708 17,558 15,148 13,587 18,911
All others 553,282 551,702 444,409 456,972 580,441
Total 2,203,587 2,101,813 1,829,901 1,921,001 2,437,875
Source: Trade Development Authority of Pakistan.
46 Annual Fact File 2022
PAKISTAN TEXTILE JOURNAL - December 2022
Table 8: Country-wise Exports of Textile Made-ups
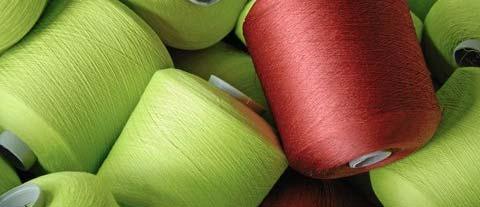
Value: US$ 000
Country 2017-18 2018-19 2019-20 2020-21 2021-22
U.S. America 436,016 447,226 376,256 162,952 188,072
United Kingdom 67,130 60,637 48,982 64,226 64,411 Germany 5,606 36,844 38,641 38,233 45,144 Netherlands 17,073 15,103 16,112 36,094 46,564 Italy 13,993 13,253 13,558 18,610 24,672 Canada 10,951 11,420 8,451 4,816 5,524 France 1,4763 12,822 9,969 14,004 19,841 Denmark 7,117 7,380 4,611 6,194 8,355 South Africa 7,184 8,504 6,164 2,806 3,227 China 5,159 2,598 1,716 7,906 4,992 Poland 6,237 8,253 7,529 9,035 10,777 Japan 3,062 4,909 4,927 4,567 5,511 Spain 5,087 5,948 5,937 13,888 22,089
Other Countries 85,433 45,074 47,664 373,019 399,940
Total 684,811 679,971 590,517 756,350 849,119
Pakistan.
47 Annual Fact File 2022
Pakistan
Source: Trade Development Authority of
Pakistan
Table 9: Country-wise Export of Readymade Garments
Value: US$ 000
Country 2017-18 2018-19 2019-20 2020-21 2021-22
U.S. America 552,627 622,772 604,261 204,856 315,265
Spain 348,204 344,528 291,210 510,434 717,250
United Kingdom 327,256 295,845 288,062 867,756 965,320
Germany 324,659 286,967 278,997 567,217 671,347
Belgium 170,870 145,909 108,987 195,412 283,672
Netherlands 142,321 200,683 240,259 467,063 644,958
Italy 92,735 1,707,608 108,552 172,710 230,160
France 80,088 82,078 73,699 135,106 151,087
Poland 71,572 78,805 67,760 111,225 127,907 Sweden 52,764 47,244 36,766 55,895 62,491
Denmark 57,805 72,815 82,447 137,976 126,134 Canada 36,684 39,132 41,152 82,106 114,489
Japan 18,282 15,795 11,909 29,265 32,850 Australia 19,019 19,047 18,405 54,137 58,146
Portugal 10,788 11,235 13,460 20,975 35,951
Hong Kong 4,693 4,701 4,176 5,664 7,231
South Africa 4,336 4,518 6,466 18,202 16,313
Turkey 8,302 8,985 9,313 8,972 9,681
Other Countries 254,213 1,334,947 266,365 612,160 665,597
Total 2,577,218 2,653,720 2,552,246 3,032,811 3,904,655
Source: Trade Development Authority of Pakistan.
48 Annual Fact File 2022
PAKISTAN TEXTILE JOURNAL - December 2022
Table 10: Country-wise Export of Knitwear (Hosiery)
Value: US$ 000
Country 2017-18 2018-19 2019-20 2020-21 2021-22
U.S. America 963,797 1,083,225 999,633 2,048,564 3,152,652
United Kingdom 427,183 418,566 397,438 867,756 965,320
Germany 218,624 224,263 253,117 567,217 671,347
Spain 202,811 221,320 191,508 510,434 717,250
Canada 50,280 50,570 47,985 82,106 114,849
Belgium 147,808 121,775 101,790 195,412 283,672
France 65,986 59,624 65,742 135,106 151,087
Sweden 13,687 14,067 13,999 55,895 62,491
Saudi Arabia 5,544 8711 10,068 40,155 43,390
Denmark 21,875 23,890 22,860 137,976 126,134
China 25,136 32,668 35,418 58,392 58,432
Mexico 12,702 15,725 16,754 23,910 40,296
Japan 20,888 24,098 28,941 29,265 32,850
Portugal 3,387 5,025 4,868 20,975 35,951
Poland 20,584 30,764 25,585 111,225 127,907
Netherlands 197,378 2,34,612 242,388 467,063 644,958
Italy 58,057 62,951 63,608 127,710 230,160
Turkey 5,547 4,207 7,460 8,972 9,681
Other Countries 249,927 498,428 265,201 1,673,134 2,347,389
Total 2,711,201 2,899,877 2,794,363 3,814,999 5,121,038
Source: Trade Development Authority of Pakistan.
49 Annual Fact File 2022 Pakistan
Pakistan
Table 11: Country-wise Export of Towels
Value: US$ 000
Country 2017-18 2018-19 2019-20 2020-21 2021-22
United Kingdom 77,356 78,036 65,801 95,161 105,099
Mexico 985 888 708 964 585
Germany 42,273 38,972 36,978 49,950 55,097
Spain 32,590 32,482 29,452 28,350 50,586 Italy 36,707 37,996 29,038 36,161 52,396
Netherlands 43,466 49,427 56,452 67,499 102,753
South Africa 10,585 9,621 11,687 14,114 50,586
Greece 12,193 14,813 10,521 8,014 16,350
Belgium 20,061 15,046 14,600 16,684 21,149
Saudi Arabia 3,525 8,752 7,371 12,147 14,641
Chile 3,876 2,671 2,074 3,135 4,291
Portugal 3,633 3,240 3,278 1,424 2,744 Malaysia 5,432 4,219 4,234 4,602 8,774
Poland 15,305 20,084 22,723 22,993 29,441
Kuwait 1304 1,397 1,571 1,629 2,079 Kenya 994 1,333 1,606 3,326 4,716 Philippines 654 409 456 668 870
U.S. America 357,026 345,115 298,812 430,517 556,458
Canada 10,479 11,000 9,369 9,503 11,221
France 18,680 17,470 15,412 16,108 33,431 Denmark 4,397 4931 5,687 8,930 13,926 Sweden 3,287 3,756 2,797 4,290 5,681
Other Countries 92,573 84,462 80,638 101,367 31,538
Total 797,381 786,120 711,265 937,536 1,111,336
Source: Trade Development Authority of Pakistan.
50 Annual Fact File 2022
PAKISTAN TEXTILE JOURNAL - December 2022
Table 12: Country-wise Export of Bedwear
Value: US$ 000
Country 2017-18 2018-19 2019-20 2020-21 2021-22
U.S. America 484,898 479,836 501,394 639,839 778.857
United Kingdom 403,654 425,668 335,643 485,312 484,350
Germany 240,845 210,449 241,020 286,867 349,892
Netherlands 185,828 177,241 177,666 265,766 334,243
Italy 119,382 102,231 101,100 127,921 173,565
Australia 47,222 43,534 68,139 86,826 83,988
Spain 107,915 97,921 91,430 105,421 162,064
France 110,186 91,019 95,094 112,741 153,564
Canada 26,563 26,363 21,033 27,459 31,754
China 18,184 15,202 7,890 6,170 37,243
Poland 35,770 33,194 36,086 54,265 67,061
Sweden 29,596 23,219 26,651 39,610 41,906
Denmark 37,049 36,364 34,560 44,651 63,766
Ireland 23,275 21,341 19,620 24,514 33,314
Chile 23,601 24,931 15,054 23,388 50,130
Malaysia 9,422 10,430 14,020 12,520 16,211
Saudi Arabia 8,156 10,946 8,018 7,929 6,093
Greece 15,249 11,566 16,110 15,310 24,960
South Africa 6,485 8,685 7,101 6,365 7,148
Slovenia 26,924 20,463 34,678 36,693 44,417
U.A.E 26,832 30,588 27,189 30,676 34,326
Norway 15,028 14,166 21,154 21,474 24,487
All others 259,005 237,550 250,183 310,072 1,067,621
Total 2,261069 2,137,705 2,150,833 2,771,787 3,292,882
Source: Trade Development Authority of Pakistan.
51 Annual Fact File 2022
Pakistan
Pakistan
Table 13:Import of Viscose Fibre in Pakistan
Year Quantity (Million Kgs)
Value (Rs. Million)
2017-18 140 31,846 2018-19 183 45,612 2019-20 147 33,370 2020-21 217 51,742 2021-22 202 71,509
Source: Pakistan Federal Bureau of Statistics.
Table 14: Country wise Imports of Viscose Fibre in Pakistan
Value: US$ 000 QTY;000 kgs
Country 2019-20 2020-21 2021-22
Indonesia 59,235 13,029 90,039 21,309 105,379 36,728
China 51,721 12,107 100,362 23,381 60,979 21,838
Thailand 25,212 5,638 11,523 2,805 22,489 7,753
Asian Countries 7843 1,803 11,251 3,059 9,588 3,509
Austria 617 244 2,204 760 2,060 1,311
European Union 907 225 1,611 325 587 193 All others 1,165 11,926 427 101 537 177
Total 146,700 33,370 217,420 51,742 201,619 71,509
Source: Trade Development Authority of Pakistan.
Table 15: Country-wise Export of Textile Madeups (Excl. Bedwear and Towels) Value: US$ 000
Country 2017-18 2018-19 2019-20 2020-21 2021-22
U.S. America 436,016 1,447,226 376,256 162,952 188,072
United Kingdom 67,130 60,637 48,982 64,226 64,411
Germany 42,450 36,844 38,641 38,233 45,144
Netherlands 17,037 15,103 16,112 36,094 46,564
Italy 13,993 13,253 13,558 18,610 24,672
Belgium 10,259 9,782 12,075 188,303 208,860
France 14,763 12,822 9,969 14,004 19,841
Spain 5,887 5,948 5,937 13,888 22,089
China 5,159 2,598 1,716 7,906 4,992
Canada 10,951 11,420 8,451 4,816 5,524
South Africa 7,184 8,504 6,164 2,806 3,227
Poland 6,237 8,253 7,529 9,035 10,777
UAE 4,581 3,895 5,080 55,069 64,288
Denmark 7,117 7,380 4,611 6,194 8,355
Australia 3,738 3,471 3,937 100,509 97,284
All others 32,309 967,165 31,489 33,705 35,019
Total 684,811 679,971 590,507 756,350 849,119
Source: Trade Development Authority of Pakistan.
52 Annual Fact File 2022
PAKISTAN TEXTILE JOURNAL - December 2022
Quantity Value Quantity Value Quantity Value
Table
Year Cotton Yarn Cotton Cloth
18: Textile Exports by Major Categories Value: US$
000
Tent & Canvas Towels Bed wear Textile Made-ups Garments
Hosiery
1990-91 1,183.0 675.8 79.6 129.4 246.2 108.9 497.1 333.6 1991-92 1,172.5 819.4 51.2 136.7 284.0 113.5 613.5 425.1 1992-93 1,121.5 863.1 39.9 139.0 351.6 125.5 617.7 464.1 1993-94 1,259.3 820.6 29.1 129.2 285.6 129.4 612.2 509.1 1994-95 1,528.1 1,081.4 38.2 144.8 340.2 163.5 641.7 688.5 1995-96 1,540.3 1,275.9 39.5 174.1 422.2 179.1 648.5 703.4 1996-97 1,411.5 1,262.4 36.2 194.1 456.3 208.7 736.4 688.9 1997-98 1,159.5 1,250.3 58.1 200.1 508.8 245.8 746.5 696.7 1998-99 945.2 1,115.2 40.8 177.7 611.0 255.3 651.2 742.1 1999-00 1,071.6 1,096.2 52.9 195.6 709.9 307.6 771.7 886.7 2000-01 1,076.6 1,035.0 50.0 243.0 734.9 328.2 827.5 910.3 2001-02 942.3 1,132.7 47.4 269.8 918.5 351.3 882.0 841.5 2002-03 928.3 1,345.6 73.2 374.8 1,329.0 359.7 1,092.6 1,146.6 2003-04 1,127.0 1,711.5 74.7 403.5 1,383.3 416.6 993.3 1,458.7 2004-05 1,057.0 1,863.0 66.6 520.5 1,449.5 466.0 1,087.9 1,635.0 2005-06 1,382.9 2,108.2 38.9 587.6 2,038.1 417.9 1,309.9 1,751.5 2006-07 1,428.0 2,026.5 69.1 610.7 1,995.9 471.2 1,547.3 1,798.5 2007-08 1,300.9 2,010.6 71.0 613.1 1,903.5 537.1 1,592.4 1,732.1 2008-09 1,114.8 1,955.3 56.2 642.9 1,735.0 480.1 1,230.0 1,740.7 2009-10 1,433 1,800 61.5 668.2 1,744.2 537.2 1,269.3 1,764.9 2010-11 2,201 2,623 46.9 762.3 2,088.9 624.9 1,773.6 2,305.6 2011-12 1,810 2,442 92.1 686.4 1,741.6 591.4 1,615.6 1,982.8 2012-13 2,253 2,690 117.5 769.6 1,785.4 598.6 1,799.6 2,043.0 2013-14 1,997 2,770 77.8 767.5 2,137.7 659.9 1,909.3 2,293.7 2014-15 1,849 2,453 126.6 797.2 2,103.1 654.9 2,095.1 2,406.5 2015-16 1,265 2,214 85.1 602.9 2,019.9 628.2 2,195.2 2,363.6 2016-17 1,244 2,136 133.8 800.6 2,137.7 638.2 2318.8 2,361.4 2017-18 13,712 2,203 85.3 797.4 2,261.1 684.8 2,577.2 2,711.2 2018-19 1,254 2,202 82.4 786.1 2,261.8 679.9 2,653.7 2,899.9 2019-20 985 1,830 98.5 711.3 2,150.8 590.5 2,552.6 2,794.5 2020-21 1,017 1,921 110.3 937.5 2,771.7 756.3 3,032.8 3,815.1 2021-22 1,207 2,438 110.4 1,111 3,293.5 849.1 3,904.6 5,121.0
Source: Trade Development Authority of Pakistan
Pakistan
53 Annual Fact File 2022
Pakistan
Year
Table 19: Pakistan Cotton Textile - Average Unit Value
Raw Cotton Cotton Yarn Cotton Fabric Towels Bed wear Knitwear Garments
$ / kg. $ / kg. $ / sq. Mtrs. $ / kg. $ / kg. $ / doz. $ / doz.
1994-95 2.00 2.93 0.93 4.73 6.53 21.24 23.28 1995-96 1.63 2.87 0.96 4.88 6.76 23.42 24.52 1996-97 1.46 2.78 1.02 4.74 6.35 24.85 24.93 1997-98 1.42 2.51 0.98 4.58 6.27 23.67 27.86 1998-99 1.33 2.44 0.82 4.05 5.51 22.85 23.29 1999-00 0.87 2.09 0.70 3.82 5.36 22.55 25.37 2000-01 1.03 1.96 0.60 3.58 4.96 23.15 22.89 2001-02 0.70 1.73 0.58 3.39 5.10 23.40 21.18 2002-03 0.89 1.78 0.66 3.68 5.48 21.98 29.67 2003-04 1.28 2.24 0.72 3.97 5.63 22.00 36.00 2004-05 0.94 2.09 0.76 3.70 5.41 22.78 32.93 2005-06 1.02 2.04 0.80 3.68 5.50 23.33 35.94 2006-07 1.12 2.11 0.91 3.79 5.36 21.04 33.81 2007-08 1.18 2.30 1.01 4.01 5.66 18.95 38.81 2008-09 1.03 2.28 0.95 3.87 5.14 17.10 36.04 2009-10 2.51 3.49 1.22 3.47 6.05 17.68 50.39 2010-11 2.53 4.11 1.12 4.39 6.79 18.39 51.63 2011-12 1.80 3.14 1.24 4.75 7.02 20.24 64.26 2012-13 1.66 3.05 1.29 4.52 6.75 19.44 65.41 2013-14 1.78 3.01 1.18 4.47 6.75 19.40 66.03 2014-15 1.55 2.74 1.25 4.71 6.48 21.76 68.78 2015-16 1.55 2.82 1.05 4.46 6.17 19.78 68.47 2016-17 1.72 2.73 1.08 4.30 6.04 20.86 66.61 2017-18 1.65 2.63 0.98 3.88 6.05 25.07 64.24 2018-19 1.61 2.60 0.80 4.17 5.54 23.76 49.96 2019-20 1.33 2.39 0.77 4.11 5.31 26.36 52.53 2020-21 1.36 2.61 4.49 4.40 5.96 21.52 81.42 2021-22 2.39 3.60 5.48 5.02 6.38 30.55 70.16
Source: Trade Development Authority of Pakistan.
54 Annual Fact File 2022 PAKISTAN TEXTILE JOURNAL - December 2022
Table 20: Imports of Textile Machinery
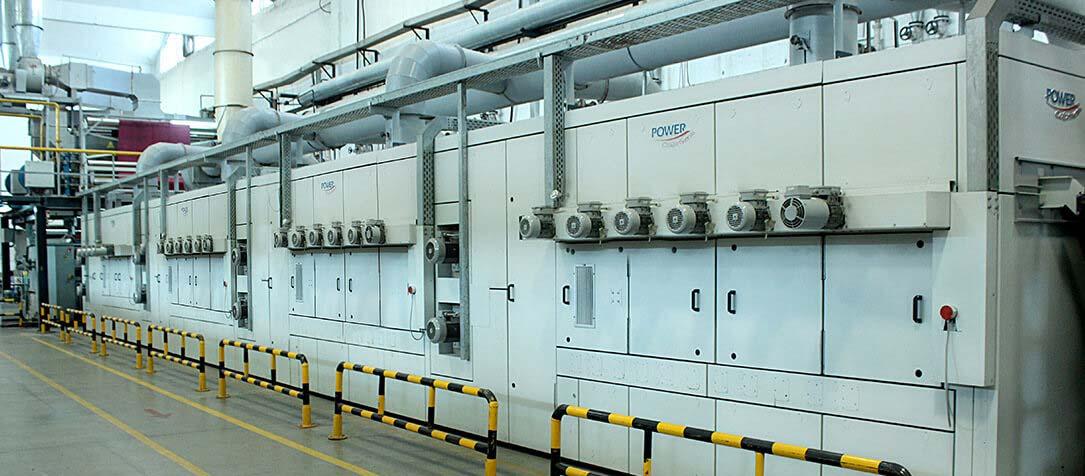
Year Value (US$ Million)
Growth %
2002-03 531.90 30.95 2003-04 597.90 12.41 2004-05 928.60 55.31 2005-06 817.24 (11.99) 2006-07 502.97 38.46 2007-08 425.26 (15.45) 2008-09 252.14 (40.71) 2009-10 349.08 38.45 2010-11 456.74 30.84 2011-12 444.50 (2.68) 2012-13 388.40 12.62 2013-14 599.22 54.28 2014-15 449.48 (24.99) 2015-16 461.51 2.68 2016-17 556.83 20.65 2017-18 543.78 (2.34) 2018-19 537.99 (1.06) 2019-20 437.32 (18.71) 2020-21 592.08 35.39 2021-22 768.98 29.88
Annual Fact File 2022
Pakistan
Source: Pakistan Bureau of Statistics
Pakistan
Table 21: Import of Textile
Machinery
Machinery in
Value: Rs. 000
Pakistan (Major Items)
2017-18 2018-19 2019-20 2020-21 2021-22
Carding Machines 1,486,727 3,589,488 4,486,573 4,578,972 7,505,071
Drawing / Roving Machines 1,815,260 3,070,766 4,233,316 3,214,431 7,295,733
Blow Room Machinery 9,016,674 1,623,760 2,465,938 1,526,145 3,322,870
Machinery for Preparation of Textile Fibres 117,063 359,626 194,587 309,784 959,850
Textile Spinning Machines 7,968,789 11,178,081 10,520,923 13,001,401 19,133,103
Textile Doubling or Twisting Machines 630,401 1,467,397 896,479 969,522 982,689
Weft Winding Machines 512,714 585,902 603,788 1,071,817 847,635
Cone / Bobbin Winding Machines 1,185,777 1,610,569 2,611,147 1,892,400 4,190,088
Other Textile Fibre Machines 310,389 4,117,841 1,416,081 4,307,888 6,753,327
Weaving Machinery (looms) 940,892 599,499 893,211 2,698,082 1,712,237
Weaving Machinery (Shuttleless) 7,203,218 9,028,423 6,446,081 16,899,253 25,605,918
Circular Knitting Machines 1,190,031 2,097,217 574,348 1,567,588 1,201,107
Flat Knitting Machines 316,155 558,311 210,313 971,470 612,531
Embroidery Machines including Multi-head 6,630,710 5,511,182 2,802,421 6,005,744 9,474,620
Dobbies, Jacquard, Copy Machines 404,998 438,546 671,914 849,563 457,787
Auxiliary Machines 1,879,060 1,472,646 1,920,289 3,496,767 5,374,525
Tops and Flat Card Clothing 721,240 822,499 900,407 1,169,883 1,180,032 Card Clothing 647,376 825,632 844,914 925,057 1,073,040
Spindle Flyer Ring Travellers 669,666 861,350 920,873 1,115,724 1,394,193
Spindles Textile Machines 371,967 460,833 461,472 594,728 908,001
Spinning Rings 332,522 354,877 319,216 302,815 342,096
Reeds for Looms 144,979 97,425 69,949 76,184 60,313 Healds & Heald Frames 192,234 117,290 1,222,156 224,339 295,862
Sinkers, Needles 504,331 315,145 319,860 469,193 619,295
Bleaching Machines 348,404 536,299 862,573 550,155 74,343
Dyeing Machines 1,643,136 2,952,119 3,245,568 3,772,371 4,363,184
Mercerizing Machines 391,991 780,426 789,259 165,257 126,625
Stentering Machines 697,834 811,743 1,742,137 1,694,062 1,870,100
Other Drying and finishing Machines 4,182,812 2,881,622 3,360,128 2,832,350 4,862,869
Industrial Sewing Machines 3,222,090 5,252,569 3,372,086 5,030,322 15,488,234
Source: Pakistan Bureau of Statistics.
56 Annual Fact File 2022 PAKISTAN TEXTILE JOURNAL - December 2022
Table 1: Bangladesh Garment Factories and Employment
Year
Garment Factories (Number) Employment (Million Workers)
1988-89 725 0.32 1989-90 759 0.34 1990-91 834 0.40 1991-92 1,163 0.58 1992-93 1,537 0.80 1993-94 1,839 0.83 1994-95 2,182 1.20 1995-96 2,353 1.29 1996-97 2,503 1.30 1997-98 2,726 1.50 1998-99 2,963 1.50 1999-00 3,200 1.60 2000-01 3,480 1.80 2001-02 3,618 1.80 2002-03 3,760 2.00 2003-04 3,957 2.00 2004-05 4,107 2.00 2005-06 4,220 2.20 2006-07 4,490 2.40 2007-08 4,743 2.80 2008-09 4,925 3.50 2009-10 5,063 3.60 2010-11 5,150 3.60 2011-12 5,400 4.00 2012-13 5,876 4.00 2013-14 4,222 4.00 2014-15 4,296 4.00 2015-16 4,328 4.00 2016-17 4,482 4.00 2017-18 4,560 4.00 2018-19 4,621 4.00 2019-20 4,582 4..00 2020-21 4,521 4.00 2021-22 4,584 4.00
Source: Bangladesh Garment Manufacturers and Exporters Association (BGMEA)
57 Annual Fact File 2022
Bangladesh
Bangladesh
Year
Table 2: Share of Export of RMG and Total Export of Bangladesh
Export of RMG (US$ Million)
Total Export of Bangladesh (US$ Million)
% of RMGs to Total Export
1986-87 298.67 1,076.61 27.74 1987-88 433.92 1,231.2 35.24 1988-89 471.09 1,291.56 36.47 1989-90 624.16 1,923.70 32.45 1990-91 866.82 1,717.55 50.47 1991-92 1,182.57 1,993.90 59.31 1992-93 1,445.02 2,382.89 60.64 1993-94 1,555.79 2,533.90 61.40 1994-95 2,228.35 3,472.56 64.17 1995-96 2,547.13 3,882.42 65.61 1996-97 3,001.25 4,418.28 67.93 1997-98 3,781.94 5,161.20 73.28 1998-99 4,019.98 5,312.86 75.67 1999-00 4,349.41 5,752.20 75.61 2000-01 4,859.83 6,467.30 75.14 2001-02 4,583.75 5,986.09 76.57 2002-03 4,912.09 6,548.44 75.01 2003-04 5,686.09 7,602.99 74.79 2004-05 6,417.67 8,654.52 74.15 2005-06 7,900.80 10,526.16 75.06 2006-07 9,211.23 12,177.86 75.64 2007-08 10,699.80 14,110.80 75.83 2008-09 12,347.77 15,565.19 79.33 2009-10 12,496.72 16,204.65 77.12 2010-11 17,914.46 22,924.38 78.15 2011-12 19,089.73 24,301.90 78.55 2012-13 21,515.73 27,027.36 79.61 2013-14 24,491.88 30,186.62 81.13 2014-15 25,491.40 31,208.94 81.68 2015-16 28,094.16 34,257.18 82.01 2016-17 28,149.84 34,655.90 81.23 2017-18 30,614.76 36,668.17 83.49 2018-19 34,133.27 40,535.04 84.21 2019-20 27,949.19 33,674.09 83.00 2020-21 31,456.73 38,758.31 81.16 2021-22 42,613.15 52,082.66 81.82
58 Annual Fact File 2022 PAKISTAN TEXTILE JOURNAL - December 2022
Source: Export Promotion Bureau Complied by BGMEA
Table 3: Main Apparel Items Exported from Bangladesh
Value in US$ Million
Year Shirts Trousers Jackets T-Shirt Sweater
2000-01 1,073.59 656.33 573.74 597.42 476.87 2001-02 871.21 636.61 412.34 546.28 517.83 2002-03 1,019.87 643.66 464.51 642.62 578.37 2003-04 1,116.57 1,334.85 364.77 1,062.01 616.31 2004-05 1,053.34 1,667.72 430.28 1,349.71 893.12 2005-06 1,056.69 2,165.25 389.52 1,781.51 1,044.01 2006-07 943.44 2,201.32 1,005.06 2,208.9 1,248.09 2007-08 915.6 2,512.74 1,181.52 2,765.56 1,474.09 2008-09 1,000.16 3,007.29 1,299.74 3,065.86 1,858.62 2009-10 993.41 3,035.35 1,350.43 3,145.52 1,795.39 2010-11 1,566.42 4,164.16 1,887.50 4,696.57 2,488.19 2011-12 1,733.54 4,686.39 2,231.16 4,713.11 2,340.34 2012-13 1,972.89 5,185.48 2,634.28 5,143.22 2,620.73 2013-14 2,173.73 5,690.78 2,973.16 5,863.81 2,932.94 2014-15 2,271.43 5,697.83 3,183.17 6,064.13 2,829.16 2015-16 3,076.36 10,167.31 3,774.08 6,892.80 3,182.47 2016-17 2,918.97 9,943.09 3,546.88 6,650.51 3,361.53 2017-18 2,927.34 10,833.83 3,978.47 7,153.84 3,674.70 2018-19 3,190.23 11,754.86 4,384.81 7,902.27 4,255.91 2019-20 2,449.65 9,362.64 3,514.21 6,273.77 3,597.68 2020-21 2,048.40 10,681.52 4,514.21 7,239.74 4,051.83 2021-22 2,765.91 14,507.50 3,514.21 9,857.54 5,640.45
Source: BGMEA
Table 4: Total Apparel Export from Bangladesh (Fiscal Year Basis) Value in US$ Million
Year Woven Knitted Total 1999-00 3,081.19 1,268.22 4,349.41 2000-01 3,364.32 1,495.51 4,859.83 2001-02 3,124.82 1,458.93 4,583.75 2002-03 3,258.27 1,653.82 4,912.09 2003-04 3,538.07 2,148.02 5,686.09 2004-05 3,598.20 2,819.47 6,417.67 2005-06 4,083.82 3,816.98 7,900.80 2006-07 4,657.63 4,553.60 9,211.23 2007-08 5,167.28 5,532.52 10,699.80 2008-09 5,918.51 6,429.26 12,347.77 2009-10 6,013.43 6,483.29 12,496.72 2010-11 8,432.40 9,482.06 17,914.46 2011-12 9,603.34 9,486.39 19,089.73 2012-13 11,039.85 10,475.88 21,515.73 2013-14 12,442.07 12,049.81 24,491.88 2014-15 13,064.61 12,426.79 25,491.40 2015-16 14,738.74 13,355.42 28,094.16 2016-17 14,392.59 13,757.25 28,149.84 2017-18 1,5426.25 15,188.15 30,614.76 2018-19 17,244.73 16,888.54 34,133.27 2019-20 14,041.19 13,908.00 27,949.19 2020-21 14,496.70 16,960.03 31,456.73 2021-22 19,398.84 23,214.32 42,613.16
Source: Export Promotion Bureau Compiled by BGMEA
Bangladesh
59 Annual Fact File 2022
Year
Table 5: Total Value of Apparel Exports from Bangladesh (Calendar year basis)
(Value in US$ Million) Woven Knitted Total
1996 1,942.37 686.27 2,628.64 1997 2,621.33 810.49 3,431.82 1998 2,871.06 976.29 3,847.35 1999 2,987.73 1,169.90 4,157.63 2000 3,376.49 1,448.22 4,824.71 2001 3,162.28 1,432.72 4,595.00 2002 3,076.28 1,573.40 4,649.68 2003 3,398.84 1,850.36 5,249.20 2004 3,686.78 2,532.62 6,219.40 2005 3,689.60 3,210.48 6,900.08 2006 4,544.83 4,388.67 8,933.50 2007 4,608.40 4,741.93 9,350.33 2008 5,655.50 6,223.42 11,878.92 2009 5,695.88 6,194.61 11,890.49 2010 7,067.34 7,787.26 14,854.60 2011 9,252.80 9,961.67 19,214.47 2012 10,117.43 9,670.71 19,788.14 2013 12,052.30 11,448.68 23,500.98 2014 12,421.26 12,162.70 24,583.96 2015 13,805.44 12,797.26 26,602.70 2016 14,931.33 13,736.95 28,668.29 2017 14,673.99 14,538.94 29,212.93 2018 16,681.04 16,245.84 32,926.88 2019 16,630.64 16,441.74 33,072.38 2020 13,242.36 14,228.87 27,470.73 2021 16,216.38 19,595.49 35,811.87 2022 6,870.63 8,985.57 15,856.20
60 Annual Fact File 2022 PAKISTAN TEXTILE JOURNAL - December 2022
Source: BGMEA Bangladesh
Year
Table 1: India’s Exports of Cotton Textile
Value in US$ Billion
Yarns Fabrics Madeups Total
Value % Share Value % Share Value % Share Value % Share
2017-18 3.42 32 2.16 20 5.13 48 10.71 100
2018-19 3.90 34 2.42 21 5.25 45 11.57 100
2019-20 2.77 27 2.48 24 4.94 49 10.19 100
2020-21 2.80 27 2.30 23 5.01 50 10.11 100 2021-22 2.82 27 3.10 25 4.99 50 16.42 100
Source: GTIS / Texprocil
Table 2: India’s Country wise Exports of Cotton Textile
Country Million United States Dollars % Share % Change 2019-20 2020-21 2021-22 2019-20 2020-21 2021-22 2022/2021
World 8,721.71 8,768.25 13,607.18 100.00 100.00 100.00 55.19
United States 2252.43 2,604.54 3,311.98 25.83 29.70 24.34 27.16
Bangladesh 1,068.30 1,018.68 3,015.92 12.25 11.62 22.16 196.06
China 611.32 694.04 799.84 7.01 7.92 5.88 15.24
Sri Lanka 338.30 318.83 479.66 3.88 3.64 3.53 50.44
South Korea 195.75 204.79 297.80 2.24 2.34 2.19 45.42
Egypt 222.16 145.13 281.90 2.55 1.66 2.07 94.24
Portugal 160.42 131.58 267.56 1.84 1.50 1.97 103.35
Germany 239.75 219.72 264.45 2.75 2.51 1.94 20.36
United Kingdom 218.82 198.70 243.84 2.51 2.27 1.79 22.72
Vietnam 137.94 184.11 220.28 1.58 2.10 1.62 19.64
Turkey 77.31 70.31 218.88 0.89 0.80 1.61 211.30
UAE 163.47 189.08 215.82 1.87 2.16 1.59 14.14
Peru 142.56 150.32 212.84 1.63 1.72 1.56 41.12
Colombia 117.59 103.29 206.20 1.35 1.18 1.52 99.63
Italy 123.62 97.63 168.59 1.42 1.11 1.24 72.68
Source: GDGCIS / MOC
India
61 Annual Fact File 2022
India
Country
Table 3: India’s Exports of Cotton Yarns
Million United States Dollars
% Share % Change 2019-20 2020-21 2021-22 2019-20 2020-21 2021-22 2022/2021
World 2,774.19 2,806.17 5,518.93 100.00 100.00 100.00 96.67
Bangladesh 591.09 671.90 2,310.15 21.31 23.94 41.86 243.83
China 586.49 667.96 777.33 21.14 23.80 14.08 16.37
Portugal 147.61 121.85 251.03 5.32 4.34 4.55 106.01
Egypt 179.78 124.92 241.49 6.48 4.45 4.38 93.32
Turkey 59.93 59.90 199.50 2.16 2.13 3.61 233.07
Vietnam 118.87 168.73 197.67 4.28 6.01 3.58 17.16
Peru 128.29 141.05 193.35 4.62 5.03 3.50 37.08
South Korea 97.10 95.76 148.26 3.50 3.41 2.69 54.82
Sri Lanka 75.90 78.46 114.61 2.74 2.80 2.08 46.07
Guatemala 22.80 26.51 93.24 0.82 0.94 1.69 251.75
Source: DGCIS / MOC
Table 4: India’s Exports of Cotton Fabrics
Country Million United States Dollars % Share % Change 2019-20 2020-21 2021-22 2019-20 2020-21 2021-22 2022/2021
World 2,230.40 2,004.94 3,101.70 100.00 100.00 100.00 54.70
Bangladesh 476.51 346.22 704.72 21.36 17.27 22.72 103.55
Sri Lanka 254.80 233.61 356.31 11.42 11.65 11.49 52.52
United States 126.60 192.42 268.34 5.68 9.60 8.65 39.45
Senegal 115.34 94.86 159.23 5.17 4.73 5.13 67.86
South Korea 91.44 100.58 139.23 4.10 5.02 4.49 38.44
Colombia 53.10 36.30 105.91 2.38 1.81 3.41 191.81
Nepal 49.64 88.55 100.71 2.23 4.42 3.25 13.73
UAE 71.74 60.67 90.64 3.22 3.03 2.92 49.39
Nepal 53.71 70.40 77.28 2.41 3.51 2.49 9.77
Sudan 77.93 62.58 57.95 3.49 3.12 1.87 -7.40
Source: DGCIS / MOC
62 Annual Fact File 2022 PAKISTAN TEXTILE JOURNAL - December 2022
Table 5: India’s Exports
Country Million United States Dollars
of Cotton Made-ups
% Share % Change 2019-20 2020-21 2021-22 2019-20 2020-21 2021-22 2022/2021
World 3,717.12 3,957.14 4,986.55 100.00 100.00 100.00 26.01
United States 2,108.53 2,386.99 2,995.87 56.72 60.32 60.08 25.51
United Kingdom 196.70 180.63 216.30 5.29 4.56 4.34 19.74
Germany 170.13 158.80 179.69 4.58 4.01 3.60 13.15
Canada 97.76 106.89 150.90 2.63 2.70 3.03 41.17
France 93.55 96.62 137.73 2.52 2.44 2.76 42.54
Australia 84.45 115.06 129.90 2.27 2.91 2.60 12.90
UAE 88.32 124.11 108.66 2.38 3.14 2.18 -12.45
Netherlands 61.85 66.30 92.76 1.66 1.68 1.86 39.91
Spain 47.86 34.11 71.06 1.29 0.86 1.42 108.30 Japan 52.45 51.93 62.61 1.41 1.31 1.26 20.56
Source: DGCIS / MOC
Table 6: India’s Imports of Cotton Textile
Country Million United States Dollars % Share % Change 2019-20 2020-21 2021-22 2019-20 2020-21 2021-22 2022/2021
World 8.72 8.77 13.61 100.00 100.00 0.53 0.53 SAARC 1.54 1.43 3.61 17.62 16.34 -6.77 -6.77 North America (USA/Canada) 2.36 2.72 3.47 27.02 31.00 15.34 15.34
EU27 1.01 0.91 1.38 11.60 10.42 -9.68 -9.68
Zone Africa 1.10 0.93 1.32 12.66 10.65 -15.41 -15.41 Hong Kong / China 0.63 0.71 0.81 7.20 8.14 13.67 13.67 South America/ Mexico 0.40 0.42 0.67 4.60 4.80 4.91 4.91
ASEAN 0.45 0.40 0.54 5.15 4.59 -10.36 -10.36
Middle East 0.36 0.35 0.40 4.16 4.03 -2.71 -2.71 CIS 0.02 0.01 0.02 0.18 0.15 -20.31 -20.31
Source: DGCIS / MOC
63 Annual Fact File 2022
India
Table 1: EU (27) Imports of Textile and Clothing Value in US $ Billion
Details 2019 2020 2021 Jan/Apr 2021 Jan/Apr 2022
Textiles 32.81 52.44 40.01 13.75 14.82
% Growth -4.54% 59.84% -23.70% -8.65% 7.82%
Clothing 89.47 78.43 85.33 26.40 31.98
% Growth -1.07% -12.34% 8.80% 7.18% 21.15%
Total: T & C 122.26 130.78 125.34 40.14 46.80
% Growth -2.02% 7.03% -4.22% 1.18% 16.58%
Source: GTA / Eurostat / Texprocil
European Union
Country
Table 2: EU (27) Export of Textiles and Clothing Value in US$ Billion
January - December
% Growth % Share
2019 2020 2021 Jan./Dec. 2021-2020 Jan.-Dec. 2021 Jan.-Dec. 2022
World 122.27 130.87 125.34 -4.22 100.00 100.00
China 36.98 54.99 41.37 -24.77 33.01 30.42
Bangladesh 17.13 14.46 17.40 20.33 13.88 16.48
Turkey 14.68 14.01 17.24 23.03 13.76 13.98
India 6.92 5.54 7.18 29.57 5.73 6.57
Pakistan 5.07 4.76 5.96 25.37 4.76 5.11
Vietnam 3.95 4.00 4.04 0.85 3.22 3.31
United Kingdom 7.57 7.05 3.73 -47.02 2.98 1.73
Cambodia 3.22 2.56 3.11 21.37 2.48 2.34
Morocco 3.70 2.81 2.85 1.51 2.27 2.40 Cambodia 2.51 2.31 2.52 9.50 2.01 2.02
Source: GTA / Eurostat / Texprocil
64 Annual Fact File 2022 PAKISTAN TEXTILE JOURNAL - December 2022
Country
Table 3: EU (27 Export of Textiles
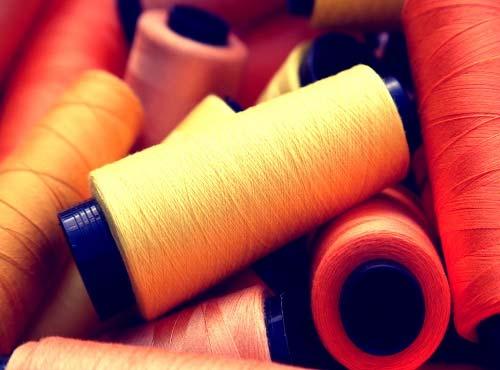
Value in US$ Billion).
January - December
% Growth % Share
2019 2020 2021 Jan./Dec. 2021-2020 Jan/Apr 2021 Jan/Apr 2022
World 32.81 52.44 40.01 -23.70 100.00 100.00
China 11.13 31.37 15.59 -50.31 38.96 38.26
Turkey 4.82 4.80 6.35 32.31 15.87 16.58
India 2.52 2.19 3.16 44.57 7.90 8.70
Pakistan 2.35 2.32 2.87 23.81 7.18 7.72
United Kingdom 2.33 2.28 1.92 -15.63 4.80 3.20
U.S. America 1.14 1.01 1.09 8.34 2.74 2.66
South Korea 1.10 0.98 1.09 11.02 2.73 3.04
Switzerland 0.78 0.72 0.73 1.24 1.83 1.65
Japan 0.74 0.63 0.71 11.80 1.77 1.88
Vietnam 0.47 0.84 0.66 -22.33 1.64 1.87
Source: GTA / Eurostat / Texprocil
65 Annual Fact File 2022
European Union
Table 1: USA Imports of Textile and Clothing Value in US $ Billion
Details 2019 2020 2021 Jan/Apr 2021 Jan/Apr 2022
Textiles 30.43 43.64 37.59 11.73 12.72
% Growth -1.35% 43.41% -13.88% 13.45% 8.42%
Clothing 84.60 68.54 82.80 23.80 32.58
% Growth 1.14% -18.95% 20.82% 9.53% 36.89%
Total: T & C 115.00 112.18 120.39 35.53 45.30
% Growth 0.47% -2.45% 7.32% 10.79% 27.49%
Source: GTA, U.S. Department of Commerce, Bureau of Census
United States of America
Country
Table 2: USA Export of Textiles and Clothing Value in US$ Billion
January - December
% Growth % Share 2019 2020 2021 Jan./Dec. 2021/2020 Jan.-Dec. 2021 Jan.-Apr. 2022
World 115.00 112.18 120.39 7.32 100.00 100.00 China 37.15 42.68 34.39 -19.44 28.56 24.92 Vietnam 14.01 14.05 15.36 9.34 12.76 14.02 India 8.43 7.23 10.42 44.06 8.65 9.31 Bangladesh 9.95 5.36 7.23 35.01 6.01 7.28 Mexico 5.05 4.37 5.24 19.84 4.35 4.02 Indonesia 4.66 3.77 4.45 18.04 3.70 4.77 Pakistan 3.08 3.02 4.27 41.42 3.55 3.66
Cambodia 2.79 3.07 3.70 20.34 3.07 3.46
Turkey 1.93 2.27 2.99 31.55 2.48 2.18 Honduras 2.92 2.07 2.83 37.24 2.35 2.15
Source: GTA, U.S. Department of Commerce, Bureau of Census
66 Annual Fact File 2022 PAKISTAN TEXTILE JOURNAL - December 2022
Country
Table 3: USA Export of Textiles
Value in US$ Billion
January - December
% Growth % Share
2019 2020 2021 Jan.-Dec. 2021/2020 Jan.-Dec. 2021 Jan.-Apr. 2022
World 30.43 43.64 37.59 -13.88 100.0 100.00
China 11.74 24.04 13.92 -42.10 37.03 35.60
India 4.34 4.16 6.19 48.68 16.47 16.54
Mexico 1.79 1.96 2.26 15.38 6.00 5.97
Turkey 1.30 1.54 2.10 36.71 5.59 5.06
Pakistan 1.60 1.59 2.01 26.74 5.36 5.66
South Korea 1.11 1.10 1.24 13.04 3.30 3.68
Vietnam 0.56 1.30 1.08 -17.24 2.87 3.08
Canada 1.13 1.05 1.07 1.68 2.85 2.71
Germany 0.72 0.62 0.75 21.49 2.00 1.80
Taiwan 0.61 0.60 0.69 15.59 1.84 1.98
Source: GTA, U.S. Department of Commerce, Bureau of Census
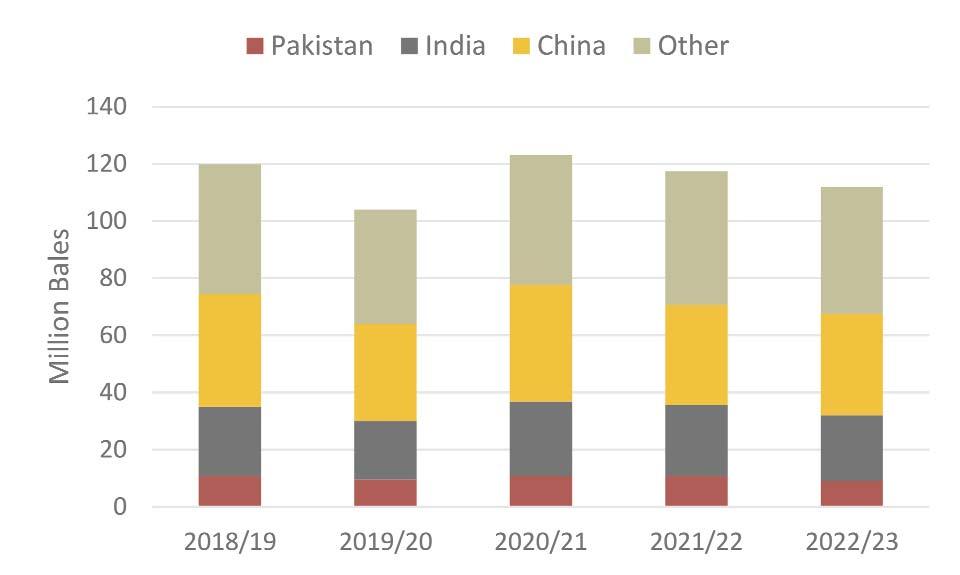
States of America Global Consumption Projected Down Again- 2022/23
Source: United States Department of Agriculture Foreign Agricultural Service
67 Annual Fact File 2022
United
United States of America
Table 4: USA Import of Textile and Apparel
Value in US$ Million
Country - Product 2020 2021 (January - August) 2021 2022 World
Yarn 2,670 3,337 2,178 2,687 Fabric 8,096 9,497 6,275 6,759 Made-up 39,256 32,937 21,345 22,721 Apparel 70,214 85,006 52,849 71,459 Total 120,235 130,776 82,646 103,626
CANADA
Yarn 198 199 134 119 Fabric 644 705 472 487 Made-up 286 281 183 117 Apparel 436 518 283 338 Total 1,565 1,704 1,073 1,121 MEXICO
Yarn 175 183 123 194 Fabric 647 787 520 539 Made-up 1,509 1,672 1,108 1,133 Apparel 2,654 3,264 2,122 2,433 Total 4,985 5,906 3,874 4,299
INDIA
Yarn 179 297 185 256 Fabric 644 1,048 665 845 Made-up 3,673 5,374 3,469 3,484 Apparel 3,067 4,247 2,690 4,192 Total 7,562 10,965 7,009 8,777
PAKISTAN
Yarn 27 39 22 42 Fabric 219 219 145 150 Made-up 1,425 1,880 1,216 1,338 Apparel 1,437 2,274 1,403 1,966 Total 3,108 4,412 2,786 3,496
CHINA
Yarn 347 391 255 282 Fabric 1,894 1,864 1,273 1,192 Made-up 25,425 16,243 10,271 10,858 Apparel 19,377 21,399 12,636 16,565 Total 47,044 39,897 24,436 28,898
KOREA, SOUTH
Yarn 321 393 250 281 Fabric 583 692 467 514 Made-up 227 197 138 150 Apparel 157 190 111 157 Total 1,289 1,471 966 1,102
HONG KONG
Yarn 0 0 0 0 Fabric 3 3 2 3 Made-up 44 17 11 12 Apparel 143 121 57 52 Total 190 141 70 67
Source: U.S Department of Commerce, Office of Textile and Apparel.
68 Annual Fact File 2022 PAKISTAN TEXTILE JOURNAL - December 2022
Continued next Page
Table 4: USA Import of Textile and Apparel
Value in US$ Million
Country - Product 2020 2021 (January - August) 2021 2022
TAIWAN
Yarn 95 118 81 93
Fabric 370 424 258 330 Made-up 209 245 168 179 Apparel 168 182 112 151 Total 842 969 618 754
JAPAN
Yarn 161 156 100 147 Fabric 388 478 314 347 Made-up 32 39 25 26 Apparel 72 91 59 72 Total 653 764 498 591 EU 27
Yarn 563 654 434 547 Fabric 1,498 1,830 1,228 1,267 Made-up 989 1,403 920 1,020 Apparel 2,083 2,769 1,687 2,274 Total 5,133 6,656 4,269 5,108 EU 28
Yarn 563 655 435 547 Fabric 1,499 1,830 1,229 1,268 Made-up 990 1,404 920 1,020 Apparel 2,088 2,775 1,691 2,280 Total 5,139 6,663 4,274 5,114 ASEAN
Yarn 311 455 295 391 Fabric 452 608 390 445 Made-up 2,730 2,608 1,800 2,483 Apparel 21,404 24,370 15,706 21,825 Total 24,896 28,041 18,191 25,144 CBI
Yarn 0 0 0 0 Fabric 0 0 0 0 Made-up 30 26 18 16 Apparel 746 1,013 643 728 Total 776 1,039 661 744
LDDC exc. HAITI
Yarn 9 11 8 8 Fabric 57 65 47 37 Made-up 792 1,057 703 1,025 Apparel 8,965 11,631 7,014 10,544 Total 9,824 12,764 7,772 11,614
W HEMI
Yarn 422 453 303 362 Fabric 1,408 1,615 1,074 1,125 Made-up 2,414 2,345 1,554 1,584 Apparel 10,906 14,703 9,396 11,492 Total 15,150 19,117 12,327 14,563
Source: U.S Department of Commerce, Office of Textile and Apparel.
69 Annual Fact File 2022
United States of America
United States of America
Table 5: USA Export of Textile and Apparel
Value in US$ Million
Country - Product 2020 2021 (January - August) 2021 2022 World
Yarn 3,157 3,916 2,571 3,119 Fabric 7,597 8,522 2,769 5,957 Made-up 3,709 4,076 2,646 2,857 Apparel 4,867 6,138 3,852 4,862 Total 19,331 22,653 14,838 16,795 Canada
Yarn 236 267 174 231 Fabric 1,278 1,450 964 1,016 Made-up 1,740 1,827 1,194 1,361 Apparel 1,587 1,810 1,117 1,427 Total 4,841 5,354 3,450 4,035 MEXICO
Yarn 383 477 311 273 Fabric 3,095 3,570 2,445 2,533 Made-up 766 806 543 552 Apparel 918 1,416 900 1,170 Total 5,161 6,269 4,199 4,627 INDIA
Yarn 29 33 24 32 Fabric 50 55 36 42 Made-up 39 80 43 15 Apparel 33 41 31 32 Total 151 210 134 121
PAKISTAN
Yarn 5 24 15 13 Fabric 2 2 1 1 Made-up 1 13 1 1 Apparel 20 21 14 17 Total 29 60 30 32
CHINA
Yarn 113 132 88 100 Fabric 463 448 305 291 Made-up 110 115 95 46 Apparel 117 153 83 107 Total 804 848 571 544
KOREA, SOUTH
Yarn 67 85 57 76 Fabric 80 73 50 42 Made-up 34 30 21 20 Apparel 89 76 50 67 Total 270 264 177 206
HONG KONG
Yarn 19 21 13 13 Fabric 135 167 116 115 Made-up 34 29 20 16 Apparel 61 55 37 35 Total 248 271 186 179
Source: U.S Department of Commerce, Office of Textile and Apparel.
70 Annual Fact File 2022 PAKISTAN TEXTILE JOURNAL - December 2022
Continued next Page
Table 5: USA Export of Textile and Apparel
Value in US$ Million
Country - Product 2020 2021 (January - August) 2021 2022
TAIWAN
Yarn 15 15 11 7 Fabric 41 62 42 42 Made-up 13 17 12 12 Apparel 23 17 11 11 Total 92 110 76 72
JAPAN
Yarn 110 107 73 79 Fabric 127 122 78 87 Made-up 75 75 50 49 Apparel 175 172 114 135 Total 486 477 314 350 EU 27
Yarn 540 497 343 357 Fabric 817 929 636 576 Made-up 317 322 216 262 Apparel 553 579 356 530 Total 2,228 2,328 1,551 1,725 EU 28
Yarn 540 497 343 357 Fabric 818 931 637 579 Made-up 317 323 216 262 Apparel 554 579 356 530 Total 2,229 2,330 1,552 1,729 ASEAN
Yarn 158 184 115 129 Fabric 281 272 191 193 Made-up 70 87 50 53 Apparel 47 47 31 41 Total 556 590 387 416 CBI
Yarn 4 6 3 3 Fabric 38 40 27 27 Made-up 51 57 32 52 Apparel 39 42 25 37 Total 132 145 87 120
LDDC exc. HAITI
Yarn 7 15 9 7 Fabric 19 17 12 12 Made-up 18 45 14 21 Apparel 64 87 53 32 Total 108 163 87 71
W HEMI
Yarn 1,873 2,559 1,665 2,150 Fabric 5,343 6,112 4,136 4,359 Made-up 2,774 2,976 1,960 2,161 Apparel 3,300 4,447 2,791 3,538 Total 13,291 16,094 10,551 12,208
Source: U.S Department of Commerce, Office of Textile and Apparel.
71 Annual Fact File 2022
United States of America


Archroma...................................................................19 Al Ameen........................................................... FC & 36 AVM Chemicals......................................................6 & 72 Chhipasons.................................................................72 CCI USA.......................................................................3 ITMA 2023...............................................................IBC iTextiles.......................................................................21 Jet Logistics................................................................72 Messe Frankfurt ..........................................................1 Rieter..........................................................................17 Rastgar.............................................................. 31 & 72 Rebus International Inc. ..............................................23 Santex Rimar Group....................................................11 Savio............................................................................9 SPGPrints...................................................................BC Suzhou Liansheng Chemistry.....................................IFC Classified ADVERTISERS INDEX DECEMBER 2022