
// URBAN DESIGNER // ARCHITECT
PORTFOLIO
SELECTED WORKS 2017-2023
RAVI THAKKER
Urban state of mind


This portfolio delves into the captivating relationship between People, Spaces, and Design. Through a curated selection of projects, it explores the interconnectedness of urban design, planning, architecture, and landscape design, with a focus on specific thematic elements in each project. These works showcase a blend of analytical and professional skills, coupled with design thinking approaches and conceptualization. The overarching aim is to view these projects in a larger context, as they connect spatial, social, and sustainable approaches for the built environment. With a strong emphasis on urban design, urban research, and architectural design, this portfolio encapsulates the essence of these themes in a comprehensive and compelling manner.

URBAN DESIGN ECOLOGICAL DESIGN COMMUNITY DESIGN ENGAGEMENT URBAN RESEARCH PUBLICATION 05 Research and documentation of mumbai streets and build typologies Mumbai, Maharastra [RE] CODING MUMBAI 03 Blurring Edges Chicago, Illinois MADISON FOR EVERYONE 01 The odd compromise between human and nature Chicago, Illinois CHICAGO’S NEW NATURE URBAN ANALYSIS 04 Urban Tissue analysis Chicago, Illinois 20 MIN DOWNTOWN PROJECTS PROLOGUE
02 An Urban Design Plan For 35th Street, McKinley Park Chicago, Illinois OUR 35TH
ECOLOGICAL DESIGN
CHICAGO’S NEW NATURE
THE ODD COMPROMISE BETWEEN HUMAN AND NATURE
CHICAGO, ILLINOIS PROJECT LOCATION :
WORK :
ROLE :
ACADEMIC (GROUP)
RESEACH, CONCEPT, DESIGN, DRAWINGS, RENDERS, GRAPHICS
SEMESTER :
GUIDE :
MCD - SPRING SEMESTER 23’
AR.PHIL ENQUIST (SOM)
DR.SEVIN YILDIZ
“The New Nature” is a conceptual framework plan for the Override Studio (MCD) that acknowledges the existing systems and redefines the region’s ecological framework strategies through a systems thinking approach. Chicagoland, being a complex and layered urban landscape, encompasses not only humanmade infrastructure but also natural systems. The studio’s aim is to map these relationships in order to explore new typological arrangements for Override confluences. The framework emphasizes an adaptive repurposing approach to urban design and planning that is climate-responsive.

01
// Green Infrastructure // Form Based Coding // Planning // Resilience // Place- making // Sustainability // Urban Design // Prototyping // Research // Landscape
GIS, InDesign, Illustrator, Photoshop, SketchUp, Vray
OVERVIEW

This studio we are expanding from one connection to address a larger conjunction of ecosystems and its impact on urban fabric, Situating chicago’s location in the larger canvas we see lake michigan (part of great lake) connecting mississippi through, chicago river, des plains and illinois.
ECOLOGICAL ABUNDANCE


series of locks and dams that exist along the Chicago and Illinois Rivers reveals the past and present use of these rivers as engineered systems operational for the shipping and transportation of goods and people.


IDENTITIES AND ISSUES
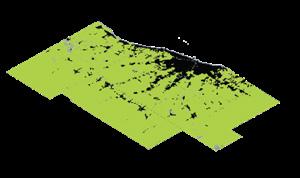
FRAGMENTED NATURE
IMPERVIOUS SURFACE INDUSTRIAL GROWTH FREIGHT LINES


QUARRY FIELDS
WETLAND TO AGRICULTURAL

URBAN SPRAWL FLOOD ZONE


ENGINEERED SYSTEMS

NPK RUNOFF

CHICAGO’S TIMELINE
Urban Sprawl
1848 1889 1892 1900 1914 1916 1922 1972 1973 1989 1996 2014
The
The Sanitary District of Chicago (now The Metropolitan Water Reclamation District) was created by the Illinois legislature
Permanent reversal of the Chicago River was attained
The Illinois and Michigan Canal completed Construction of the 28-mile Sanitary and Ship Canal
The Forest Preserve District of Cook County was established
The 16-mile Cal-Sag Channel was constructed Chicago Adopts the TARP (Tunner and reservoir Plan)
The Sanitary District of Chicago was renamed the Metropolitan Water Reclamation District of Greater Chicago
The Forest Preserves release the Next Century Conservation Plan (NCCP)
The first lands were obtained—500 acres
The Lakefront Protection Ordinance Tthe Forest Preserves help found Chicago Wilderness
WATERWAYS PROFILE


 Early 1800’s original river flow
Engineered Systems to reverse the flow
The island created due to system ‘C’ shaped imapcet zone
Early 1800’s original river flow
Engineered Systems to reverse the flow
The island created due to system ‘C’ shaped imapcet zone
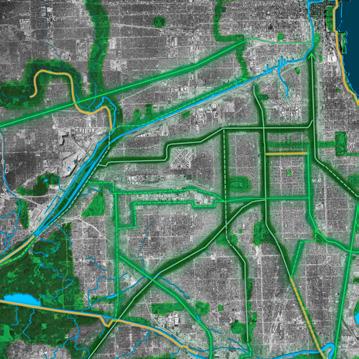
The mapping of Green and blue infrastructure indicate the major confluence points, fragmented and degradation of natural systems, the dispersing urban sprawl. The primary goal is to connected the broken links, allow the natural system to thrive and diffuse into the urban core.
Wildlife move between aquatic, riparian and upland habitats making encroachment a pressing issue as habitat connectivity is lost. Mapping mammal richness along the river and open space networks give us a scope to create spaces that alow biodiversity to thrive by connecting the broken islands of habitat and migration.
This map details the areas where watersheds, rivers, wetlands, and flood prone zones are located. Understanding the flow between watersheds, rivers, and tributaries is vital to understanding where and what interventions should be pursued since these sites act as a funnel into bigger watersheds and ecosystems
ECONOMIC DEMOGRAPHICS GEOMORPHOLOGY
Above map helps us analyze the topography of Chicagoland that shows how Chicago’s terrain shapes ecological systems in the region. Valleys cutting through ridges create a unique geomorphology of streams and gullies that eventually connect to the larger watersheds.


UTILITY INFRASTRUCTURE
The network of utilities that stretch across the city and connect the dense urban fabric to sub-urban and rural communities. these utility corridors allows us to understand how engineered and human made systems are layered on top of natural systems.


This map highlights the economic North- South divide in the Chicago region which shows a legacy of disinvestment on the south and west side. A high rate of housing vacancy is coupled with lower median household incomes between the two rivers (Chicago river and Cal-Sag river)

 GREEN AND BLUE INFRASTRUCTURE
WATERSHED AND FLOOD PRONE ZONE ECOLOGICAL OVERLAPS
GREEN AND BLUE INFRASTRUCTURE
WATERSHED AND FLOOD PRONE ZONE ECOLOGICAL OVERLAPS
PLACETYPES
VISION
Fragmented natural systems need to be restitched to restore the Chicago region’s legacy of rich natural systems, promote coexistence between humans and nature, and catalyze Chicago’s New Nature - an ecology that responds to historical degradation and is innovatively positioned for urban use and resilient climate adaptation - through design, planning, and governance.

CONNECT ADAPT RESTORE
Adapt the built environment to be multipurpose, meeting the needs of people, wildlife, and natural systems.

Restore natural edges and remove physical barriers to improve and conserve natural functions


Guiding Principles and Place-types Connection


GOALS
Ecological Corridor
REGIONAL STRATERGIES
Green Roof Masterplan Reimagined Infrastructure Waterway Adjacencies


Opportunity areas for green roof development and financial and tax incentive recommendations.
Re-imagined infrastrucure connections along abandoned and exisitng railway corridors and utility lines.

Opportunities and challenges along the river corridor.

Proposed landscapes and design recommendations.


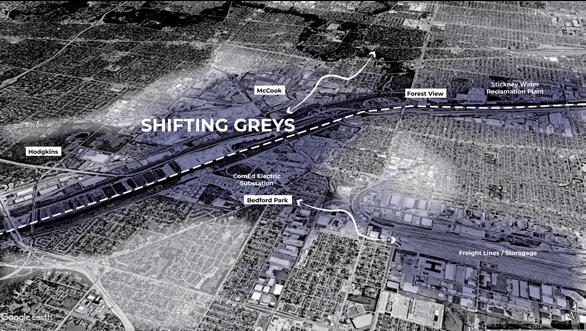
Natural and built systems that disrupt the city grid. Utility and industrial corridors shaping nearby land uses. Built and natural systems in proximity to each other which influence one another and trigger a ripple effect. Natural areas that are cut off from their ecological point of origin but retain similar characteristics. Where natural systems have been engineered resulting in changed functionality. Where natural systems have been engineered resulting in changed functionality. Grid Disruptors Shifting Greys Dynamoscapes Engineered Landscapes Eco-Remnants Natural Spine Connect Adapt Restore
islanded
natural systems
other.
Connect
communities to nature and fragmented
to each
Waterway Adjacencies
Reimagined Infrastructure
Chicago’s industrial legacy has left behind a landscape with broken natural systems that were manipulated for industrial purposes. Infrastructure, particularly railways, divides both open spaces and neighborhoods. However, the interlaced systems of railways and power lines present an opportunity to create a 35-foot-wide green buffer that can be rewilded to connect wildlife and humans. This would utilize underutilized space within the right of ways and provide corridors of connectivity for both.
Our waterways connectivity plan repurposes the region’s waterways, including rivers, streams, and wetlands, into ecological hotspots that connect and protect wildlife and people. It also provides increased community access to these spaces, promoting a reconnection to the region’s nature. Using placetype-based prototypes, the plan addresses current challenges and creates a climate adaptation strategy for a stronger and more flexible Chicago region.


Green Roof Network


Our ecological green roof plan focuses on identifying suitable areas, such as industrial, institutional, and commercial buildings, for green roof installations. To maximize coverage, we set targets for the percentage of eligible roofs that should be covered by green roofs, considering their potential benefits such as reducing the urban heat island effect, improving air quality, and managing stormwater runoff.


 Increased crossings for pedestrians + bikes
Climate mitigation zones
Ecological restoration + conservation
Powerline right-of-ways repurposed as trail connections
Continuous trail connection along the river corridor
Economic development: bluegreen industries + mixed-use development
Urban Farming Sponge Bio-diversity
Recreational
Increased crossings for pedestrians + bikes
Climate mitigation zones
Ecological restoration + conservation
Powerline right-of-ways repurposed as trail connections
Continuous trail connection along the river corridor
Economic development: bluegreen industries + mixed-use development
Urban Farming Sponge Bio-diversity
Recreational
A vision for a resilient and vibrant chicago
The legacy of the Great Lakes Region is one of ecological abundance which has been challenged and disrupted by industrial and urban primacy. Fragmented natural systems need to be restitched to restore Chicago region’s legacy of rich natural systems, promote coexistence between humans and nature, and catalyze Chicago’s New Nature - an ecology that responds to historical degradation and is innovatively positioned for urban use and resilient climate adaptation - through design, planning, and governance.
Ecologically fragmented chicago


Chicago’s New Nature
1.28 million people living in the ‘C’ impacted by Chicago’s New Nature
of new green space across the Green Roof Network


14,000+ acres of remediated and rewilded land
12,500+ acres of newly connected ecological corridors


2,000 miles

Rewilding Nature Improving Waterways Restoring Wetlands Building Green Industries Connecting Trails Increasing commumnity access
COMMUNITY DESIGN ENGAGEMENT
OUR 35TH
AN URBAN DESIGN PLAN FOR 35TH STREET, MCKINLEY PARK

MCKINLEY, ILLINOIS PROJECT LOCATION :
ROLE : WORK :
ACADEMIC (GROUP)
RESEARCH, CONCEPT, DESIGN, DRAWINGS, RENDERS, GRAPHICS
SEMESTER :
GUIDE :
MCD - SUMMER SEMESTER 23’
DR.APRIL JACKSON
DR. SEVIN YILDIZ
MERAV ARGOV
// Urban Design
// Planning
// Research
// Community
// Street Redesign
// Landscape
// Mixed-use
// Sustainability
// Prototyping
The 35th Street corridor is foundational to McKinley Park’s identity of community, culture, and resiliency. This project builds upon these values and fits within a larger, coordinated effort to make 35th Street better for all McKinley Park residents. In partnership with the McKinley Park Development Council (MPDC), Bridgeport Alliance, Coalition For A Better Chinese American Community (CBCAC), and international consulting firm Design Workshop, the UIC College of Urban Planning and Public Affairs Master of City Design program facilitated a community-led design process for a comprehensive corridor plan for 35th Street between Leavitt and Ashland.
GIS, InDesign, Illustrator, Photoshop, SketchUp, Vray
02
INCLUSIVITY:
Respect the neighborhood’s heritage and cultural identity
PROJECT PRINCIPLES
IMPROVED MOBILITY FOR WALKERS AND BIKERS:

Prioritize pedestrian and bikers safety through protected bike lanes, proper street lighting and active storefronts

OUR 35TH
ENHANCED COMMUNITY INTERACTION and ENGAGEMENT:


Engage and collaborate with the local community

PROCESS
LOCAL ENTERPRISE PROMOTION:
Create opportunities for diverse small businesses, local entrepreneurship, and cultural amenities

CONCEPT
35th as a Neighborhood Main Street
The design concept conceptualizes 35th Street as McKinley Park’s bustling street with concentrations of activity at certain intersections from Archer to Ashland. Based on community feedback, the concept integrates elements of artactivated alleyways, a linear park, extended sidewalks, community spaces, pedestrian crossings, and food trucks. These strategic additions can help promote small business development and community well-being.


The 35th street will transform into the “Neighborhood Main Street”, becoming the go-to-destination for McKinley Park. The new street design promotes accessible and safe pedestrian mobility for pedestrians and cyclists. It expands dining and shopping options, as well as comfortable, outdoor spaces for people to gather and celebrate their community.
Through past planning efforts, the 35th Street corridor has been identified as a catalytic site for community and small business growth. In addition to conducting preliminary research on the corridor, our team organized engagement events at different neighborhood sites where community members gather, play, and work. These events led up to a design charrette, which brought together diverse community members to co-create ideas for improving the corridor. As the culmination of our research and community engagement, this project leverages existing assets, celebrates the neighborhood’s cultural diversity, and furthers connectivity and inclusivity.
OUR VISION
The 35th Street corridor is McKinley Park’s vibrant, community-oriented main street anchored by strong local businesses, multimodal connectivity, and resilient infrastructure.

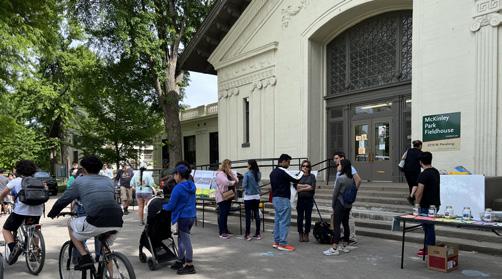 Pop-Up Event in McKinley Park (Front of Field House) Pop-Up Event in Playgarden
Pop-Up Event On Memorial Day Parade (35th Street) Visioning Workshop
Pop-Up Event in McKinley Park (Front of Field House) Pop-Up Event in Playgarden
Pop-Up Event On Memorial Day Parade (35th Street) Visioning Workshop
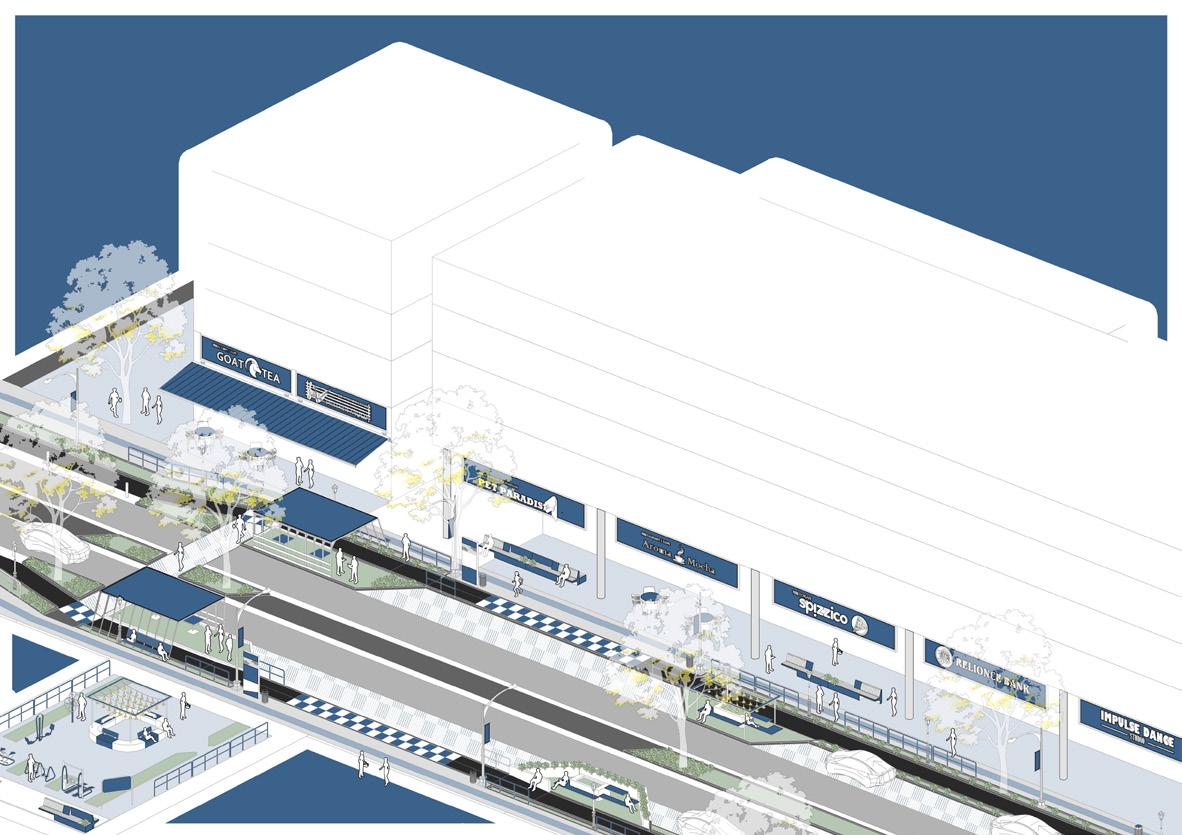
‘The Portal’ 35th and Archer
The 35th and Archer intersection connects McKinley Park to the city through the CTA Orange Line and other transit options. Based on community feedback, this transit oriented development is a potential portal into and out of the neighborhood. The view shows a part of the parking lot being repurposed into a linear park to improve walking and biking connectivity surrounded by grab-and-go businesses. The sidewalks at the junction are extended, and the paving is modified to facilitate traffic calming. These interventions also respond to safety concerns related to road accidents, improving mobility around the L station.

‘Social Hub’ 35th and Wolcott Ave
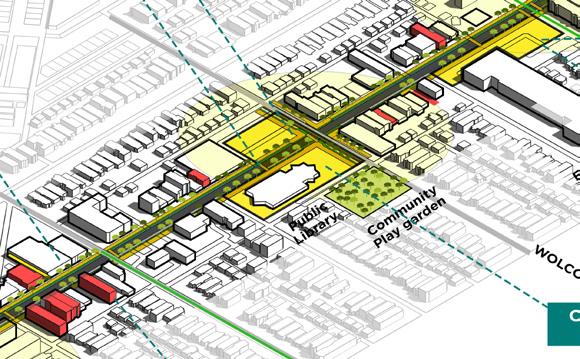
Housing the McKinley Park Library and the Walgreens store, this intersection is frequently visited by community members. The junction is envisioned as a “Social Hub” with multiple small businesses and flexible gathering spaces.
It repurposes the Walgreens parking lot as a station for food trucks with an extension into the library’s landscaped space. Wolcott Avenue is utilized as the Festival Street, which can host small street markets and block parties spanning 2 blocks in either direction from the McKinley Community Play Garden.


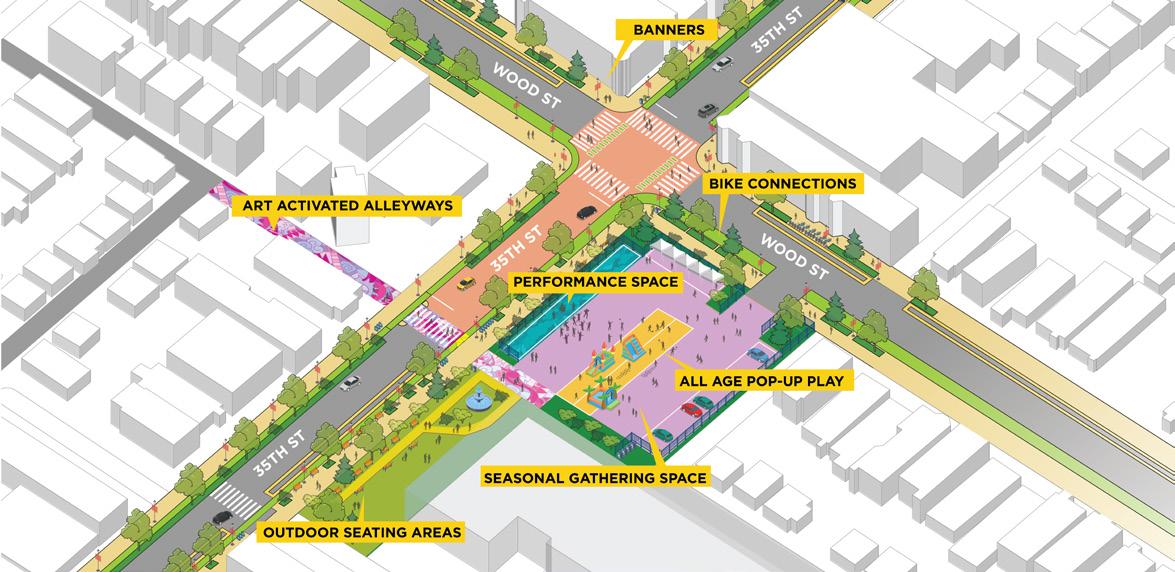


‘The Heart’ 35th and Wood St
Adjacent to the Nathanael Greene Elementary School, the 35th and Wood intersection becomes an essential community space hosting a seasonal pop-up playground for all ages and a temporary performance area. Displaying the neighborhood’s diversity through public art on empty facades and providing space for cultural celebrations, the intersection embodies the heart of McKinley Park. Also, the bike lane on 35th Street links to the proposed bike network on Wood St, which stretches to the large park through 37th St. This redesign encourages casual meet-ups and community connections, while becoming a platform for cultural expression.
URBAN DESIGN
// Urban Design
// Planning
// Research
// Form Based Coding
// Prototyping
// Landscape
// Community
// Sustainability
// Mixed-use
MADISON FOR EVERYONE
03 BLURRING EDGES
OAK PARK, ILLINOIS PROJECT LOCATION :
SEMESTER : ROLE : WORK :
GUIDE :
ACADEMIC (GROUP)
MCD - FALL SEMESTER 22’
This design project aims to propose solutions for revitalizing the commercial corridor of Madison Street in Oak Park, characterized by high vacancy rates and a drive-thru economy. The focus is on a 1.5mile stretch of the street between Harlem and Austin in a metropolitan region with diverse urban edges and socio-economic disparities.The goal is to blur the hard edge between Oak Park and Austin and activate the street’s commercial activities and character. Madison presents a unique opportunity to serve as a “community connector” between neighboring communities and within Oak Park itself. The project explores creating new identities for Madison, such as Madison-Med, Mix, and Made.
 Prof. SANJEEV VIDYARTHI
Prof. VINAYAK BHARNE
RESEARCH, CONCEPT, DESIGN, DRAWINGS, RENDERS, GRAPHICS
GIS, InDesign, Illustrator, Photoshop, SketchUp, Vray
Prof. SANJEEV VIDYARTHI
Prof. VINAYAK BHARNE
RESEARCH, CONCEPT, DESIGN, DRAWINGS, RENDERS, GRAPHICS
GIS, InDesign, Illustrator, Photoshop, SketchUp, Vray
Planning Making Process and Methord
The approach involved a research-informed methodology, with community input informing the direction of the project. Statistical data was utilized to support tangible design approaches, while experts in specialized fields were consulted to gain a better understanding of the area

Context
Initial Insights 01
Data gathered through a self-guided tour of the communinty, helped us guide investigations into local histories and people that animate madison.

Community Profile 02
It revealed the development trends, housing patterns, and transportation connections for considerations on Madison
Spatial Analysis 03
A closer look at Madison revealed additional asserts, opportunites and spatial charateristics to be addresses on the corridor.

Concepts, Criteria, and Constraints
By defining the problem, identifying opportunities for design repairs and setting a scope of work, the studio laid the groundwork for a comprehensive design
OAKPARKAVENUE
Design Proposal 05
Work for the design proposalbegan by establishing collective design values and vision. “Madison for Everyone Else” came together.
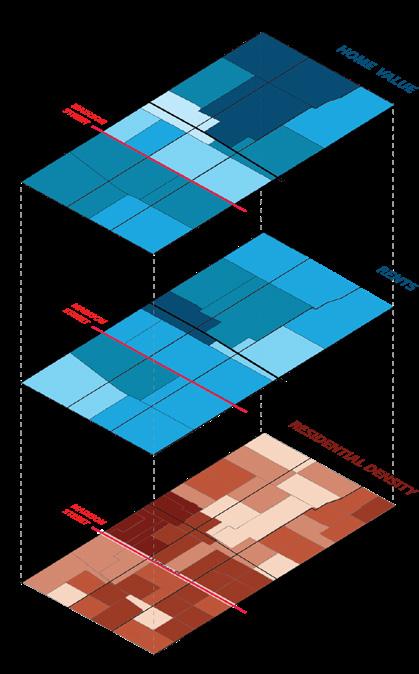
Community Profile
An analysis of the census tracts surrounding Madison reveals that they have the lowest median household incomes, highest poverty rates, and highest unemployment rates in the community. Additionally, the western end of Madison is characterized by the lowest housing values, moderate rents, and high residential density.
Transect Analysis
Zooming out from Oak Park, the transect analysis shows how the Madison corridor transforms from a downtown urban artery (and the start of Chicago’s North/South numbering system), to a newly developed commercial and office strip in the West Loop, and eventually transitioning into a neighborhood corridor.
Vision: Madison for Everyone else
Oak Park is headed towards a lack of affordability shown through high property taxes and increasing rents.
MADISONSTREET
OAKPARKAVENUE
Lack of concentration of retail on Madison Street contributes to its status as a stagnant economy.
The absence of a historic district and preservation sites along Madison Street results in a lack of identity for the corridor
Key Takeaways
MADISONSTREET
MADISONSTREET
Oak Park is headed towards a lack of affordability shown through high property taxes and increasing rents.
MADISONSTREET
Lack of concentration of retail on Madison Street contributes to its status as a stagnant economy.
Madison Street has a lack of pedestrian infastructure, the streetscape doesn't as to support community building.
Oak Park is headed towards a lack of affordability shown through high property taxes and increasing rents.
Lack of concentration of retail on Madison Street contributes to its status as a stagnant economy.
The absence of a historic district and preservation sites along Madison Street results in a lack of identity for the corridor
Madison Street has a lack of pedestrian infastructure, the streetscape doesn't as to support community building.
Oak Park is headed towards a lack of affordability shown through high property taxes and increasing rents.

STREET
The absence of a historic district
OAKPARKAVENUE
OAK
04
Macro Planning
Madison Street differs from Oak Park in terms of racial and economic demographics, architecture, housing patterns, and retail options. Instead of presenting Madison as a problem that needs fixing, the ideas proposed in this report aim to celebrate and cherish the unique and diverse mix of people, places, and properties that already exist within the corridor. If Oak Park is for “everyone,” then Madison can be for “everyone else.”
What are we designing


In examining Madison Street within a broader context, we have identified its relationships with the surrounding urban realm. The diagrams specifically highlight the existing downtowns and open space systems that shape the edges of Forest Park and Austin, as well as the impact of Madison’s distance from the CTA Green and Blue Line stations. Additionally, we have identified specific notable assets on the corridor, such as blockchain retail, public institutions, and senior living facilities.


Intersections
Building Typologies- Form Based Codes


These proposed building typologies respond to different parcel sizes and building heights, in line with the project goals. Each proposal is based on an average of three parcel sizes commonly found on Madison: 50’x120’, 120’x100’, and 200’x120’. The northern and southern blocks adjacent to Madison have distinct building characteristics, with 45’ multifamily housing zoned to the north and 30’ single-family homes zoned directly to the south.


MADISONST MADISONST
MADISONST MADISONST
Med draws inspiration from the RUSH Oak Park hospital, on the western edge.
On Madison Med, design interventions like public handrails, tactile crosswalks, outdoor fitness equipment, and information kiosks serve aging residents and pedestrians with specific mobility and safety needs.


MADISONST


Mix is in reference to the wide range of parcel sizes, land uses, and building types in the center of the corridor.


On Madison Mix, design interventions like group seating, playful social spaces, waiting spaces for school children, and patterned crosswalks help bring a diverse range of people and activities together to strengthen community and infuse a sense of dynamism into the corridor.

Made honors the significant number of small, historically Black-owned businesses on the eastern edge.
On Madison Made, expanded sidewalk space for outdoor retail amenities, parking spots at bus bulbs, popup market spaces along buffer zones, color-coded signage, and patterned crosswalks that bridge north and south sides of the street invite foot traffic to promote local businesses.
MadisonSt. MadisonSt. MadisonSt. MadisonSt. MadisonSt. MadisonSt. MadisonSt. MadisonSt. MadisonSt. MadisonSt. MadisonSt. MadisonSt. Residential Parcel Commercial Parking MadisonSt. MadisonSt. MadisonSt. MadisonSt. MadisonSt. MadisonSt. MadisonSt. MadisonSt. MadisonSt. MadisonSt. MadisonSt. MadisonSt. Residential Parcel Commercial Parking MadisonSt. MadisonSt. MadisonSt. MadisonSt. MadisonSt. MadisonSt. MadisonSt. MadisonSt. MadisonSt. MadisonSt. MadisonSt. MadisonSt. Residential Parcel Commercial Parking 100ft 120 120 200 ft 50ft 120 50*120 Parcel MadisonSt. MadisonSt. MadisonSt. MadisonSt. MadisonSt. MadisonSt. MadisonSt. MadisonSt. MadisonSt. MadisonSt. MadisonSt. MadisonSt. 100*120 Parcel 200*120 Parcel 100ft 120 ft 120 ft 200 50ft 120 ft 100ft 120 120 200 ft 50ft 120 Residential Parcel Commercial Parking 100ft 120 ft 120 ft 200 50ft 120 ft 50*120 Parcel MadisonSt. MadisonSt. MadisonSt. MadisonSt. MadisonSt. MadisonSt. MadisonSt. MadisonSt. MadisonSt. MadisonSt. MadisonSt. MadisonSt. 100*120 Parcel 200*120 Parcel 100ft 120 120 200 ft 50ft 120 100ft 120 ft 120 ft 200 50ft 120 ft Residential Parcel Commercial Parking 100ft 120 120 200 50ft 120 50*120 Parcel MadisonSt. MadisonSt. MadisonSt. MadisonSt. MadisonSt. MadisonSt. MadisonSt. MadisonSt. MadisonSt. MadisonSt. MadisonSt. MadisonSt. 100*120 Parcel 200*120 Parcel 100ft 120 ft 120 ft 200 50ft 120 ft 100ft 120 120 200 50ft 120 Residential Parcel Commercial Parking Common Space Common Space Common Space MADISONST MADISONST MADISONST MADISONST ALLEY ALLEY ALLEY ALLEY Building Typology Setback North Side South Side Intersection 100ft 120 ft 120 200 50ft 120 ft 50*120 Parcel 100*120 Parcel 200*120 Parcel 0' offset is not allowed unless granted special privilege • Minimum 5' offset on the front, right and left side of the parcel Minimum 10' offset on the back of the parcel • 0' offset is not allowed unless granted special privilege • Minimum 10' offset on the front, right and left side of the parcel • Minimum 15' offset on the back of the parcel • 0' offset is not allowed unless granted special privilege • Minimum 15' offset on the front, right and left side of the parcel • Minimum 20' offset on the back of the parcel • Maximum building height is 50' and minimum to be maintained is 30'. Building mass above 30' is to be pulled back 15' minimum from the back of the parcel line. Maximum building height is 50' and minimum to be maintained is 30'. • Building mass above 20' is to be pulled back 15' minimum from North Side South Side North Side South Side Residential % of Built up area % of Built up area % of Built up area Commercial Parking Residential Commercial Parking Residential Commercial Parking Maximum building height is 80' • Building mass above 30' is to be pulled back 15' from the back of the parcel line Building mass above 50' is to be pulled back 25' from the back of the parcel line 100ft 120 ft 120 200 50ft 120 ft 100ft 120 ft 120 200 50ft 120 ft
MADISONST ALLEY ALLEY ALLEY ALLEY MADISONST MADISONST MADISONST MADISONST ALLEY ALLEY ALLEY ALLEY <15 ft 30 ft 50 ft <15 ft <25 ft 30 ft 80 ft 20 ft ~60% ~60% ~60% ~25% ~20% ~20% ~15% ~15% ~10% <15 ft 50 ft <15 ft 30 ft 50 ft <15 ft <25 ft 30 ft 80 ft 20 ft ~60% ~60% ~60% ~25% ~20% ~20% ~15% ~15% ~10% <15 ft 50 ft <15 ft 30 ft 50 ft <15 ft <25 ft 30 ft 80 ft 20 ft ~60% ~60% ~60% ~25% ~20% ~20% ~15% ~15% ~10% <15 ft 50 ft <15 ft 30 ft 50 ft <15 ft <25 ft 30 ft 80 ft 20 ft ~60% ~60% ~60% ~25% ~20% ~20% ~15% ~15% ~10% <15 ft 50 ft
ALLEY ALLEY ALLEY ALLEY
MADISONST MADISONST MADISONST
MADISONST ALLEY ALLEY ALLEY ALLEY <15 ft 30 ft 50 ft <15 ft <25 ft 30 ft 80 ft 20 ft ~60% ~60% ~60% ~25% ~20% ~20% ~15% ~15% ~10% <15 ft 50 ft <15 ft 30 ft 50 ft <15 ft <25 ft 30 ft 80 ft 20 ft ~60% ~60% ~60% ~25% ~20% ~20% ~15% ~15% ~10% <15 ft 50 ft
MADISONST
MADISONST
URBAN ANALYSIS
PROJECT LOCATION :
PROJECT TYPE :
ROLE : WORK :
CHICAGO, ILLINOIS
RESEARCH, DOCUMENTATION AND ANALYSIS
ACADEMIC (INDIVIDUAL)
RESEACH,CONCEPT,DESIGN,DOCUMENTATION, GRAPHICS
SEMESTER : DATE :
GUIDE :
MCD - FALL SEMESTER 22’
DEC, 2022
DR. SEVIN YILDIZ
This analysis focuses on the ‘20 MIN DOWNTOWN’ concept as a way to evaluate the livability and accessibility of a city’s downtown core. The study aims to determine if the core has been designed to be a successful model of livability and if it enables pedestrians to access all the amenities and activities of the dense urban fabric. Through a three-level analysis (macro, meso, and micro), the investigation found that Chicago’s downtown core, ‘The LOOP,’ is accessible in under 20 minutes and offers a diverse range of experiences. The analysis used visual guidance for walking exploration, creating a layout that can be applied to any downtown area in any city.


GIS, InDesign, Illustrator, Photoshop, Lightroom
// Urban Analysis
// Research
// Prototyping
// Planning
04 URBAN TISSUE ANALYSIS
MIN DOWNTOWN
20
METHOD 1
INTRODUCTION
Cities are dynamic systems made for people to inhabit and generate unique experiences. Walking is the most common and accessible mode of experiencing a city. We focus on Downtown and its core to analyze livability through walking.


We shall look at the whole site that is the ‘LOOP’ and create a matrix for all the major type of activites that are present and the rate them on the basic of how accessible they are from this area and how much footfall does each section experience.
- Type of Activity
- Accessiblity
- Footfall
We shall look at the Streets individually. Here we will mark the type of path and analyis the charater of the street North- South and East-West Streets will be analyzed differently.

We shall look at the street level visual guidance for the pedestrian that helps them to navigate and walk toward the desired destination or activity, adding to the Walkability aspect of the space.

The major types of activities in the downtown area are divided into seven zones, and their percentage impact is represented in a radial graph by the area they occupy, corresponding to their actual percentage area in the downtown.


ACCESSIBILITY LINK

- Level of the Street
- Movement pattern
- Time to travel
- Street Edge Condition
- Vibe
- Crosswalk


- Signals
- Signages
- Sidewalks
The impact on all seven zones is measured by their visual presence and the activities they host. This rating system allows us to identify the most active areas and the zones with the highest footfall. By analyzing this data, we can determine which zones are most impactful for a user within a 20-minute walk.
TOOLS
Condition scale Condition scale
SITE
S Wells St. S La Salle St. S Clark St. S Dearborn St. S State St. S Wabash St. S Michigan Ave. DOWNTOWN DOWNTOWN-CORE W Lake St. W Randolph St. W Washington St. W Madison St. W Monroe St. W Adams St. W Jackson St. W VanBuren St. Chicago, Illinois THE
METHOD 1 METHOD 2 METHOD 3
LOOP
IMPACT SCALE Low Moderate High 1 2 3 4 5 6 7 8 9 10 TRANSPORT LAKEFRONT ZONES PERCENTAGE 100 % 90 % 80 % 70 % 60 % 50 % 40 % 30 % 20 % 10 % ENTERTAINMENT SHOPPING BUSINESS RECREATIONAL RETAIL % % % % % % % LAKE FRONT ENTERTAINMENT SHOPPING BUSINESS RECREATIONAL RETAIL BUSES TRAINS BICYCLES TAXIS 20 MIN 3 6 8 9 9 7 6 10 10 10 10 10 10 10
PERCENTAGE IMPACT Low Moderate High 0-10 % % % 10-30 % 30% or higher %
The direct link examines the immediate or neighboring use spaces that are associated with one another, revealing how their movement patterns affect the use of the space and how different zones connect to one another. Direct
Street Charater Analysis

The Street Character Analysis examines the relationship between building edges and streets/sidewalks to provide insight into the walkability of the area.


Chicago has multiple levels in the city and downtown you can only expect it to be more layered. So indicating the layer of street interacted is important.


Chicago downtow is layed out in grid so there is no much non-linear movement. One can still move diagonally is the subject of intrest is such.


Street Edge Condition
Chicago’s conditions are measured on the basis of the porosity,materiality and the offset spaces created on the building edgeline where the space is being used for public
The vibe of the street is a intangible but its measure in relation to Street Condition, Time and Legibility of the space.


Street Walkability Element Analysis


The Street Walkability Element Analysis focuses on the streets and sidewalks in terms of the placement of elements that guide pedestrians visually and aid in their navigation from one location to another. This analysis is crucial for forming a comprehensive understanding of the streets and their legibility for the purpose of walkability.
Departments
Crosswalk


Sidewalk
All Rating in each department
7 Crosswalk Signal Signages

Sidewalk
9 A street junction on the West - East axis, S Dearborn St.
Sidewalk hear creates a good buffer zone and all the other elements for the walkablility aspect are visible but could have been enhanced to cater better to the pedestrians visting here for first time.
CTA Blue Line- Inclusion of Transit facilities onto the sidewalk and merging the on-ground and underground levels of the city.

Plaza. A public seating space Included just next to the side walk, keeping in mind the activities of the surrounding spaces and building edge opening up to create a good in-between spaces.
NORTH- SOUTH direction streets in downtown core area for walkability measurement of 20 min and activities.

WEST - EAST direction streets in downtown core area for walkability measurement of 20 min and activities.

A green buffer spaces included in-between and on the edges of the side adds to the visual beautification and also contributes enviornmentally. The streets feel much more lively and vibe is overall enhanced.
A service infrastructure incorporated onto the sidewalk near the junction area, narrow downs the walkable area and cause a hindrance visually, physically and add to the congestion of the space.


8 5 6
METHOD METHOD 2 3 S Dearborn St. Level of the Street On ground 0.68 Miles Linear 17 Mins 9 Distance Movement pattern Time to Travel Street Edge Condition Vibe G
Matrix Indicator
of the Street - Underground - On
- Above
- Good - Average - Poor - Linear - Non-linear
pattern
Level
ground
ground
Movement
Vibe P A G 9 9 8 8 5 5 1 1 6 6 2 2 7 7 3 3 4 4 10 10 Low Low Moderate Moderate High High
Signal Signages
9 9 9 4 W Monroe St. Level of the Street Distance Movement pattern Time to Travel Street Edge Condition Vibe 6 On ground 0.48 Miles Linear 13 Mins A W Monroe St. KEY MAP S Dearborn St.
URBAN RESEARCH PUBLICATION
05
(RE) CODING MUMBAI
RESEARCH AND DOCUMENTATION OF MUMBAI STREETS AND BUILD TYPOLOGIES

Urban Analysis
Research
Prototyping
Planning
Community
Mixed-use
Adaptive reuse
Documentation
MUMBAI, INDIA
PROJECT TYPE : RAVI, NIRAV, SHAIBA. RAHUL, RIKUNJ
RESEARCH AND DOCUMENTATION
PROJECT LOCATION : DATE :
MEMBER : FIRM :
ROLE :
RESEACH, DOCUNEMTATION, GRAPHICS.
MAY-JUNE, 2017.
sPare. (Sameep Padora and associates).
The research and documention was done at firm sP+A under the research wing sPare for publication.
The DCR (Development Control Regulations) primarily prioritizes road widening codes and overlooks pedestrian needs. While automobiles are important, we cannot overlook the importance of pedestrians. Instead we should reconsider their potential and create some space within the DCR to facilitate their revival where necessary. We need to make room for streets once again, giving equal consideration to pedestrians and automobiles, in order to ensure a balanced and sustainable urban development.
Autocad, Revit, InDesign, Illustrator, Photoshop
//
//
//
//
//
//
//
//
//
Publication
TYPOLOGY DOCUMENTATION
I participated in a research and documentation project with sPare, which divided volunteers into teams to document different types of structures and roads in Mumbai that have unique typologies and reflect the city’s urbanization. These structures and roads serve as markers in time and space, recording anomalies and slippages in the general set of logics operating within the urban field. They also present potential ideas or types that can be deployed within contemporary urban contexts.


STREETS DOCUMENTATION
These five streets were surrounded by different neighborhoods and cultural contexts, yet they were part of the same area. Therefore, the complexity of the streets’ nature was key to making further analysis possible. Each street already had a unique established character in the urban fabric, combined with its neighborhood. My role in this project was to document these relationships and different types of streets in Bandra, Mumbai. This documentation involved representing them with different styles of drawing such as plans, sections, isometric sections, and creating a comparative analysis between them to understand and enhance their characteristics.
STREET DOCUMENTATION ANALYSIS
Photodocumentation higlighting street infrastructures and areas of concern, regarding re-planning and arrangements.
1. Informal shops on footpath
2. Under utilized edge condition
3. Absence of footpath
4. Absence of zebra crossing
5. Degenerated median condition
6. Reduced effective street width due to encroachment, hawkers and parking
 Dinanath Mangesh Hall, Vile Parle
Candies, Bandra
STATION ROAD
LINKING ROAD
CARTER ROAD
CHIMBAI ROAD
PALI VILLAGE
Isometric View of the streets
Dinanath Mangesh Hall, Vile Parle
Candies, Bandra
STATION ROAD
LINKING ROAD
CARTER ROAD
CHIMBAI ROAD
PALI VILLAGE
Isometric View of the streets
1 2 3 5
4 5 6
Near the Junction of Linking Road and Secondary Road
1 2 4 5
Linking Road middle plaza node
Near the Linking Road Market signal
STREET ANALYSIS
The street is an arterial road and the edges of the street are defined by the collector roads which branch out from the street.
The width of the street varies at different sections of the street but is approximately 18m wide and carries heavy traffic.
Out of the total street space, 60% is used for movement of vehicles. 30% is used by shops and eateries. 10 % is used by the pedestrians.
The street is characterised by the commercial shops which are present on the edge of the road
The street is a two way vehicular road with heavy traffic as it recieves traffic from adjacent collector road
It is a high traffic zone as the vehicular traffic is high almost throughout the day.
The pedestrian traffic is predominantly high durning the evening due to the roadside eateries and shopping programs.
EDGE CONDITIONS BUILT FORM AND ADJACENT TYPOLOGIES SPACE UTILIZATION STREET ELEMENTS STREET WIDTH VEHICULAR TRAFFIC MORNING MORNING EVENING EVENING NOON NOON PEDESTRIAN TRAFFIC TRAFFIC PATTERN TIME
XX vehicles/m2 XX vehicles/m2 XX vehicles/m2 XX persons/m2 XX persons/m2 XX persons/m2 - XX min TIME FROM A to B : - XX mins MIXED USE COMMERCIAL RESIDENTIAL EATERIES SHOPS PARK NG SPACE MOVEMENT 183M 177M 120 M A B ARTERIAL ROAD COLLECTOR ROAD COLLECTORROAD TWO WAY ROAD TWO WAY ROAD TWOWAYROAD
o 2.5M 5M 10M SCALE 1:200 FOOTPATH PROMENADE RESIDENTIAL BUILDING Isometric View KEY PLAN CARTER ROAD, BANDRA o 2.5M 5M 10M SCALE 1:200 LINKING ROAD, BANDRA FOOTPATH COMMERCIAL COMPLEX Isometric View KEY PLAN LIKNKING ROAD, BANDRA
LINKING ROAD, BANDRA
University of Illinois, Chicago - Master of City Design ’23
Aditya College of Architecture - Bachelor Of Architecture ‘19
Architectural Portfolio
https://issuu.com/ravithakker/ docs/ravi_thakker_portfolio_2022
rthakk23@uic.edu
ar.ravithakker@gmail.com

Product Design Studio
Graphic Design Portfolio
https://www.instagram. com/artyst.studio/


https://issuu.com/ravithakker/docs/ ravi_thakker_graphic_design_portfolio
