

GLOBAL CAPACITY
FORUM SUBMARINE TELECOMS ISSUE 136 | MAY 2024
EXORIDUM FROM THE PUBLISHER
WELCOME TO ISSUE 136, OUR GLOBAL CAPACITY EDITION!
As spring blossoms, a fresh season of industry conferences is upon us. This May has been particularly eventful, with key summits taking place in Singapore, Washington, DC, and London, all within a span of five weeks. The bustling schedule reflects the dynamic and ever-evolving nature of the submarine cable industry, setting the stage for another great year ahead.
The industry continues to make headlines globally, particularly with the recent cable breaks in the Red Sea and other new disruptions around Africa. As the industry responds to these challenges, a new round of diverse routes may be on the horizon. We’ll keep up with the pace and meet you whenever we can, ensuring we stay connected and informed as we navigate these exciting developments in global network infrastructure.
INTRODUCING THE SUBMARINE CABLE INDUSTRY DIRECTORY
We’re thrilled to introduce the Submarine Telecoms Forum Directory, a platform designed to cater to the intricate needs of industry professionals, fostering efficient connections between submarine cable projects and vendors offering critical products and services. With a user-centric interface, the directory streamlines navigation through its well-organized categories, making it an indispensable tool for consulting, equipment procurement, infrastructure deployment, and more. The directory not only enhances accessibility to a comprehensive array of resources but also celebrates the collaborative spirit and technical prowess driving the industry. We aspire for the SubTel Forum Directory to be the premier reference for those charting new territories in the submarine telecoms industry, guiding towards a more interconnected and sustainable global community. Take a look and tell us what you think.
SUBTEL FORUM APP
Our app has a few exciting new features since our last is-
sue, including a link to the SubTel Forum Directory. A big thank you to all the professionals who’ve added it to their smartphones, driving us forward at full steam. This app now provides real-time updates, comprehensive data, and interactive features designed for those involved in submarine cable projects.
With seamless integration with our website, the app offers an intuitive user interface and streamlined access to crucial industry insights. But it’s more than just an information source; it’s an interactive platform designed to facilitate learning and collaboration. Features like real-time project tracking and AI-driven analytics ensure it evolves to meet the changing needs of its users. Dive in and explore it today. (https://subtelforum.com/stf-app/)
2024 SUBMARINE CABLE MAP
We’re releasing our updated 2024 Submarine Cables of the World printed wall map, an indispensable resource for industry professionals. This crafted map offers a visually stunning and highly detailed representation of global submarine cable networks, making it an invaluable tool for anyone in the field. The updated map will be unveiled at Submarine Networks EMEA this month and Submarine
2 SUBMARINE TELECOMS FORUM MAGAZINE
Networks World in September, ensuring it receives extensive visibility among key industry stakeholders.
We’re also inviting more advertisers to join us in this venture, offering unparalleled exposure to a focused audience deeply involved in the submarine cable and telecommunications sector. Interested in advertising? Contact Nicola Tate at ntate@associationmediagroup.com.
SUBMARINE CABLE ALMANAC
The May edition of the Submarine Cable Almanac is set for release. We’ve updated our data with the latest public news stories from the past three months and validated this information directly with cable owners to ensure accuracy. In this edition, cable systems are organized by region to provide a clearer view of developments in each area, and the new format makes it easier to identify upcoming systems. This comprehensive and user-friendly resource is designed to help you stay informed about the latest in submarine cable developments worldwide.
THANK YOU
Thank you as always to our awesome authors who have contributed to this issue of SubTel Forum. Thanks also for their support to this issue’s advertisers: AP Telecom, AP Procure, Fígoli Consulting, Indigo, IWCS, and WFN Strategies. Of course, our ever popular “where in the world are all those pesky cableships” is included as well. STF
A Publication of Submarine Telecoms Forum, Inc. www.subtelforum.com | ISSN No. 1948-3031
PRESIDENT & PUBLISHER: Wayne Nielsen | wnielsen@subtelforum.com | [+1] (703) 444-2527
VICE PRESIDENT: Kristian Nielsen | knielsen@subtelforum.com | [+1] (703) 444-0845
ANALYTICS: Kieran Clark | kclark@subtelforum.com | [+1] (540) 533-6965
SALES: Nicola Tate | ntate@associationmediagroup.com | [+1] (804) 469-0324
DESIGN & PRODUCTION: Weswen Design | wendy@weswendesign.com
DEPARTMENT WRITERS:
Andrés Fígoli, Ella Herbert, Hesham Youssef, John Maguire, Iago Bojczuk, Kieran Clark, Michael Brand, Nicola Tate, Philip Pilgrim, Syeda Humera, and Wayne Nielsen
FEATURE WRITERS:
Chris Wood, Daniel Leza, Gilberto Guitarte, Javier Valdez, Jorge Lozano, Kathy Kirchner, Keith Shaw, Kieran Clark, Kristian Nielsen, Vineet Verma
NEXT ISSUE: July 2024 – Regional Systems

Submarine Telecoms Forum, Inc. www.subtelforum.com/corporate-information
BOARD OF DIRECTORS:
Margaret Nielsen, Wayne Nielsen, Kristian Nielsen and Kacy Nielsen
SubTel Forum Continuing Education, Division of Submarine Telecoms Forum, Inc. www.subtelforum.com/education
Contributions are welcomed and should be forwarded to: pressroom@subtelforum.com.
Good reading – Slava Ukraini STF
 Wayne Nielsen, Publisher
Submarine Telecoms Forum magazine is published bimonthly by Submarine Telecoms Forum, Inc., and is an independent commercial publication, serving as a freely accessible forum for professionals in industries connected with submarine optical fiber technologies and techniques. Submarine Telecoms Forum may not be reproduced or transmitted in any form, in whole or in part, without the permission of the publishers.
Liability: While every care is taken in preparation of this publication, the publishers cannot be held
responsible for the accuracy of the information herein, or any errors which may occur in advertising or editorial content, or any consequence arising from any errors or omissions, and the editor reserves the right to edit any advertising or editorial material submitted for publication.
New Subscriptions, Enquiries and Changes of Address: 21495 Ridgetop Circle, Suite 201, Sterling, Virginia 20166, USA, or call [+1] (703) 444-0845, fax [+1] (703) 349-5562, or visit www.subtelforum.com.
Copyright © 2024 Submarine Telecoms Forum, Inc.
SUBMARINE TELECOMS
FORUM IN THIS ISSUE
ISSUE 136 | MAY 2024
FEATURES

STEPPING UP TO MEET SUBSEA SECURITY CHALLENGES
Advancing strategies to protect submarine cables against growing cyber threats and geopolitical tensions
By Kathy Kirchner
40 56 42 60 52 64
THE IMPORTANCE OF SUBSEA CABLE AND ROUTE DIVERSITY
Discovering the critical role of subsea cable route diversity in enhancing Africa's connectivity resilience
By Chris Wood
THE SYMBIOTIC RELATIONSHIP OF SUBMARINE AND TERRESTRIAL CABLES
Examining the evolution of submarine and terrestrial cables and their implications for climate change
By Jorge Lozano

LISBON: A DIGITAL GATEWAY ENABLING GROWTH AND RESILIENCE
Assessing the importance of Lisbon as a digital gateway and its unique location and infrastructure in bolstering global connectivity
By Keith ShawLIFE EXPECTANCY OF A FIBER OPTIC CABLE
Exploring the 25-year lifespan of submarine fiber optic cables and the factors prompting their frequent updates
By Javier Valdez and Gilberto Guitarte

INTRODUCING THE SUBMARINE CABLE INDUSTRY DIRECTORY
Launching a groundbreaking platform to enhance industry connectivity
By Kieran Clark

BEYOND BORDERS: ENSURING RESILIENCE IN SUBSEA CABLE INFRASTRUCTURE AMIDST GEOPOLITICAL CHALLENGES
Revealing how hybrid terrestrial-subsea networks can ensure global connectivity
By Vineet Verma
FORECASTING CAPACITY NEEDS IN FEASIBILITY STUDIES
Exploring the critical role of capacity forecasting in feasibility studies for submarine cable projects
By Daniel Leza and Kristian NielsenDEPARTMENTS
2 EXORDIUM
Find out about advertising opportunities to connect with our specialized audience.
3 IMPRESSUM/MASTHEAD
Meet our team, from editors to designers, establishing our commitment to transparency.
6 SUBTELFORUM.COM
8 INTERACTIVE CABLE MAP UPDATES
Get the latest on global submarine cable infrastructure from our interactive map.
10 SUSTAINABLE SUBSEA
Discover industry innovations for reducing environmental impact and protecting marine life.
16 WHERE IN THE WORLD ARE ALL THOSE PESKY CABLESHIPS?
Follow the missions of cableships crucial to undersea connectivity.
23 CAPACITY CONNECTION
Learn how collaborations and advancements are boosting global network capacity.
30 ANALYTICS
Delve into the latest trends and data shaping the future of submarine telecoms.
77 BACK REFLECTION
Explore the history and evolution of the submarine telecoms industry.
86 LEGAL & REGULATORY MATTERS
Understand the legal and regulatory issues affecting the submarine telecom industry.
90 ON THE MOVE
Track the career movements within the submarine telecom sector.
91 NEWS NOW
Stay updated with the latest developments in the submarine telecom world.
92 ADVERTISER CORNER
Find out about advertising opportunities to connect with our specialized audience.
67 73
MAY 2024 | ISSUE 136 5


INSIDE THE WORLD OF SUBTEL FORUM: A COMPREHENSIVE GUIDE TO SUBMARINE CABLE RESOURCES
TOP STORIES OF 2019
The most popular articles, Q&As of 2019. Find out what you missed!
NEWS NOW RSS FEED
Welcome to an exclusive feature in our magazine, where we explore the captivating world of SubTelForum.com, a pivotal player in the submarine cable industry. This expedition takes us on a detailed journey through the myriad of resources and innovations that are key to understanding and connecting our world beneath the oceans.
mapping efforts by the analysts at SubTel Forum Analytics, a division of Submarine Telecoms Forum. This reference tool gives details on cable systems including a system map, landing points, system capacity, length, RFS year and other valuable data.
DISCOVER THE FUTURE: THE SUBTEL FORUM APP
CONNECTING THE DEPTHS: YOUR ESSENTIAL GUIDE TO THE SUBTEL FORUM DIRECTORY
Keep on top of our world of coverage with our free News Now daily industry update. News Now is a daily RSS feed of news applicable to the submarine cable industry, highlighting Cable Faults & Maintenance, Conferences & Associations, Current Systems, Data Centers, Future Systems, Offshore Energy, State of the Industry and Technology & Upgrades.
PUBLICATIONS
Submarine Cable Almanac is a free quarterly publication made available through diligent data gathering and
Submarine Telecoms Industry Report is an annual free publication with analysis of data collected by the analysts of SubTel Forum Analytics, including system capacity analy sis, as well as the actual productivity and outlook of current and planned systems and the companies that service them.
CABLE MAP
In our guide to submarine cable resources, the SubTel Forum Directory shines as an essential tool, providing SubTel Forum.com readers with comprehensive access to an array of vetted industry contacts, services, and information. Designed for intuitive navigation, this expansive directory facilitates quick connections with leading vendors, offering detailed profiles and the latest in submarine cable innovations. As a dynamic hub for industry professionals, it fosters community engagement, ensuring our readers stay at the forefront of industry developments, free of charge.
2024 marks a groundbreaking era for SubTel Forum with the launch of its innovative app. This cutting-edge tool is revolutionizing access to submarine telecommunications insights, blending real-time updates, AI-driven analytics,
The online SubTel Cable Map is built with the industry standard Esri ArcGIS platform and linked to the SubTel Forum Submarine Cable Database. It tracks the progress of

6 SUBMARINE TELECOMS MAGAZINE
SubTelForum.com Visit SubTelForum.com to find links to the following resources FREE RESOURCES FOR ALL OUR SUBTELFORUM.COM READERS SubTelForum.com Visit SubTelForum.com to find links to the following resources
6 SUBMARINE TELECOMS FORUM MAGAZINE
and a user-centric interface into an indispensable resource for industry professionals. More than just a technological advancement, this app is a platform fostering community, learning, and industry progression. We encourage you to download the SubTel Forum App and join a community at the forefront of undersea communications innovation.
YOUR DAILY UPDATE: NEWS NOW RSS FEED
Our journey begins with the News Now updates, providing daily insights into the submarine cable sector. Covering everything from the latest technical developments to significant industry milestones, this feed ensures you’re always informed about the latest trends and happenings. It’s an essential tool for professionals who need to stay on top of industry news.
THE KNOWLEDGE HUB: MUST-READS & Q&AS
Dive deeper into the world of submarine communications with our curated collection of articles and Q&As. These insightful pieces offer a comprehensive look at both the history and current state of the industry, enriching your understanding and providing a broader perspective on the challenges and triumphs faced by submarine cable professionals.
IN-DEPTH PUBLICATIONS
• Submarine Cable Almanac: This quarterly treasure trove provides detailed information on global cable systems. You can expect rich content including maps, data on system capacity, length, and other critical details that sketch a vivid picture of the global network.
• Submarine Telecoms Industry Report: Our annual report takes an analytical approach to the industry, covering everything from current trends to capacity analysis and future predictions. It’s an invaluable resource for anyone seeking to understand the market’s trajectory.
VISUALIZING CONNECTIONS: CABLE MAPS
• Online SubTel Cable Map: An interactive tool mapping over 550 cable systems, perfect for digital natives who prefer an online method to explore global connections.
• Printed Cable Map: Our annual printed map caters to those who appreciate a tangible representation of the world’s submarine fiber systems, detailed in a visually appealing and informative format.
EDUCATIONAL OPPORTUNITIES: CONTINUING EDUCATION
SubTel Forum’s commitment to education is evident in our courses and master classes, covering various aspects of the industry. Whether you’re a seasoned professional or new to the field, these learning opportunities are fantastic for deepening your understanding of both technical and commercial aspects of submarine telecoms.

SCAN THE QR CODE TO ACCESS ALL THE RESOURCES THAT SUBTELFORUM.COM HAS TO OFFER
FIND THE EXPERTS: AUTHORS INDEX
Our Authors Index is a valuable tool for locating specific articles and authors. It simplifies the process of finding the information you need or following the work of your favorite contributors in the field.
TAILORED INSIGHTS: SUBTEL FORUM BESPOKE REPORTS
• Data Center & OTT Providers Report: This report delves into the evolving relationship between cable landing stations and data centers, highlighting trends in efficiency and integration.
• Global Outlook Report: Offering a comprehensive analysis of the submarine telecoms market, this report includes regional overviews and market forecasts, providing a global perspective on the industry.
• Offshore Energy Report: Focusing on the submarine fiber industry’s oil & gas sector, this report examines market trends and technological advancements, offering insights into this specialized area.
• Regional Systems Report: This analysis of regional submarine cable markets discusses capacity demands, development strategies, and market dynamics, providing a detailed look at different global regions.
• Unrepeatered Systems Report: A thorough examination of unrepeatered cable systems, this report covers project timelines, costs, and operational aspects, essential for understanding this segment of the industry.
• Submarine Cable Dataset: An exhaustive resource detailing over 550 fiber optic cable systems, this dataset covers a wide range of operational data, making it a go-to reference for industry specifics.
SubTelForum.com stands as a comprehensive portal to the dynamic and intricate world of submarine cable communications. It brings together a diverse range of tools, insights, and resources, each designed to enhance understanding and engagement within this crucial industry. From the cutting-edge SubTel Forum App to in-depth reports and interactive maps, the platform caters to a wide audience, offering unique perspectives and valuable knowledge. Whether you’re a seasoned professional or new to the field, SubTelForum.com is an indispensable resource for anyone looking to deepen their understanding or stay updated in the field of submarine telecommunications.
MAY 2024 | ISSUE 136 7
SUBTEL CABLE MAP UPDATES
The SubTel Cable Map, built on the industry leading Esri ArcGIS platform, offers a dynamic and engaging way to explore over 440 current and planned cable systems, 50+ cable ships, and more than 1,000 landing points. This interactive tool is linked to the SubTel Forum Submarine Cable Database, providing users with a comprehensive view of the industry.
We’re thrilled to announce a new partnership with ACS Cable Systems, a leading provider of wholesale carrier services, as the official sponsor of the SubTel Cable Map. With this collaboration, the ACS logo will now be prominently displayed on the map, serving as a direct link to their comprehensive offerings at Alaska Communications. This partnership underscores our mutual commitment to supporting the submarine telecommunications industry by providing critical infrastructure and connectivity solutions. ACS Cable Systems specializes in delivering high-quality, reliable services tailored to meet the needs of global carriers, enhancing the value they provide to their clients. This integration ensures that our users have instant access to a trusted partner renowned for their expertise in connectivity and customer service.
For more information about ACS Cable Systems and their services, please visit their website.
Submarine cables play a pivotal role in global communications, acting as the backbone of the internet. They are responsible for transmitting over 99% of all international data, connecting continents and enabling global connectivity. Without these underwater highways, the speed and efficiency of global internet communication that we enjoy today would not be possible.
system (GIS) for working with maps and geographic information. It is used for creating and using maps, compiling geographic data, analyzing mapped information, sharing and discovering geographic information, and using maps and geographic information in a range of applications. Its robust capabilities make it an ideal platform for the SubTel Cable Map, allowing for dynamic, interactive exploration of complex data.

With systems connected to SubTel Forum’s News Now Feed, users can easily view current and archived news details related to each system. This interactive map is an ongoing effort, updated frequently with valuable data collected by SubTel Forum analysts and insightful feedback from our users. Our aim is to provide not only data from the Submarine Cable Almanac, but also to incorporate additional layers of system information for a comprehensive view of the industry.
The Esri ArcGIS platform, upon which the SubTel Cable Map is built, is a powerful geographic information
We encourage you to explore the SubTel Cable Map to deepen your understanding of the industry and to educate others on the critical role that submarine cable systems play
8 SUBMARINE TELECOMS FORUM MAGAZINE

in global communications. All submarine cable data for the Online Cable Map is sourced from the public domain, and we’re committed to keeping the information as current as possible. If you are the point of contact for a company or system that needs updating, please don’t hesitate to reach out to kclark@subtelforum.com
To the right, find the full list of systems added and updated since the last issue of the magazine:
We hope the SubTel Cable Map serves as a valuable resource to you and invites you to dive into the ever-evolving world of submarine cable systems. We invite you to start your exploration today and see firsthand the intricate network that powers our global communications. Happy exploring! STF

KIERAN CLARK is the Lead Analyst for SubTel Forum. He originally joined SubTel Forum in 2013 as a Broadcast Technician to provide support for live event video streaming. He has 6+ years of live production experience and has worked alongside some of the premier organizations in video web streaming. In 2014, Kieran was promoted to Analyst and is currently responsible for the research and maintenance that supports the Submarine Cable Database. In 2016, he was promoted to Lead Analyst and his analysis is featured in almost the entire array of Subtel Forum Publications.
MAY 20, 2024
SYSTEMS ADDED:
• Far North Fiber
• Hawaiian Islands Fiber Link
SYSTEMS UPDATED:
• AAG
• Americas 1-North
• Americas-II
• Balalink
• IONIAN
• JGA North
• JGA South
• Orval/Alval
Do you have further questions on this topic?
MAY 2024 | ISSUE 136 9
SUBTELFORUM.COM/CABLEMAP
AN EXPERT
ASK
WHAT’S IN AN EFFICIENCY METRIC?
The Case of Power Usage Effectiveness (PUE) at the Cable Landing Station
BY IAGO BOJCZUK, ELLA HERBERT, MICHAEL BRAND, HESHAM YOUSSEF, AND NICOLE STAROSIELSKIThe Sustainable Subsea Networks research project, an initiative of the SubOptic Foundation, recently released the Report on Best Practices in Subsea Telecommunications Cable Sustainability. In that report, we concluded that there was a need for sustainability metrics in the industry. Many of our interviewees reported, “If you can’t measure it, you can’t manage it.” Metrics can not only help to set internal benchmarks, but also to shape future investments and regulation. We believe that metrics can also help the subsea cable industry explore possible win-win scenarios that are good both for business and the planet.
As a first step, we begin with an investigation of existing metrics from adjacent industries. There is no need to reinvent the wheel when it comes to measurement. At the same time, the struggles over metrics — and their limitations — are instructive as we attempt to develop appropriate metrics for the subsea cable network.
In this month’s column, we focus on a metric that has been established to gauge energy efficiency of facilities housing information technology (IT) equipment worldwide: Power Usage Effectiveness (PUE). This is one of the most widely disseminated metrics in the data center industry. It has been codified in ISO standards and absorbed into regulation. In our research, we have found that
some Cable Landing Station (CLS) facilities are already using PUE as an internal measurement.
Is this use of PUE a good idea for the subsea cable industry? What are the limitations of this metric? In this article, we cover the basic definitions of PUE and describe how it became used across the globe. We also describe the pitfalls of PUE. As academic and industry literature has shown, PUE can at times lead to misleading conclusions, especially when it is used to compare facilities around the world.
We conclude that, by itself, using PUE as a gauge of the sustainability of the CLS is far from sufficient. However, as the subsea cable industry faces the challenge of identifying, developing, standardizing, and adopting the right suite of metrics, it is nonetheless a good starting point.
THE RISE OF PUE AS AN ALLENCOMPASSING METRIC
In its original definition, the Power Usage Effectiveness (PUE) (per ISO/ IEC 30134-2) of a facility refers to the ratio between total power used by a data center and the power used by its IT systems. A lower value indicates greater energy efficiency, ideally approaching 1.0 — this signifies that a greater portion of the facility’s power consumption is being used directly for computing, rather than cooling or other overhead, thus indicating higher operational efficiency.
PUE as a metric was first developed by the Green Grid in 2007, and was the first standardized metric measuring the energy efficiency of an entire data center (Lin et. al, 2021). Since its inception, the main goal of implementing PUE measurement has been to motivate data center operators to eliminate waste in their facility power
10 SUBMARINE TELECOMS FORUM MAGAZINE SUBSEA
structure, primarily through reducing energy used for cooling, power delivery components, and other internal component loads (The Green Grid, 2012). The ownership, development, standardization, and dissemination of PUE now lie in the hands of the International Organization for Standardization and the International Electrotechnical Commission (Future-Tech, 2020). In addition to PUE, the Green Grid created a handful of other sustainability metrics such as Carbon Usage Effectiveness (CUE) and Water Usage Effectiveness (WUE). The combination of these metrics (often referred to as the xUE family of metrics) co-exist to provide operators with a quick sustainability assessment for their facilities.
According to Uptime, the average annual PUE for the data center industry was 2.6 in 2007 — meaning that the data center subsystems used 2.5x more power than the IT systems they were supporting. However, in 2022 this number was closer to 1.55 globally, with companies such as Google, with a global-spanning infrastructural footprint, reaching an average PUE as low as 1.1 in their data center facilities — in many cases relying on water-cooling. However, when it was created, the plain nature of PUE was especially attractive as it just focused on total power and IT power, instead of creating new measurements which would require an industry consensus to define (Neudorfer and Ohlhorst, 2010). These changes in the PUE as a measurement reflect in large part the broad adoption of new techniques such as hot/cold air containment, optimized cooling control, and increased air supply temperatures, among others.
The attractiveness of this metric comes from its simplicity. PUE does not require too much technical understanding of data center standards or equipment to comprehend its values, making
it ideal for business practices. Given its standardization, simplicity, and focus on energy efficiency, PUE was quickly adopted by the industry and stands as the widely used performance metric for data centers (Voort et al, 2017).
PUE has since become a core metric for government regulations — from nation-states to municipalities. China’s second-largest city, Beijing, for example, has a handful of different PUE benchmarks depending on the size of the data center. Additionally, PUE has become a core targeting metric for associations looking to transition the industry toward energy efficiency. The European Data Center Association calls for new data centers to meet a PUE of 1.3 (for centers in cold weather) or 1.4 (for centers in warm climates). In the context of Singapore, which has recently lifted a two-year data center construction moratorium, the requirement is for a PUE of 1.3. All of these show that metrics are becoming an important tool for sustainability that may affect the future of the industry.
THE LIMITS TO PUE
Despite PUE being a prominent and useful metric, it does have several important limitations. First of all, despite its wide use for over 15 years, PUE was never intended to compare energy efficiency between facilities, given their varying climatic and technical conditions (Kosik, 2021). John Booth and Nick Morris of Carbon3IT, consulting for Sustainable Subsea Network, observe that PUE is often a misunderstood and inappropriately applied metric. “Too many organizations have misinterpreted its use and have attempted to use it as an absolute measure of energy efficiency performance for their facilities compared to those of others,” they report. “PUE is merely a ratio that
acts as an improvement metric specific for the facility in question, you calculate it to get a baseline number, implement some energy efficiency improvements such as the best practices found in the EU Code of Conduct for Data Centres (Energy Efficiency), and then measure again, the ultimate aim is to reduce the ratio to as close to 1 as possible.”
Echoing this, Thomas J. Moran, sustainability researcher and advisor to the Global Enabling Sustainability Initiative, argues: “PUE should never have been anything other than a temporary, internal operational metric and is already dangerously outdated. Its use today is best viewed as an indicator of a lack of sustainability maturity in the data center industry.”
In general, smaller data centers have a larger PUE than larger ones, as the latter has more capital to implement more efficient technologies and techniques (Davis, 2024). CLSs would also naturally have a higher PUE because they require far less IT equipment. Facilities based in warmer climates will generally have a higher PUE than those in colder locations. The use of PUE in regulation also does not take into account the specificity of individual facilities, especially considering their age.
If we strictly followed PUE in developing plans for sustainability, this might lead us to only build super-efficient, brand-new hyperscale facilities in cold climates. A comprehensive plan for sustainability, however, includes many more considerations, including renewable power. In short, it is not a good idea to simply use PUE to compare data centers or CLS facilities to one another.
A second key pitfall of PUE is that, if decreasing PUE is the only goal, it is possible to manipulate energy ratios to make the PUE measurement lower without reducing energy use.
MAY 2024 | ISSUE 136 11
For example, when a facility’s cooling set point is increased, PUE will decrease due to less energy used for the cooling system, and increased IT load due to the higher use of server fans. This can result in a higher amount of total energy consumed, but a lower PUE value.
In turn, total energy usage may go down, both in the facility overall and within the IT load, but if they decrease proportionately to each other, the metric will not reflect an improvement. Introducing a new, more efficient IT technology might decrease the IT load, but will make PUE appear larger despite this being a positive change for energy usage. The data center industry is aware of these limitations, with companies like Mitsubishi Electric telling their customers that, “siloed improvements in efficiencies can result in a higher PUE.” As a result, cooling has to be adjusted when new equipment is installed in order to maintain the same PUE.

industry used an equivalent metric to PUE, when you asked a car maker what sort of mileage a vehicle gets, their answer would be, “we have no idea, but the air conditioner is about 10 percent of the total.””
closer and closer to the minimum value of 1, and the industry may require a more granular metric to capture energy efficiency changes.
One detailed example that illustrates the problem with PUE, especially at the CLS, is the fact that much transmission equipment has its own fans to cool down when the temperature is too high or when airflow is not properly distributed. This can somewhat distort the concept of consumption, suggesting that an increase in the transmission equipment’s energy use is solely due to increases in IT power, rather than this increase in cooling needs.
Moran points out that the best way to understand the value of PUE is to imagine a different industry using a comparable metric: “If the auto
Due to new methods of cooling on the horizon that are not compatible with the way PUE is calculated, some even claim that PUE is on the verge of becoming outdated. Jacqueline Davis (2021), in an opinion piece for Data Center Dynamics, argued, “its simplicity could limit its future relevance, as techniques such as direct liquid cooling (DLC) profoundly change the profile of data center energy consumption.” She brings up the point that if technology such as direct liquid cooling becomes more prominent, PUE may become less applicable. Direct liquid cooling in data centers tends to lessen the total IT power because it has a lower partial PUE and removes the need for fans in the server. However, these upgrades reduce IT load, so without adjustments, they could appear to be making PUE worse.
And lastly, as several industry experts claim: PUE levels are getting
The original goal of PUE was to measure the efficiency of data centers to avoid unnecessary energy expenditure. But PUE was never intended to be an all-encompassing measurement of sustainability in data centers. Even the Green Grid itself describes PUE as only the “first step” in examining data center efficiency. The over-emphasis and mis-use may have serious implications if all stakeholders rely on this metric alone. “PUE tells you nothing about the processing performance in terms of energy use of the core IT or telecoms equipment: two facilities could have the same PUE value yet one may be way more performant in terms of its output or capacity in compute, storage, network or data transmission,” Booth and Morris point out.
Properly contextualized with more detailed information and a suite of other metrics, and used to measure internal improvements, year-on-year, PUE can still tell a part of the story, even if it does not give a full picture.
12 SUBMARINE TELECOMS FORUM MAGAZINE
SUBSEA
A photo from the site visit by the SSN team at the CLS station operated by Etisalat and e& in Fujairah, UAE, showcasing a panoramic view of the facility.
PUE at the Cable Landing Station
On one hand, the CLS can be considered a small kind of data center, simply with a much lower power capacity (approximately 1 to 1.5 MW), smaller size, and different kinds of stakeholders involved. As a result, PUE can be used, as it is in the data center industry, to gauge improvements internally. We have seen promising projects to retrofit existing CLSs with newer, more efficient technologies and to integrate systems that allow for enhanced data collection and reporting. R&G Telecom, which has been working with operators, has been using PUE measurement especially when there is a need to compare results before and after an upgrade. Andrea Reschini, Head of Energy Efficiency and Sustainability at R&G, argues that this is something best done in collaboration.
Our team recently had a chance to visit the Etisalat SmartHub Fujairah Data Center, a facility that supports connectivity between Europe, Asia, Africa, and the Middle East. Here we learned that in SmartHub’s CLS there has also been a routine collection of power data and the calculation of PUE, although there is no metering in place. e&’s data collection helped to pave the way for improvements in increasing energy efficiency, such as the installation of new chillers aimed at reducing temperatures and optimizing energy use — and thus reducing PUE.
Another company that has been utilizing PUE as a metric to assess the efficiency of subsea cable landing stations is Orange. The company has also been using PUE to help plan the renewal and renovation of data center cooling and conversion systems, as well as in challenging equipment suppliers to achieve more optimal electrical
designs. Ricardo Ona, Subsea Project Manager at Orange, notes that this metric is promising for future activities aimed at enhancing the sustainability portfolio of the company. “The numbers have shown a positive PUE evolution over the years, and it is expected that future common initiatives may help further extend this tendency,” says Ona.
NEW EUROPEAN UNION REGULATIONS ON THE HORIZON
The European Union has been at the forefront of data center regulation globally and new regulations, of which PUE is a part, are on the Horizon. The EU has, to date, worked with the industry to offer best practices in data centers (via the EU Data Center Code of Conduct), which sets ambitious voluntary standards for companies and focuses on key issues and agreed-upon solutions. The Code of Conduct provides detailed best practices for improving energy efficiency in data centers, covering IT and power equipment management, cooling systems, building design, and monitoring.
In September 2023, the EU Parliament passed a Directive on the Energy Efficiency Directive, with the goal of reducing Europe’s energy consumption by 11.7% by 2030. Article 12 of the directive proposes new regulations on reporting for data centers. With the new directive now in place, the key regulations require data center owners and operators with significant power demands (above 500 kW) to publicly disclose detailed information about their energy consumption, power utilization, PUE, temperature set points, data volumes, water usage, heat utilization, and the use of renewables (see Annex VII for more details).
At a regional level, the directive also
mandates the establishment of a European database to aggregate data center information, enhancing oversight and public access to energy metrics. Moreover, the EU has expanded discussions on the first phase of establishing a common Union rating scheme for data centers through an associated delegated act (C (2024) 1639). By 15 September 2024, then by 15 May 2025, and annually thereafter, reporting data center operators must communicate their information and key performance indicators to the European database. Based on this, the delegated act specifies that the following will be publicly available in the European database in an aggregated manner, at both Member State and Union levels: Power Usage Effectiveness (PUE), Water Usage Effectiveness (WUE), Energy Reuse Factor (ERF), and Renewable Energy Factor (REF). While CLSs are not directly cited in these new rules, these legislative moves suggest that additional measures — both at the country and regional levels — could be introduced to enforce these standards more rigorously across other parts of the network, including cable landing stations. This means that EU member states are now required to enact it in their own way within their legal frameworks, which in turn will foster transparency and encourage the adoption of best practices in data center operations.
THE FUTURE OF SUSTAINABILITY METRICS
Sustainability and technology are two complex fields that are always evolving — why should one simple metric try to cover their intersection for years to come? PUE has certainly helped propel the efficiency movement in the data center sector–and is now enshrined in oncoming regulation. But as we describe
MAY 2024 | ISSUE 136 13
here, it should not be over-used or used by itself in the subsea cable industry. As Thomas J. Moran cautions: “At its worst PUE is now regularly used in clumsy attempts at virtue signaling that misrepresent it as a metric for comparing facilities to each other rather than to older, less efficient versions of themselves.”
CLS operators concerned with energy use might draw inspiration from other categories of metrics that have also been developed for use in the data center sector. Among these are metrics that describe the energy source itself. This includes the proportion of renewable energy used, whether it was generated on or off-site, and whether the energy was reused. Andrea Reschini reminds us that such other metrics would also come handy for enhancing sustainability: “It would be useful to know more about the breakdown of the energy — for example, the energy produced in the station, which is different from renewables acquired through certificates,” she says. Working alongside each other, industry members might also look at something that is often overlooked: kW/h consumed. They might look at the data transmission rate (or capacity) over energy used (e.g. Tbps/kW).
In short, if used, PUE needs to be interpreted in tandem with other performance attributes to fully characterize the operating energy efficiency of a facility — including Cable Landing Stations. As we suggest, it takes a suite of metrics, rather than a one-size-fitsall approach, to grasp the bigger picture of facility sustainability. This points to the need for the subsea cable industry to continue working together to facilitate data exchange and collaboration that can help the industry be prepared for tighter regulations emerging in Europe and other parts of the globe.
This article is an output from a SubOptic Foundation project funded by the Internet Society Foundation. STF

IAGO BOJCZUK is a Global Policy Consultant for the Sustainable Subsea Networks research project and a Ph.D. candidate in the Department of Sociology at the University of Cambridge, UK. His work investigates the material, cultural, economic, and political dimensions of digital infrastructures in the Global South.

ELLA HERBERT is an undergraduate student at UC Berkeley pursuing her B.S. in Environmental Science. She is currently a research assistant for the SubOptic Susbsea Sustainable Networks research team, focusing on data center sustainability by exploring metrics, industry trends, and publications within the field of telecommunications.

MICHAEL BRAND is an undergraduate student at the University of California, Berkeley pursuing a B.S. in Environment Economics and Policy. He is also a research assistant on the Sustainable Subsea Networks research team. His research focuses on the intersection of behavioral economics, environmental policy, and public communication for the development and regulation of digital infrastructure.

HESHAM YOUSSEF is a senior transmission engineer at Telecom Egypt, which is the leading provider of telecom, data, and internet services in the region. He has over 12 years of experience in the field of optical communications and submarine cable operations. He holds a master’s degree in electrical, electronics, and communications engineering from Alexandria University, and has also published several papers on novel optical amplifiers and modems.

NICOLE STAROSIELSKI is Professor of Media Studies at UC Berkeley. Dr. Starosielski’s research focuses on the history of the cable industry and the social aspects of submarine cable construction and maintenance. She is author of The Undersea Network (2015), which examines the cultural
and environmental dimensions of transoceanic cable systems, beginning with the telegraph cables that formed the first global communications network and extending to the fiber-optic infrastructure. Starosielski has published over forty essays and is author or editor of five books on media, communications technology, and the environment. She is co-convener of SubOptic’s Global Citizen Working Group and a principal investigator on the SubOptic Foundation’s Sustainable Subsea Networks research initiative.
Do you have further questions on this topic?
ASK AN EXPERT
References
Davis, J. (2024). Large Data Centers are Mostly More Efficient, Analysis Confirm. Uptime Institute. Retrieved 13 March, 2024, from https://journal.uptimeinstitute. com/large-data-centers-are-mostly-more-efficient-analysis-confirms/
Future-Tech. (2020). Introduction: The ISO/IEC 30134 Series of Standardised KPIS. Retrieved from https://www. future-tech.co.uk/introduction-the-iso-iec-30134-seriesof-standardised-kpis/
Lin, P., Bunger, R., Avelar V. (2021). Guide to Environmental Sustainability Metrics for Data Centers. Schneider Electric. Retrieved from https://download.schneider-electric.com/files?p_enDocType=White+Paper&p_Doc_ Ref=WP67_SPD_EN
Neudorfer, J. and Ohlhorst, F., (2010). Data Center Efficiency Metrics and Methods. Search Data Center. Retrieved from https://viewer.media.bitpipe.com/979246 117_954/1279665297_327/Handbook_SearchDataCenter_efficiency-metrics_final.pdf
The Green Grid. (2012). Carbon Usage Effectiveness (CUE): A Green Grid Data Center Sustainability Metric. Retrieved from http://nikom.in/Downloads/0a58778dfc96-4482-8c46-13abe76b015c.pdf.
The Green Grid. (2012). PUE: A Comprehensive Examination of the Metric. Center of Expertise of Energy Effiency in Data Centers. Retrieved from http://nikom. in/Downloads/0a58778d-fc96-4482-8c46-13abe76b015c. pdf.
Voort, T. V. D., Zaverl, V., Galdiz, I. T., & Hensen, J. (2017, February). Analysis of Performance Metrics for Data Center Efficiency. Rehva Journal. Retrieved from https://www.rehva.eu/fileadmin/REHVA_Journal/REHVA_Journal_2017/RJ1/p.05/05-11_RJ1701_WEB.pdf
14 SUBMARINE TELECOMS FORUM MAGAZINE
SUBSEA
WHERE IN THE WORLD ARE THOSE PESKY CABLESHIPS?
BY SYEDA HUMERAMARITIME NAVIGATION DATA INSIGHTS: A MICROSOFT POWER BI VISUAL ANALYSIS
INTRODUCTION :
In an age dominated by data, the maritime sector stands at the forefront of a transformative wave, primed to capitalize on advanced analytical insights. As stewards of the vast, ever-changing oceans, our commitment to steering the global lifeline of commerce through innovative and efficient maritime operations has never been more crucial. This 2024 Power BI report delves deeper into the vast ocean of data provided by the Automatic Identification System (AIS), articulating a more nuanced narrative of ship movements, traffic patterns, and navigational trends. Our analysis this year reflects profound technological advancements and significant geopolitical shifts that redefine maritime logistics.
The core aim of this report is to elevate the utility of AIS data from mere numbers to a cornerstone strategic asset. We have re-engineered our suite of Power BI visuals to offer stakeholders an enhanced, dynamic dashboard of knowledge. This includes sophisticated real-time positional mapping integrated with advanced predictive analytics to forecast potential maritime congestion and collision zones. Each visual not only contributes to a comprehensive understanding but also empowers decision-makers with actionable insights for superior route planning, fleet management, and optimized maritime operations.
Embracing the technological frontier, our report expands its lens to include the revolutionary integration of auton-
omous vessels and the application of digital twin technologies in maritime logistics. These advancements promise to reshape the operational paradigms of shipping fleets worldwide, enhancing efficiency while reducing the need for extensive human crews.
As we chart this analytical voyage, we also turn our attention to the submarine telecommunications network— a silent yet formidable force enabling our digital conversations. The network’s sprawling, unseen channels are the backbone of our global connectivity, making it a pivotal infrastructure in our digital age. The 2024 report explores the dynamic interplay of innovation, demand, and strategic maneuvering that molds the submarine telecommunications landscape.
16 SUBMARINE TELECOMS FORUM MAGAZINE
Below the ocean’s surface, the complex matrix of submarine cables, both slender and robust, not only facilitates our connectivity but increasingly mirrors significant geopolitical concerns and environmental considerations. We offer updated visual mappings of the global submarine cable network, reflecting recent deployments, retirements, and strategic expansions. Our visuals chronicle the industry’s progress through critical technological milestones, painting a vivid picture of a network that underpins the communication capabilities of nations and enterprises alike.

This year, we invite you to embark on a data-driven journey into the horizon of 2024, where every data point serves as a guiding beacon towards smarter, safer, and more efficient maritime and digital navigation. With each Power BI visual, we illuminate pathways through the vast data seascape.
VISUALIZING THE CABLE SHIP FLEET
Our visuals now map out a more intricate web of submarine cables that traverse the ocean floor, meticulously updated to reflect the connectivity grid of 2024. This new mapping includes the latest cable deployments which incorporate advanced materials for increased durability and data transmission capabilities. We also feature the pioneering use of AI-driven routing technologies that optimize signal integrity across vast distances, responding dynamically to underwater conditions and global data demands.
The industry’s timeline, enriched with the most recent data, chronicles pivotal advancements that have occurred over the past year. We highlight the deployment of ultra-low-loss fiber optics that have significantly expanded bandwidth capacities, meeting the burgeoning global demand for faster and more reliable internet connections. Additionally, our visuals capture the emergence of environmentally sensitive cable laying techniques that minimize the ecological impact on marine ecosystems, a reflection of the industry’s shift towards sustainability. These updates paint a vivid picture of technological
progress and the evolution of a network that not only undergirds the communication capabilities of nations and enterprises but also demonstrates a commitment to environmental stewardship and technological innovation. Through these enhanced Power BI visuals, stakeholders can gain a comprehensive understanding of how recent innovations influence both the current state and future trajectory of global communications infrastructure.
Amidst the bustling activity of the maritime industry, the importance of data remains paramount as it flows through the arteries of global trade and communication. Within this extensive realm of marine navigation, the analysis of vessel speeds continues to offer a vital perspective on the dynamics of sea traffic. Building upon our earlier focus on January’s Day 20, we now turn our attention to another significant temporal marker—March’s Day 24. This day commands a notable 5.18% share in the sum of AIS speeds, emerging as a critical point for a detailed examination of its significance and the various elements influencing this statistic.
While January sets the tone for the year, the impact of March 24 on speed metrics is not just a mere statistic but a reflection of evolving trends and operational dynamics as the year progresses. This report dives into the intricacies of this specific day, exploring the myriad of factors that shape vessel velocities and, by extension, influence the rhythm of maritime telecommunications.
The significance of the 5.18% contribution on this March day is multifaceted. To decode its importance, we
MAY 2024 | ISSUE 136 17
CABLESHIPS
engage with various potential drivers—from shifting environmental conditions and seasonal adjustments that favor certain navigational speeds to strategic vessel deployments in response to fluctuating market demands or geopolitical developments. Each percentage point represents a snapshot of the operational environment, depicting a complex scenario of maritime mobility.
In delving into this data, we aim to determine if this increase represents an outlier or is part of a predictable pattern influenced by recurring factors. Does this surge align with specific routes or geographic regions? Is it indicative of advancements in navigation systems or improvements in propulsion efficiency? Or does it correspond with an increase in economic activities, as the industry accelerates in response to heightened commercial demands post-winter?

As the year progresses, this report will continue to serve as a lodestar, leading the maritime telecommunications industry toward informed, data-driven decision-making and robust industry analysis.
The prominent average speed on March 24 has a ripple effect across the industry, affecting operational protocols and strategic decision-making frameworks of maritime enterprises. It impacts scheduling, fuel consumption, port operations, and the supply chain logistics crucial for the timely arrival of cargo. By understanding the implications of this speed surge, industry stakeholders can better anticipate similar trends, allocate resources more efficiently, and refine their route planning strategies.
By situating March 24 within the broader operational landscape of the year, this analysis not only benchmarks the increase but also sets a precedent for predictive analytics in maritime operations. The data captured on this day becomes a benchmark for comparative analysis, serving as a metric for gauging the performance and efficiency of the industry at large.
The exploration of March 24 and its 5.18% contribution to the sum of AIS speed transcends simple statistical analysis. It is a quest to extract actionable insights from the depths of data, guiding us through the complex waters of maritime navigation with a compass calibrated by knowledge. For stakeholders in this industry, these insights are not just numerical waypoints but are crucial navigational aids that steer strategic thinking and operational excellence.
In the intricate tapestry of global maritime operations, the nuanced dynamics of vessel statuses unfold, captured poignantly by the Automated Identification System (AIS). Our analytical journey dives deep into this profound sea of data, charting the diverse states that rhythmically pulse through the arteries of maritime commerce and navigation.
In our latest analysis, the “Moored” status emerges with even greater prominence, now recorded at a towering count of 3,982. This figure is not just a statistic; it embodies the multitude of vessels securely anchored within the world’s ports. Representing more than a temporary pause, “Moored” is a symphony of orchestrated efforts involving crew rest, cargo handling, and essential maintenance, playing a cornerstone role in facilitating the seamless flow of global trade.
However, a striking contrast is found in the status “Not Under Command,” which has a solitary count of 1. This status signals a vessel’s compromised maneuverability, serving as a stark reminder of the unpredictability and inherent perils of maritime journeys. Though minimal statistically, this outlier underscores the moments when even the mightiest ocean giants are at the mercy of nature’s caprices.
Adding to the narrative, status 5, which generally denotes “Underway Using Engine,” now stands as the status with the highest count at 3,982, making it 398,100.00% higher than the status 15, which has the lowest count at
18 SUBMARINE TELECOMS FORUM MAGAZINE
just 1. This vast disparity illuminates the operational diversity of the maritime sector, from serene harbors to vessels powering through open waters.
The spectrum of AIS data reveals a rich landscape of operational dynamics across seven navigational statuses, with “Moored” accounting for 36.78% of the total count. This dominant proportion further affirms its pivotal role in maritime operations. The dramatic range in status counts—from 3,982 for “Moored” to 1 for “Not Under Command”—encapsulates the full breadth of maritime activity, governed by a myriad of factors including environmental conditions, regulatory frameworks, and the relentless demands of global logistics.

emplify exceptional performance in these domains, setting new standards in maritime operations.
As we distill the essence of AIS data into coherent narratives, we uncover more than mere figures; we navigate through the lifeblood of maritime operations. This exploration into the realm of vessel states is not just analytical—it is a saga woven from the strategic, operational, and logistical fibers that unite to form the complex fabric of international maritime travel.
With these insights, the AIS data acts as a navigational beacon, guiding the maritime industry towards a horizon marked by increased safety, efficiency, and environmental responsibility. It underscores the critical importance of understanding not only where we are but also where we are heading—charting a course for the future of maritime navigation that is as informed as it is ambitious.
In closing, the voyage through maritime data is a continuous journey, one that underscores the robustness and adaptiveness of this essential industry. Each data point, each trend, represents a narrative of resilience, chronicling the strategic ingenuity that propels the ceaseless journey of our global fleet.
In the complex and ever-evolving realm of global maritime operations, the nuanced dance of vessel capabilities unfolds, captured intricately by the Automated Identification System (AIS). Our analytical voyage delves into the critical relationship between two pivotal attributes: SPEED and DRAUGHT. This year, our focus sharpens on POLARIS 3 and ASEAN RESTORER, two vessels that ex-
POLARIS 3: THE VELOCITY VANGUARD
POLARIS 3 has redefined maritime speed, recording an impressive average AIS.SPEED of 10.97. This remarkable velocity not only underscores its capability to navigate vast oceanic expanses efficiently but also positions it as a leader in the maritime race against time. Its prowess in speed makes it an essential study in operational efficiency and technological advancement in ship engineering. On our analytical scatter plot, POLARIS 3’s data points ascend towards the zenith of speed, vividly illustrating its dominant stance as the velocity vanguard in the high seas.
ASEAN RESTORER: THE DEPTHS DOMINATOR
ASEAN RESTORER stands as a testament to robustness and capacity, commanding the highest average AIS. DRAUGHT of 6.73. This significant draught is indicative of its ability to navigate through varied marine environments while bearing substantial loads. This measure not only highlights its operational depth but also its crucial role in heavy cargo operations, integral to global logistics and trade. On the scatter plot, the data points of ASEAN RESTORER are expected to cluster prominently at the upper extremes of the draught spectrum, marking it as the depth’s dominator.
The dynamic scatter plot analysis serves as more than just a visual tool; it is a narrative device that brings to light the intricate interactions between SPEED and DRAUGHT.
MAY 2024 | ISSUE 136 19
CABLESHIPS
This comparative analysis is designed to unearth potential correlations or distinctive patterns that may define the operational envelopes of POLARIS 3 and ASEAN RESTORER.
Identifying outliers within this data is particularly revealing, offering a window into extraordinary operational capabilities or groundbreaking navigational strategies that these vessels might employ. These statistical deviations are explored not as anomalies but as insights into innovative practices that could redefine industry standards or highlight areas for potential technological advancements.
This deeper exploration into the attributes of SPEED and DRAUGHT, particularly focusing on POLARIS 3 and ASEAN RESTORER, illuminates the vast array of navigational dynamics that characterize the maritime industry. By mapping these attributes on an advanced scatter plot, we celebrate the unique characteristics of these vessels, enhancing our collective understanding of the intricate interplay between speed and draught in maritime operations.
Through this analysis, we bear witness to the diversity and richness of operational strategies within the maritime domain, gaining invaluable perspectives that aid in optimizing vessel performance and operational efficiency. This comprehensive view not only educates but also inspires strategic thinking and operational finesse among maritime
industry stakeholders.
Understanding the distribution of vessel types through AIS data is critical for numerous stakeholders within the maritime industry, including regulatory bodies, shipping companies, and maritime safety organizations. The AIS. TYPE classification serves as a key indicator of the composition of the maritime fleet, offering insights into shipping trends, operational priorities, and potential areas for policy development.
The focused analysis reveals a distinct pattern of distribution across different AIS.TYPE categories within the dataset. This examination highlights the predominance of specific vessel types, shedding light on the current dynamics of maritime operations.
• Highest Count Observed: The dataset shows that the “Other Type, all ships of this type” category recorded the highest count with 4,526 instances. This figure significantly surpasses the counts of other vessel types, marking it as the most prevalent within the maritime data analyzed.
• Percentage Share: Remarkably, the “Other Type, all ships of this type” accounted for 41.80% of the total AIS. TYPE count observed in the dataset. This substantial proportion underscores the central role of this vessel type in maritime operations, suggesting a widespread application and critical importance in the industry’s ecosystem.

20 SUBMARINE TELECOMS FORUM MAGAZINE

COMPARISON WITH OTHER CATEGORIES
• Following Leaders: While the “Other Type” leads in prevalence, categories such as “Dredging or underwater ops” and “Cargo” also emerged as notable vessel types within the dataset. Though these categories do not match the volume represented by the “Other Type,” their presence is crucial in demonstrating the diversity and range of vessel operations captured through AIS data.
• Operational Implications: The variation in the count of AIS.TYPE categories reflects the multifaceted nature of maritime operations. The high prevalence of the “Other Type” might indicate specific operational or logistical preferences within the industry, potentially driven by factors such as vessel functionality, regulatory compliance, or market demands.
• Strategic Insights: Stakeholders can leverage these insights to strategize fleet management, regulatory oversight, and safety measures. The dominance of a particular vessel type may inform targeted strategies for enhancing operational efficiency, compliance monitoring, and safety protocols.
• Future Research Directions: The findings also open avenues for further research into the specific characteristics, uses, and operational patterns associated with the leading vessel types. Understanding the reasons behind the dominance of the “Other Type” and its implications for
maritime logistics and safety represents a valuable area for in-depth investigation.
The detailed analysis of AIS.TYPE distribution not only enhances our understanding of the current maritime operational landscape but also informs future strategic decisions and policy development within the maritime sector. The data shows a range across all 11 Type Description, from 143 to 4,526, further highlighting the diversity within the maritime fleet and pointing to areas where targeted interventions could yield significant improvements in operational effectiveness.
The network graph presented in this report aims to provide a visual representation of the relationships between different sources and their corresponding destinations. This analysis is essential for understanding the patterns of connections and interactions in a complex system, such as transportation, data flow, or supply chains.
The dataset used for this analysis includes information on various sources and their associated destinations. Sources and destinations can represent a range of entities, from airports and cities in transportation networks to data centers and endpoints in telecommunications.
The network graph below illustrates the connections between sources (nodes) and their destinations (edges). The size of the nodes and the thickness of the edges are propor-
MAY 2024 | ISSUE 136 21
CABLESHIPS
tional to the frequency or significance of connections.
In the network graph, some sources and destinations serve as hubs with numerous connections. These hubs play a crucial role in facilitating connectivity within the system. The degree centrality of nodes (sources or destinations) can be used to identify the most connected entities. High-degree nodes are potential hubs.
Analyzing the directionality of edges can reveal patterns of flow. For example, in transportation networks, arrows may indicate the direction of travel from source to destination. The presence of bidirectional edges suggests mutual interactions between sources and destinations.
The network may exhibit clusters or communities of sources and destinations that have stronger connections within their groups than with entities outside of their clusters. Detecting and analyzing such clusters can provide insights into the structure and organization of the system.
Practical Applications: Understanding the network of sources and destinations has several practical applications: Optimization: Identifying hubs and high-traffic routes can help optimize resource allocation and logistics.
Resilience Planning: Analyzing network connectivity aids in resilience planning by identifying critical nodes and potential vulnerabilities.
Route Planning: In transportation networks, this analysis can inform route planning for efficiency and reduced congestion.
The network graph of sources and destinations provides a valuable visual representation of the connectivity and relationships within a complex system. By analyzing this graph, we gain insights into hubs, flow patterns, and potential communities within the network.
This analysis serves as a foundation for making informed decisions, optimizing operations, and enhancing the resilience of the system. As we continue to navigate and understand complex systems, network graph analysis remains an indispensable tool for uncovering hidden patterns and connections. STF

SYEDA HUMERA, a graduate from JNTUH and Central Michigan University, holds a Bachelor’s degree in Electronics and Communication Science and a Master’s degree in Computer Science. She has practical experience as a Software Developer at ALM Software Solutions, India, where she honed her skills in MLflow, JavaScript, GCP, Docker, DevOps, and more. Her expertise includes Data Visualization, Scikit-Learn, Databases, Ansible, Data Analytics, AI, and Programming. Having completed her Master’s degree, Humera is now poised to apply her comprehensive skills and knowledge in the field of computer science.

22 SUBMARINE TELECOMS FORUM MAGAZINE
CAPACITY CONNECTION
EDITION THREE: DYNAMICS OF THE SUBMARINE CABLE BANDWIDTH MARKET: EFFECTS OF THE GROWTH IN CLOUD AND DATA CENTERS
BY JOHN MAGUIREINTRODUCTION
Welcome back to Capacity Connections, Submarine Telecom Forum’s department concerned with commercial aspects of the submarine cable capacity business.
In this third article of our series, we are going to look at the commercial effects on our business of continued burgeoning growth in the cloud and data center market.
In our first article, we presented a high-level overview of the sector, identifying cloud and data centers as one among a number of a key factors driving subsea bandwidth demand. The expansion of cloud services, the rapid growth in the number of cloud regions and the consequent establishment of increasing numbers of large-scale data centers globally, were identified as key factors driving bandwidth demand. It is a dimension that has come even more sharply into relief considering developments, specifically in the Pacific, in the few short months since that article was written, about which a bit more later.
In the second Capacity Connections article, on the evolution of commercialization (and to some extent regulation), in the subsea sector, cloud and data centers were identified as the key driver of growth in bandwidth demand. Simply put, demand
is converging on cloud. So, now let us have a slightly closer look.
'
ENVIRONMENT
At the risk of stating the bleeding obvious, but probably made necessary by the preceding remark, it is useful to consider briefly what “the cloud” is—and why it is generally bundled with data centers. There are a plethora of definitions, from the long-pastits-use-before-date “someone else’s computer” to the long and descriptive, the interesting and useful. I have decided to cite the following, in attempt to balance brevity and utility:
“’The cloud’ refers to servers that are accessed over the Internet, and the software and databases that run on those servers. Cloud servers are located in data centers all over the world. By using cloud computing, users and companies do not have to manage physical servers themselves or run software applications on their own machines.”1
We might otherwise, depending on our location and consumer interests, know ‘the cloud’ as amazon. com, AppleTV, Blackberry Messen-
1 https://www.cloudflare.com/en-gb/learning/cloud/ what-is-the-cloud/ (The quote is approximately 20% of the definition of “What is Cloud Computing?”)
MAY 2024 | ISSUE 136 23
CAPACITY CONNECTION

1 Those included in this
ger (R.I.P.), Gmail, Instagram, Line, Microsoft 365, Netflix or TikTok. Or, indeed, all the above.
While both are important, it is difficult, partly owing to their fundamentally different nature, to determine the breakdown of cloud demand/consumption between enterprise and consumer applications. Having said that, the key driver of cloud demand is considered to be enterprise applications2
Regardless of who they serve, however, and what they serve them with, cloud providers rely heavily on robust, high-capacity global networks—our area of interest—to ensure seamless access to data and applications hosted in data centers. Submarine cables, specifically through the Internet they support, play an
2 https://www.idc.com/getdoc.jsp?containerId=prUS51280423
integral and critical role in connecting these data centers across the globe.
EVOLUTION
At the nexus of enterprise and personal computing, Blackberry was possibly one of the earlier exposures many of us had to true cloud. Blackberry servers provided secure, remote storage, initially, of our enterprise email

24 SUBMARINE TELECOMS FORUM MAGAZINE
Figure 1: Global cloud regions1 (Source: www.cloudinfrastructuremap.com)
aggregated map are: Amazon Web Ssevices, Google Cloud, IBM Cloud, Microsoft Azure, Alibaba Cloud, Tencent Cloud and Huawei Cloud.
Figure 2: Cloud services market shares
data—very personal to use, very enterprise to provide. Similarly, Gmail began life as a free consumer service and rapidly evolved to one Google successfully markets to enterprises.
As the sector has evolved, it has grown rapidly in both enterprise and consumer categories, with the massive growth in demand enabling great broadening of underlying cloud fabric. This latter aspect is important because the growth in cloud regions, and especially in their local zones, has reduced some of the key early objections to cloud, particularly around the vexed questions of data security and, most especially, data sovereignty.

6 Sources: https://s2.q4cdn.com/299287126/files/doc_financials/2023/q4/AMZN-Q4-2023-Earnings-Release.pdf https://abc.xyz/assets/95/eb/9cef90184e09bac553796896c633/2023q4-alphabet-earnings-release.pdf https://www.microsoft.com/investor/reports/ar23/index.html https://s21.q4cdn.com/399680738/files/doc_news/Meta-Reports-Fourth-Quarter-and-Full-Year-2023-Results-Initiates-QuarterlyDividend-2024.pdf
IDC reports that year-on-year spending on cloud infrastructure in 2Q2023 grew by just shy of 8%, while spending in the non-cloud sector fell by a marginally higher proportion of just over 8%. The cloud segment ($24.6 billion) is some 70% bigger than non-cloud ($14.4 billion)—and the gap is rapidly widening rapidly.
On the revenue side, Statista reports total cloud services revenues of an eye-watering $76 billion in 1Q2024. The leading service providers are shown in Figure 2. When we add the shares that make it to the graph (80%) we can see there is also a considerable long tail to this market.
The revenue positions of the players, shown in Figure 3, is also noteworthy. We see that each of the top three cloud services providers has a significant business beyond cloud—be it in search, retail, hardware or software— on top of which the cloud business has been built. Of the top four revenue
earners, only Meta, principally through its Facebook, WhatsApp and Instagram platforms, is an outlier in being a purely cloud player and having purely a consumer product3.
Each of the names in chart are well known to us in the subsea sector as active, evolving, fast growing participants in the business.
CONTINUING GROWTH IN CLOUD— AND A CASE STUDY
The cloud computing market is poised to continue its incessant rapid growth, with projections estimating its value to reach $1.44 trillion by 20294. This points to a compound annual growth rate of more than 16% from today’s baseline. Apart from the migration from non-cloud to cloud infrastructure already identified, as new applications come along and evolve— artificial intelligence, for example, with
3 I’ve tried to phrase this carefully. Meta’s revenues come significantly, of course, from enterprise customers who purchase advertising. But on the basis that what Meta customers are purchasing is not a cloud service, but access to consumers and their data, consumers, literally, are the product.
4 https://www.mordorintelligence.com/industry-reports/ cloud-computing-market
its attendant data-hungry processes— they will drive substantial new demand for cloud computing services. The inevitable consequence, in this globalised world, is demand for more and more submarine cable capacity.
Unpacking the growth numbers, we have already mentioned the growth in cloud regions. The addition of regions and the attendant globalisation of cloud offerings is the element that feeds demand into the subsea bandwidth category.
While growth is exhibited by each of the players in the space, we are going to focus briefly here on Google as an exemplar. Google’s blog at https:// cloud.google.com/blog/products/infrastructure/ is a great source for firsthand information in this area.
• In the last year—most recently last month (April 2024)—Google has announced a mind-boggling seven new submarine cables in the Pacific.
A blog entry on Google Cloud regions revealed that Google had at the time (in September 2023) 39 cloud regions, globally. The post goes on to
MAY 2024 | ISSUE 136 25
Figure 3: Cloud provider gross revenues (cloud and other businesses, if any)61
CAPACITY CONNECTION

detail completed deliveries (which we assume are included in the total) in Israel, Italy, Qatar, Germany and Saudi Arabia. Meanwhile, it announced upcoming new regions in New Zealand, Thailand, Kuwait, South Africa5, Sweden, Greece, Mexico and Norway.
In Figure 4, we have filtered the data displayed in Figure 1 to show only Google presences. While the map presents readable numbers of only cloud on-ramp locations, we can unscientifically estimate that Google has of the order of half the total in North America and Europe—and significantly fewer than this in Asia-Pacific. One can only assume that will change over the next couple of years.
CONCLUSION
The brief for this article was to examine how cloud and data center growth might be expected to affect the submarine cable bandwidth busi-
5 Subsequently announced on January 31, 2024 as being open for business. (https://cloud.google.com/blog/products/infrastructure/heita-south-africa-new-cloud-region)
ness and to seek to identify any likely commercial effects. After this briefest examination of the issue, what to conclude? Well, if you are in the infrastructure business—building or maintaining submarine cables—this is a busy time and that is not going to change soon. What, however, if you are in the bandwidth business? According to the definition of cloud services that we have used, it is probably not unreasonable to posit that all international telecommunications (if not all telecommunications) will move to the cloud sooner rather than later. Traditional service providers, telecommunications companies, continue to participate actively in developing submarine cables and they do that based on business cases that forecast sales of bandwidth in particular quantities at particular times and at particular prices.
What we see happening, however, is that the major cloud service providers are moving, or have already moved from being customers of the telecom companies, to being partners
in building, to being builders. At some point one must wonder, even if based on a sample size of N=1, whether the players formerly known as “OTT customers” will instead become the underlying suppliers of bandwidth to the telecommunications industry. STF

Currently Director, EMEA, with APTelecom, JOHN MAGUIRE has experience gained across a broad spectrum of telecommunications roles and businesses over the past 30 years. He has sold security and network control software to mobile networks worldwide; established a regional federation fibre network across a family of affiliated telcos and, several times, established interconnect networks and wholesale structures for leading telco brands in new entry and emerging markets. He’s done this in roles across the business: using satellite and cable technology, for OEM and service provider companies and in fixed and mobile domains—including for start-ups and mature companies. His roles have encompassed general management, sales management, direct and indirect sales, business development, market development and operations. A native of Dublin, Ireland, he’s also lived and worked in Australia, UK, Singapore, Hong Kong, Thailand, Qatar, UAE and Malaysia. John holds a B.Tech. degree from University of Limerick in Ireland and an M.A. from Macquarie University Graduate School of Management in Sydney, Australia.
26 SUBMARINE TELECOMS FORUM MAGAZINE


MAY 2024 | ISSUE 136 27 to connect On a Mission WFN Strategies is an ISO accredited, industry-leading consultancy specializing in the planning, procurement, and implementation of submarine cable systems. We support commercial, governmental, and offshore energy companies throughout the world. We analyze and advocate renewable energy alternatives for clients’ submarine cables. wfnstrategies.com the world


[Reprinted from SubTel Forum 2023/2024
Submarine Industry Report]
GLOBAL CAPACITY ANALYTICS

The unceasing global demand for data is reaching unprecedented levels, driven by several key factors such as the widespread adoption of cloud-based services, the ubiquity of mobile devices, and the rapid deployment of next-generation technologies like 5G. This burgeoning demand presents the submarine fiber industry with ample opportunities to address the world’s ever-increasing connectivity needs.

From 2018 to 2023, the submarine fiber capacity on major routes grew at a Compound Annual Growth Rate (CAGR) of 13.3%. This rate accounts for both capacity upgrades and the construction of new systems, highlighting the industry’s agility in meeting rising data demands. However, it’s worth noting that this growth rate is a slight dip from the 18.2% CAGR observed in the previous year’s analysis.
As the global appetite for data continues to swell, the industry faces impending challenges. Balancing the soaring demand for data transmission with sustainable infrastructure growth is a significant hurdle. In some instances, data capacity demand could even outstrip supply. To mitigate this, the industry must remain committed to further capacity expansion. Cutting-edge
Global Capacity Growth on Major Routes, 2019-2023CLICK HERE TO VIEW THE ENTIRE INDUSTRY REPORT 30 SUBMARINE TELECOMS FORUM MAGAZINE


technologies like 400G wavelengths and high fiber pair count systems are crucial for ensuring that the submarine fiber industry keeps pace with the growing global data transmission needs.
Based on current data and future capacity projections, global capacity is expected to see a substantial uptick, potentially reaching a 75.4% increase by the end of 2025 (Figure 20). This forecast emphasizes the industry’s dedication to meeting the surging global demand for data transmission. However, it’s important to point out that these projections are somewhat more conservative than those from the previous year, which
had anticipated a 100% capacity increase over the next three years.
It’s also important to emphasize that not all announced systems have advanced sufficiently in their development to finalize details like fiber pair counts and design capacity. As these critical specifics are nailed down and more new systems come online, bandwidth capacities could see further increases, especially with the growing adoption of 400G wavelength technology and high fiber pair count systems. Additionally, the transformative effects of the COVID-19 pandemic, which led to a significant reevaluation of bandwidth
CAPACITY | GLOBAL CAPACITY
Planned Capacity on Major Routes, 2024-2026
MAY 2024 | ISSUE 136 31
Transatlantic Capacity Growth (Tbps, 2016-2020)
ANALYTICS

Lit Capacity Growth, Future

Total Capacity Growth, Future
needs and preparations for enhanced capacity to support remote work, add another layer of complexity to the ever-changing landscape of data transmission.
Since 2015, major submarine cable routes have averaged 18 percent lit of total design capacity, maintaining a large capacity buffer in cable systems to accommodate sudden spikes in demand, such as rerouted traffic due to a cable fault. However, it’s important to note that the Federal Communications Commission (FCC) has significantly reduced reporting requirements for active circuits since 2020. This
change has led to a lack of hard data, necessitating the reliance on modeling to understand capacity and usage trends post-2020.
TRANSATLANTIC
Transatlantic routes are among the most competitive globally, particularly those connecting the major economic hubs of New York and London. These routes facilitate traffic between the highly developed economies and technology markets of North America and Europe.
Transatlantic Transatlantic32 SUBMARINE TELECOMS FORUM MAGAZINE


From 2016 to 2020, the Transatlantic region experienced low to moderate design capacity growth, with a Compound Annual Growth Rate (CAGR) of 16 percent. This growth was driven by regular upgrades and the introduction of a new system each year from 2015 to 2018, as well as one new system in 2020. This represents a decrease from the previous year, where the CAGR for the period from 2015 to 2019 was 22.9 percent.
On average, the Transatlantic route has maintained a lit capacity of 23 percent of the total design capacity over this five-year period, which is significantly higher than
the global average of 18 percent. Specifically, 2019 and 2020 have seen lit capacities of 27.3 and 36.8 percent, respectively. Moreover, the lit capacity has grown at a CAGR of 40.9 percent during this period, indicating that demand is substantially outpacing the rate of capacity build-out.
Based on publicly announced information, lit capacity in the Transatlantic region is expected to grow to between 300 and 600 Tbps by 2025. (Figure 23) On the other hand, total design capacity is projected to reach between 900 Tbps and 1100 Tbps by the same year.
Transpacific Capacity Growth, 2016-2020CAPACITY | GLOBAL CAPACITY MAY 2024 | ISSUE 136 33
Transpacific Lit Capacity Growth, Future
ANALYTICS


While there is still an opportunity for new systems to be developed for 2025, the window for such projects is narrowing, given that a typical submarine cable project takes 2-3 years to implement.
The surge in bandwidth demand continues to be fueled by individuals and businesses increasingly adopting cloud and web-based services, a trend that has been particularly pronounced since the onset of COVID. However, the introduction of 400G technology and high fiber pair count systems, ranging from 16 to 24 or more, suggests that design capacity may keep pace
with or even exceed demand. This will likely be achieved through system upgrades and new systems announced over the next 12 to 18 months.
TRANSPACIFIC
In the Transpacific region, Hyperscalers are also extending their infrastructure, mirroring trends seen in the Transatlantic area. These systems serve as vital links connecting the economies of the United States and Canada with Australia and East Asia.
The Transpacific region has experienced growth rates
Transpacific Total Capacity Growth, Future Americas Capacity Growth, 2016-202034 SUBMARINE TELECOMS FORUM MAGAZINE


closely aligned with those of the Transatlantic, recording a Compound Annual Growth Rate (CAGR) of 16.6 percent for the period between 2016 and 2020. This is nearly identical to the previous year’s CAGR of 15.7 percent for the 2015-2019 period. During this time, the region has maintained an average lit capacity of 29.4 percent, which is significantly higher than global averages.
In 2015, the lit capacity in this region was as low as 15 percent, suggesting a short-term overbuild in capacity that has only recently started to decline. Specifically, the years 2019 and 2020 saw lit capacities of 29.3 and
47 percent, respectively. Similar to the Transatlantic region, Hyperscalers in the Transpacific area continue to be the driving force behind the majority of new system builds.
Based on publicly announced system information, the Transpacific region remains one of the most competitive areas globally, featuring a diverse array of both systems and customers. (Figure 28) While lit capacity is not currently projected to surpass design capacity by 2025, available data suggests that lit capacity could reach as high as 69.7%. To meet this steep rise in demand, more
Americas Lit Capacity Growth, FutureCAPACITY | GLOBAL CAPACITY MAY 2024 | ISSUE 136 35
Americas Total Capacity Growth, Future
ANALYTICS


systems will need to be developed and additional upgrades performed along Transpacific routes.
In terms of future projections, total design capacity in the Transpacific region is expected to grow to between 860 Tbps and 930 Tbps by 2025. Concurrently, lit capacity is anticipated to increase to a range of 260 to 650 Tbps by the same year.
AMERICAS
The Americas region has experienced substantial growth in recent years, with total capacity along major
routes nearly quadrupling from 233.5 Tbps in 2016 to 803.5 Tbps in 2020. (Figure 29) The growth rate for the period 2016-2020 closely aligns with the previous year’s rate for the 2015-2019 period, which was 28.5 percent.
In contrast to this significant growth in total capacity, the region has maintained a relatively low average yearly lit capacity of 9.4 percent, falling well below the global average. Initially, much of this growth was anticipated to stem from emerging markets in Latin America, which were expected to develop new systems and capacity upgrades to the United States. However, this anticipated growth has
Intra-Asia Capacity Growth, 2016-2020 Intra-Asia Lit Capacity Growth, Future36 SUBMARINE TELECOMS FORUM MAGAZINE
yet to materialize, possibly due to current economic and political challenges in Central and South America.
Hyperscalers continue to be the main catalysts for new systems along this route. They added several high-capacity systems in 2017 and 2018, increasing the total capacity along this route by over 160 percent compared to 2016 levels. While Hyperscalers have traditionally partnered with conventional telecom carriers to add this capacity to the general market, they are now primarily constructing cables for their exclusive use. Notably, Google sold a fiber pair to Sparkle on the Curie submarine cable system in 2020 and another fiber pair to Lumen on the Grace Hopper system across the Atlantic earlier this year. These transactions indicate that Hyperscalers may be open to monetizing these assets.
Based on publicly announced system information, the Americas region is expected to see a notable slowdown in new capacity demand, as much of the existing infrastructure remains unlit. (Figure 30) Traditionally, growth in this region has been driven by markets in Latin America, including Brazil, Argentina, and Chile, and further supported by the expansion of Hyperscalers in South America. However, due to ongoing economic and political instability in the region, and a potential overbuild in recent years, the usual demand drivers for systems have been lacking. Notably, much of the new bandwidth expected to be in place by 2025 will serve primarily the East Coast of the United States, where demand continues to rise.
In terms of future projections, total design capacity in the Americas region is anticipated to grow to between 1350 Tbps and 1650 Tbps by 2025. Concurrently, lit
capacity is expected to increase to a range of 125 to 175 Tbps by the same year.
INTRA-ASIA
Growth along the Intra-Asia route is contingent on significant infrastructure builds that connect major hubs across Asia and Southeast Asia, a development that does not occur annually.
Since 2016, the Intra-Asia route has experienced minimal to moderate design capacity growth. (Figure 31) This represents a slight decrease compared to the previous year, when the growth rate for the period from 2015 to 2019 was 19.5 percent. The lit capacity on this route has remained below global trends, accounting for just 12.4 percent of the total design capacity.
More than 700 Tbps of capacity is already available along the Intra-Asia routes, and up to 500 Tbps is expected to be added by 2025, marking a substantial increase. This growth in capacity is fueled by the development of several cables in the region, each with over 140 Tbps in capacity, planned through 2025. As demand escalates, particularly across the Pacific and between Asia, Australia, and the United States, there is potential for a significant rise in lit capacity, given the increasing amount of traffic being routed to and from Asia.
Based on publicly anounced system information, the Intra-Asia route is set for considerable expansion. (Figure 32) Total design capacity is projected to grow to between 1110 Tbps and 1250 Tbps by 2025. Concurrently, lit capacity is expected to increase to a range of 106 to 125 Tbps by the same year. STF
CAPACITY | GLOBAL CAPACITY MAY 2024 | ISSUE 136 37
Intra-Asia Total Capacity Growth, Future

121 112 77 74 67 52 44 38 35 34 36 41 27 18 41 87 18 26 37 23 16 20 20 22 14 11 7 13 18 23 10 9 6 22 11 12 5 7 7 8 4 4 5 5 11 5 15 6 3 31 3 2 10 3 2 10 12 3 3 4 15 2 7 13 SouthernCross CPC CPC TPU SAFE Honotua EAC-C2C CFX-1 Unity Faster TPE TGN Pacific TGN Pacific FOA M e m We A aCbe NATITUA Canalink WACS Manatua One One EAU O N SEA-ME-WE5 MAAG Falcon ACE PEACE TuiSamoa Malbec CE SAT-3 AAE-1 SKR1M S -ME-WE4 FEA AAE-1 Eastern Light Atlantis-2 GBICS ACE M e d u u Antel EASSy TWA-1 EllaLink Columbus III SJC C-Lion1 AESEWE3 Falcon Pangea LEV AE1 EASSy EIG SEACOM M nO M ua O e ESAT-2 RNAL EASSy BBG K D k SJC Ha FEA OAC BSFOCS SamoaTui ACE SEA-ME-WE 3 AAE-1 SEA-ME-WE5 EllaLink IONIAN G e N C AAE-1 Hawaiki SamoaTui ACE A5ME-WE ACE U s Malbec PEACE ACE ACE BRUSA FOA EllaLink JJK SAC EASSy ASE 1LV-SE MAYA-1 NEXTCrossSouthern BSFOCS SouthernCrossNEXT Alexandros Atlantis-2 QuintillionSubsea BBG ACE POI 2 ACE NordBalt SAC NEXTCrossSouthern Se k EllaLink PEACE Shefa2 MainOne DARE-1 SAM-1 WACS WARF PEACE SPSC/Mistral SAM-1 MA S SEACOM SEA-ME-WE3 BBG BBG APG MSC SAIT EASSy SEACOM A ka t dW s SouthernCross SAT-3 SAT-3 I-ME-WE GLO-1 TGN W EIG WACS SPSC/Mistral TGN Wes e E ope I-ME-WE HAVFRUE/AEC-2 SAFE PCCS EIG ACE EX N t AmericasII EXANorth/South SAFE Q Sub Aletar APG Atlantis-2 BRUSA Amitie SEA-ME-WE A E GLO-1 LION WACS EAC-C2C SAT-3 Amitie SAT-3 SPSC/Mistral P L C LION-2 SC WACS MainOne WACS NO-UK CCS EIG AAE1 ACE MENA Pangea Atlantis-2 ACE GLO-1 PAN-AM SEACOM WACS AMX-1 SAT-3 G2A AAG CFX-1 Atlantis-2 Norsea Com-1 GLO-1 GLO-1 CB-1 G mnB mud Pencan-9 CaucasusSystemCable AMX-1 WACS Northstar SAM-1 WACS SAT-3 Hawaiki WACS WACS AMX-1 Northstar AlaskaUnitedWest FEA Atlantis-2 SEACOM C-BUS GLO-1 ALBA-1 I-ME-WE Columbus II Athena SAFE GLO-1 WACS Kdakena Tannat ASC N W C AlaskaUnitedEast Farice-1 EllaLink A e IN rh TGN Pacific PCCS P C BRUSA IRIS ASC i2i METISS GlobeNet G beN ACE SCAN Prat SAM-1 Polar Express Endeavour SouthernCross ASH Minerva GlobeNet Indigo West AKORN Southern Cross TEAMS Southern Cross SAIL TGN-TIC SACS ColumbusIII NCP Grace Hopper EXAExpress EXANorth/South PAC AAG PLCN Jupiter SEA-US AEC-1 AC-2 Apollo FA-1 Greenland Connect MAC FEA Apollo Svalbard MAREA Dunant A o -1 ColumbusII OAC AMX-1 Curie SAM-1 Monet Seabras-1 SAC Japan-US PC-1 TGNAtlantic AC-1 PolarExpress BCS PEACE ACC-1 ALC B Natitua Sud 2A EAR S MEDUSA SING De p Blu One Raman MIST IEX CX IAX Ar ca1 ME USA MIST SEA-ME-WE6 Africa-1 CPC SAEXWest AX SAEXWest ALC S d V onC b IAX SE -M -WE G ld D a M D A Equiano 2Africa F i MIST 2Africa SEA-H2X N e C nCX 2Africa CX SEAH2X SJC2 EastSAEX U CSN-1 SJC2 Bifrost Tikal/AMX-3 Equiano 2Africa 2Africa D pB On GoldData1 ALC HCS ALC Firmina SAEXEast ALC ADC 2Africa SJC2 A a-1 Blue 2Africa SAEX West Galapagos Subsea System Raman h e b ADC Bifrost 2Africa A SE - - 6 Equiano SING SING 2Africa Ch eA a 2A ca SAEXEast CX 2Af a SEA-H2X IAX 2Africa E AEW 6 IEX CSN-1 CelticNorse SIGMAR 2Africa Bifrost 2Afic H Khano kv EMIC-1 Raman 2Africa SAEX East 2Africa SAEXWest IEX 2Africa T3 Africa-1 EMIC-1 2Africa 2Africa Raman EMIC-1 Bifrost TOPAZ Echo PEACESingaporeExtension ACC-1 2Africa LeifErikson Nuvem Anjana HawaikiNui T Concepción Saavedra Dummam Blackpool Sands Valparaíso Arica Salinas Tijuana Los Angeles Point Arena Angoon Sitka Cartagena Ustupo Bluefields Lempira Trujillo Ladyville Virginia Beach Manasquan Lynn Nuuk Kuujjuaraapik Inukjuak Akulivik Iqaluit Maywick Orkney Holyhead Kilmore Quay Oxwich Bay Highbridge Rödbyhavn Sventoji Ventspils Utqiaġvik Logi Måde Sylt Beverwijk Bredene Vigo Ponta Delgada Medano Banjul Conakry Cotonou Lagos Swakopmund Melkbosstrand Mtunzini Maputo Mogadishu Mayotte Bosaso Al Hudaydah Aqaba Oran Haifa Chania Savona Bari Otranto Odessa Novorossiysk Poti Fujairah Chabahar del Vallo Tripoli Kochi Tuticorine Cox's Bazar Medan Bandjermasin Waingapu Tungku Kota Da Nang Tseung Kwan Hong Kong Perth Pago Pago Vaitape Moorea Papenoo Spencer Maniitsoq Santiago Bay Santo Domingo Puerto Plata Dickenson Bay Montserrat Madiana Beach Port Salines Canefield Anguilla Rock Sound Crooked Providenciales Upper Bogue Kingston Kuala Kurau Ngwe Saung New York Rengit Conil Macqueripe Sines Northport Al Safat Bandar Abbas Al Ghaydah Aldeburgh Bull Bay Port Castries Maiquetia Herring Cove Hermosa Tanjung Sicily Terre Rouge Chiquita Hillsboro Kaunakakai Yzerfontein Praia Grande Kuakata Qalhat Ayre of Cara Quy Nhon Quawef Limbe Sangano Leckanvy Takaroa Makemo Osterby Duynefontein Oranjestad Sekena Rarotonga Aitutaki Bay King Cove Kollsnes Esbjerg Havelock Myanmar Aunu’u Wharf Santa Cruz Saint Paul's Bay Nacala Elizabeth Sopelana Fernandez Tortel Indonesia McHugh Dadeng Perryville Cold Bay Panipahan Malé Ålsgårde Beausejour Deeside Clwyd Cagliari Civitavecchia Kendal Muncar Nynashamn Golden Bay Klaipeda Nybro Jask Antofagasta Palembang Myrtle Beach Brighton Linao Saltcoats Taba Nuku'alofa Trapani Pigeon Point Pegwell Ujung Pankah Punta Salinas Galway Androth Agatti Kalpeni Minicoy Morib Villamil Caldera Concón L'Ancresse Bay Winema İğneada Saints Bay Kalimantan Ajaccio Åndalsnes Veracruz 1,000 0 1,000 2,000 3,000 4,000 500 Kilometers Landings Planned Systems In Service Systems
DISTRIBUTED AT KEY 2024 INDUSTRY CONFERENCES IWCS CABLE & CONNECTIVITY INDUSTRY FORUM, PTC, SUBMARINE NETWORKS EMEA, AND SUBMARINE NETWORKS WORLD
NOW AVAILABLE

2024
CABLE MAP GET YOURS TODAY 140 69 33 12 12 5 11 APG APG Far East EAC-C2C K CN G2P2 PPC-1 K N KSCN AJC TGN APCN-2Intra-Asia TSam AJC TPE TPE 1 Japan-US PDSC TCS Faster APG KSCN KSCN LPNG NG SEA-U SEA-US FEA AAG EAC-C2C M CS C APG JGA South GOKI SMPCS AP ASE SEA-ME-WE 3 APG NCP NCP TPE GOK H CS ASE SouthernCrossNEXT Jupiter Hantru-1 N Po r Coral Sea CoralSea ICN1 NCP Southern Cross NEXT Southern Cross FarEast GA S o h APCN-2 Hawaiki PolarExpress Hawaiki RJCN PPC-1 Gondwana-1 JGA North A Tasman Global Access SJC TGN Pacific Endeavour Japan-US Unity PC-1 Jupiter PC-1 Indigo Central Faster PLCN SouthernCross TGN Pacific Express RNAL TPE TPE EAC-C2C EAC-C2C HawakNui Hawaiki Nui H a k N ot CPC SJC2 NO CPC ADC CPC HCS TPU CPC p o TPU TPU ADC H C b H k Hawaiki Nui HawaikiNui H2Cable HawaikiNui Hawaiki Nui TOPAZ CPC TLSSC Ap co SJC2 SJC2 Echo TLSSC Apricot East CableMicronesia VCS Echo JUNO Echo Bifrost Ap ACC-1 H Nw u HawaikiNui Melbourne Cagayan de Oro Waingapu Kupang Sulawesi Papua Maluku La Union Toucheng Qingdao Ajigaura Naoetsu Ninomiya Madang Port Moresby Inverloch Auckland Majuro Sasanlagu Ngeremlengui Falls Daet Wada Brookvale Boat Harbour Takapuna Nago Coast Tanguisson Point Sandy Point Alexandria Atoll Tanshui Tutuyan Anadyr Petropavlovsk-Kamchatsky We Kavieng Kokopo Vanimo Calbayog Liloy Maasin City Alupang Unity TGN Pacific Polar Express PC-1 NCP AAG Jupiter PLCN Tui Samoa ExpressPolar CrossSouthern NEXT Polar Express SouthernCross TOPAZ Echo ACC-1 Bifrost Hawaiki Nui
SUBTEL FORUM
FEATURE
STEPPING UP TO MEET SUBSEA SECURITY CHALLENGES
BY KATHY KIRCHNERBack in February, new recommendations from the EU Commission on making submarine cables more secure and resilient highlighted concerns around the increased risk of attacks by malicious actors against critical maritime infrastructure. It follows a growing number of reports around subsea security, revealing a creeping anxiety in the US and Europe about how dependent economies have become on cables that carry 99% of international data traffic. The anxiety mirrors geopolitical tensions, conflicts in Ukraine and Gaza, where vulnerabilities in the pipes and cables that span the world’s oceans have become clearer.
Both war zones have seen undersea infrastructure destroyed or damaged: the Nord Stream gas pipeline in the Baltic Sea and internet cables in the Red Sea. Such attacks expose one kind of risk, while cyberattacks on critical infrastructure.
What’s raised the stakes around the significance of such incidents is the high volume of business-critical data routinely travelling over subsea cables, because of accelerating demand for cloud services. Hyperscale internet providers like Amazon, Google, Meta and Microsoft have become key players in the market, transitioning from high bandwidth buyers to capacity providers, building lucrative business mod-
els that have made them prime targets for cybercriminals.
What they also bring to the market is a need for cybersecurity awareness that was badly needed in the sector. They demand service providers up their game and become more proactive when it comes to network monitoring, consigning more passive approaches to history. As a company that has been providing engineering services for 25 years, Indigo was ready for the challenge of subsea security when we entered the market a few years ago.
IMPROVING NOC CAPABILITIES
What has become clear is that a new best-practice approach to cyber security is essential to minimize the risk of state-sponsored attacks taking out cables that connect continents. The Network Operation Centre (NOC) has had to evolve to become security-aware, providing hyperscale internet companies with a combination of fault and threat identification capabilities. As well as implementation of ITLV4 as the methodology for our processes to ensure best practice.
A modern NOC must be able to cross-reference data when tracking an incident and ascertain if there are any security implications. Similar sets of data must be analyzed in different
40 SUBMARINE TELECOMS FORUM MAGAZINE
ways. A priority will always be the client experience, ensuring uptime and the optimized performance of network infrastructure, but it’s increasingly important that network monitoring capabilities can identify early indicators of a cyberattack.
What service providers also need to recognize is that remote monitoring tools are part of the problem. They are themselves a target for cybercriminals. Any firms involved in network monitoring or managing may be targeted. They could be the weak link that lets a bad actor into a bigger company’s infrastructure.
Indigo ensures full ownership of all connectivity around remote monitoring that is integral to protecting client infrastructure. Built on robust MPLS technology, we use a carrier-grade IP-based Data Communication Network (DCN) that has advanced security features for high availability and redundancy, with full network recovery in case of failure. Hardware also has to be state-of-the-art. We never buy second-hand equipment because we need to have a forensic level of confidence that the hardware, firmware, and software are fresh from the factory, giving us the highest level of assurance possible of the equipment’s integrity.
A remote network monitoring service must take 100 percent responsibility for its services, which is why the choice of tools and processes is paramount. For Indigo, this includes running two NOCs simultaneously for backup and redundancy as part of our Secure Remote Access Service. Either can do the work with the other on standby. All services are provided in a ‘highly available’ manner across different geographies with constantly staffed facilities.
DEVELOPING THREAT INTELLIGENCE
Soft skills are becoming as important as technical competence when it comes to subsea cable monitoring. Security teams must build up their threat intelligence and become familiar with the IP subnets and organizations associated with criminal activity. They should know where to look to see if a client’s name is listed as a likely target. Such intelligence is an early warning system, a proactive way to keep ahead of constantly evolving threats.
None of this is easy and it takes a lot of planning. Indigo started with a security approach to services many years ago, introducing monitoring and first applying ISO 27001 standards in 2008. Our investment in Salesforce as our CRM platform is part of this evolution. Initially, the solution more advance than we needed, but we want to be able to capture monitoring data at scale and start the journey towards predictive monitoring and maintenance that’s AI powered.
Historic data collected in tickets and event records will be analyzed, alerting engineers to issues that might otherwise have been missed. The good news for clients is that the data we use
will all be owned by Indigo, generated purely from monitoring. We never ingest the data travelling on the client’s network. Another security risk where companies must do better is around employees. It’s widely understood that people are often the weakest link, which is why Indigo’s People department is so vigilant when it comes to hiring for our NOC and security practice. New recruits must go through a rigorous vetting and onboarding process, and then sign up to our security policies before undergoing training.
For US hyperscalers this level of detail matters, as does our European footprint. We help navigate EU regulations that are having a huge impact on the technology sector, such as the Telecoms Security Act, the European Electronic Communications Code (EECC), a major revision of the original framework for the telecommunications sector. US clients, used to a more relaxed regulatory environment, rely on Indigo to make sure they comply with the different markets they enter.
MANAGING SUBSEA PHYSICAL SECURITY
Any digital infrastructure owner or operator aspiring to be successful in subsea will also need diverse skills around physical security that is unique to the sector. Here the threats are as old as any man-made infrastructure: extreme weather incidents, unexpected accidents, and intentional attacks in conflict zones that all cause outages.
A combination of AIS (Automatic Identification System) to track ships and COTDR (Coherent Optical Time Domain Reflectometer) to detect faults are essential tools of the trade, along with a logistical acumen and an acute sense of time management. Dispatching a repair vessel to fix a broken cable can cost tens of thousands of dollars a day, so the ability to accurately locate a fault and then arrange a timely fix is paramount. And that is if you can employ the o ensure the most appropriate, scarce vessel can be deployed.
Indigo’s subsea service has always been about end-to-end security, covering every aspect of subsea network resilience. While our security skills have evolved from 25 years working with fiber and wireless networks, the skills that address physical subsea incidents have been embedded in our business since we signed our first subsea contract in Sept 2021. All are now managed seamlessly from our NOC. We believe it’s what the market demands, a proposition that is continually honed to be relevant to fast-growing subsea networks. STF

KATHY KIRCHNER is Network Operations VP, Americas for Indigo. Having held a number of senior operations positions in the telecommunications sector, Kathy is now playing a key role in Indigo’s US expansion, driving operational excellence and providing leadership in customer relationships that span tech and telecoms companies, hyperscalers and data centres.
MAY 2024 | ISSUE 136 41
THE SYMBIOTIC RELATIONSHIP OF SUBMARINE AND TERRESTRIAL CABLES:
A Climate Change Perspective
The history of communication technology is a testament to human ingenuity and adaptability. For over 170 years, submarine and terrestrial cables have been closely intertwined, facilitating global connectivity and transforming the way we interact. This article aims to highlight this relationship and its implications for climate change.
BY JORGE LOZANO
The engraving, titled “THE LAYING OF THE CABLE—JOHN AND JONATHAN JOINING HANDS,” preserved in the Library of Congress, captures the momentous event on August 17, 1858, when the first telegraph message was transmitted between Newfoundland and Valentia Bay, Ireland. The two figures shaking hands over the Atlantic Ocean symbolize the groundbreaking connection made possible by the first submarine cable. The ships “NIAGA-
A HISTORICAL OVERVIEW
RA” and “AGAMEMNON” in the background represent the U.S. and British ships involved in laying the cable. The lightning bolts illustrate the connection made by the cable across the Atlantic Ocean, a visual metaphor for the ITU connectivity map in the Figure 3.
Interestingly, the dialogue in the engraving closes with the first verse of Psalm 1331. This biblical reference adds a layer of depth to the image, underscoring the unity and brotherhood that this technological achievement symbolized.
The establishment of submarine cables dates back to the 19th century, marking a significant milestone in global
1 https://www.hmdb.org/m.asp?m=98822
42 SUBMARINE TELECOMS FORUM MAGAZINE FEATURE
Figure 1 - The First Submarine Cable - A Historic Handshake
communication. These underwater cables, in conjunction with their terrestrial counterparts, have formed the backbone of our interconnected world. The Internet connectivity map created by the International Telecommunication Union (ITU) provides a vivid illustration of this intricate network.

CLIMATE CHANGE AND COMMUNICATION TECHNOLOGY
“Economic margins have been eroding in the industry, especially in the marine sector, and there are generally no excess resources to funnel into sustainability”2. That affir mation applies around the world, not merely for the passive observers of climate change but all TIC Spatial, Submarine and Terrestrial Industries. They are, in fact, contributors at different levels to the increase its emissions. However, they also hold potential solutions to mitigate these impacts.
The red line in the upper left third of Infrastructure Connectivity Map is very subtle, but it represents just a magical tracing that is paying off 138 years later. Glides over it at this moment the Exa Atlantic cable, which has changed its name 3 times and will continue to be the industry’s vehicle to learn more about the mysteries of the North Sea.
In the same map, the dark blue lines represent the totality of terrestrial fiber optic cables reported to the Interna tional Telecommunication Union (ITU) by the national authorities of the 193 member states.
ratio (1:11.71) highlights the need for synergy between these two critical infrastructures. Submarine Cable Industry needs “healthy transport brothers” as the submarine ones are indeed.
To explore the ITU and/or Infrapedia Connectivity Maps3 ; and to add value to their observations, identifying in their country, state or region, the networks of their ISPs, is to take advantage of the enormous effort of the regulator so that we can learn how to help rate the quality of the service received and recognize the work and the thousand things that are between your

While terrestrial fiber optic networks dominate the landscape with a s surprising 16.41 million kilometers deployed according to the ITU in 2022, submarine cables, inventoried at 1.4 million kilometers by TeleGeography in early 2024, play a crucial role in bridging continents. This
SubOptic Foundation Greener Data - Volume Two, Chapter Fifteen Subsea Cable Sustainability
The Figure 4 is a sample of the ITU Disaster Connectivity platform to help first responders determine the status of telecommunications network infrastructure, coverage, and performance before and after a disaster. The map is focused on the Amazon Basin, an ecosystem of vital importance for the planet and humanity. It covers an area of 7.8 million km2 across eight countries: Bolivia, Brazil, Colombia, Ecuador, Guyana, Peru, Suriname and Venezuela. Map attributes refers to terrestrial and subfluvial fiber
3 https://www.infrapedia.com/
2 Subsea Cable Sustainability Erick Contag & Nicole Starosielski, PhD,
MAY 2024 | ISSUE 136 43
Figure 2 – Psalm 133 KJV

optic link as part of Infovias4, an initiative known as LA SUPERCOBRA, (Linea Amazonica Peru, Colombia, Brasil) and presented in Suboptic Paris 2013. The main goal of this initiative is to get a new one low latency fiber optic route between Europe and Asia, jointing Atlantic and Pacif Oceans through Amazon River and Andean Mountains. Do you think it is a Crazy idea?
Everyone is nervous about the river; the dramatic changes in course have discouraged many companies or organizations that have wanted to conquer it. But just like the Valentia, Newfoundland crossing, you have to keep going. Humanity is indebted to the native Indigenous population, settlers and peasants, abused men, women and children who fell into the hands of the rubber, gutta-percha or hemp fiber traders.
Have you imagined a global initiative that materializes this idea and also goes around the world as shown in Figure 4?, or a constellation of Haps that represents all the countries that profited from the exploitation of rubber, minerals and Amazonian resources, returning the favors in connectivity, health, food, education and a better quality of life for the natives so that there is no need to burn the forest?
Brasil Government with the technical support of the RNP has been conducting since 2015 a program to build long-distance optical networks that help bring connectivity to the interior of states, in order to serve the teaching and research community.
To save the Amazon River is to give the best of human
4 https://www.gov.br/mcom/pt-br/acesso-a-informacao/acoes-e-programas/programas-projetos-acoes-obras-e-atividades/norte-conectado
intelligence to understand and learn how to lay the underwater cables that can resist the annual onslaught of the enormous currents that characterize it.
We propose alliances through the university networks, CLARA for example, we need the push of BELLA link, the RNP of Brazil, the ICT Industries, the governments of the 193 or more states that benefit from it, we need the Amazon River alive!
We cannot give up, nor stop studying or generating ideas that help protect both the river and the cables that we will install so that the river and its people suffer less, predators break with the past and bring life back to the land.
The central course of the Amazon River 5 in Figure 6, shows a flood zone of approximately 40,000 square kilometers with many bad passages up to 50 meters deep. A strategy to follow for the survival of the cable would be to identify the bad passages and simulate through AI, the worst conditions of droughts and floods and take advantage of the dry seasons to carry out deep burial maneuvers of cables with customized techniques by routes, just as it is done in submarine cables, with the advantage of that those kinds of maneuvers would be dry. In the rainy season, the tectonic plates are bent, reducing the height of the geodesic vertices by a few centimeters.
Figure 7, to conclude this journey into the past but hoping for a promising future, is an excerpt from a map published by the Western Union Telegraph Company and curated by
5 https://www.sciencedirect.com/science/article/abs/pii/S0034425720304363?via%3Dihub
44 SUBMARINE TELECOMS FORUM MAGAZINE
FEATURE
Figure 4 – ITU Disaster Connectivity Map (DCM)
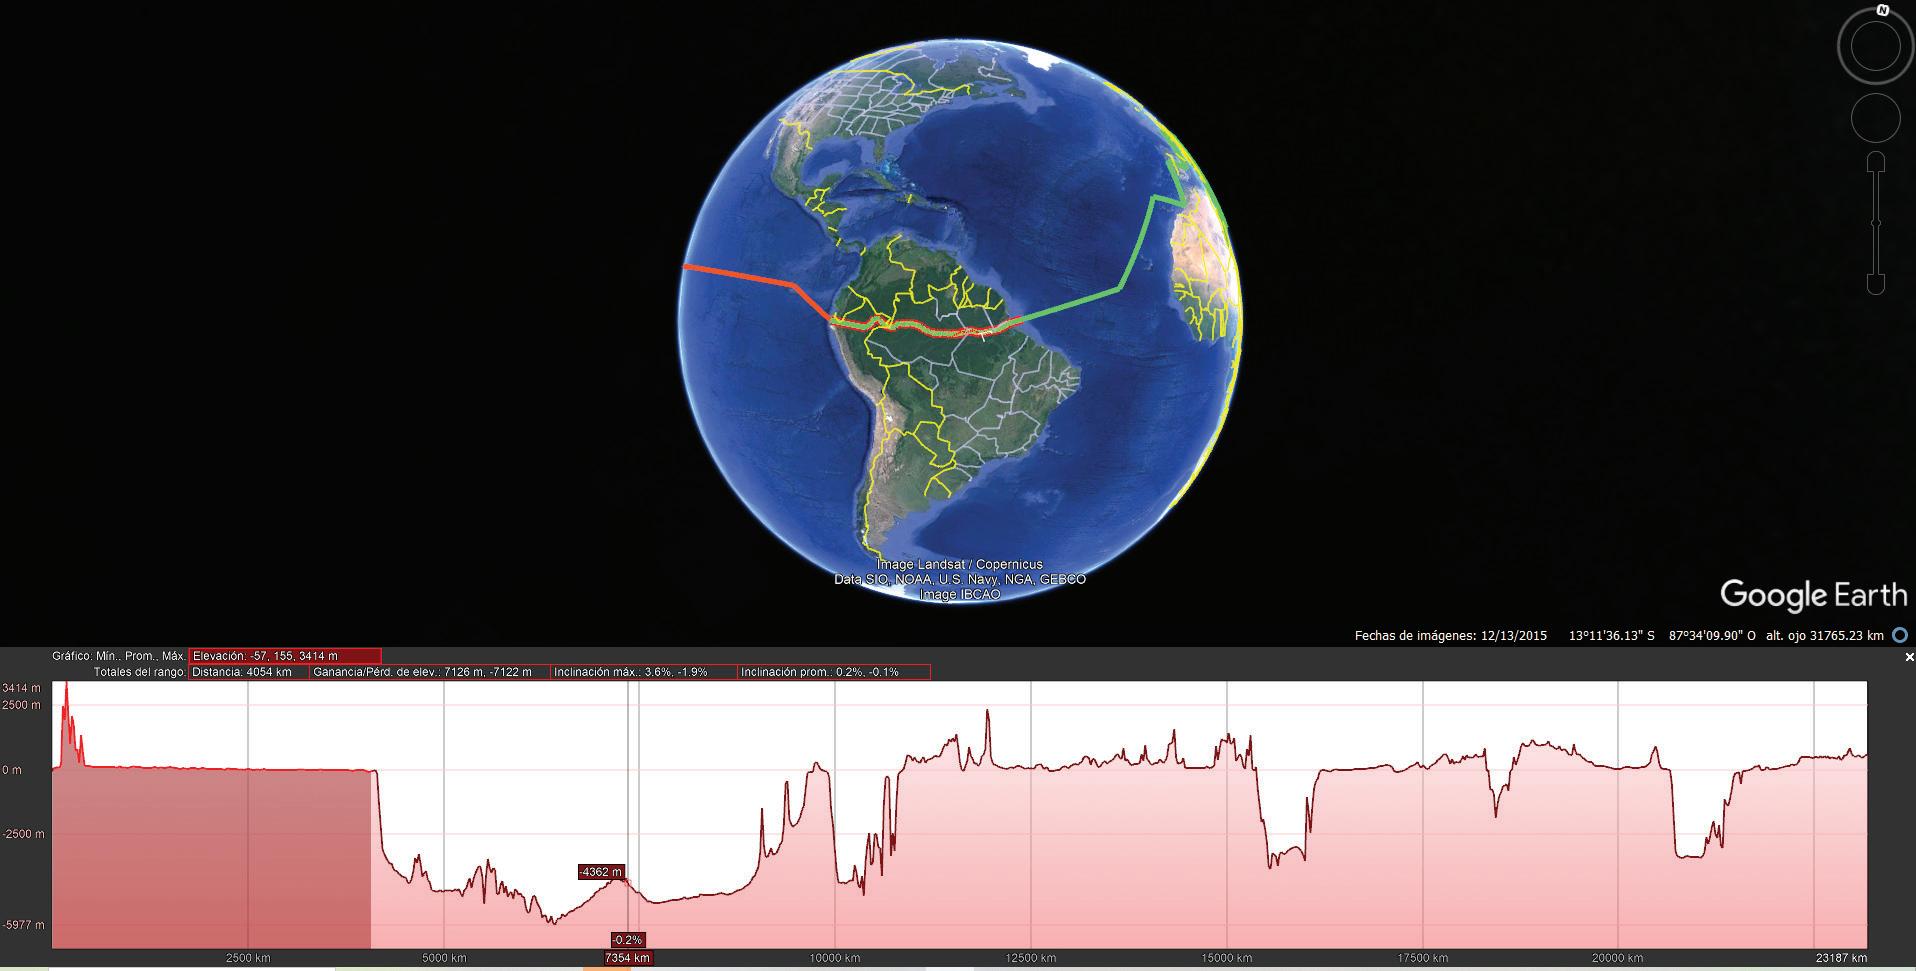
Princeton University6 promoting telegraph service from Gurupa at the mouth of the Amazon to Iquitos, Peru.
As an industry, we owe a debt to the inland sea that is 6400 kilometers long and has an area the size of Europe. The submarine cable industry or brotherhood is indebted to the Amazon and while we learned the lesson of Cyrus Field’s Persistence, it’s time to start paying off the debt. The Brazilian government and some Peruvian companies have given the modern initial fee, installing cables that will allow us by the end of the year to have a functional model of connectivity between Macapá – Santarem – Manaus – Coari – Tefe – Tabatinga (Brazil side) and Tabatinga – Leticia – Iquitos Yurimaguas (Peru side). The Andes Pass has several safe alternatives with probable arrivals at existing landing points.
This revised text provides a broader perspective on the global communication landscape, emphasizing the need for collaboration between different network types for optimal performance. It also highlights the exciting possibilities offered by emerging technologies like HAPS and subaquatic cables.
6 https://commons. princeton.edu/mg/wp-content/ uploads/2017/04/Western_Union_ Cable_System_and_Connections. jpg
The aim of this article was, show the close relationship that has existed between submarine and terrestrial cables areas and to use for comparison, the Internet connectivity map created by ITU.
The next idea is to turn to the document prepared by Erick Contag and Nicole Starosielski of the Suboptic Foundation, to emphasize that these two sister and complementary technologies are involved with climate change and that contributing to the reduction of emissions is a pressing need, because we are guilty of that increase and that all our actions count even if they are small.
To show that it is possible to contribute, I mention the repair work we have done in Colombia in 2002 and documented in the paper: Low price metho to repair cables at shallow waters: that has avoided the mobilization of expensive ships and machinery and that this example can perhaps

MAY 2024 | ISSUE 136 45
Figure 5 – LA SUPERCOBRA “Linea Amazonica Subacuatica peru Colombia Brasil

be replicated with the help of Suboptic and WFNS, with the dissemination of lessons learned.
CONCLUSION
To reduce the carbon footprint that began with telegraph networks parallel to railways more than 180 years ago, current governments should consider initiatives from other industries. I believe that the example of auctions in the energy exchange should be applied to telecommunications. Basically, the contribution in shares of the operators could be the monetized product of their terrestrial fiber optic networks in kilometers-wire, multiplied by a unit that is established for the performance of the network in terms of availability. The greater the amount of availability, the greater the contribution. Capitalizing on the network would then mean optimizing the external plant, including even in the factors, the dismantling of copper cable networks that have been disused for many years.
The evaluation would be in the hands of an AI that can measure the optical continuity and performance of each of the wires that operators want to provide, measured from the headers of submarine cables to the most remote of premises or POPs. This idea, open to modifications and debugging without “Copy Right”, was born in Suboptic Yokohama 2010, but has gained validity now that we want to unite the
Atlantic and Pacific oceans.
It opens up to discussion to find the best way to do it. We are all indebted to the Amazon. STF

JORGE ORLANDO GARCÍA LOZANO is an observer of the telecommunications sector and practitioner of the lessons on submarine cables given by the former veterans from Mount Kemble Morristown (AT&T USA), Lanion (Alcatel France), Kamifukuoka (KDD Japan) and Barranquilla (Telecom Colombia) since 1990. He is defender of the searching for a proposal to embrace the continents with land and underwater fiber optic cables that follow the Silk Road and crossing both Mediterranean Sea, Atlantic and Pacific Oceans to finally close the loop opened for centuries through the Amazon River and the Andes mountains. He presented papers at Suboptic in Baltimore 2007, Yokohama 2010, Paris 2013, and Louisiana 2019.
Thanks to SubTel Forum magazine the Submarine cable Industry will have in this issue details of the exercise of laying the first fiber optic cable on the bed of the navigable lake at highest level above sea.
REFERENCES
“The Worldwide History Of Telecommunications Anton A. Huurdeman” Library of Congress Cataloging-in-Publication Data: Huurdeman, Anton A. The worldwide history of telecommunications / Anton A. Huurdeman. p. cm. ‘‘A Wiley-Interscience publication.’’ Includes index. ISBN 0-471-20505-2 (cloth : alk. paper)
Rosenberg, Matt. “Amazon River.” ThoughtCo, Aug. 25, 2020, thoughtco.com/amazon-river-overview-1435530.
https://en.wikipedia.org/wiki/Amazon_River#Challenges https://www.sciencedirect.com/science/article/abs/pii/S0034425720304363?via%3Dihub https://atlantic-cable.com/CableCos/CandW/EATC/index.htm#amazon https://www.thoughtco.com/maps-4133027
46 SUBMARINE TELECOMS FORUM MAGAZINE
FEATURE
PROVEN PROCESSES AND METHODOLOGIES
• Defined Processes
• Template Driven
• PMP Based Project Management Approach
• Rigorous Documentation Controls
• Quality Assurance Focused
• Secure Records Storage
• Accessible and User Friendly
INTRODUCING THE VIRTUAL REP
• In-Field Analysis Without In-Field Risk
• Remote real-time analysis and reporting without the added cost of today’s in-field representation liabilities.

YOUR
PM 2.0 by REQUEST A QUOTE
PROJECT ANALYTICS ANYTIME. ANYWHERE.


28th - 30th May 2024
Business Design Centre, London
1000+ attendees 150+ industryleading speakers 50+ sponsors & exhibitors 250+ organisations 9 key themes 1 unmissable #SubNetsEMEA Use code ‘STF20’ to get 20% off your Submarine Networks EMEA 2024 ticket
industryspeakers unmissable event EMEA's Pre-eminent Subsea Conference Submarine Networks EMEA is the leading annual subsea connectivity event in the region, bringing together 1000 senior leaders from the global subsea market for two jam-packed days of learning, collaboration and networking. www.totaltele.com/subnets your ticket

28th May - 30th May
Business Design Centre, London
Attendees of Submarine Networks EMEA are invited to...

PRE-EVENT WORKSHOP
28th May | Business Design Centre, London
Pre-registration is required: Spaces are limited and you must be registered for Submarine Networks EMEA to secure your place.
AGENDA
29 - 30 May
Keynotes
Trends, opportunities, and challenges for the global subsea cable market
Keynote addresses from the European Subsea Cables Association (ESCA), SubOptic Association & the International Cable Protection Committee (ICPC)
Title Partner presentation from Ciena
News in Brief: Cable project and connectivity hub updates
Collaborating towards a greener future
Delivering enhanced subsea connectivity in the Middle East
Commercial strategy Technology & operations
Commercial models & innovative partnerships
Subsea financing: is it getting harder or easier?
Security
Strategies for promoting subsea cable resilience and security
Capacity upgrades: what are the latest innovations?
Strategies for using existing subsea assets for environmental monitoring
50 SUBMARINE TELECOMS FORUM MAGAZINE
Market dynamics
Strategies for delivering connectivity for underserved regions
Collaboration opportunities for connecting digital infrastructure in Africa
Regulation
How should and can industry work with different national jurisdictions?
Environmental planning considerations
How are subsea cables part of larger infrastructure plays in the wider ecosystem?
Installation, maintenance & operations
Is there a need for a collaborative approach from the industry to the maintenance issue? If yes, what should this look like?
*Agenda topics and timings are still subject to change


The talent gap: what does the industry need?
How is the sector addressing the challenge of skills shortages?
Sustainability
Cables and the environment: looking towards the future


MAY 2024 | ISSUE 136 51 May London Early bird, group discounts, and *subsidised tickets available at
SCAN TO FIND OUT MORE!
www.totaltele.com/subnets
The future of subsea
Data centres
FEATURE LIFE EXPECTANCY OF A FIBER OPTIC CABLE
BY JAVIER VALDEZ AND GILBERTO GUITARTE
The article on the life expectancy of fiber optic cables reveals a scientifically estimated lifespan of 25 years for submarine cables, based on environmental stresses and technological advancements. It highlights the dynamic nature of the telecommunications industry, where increasing bandwidth demands may prompt more frequent updates and replacements of these cables.
When we read the list of projects already executed and those that are about to be executed related to submarine fiber optic cables, we observe a constant: the period between the date of entry into service of the cable and the estimated date of decommissioning is stated as 25 years.
We rightly wonder if this is a financial assumption or if it is expected that after 25 years the cable will no longer be reliable and perhaps it is time to take it out of service... Well, they can be the first and the second together, but the reality is that scientifically determined life expectancy is the one that must be taken into account for the operation of that submarine cable with limited risk.
The life expectancy of a submarine cable is estimated by various scientific methods, between 20 and 30 years (hence the famous 25 cited by various media) and the most important manufacturers of fiber and optical cables in the world, as well as the scientific documents of regulations and verification tests by ITU and IEC, are involved in this esti-
mate. as the two most important to mention in this aspect.
Both regulatory organizations worked with the methodology of stressing the phenomena that can produce mechanical or optical failures in fiber and cable, measuring performance parameters and their evolution over time under constant conditions, and with isolation of variables in some cases or a combination of them in others. Both accept with scientific rigor the validity of the concept -or theory- of “accelerated aging”, in order to then be able to extrapolate in time the moment when unacceptable performance values are reached, whether they are high-risk entry, or total failure in service.
The amount of material documented by these organizations is incredible and we list all of them at the end as references so that the reader of this article can verify them and deepen their knowledge of the detail provided by them.
It is very important to emphasize that an optical fiber has extrinsic faults (failures in the glass due to manufacturing process, winding, storage, installation, stripping of the fiber during the splicing or connectorization process) and intrinsic failures (inherent to the physical resistance of the glass itself).
There are examples of variations in stress over time (stress histories) and geometries such as:
• Constant Tension (such as directly buried cable, or bending in a splice or reserve closure).
• Variable voltage (due to variations in temperature, wind,
52 SUBMARINE TELECOMS FORUM MAGAZINE
ocean currents, or laying fiber from a cable feeder coil).
• However, the most common situation for which reliability calculations are made is that of fiber optics subjected to an in-service stress stress, applied constantly, invariably over time.
According to ITU-T-G Supplement 59, a widely used model that takes into account the intrinsic zone of high resistance as well as the extrinsic zone, is the life equation according to the Power Law theory that appears in IECTR-62048 shown below:

VARIABLES USED IN THE EQUATION
PARAMETERS DESCRIPTION - EXAMPLE
• TF Time to Failure (Expected Life) Calculated
• tp test time check see ITU-T-G.650.1
• σ p test stress 0.69 GPa (100 kpsi) (given by the manufacturer)
• σ a applied load see clause 10 (in ITU G Sup59)
• F probability of failure see Appendix II (in ITU G Sup 59)
• Np rupture rate during one test in 100 km
• l Length under tension determined by application
• ∙ corrosion under stress ~20 to predict service life
• Weibull md m in dynamic tensile strength pending from the Log graph (probability of failure) vs.Log (effort) in the extrinsic region
In the case of active components in a submarine cable, models (such as) those presented in ITU-TG.911 can be used, which establish in Table 6, the MTBF (Mean Time Between Failures) and FIT (Failures In Time-device in 1,000,000,000 hours) for pluggable circuits. An example of the MTBF of a Terminal and Repeater system is given in Table 7.
The treatment of MTBF and FIT (see figure below) requires the reader to be introduced to the topic of statistical fault distributions and to recline on reliable and reputable suppliers in the electronic optics industry who can support the establishment of MTBFs and/or FITs of their component elements in order to determine the
probability of failure or survival of the entire link optical system either underwater or terrestrial. We recommend the in-depth study of the following reference standards:
• ITU-T-G.911
• ITU series G Suplementos 40 y 59
• ITU-G.650.3
• IEC TR 62690
• IEC TR 62048
• IEC 62005-9-IEC TR 62469
TYPICAL FIGURE : “Bathtub” style indicating the expected performance as useful life (ZONE 2) until the risk period in which failure rates begin to increase in an accelerated manner (ZONE 3)
The rapid evolution of communication technologies and the increasing demand for bandwidth are leading to underwater optical networking systems being designed with a potentially shorter lifespan than the traditional 25 years. This evolution is due to several factors:
1. Increasing demand for bandwidth: With the increase in the use of the internet, cloud services, high-definition video streaming, virtual reality applications, among others, the demand for bandwidth continues to grow significantly.
2. Technological advancements: New emerging technologies, such as coherent sensing, the use of C+L bands, tecnología de multiplexación por división espacial (SDM), and other transmission techniques, are making it possible to increase the capacity of submarine cables to meet this growing demand.
MAY 2024 | ISSUE 136 53
Device type Quantity Unit FIT rate Total FITs Packaged laser 1 1500 1500 Integrated circuits 5 300 1500 Resistors 4 123 492 Capacitor 7 57 399 Connector 1 27 27 PWB 1 27 27 Total 3945 YEARS
Table 6/G.911 – Example of plug-in circuit pack MTBF calculation
FEATURE
Competition and updating: Competition in the telecommunications market drives companies to stay up-to-date with the latest technologies to offer faster and more reliable services. This may involve replacing subsea systems with new technologies and cables with higher carrying capacity before they reach their full lifespan.
Therefore, it is common for underwater optical network operators to plan replacements and upgrades on a more frequent basis to keep up with market demands and available technology. This can result in a seemingly shorter lifespan for these systems compared to other types of network infrastructure. They are not necessarily designed to have a shorter service life, but rather to adapt to the specific conditions and needs of the underwater environment. Submarine cables and submarine optical networking systems are designed with materials and technologies that can withstand the harsh conditions of the seafloor, including water pressure, corrosion, ocean currents, and seismic activity.
Due to the constant evolution of technology and ever-increasing bandwidth demands, submarine cables may be upgraded or replaced over time to keep up with global communication needs. This can result in a seemingly shorter lifespan compared to other types of subsea network infrastructure, but it is not necessarily designed for the purpose of having a reduced lifespan from the start. STF

Table 7/G.911 – Example of system MTBF calculation

access across Latin America. Valdez’s extensive experience and active participation in both the professional and educational spheres make him a respected consultant and influential figure in the telecommunications sector.
ENG. JAVIER VALDEZ, based in Capital Federal, Buenos Aires, Argentina, has made significant contributions to the telecommunications sector, especially in terrestrial and submarine optical networks, over his 31-year career. As a member of the SubOptic Association, Valdez plays a crucial role in the Mentor & Mentee Committee, focusing on the submarine program. His global consultancy work spans numerous international projects, establishing him as a key figure in optical network advancements. Additionally, Valdez’s commitment to education is evident through his professorships at the National Technological University (UTN-BA) and the University of Buenos Aires (UBA), where he mentors young professionals entering the field.
Beyond his professional and educational endeavors, Valdez is actively involved in several professional organizations, including the Subcommittee of Fiber Optics at the COPITEC Professional Council and the Operations Committee of FBA-LATAM Fiber Broadband LatAm since 2001. His work in these roles not only contributes to the development of industry standards but also to the broader goals of improving telecommunications infrastructure and

ENG. GILBERTO “GG” GUITARTE stands out in the telecommunications field as a seasoned Industrial Engineer from UCA Buenos Aires, known for his expertise in fiber optics. As a Certified Fiber Optics Instructor (CFOS/I) with the Fiber Optic Association USA, Guitarte has significantly contributed to the education and training of professionals in this specialized area. His role extends beyond instruction; as the former President of the FTTH Latam Council, he has been at the forefront of promoting fiber to the home (FTTH) technologies across Latin America, advocating for the expansion and adoption of high-speed internet infrastructures. Currently, Guitarte is leveraging his extensive knowledge and experience as a Fiber Optics Instructor at Wake Tech Community College in North Carolina, USA, where he focuses on practical and theoretical aspects of fiber optics, including FTTH Passive Optical Networks (PONs) and Passive Optical LANs (PO-LANs). His work as a consultant in these areas further solidifies his position as a pivotal figure in advancing fiber optics technology, bridging the gap between educational frameworks and industry needs. Through his dedication and expertise, Eng. Guitarte continues to influence the future of telecommunications, fostering growth and innovation in fiber optics globally.

54 SUBMARINE TELECOMS FORUM MAGAZINE
Device type Quantity Unit FIT rateTotal FITs Channel pack 5 8 00040 000 Power supply 4 6 50026 000 Regenerator 4 12 05048 200 Microprocessor board 1 12 30012 300 Monitor board 1 3 4003 400 Total 129 900 1.14 × 10⁵ 1.299 ×10⁵ MTBF = =0.878 years

MAY 2024 | ISSUE 136 55 FEATURE ENGAGE WITH US ON SOCIAL MEDIA STAY CONNECTED subtel-forum @subtelforum @subtelforum Sub TelForum
THE IMPORTANCE OF SUBSEA CABLE AND
DIVERSITY: ROUTE
A Strategic Role In Mitigating the Impact of Unprecedented Cuts to Multiple Subsea Cables Off the Coast of Africa
BY CHRIS WOOD56 SUBMARINE TELECOMS FORUM MAGAZINE FEATURE
Unprecedented.
That was the term widely used to describe the incidence of two significant subsea cable disruptions occurring less than a month apart off the African coastline, causing internet outages across the continent.
The issues started in February, when three cables were severed in the Red Sea by a suspected anchor drag. The following month, a suspected undersea canyon avalanche off the coast of Côte d’Ivoire led to damage on four cable systems serving Africa’s western seaboard – ACE, MainOne, South Atlantic 3 (SAT-3) and WACS. In total, seven cable systems were affected at the same time, resulting in widespread internet issues for days across many geographies, particularly Côte d›Ivoire and other smaller economies on Africa’s west coast, as well as in South Africa.
Cable route diversity along Africa’s east coast meant that despite damage to the three cables in the Red Sea, it was possible to re-route traffic through international cables running through Djibouti.
The four affected systems off the west coast of Africa have never all been damaged at the same time, with the issues compounded by the cut cables in the Red Sea - as it would normally be possible to restore west traffic on the east (and vice versa).
However, the impact would have been far more severe and longer lasting were it not for the crucial route diversity provided by the Equiano cable, together with swift traffic re-routing and service restoration work by WIOCC.
WIOCC LEADS THE INDUSTRY’S RESPONSE
WIOCC, Africa’s digital backbone and the largest operator exclusively focused on the infrastructure needs of Africa’s wholesale community, led the telecommunications industry’s response to the cable outages. This was even though its own clients were largely unaffected because of the resilient network architecture enabled by WIOCC’s strategic approach to capacity investment – investing at
scale and in multiple subsea and terrestrial systems routes. This protected WIOCC clients by providing them with unique levels of redundancy, taking advantage of the scale & scalability of WIOCC’s core backbone following consistent significant investment in diverse, highly-scalable national and international connectivity infrastructure,
CLOSE COLLABORATIONS AND PARTNERSHIPS KEY TO ACHIEVING SERVICE RESTORATION MILESTONES
WIOCC quickly established a combined executive, technical and operational task force to instigate, plan and implement WIOCC Group’s response to the situation. WIOCC immediately began turning up restoration solutions for cloud operators, fixed and mobile carriers, internet service providers (ISPs) and other service providers. To serve those with critical traffic running on affected cables, WIOCC staff worked around the clock to meet the demands of clients both old and new.
Because of WIOCC’s policy of investing in diverse, highly-scalable national and international connectivity infrastructure, allied to the very strong partnerships it has forged with equipment suppliers, data centre companies and other network operators, within just six days of the cable cuts, WIOCC had:
• added more than 2.5 Terabits per second (Tbps) of capacity into its network
• configured in excess of 100 individual restoration circuits (from 150Mbps up to 800Gbps capacity)
• restored more than 30 of the leading players in Africa’s wholesale ecosystem, enabling them to quickly re-establish key traffic routes, the internet and minimise performance degradation for their business and consumer customers.
Turning up so much restoration capacity at such short notice also required the configuration of huge amounts of national backhaul capacity to connect clients to the subsea landings, and the ability to rapidly source, stage and install the network cards and optics necessary to make this capacity available where needed.
WIOCC’s suppliers and key industry partners were instrumental in enabling this, supporting it in meeting its short-term equipment needs.
CRUCIAL CABLE ROUTE DIVERSITY
The 15,000km, 144Tbps Equiano cable, which went live in 2023, played a huge role in safeguarding the resilience of Africa’s connectivity during this incident off the west coast of Africa.
The Equiano cable lies much further offshore than the four cables affected in the African west coast incident,
MAY 2024 | ISSUE 136 57
FEATURE
which are laid at depths of 2.4km to 4.5km below sea level and at least 100km apart, so were most likely struck by an undersea avalanche of debris.
Many of the carriers that were badly affected by the cable outages, which caused major internet outages in West Africa, didn’t have redundant capacity on Equiano and so were not able to reroute their traffic.
As WIOCC owns a fibre pair on Equiano, acquired as part of its strategic approach to at scale capacity investment in multiple subsea and terrestrial infrastructure networks, it was able to quickly restore other networks onto Equiano. Some of that traffic went north to Europe and some went south and connected into WIOCC’s IP network in South Africa, which is why the impacts of the multiple, synchronous cable outages were limited in terms of time.
2AFRICA CABLE WILL PROVIDE DIGITAL AFRICA WITH FURTHER RESILIENCE AND DIVERSITY
Today, connectivity providers typically have capacity on just a few of the available international routes, but recent events like these concurrent subsea cable outages demonstrate the need for this to increase in order to achieve adequate system resilience and reliability.
The 2Africa cable system is expected to go live later this year and will provide the option of further resilience and redundancy. However, to provide their customers with this added level of reliability, operators will need to purchase capacity on the new system.
SATELLITE A (VERY) LIMITED OPTION
There are few financially viable options not based on subsea connectivity for ISPs to build additional resiliency into their networks. Satellite is not a replacement or a redundancy solution for submarine cables; it cannot deliver anywhere near enough capacity and would also be far too expensive. However, it could potentially be used for backup of certain limited applications.
MORE SUBSEA CABLES?
As some existing cables, such as Sat-3, are approaching the end of their useful lifespan, additional capacity beyond Equiano and 2Africa will be required, but there is no quick fix. New international cable systems are very expensive: to lay a new cable from South Africa to Europe, landing in four or five countries on the way, would cost in the region of a billion dollars. On top of that, it is still a seven-to-tenyear process to secure the funding, design the system, lay the cable and commission it.
SUBSEA CABLES RUN THE WORLD’S INTERNET
There is no viable alternative for running multi-terabit solutions around the world. While Africa’s reliance on subsea cables maybe more pronounced than other regions, this incident has demonstrated the extent to which the continent’s connectivity has become more resilient over the past ten years.
With the addition of one or two further ultra-high capacity subsea cable systems, digital Africa will become even more resilient and an even more attractive continent for global content providers, cloud operators and hyperscalers to do business in.
SOME LEARNINGS
1. There is no such thing as too many subsea cable systems. Providers should have capacity on whatever systems are available.
2. It is not about the volume of capacity that the cables can carry, it is the number of cables a provider has capacity upon which is important, as this is what ultimately determines the stability of a network and service resilience.
3. Diversify, diversify and diversify: cables, providers, subsea and terrestrial routes, international capacity, or using terrestrial fibre.
4. L aying cables further offshore would reduce the possibility of subsea avalanches disrupting multiple cables. However, this is difficult in geographical bottlenecks such as the Red Sea, where an option is to take alternative terrestrial routes.
5. Exchange more traffic locally to reduce reliance on international transit. STF

WIOCC Group CEO CHRIS WOOD is a key figure in Africa’s digitisation and led the industry’s response to connectivity disruptions experienced by businesses and individuals throughout west and southern Africa following cuts to multiple subsea cables near Côte d’Ivoire in early March 2024.
An ever present in the annual global index of the 100 most influential people in the wholesale carrier and ICT communities, Chris has led WIOCC since its formation in 2008. He drove the innovative implementation of converged open access digital infrastructure across Africa, which enabled content providers, cloud operators, fixed-line and mobile telcos, Internet Service Providers (ISPs) and major enterprises to accelerate the digital transformation of this rapidly developing continent.
Chris has grown WIOCC into Africa’s digital backbone, the organisation responsible for the continent’s first, truly hyperscale network infrastructure, and one of the largest providers of connectivity to the ‘Big 5’ capacity users in Africa. He has contributed significantly to Africa’s digitisation imperative, ensuring the ability of WIOCC Group clients to deploy scalable, value-added services through extensive infrastructure investment and improvement.
58 SUBMARINE TELECOMS FORUM MAGAZINE

MAY 2024 | ISSUE 136 59
FEATURE

LISBON: A DIGITAL GATEWAY ENABLING GROWTH AND RESILIENCE
Subsea cable operators are expanding capacity across emerging and developed markets, and Lisbon is uniquely positioned to support both goalsBY KEITH SHAW
[This article was originally published at https://blog.equinix.com/blog/2024/04/25/lisbon-a-digital-gateway-enabling-growth-and-resilience/ ]
Subsea cables have existed for more than 150 years, but demand continues to grow. TeleGeography predicts that $11 billion in new cable systems will go into service between 2023 and 2025.[1] Where this growth is happening is also important. Operators are adding capacity on established routes, but they’re also investing in new cables to emerging markets.
This two-pronged approach will spur digital growth in new places while also making global digital infrastructure more resilient. As extreme weather, geopolitical conflicts and other threats arise, having more cables across more routes will provide redundancy and ensure the continued growth of our digital economy.
In this new reality, Lisbon is becoming one of the most important subsea cable hubs on the planet. This is largely thanks to its strategic location at the confluence of Europe, Africa, the Mediterranean Sea and the Atlantic Ocean. The Portuguese government has worked to take advantage of this by supporting new digital infrastructure projects and speeding up the licensing process. As a result, Portugal has become one of the few countries in the world with direct subsea cable connectivity to every populated continent.[2]
Lisbon offers cable operators one location that can help meet both of their priorities: opening new routes to emerging markets and providing alternative routes between developed markets. We can see this playing out with new cable systems that have landed in Lisbon recently and others scheduled to do so soon.
PROVIDING THE FOUNDATION FOR DIGITAL GROWTH IN AFRICA
International internet bandwidth into Africa grew at a compound annual growth rate (CAGR) of 44% between 2019 and 2023, the fastest growth of any continent by far.[3] This is largely because of the unmatched digital opportunity that exists in Africa today. More than 850 million Africans still lack basic internet connectivity.[4] Two new cable systems that land in Lisbon—Equiano and 2Africa— are designed to help change that.
Equiano and 2Africa are backed by two global tech companies—Google and Meta, respectively. Both companies have business models that depend on bringing in new users to view more content. The markets in Europe and North America have become saturated, but connecting even a small portion of the unconnected population in Africa
60 SUBMARINE TELECOMS FORUM MAGAZINE
would open a massive pool of potential new users.
In addition to providing growth opportunities for global companies, these cables will also help stimulate the growth of digital economies in Africa Increased upstream capacity to the continent will result in more internet users, which will create an incentive for service providers to invest further in Africa’s digital infrastructure.
When complete, 2Africa will circle Africa and be the longest subsea cable system ever built. The leg serving West Africa lands at an Equinix IBX® data center in Lisbon
ENABLING LOW-LATENCY CONNECTIVITY TO LATIN AMERICA


Lisbon also plays a key role in driving digital growth in Latin America. When the EllaLink cable system launched in 2021, it became the first cable to directly link Europe with South America. In the past, traffic moving from Europe to Latin America had to pass through the U.S. first. In addition to introducing potential data sovereignty issues, this led to higher latency due to the indirect route. By bypassing the U.S., EllaLink was able to cut latency in half. This has big implications for industries with many latency-sensitive use cases, including financial services and gaming. The cable is also noteworthy because it connects Portugal and Brazil, two of the world’s largest Portuguese-speaking countries. It’s now easier than ever for organizations to capitalize on the linguistic and cultural connections between the two.
EllaLink lands at Equinix IBX data centers in both Lisbon and São Paulo. These two metros are also connected by Equinix Fabric®, our virtual networking solution. This means that Equinix customers can easily acquire capacity
on EllaLink from our self-service web portal.
INCREASING SUBSEA CABLE RESILIENCY WORLDWIDE
As mentioned earlier, today’s subsea cables face a wide range of threats. That’s why cable operators are bringing redundant capacity to established routes, in addition to pursuing emerging markets like Africa and Latin America. Once again, Lisbon plays a key role in making this happen, both in the Mediterranean and transatlantic corridors. Although Lisbon is more often considered an Atlan-
MAY 2024 | ISSUE 136 61
Source: Meta
FEATURE
tic cable hub, operators clearly include it in their redundancy strategy for the Mediterranean corridor. That’s why the Medusa cable system is scheduled to connect Lisbon with Egypt, with branches landing in various European and North African markets along the way. When it launches in 2025, Medusa will be the first new cable system between Lisbon and the Mediterranean in more than 15 years.

The Medusa company named three drivers for building the cable:[5]
• Increasing connectivity between Europe and North Africa
• Increasing connectivity between Mediterranean islands and the mainland
• Increasing connectivity between the Mediterranean and the Atlantic
The last point above gets to the heart of what makes Lisbon so important. It’s one of the only hubs positioned to serve both the Mediterranean and the Atlantic, so it makes sense that new cable systems are coming in from both directions. In addition to Medusa on the Mediterranean side, Lisbon will also be a landing site for the Nuvem cable system on the Atlantic side.
The Nuvem cable—which, like Equiano, will be built by Google[6]—is scheduled to launch in 2026. It will directly connect Portugal with the U.S., landing in Myrtle Beach, South Carolina. This will provide an alternative to the more traditional—and crowded—North Atlantic route. The high capacity that Nuvem offers will both increase reliability and improve performance between the U.S. and Europe.
SUPPORTING DIGITAL GROWTH IN LISBON
To support our partners and customers looking to capitalize on Lisbon’s strategic location, we’re announcing Equinix LS2, our new Equinix IBX colocation data center in Lisbon. The additional capacity LS2 provides will not only meet the demand for subsea cable landings in Lisbon, but also improve resilience. The new facility will be separate from LS1, our existing data center in Lisbon. The two facilities will offer redundant power and cooling systems, removing the potential for a single point of failure.
While LS2 and LS1 will be separate, they’ll also be closely connected. This means that any bandwidth from
existing cable systems landing at LS1 will be instantly available to customers in LS2. It also means that any new customers deploying in LS2 can immediately take advantage of the dense service provider ecosystem we’ve built in LS1. This ecosystem includes numerous network providers, cloud providers and content and digital media companies that serve Portugal and the rest of southern Europe.
All the new cables named above illustrate how Lisbon helps make our digital world smaller and more connected. With the announcement of LS2, we’re proud to play our part in further cementing Lisbon’s place among the most important cable landing hubs on the planet. The colocation capacity and ecosystem density LS2 provides will help our customers take full advantage of the new cable bandwidth coming to and from Lisbon.
Learn more about Equinix IBX data centers in Lisbon. Or, read our vision paper The future of digital leadership for a closer look at the trends driving distributed, interconnected digital infrastructure growth across the globe.
[1] The State of the Network 2024 Edition, TeleGeography, January 2024.
[2] Portugal: A Hidden Gem of Connectivity, Deloitte, 2022.
[3] The State of the Network 2024 Edition, TeleGeography, January 2024.
[4] Saifaddin Galal, Unconnected population in Africa 2024, by region, Statista, February 26, 2024.
[5] Mediterranean Subsea Infrastructure Operator: Neutral and Independent. Medusa Submarine Cable System.
[6] Brian Quigley, Meet Nuvem, a cable to connect Portugal, Bermuda, and the U.S., Google Cloud blog, September 25, 2023. STF

KEITH SHAW leads the SubSea activity for Equinix in the EMEA region, driving important and strategic customer relationships, as well as new infrastructure projects and partnerships with our key Subsea partners. Currently living in Amsterdam, Keith has worked across the globe with various Subsea, Network and Data Centre companies.
62 SUBMARINE TELECOMS FORUM MAGAZINE
Planned route for the Medusa subsea cable system Source: Medusa

Converged Connectivity Consulting
MAY 2024 | ISSUE 136 63
APTelecom is an award-winning consulting firm founded in 2009. APTelecom’s reach and expertise spans a wide range of emerging global markets. Among the company’s core offerings are due diligence, fiber sales, data center and strategic consulting services. aptelecom.com Connectivity Data Center Services Due Diligence Emerging Markets Satellite Education

INTRODUCING THE SUBMARINE CABLE INDUSTRY DIRECTORY A
New Horizon for Industry Connectivity and Innovation
BY KIERAN CLARKUNVEILING THE DEPTHS: AN IN-DEPTH GUIDE TO THE SUBTEL FORUM INDUSTRY DIRECTORY
In the intricate and ever-evolving realm of submarine telecommunications, where the frontiers of innovation and the necessity for global connectivity intertwine beneath the ocean’s surface, the launch of the Submarine Telecoms Forum Directory marks a transformative milestone. Conceived and designed to meet the nuanced demands of industry professionals, for the express purpose of fostering more efficient connections between Submarine cable projects and the vendors that provide products and services to support those projects, this expansive platform stands as a comprehensive resource for locating companies that offer a plethora of products and services crucial to the submarine telecom cable and network operations sectors.
BRIDGING WORLDS: A PORTAL TO INDUSTRY EXCELLENCE
The SubTel Forum Industry Directory website heralds a new era of accessibility and opportunity, acting as a conduit
to a world where cutting-edge connectivity and groundbreaking innovation converge. Whether your pursuits lie in the domain of consultancy, the procurement of advanced equipment, the deployment of robust infrastructure solutions, or the integration of state-of-the-art manufacturing capabilities, the directory’s user-centric design ensures that an exhaustive array of resources is readily at your disposal. Aimed at bolstering mission-critical objectives, the platform is intricately organized into categories, making it an indispensable tool for professionals seeking to navigate the broad spectrum of industry offerings.
KEY FEATURES OF THE DIRECTORY:
• Seamless Navigation: The directory is engineered for efficiency, featuring a streamlined search functionality alongside well-organized categories. This allows for effortless discovery of companies that align with specific operational needs, spanning consulting, supplier services, software solutions, survey expertise, and more, each category serving as a gateway to specialized industry knowledge.
64 SUBMARINE TELECOMS FORUM MAGAZINE
FEATURE
CONNECT TO THE DIRECTORY
• Curated Content: Step into a world of curated insights with featured videos and comprehensive reports, such as the illustrious 2022 Submarine Telecoms Forum Industry Report. This segment is dedicated to showcasing exclusive projects like Southern Cross NEXT and C/S KIZUNA, providing a snapshot of the industry’s current landscape and emergent trends.
• Expansive Categories: The directory is a testament to the diversity and depth of the submarine telecoms ecosystem, with categories that include Consulting, Equipment, Infrastructure, Manufacturer, Media, Software, Supplier Services, Survey, Vessels, and Wholesale Services. This extensive categorization underscores the directory’s role as a holistic repository of industry-related information.
• S potlight on Excellence: Featured listings shine a light on industry frontrunners, offering detailed insights into companies making significant impacts within their fields. From the comprehensive consultancy services of WFN Strategies, LLC, to Fugro’s unparalleled environmental and survey expertise, and Nexans Norway AS’s innovations in power and optical fiber cables, these entities exemplify the pinnacle of industry excellence.
• Constantly Evolving: The new directory will constantly evolve as we increase the number of companies listed and expand and refine the many categories. Your feedback and help is welcomed in this endeavor.
is an essential online resource for professionals seeking specialized companies in the submarine telecoms industry.

FORGING CONNECTIONS: A COMMUNITY OF INNOVATORS
More than a mere resource, the SubTel Forum Industry Directory embodies a dynamic community of innovators
MAY 2024 | ISSUE 136 65
The SubTel Forum Directory
FEATURE
and pioneers from the telecom, government, and energy sectors. It is a celebration of the collective ingenuity and steadfast commitment of companies that drive the safety, sustainability, and efficiency of global operations. Companies like NTT WE MARINE, with their extensive expertise in cable laying, maintenance, and repair, epitomize the collaborative spirit and technical prowess that are the hallmarks of our industry.
CHARTING THE COURSE: NAVIGATING TOWARDS THE FUTURE
As the submarine telecoms industry continues to chart new territories, the SubTel Forum Industry Directory emerges as an essential navigational tool. It is not merely a facilitator of connections between pivotal industry players but a luminary guiding the way to innovation and progress. Whether embarking on a groundbreaking project, seeking strategic partnerships, or exploring the latest technological advancements, the directory is poised to be your premier point of reference in the voyage towards a more interconnected and sustainable global community.
THE CATALYST BEHIND THE DIRECTORY
In recognizing the dynamic complexity of the submarine cable sector, where the quest for reliable vendors and service providers is both critical and challenging, SubTel Forum initiated the development of the Submarine Cable Industry Directory. This venture was driven by a multiplicity of objectives aimed at enhancing industry connectivity, showcasing technological innovation, streamlining access to information, empowering vendors with broader visibility, and fostering overall industry growth. The directory is envisioned as a cornerstone for industry professionals, enabling them to navigate the extensive landscape of available products and services with unparalleled ease.
ENRICHING THE DIRECTORY EXPERIENCE
The Directory is not just a tool but an immersive experience, offering state-of-the-art SaaS solutions that serve as the nexus for discovering industry-aligned vendors and their innovative products and services. It stands as a central hub, inviting users to explore and engage with a wide array of vendors, each offering products and services meticulously tailored to the unique demands of the submarine cable industry.
PERSONALIZED VENDOR PROFILES AND UNRIVALED HOSTING
Through the Directory, vendors are afforded a unique platform to exhibit their offerings on dedicated web pages, crafted from data gathered by both customers and the
SubTel Forum team. This collaborative approach ensures that each vendor listing is both comprehensive and current, reflecting the latest advancements and offerings in the industry.
ENGAGING SALES AND MARKETING: A SYNERGISTIC APPROACH
The sales group at SubTel Forum, Association Media Group, is set to play a vital role in interacting with vendors, offering a suite of advertising, promotional services, and marketing solutions. This initiative is designed to not only enhance vendor visibility within the Directory but also to foster a dynamic and interactive marketplace that benefits all stakeholders.
A COMMITMENT TO CONTINUOUS SUPPORT AND DATA MANAGEMENT
The responsibility for populating and maintaining the Directory’s vast repository of information lies with the dedicated team at SubTel Forum and with you, our readers. We encourage any relevant vendor to ensure you are listed within the Directory and that the contact details and categorization data is correct and up to date.
This new SubTel Forum Industry Directory provides vendors the ability to claim and manage your listing and we encourage you to claim or contribute your listing today.
A VISION REALIZED: CONCLUSION
The introduction of the Submarine Cable Industry Directory by SubTel Forum heralds a new era of connectivity and innovation within the submarine cable community. This pioneering service, meticulously designed to streamline connections and foster collaboration, is poised to unlock untold opportunities for vendors and industry professionals alike. As we anticipate the growth and advancements this Directory will catalyze, we invite the industry at large to dive deep into this unparalleled resource, exploring the vast opportunities that lie beneath the surface of the submarine telecoms landscape. Join us in navigating towards a brighter, more connected future. STF

KIERAN CLARK is the Lead Analyst for SubTel Forum. He originally joined SubTel Forum in 2013 as a Broadcast Technician to provide support for live event video streaming. He has 6+ years of live production experience and has worked alongside some of the premier organizations in video web streaming. In 2014, Kieran was promoted to Analyst and is currently responsible for the research and maintenance that supports the Submarine Cable Database. In 2016, he was promoted to Lead Analyst and his analysis is featured in almost the entire array of Subtel Forum Publications.
66 SUBMARINE TELECOMS FORUM MAGAZINE
BEYOND BORDERS
Ensuring Resilience in Subsea Cable Infrastructure Amidst Geopolitical Challenges
BY VINEET VERMA
It may not be something you think about when signing onto your favorite streaming services or hopping on a video call with someone who lives abroad, but the world’s connectivity hinges on the functionality of cables that run under the ocean, connecting the world through optical fiber. Recent events in many geographies have forced us to re-examine just how fragile this infrastructure can be, and how our business daily operations can be affected by events happening across the world.
Subsea cables carry over 95% of international data traffic, serving as the backbone of the internet and telecommunications industry. When geopolitical tensions escalate in regions where these cables are laid, such as the Red Sea, Arabian Gulf, or South China Sea, they become susceptible to deliberate attacks, accidental damage, or disruption caused by military activities and civil unrest. These disrup-
tions can lead to widespread outages, slowdowns, or even complete loss of connectivity, impacting businesses, governments, and individuals worldwide. Additionally, geopolitical threats can result in increased costs for cable maintenance, ultimately affecting the affordability — and thus accessibility — of internet services. Instability caused by geopolitical conflicts can deter investment in new cable projects or upgrades, hampering efforts to expand and improve global connectivity.
To see a current example of this, let us look to the Red Sea. The unique geography of the Red Sea poses a significant challenge for subsea cable providers, forcing all underwater cables to pass through a narrow corridor through the Bab al-Mandab Strait between Yemen and Djibouti. This geographic constraint not only makes repairs and maintenance challenging but also potentially exposes half the
MAY 2024 | ISSUE 136 67
FEATURE
FEATURE

world’s internet access to substantial risks.
The image below shows the bottleneck created for subsea cables that pass through the Red Sea.
The history of subsea cables in the Red Sea region has been instrumental in shaping global connectivity, serving as a crucial link between Europe and East Asia. Understanding the political nuances of the region is paramount for effectively managing the risks associated with subsea cables. On 24th February, three Cable systems (EIG, AAE1 and SEACOM/TGN) suffered subsea cuts in the Red Sea and disrupted internet traffic between Europe, Asia and parts of East Africa. The specific cause remains unclear, though it is speculated the fault was caused by dragging of the anchor of a sinking cargo ship. Three vital undersea cables that facilitate global internet and telecommunications were severed. These disruptions were estimated to impact 25% of the traffic traversing the Red Sea, which highlights the significance of the route for data transmission between Asia and Europe. In these situations, rerouting measures must be initiated to mitigate the impact on communication networks, but maintenance can be slow and plagued with ongoing threats. It’s been around two months since the cuts and the repair timelines are still unclear due to the complexities involved with the permitting process required from various government entities and the safety risks associated with operating in the area.
The incident highlighted the vulnerability of undersea cables to geopolitical conflicts and the challenges in repairing
and maintaining them, given the complex geopolitical situation in the region.However, it is not an insurmountable crisis for global connectivity — merely one that requires collaboration with the right partners. Strategic measures must be taken to safeguard global digital infrastructure. Subsea operators such as GCX are beginning to look at developing alternative solutions that circumnavigate this narrow corridor plagued by geopolitical tensions. As shown in the picture below, these routes span across peninsulas, pass through countries like Saudi Arabia and Iraq, and extend all the way to Europe, effectively bypassing the problematic areas. By diversifying network infrastructure and creating pathways that steer clear of conflict-prone regions, operators can enhance the reliability and security of the global connectivity they provide. Developing alternative routes also offers the opportunity to adopt hybrid terrestrial and subsea routing, which can also mitigate risks associated with conflict zones. Bypassing the bottleneck in the Red Sea will allow for more reliable operations, alleviating congestion and ensuring the uninterrupted flow of digital communications. Building trust in hybrid terrestrial and subsea routes becomes essential, particularly in areas prone to ongoing geopolitical conflicts. Hybrid routes combine terrestrial and subsea segments. Terrestrial segments encompass land-based infrastructure, such as fiber-optic cables laid underground or on utility poles, connecting cities and regions within countries or across borders. Meanwhile, the subsea segments facilitate international connectivity between continents with fiber-optic cables laid
68 SUBMARINE TELECOMS FORUM MAGAZINE

on the ocean floor. By combining these segments, hybrid routes leverage the reliability and high bandwidth capacity of terrestrial cables with the long-distance transmission capabilities of subsea cables. This integration enhances redundancy, diversity, and resilience in communication networks, ensuring continuous connectivity even in the most challenging of circumstances. This, in turn, offers diversification and redundancy, reducing sole reliance on one or the other. By utilizing both terrestrial and subsea infrastructure, companies can reduce the impact of disruptions and ensure continuous connectivity even in the face of geopolitical instability. Establishing trust in these hybrid routes involves not only investing in their development but also fostering partnerships with local authorities, communities, and stakeholders to navigate complex political landscapes and ensure the security and resilience of the network. This proactive approach not only enhances the reliability of global digital infrastructure but also fosters stability and trust in regions where tensions may be high. By proactively designing routes that avoid existing or potential conflict zones, companies can enhance the security and reliability of their digital infrastructure. Many providers are already doing this in the
region, and industry leaders would do well to take advantage of “feet on the ground” knowledge in these volatile areas.
The Red Sea conflict serves as a stark reminder of the vulnerabilities inherent in global digital infrastructure, emphasizing the urgency for proactive measures to ensure reliability and security in an ever-connected world. Through this incident, we can see the importance of imbuing global networks with hybrid routing capabilities for the purpose of safeguarding operations. Those in the telecommunications industry must stay attuned to underlying geopolitical matters, but actively working with experienced providers who understand the intricacies of navigating rough digital waters will ultimately lead to the most secure, redundant and assured way to protect connectivity. STF

VINEET VERMA is currently Head of Global Business Development and Head for Middle East and Africa at Global Cloud Xchange. He is currently responsible for global expansion strategy and investment initiatives for GCX. He also leads the Middle East, Africa and Indian subcontinent business. Vineet has more than 25 years of experience in the International Telecom industry and has led various functions over the last 20 years including procurement, product management, managed services operations and sales.
MAY 2024 | ISSUE 136 69
STAY UPDATED WITH THE SUBTEL FORUM APP
BY KIERAN CLARK
INTRODUCTION
In the rapidly evolving landscape of submarine telecommunications, staying connected and informed is more critical than ever. The new SubTel Forum app is a pivotal resource for professionals, offering immediate and comprehensive insights into the industry’s pulse.
The SubTel Forum app is designed to serve as the digital confluence for news, analysis, and data, standing as a testament to SubTel Forum’s commitment to delivering cutting-edge information directly to your fingertips. It’s not just an app; it’s a gateway to a world where information is power, and timely access to that information is crucial. In an industry where a single development can have far-reaching implications, the app provides a platform for professionals to stay ahead of the curve. It offers a curated experience, sifting through the deluge of industry news and updates to bring the most relevant and impactful stories to its users.
The app’s design philosophy is built on user-centricity, ensuring that the interface and features are aligned with the needs and preferences of industry professionals. It’s a result of careful planning, extensive research, and a deep understanding of the challenges and information requirements of the submarine telecommunications sector. The app bridges the gap between the fast-paced developments in the industry
and the professionals who need to stay informed. By providing a streamlined, intuitive, and comprehensive resource, the SubTel Forum app is not just keeping professionals updated; it’s helping shape the future of global connectivity.
The SubTel Forum app marks a significant milestone in digital resource provision for the submarine telecommunications industry. It embodies a commitment to empowering professionals with a user-centric platform, thoughtfully designed to navigate the complexities of global connectivity. This commitment is mirrored in the app’s features, each crafted to address the specific needs of its users.
CORE FEATURES OF THE SUBTEL FORUM APP
The SubTel Forum app is engineered to keep its users at the forefront of the submarine telecommunications sector. It achieves this through a suite of tailored features: Live Newsfeed: The app’s live newsfeed is not just a stream of updates; it’s a dynamic portal to the heartbeat of the submarine telecommunications world. Here, users can access real-time information about technological breakthroughs, project milestones, and industry trends. The feature is designed to offer a comprehensive view, ensuring that every piece of news is a blend of immediacy and depth.
Access to Publications: The app’s integration of key publica-
70 SUBMARINE TELECOMS FORUM MAGAZINE
tions like the SubTel Forum Magazine, the Submarine Cable Almanac, and the Submarine Telecoms Industry Report is an innovative step. It transforms the app into a digital library, where the latest research, analysis, and thought leadership in the industry are just a tap away. This not only saves time but also enriches the professional knowledge base of the users.
Sharing Made Simple: The sharing feature goes beyond just a tool; it’s a bridge connecting users with their networks and communities. Whether it’s a groundbreaking story or a thought-provoking article, the app ensures that sharing this information is seamless and instantaneous. This feature enhances the collaborative spirit of the industry, fostering a culture of knowledge-sharing and community building.

Instant Notifications: The push notification sys tem of the app is tailored to keep users in the loop without overwhelming them. It’s a fine-tuned balance between alerting users to the latest devel opments and respecting their time and attention. This feature is particularly beneficial for profes sionals who need to stay informed but are often caught up in their demanding schedules.
USER EXPERIENCE AND INTERFACE
The design philosophy of the SubTel Forum app is rooted in simplicity and clarity. This is evident in its sleek and modern interface, which prioritizes ease of navigation. We have crafted an environment that is both visually appealing and functionally intuitive. The app’s layout, with its uncluttered design and logical organization, reflects a thoughtful approach to presenting a wealth of information in an accessible manner.

Understanding that its user base comprises individuals with varying degrees of comfort with technology, the SubTel Forum app is designed to be inclusive. Whether a user is a seasoned tech professional or someone less familiar with digital apps, the interface is approachable and easy to comprehend. The developers have ensured that the learning curve is minimal, making the app an accessible tool for all professionals in the submarine telecommunications industry, regardless of their tech proficiency.

The SubTel Forum app shines in its user-friendly interface, ensuring that navigation is a seamless experience. From the home screen to the detailed sections, every element is placed with the user’s journey in mind. The app employs familiar navigational cues and interactive elements, making it easy for users to find what they’re looking for without confusion or frustration. This intuitive interface design is crucial for an app that serves a wide range of content and functionality.
MAY 2024 UPDATE – INTEGRATING THE SUBTEL DIREC-
As part of our ongoing efforts to enhance the value of the SubTel Forum app, we are pleased to announce the integration of the SubTel Directory, initially available on our website, directly into the app. This inclusion bridges the gap between online resources and mobile accessibility, offering a seamless experience for navigating the comprehensive database of submarine cable industry companies. For detailed insights and full features of the directory, be sure to check out the dedicated article in this issue of our magazine. This update not only provides direct access to a rich resource of industry contacts but also strengthens the app’s position as a crucial tool for professionals in the submarine telecommunications sector. Stay connected and informed with just a few taps, wherever you are.
CONCLUSION
The SubTel Forum app, as it stands today, is a robust tool that has already begun to redefine how professionals in the submarine telecommunications industry access and interact with critical information. It represents a fusion of technological innovation and user-focused design, setting a new stan-
MAY 2024 | ISSUE 136 71
FEATURE
dard in digital resources for the industry. The app’s current features, including the live newsfeed, access to key publications, intuitive sharing, and instant notifications, collectively create a comprehensive and engaging user experience.
Looking ahead, the future of the SubTel Forum app is bright and promising. The anticipated updates for 2024, in-

cluding enhanced search capabilities, personalization options, offline access, and additional navigation inputs, demonstrate an ongoing commitment to improvement and user satisfaction. This evolution is not just a testament to technological advancement but also an invitation to users to be a part of this journey. We encourage our user community to engage with the app, provide valuable feedback, and contribute to shaping its future, ensuring it continues to be an essential tool for professionals worldwide.
EMBRACE THE DIGITAL WAVE WITH THE SUBTEL FORUM APP
The SubTel Forum app is readily accessible on both Android and iOS platforms, serving as a comprehensive hub for submarine telecommunications information. It stands as a testament to our commitment to providing up-to-date industry insights, news updates, and networking opportunities right at your fingertips.
By downloading the SubTel Forum app, you gain immediate access to a wealth of information tailored to the submarine telecommunications community. It’s designed not just to keep you informed but to offer a platform where the future of digital connectivity in our industry can be discussed and shaped.
We invite you to join a global community of professionals and enthusiasts who rely on the SubTel Forum app to stay informed and connected. Download it today to ensure you’re always ahead in the dynamic and ever-changing world of submarine telecommunications.
We highly value your insights and feedback as we aim to continuously improve the app. Should you have any specific questions or suggestions, please don’t hesitate to email kclark@subtelforum.com. Together, we can make the SubTel Forum app an even more powerful tool for the global submarine telecommunications community. STF

KIERAN CLARK is the Lead Analyst for SubTel Forum. He originally joined SubTel Forum in 2013 as a Broadcast Technician to provide support for live event video streaming. He has 6+ years of live production experience and has worked alongside some of the premier organizations in video web streaming. In 2014, Kieran was promoted to Analyst and is currently responsible for the research and maintenance that supports the Submarine Cable Database. In 2016, he was promoted to Lead Analyst and his analysis is featured in almost the entire array of Subtel Forum Publications.


72 SUBMARINE TELECOMS FORUM MAGAZINE

INTRODUCTION:
Submarine cable systems are the unseen lifeline of global communication, carrying over 99% of all international data traffic. Their existence enables seamless international business, entertainment, and information exchange in our hyper-connected world. However, as technological progress accelerates and data demand soars, accurate forecasting of capacity needs during feasibility studies becomes crucial. Miscalculating future data needs can result in under-dimensioned systems that underperform or over-dimensioned systems that never reach their full utilization, leading to inefficiency and financial waste.
In this article, we’ll delve into the crucial role that capacity forecasting plays in feasibility studies for submarine cables. We will outline the methodologies used, discuss the challenges faced, and illustrate practical examples from two major projects: the Humboldt Cable System and the proposed Basilan, Sulu, and Tawi-Tawi cable project.
THE ROLE OF FEASIBILITY STUDIES:
Feasibility studies are the foundation upon which submarine cable projects are built. They encompass comprehensive assessments that consider technical, environmental, economic, and institutional factors, shaping decisions on
FEATURE FORECASTING CAPACITY NEEDS IN FEASIBILITY STUDIES FOR SUBMARINE CABLE PROJECTS
BY DANIEL LEZA AND KRISTIAN NIELSENdesign, routing, network specifications, and the overall viability of a project. Capacity forecasting is the linchpin in these studies, providing essential data to determine project requirements and potential profitability. Here are some critical aspects of feasibility studies:
In feasibility studies for submarine cable projects, several analyses are conducted. Technical Assessments evaluate the feasibility of the proposed cable route, considering factors such as depth, seabed topography, and natural hazards to ensure reliable performance. Environmental Impact Studies ensure compliance with regulations, identify risks to marine ecosystems, and suggest mitigation strategies. Economic Evaluations assess the financial viability by estimating costs and revenues, where accurate capacity forecasting is crucial for projecting potential revenue. Institutional and Regulatory Analysis involves identifying the institutional structure best suited for the project, and coordination with government agencies, private-sector stakeholders, and civil society organizations to ensure smooth implementation and compliance with regulations. These components influence decisions from design to deployment.
IMPORTANCE OF CAPACITY FORECASTING:
In the planning of submarine cable infrastructure, accu-
MAY 2024 | ISSUE 136 73
FEATURE
rate forecasting is key to determining the necessary scale to accommodate future data demands and minimize risks such as obsolescence or underutilization. Cost efficiency is achieved through capacity forecasting, which helps balance the initial investment with future revenue potential, thereby reducing the risk of spending too much or too little on cable capacity. Additionally, sizing systems according to market demand ensures that they remain attractive to customers and profitable by meeting market needs effectively.
FORECASTING METHODOLOGIES:
Various methodologies can be used to forecast future data traffic accurately. These approaches analyze historical data, understand market trends, and consult expert opinions to produce comprehensive traffic predictions. Some key methodologies include:
1. Historical Analysis: By examining past data usage trends over several years, analysts can identify long-term patterns and extrapolate future demand based on technological changes and shifting demographics.
2. Extrapolative Modeling: Mathematical models identify trends and project them into the future. These models incorporate variables like population growth, technological advancements, and economic development to estimate future data traffic.
3. Delphi Method: The Delphi method involves consulting industry experts to assess potential disruptions, market trends, and emerging technologies that could impact data consumption.
4. Scenario Planning: This involves creating plausible future scenarios based on varying assumptions, such as regulatory changes, economic growth rates, and technological advancements. Scenario planning allows for flexibility in infrastructure planning to accommodate different possible futures.
Demand analysis for submarine cable projects is a pivotal element in the early stages of feasibility and pre-feasibility studies. It’s focused on identifying “addressable markets”—potential customers or regions that could be served by the infrastructure. This analysis is not only central to evaluating the business opportunity but also crucial for network planning and sizing.
In practice, demand analysis is an iterative process that recurs throughout various business planning cycles of a submarine cable project. This exercise integrates multiple inputs, sources, and sensitivity analyses to project the traffic that the system could feasibly support. Typically, three primary sources of demand are forecasted: top-down demand, bottom-up demand, and demand from service providers or investors.
TOP-DOWN DEMAND ANALYSIS
The top-down approach evaluates existing demand on the intended route and its potential growth, considering historical data, technological advancements, market trends, and other relevant factors. This analysis helps validate forecasts made through the bottom-up approach.
BOTTOM-UP DEMAND ANALYSIS
Bottom-up analysis involves detailed scrutiny of demand across different market segments throughout the economic life of the asset. It aims to provide insights into potential target countries, transit demands, and redundancy needs to accurately forecast future requirements for the submarine cable system.
To execute this, modelers identify key drivers of demand volume—such as demographic shifts and technology adoption rates—in each market segment. These drivers are then tested to see if extrapolating current trends provides a consistent and reasonable forecast.
SERVICE PROVIDER/INVESTOR DEMAND
Parallel to these analyses, market sounding exercises and other data collections performed during the feasibility study help ascertain potential demand from
74 SUBMARINE TELECOMS FORUM MAGAZINE
customers and service providers/investors. Engaging with service providers in target countries, global digital platforms, and multinational telecommunications providers is a critical component of these assessments. These interactions are vital for understanding the broader market needs and the specific requirements of potential large-scale users.
SUPPLY-SIDE ASSESSMENT
Equally important is the supply-side assessment of the international connectivity market along the proposed route. This step involves evaluating existing and planned submarine and terrestrial fiber networks. The competitive dynamics expected from these existing and future infrastructures are considered to estimate how they might affect the new cable system’s market presence.
Analysts need to identify the unique value proposition of the new submarine cable and the key factors that will help it capture market share moving forward. This might include technological superiority, better resilience, strategic partnerships, or pricing strategies.
SYNTHESIS OF DEMAND ANALYSIS
CHALLENGES IN CAPACITY FORECASTING:
Despite the existence of advanced methodologies, capacity forecasting is rife with challenges: Technology evolves rapidly, often outpacing existing forecasting models. Emerging technologies like quantum computing or satellite internet can significantly impact future data consumption patterns. Economic fluctuations, including political instability, global economic crises, and pandemics, can affect data consumption and investment strategies, complicating accurate forecasting. Regulatory changes, such as data regulations and international treaties, directly influence cross-border data flows and, subsequently, data consumption, which can complicate forecasts. Additionally, market competition from emerging technologies like satellite-based internet and terrestrial networks can reduce dependence on subsea cables and affect demand, with competing projects also impacting market share.
Analysts need to identify the unique value proposition of the new submarine cable and the key factors that will help it capture market share moving forward. This might include technological superiority, better resilience, strategic partnerships, or pricing strategies.
Combining the insights from these varied approaches allows modelers to develop a comprehensive view of potential demand and the market share the new submarine cable might realistically capture. This synthesis involves balancing the optimistic projections of bottom-up analyses with the broader market realities highlighted by top-down assessments and supply-side evaluations.
Overall, demand analysis for submarine cable projects is a complex, multi-faceted process that requires a deep understanding of both market and technical aspects. By carefully considering each element—from individual customer needs to global market trends and competitive dynamics—project planners can build a robust business case for their proposed submarine cable system. This thorough understanding is essential for making informed decisions on whether to proceed with the project, how to structure it, and how to position it in a competitive market landscape.
CASE STUDY: HUMBOLDT CABLE SYSTEM
The Humboldt Cable System is a visionary project aiming to connect Chile with Asia via Oceania. Initially designed to cater to niche markets, feasibility studies revealed the need for a scalable design that could accommodate the rapid growth of data traffic, particularly between Latin America and Asia. Key findings included:
1. Rising Demand: Latin America’s rapid digital adoption, combined with growing trade with Asia, was expected to drive exponential growth in data consumption. This justified the investment in a high-capacity cable system.
2. Market Shifts: Geopolitical shifts, strategic alliances, and new trade agreements were expected to increase cross-continental data exchanges, reinforcing the need for robust connectivity.
3. Innovative Design: A modular system was proposed to enable phased capacity expansion without requiring significant additional capital investment. This modularity ensured scalability while minimizing financial risks.
MAY 2024 | ISSUE 136 75
FEATURE
CASE STUDY: BASILAN, SULU, AND TAWI-TAWI SUBMARINE CABLE PROJECT
In the Philippines, the government is planning a submarine cable project to improve digital connectivity across the Bangsamoro Autonomous Region, including Basilan, Sulu, and Tawi-Tawi. This project aims to reduce the digital divide by providing high-quality internet connectivity. Its feasibility study explores several key factors:
1. Objectives: The primary goals are to assess feasibility, identify risks, and provide recommendations to improve digital connectivity in these regions.
2. Market Analysis: The study estimates the demand for internet services, helping developers tailor infrastructure design to regional needs.
3. Technical Analysis: The analysis involves identifying suitable cable routes and landing stations, as well as determining network bandwidth capacity and power requirements.
4. Financial Analysis: This estimates capital and operating costs alongside potential revenue streams, guiding investment decisions and profitability assessments.
5. Environmental Analysis: The study identifies potential impacts on sensitive ecosystems and recommends measures to mitigate environmental risks.
6. Legal Analysis: Compliance with relevant international treaties, national laws, and local regulations is critical to ensure seamless implementation.
7. Institutional Analysis: Coordination with government agencies, private sector stakeholders, and civil society organizations ensures that the project receives support and meets regional needs.
EXPECTED OUTCOMES:
From the above studies, the following outcomes are expected:
1. Assessment of Feasibility: Comprehensive technical, financial, environmental, and institutional assessments will determine project feasibility.
2. Risk Identification: Potential risks will be identified and mitigated to ensure smooth implementation.
3. Decision Support: Clear recommendations will guide developers in making informed decisions regarding system architecture, network scale, and market positioning. Realizing the Benefits of Accurate Forecasting:
5. The Humboldt Cable System and the Basilan, Sulu, and Tawi-Tawi projects demonstrate how accurate forecasting can maximize project success:
6. Phased Expansion: Phased expansion allows cable sys-
tems to increase capacity as demand grows, preventing excessive initial investment.
7. Future-Proofing: Modular designs ensure that systems can adapt to future technological changes and market shifts without significant overhaul.
8. Market Positioning: Cable systems developed through accurate forecasts remain well-positioned to capture emerging market demands and maintain long-term competitiveness.
CONCLUSION:
In the realm of submarine cable projects, accurate capacity forecasting during feasibility studies is crucial for long-term project success. Advanced forecasting models, continually updated in response to changing conditions, ensure that cable systems remain relevant and profitable in the ever-evolving digital landscape.
CALL TO ACTION:
Industry stakeholders must adopt advanced forecasting techniques and stay informed about technological and market trends. In doing so, they can ensure that future submarine cable projects are optimized for the data transmission needs of tomorrow, maintaining their critical role in global connectivity.Top of FormBottom of Form STF

DANIEL LEZA, an attorney, is a policy and regulatory specialist with expertise in the areas of competition law, regulation, and public policy in the information and communications technologies sector. He has substantial experience on regulatory reform initiatives, digital services, market analysis, infrastructure deployment and investment, spectrum assignment processes and licensing, anticompetitive conduct and mergers and acquisitions in the communications and digital technologies sector, and advises private and public sector clients on such matters in Latin America and the Caribbean, Asia-Pacific, the Middle East and Africa. Prior to working at TMG, he was with the Legal Counsel’s Office of the Comisión Nacional de Telecomunicaciones of Venezuela. Mr. Leza obtained his Master of Laws at University of Chicago and his law degree at Catholic University in Venezuela. Mr. Leza is fluent in Spanish and English.

KRISTIAN NIELSEN is based in the main office in Sterling, Virginia USA. He has more than 15 years’ experience and knowledge in submarine cable systems, including Arctic and offshore Oil & Gas submarine fiber systems. As Chief Revenue Officer, he is responsible for overseeing strategic planning, sales leadership, and marketing alignment to optimize revenue streams. He supports the Projects and Technical Directors, and reviews subcontracts and monitors the prime contractor, supplier, and is astute with Change Order process and management. He is responsible for contract administration, as well as supports financial monitoring. He possesses Client Representative experience in submarine cable load-out, installation and landing stations, extensive project logistics and engineering support, extensive background in administrative and commercial support and is an expert in due diligence.
76 SUBMARINE TELECOMS FORUM MAGAZINE
BACK REFLECTION
SOLAR POWERED CABLES
BY PHILIP PILGRIMThey say you age slowly, then suddenly. Well, I am suddenly able to provide personal recollections for this issue’s Back Reflections... oh dear. The topic is one that I have been considering for some time, but it is a tad on the technical side, so I will endeavor to cover the technical points at a more palatable high level. The recent burst of Aurora activity across the world has spurred me on. With this said, let’s jump in:
OVERVIEW OF SUBMARINE CABLE POWERING
I am not an avid reader, (as I write this, I can hear my proof-reader, and English major, Janet, chuckling). One of the few lines I have read in the past that has stuck with me is “electrons are lazy and homesick, when you try to send them along a wire, the will jump off at the first opportunity and promptly return back to where they came from”. This is the essence of how submarine cables work, and also how they fail. The goal of early telegraph cables was to send electrons from one end of the cable to the other and prevent them from “leaking” into the ocean. The flow of these electrons was called “current” and the substance flowing was referred to as “the electric fluid”. Yes, man’s early understanding of electricity was from submarine cables and it was likened to fluid dynamics. These quaint

1859 Telegraph System “Circuit” with Earth Return
terms have stuck.
Unlike telegraph cables, which had a copper core conductor to transfer the signal, contemporary submarine cables (repeatered cables), have devices placed along their length. These devices
amplify, shape, and switch the signal. The term for the devices that amplify the signals are “repeaters”. These devices also require electrical power to function, so even “optical cables” must be powered. Powering a repeatered
MAY 2024 | ISSUE 136 77
BACK REFLECTION
transoceanic submarine cable requires thousands of volts. Most people do not realize that a submarine cable has much in common with overhead high voltage power lines!
“Death on Contact” and the ability to carelessly injure a worker thousands of kilometers away. Fortunately, best practices for safety and keyed interlocks protect all involved.
The electrical core of the submarine cable has evolved from a single copper wire (<1856), to twisted coper wires (1856 to ~1940), to copper tubing (~1940 to present), and lately to aluminum tubing (to reduce commodity costs).

The early transoceanic submarine telegraph cables suffered the effects of capacitance and it was found that applying a low cable current, was the most efficient method for sending signals. Later telephone and optical cables required much more current (up to three amps), to power the devices.
SUBMARINE CABLE POWERING CIRCUIT
In electronics, the term “circuit” was coined to describe the path of electricity. It was modeled as a loop from a power source. Latin circuitus “a going around” or “a journey”. In the early days of electricity, the concept went like this: energetic electrons

(fluid), flowed from a battery to set out on a journey around the loop and find their way back to the battery, where they were re-energized and this journey repeated.
A submarine cable forms a “circuit”, but it only has a single conductor; so how can it be a closed loop? We all must thank Carl August Steinheil, who in 1836, applied a ground-return path to telecom systems. He effectively used the planet “Earth” as the return path though the “ground”. Again, two electrical terms (Ground and Earth) that come from applied physics during the early days of the telegraph. Steinheil’s discovery continues to save 50% of the conductor costs of every submarine cable today, as they do not need a second copper return path to close the circuit into a loop. Simply placing a conducting electrode at each end of the cable is all that is needed to con-
78 SUBMARINE TELECOMS FORUM MAGAZINE
Carl August Steinheil’s Earth Return
Carl August Steinheil
nect these distant ends.... but as they say: “here is the rub”. It was assumed the only energy being put into a submarine cable conductor was carefully controlled by man’s application of batteries (power supplies) at each end, this was soon found to be incorrect.
An 1860 paper Terra Voltaism ,by Septimus Beardmore, shows that the recently failed 1858 Atlantic cable was still being experimented upon in 1859. With no power applied to the Valentia end, “deflections” up to 80 degrees of Thompsons Mirror Galvanometer current meter were observed at the landing station. “Earth currents” were known to telegraphers previous to this but in 1859, there was no unit known as the “volt” to use (the Volt was established in 1873).
An 1859 paper by George B. Prescott documents many telegraphic anomalies during the Carrington Event (more details below), and it also points to similar events occurring as early as 1847, just three years after the adoption of commercial telegraph.
HERE COMES THE SUN... SHOCKING!
An article in the August 29th, 1894 publication The Electrical Engineer mentions that the correlation of sunspots and earth currents on telegraph pole lines and cables existed. It states the most affected systems were running East-West systems, but the recent event (July 20, 1894) showed a N.N.W. terrestrial system having 150V induced.
In early September, 1859, a massive solar event occurred that


induced so much energy into the telegraph pole lines that sparking of telegraph relays and telegraph keys occurred, shocking the operators. Quick thinking operators disconnected their boiling batteries and were able to operate the telegraph lines without batteries. It is interesting that the operators found the systems to give the best performance ever. They also observed the power to gently fluctuate as if slow moving waves were driving the system over hours. This massive solar storm was known as the “Carrington Event” (amateur astronomer Richard Christopher Carrington first recorded the solar flare that caused the storm) and the world enjoyed massive Aurora Borealis/ Australis shows in the night sky.
MAY 2024 | ISSUE 136 79
George Prescott’s Observations of Aurora and Telegraph Anomalies 1847
Septimus Beardmore’s Paper on Earth Currents, 1860
BACK REFLECTION


HOW DOES IT HAPPEN?
Our sun’s surface randomly experiences violent energy events. These are usually accompanied with the observation of solar flares. These events are called Coronal Mass Ejections (C.M.E.) and can send energy and matter off into space along the axis of the flare. Occasionally, these ejections occur in the direction of the Earth. The matter (plasma) and energy travel towards our planet. Fortunately, we are protected by our planet’s magnetic field. Resultant “Magnetic storms” occur high above us in the Magnetosphere where the charged plasma from the sun interacts with the Earth’s magnetic field. In turn the changing magnetic fields above the Earth can induce localized voltages on the earth’s surface below. For example, the 0V ground potential in the UK may
plummet 600V due a localized magnetic storm above.
HOW DOES A MAGNETIC STORM AFFECT SUBMARINE CABLES?
If a magnetic storm, on one side of
a transoceanic cable, lowered the local ground potential by 1,000V, and if this cable had a resistance of 1,000 ohms, then 1 amp of current would flow through the cable with no batteries or power supply operating. The imbalance

80 SUBMARINE TELECOMS FORUM MAGAZINE
Solar Storm of 1859 (Carrington Event)
C.M.E. and Earth’s Magnetic Shield

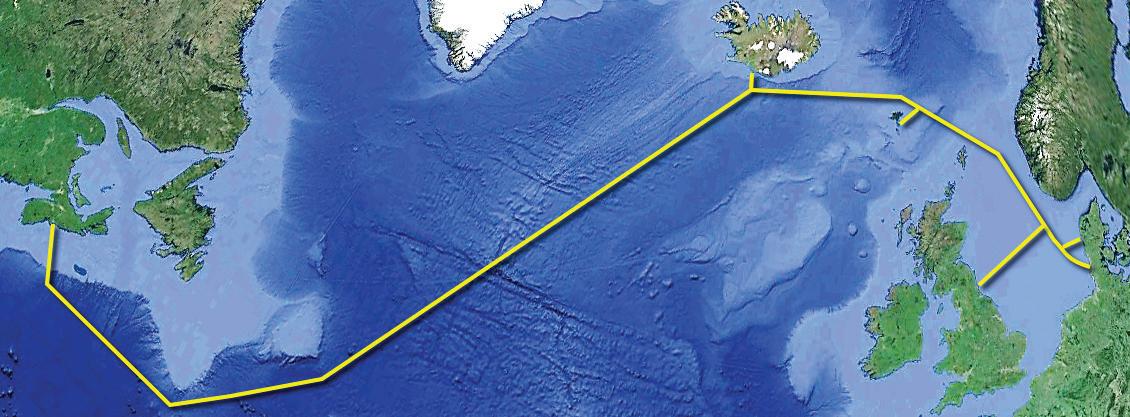
of Earth potential (0V) across the surface of the earth causes earth currents to flow.
CANTAT-3 SHUTDOWN MAY 4, 1998
My early years in telecommunications were at the Teleglobe Canada Beaver Harbour Cable Landing station for CANTAT-2 and the Pennant Point Earth and Cable Station for TAT-9, CANTAT-3, and CANUS. Note that CANTAT-3 was the most northern transoceanic cable up to that point in history.
At Beaver Harbour, I became aware of geomagnetic interactions with submarine cables as the experienced technicians who trained me covered this subject. In one example, it was mentioned during the fault finding tests of ICECAN, the earth currents were causing the electrical test instrument to swing wildly. It was so severe they had to remove the screen from the Sullivan balancing bridge and cast its light onto the far wall of the cable station to better see the extreme ends
of its swing and to determine the null center which would match the cable resistance to the fault.
Teleglobe Canada had been operating transatlantic cables since CANTAT-1 in 1961. Some of my colleagues had also worked on TAT-1 as
both landed here in the eastern end of Canada. The skill set of cable operators at that time included an understanding of “Space Weather” observations. Our station in Beaver Harbour subscribed to a monthly publication from the Space Environment Center in Colo-

MAY 2024 | ISSUE 136 81
CANTAT-3
Pennant Point Earth & Cable Station, Nova Scotia Canada (~1992)
BACK REFLECTION


rado, (operator of the USA’s National Solar Observatory), and all knew of the 11 year solar cycle.
On May 4th, 1998, I had just started
the night shift at Pennant Point and was conducting initial rounds to check the condition of all systems when the station alarm sounded. The CAN-
TAT-3 Power Feed Equipment (PFE) had unexpectedly shut down. I did the obvious and manually tried to restart it before attending to the countless calls from our other sites and from distant stations checking on what happened to their traffic. In the mid 90’s, losing the three streams of 2.5Gb/s was a massive outage! Fortunately, the cable powered up and all was good. No cuts, or shunt faults, and no need to call in support. Very unusual, but very lucky I thought. I will joke and say that all of us in the cable station were very experienced at operating the CANTAT-3 PFE as the cable had suffered many faults in its early years and was powered up and down like a yo-yo.
By around 3 AM, after attending to all of the reports and calls following a major outage, it was time to start investigating what caused our PFE to shut down. The paper chart recorder capturing the cable current and voltage over time held the answer (this was before the days of computer data logging). The voltage had risen slowly over an hour until the high current alarm tripped. The change in voltage was ~ 650V. This was very unusual as the PFE’s for our 3 cables were always stable and varied no more than a few tens of volts.
CANTAT 3 was constructed at a time when the power feed equipment in a cable station was not powerful enough to energize the full transatlantic cable (called single-end feeding). The power feeds at each end of the cable had to share the load (called dual-end feeding). One PFE was placed in constant voltage mode (Slave), and the other was placed in constant
82 SUBMARINE TELECOMS FORUM MAGAZINE
Kiruna Magnetometer, May 4, 1998
Kiruna Magnetometer, May 11, 2024
current mode (Master). The slave PFE would apply a constant pre-set voltage to the centre conductor relative to the local ground electrode near that site. The master PFE would vary its voltage to maintain a pre-set constant current in the cable. This arrangement prevented the two PFEs from “fighting” with each other (i.e. if one raises the voltage, the other lowers the voltage ad nauseum). The nominal total cable voltage across CANTAT-3 was ~ 10,000 volts. The far-end PFE in Sylt, Germany was set in constant voltage mode to hold ~ +4,000V and our PFE in Canada maintained a 1.6A cable current with an applied voltage of ~ -6,000V (variable). Our PFE had an emergency shut down current protection of 10% (1.76A). There were also high voltage (HV) alarms and shutdowns.
In reviewing the chart recorder, the rise in voltage was an attempt for our PFE to maintain the 1.6A but it was unable to do so, and the shutdown occurred. The mechanism causing this was the extra earth currents of the geomagnetic storm taking a free ride through our cable. These “lazy” electrons found our copper cable to be the easier path to take. When the earth potential at the Sylt end decreased in voltage relative to Canada (the 0V earth potential in Sylt, locally dropped >700V volts relative to the 0V earth in Canada), the power feed in Canada did its best to compensate, but it hit a shutdown limit at an extra ~ 650V). The voltage across the system at that time, relative to Canada, changed from +4,000V and -6,000V across the cable (10,000 V), to more like (+3,300V and -6,700V) (10,000V).

In checking the alarm log on the PFE, a HV alarm was acknowledged by the technician that I replaced at midnight, but I was not updated when we passed control of the CLS over.
Being the early days of the Internet, I decided to see if I could find any indications of the geomagnetic storm that was occurring. I was very fortunate and found that some scientific institutes had online magnetometer data. The nearest to Sylt Germany was in Kiruna, Sweden. Their plot of the magnetic field showed the drop at the exact time the PFE tripped off in Canada. The plot shows the magnetic field in 3 directions, but it was the Y axis drop that correlated to the PFE outage at -1,600 nT. This finding now gave us real-time visibility of “Space Weather” that affected our cable.
Here is the Kiruna plot for the recent 2024 May 10-13 solar event. The lowest value in the Y axis is ~ 0 nT so
CANTAT-3 should have been fine.
In 2003, while operating the 360atlantic cable system, a large geomagnetic solar storm occurred on October 29th. We were watching the PFE’s and the only notable change was 60V again at the lowest Y value of ~ -1,500 nT.
I hope this information of the past is useful for cable operations now and in the future. STF

PHILIP PILGRIM is the Subsea Business Development Leader for Nokia's North American Region. 2021 marks his is 30th year working in the subse a sector. His hobbies include "Subsea Archaeology" and locating the long lost subsea cable and telegraph routes (and infrastructure). Philip is based in Nova Scotia, Canada.
References: Kiruna Magnetometer: https://www2.irf.se/ Observatory/?link=Magnetometers
Kiruna Magnetometer (Historical to 1990): https://www2.irf.se/maggraphs/dmi.php
MAY 2024 | ISSUE 136 83
Kiruna Magnetometer, October 29, 2003
LEGAL & REGULATORY
MATTERS
WHY ARE FORCE MAJEURE CLAUSES IMPORTANT?
By Andrés FígoliForce majeure (FM) provisions are important in various types of contracts, including those used in the normal course of submarine cable operations, such as Construction & Maintenance Agreements (C&MA), Joint Build Agreements (JBA), supply and maintenance contracts with cable laying companies, and capacity IRUs (Indefeasible Right of Use) agreements.
In all of these contracts, certain minimum standard FM provisions are critical, while in others, a cable owner’s legal counsel should focus on developing and adapting them to each party’s activities, the jurisdictions involved and the changing global risks.
DRAFTING THE CONTRACT
Typically, force majeure consists of three elements:
1. Unforeseeable event (unforeseeability),
2. outside the control of the parties (externality)
3. which makes performance impossible or impracticable (irresistibility).
When lawyers come to draft this clause during a contract negotiation, they are also careful to review other provisions such as the FM definition, usually in the first clauses, the termination clause, or others that may grant rights to terminate a contract due to an FM event. They may also be found in the annexes, particularly the Service Level Agreements (SLAs), which may be mentioned as an exception to a provider’s obligation to compensate a customer for a service failure.
It is at this point that the interests of the contracting parties come to the negotiating table, and the skills and practical knowledge of lawyers are required to bring the positions of all the contracting parties closer together. When negotiating all these different typical contracts for the long life of a subsea infrastructure, their positions may change, but their interests do not. For example, a COVID crisis affecting permits to lay a new cable would have been unthinkable a decade ago, but careful contract drafting is now essential to avoid future surprises with cable-laying contractors overcharging carriers.
As a result, the length of the FM provision in each of these types will be different, as they need to address specific future scenarios and risks accordingly.
Here we will analyze in each contract which are some of the risks and concerns described in a FM provision.
CMAS OR JBAS
When negotiating an FM provision in these agreements, the cable owners may feel mistrust between each other, but it is normal to analyze each other’s weaknesses and strengths in order to avoid future problems during the 25–30 year life of a cable. And it is better to solve them now than to create a snowball effect.
In this context, the consortium owners divide their responsibilities and appoint some of them as landing parties. To avoid unnecessary costs, these are usually telecom operators already established in the countries
concerned, who would normally own the national local part of the submarine cable and the landing station, where they would sublease any space to the other consortium members. A landing party will also be required to obtain all local licences/permits in a timely and diligent manner on its own behalf or, if necessary, on behalf of the others.
These local companies would be expected to be aware of the political and regulatory situation in the country and to defend the interests of the consortium. However, any right-wing or left-wing change in local government can also change the criteria of the telecom regulators, and a reasonable expectation of 8 months to obtain a landing permit can quickly become an uncertain period if such a landing party consistently breaches the regulations in its day-to-day operations.
It is therefore important to agree in the CMA that the failure to obtain a permit for the new project in a timely manner is not a FM if the acts or omissions of the landing party directly contributed to the delay or failure to obtain such a permit. This should also be carefully considered by the other parties, particularly when selecting their investor for the new cable project, and not when the cable-laying vessel is at mile 201 and it is too late to approach the local authorities to inform them of a change of landing party.
Indeed, most FM provisions are important both before and after the CMA/JBA is signed. While in the
84 SUBMARINE TELECOMS FORUM MAGAZINE
former case a careful up-front review of the parties’ relationship with the local authorities is mandatory, in the latter case careful monitoring of all jurisdictions by all consortium owners is also required to ensure full compliance with the regulatory good standing status.
In addition, with the current climate change, compounded by sea level rise and other potentially increasing hazards, the landing parties must carefully select the location of a cable station to avoid unnecessary risk over the 25-30 year operational life
of a cable system. Otherwise, such a circumstance may not be considered an unexpected change, and indeed shore erosion affecting the fuel tanks of a landing station would not be an FM event.
In fact, most countries now carry out these environmental studies to further assess any national risk. Certainly, the installation of SMART (Science Monitoring And Reliable Telecommunications) cables in certain affected regions, such as the Pacific, will also help to improve the resilience of future nearby cables.
SUPPLY AND MAINTENANCE AGREEMENTS
A supply agreement with a cable-laying contractor should also address whether the suspension of activities due to an FM event entitles the supplier to claim additional costs and time extensions, as well as a right of termination if it is unable to meet its obligations for 6 months or less. Any new submarine cable system faces potential delays during its typical 1-3 year project, but in the case of delays due to an excessively long hurricane season, the cable owner should consider whether or
Protecting and connecting the world’s submarine cable system.
MARCH 2024 | ISSUE 135 85
LEGAL & REGULATORY MATTERS
WHY ARE FORCE MAJEURE CLAUSES IMPORTANT?
By Andrés Fígolinot to find another more economical supplier.
Furthermore, the definition of an FM event is usually broad, and it is important not to restrict it too much. This clause should mention reasonable examples provided they meet the three elements of FM mentioned above. It is advisable that it should include any risks that cable owners consider relevant in the applicable jurisdictions, such as flash floods in the desert area near a landing station. Similarly, such a clause should clearly distinguish those events that are not considered to be FM events, such as strikes by the supplier’s own workforce.
In the light of the lessons learned from the COVID crisis, it is recommended that such a specific scenario be treated as an example, rather than simply included as a “pandemic”, which may be open to interpretation as to who should declare it as such. A flood of academic articles has been written in the shadow of this crisis, and the lesson is now being learned by every player in the global economy, including the telecommunications industry.
Other current risks include maintenance activities in disputed waters, where a cable repair could be seen as an act of sovereignty by either nation and such a task could be obstructed by naval forces in the area. In addition, recent national critical infrastructure programs require the immediate mobilization of cable-laying vessels, resulting in the prioritization of one type of cable system over another. Thus, cable owners should address
these and other risks during the negotiation of supply or maintenance agreements if they believe they are applicable under the circumstances.
CAPACITY IRU AGREEMENTS
These agreements, like the others, have to adapt their definition of FM to their circumstances. Accordingly, the capacity service provider, who is usually the cable owner, will initially resist any attempt by its customer to exclude “fibre cuts” as an FM event. This position is reasonable as these events typically have the 3 elements of a Force Majeur event.
Moreover, since the FM definition clause usually gives many examples of FM events such as earthquakes, sabotage, tsunamis, it is reasonable that the carrier would eventually accept such a deletion and commit to investigate any fibre cut event in the future. If these three elements are indeed present, the carrier concerned will enforce this FM clause accordingly, even if such an example is not explicitly mentioned.
In these scenarios, and especially when negotiating terrestrial connectivity, it is imperative for such a customer to analyse the provider’s historical outage data for such a leased route before signing longterm leases for this capacity. If there are frequent outages in the middle of the rainforest segment due to illegal mining activities or even accidents caused by local municipal road maintenance work, the IRU provider should consider offering
two different SLAs, one for the submarine segments and one for the risky terrestrial portion.
Additionally, the termination rights for capacity IRU agreements are usually set at 30 days if the FM event continues, which is shorter than in the other cases mentioned above. No one wants to have an unreliable carrier as a supplier for 25 years. The rationale is based more on maintaining trust with their own customers than on monetary compensation, which is generally insufficient in such a retail market. Typically, national telecom operators or Internet Service Providers (ISPs) provide residential or business services to end-users, who rarely receive any compensation but can very quickly find another Internet provider.
In addition, if a customer has to pay an up-front fee in a capacity IRU agreement, it is advisable to include a refund clause to provide clarity for both parties on the consequences of terminating the contract. On the one hand, this provision should specify the amounts to be paid to the affected customer and, on the other hand, it should also specify that no other costs, damages or penalties are to be paid by the non-breaching party, which would have to urgently find a replacement capacity provider immediately if it does not want to lose its customers.
As in the previous case, there should be a clear procedure to be followed by each party when an FM event occurs. In particular, it is important that the capacity IRU pro -

86 SUBMARINE TELECOMS FORUM MAGAZINE
LEGAL & REGULATORY MATTERS
WHY ARE FORCE MAJEURE CLAUSES IMPORTANT?
By Andrés Fígolivider effectively notifies its customer if there is a service interruption due to damage to its submarine cable and if it is suspected that the cause is either due to a seabed landslide or a fishing vessel. At a later stage, the investigation will finally determine the cause of the disruption, but it is important to keep customers informed, as they will also need to inform their retail customers, as seen above.
How can a potential IRU Capacity customer be sure that they are contracting with a reliable provider? Unfortunately, force majeure events that cause cable system failures are still common in the telecommunications industry. However, a carrier may be able to show a track record of no outages in previous years or ongoing cable awareness campaigns in the affected area to demonstrate that the cable owner has been active in preventing this type of accident. Of course, the absence of the latter should not be interpreted as an excuse for the skipper of a fishing trawler to be negligent when approaching a cable zone.
HARMONIZATION
It is important for a cable owner’s in-house legal counsel to be aware of and harmonize the contractual terms agreed for all phases of the submarine cable’s life (installation, maintenance and subsequent commercialization of telecommunications services). The FM provisions in all these contracts mentioned above should be consistent and harmonized, otherwise the cable owner will be left with gaps that may jeopardize the operational, financial and, of course,
legal stability of the cable.
For instance, before a submarine cable is laid, future capacity IRU customers may require as a sine qua non condition that the carrier has aggressive service level agreements (SLAs) and recovery plans, including restoration services. The cable owner should then demand similar terms from the cable maintenance provider and other capacity restoration providers. Otherwise, such a cable owner should negotiate a better IRU price with its potential IRU customer, or assume that it has a time bomb in its financial projects, or consider other less risky investments.
This simple consistency test should be defined at the outset of any submarine cable project, as consortium co-owners may have different expectations, needs and solutions in line with their own market constraints. And it is an issue that needs to be addressed in the business case projection, as it can also affect future revenues.
Another illustration of this is where a cable owner is not obliged to compensate an IRU capacity customer for unavailability of service due to an FM event (e.g. cable failure due to earthquake) and, subject to the applicable C&MA, consortium members will have subsequent meetings to contribute to repairs in accordance with their participation. Any distortion in the FM provision of one of these agreements should also be addressed in the other agreements with partners and maintenance suppliers, with a different allocation of risks and costs.
Of course, this regular consistency check between the different agree-
ments should not be carried out by external lawyers, who usually negotiate only one agreement, but by the various departments of a cable owner’s company, including legal, commercial and network departments, working together. They should identify inconsistencies and seek to eliminate or at least minimise their impact.
In summary, force majeure provisions are indeed an important part of any contract, and in the submarine cable industry they are particularly relevant as they seek to address future risks for the next 25-30 years after a submarine infrastructure is in the water. Climate change, pandemics and other hazards that were once considered remote risks are now seriously addressed in contract drafting.
Maintaining consistency of terms with other agreements relating to the same subsea assets is a key element of a successful business plan. Each submarine cable owner’s internal organisation must work as a coordinated team to address this cross-functional control of their day-to-day activities. STF

ANDRÉS FÍGOLI is the Director of Fígoli Consulting, where he provides legal and regulatory advice on all aspects of subsea cable work. His expertise includes contract drafting and negotiations under both civil and common law systems. Additionally, he has extensive experience as an international commercial dispute resolution lawyer. Mr. Fígoli graduated in 2002 from the Law School of the University of the Republic (Uruguay), holds a Master of Laws (LLM) from Northwestern University, and has worked on submarine cable cases for almost 21 years in a major wholesale telecommunication company. He also served as Director and Member of the Executive Committee of the International Cable Protection Committee (2015-2023).
88 SUBMARINE TELECOMS FORUM MAGAZINE
DISCOVER THE OCEAN OF OPPORTUNITY
Your Premier Portal to Locate Companies for Submarine Telecoms Collaboration

Content Highlights:
• All-Encompassing Listings: Dive into a world-class directory of submarine telecom product and service providers.
• Intuitive Search: Effortlessly navigate to the services and solutions tailored to your mission.
• Spotlight on Innovation: Engage with the leaders driving the industry forward through technological advancements.
SET SAIL FOR SUCCESS


BOOKMARK THE SUBTEL FORUM INDUSTRY DIRECTORY TODAY!
ON THE MOVE
IN THE DYNAMIC REALM OF CORPORATE ADVANCEMENTS, THIS MONTH SPOTLIGHTS A SERIES OF NOTABLE TRANSITIONS AMONG INDUSTRY LEADERS.


ANDY BAX has been appointed Senior Partner - Digital Infrastructure at Cambridge Management Consulting starting May 2024. Previously, Bax served as Chief Strategy Officer at EdgeUno.
ROLF BØE assumed the role of Project Manager at ELFOsubsea in March 2024. Boe has a solid background in project management, having previously served as Project Manager at Tampnet AS for over a decade.
JOHN CHICHESTER took on the position of Director of Commercial Operations at Datawave Networks in February 2024. Before this, Chichester was the Sales Director at Huawei Marine Networks, a role he held since November 2011.


JAVIER HÉCTOR LLORET joined Infinera as the Senior Director of Subsea Sales for EMEA in April 2024. Prior to this, Lloret was a Senior Submarine Expert at Zain Omantel International.
ANDY LUMSDEN was appointed Operations Lead for the Global Submarine Network at Google starting March 2024. He previously held the role of Head of Network Services at the Telstra International Group.
DENISE TOOMBS has taken on the role of Director, Marine Permitting at Worley as of May 2024. Prior to joining Worley, Toombs was Associate Vice President, Offshore Services Lead for Subsea Fiber and US West Coast Offshore Wind at AECOM.
These transitions underscore the vibrant and ever-evolving nature of the industry, as seasoned professionals continue to explore new challenges and avenues for impactful contributions.
90 SUBMARINE TELECOMS MAGAZINE
SUBMARINE CABLE NEWS NOW
CABLE FAULTS & MAINTENANCE
Yemen Subsea Cable Repairs Delayed
WACS Subsea Cable Repaired After Landslide Damage
Subsea Cable Damage Cuts Internet to Islands Off Africa Coast
Internet Disruption May Affect Bangladesh for a Month
Quintillion Submarine Cable Break Affects Alaska’s North Slope
Submarine Cable Break Slows Internet in Bangladesh
Undersea Cable Cuts Impact Nigeria Terrorism Fight
Ghana Internet Cuts Spark Digital Resilience Call
MainOne’s Repair Timeline Extends to Eight Weeks
$8M to Restore Subsea Cable Services
CONFERENCES & ASSOCIATIONS
Join PTC’25 in Hawaii: A Call for Participation
ICPC Call for Presentations for Valentia Island Symposium
CURRENT SYSTEMS
Telecom Egypt, EXA Infrastructure Ink Key Data Movement Pact
Google’s Equiano Cable: West Africa’s Connectivity Lifeline
Angola Cables and EllaLink Enhance South America-Europe Link
Crosslake Fibre and Cologix Boost Montreal’s Connectivity
Tunisia Inaugurates Ifriqiya Submarine Cable
DATA CENTERS
Flagler DC Blox Data Center Plan Ties to Undersea Cables
Liberty Networks Expands in Latin America
TelCables Opens New PoP in Durban
FUTURE SYSTEMS
Unitirreno Advances Subsea Cable Development
Orange Announces SEA-ME-WE 6 Cable Lands in Marseille
Telxius Boosts Caribbean Connectivity with New Cable
Singtel, Viettel to Build Singapore-Vietnam Submarine Cable
Delays Hit Converge ICT Subsea Cable Projects
Mérida Internet PoP and Undersea Cable Upgrade
Google’s $1B Boost for Pacific Connectivity
GO Innovates with Digital Drive
Study Clears Blue Submarine Cable’s Environmental Path
Ooredoo and e& Boost UAE-Qatar Data Center Link
STATE OF THE INDUSTRY
Australia’s $75M Boost to Tuvalu Amid Regional Tensions
Angola Cables and Camtel Boost West Africa Connectivity
Optus Appoints Stephen Rue as New CEO
Italy’s G7 Summit Focuses on Undersea Networks
Telecom Italia Writes Down Sparkle Submarine Cable Division
FCC Grants JGA Submarine Cable License Changes
Mission Critical: Safeguarding Submarine Cable Networks
Telkom Indonesia’s Major Network Capacity Leap
Nigeria, ITU to Strengthen Submarine Cable Infrastructure
Nigeria Seeks Global Cooperation for Cable Protection
TECHNOLOGY & UPGRADES
BW Digital Installs Solar Panels at NZ Cable Station
UK and NZ Explore Earthquake Detection Via Subsea Cables
Scurra Tech Debuts First Organic Sub Cables
NEC, NTT’s 7,000km Multicore Fiber Optic Experiment
Ciena Upgrade Boosts SEA-ME-WE 4 Cable Capacity
MAY 2024 | ISSUE 136 91
ADVERTISER CORNER
By Nicola TateTraditionally we use this space to promote all the reasons to advertise in the SubTel Forum Magazine and on other SubTel Forum properties, however, as we were finalizing this issue I thought we could start using this space to also provide one advertising or marketing tip that could be applied to any of your marketing efforts.
This issue’s top tip is a simple one. When running a digital campaign always use a custom, trackable URL for each of your media outlets. A trackable URL, specific to each media outlet, allows you to track what outlets generate the most clicks. By employing different trackable URLs you can measure a retargeting campaign separately from, for example, a banner ad campaign running on SubTelForum. com, while running the same artwork.
There are two basic URL tracking solutions.
• For those of you utilizing Google Analytics you can create one directly with Google and it will also track back into your Google Analytics dashboards. Click here to view basic instructions or scan the QR code below:

• If you do not utilize Google Analytics or prefer a different solution one of the most popular tools is Bitly. Bitly will provide click data, but also some general demographic data about those engagements. Click here to view their site or scan the QR code below:
Don’t forget that reporting traffic via a tracking URL is just a small part of measuring the ROI of your campaigns. Not all clicks represent the same value, however, this is a great starting point to measuring the effectiveness of your campaigns.
Speaking of effective campaigns, if you are seeking to reach high-level decision-makers in the submarine cable industry there is simply no better place to facilitate connections and showcase your product or service than SubTel Forum properties. Contact me to discuss how we may be of service.STF

Originally hailing from the UK, NICOLA TATE moved to the US when she was just four years old. Aside from helping companies create effective advertising campaigns Nicola enjoys running (completed the Chicago marathon in 2023 and will be running in the Berlin marathon in 2024), hiking with her husband, watching her boys play soccer, cooking, and spending time with family.
92 SUBMARINE TELECOMS FORUM MAGAZINE

CONNECT INNOVATIVELY. ENGAGE GLOBALLY. GROW EXPONENTIALLY.
MAY 2024 | ISSUE 136 93 2024
Your Gateway to Influential Submarine Telecoms Advertising
Welcome to a new era of advertising with SubTel Forum in 2024. We’re combining revolutionary and diverse advertising options with a focus on impact and customization. Our offerings this year are designed to cater to a spectrum of marketing strategies within the dynamic submarine telecoms industry, offering a unique blend of opportunities for every advertiser’s need.
CONTACT SALES
94 SUBMARINE TELECOMS FORUM MAGAZINE
AT A GLANCE
Submarine Telecoms Forum is the leading digital platform for the submarine cable industry, offering a dedicated e-magazine, daily news, and streaming video content. We serve over 150,000 users across 125 countries, providing free, comprehensive insights into submarine telecom cable and network operations. As a trusted source for information, we ensure you stay informed and connected in the fast-paced world of submarine telecommunications.
OUR SPONSORS INCLUDE:


In 2024, we’re expanding our reach to more industry professionals and decision-makers. We are your link to a vast network in the telecom world.
OUR AUDIENCE BY THE NUMBERS
65%
are final decision-makers or high influencers of purchasing decisions.
85% More than
of readers have been in the industry for greater than 10 years.
96 SUBMARINE TELECOMS FORUM MAGAZINE AUDIENCE OVERVIEW
4 SUBTEL FORUM 2024 SPONSORSHIP


FACEBOOK X/TWITTER followers: followers: followers: clicks: impressions: reactions: 7,063 991 1,398 7,923 265,579 4,376
MAY 2024 | ISSUE 136 97 2023
SOCIAL MEDIA BREAKDOWN LINKEDIN
5 SUBTEL FORUM 2024 SPONSORSHIP
START YOUR 2024 ADVERTISING JOURNEY WITH US
Ready to elevate your brand in 2024? Reach out to our dedicated team at sales@subtelforum.com for personalized advertising solutions. We’re here to collaborate with you in achieving your marketing aspirations. Let’s make your campaign a success together.
Editorial Calendar
Cable Almanac – Q1
age of the world’s systems.
SubTel Forum Magazine #135 Finance & Legal edition featuring ICPC ’24 Preview: Get the lowdown on the financial and legal aspects.
SubTel Forum Magazine #136
Cable Almanac – Q2
2024 SubTel Forum Magazine #137
Capacity edition featuring SNW World Preview: Explore the world’s data highways and their capabilities.
regions of the world’s systems.
SubTel Forum Magazine #138
2024/25 Submarine Telecoms Industry Report
Energy edition: Uncover the link between energy and subsea cables.
SubTel Forum Cable Map Showcasing every major international submarine cable system.
98 SUBMARINE TELECOMS FORUM MAGAZINE
Publication Theme Booking Deadline Artwork Deadline Conference Participation JANUARY
2024
Magazine
Global
1 January 2024 8 January 2024 PTC ‘24 FEBRUARY 2024 Submarine
Highlighting
8 February 2024 15 February 2024 MARCH 2024
SubTel Forum
#134
Outlook edition featuring SNW EMEA Preview: Start the year with a comprehensive view of the industry.
1 March 2024 8 March 2024 ICPC Plenary ‘24 MAY
2024
1 May 2024 8 May 2024 Submarine Networks EMEA ‘24 Submarine
Highlighting
8 May 2024 15 May 2024 JULY
Systems edition
1 July 2024 8 July 2024 AUGUST 2024 Submarine Cable Almanac
Highlighting suppliers
systems. 8 July 2024 15 July 2024 SEPTEMBER 2024
Global
Regional
featuring Cables & Connectors Industry Forum Preview: Dive into the specifics of regional connectivity.
– Q3
of the world’s
Offshore
1 September 2024 8 September 2024 Submarine Networks World ‘24 OCTOBER 2024
The
submarine
1 September 2024 8 September 2024 Cables & Connectors Industry Forum ‘24 NOVEMBER 2024
Data
1 November 2024 8 November 2024
Highlighting
8 November 2024 15 November 2024 DECEMBER 2024
most accurate, comprehensive data on the
fiber market.
SubTel Forum Magazine #139
Centers & New Technology edition featuring PTC ’25 Preview: Stay ahead with the latest tech insights.
Submarine Cable Almanac – Q4
owner of the world’s systems.
20
6 SUBTEL FORUM 2024 SPONSORSHIP
November 2024 1 December 2024
SubTel Forum Bi-Monthly MAGAZINE
SubTel Forum, the premier publication in the submarine telecoms industry, offers focused issues that delve into specific market aspects. Each issue stands out with:
• Over 100,000 Downloads: Your message reaches a vast audience with each publication.
• Two Months Exposure & Endless Archiving: Extended visibility and perpetual access for your ads.
We also provide a tiered advertising structure, accommodating various marketing needs and budgets. Choose from half-page, full-page, and two-page spread options, with discounts for multiple-issue commitments.

SPONSORSHIP BENEFITS WITH SUBTEL FORUM:
• Web Banner: Feature on our News Now feed.
• Press & Mailer Recognition: Announcement of your sponsorship.
• Video Embedding: Optional 30-second slot for Full and Two-Page ads.
• Social Media Shoutouts: For Full and Two-Page spreads on LinkedIn, Facebook, and Twitter.
• Dedicated Email Campaign: Exclusive for Two-Page sponsors.
AD OPTIONS (SEE EXAMPLES TO THE RIGHT):
• Half Page: Great visibility, no additional perks.
• Full Page: Includes a social media campaign/mention.
• Two-Page Spread: Maximum exposure with social media and a dedicated sponsor email.
ART & VIDEO REQUIREMENTS:
• Print Ads: 300 dpi in PDF or JPG with crop marks.
• Video Ads: 30-second clips in 1280 × 720 or 1920 × 1080 resolution, mp4 format.
• Optional Video - 30 seconds
• 1280 × 720 or 1920 × 1080 resolution – mp4 Video File
MAY 2024 | ISSUE 136 99
Advertisement 1 Issue 2 Issues 3 Issues 4 Issues 5 Issues 6 Issues Half Page $1,200 $1,145 $1,085 $1,025 $965 $905 Full Page $2,000 $1,905 $1,810 $1,705 $1,605 $1,505 2 Page Spread $3,500 $3,325 $3,150 $2,980 $2,805 $2,625 HALF PAGE AD FULL PAGE AD 2 PAGE SPREAD AD EXAMPLES 8.5” x 5.5” 8.5” x 11” 11” x 17” 7 SUBTEL FORUM 2024 SPONSORSHIP
SubTel Forum Quarterly ALMANAC
The SubTel Forum Almanac, released quarterly, is a key reference for the submarine cable industry. Each issue showcases major international systems with detailed pages featuring system maps, landing points, capacity, length, and RFS year, among other data.
QUARTERLY DOWNLOADS & EXPOSURE:
• Over 525,000 downloads per issue.
• Three months of exposure plus permanent archiving.

2024 TOPICS INCLUDE:
• Q1 - Age
• Q2 - Region
• Q3 - Supplier
• Q4 - Owner
SPONSORSHIP BENEFITS:
• Prominent Two-Page Spread Ad near the front.
• Logo/Link on cover and webpage acknowledgment.
• Web Banner on News Now feed.
• Social media acknowledgment.
• Press release and mailer mention.
ART & VIDEO REQUIREMENTS:
• Size: 17” W x 11” H for Two-Page Spread.
• Resolution: 300 dpi, in PDF or JPG.
• Optional 30-second video in 1280 × 720 or 1920 × 1080, mp4 format.
100 SUBMARINE TELECOMS FORUM MAGAZINE
Advertisement 1 Issue 2 Issues 3 Issues 4 Issues 2 Page Spread $2,500 $2,125 $1,800 $1,550 8 SUBTEL FORUM 2024 SPONSORSHIP
SubTel Forum Industry REPORT
The SubTel Forum Annual Report offers the latest, comprehensive data on the submarine fiber market, analyzing system capacity, productivity, and industry outlook. Key features include:
• Annual Downloads & Exposure: Over 560,000 downloads, with one-year exposure and permanent archiving.
• Tiered advertising structure, accommodating various marketing needs and budgets. Choose from half-page, full-page, and two-page spread options.

SPONSORSHIP BENEFITS:
• Web Banner on News Now feed.
• Social media acknowledgment.
• Press release and mailer acknowledgment.
AD OPTIONS (SEE EXAMPLES TO THE RIGHT):
• Half Page: Great visibility, no additional perks.
• Full Page: Includes a social media campaign/mention.
• Two-Page Spread: Maximum exposure with social media and a dedicated sponsor email.
• Optional video: Include a blank box for overlay; no size restrictions.
ART & VIDEO REQUIREMENTS:
• Print Ads: 300 dpi in PDF or JPG with crop marks.
• Optional Video - 30 seconds 1280 × 720 or 1920 × 1080 resolution – mp4 Video File
LOCK IN NOW FOR 2024!
Sponsors can secure a spot in one of the various categories below. First come-first served!
• Global Overview
• Capacity
• Ownership Financing Analysis
• Supplier Analysis
• System Maintenance
• Cable Ships
• Hyperscalers and The Evolution of Submarine Cable Ownership
• Special Markets
• Regulatory Outlook
• Regional Analysis and Capacity Outlook
MAY 2024 | ISSUE 136 101
Note: Subtel Forum reserves the right to change categories 9 SUBTEL FORUM 2024 SPONSORSHIP HALF PAGE AD FULL PAGE AD 2 PAGE SPREAD AD EXAMPLES 8.5” x 5.5” 8.5” x 11” 11” x 17” Advertisement Size Cost Half Page $1,200 Full Page $2,000 2 Page Spread $3,200
SubTel Forum
PRINT CABLE MAP
Feature your logo on our beautiful, large format print map, which proudly showcases every major international submarine cable system. This map is a fixture in many offices across the industry.
• Limited Availability: Only 22 spaces for logos.
• Wide Distribution: Over 4,500 copies shared at key industry events like PTC and Submarine Networks EMEA and World, ensuring a year-long exposure.
ANNUAL PRICE: $4,000
SPONSORSHIP PERKS:
• Complimentary Web Banner on News Now feed.
• Social media shoutouts.
• Acknowledgment in press releases and mailers.
• 25 free copies for sponsors.Resolution: 300 dpi, in PDF or JPG.

102 SUBMARINE TELECOMS FORUM MAGAZINE
10 SUBTEL FORUM 2024 SPONSORSHIP
SubTel Forum ONLINE CABLE MAP
The SubTel Forum Online Cable Map is built with the industry-standard Esri ArcGIS platform, linked to the SubTel Forum Submarine Cable Database. It offers comprehensive tracking of:
• Over 550 current and planned cable systems.
• More than 1,500 landing points.
• In excess of 1,700 data centers.
• 53 cable ships.
• Integration with SubTel Forum’s News Now feed for current and historical news.
QUARTERLY PRICE: $3,000
This map is a valuable tool for anyone interested in the submarine cable industry, allowing detailed exploration of global cable infrastructure.
SPONSORSHIP BENEFITS FOR THE SUBTEL FORUM ONLINE CABLE MAP:
• Duration: 3-month exposure.
• Visibility: Your logo and link featured on every page.
• Company Profile: 75-word description in the company announcement.
• Additional Promotion: Complimentary web banner on SubTel Forum’s News Now feed.
• Social Media Recognition: Acknowledgment on LinkedIn, Facebook, and Twitter.
• Official Acknowledgment: Mention in press release and mailer.
These benefits offer sponsors significant exposure and opportunities to highlight their company within e-submarine telecoms community.

MAY 2024 | ISSUE 136 103
11 SUBTEL FORUM 2024 SPONSORSHIP
104 SUBMARINE TELECOMS FORUM MAGAZINE Where Submarine Telecoms Advertising Meets Innovation. SUBTEL FORUM 2024 Join us in shaping the future of telecom marketing. FOR ALL ADVERTISING INQUIRIES, CONTACT: NICOLA TATE ntate@associationmediagroup.com [+1] 804.469.0324
MAY 2024 | ISSUE 136 105


106 SUBMARINE TELECOMS FORUM MAGAZINE FEATURE MARCH 2021 | ISSUE 117 106 COMING NEXT ISSUE! YOU CAN BE A PART OF OUR NEXT ISSUE! SUBMIT AN ARTICLE contact editor@subtelforum.com SPONSOR AN ADVERTISEMENT contact ntate@associationmediagroup.com