10 minute read
MARKET REPORT

much below Cotlook A index, the global spot price benchmark but was above domestic spot price for benchmark Gujarat Shankar-6. During the month, Cotlook averaged US$93.60 per pound while Shankar-6 was at US cents 77.99 per pound, keeping Indian cotton competitive in the global market.
MARKET REPORT
Advertisement
VIETNAM: COTTON MARKET REPORT
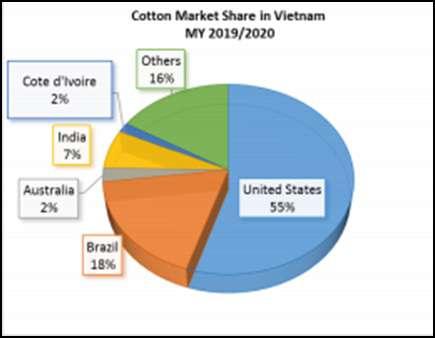
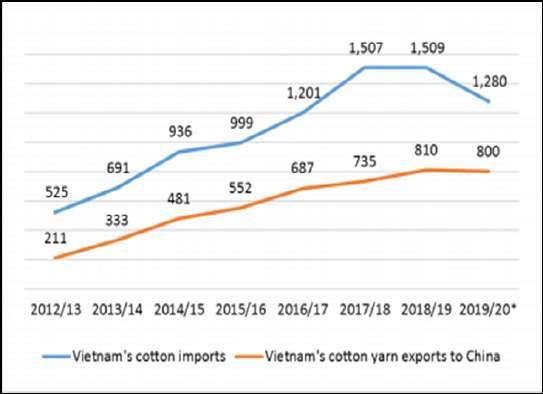
Due to the ongoing COVID-19 pandemic, which has impacted many of Vietnam's main business partners, including China, Korea, Japan, the United States, and the EU, Post forecasts that Vietnam's cotton imports for marketing year (MY) 2019/2020 will be reduced to 1.28 million metric tons (MMT), or 5.90 million bales. The pandemic has slowed demand for clothing and has had a major effect on cotton imports into Vietnam. In MY19/20, US cotton exports to Vietnam are forecast to be 707,000MT, or 3.24 million bales, down 15% from the previous year. Despite this downturn, Post predicts that the United States will retain its 55 percent market share. Post predicts that Vietnam's cotton imports will increase by 10% in MY20/21, with 1.42 MMT or 6.5 million bales imported. Cotton from the United States is expected to achieve a market share of 60%. This forecast is subject to ongoing COVID-19 developments; for the most up-to-date information, see the Cotton and Products Semiannual in November 2020.
Setting and perspective Textile Industry
The textile and garment sector in Vietnam remains one of the country's most important export sectors, contributing significantly to the country's GDP growth and employing 2.8 million people. Export sales in the calendar year (CY) 2019 hit $37.6 billion, up 7.4% from the previous year, according to trade data from Vietnam Customs. Despite being important, this growth fell short of the 11 percent target set by the Vietnam Textile and Apparel Association (VITAS) at the start of the year. VITAS reported Vietnam's textile and garment exports to be between $41.5 and $42 billion in CY20. COVID-19, which has impacted the United States and the EU, Vietnam's two main textile markets, has broken these hopes. For both material supply and yarn use, the textile and apparel industry in Vietnam is heavily reliant on China. Vietnam imports 60% of its clothing, 55% of its yarn and fiber, and 45% of its trims from China. Furthermore, China receives approximately 60% of total yarn exports from Vietnam and 80% of cotton yarn exports. As a result, even minor changes in China would influence the textile and apparel industries in Vietnam. Many Chinese factories had to minimize or halt operations when China was under siege, sparking concerns of supply shortages in Vietnam's textile and garment industry. As a result, Chinese fabric imports fell 19 percent to $813 million in the first two months of 2020, compared to the same period last year. Though fears about Chinese supplies have subsided after Chinese factories started to reopen in late February 2020, Vietnamese garment producers began facing a new challenge in March of this year as the COVID-19 outbreak spread across the US and EU, Vietnam's two largest customers. According to Vietnam Customs, Vietnam's textile and garment exports to the United States and the European Union totaled $19.2 billion in 2019, accounting for more than half of the country's total textile and garment exports. While exports to the EU increased just 4% to $4.3 billion in 2019, exports to the EU are expected to skyrocket once the EU-Vietnam Free Trade Agreement (EVFTA) is ratified. The EU ratified the EVFTA on February 12, 2020, and Vietnam is due to ratify it in May 2020. The EVFTA would eliminate the existing tariffs of up to 12% on textiles and garments manufactured in Vietnam. In response to COVID-19, the US and the EU temporarily shut down borders, schools, and non-essential stores, restricted travel, and reduced commercial flights. Store closures have decreased consumer demand, which has started to affect Vietnamese textile and apparel exports. Customers in the United States and Europe have already suspended or cancelled orders, according to several Vietnamese garment manufacturers. Exports to member countries of the Comprehensive and Progressive Agreement for Trans-Pacific Partnership (CPTPP) and other conventional markets like South Korea and Japan have also slowed because of COVID-19. According to industry sources, if the flu pandemic in the United States and Europe lasts until May, many Vietnamese garment manufacturers will face severe financial hardship, possibly leading to bankruptcy.
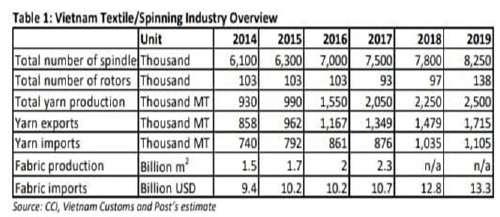
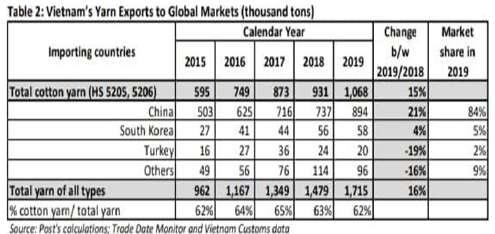
In CY19, the number of mills in Vietnam increased to 107 from 98 the previous year, suggesting that the country's yarn spinning capacity is still rising. The equivalence of spindles has increased to nearly 10 million, up around 1 million from CY18, and yarn production could hit 2.5 million MT per year (see Table 1). In 2019, Vietnam's yarn exports totaled 1.72 MMT, up 16 percent from the previous year. Export values, on the other hand, did not keep pace with sales, increasing just 3.8 percent from $4.0 billion in CY18 to $4.2 billion in CY19 due to lower prices. Cotton yarns with the HS codes 5205 and 5206 account for 60 to 65 percent of all yarn exports from Vietnam. Cotton yarn exports in CY19 totaled nearly 1.11 MMT, up 15% from CY2018. China, South Korea, and Turkey continue to be Vietnam's top importers, accounting for more than 90% of the country's
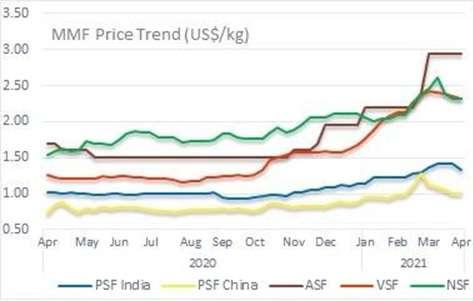
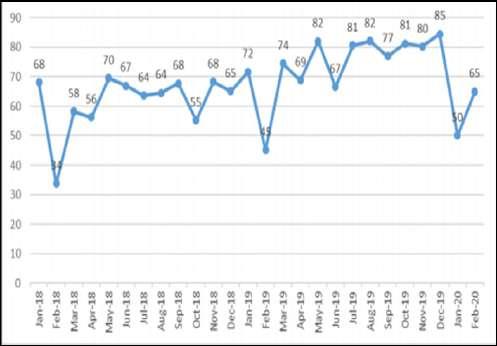
total cotton yarn exports (see Table 2 and Figure 1). In CY19, Vietnam's cotton yarn exports to China increased by 19 percent in volume and 7% in value, reaching 894 TMT and $2.3 billion, an increase of 19 percent in volume and 7% in value over the previous year. The rise was largely due to increased exports by Chinese and Taiwanese-owned spinning mills. Even though there are only 17 Chinese and Taiwanese-owned mills in Vietnam out of a total of 107, their spindle equivalent accounts for 45 percent of the country's total yarn output (see Table 3). Cotton yarn exports to China remain high, but local spinning mills are grappling with falling yarn prices. Cotton prices, which fell gradually from around $1.87/kg in January 2019 to around $1.69/kg in December 2019, fell further in February 2020 to $1.63/kg (see Figure 2). Since Chinese yarn buyers often use the price of cotton as a benchmark for setting cotton yarn prices, this drop has put a strain on many Vietnamese spinners, especially those who solely export cotton yarns to China. As a result, as cotton prices decline, spinners make small profits or even lose money. FDI spinning mills, on the other hand, normally manufacture cotton yarns for their parent companies and are therefore less vulnerable to yarn price fluctuations.
Following the announcement of the Phase 1 US-China agreement in mid-January 2020, Vietnamese spinners began ramping up production for the Chinese market, but this was soon interrupted by COVID-19 and the previously stated temporary closures of numerous weaving and knitting factories across China. While cotton yarn exports remained positive in the first two months of 2020, local spinning mills said they were keeping a close eye on developments in China (see Figure 2). When Chinese factories gradually reopened in late February, pressure on Vietnamese spinners was relieved. However, as previously mentioned, demand from the United
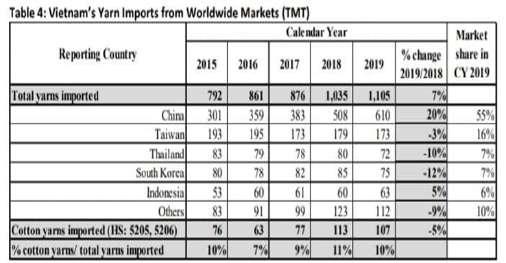
States and the European Union has decreased, resulting in lower Vietnamese yarn consumption. Vietnam also imports yarn, the majority of which is synthetic yarn, for its weaving and knitting industries. Vietnam's cotton yarn imports are negligible in comparison to total yarn imports, indicating that domestic cotton yarn supply is improving (see Table 4).
Production


Vietnam's cotton-planting area has started to decline to insignificance. Domestic cotton production is projected to be less than 1% of total market demand by FAS/Vietnam. For
a more in-depth look at the decline in planted area.
Trade
Cotton shipments to Vietnam remained normal until the
end of February 2020, but the situation remains volatile due to COVID-19. While FDI spinning mills, especially Chinese ones, are maintaining their normal operations, most local spinners have reported that they are receiving messages from their yarn buyers for order suspensions and/or delayed shipping schedules. Unshipped yarns were stated to be plentiful in some spinners' warehouses. Local spinners have begun to consider reducing their operations in response, resulting in lower cotton imports. Cotton imports are expected to reach an alltime low in MY19/20, according to industry analysts. On COVID-19, Post estimated MY19/20 cotton imports to Vietnam at 5.9 million bales (or 1.28 MMT), a decrease from the USDA official figure. Post predicts that Vietnam's cotton imports will rebound with a 10% rise in MY20/21, to around 1.42 MMT, or 6.5 million bales, assuming the situation is contained, and normal business operations are resumed by July 2020. Because of the available supply, Post predicts that U.S. cotton would gain a 60 percent market share. This expected recovery is, once again, subject to change based on COVID-19 developments. For nearly a decade, the United States has topped the list of cotton suppliers to Vietnam. Cotton exports from the United States to Vietnam were strong in the first half of MY19/20 but have slowed in the second half due to a recession in the entire textile and apparel supply chain caused by COVID-19. According to Post, U.S. cotton exports to Vietnam would drop 15% in MY19/20, totaling 707,000MT. Brazil has established itself as a direct competitor of the United States, and most spinners in Vietnam use Brazilian cotton. Cotton exports from Brazil to Vietnam have increased dramatically in the last five years, from 100,000 metric tonnes in MY14/15 to 176,000 metric
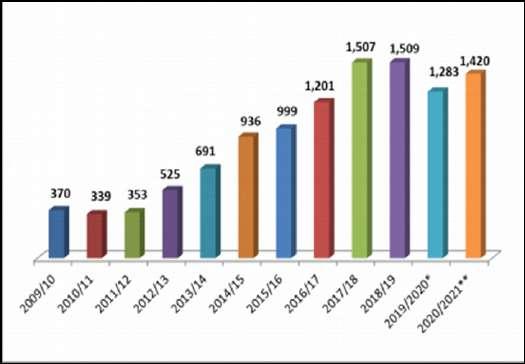
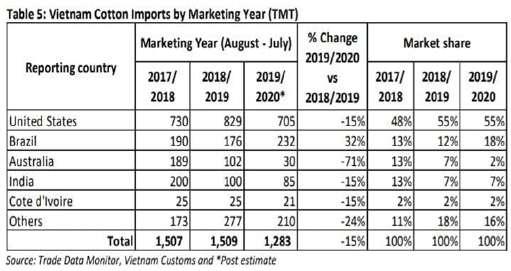


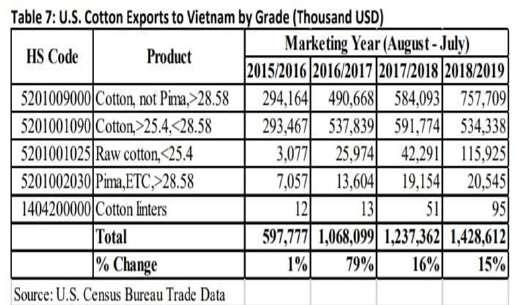
tonnes in MY18/19, and are forecast to exceed 200,000 metric tonnes in MY19/20 due to a large harvest. Meanwhile, due to unfavorable weather conditions, Australia's cotton exports fell dramatically in MY18/19 and are predicted to continue to decline in MY19/20. Due to increased production of open-end yarns (OE) and a shorter supply of cotton waste, raw cotton exports have steadily increased over the last four years.
Consumption
As previously mentioned, Vietnam's cotton consumption is expected to decline in the second half of MY19/20, and Post expects this trend to continue into MY20/21 because of COVID-19, as a decrease in consumer demand in these markets would have a direct impact on Vietnam's cotton consumption. China's textile exports to the US and EU are expected to decline, reducing Vietnam's cotton consumption. MY19/20 consumption is expected to drop sharply to 5.9 million bales (1.28 MMT), while MY20/21 consumption is expected to recover to 6.5 million bales (1.42 MMT).
Prices
In MY18/19, average cotton import prices fell slowly, from $2.04/kg in August 2018 to $1.80/kg in July 2019. Prices dropped lower, hitting a new low of $1.59/kg in January 2020. The drop in prices is due to a number of factors, including the aforementioned trade tensions between the US and China, low demand, and the effects of the COVID-19 pandemic.
Stocks
Due to the global wide supply and declining cotton prices, local spinners have continued to reduce stock levels in MY19/20. Post expects the stocks-to-use ratio to stay at 17 percent in MY19/20 and predicts the same ratio for MY20/21.
MARKETING/ POLICY
Tariffs on cotton
Cotton fiber (HS codes 5201, 5203) has no tariff but is subject to a 5% value added tax. Tariff on cotton yarn

Cotton yarn (HS codes 5204, 5205, and 5207) is subject to a 5% tariff and a 10% VAT.
Biotech Policy and Cotton Production Vietnam has not yet allowed the commercialization of biotech cotton. Biotech cotton field trails, on the other hand, are permitted. There have been no field trials to date. More information on agricultural biotechnology in Vietnam can be found here.
Source: USDA