Architecture

Portfolio

Architecture

Portfolio
Studio William Ng
A0238022R
Design 1
Seeing, Thinking, Making
WILLIAM NG | STUDIO TUTOR

CHRISTINE YOGIAMAN | EXTERNAL REVIEWER, ASSISTANT PROFESSOR, SUTD
LEE HUI LIAN | GUEST REVIEWER

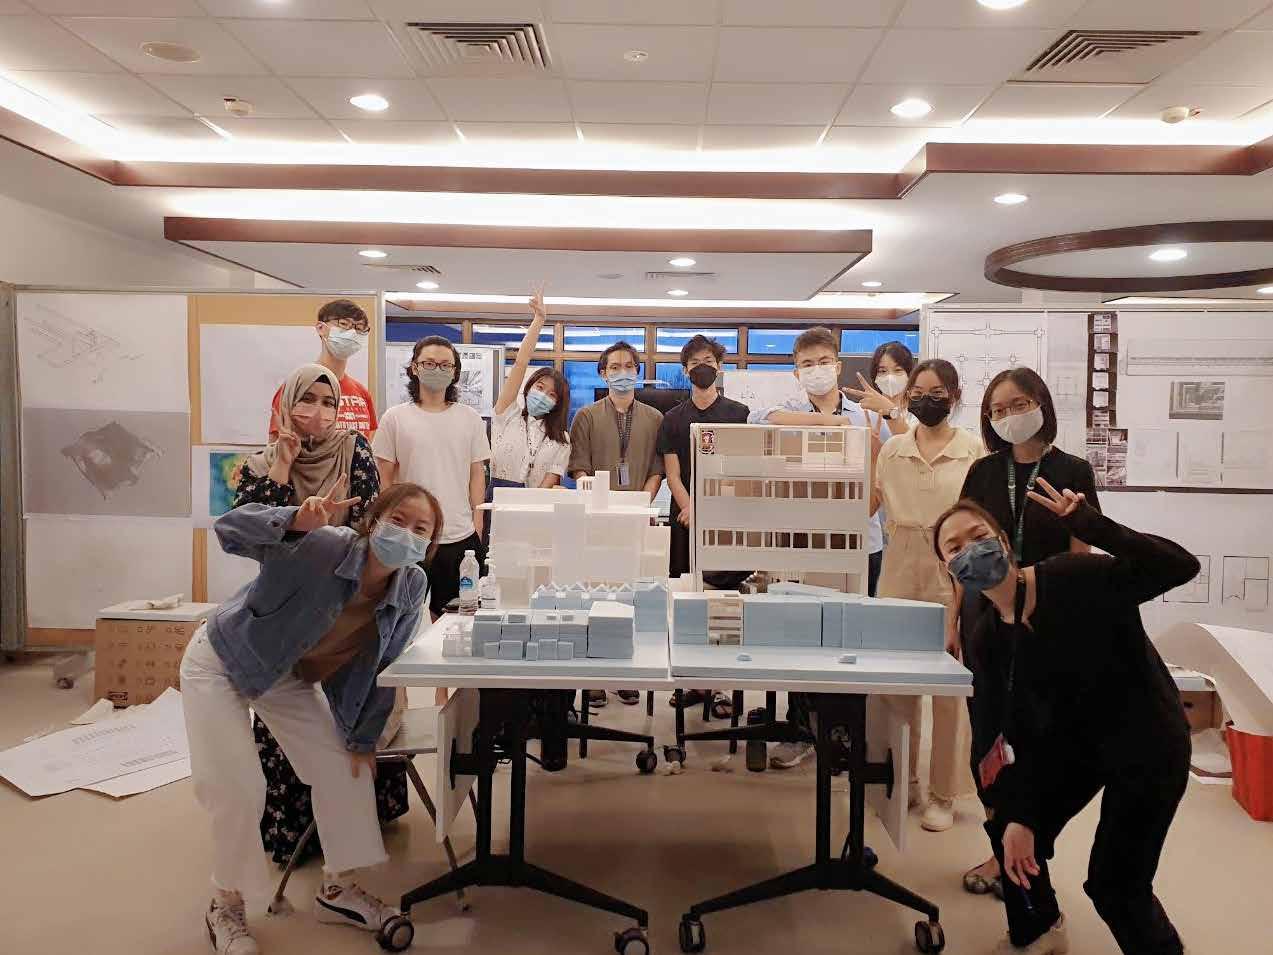
LIM YINSHI | GUEST REVIEWER
YANG HAN | INTERIM REVIEWER
YING YING | TEACHING TRAINEE
GANGHUA | TEACHING ASSISTANT
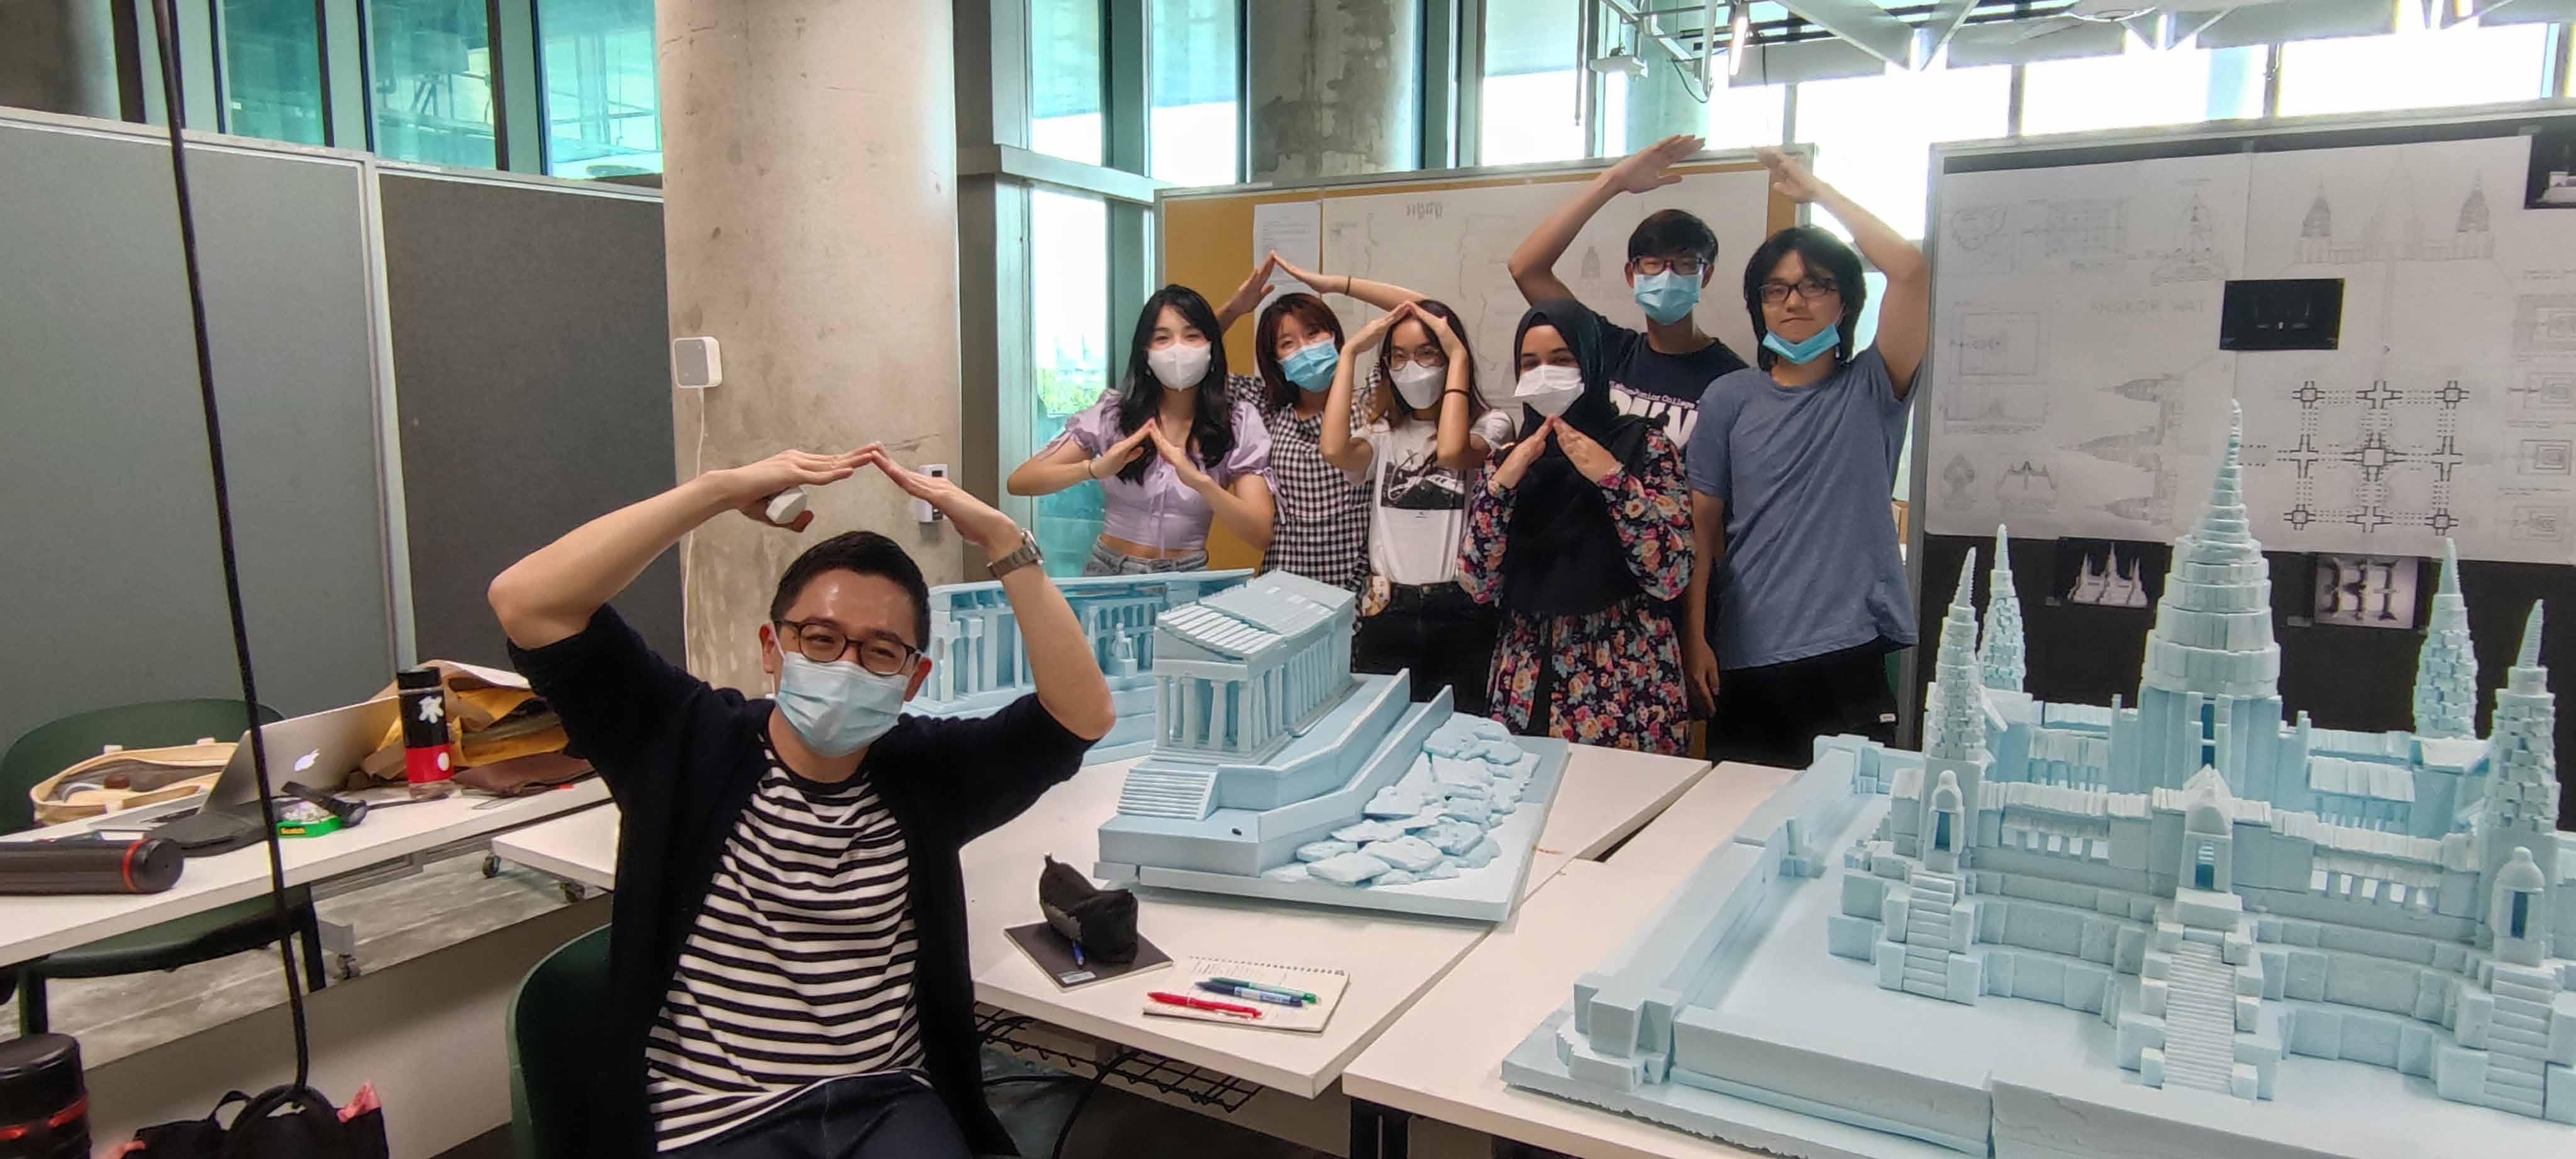
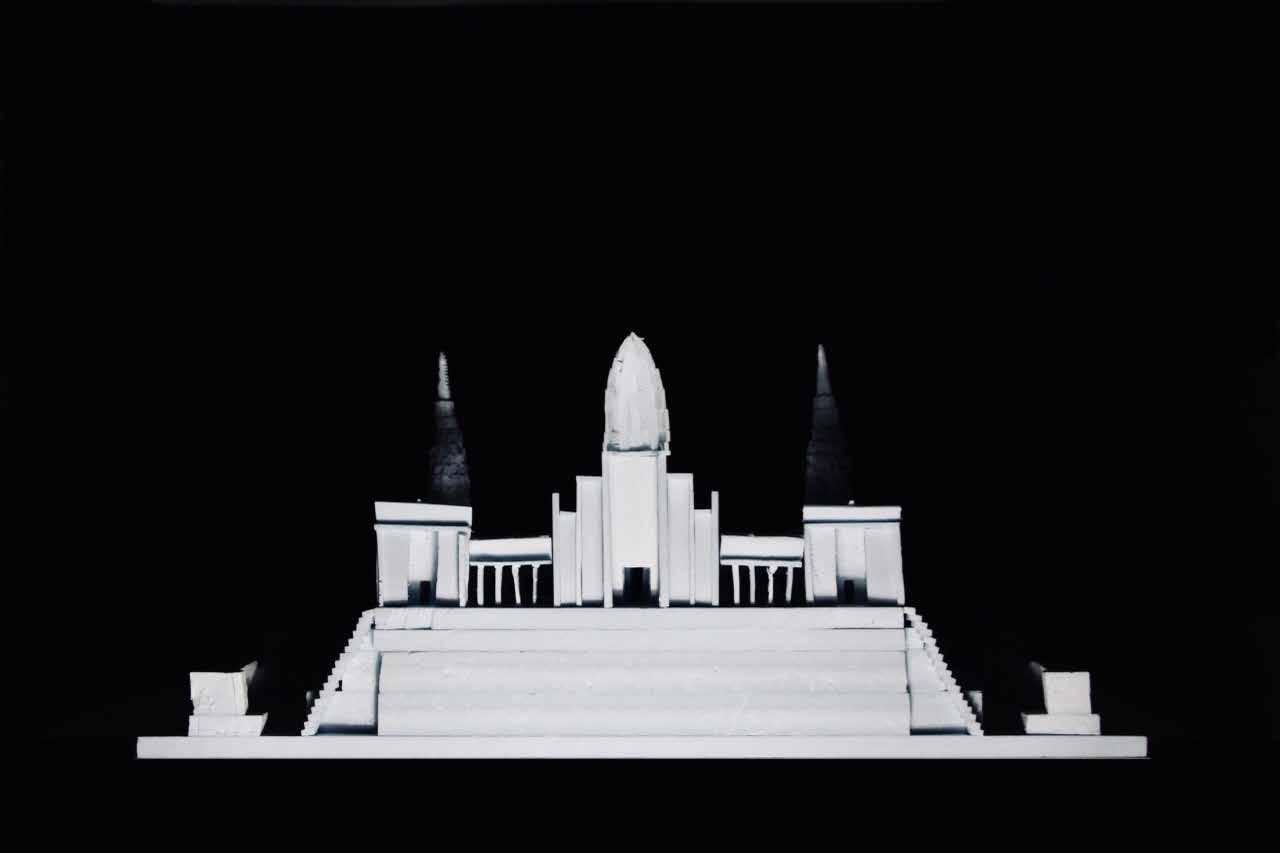
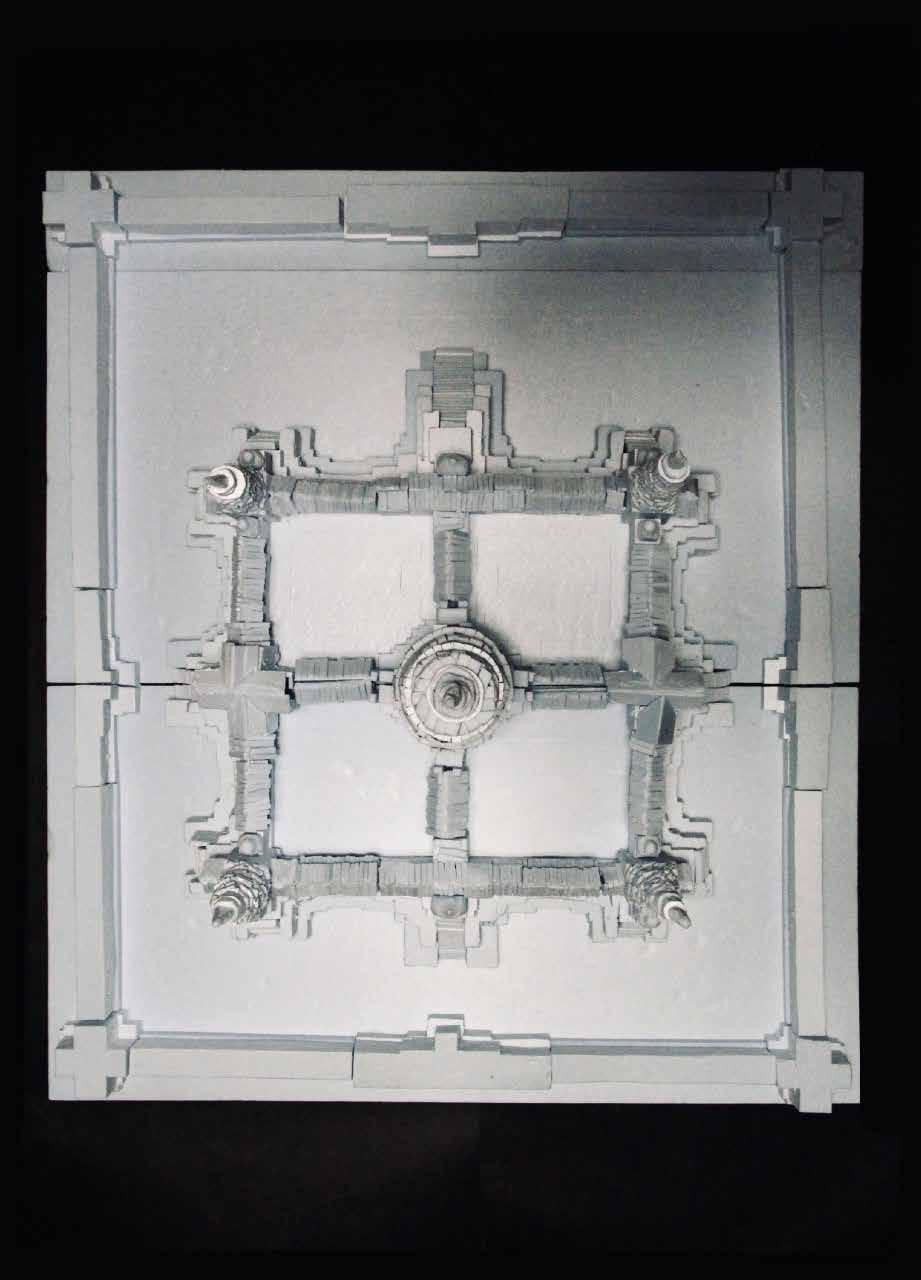
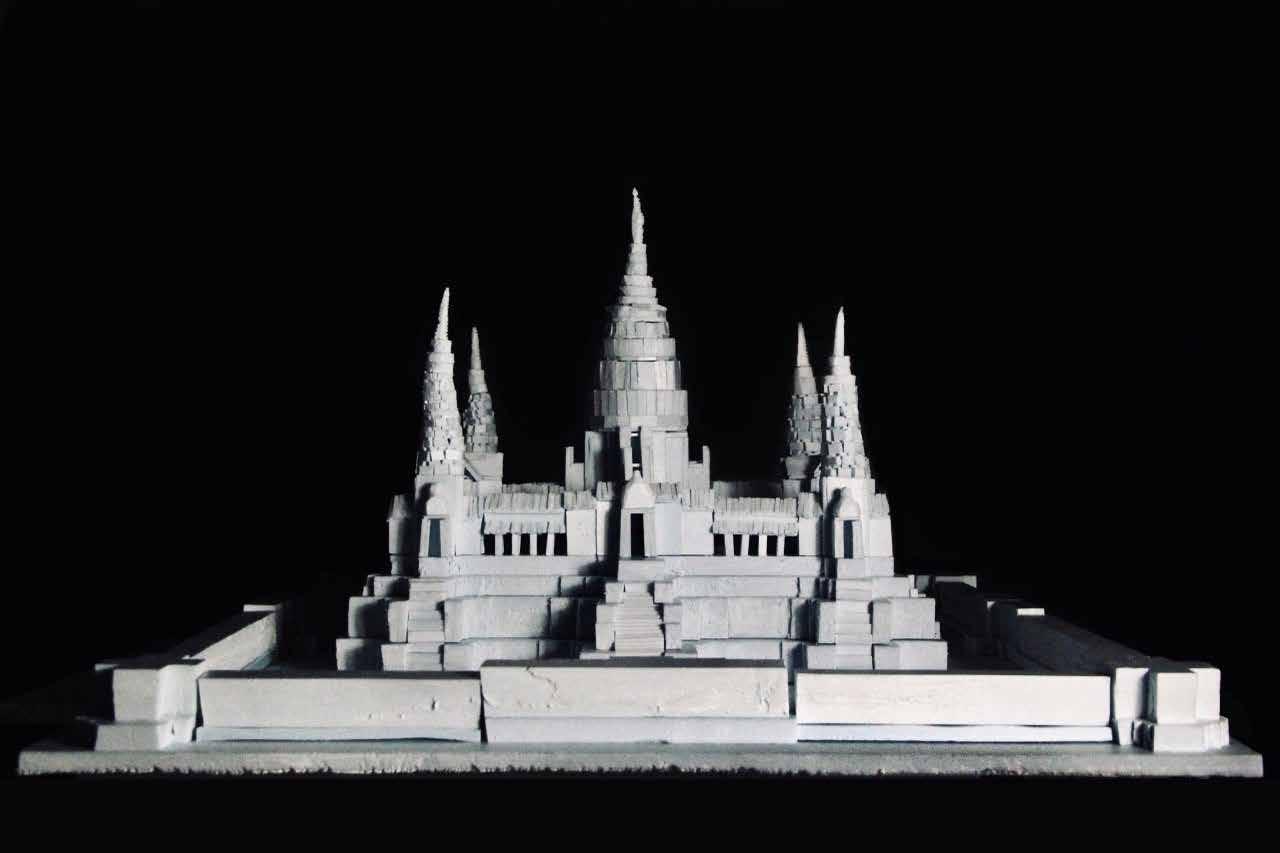
The semester started with the study of representation of Order and Geometry in Plans, Sections and Elevations of 2 places of worship, Angkor Wat and The Parthenon; One from the East and other from the West to appreciate Axis, Rhythm, Symmetry/ Asymmetry, Hierarchy, Repetition and Proportion. The making of architectural models enabled an understanding of tectonics and assemblage of parts whilst the presentation of the architectural drawings was an exploration in pencil drawing with a layout to encapsulate the architectural concept of these 2 places of worship.
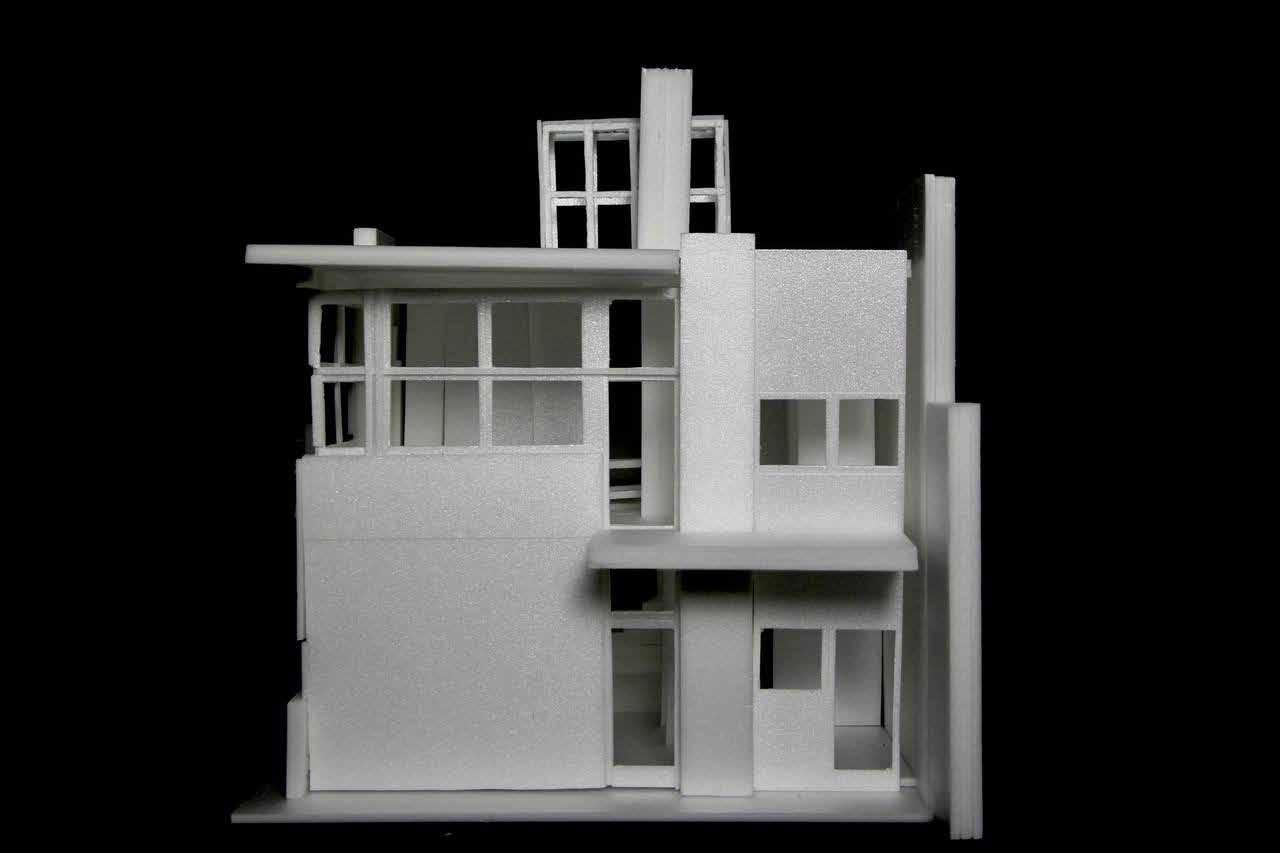
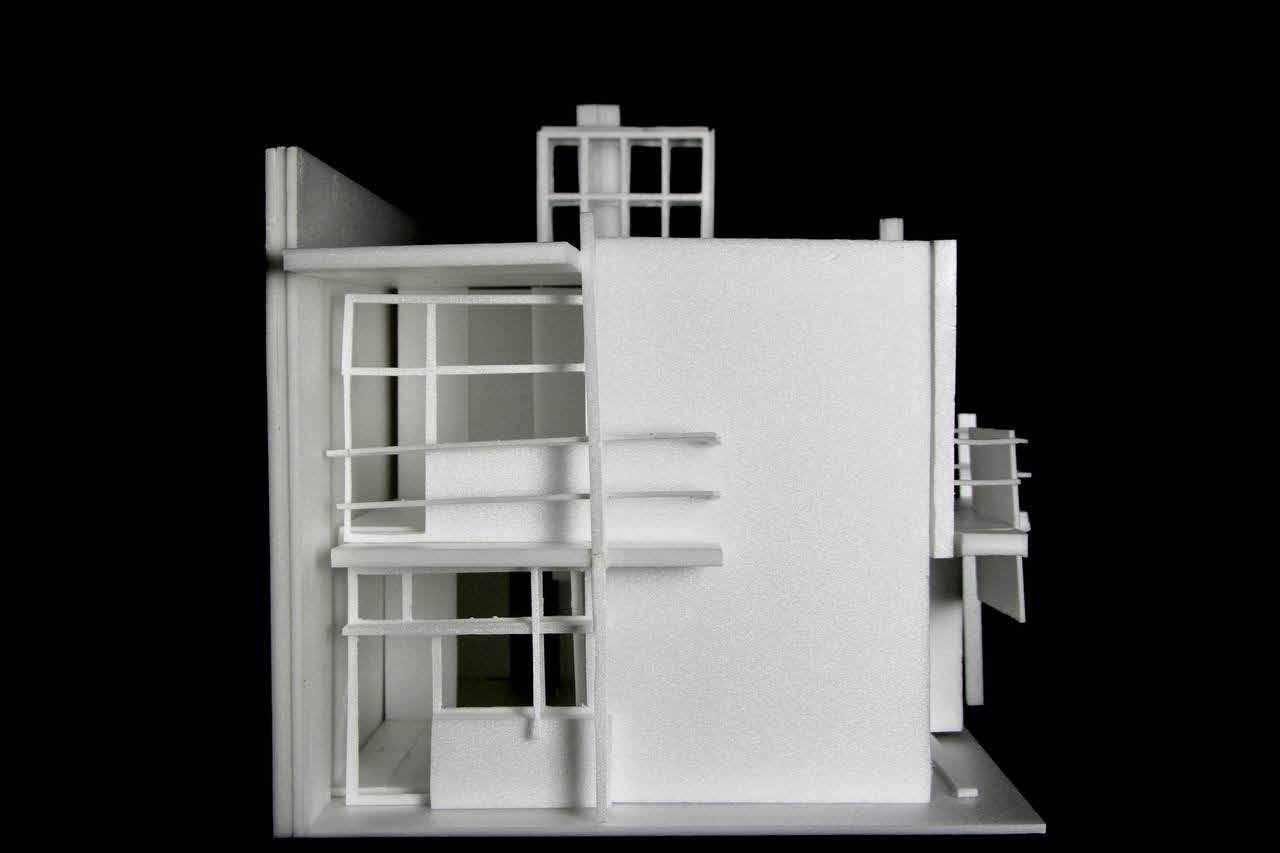
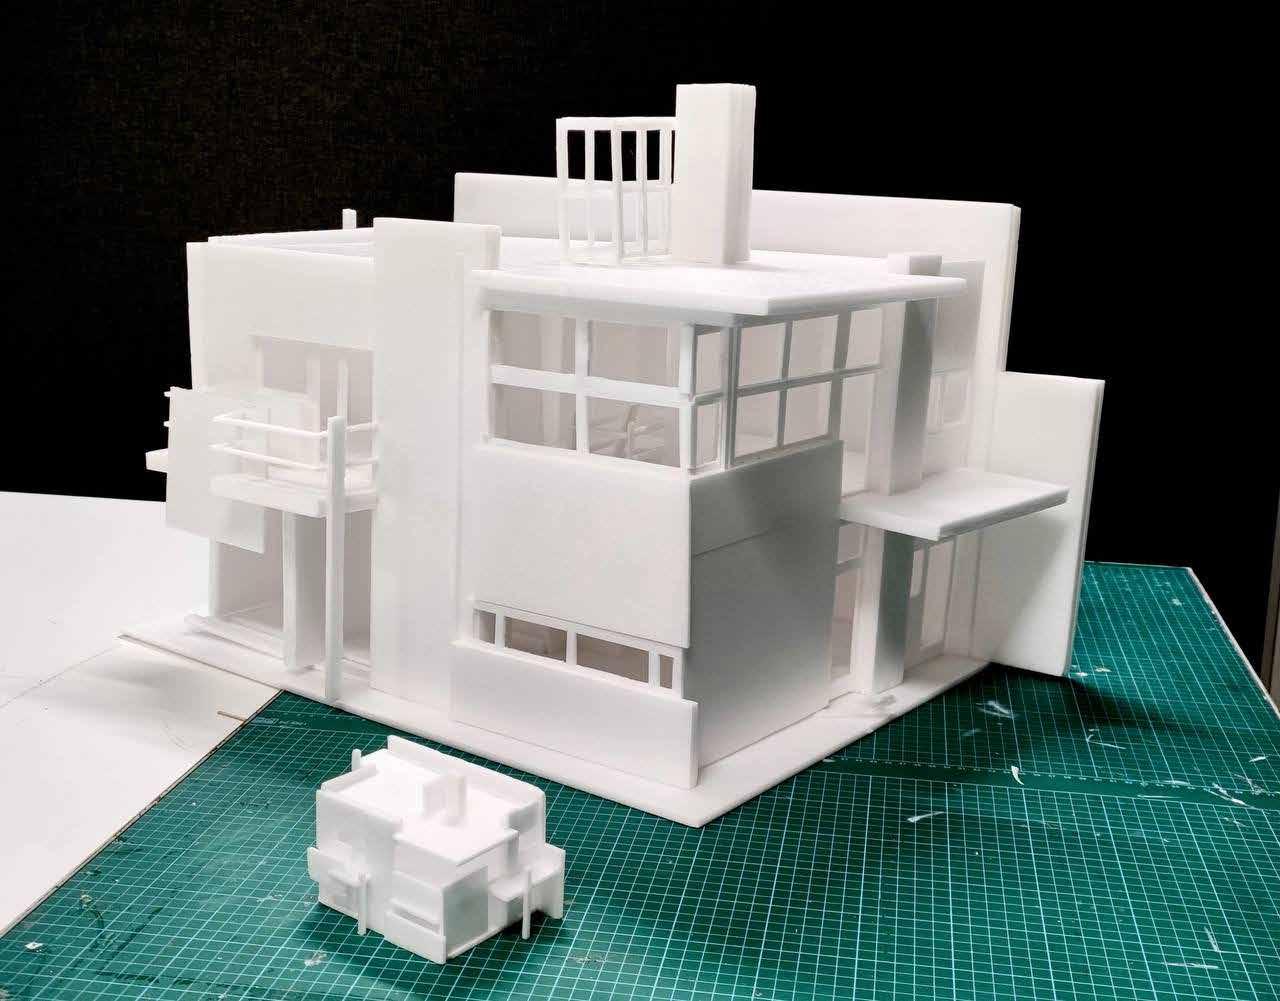
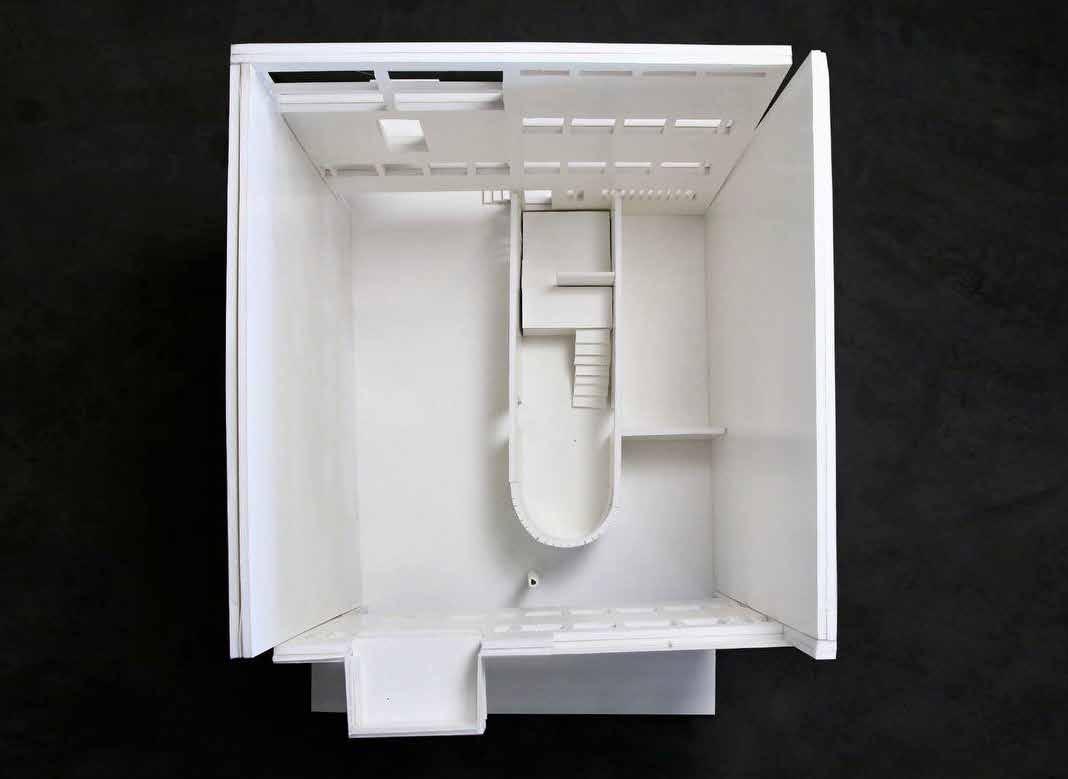
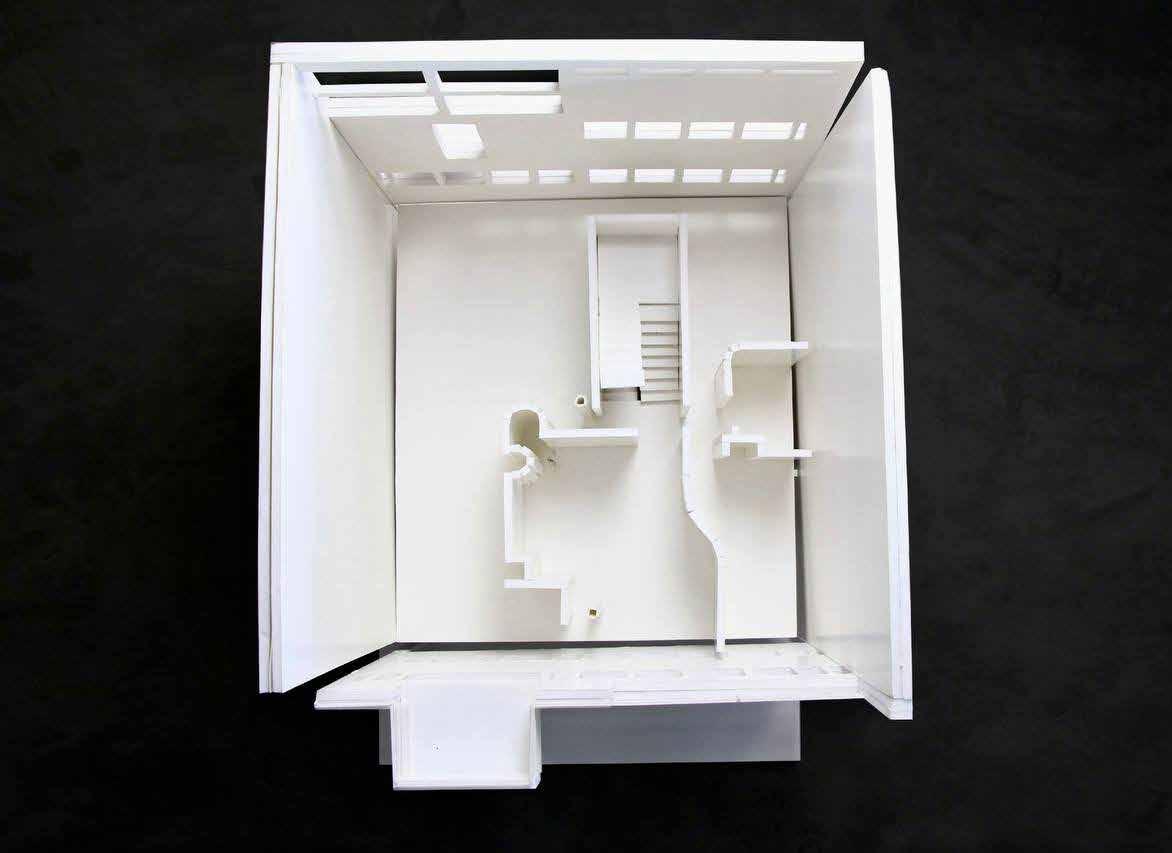
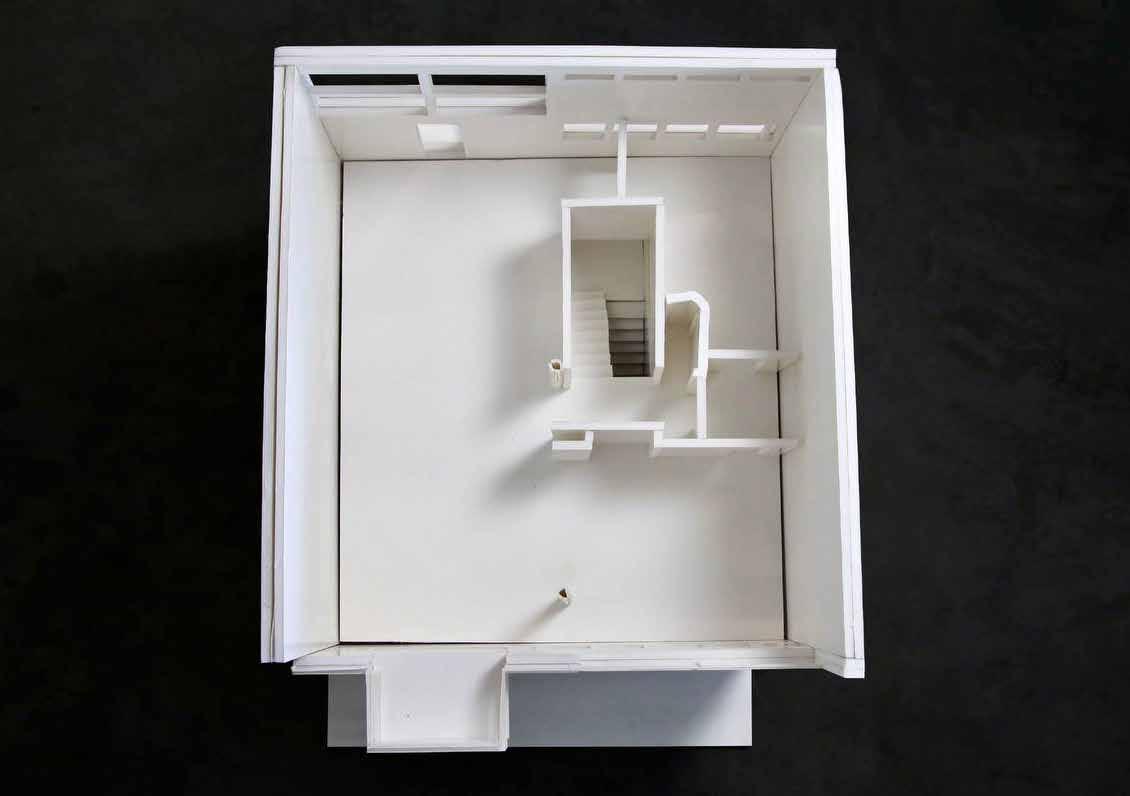
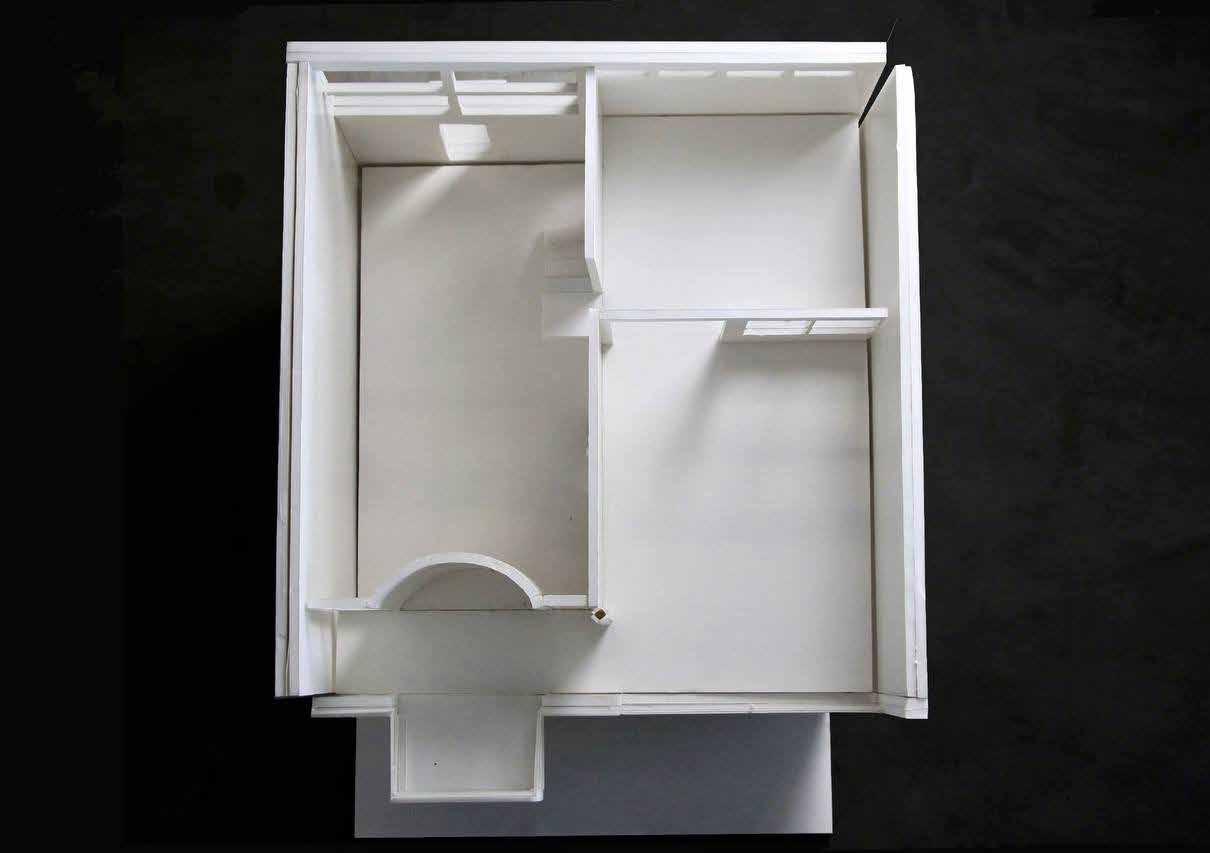
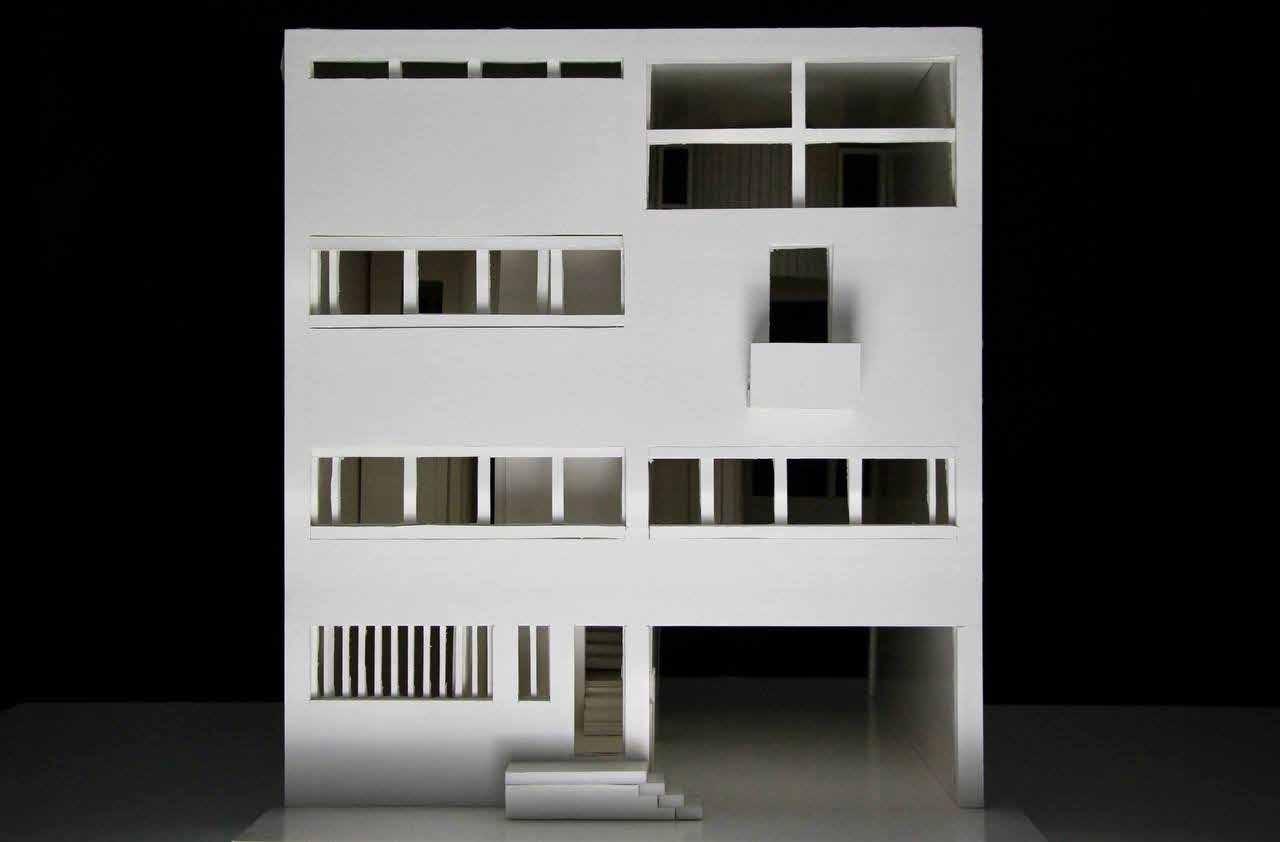
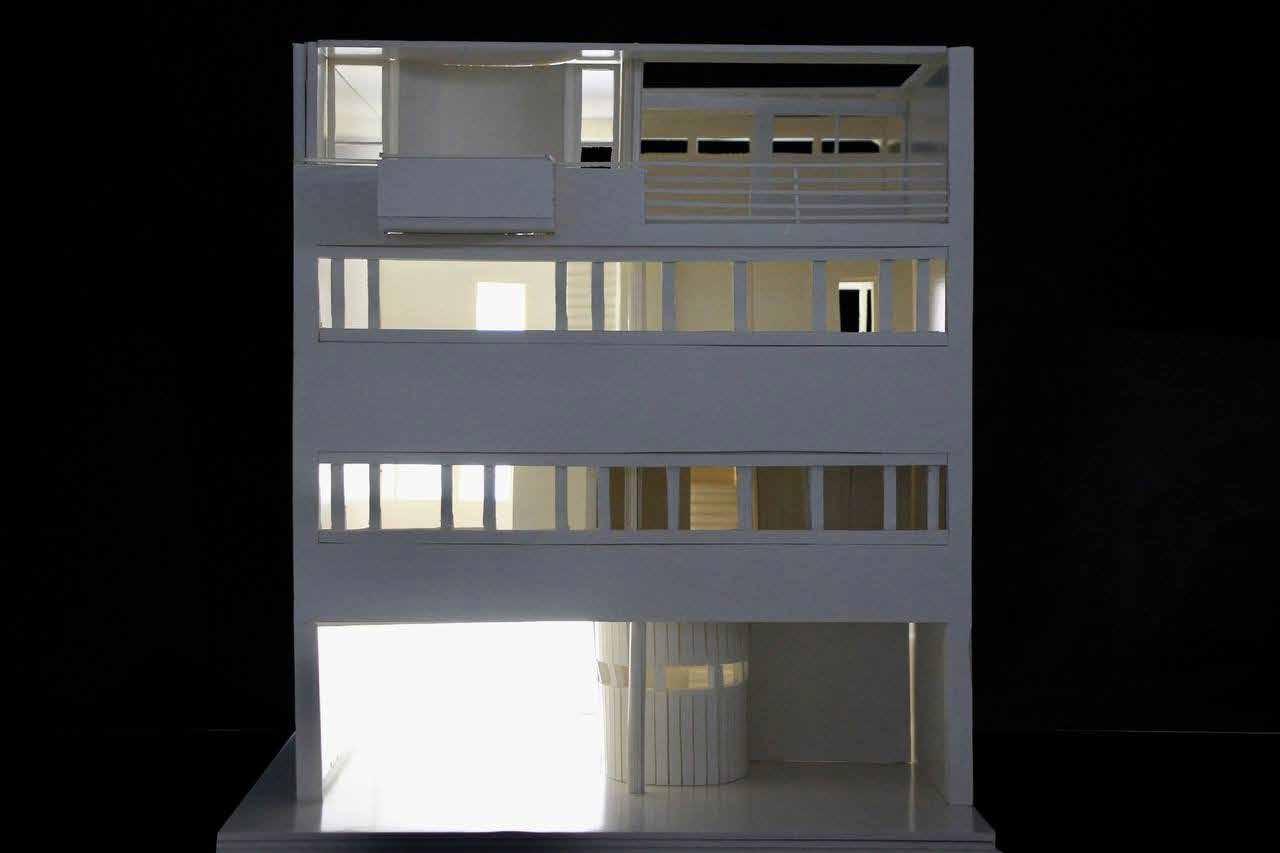
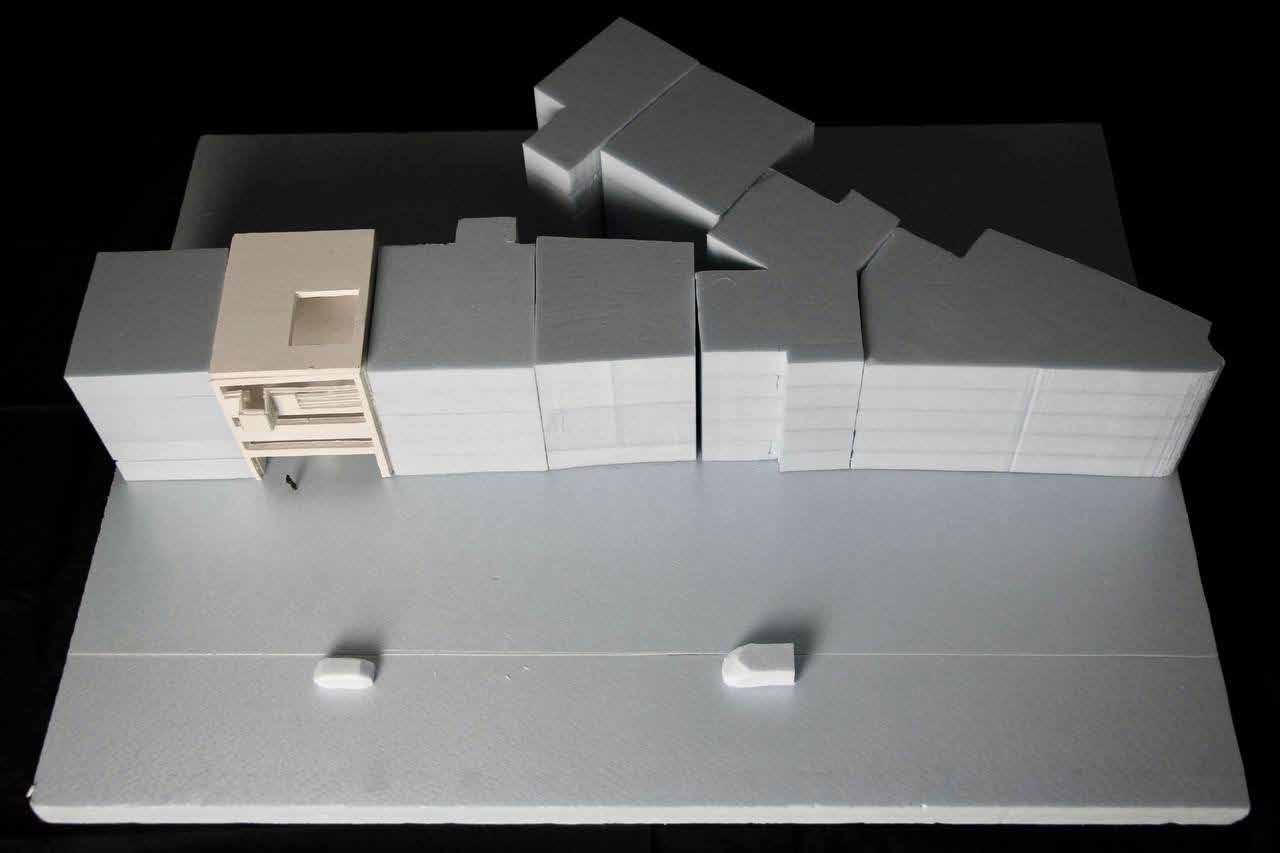
Following the above exercise, the Studio moved into the study of Parti and Space in Exploded Isometric and Axonometric in 2 works of Modernist Architecture to appreciate Form, Movement, Structure, Sequence and Private/ Public. Schroder House by Gerrit Rietveld and Maison Cook by Le Corbusier were selected as the pair of Modernist buildings. Pairing of the houses and studying them through drawings and model-making (both a detailed model in scale 1:20 and a context model in scale 1:100) enabled the studio to appreciate the sameness and differences of these 2 residential works of Modernist Architecture. The making of context models in the same scale as that of Angkor Wat and The Parthenon also enabled an appreciation of the monumental scale of the 2 places of worship when compared to the 2 places of residential use.
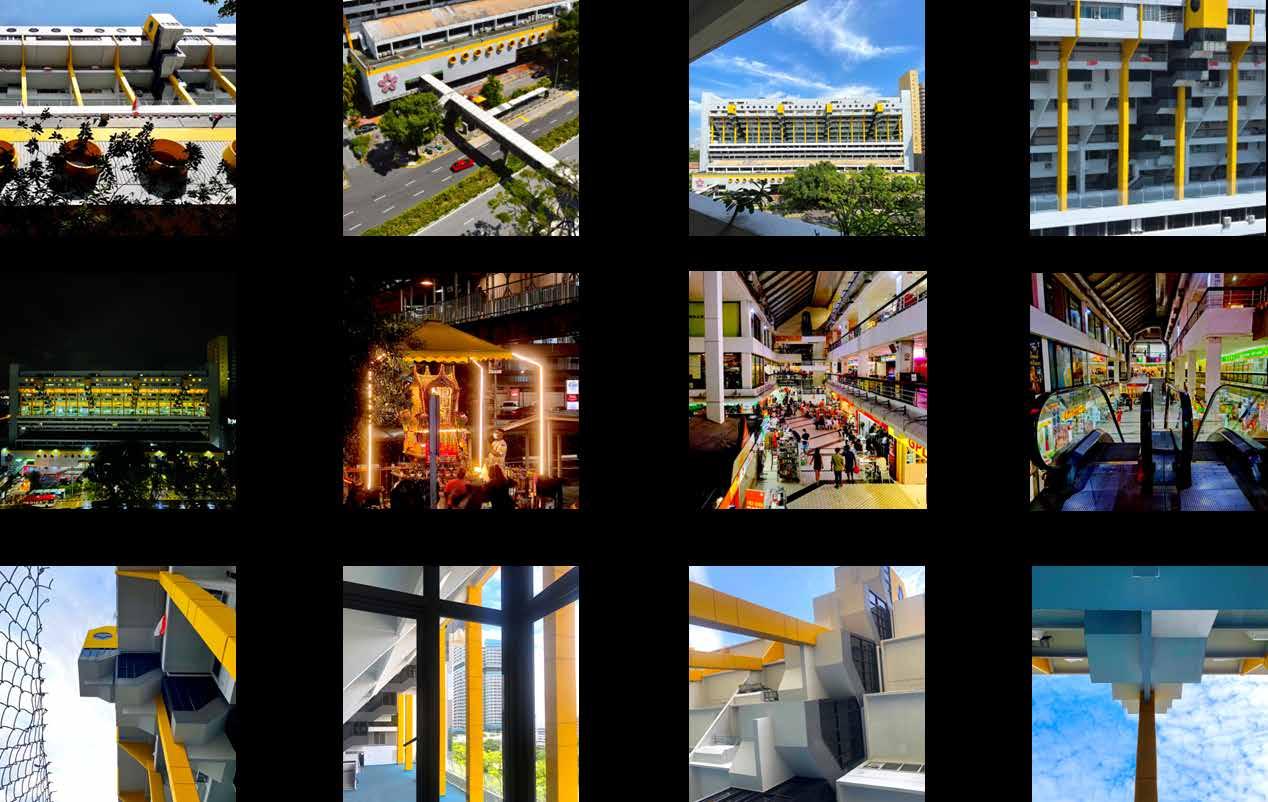
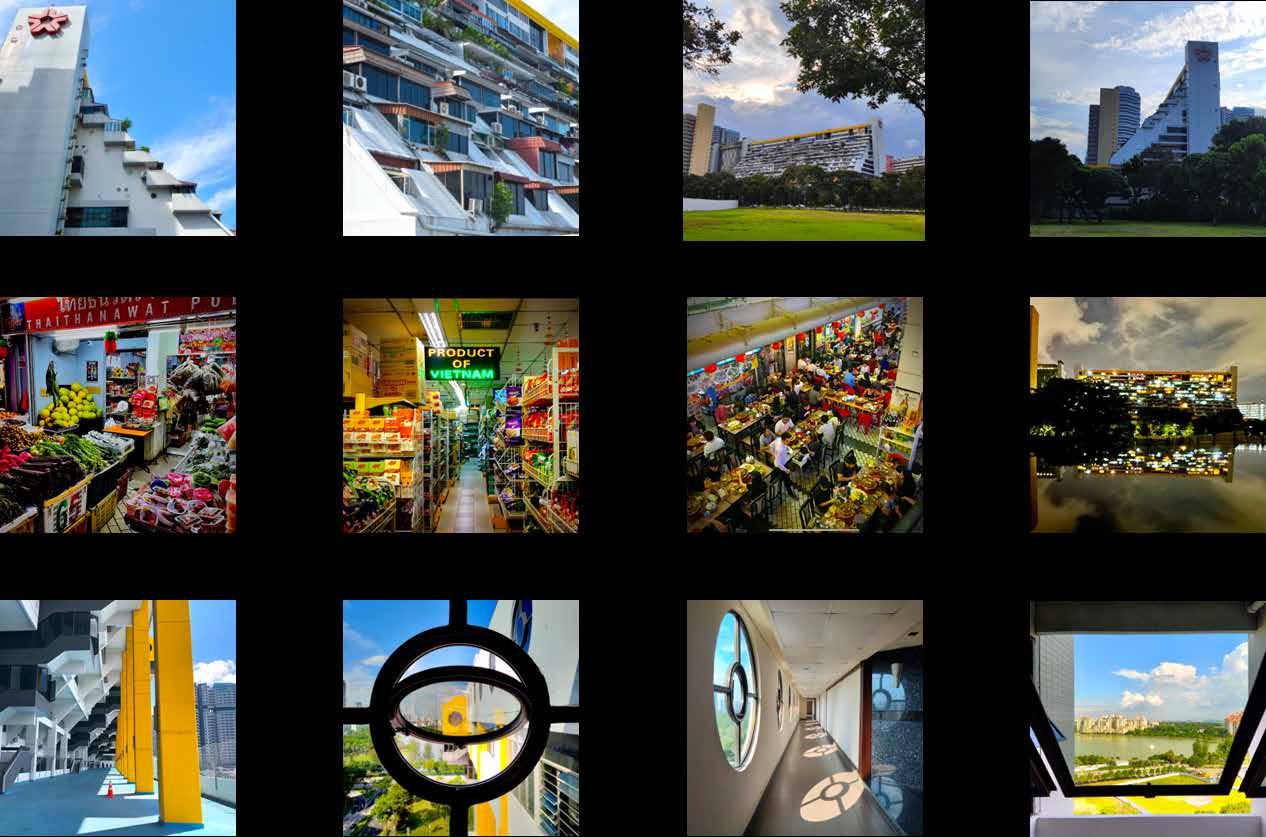
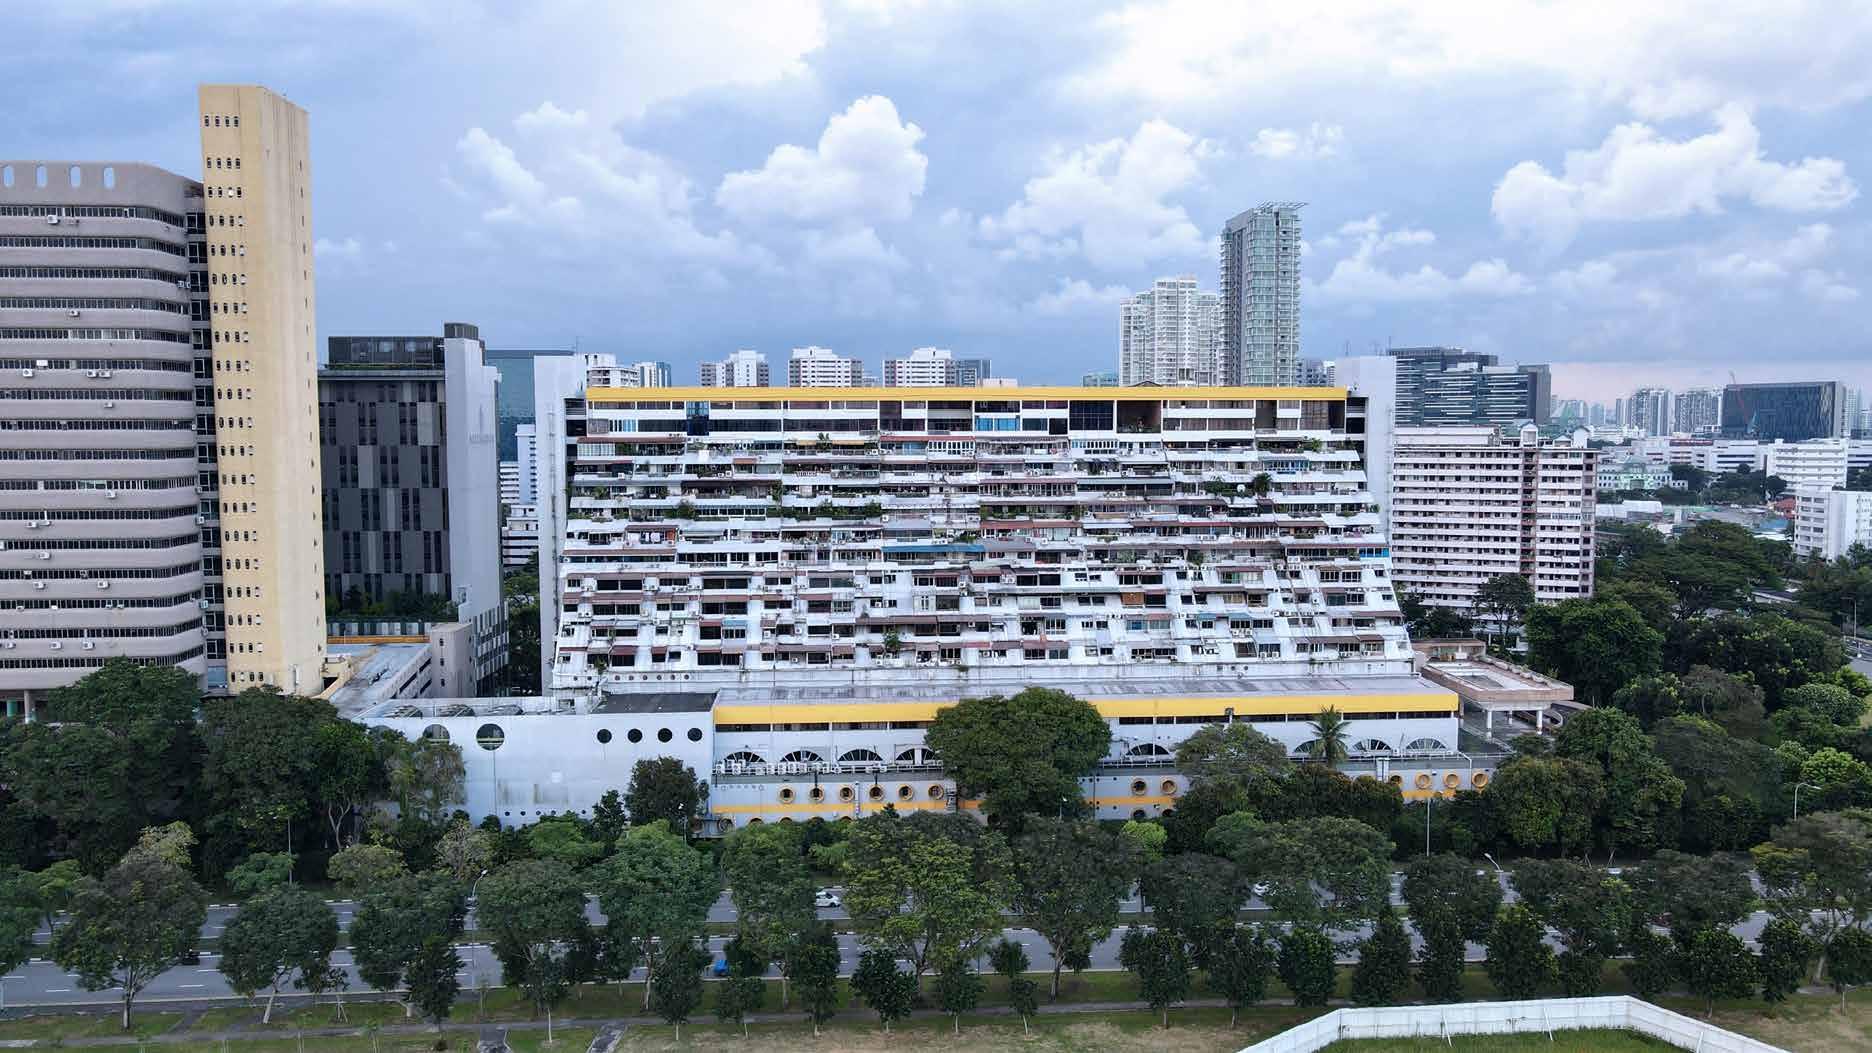
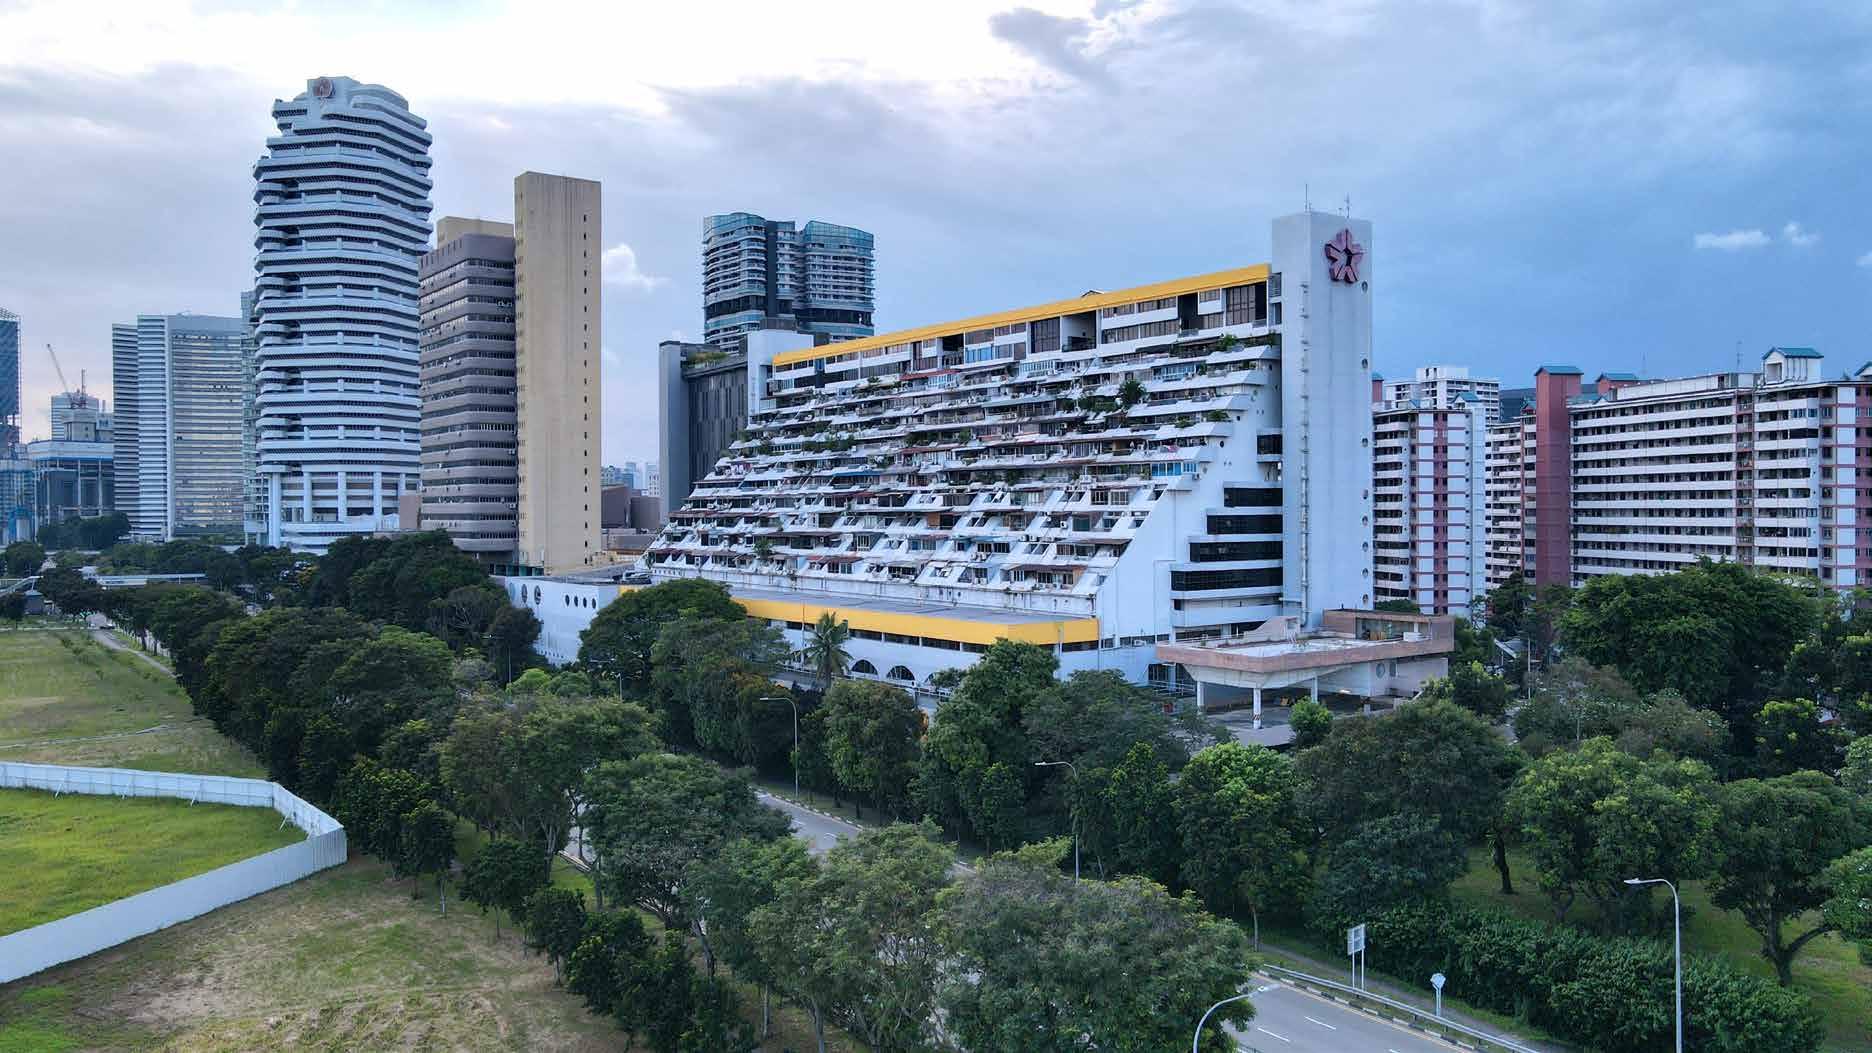
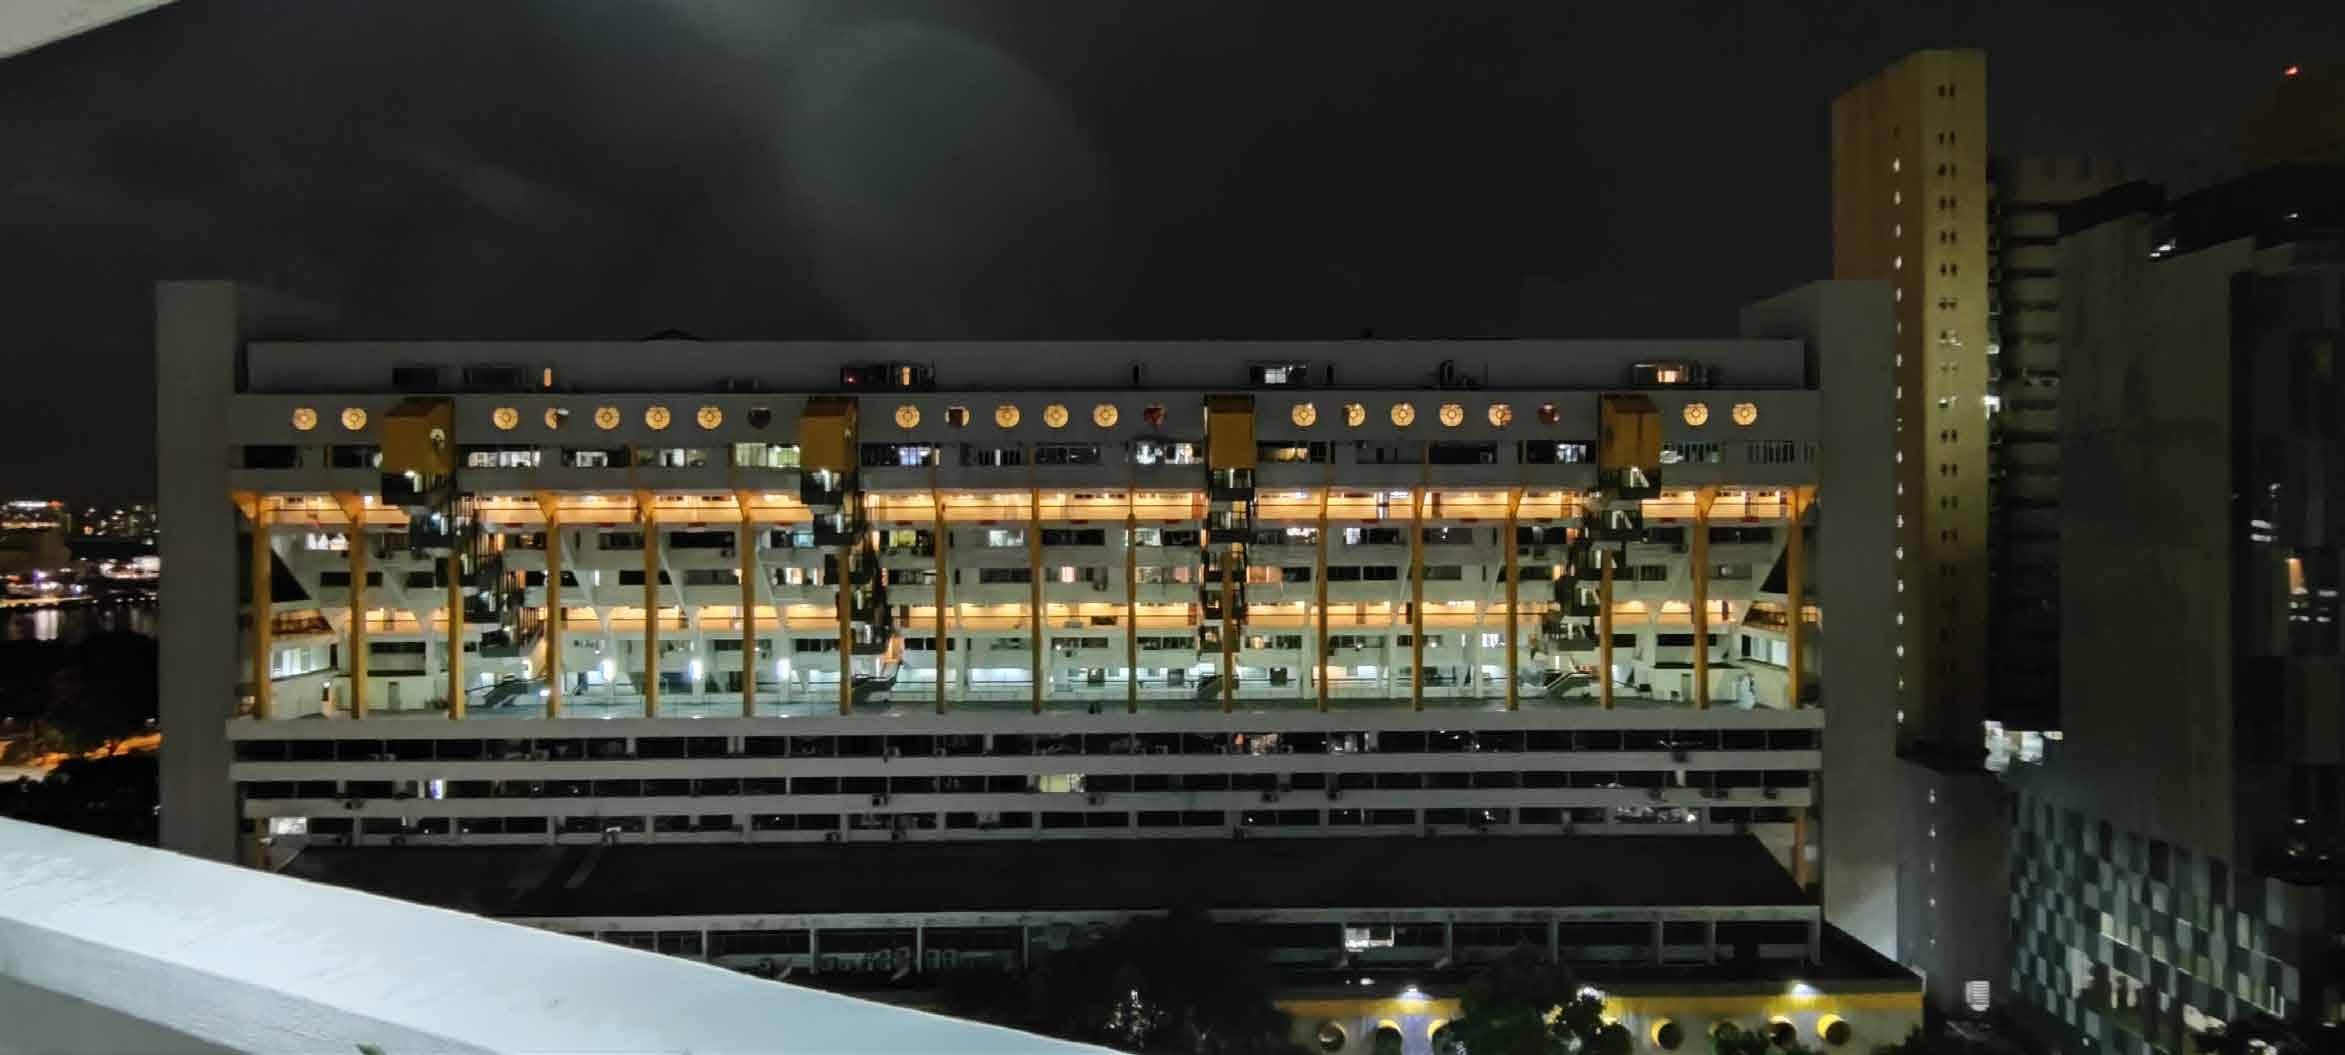
Moving past the Isometric and Axonometric in Modernist Architecture, the studio advanced into the study of representation of Interiority and Exteriority in Sectional Perspectives of an work of Early Independence Singaporean Architecture, Golden Mile Complex. Through site visits, the studio was exposed to the appreciation of Tectonics, Social, Urban Architecture Contexts, Building Systems, Interior and Exterior, Streetscapes, Entries, Approaches and Arrival. The exercise lead to a series of interior perspectives ‘stitched’ together for a narrative of City Living.
The semester culminated in Computational Design Thinking through 3 exercises. Exercise 1 was Data Collection of patterns of movement in a bus-stop. A simple exercise in mapping with identified forces applied on a responsive material resulting in 3D model which was measured manually and translated into a hand drafted drawing and other drawing made digitally for a comparative study. Exercise 2 was a Coding Exercise on Infogram with the objective to introduce information systems and the methods of how they can be represented in other language syntax through logical abstraction; a 2D Infogram was identified resulting in a ‘Field of Codes’ for the identified infogram. Exercise 3 similarly adopted the use of a responsive material, like the earlier Exercise 1 but with greater complexity, that provided ‘feedback’ depending on the ‘actions’ made in relation to the ‘codes’. The exercise was akin to a primitive digital medium working in a real environment. The feeding of ‘actions’ onto a responsive material resulted in a 3D model which was further translated into models of non-responsive unit materials via 3D scanning of the 3D model.
The last exercises enabled the full appreciation of Design Thinking in the abstraction of information behind Computational Design and this methodology of form generation. It too closed the loop of seeing, drawing, thinking and making and the appreciation of materiality.
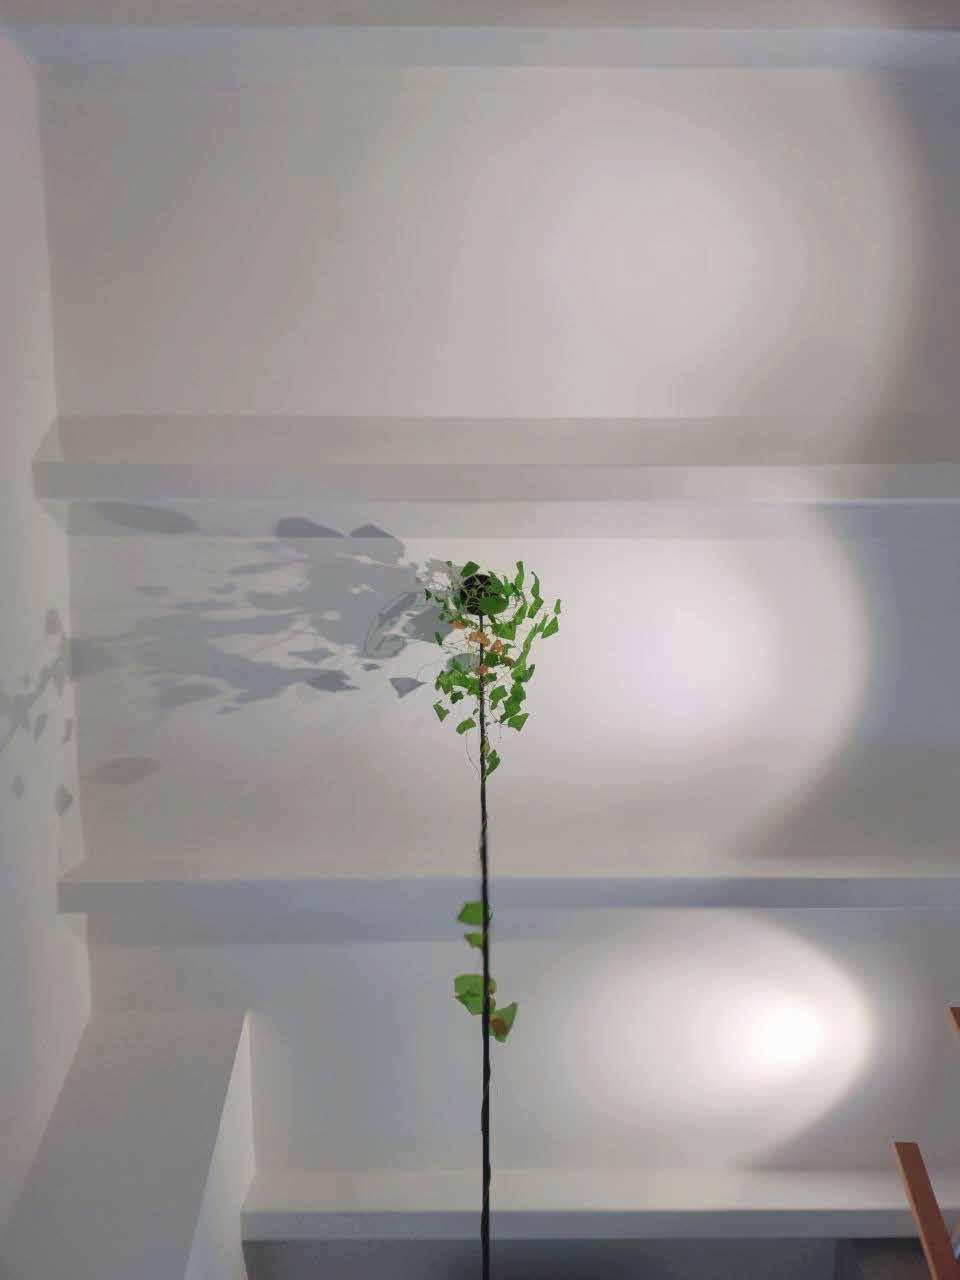

A good drawing evidences observation in documentation, clarity in thinking, virtuosity in precision and ingenuity in execution. Being equipped with ways to see and think sits at the core of this topic. To understand architectural representation is about the content as much as it is about finding the best way to convey intent and thought processes through drawing, rendering and model making.
ARCHITECTURAL REPRESENTATION (3 bi-weekly assignments)
Discover: Orthography, Grid, Axis, Rhythm, Symmetry, Hierarchy, Form, Proportion, Stereotomy, Human-centric, user experience, possible solutions
“Geometry is the language of man...he has discovered rhythms, rhythms apparent to the eye and clear in their relations with one another. And these rhythms are at the very root of human activities. They resound in man by organic inevitability, the same fine inevitability which causes the tracing out of the Golden Section by children, old men, savages and the learned.” -----Le Corbusier, Towards A New Architecture, 1931
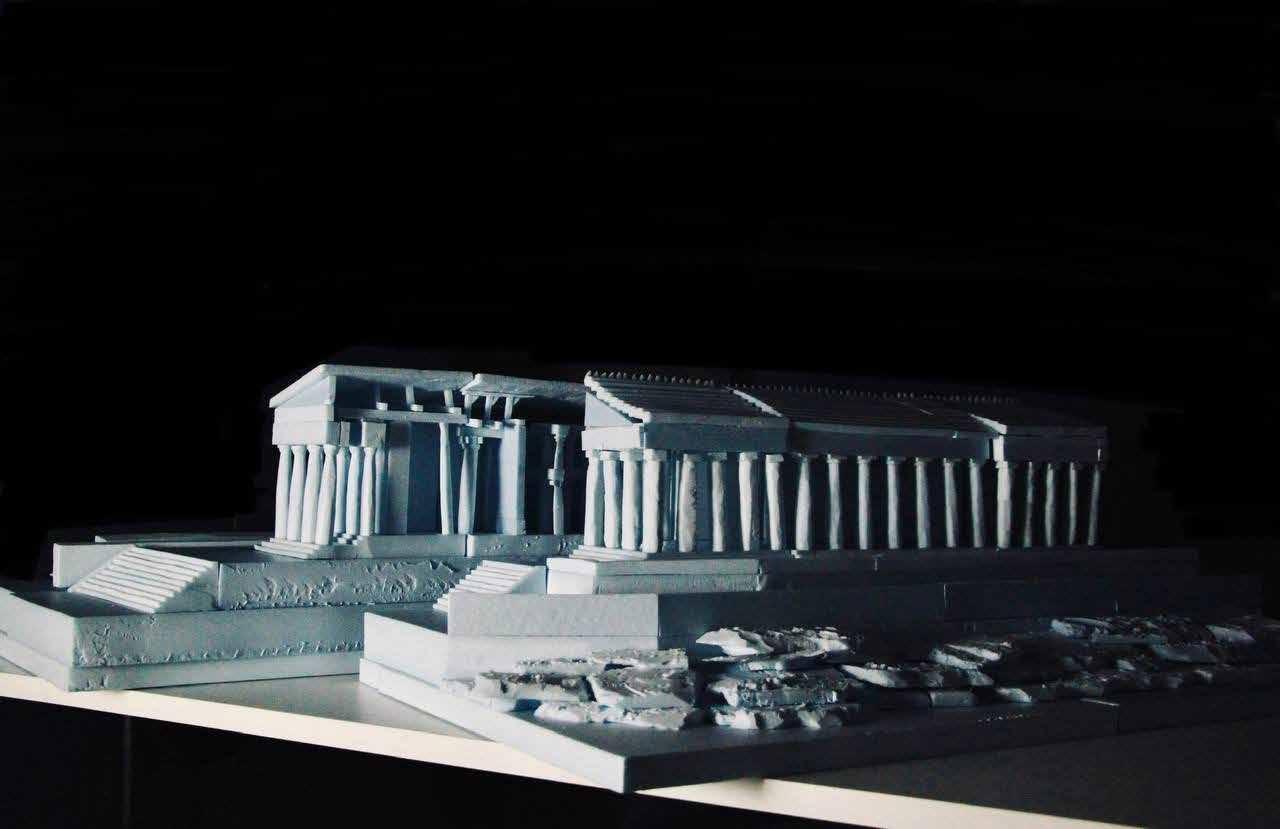
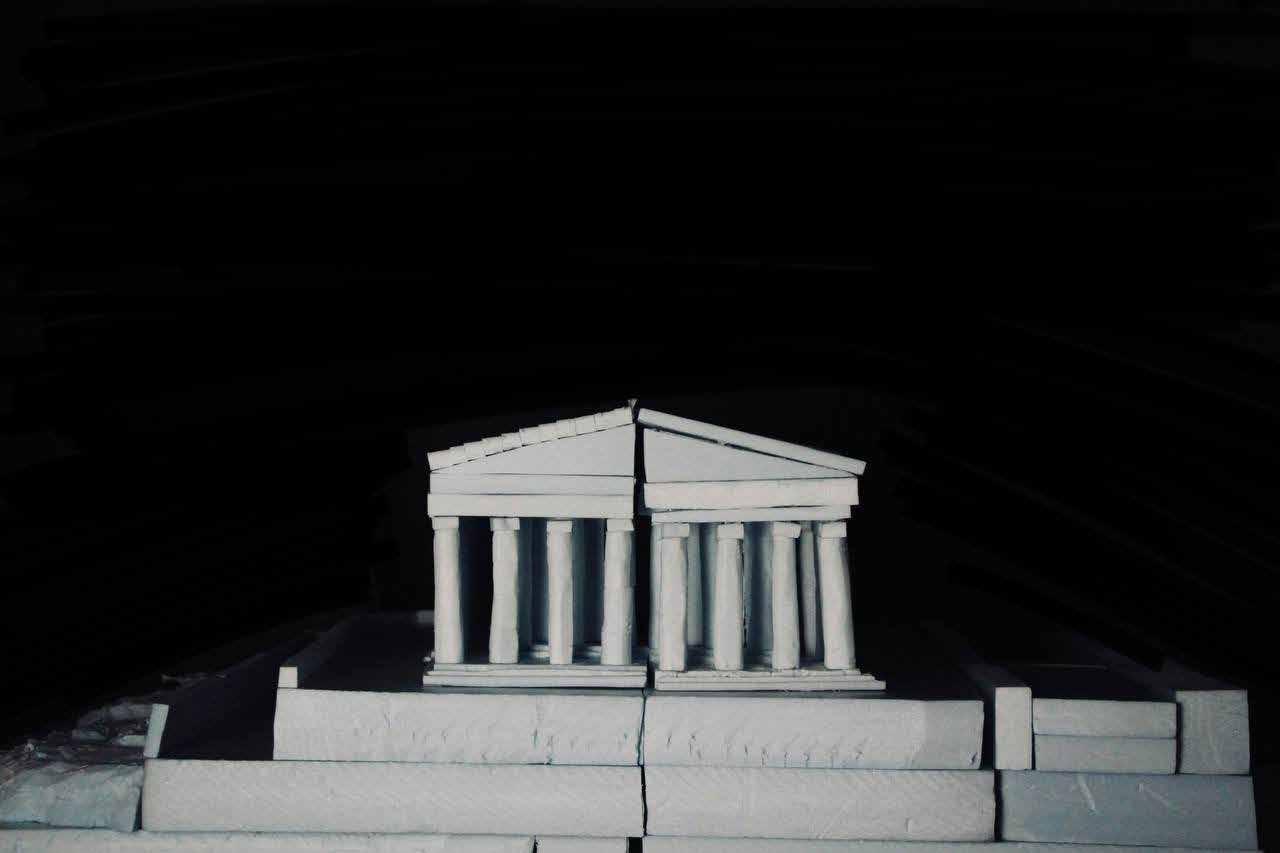
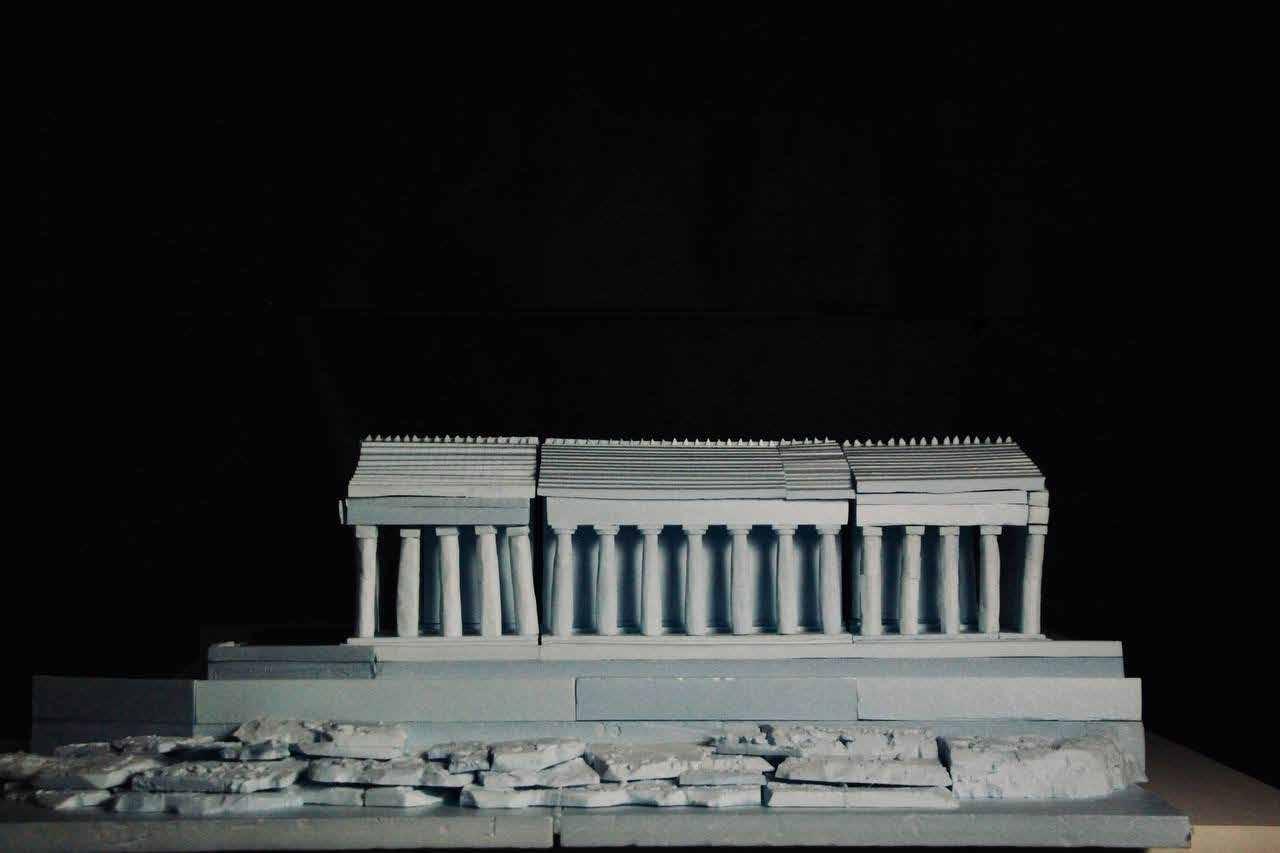
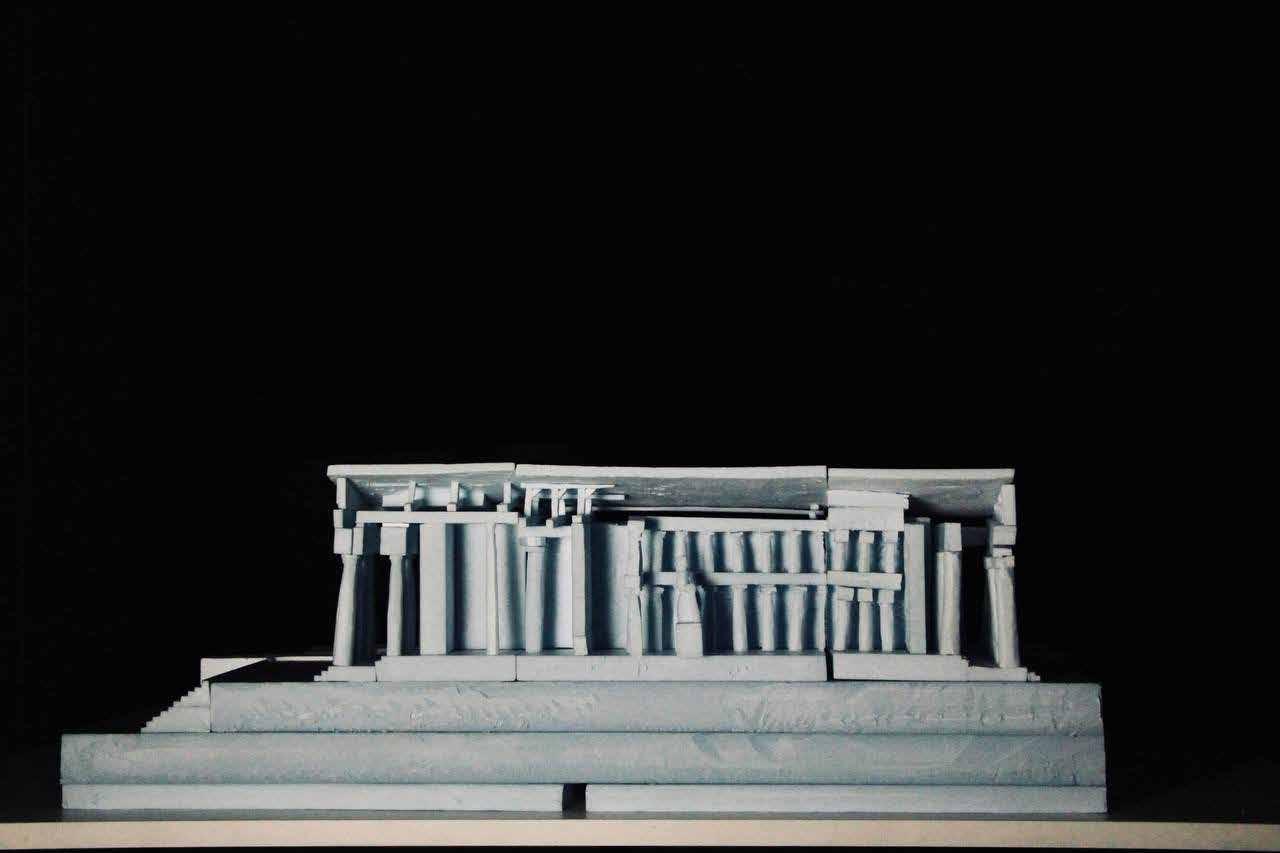
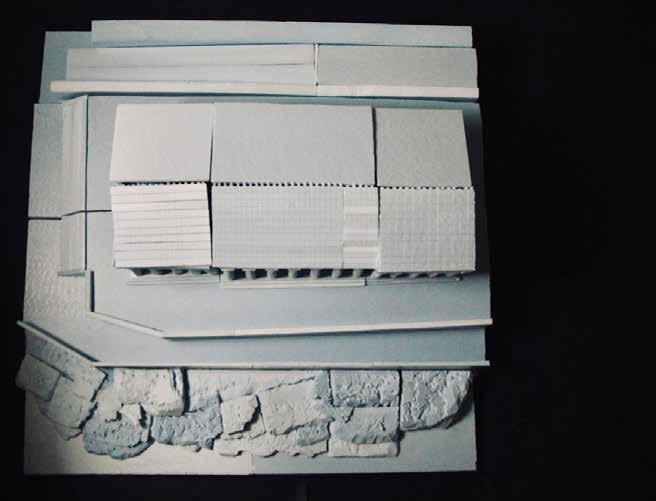
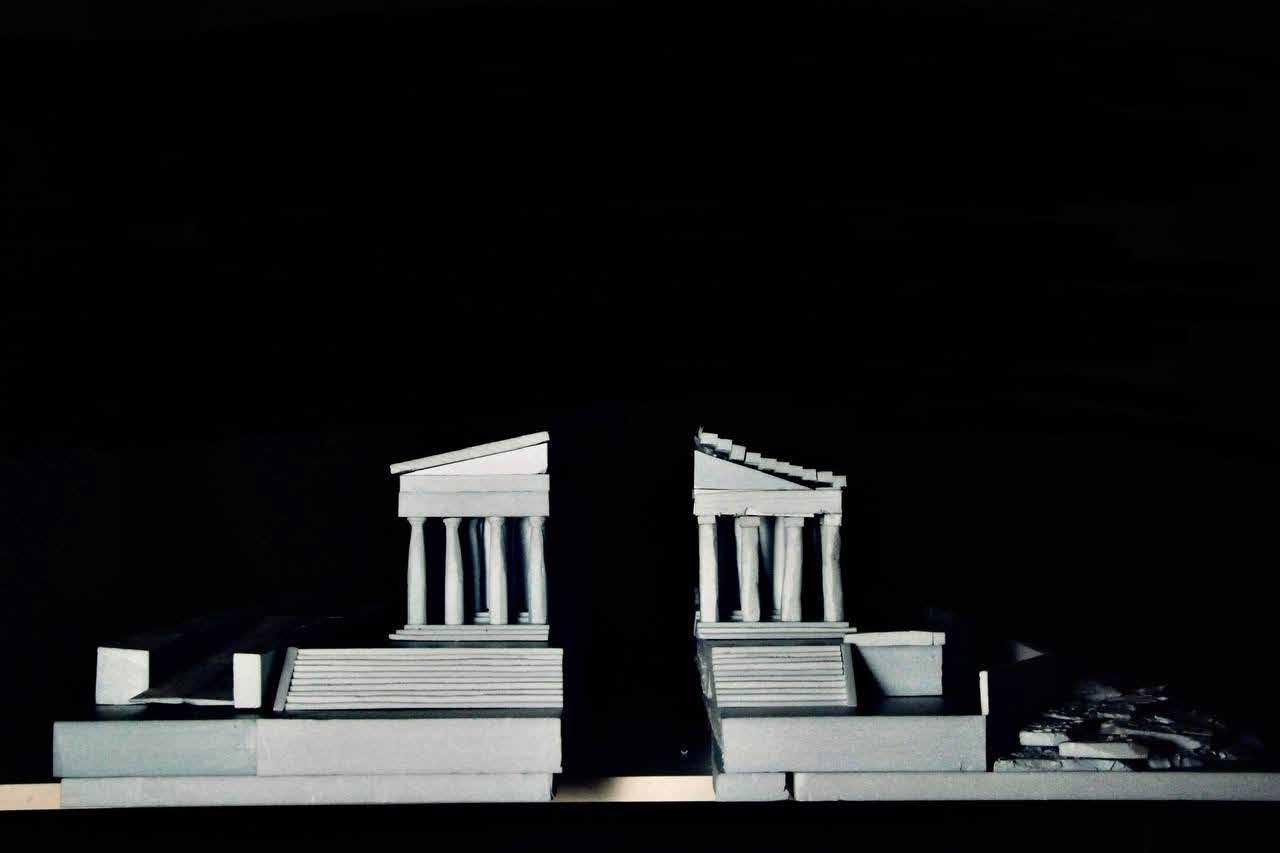
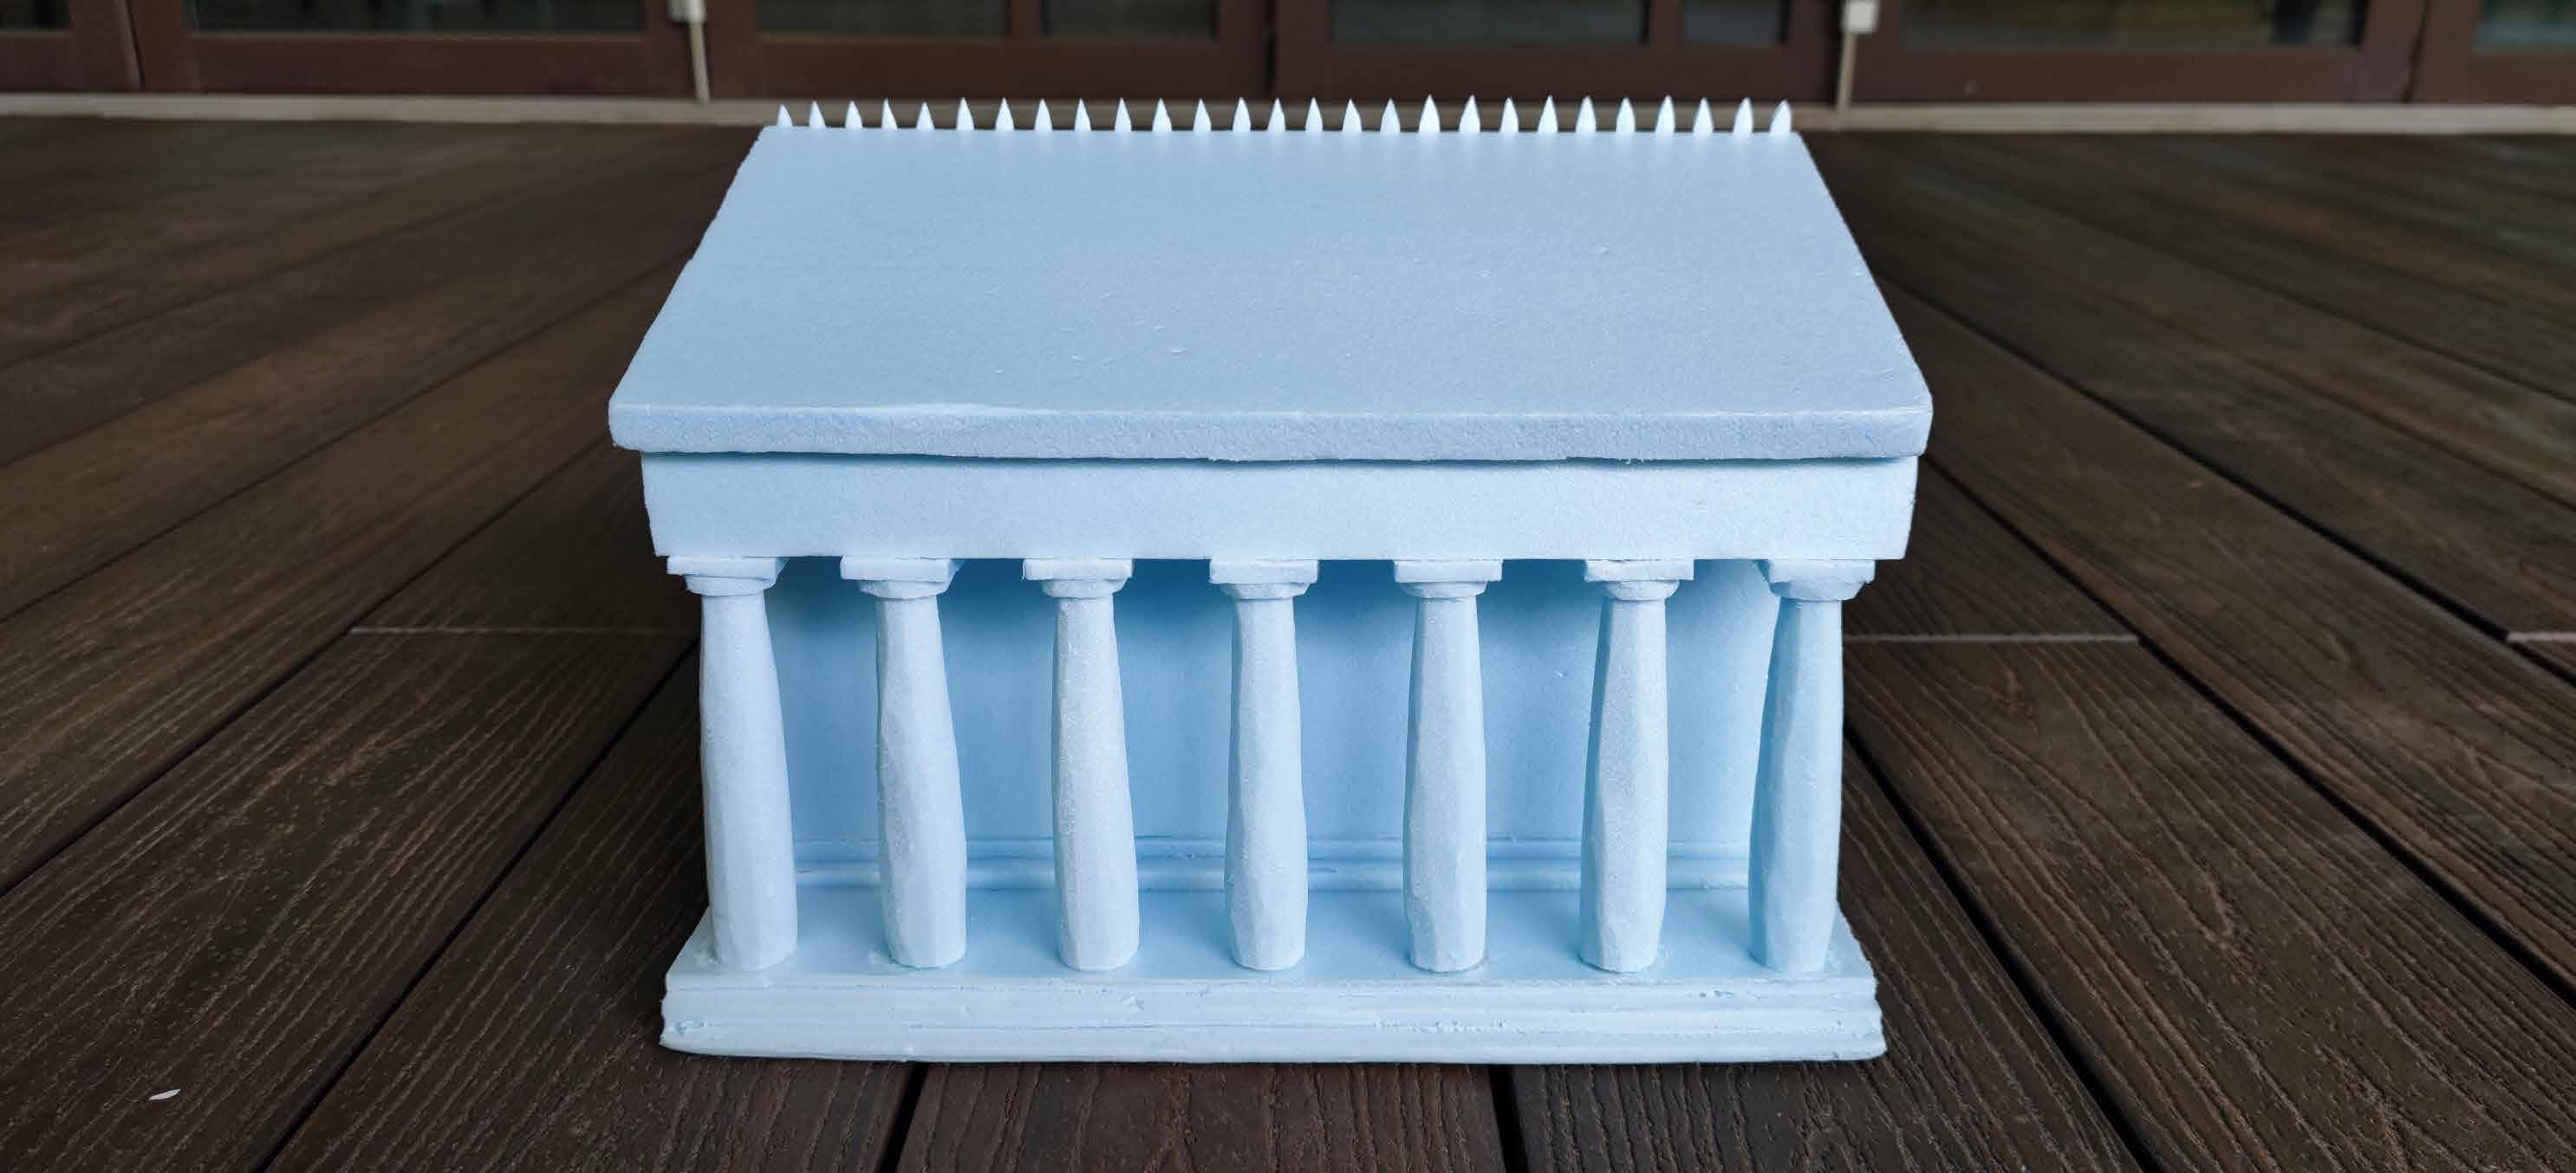
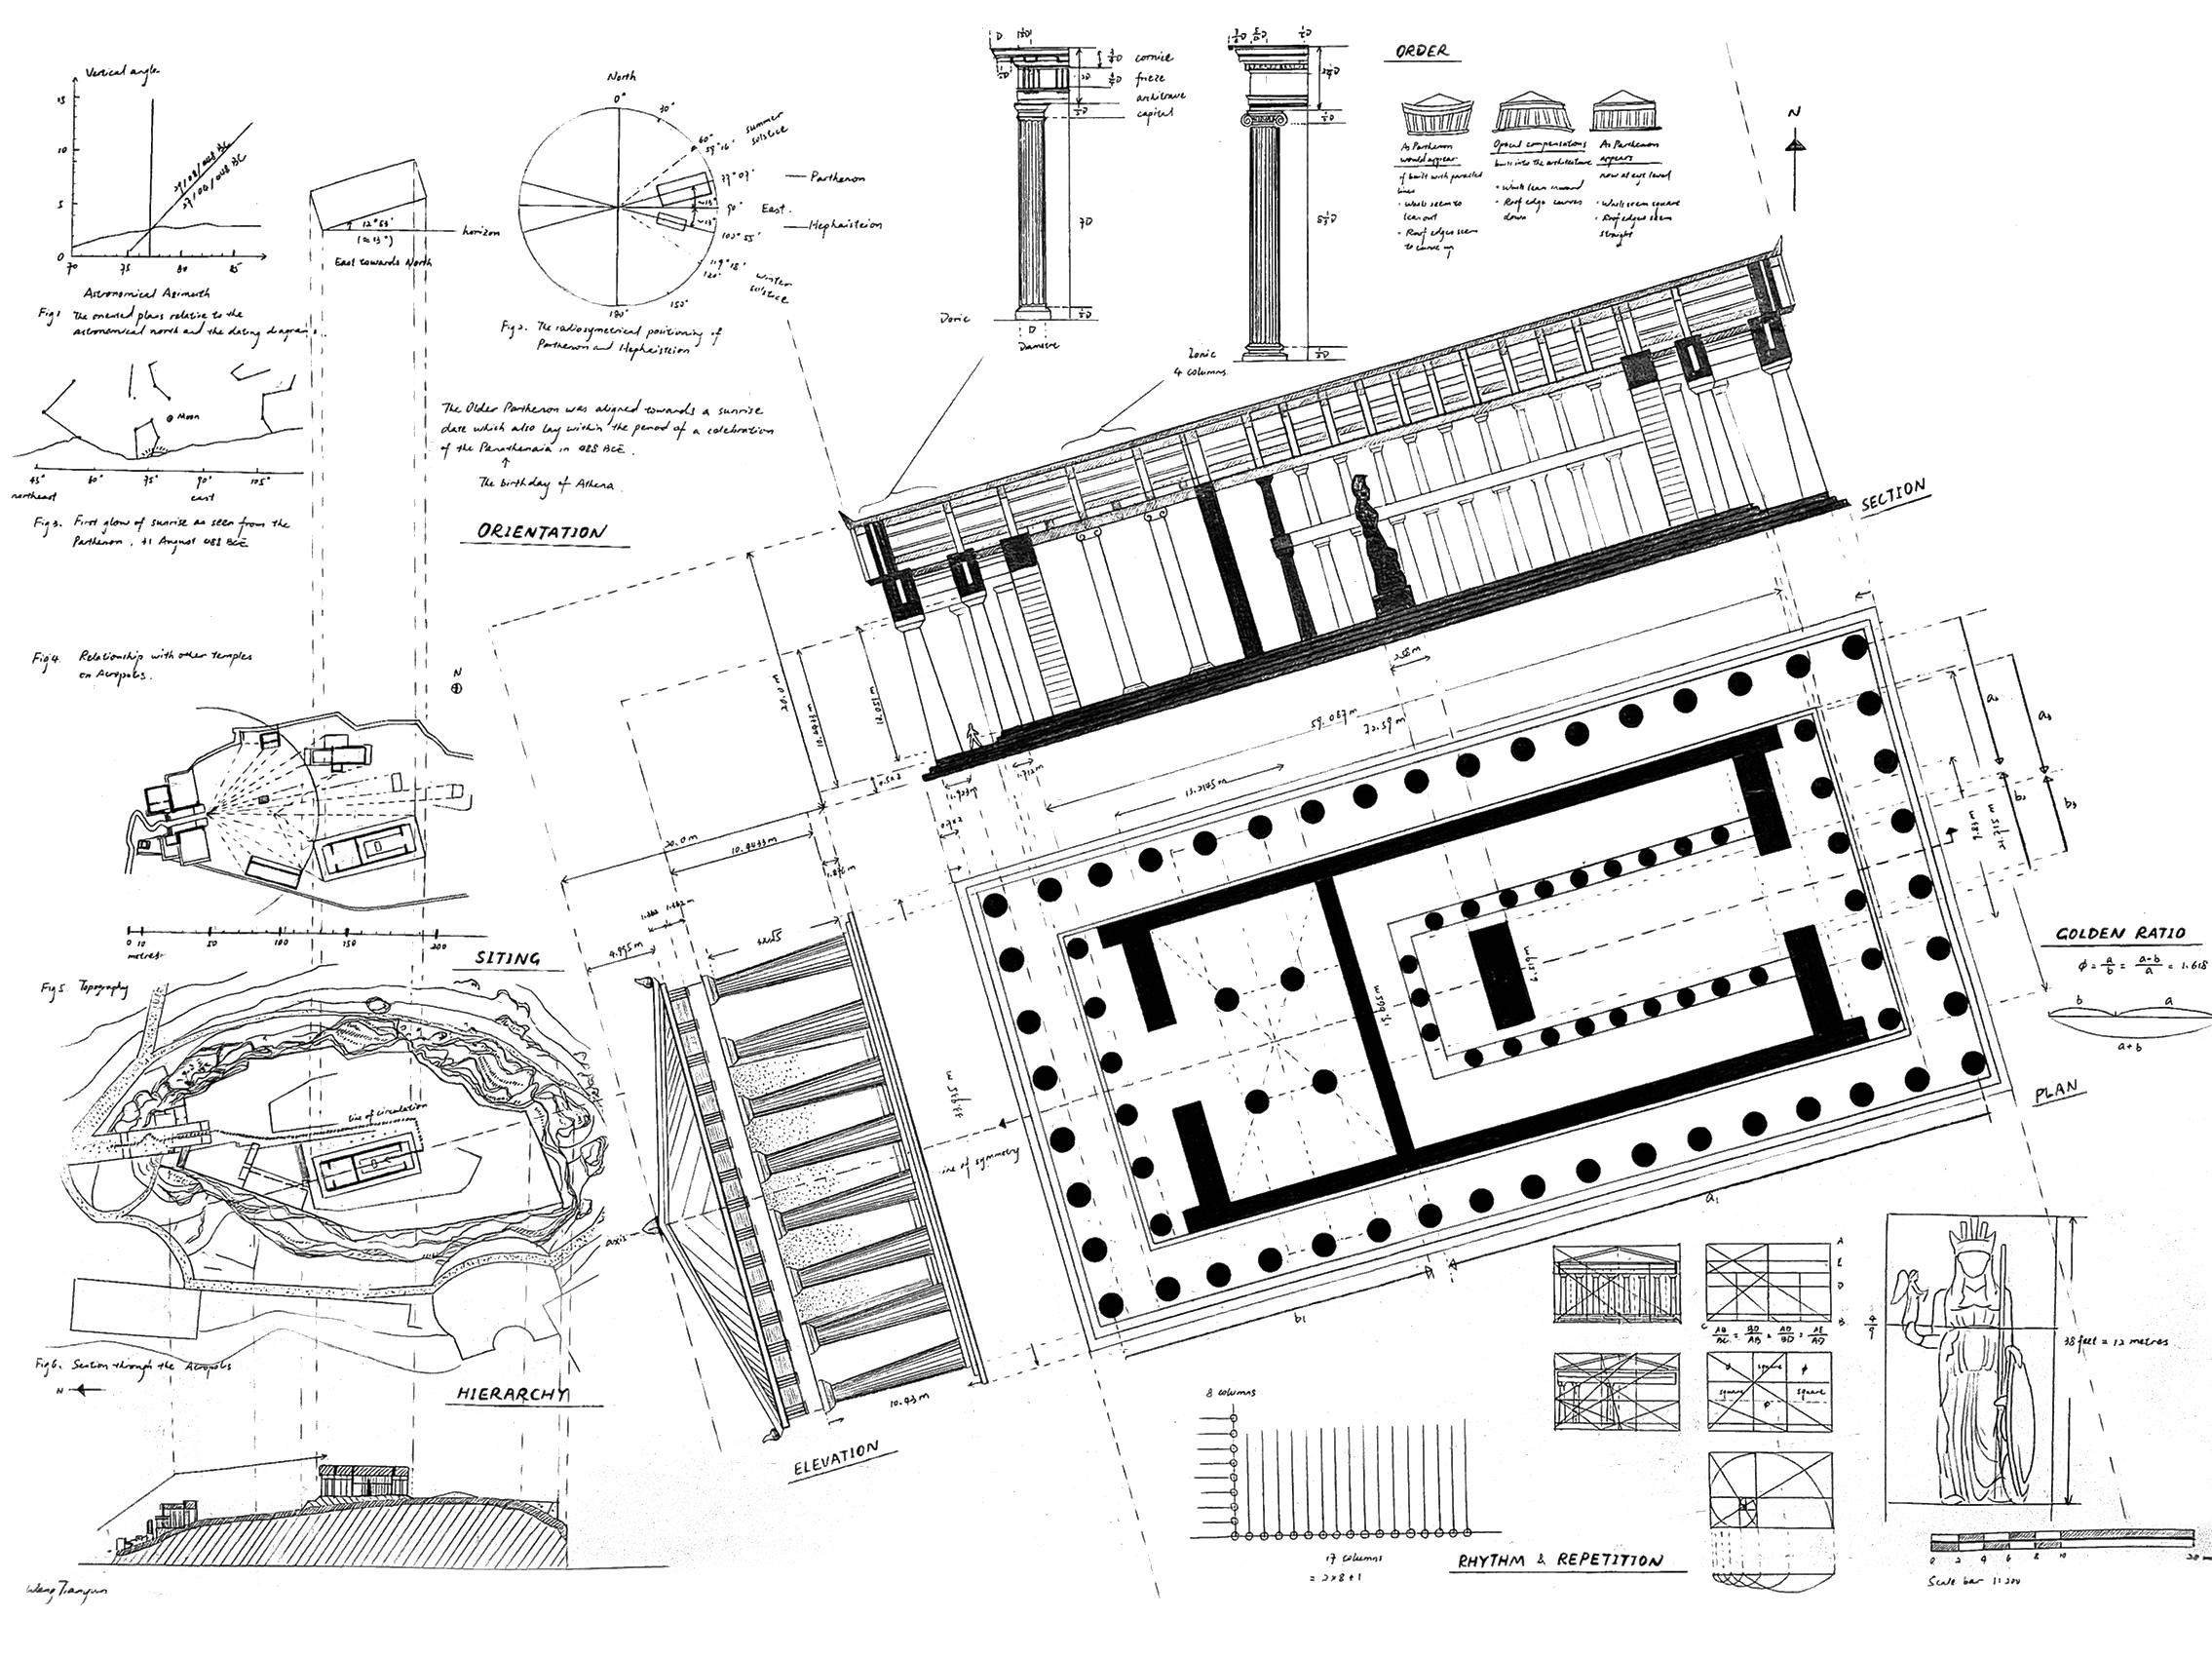
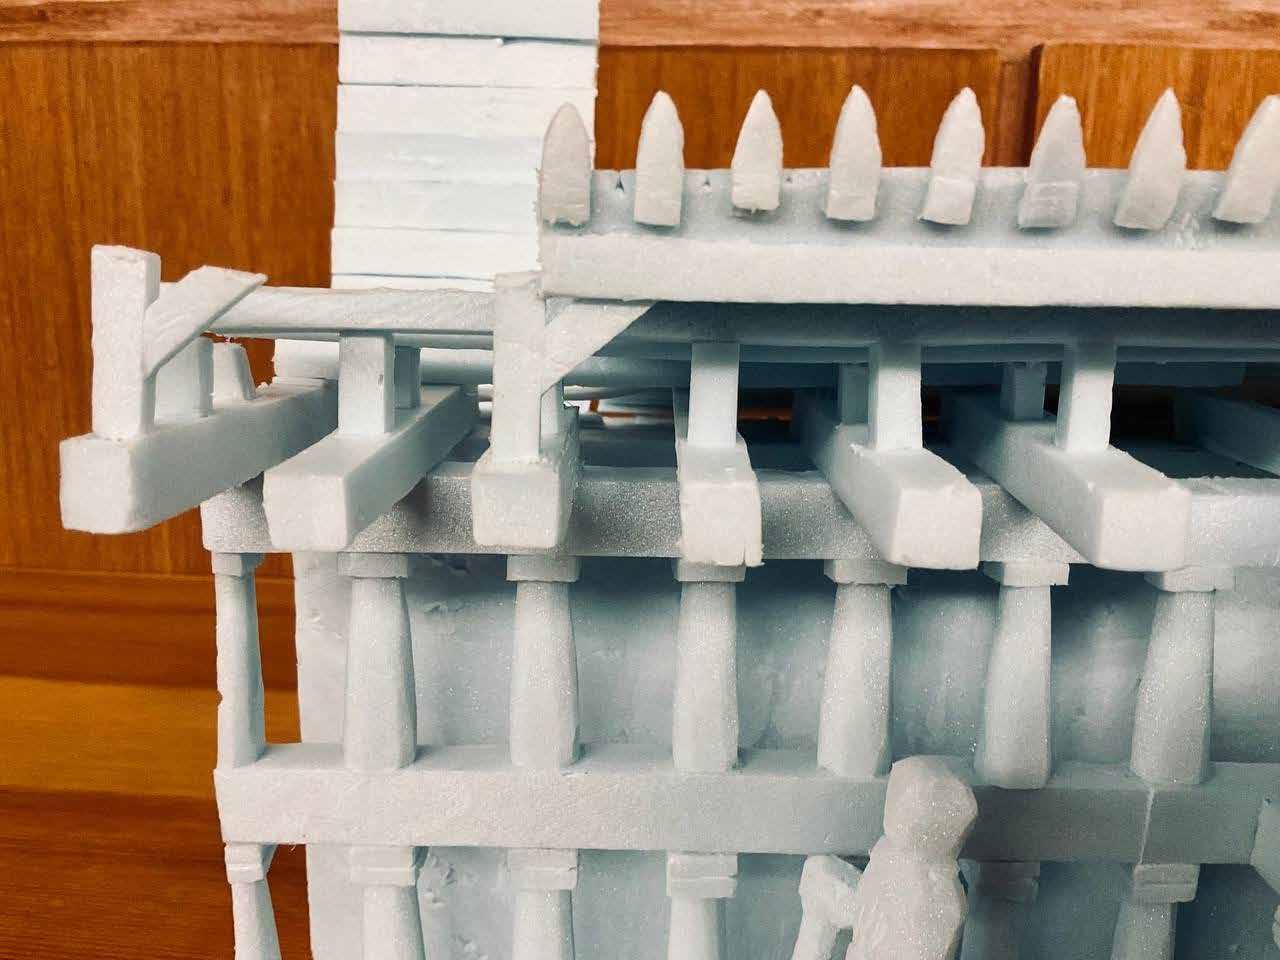
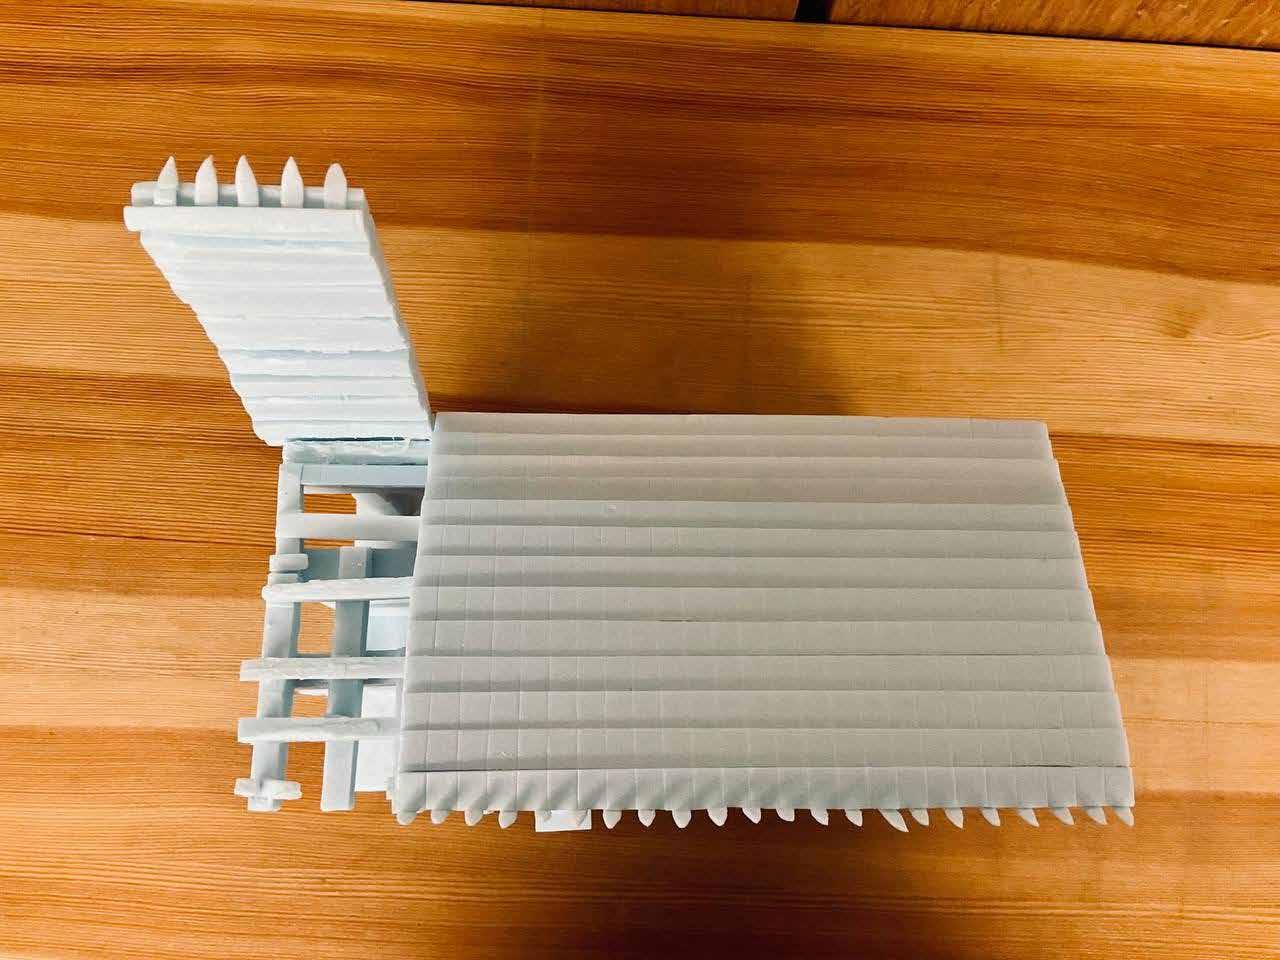
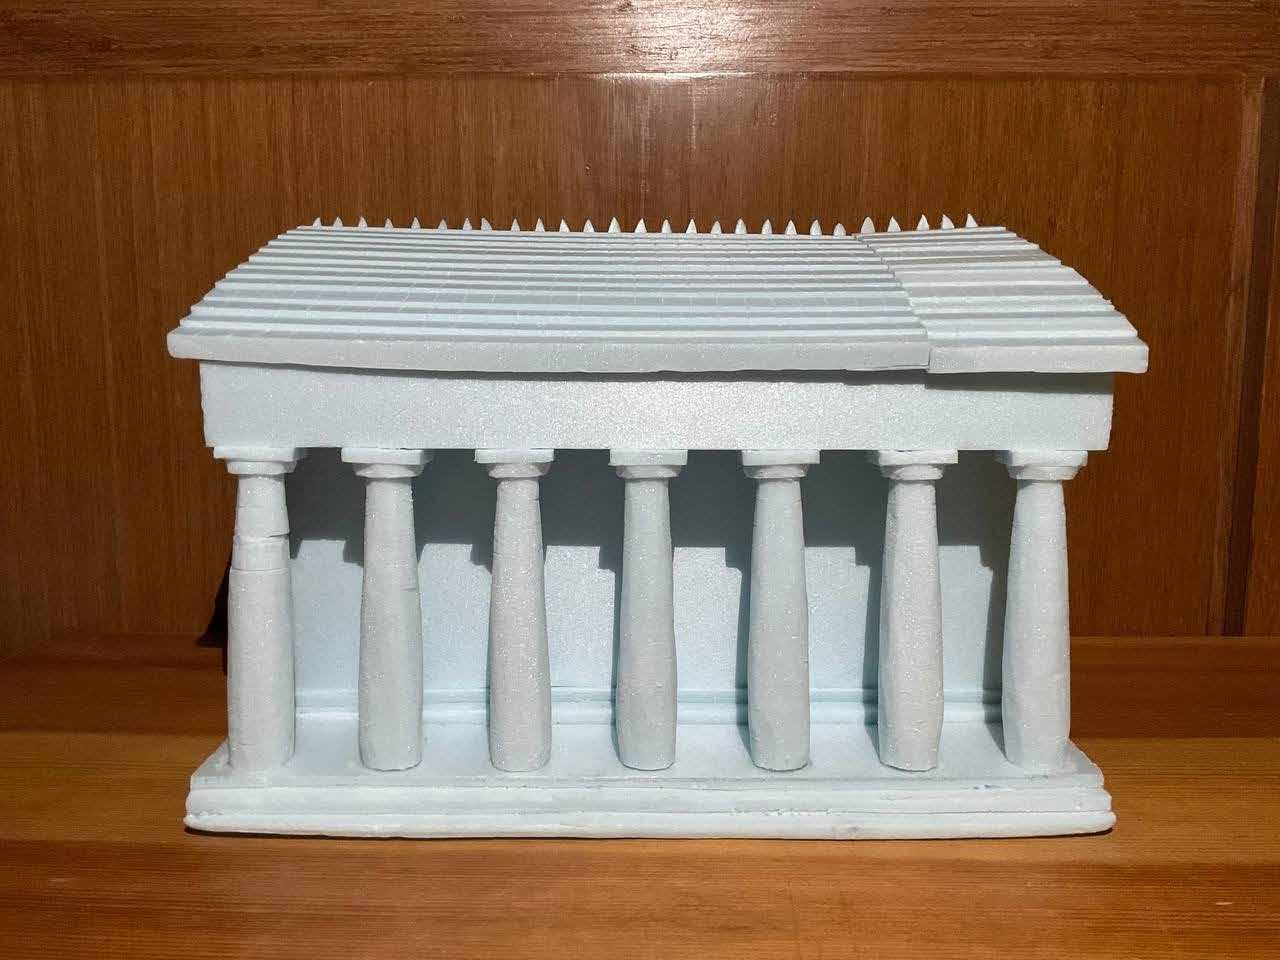
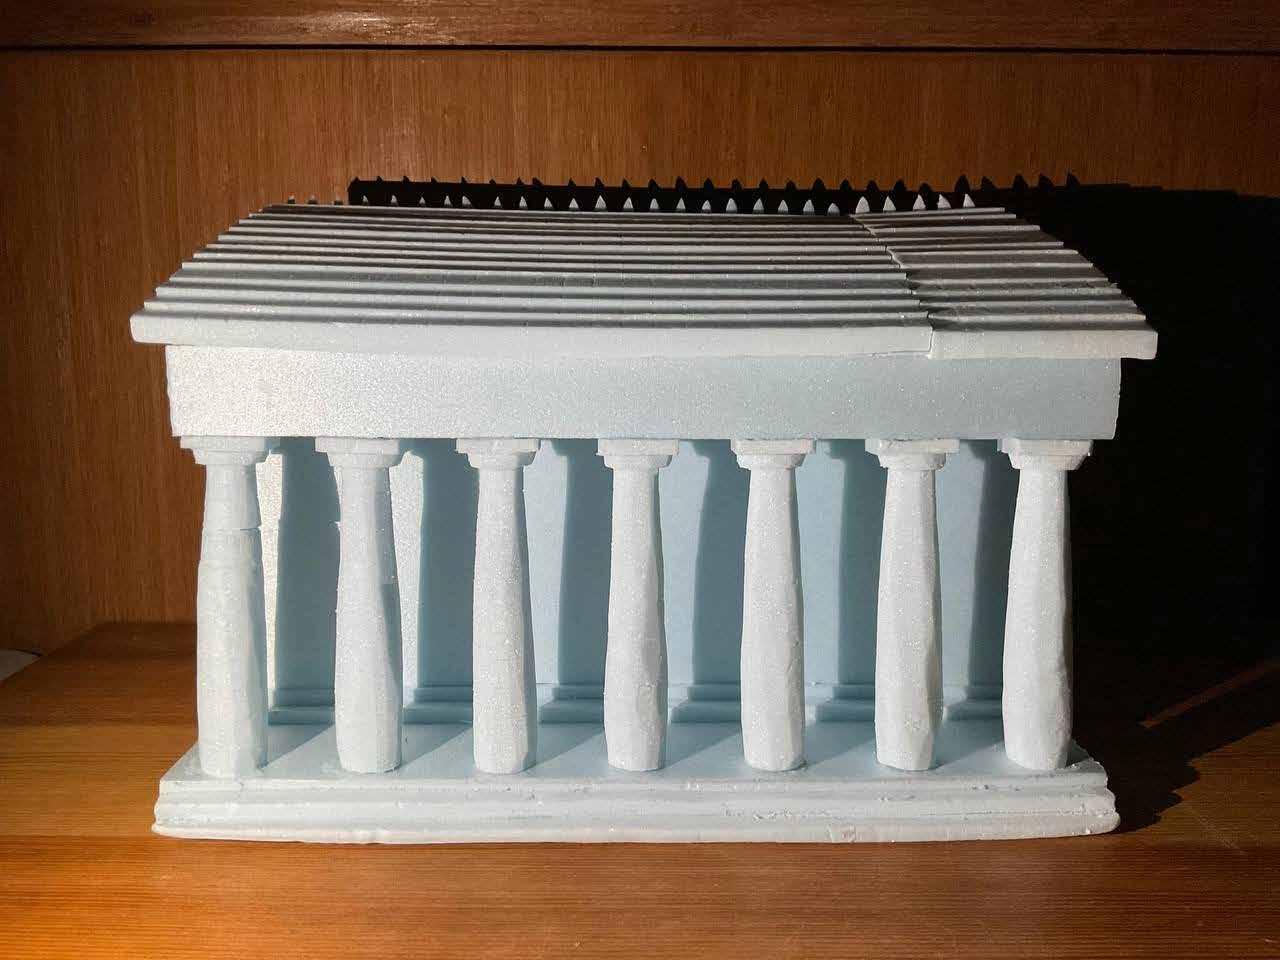
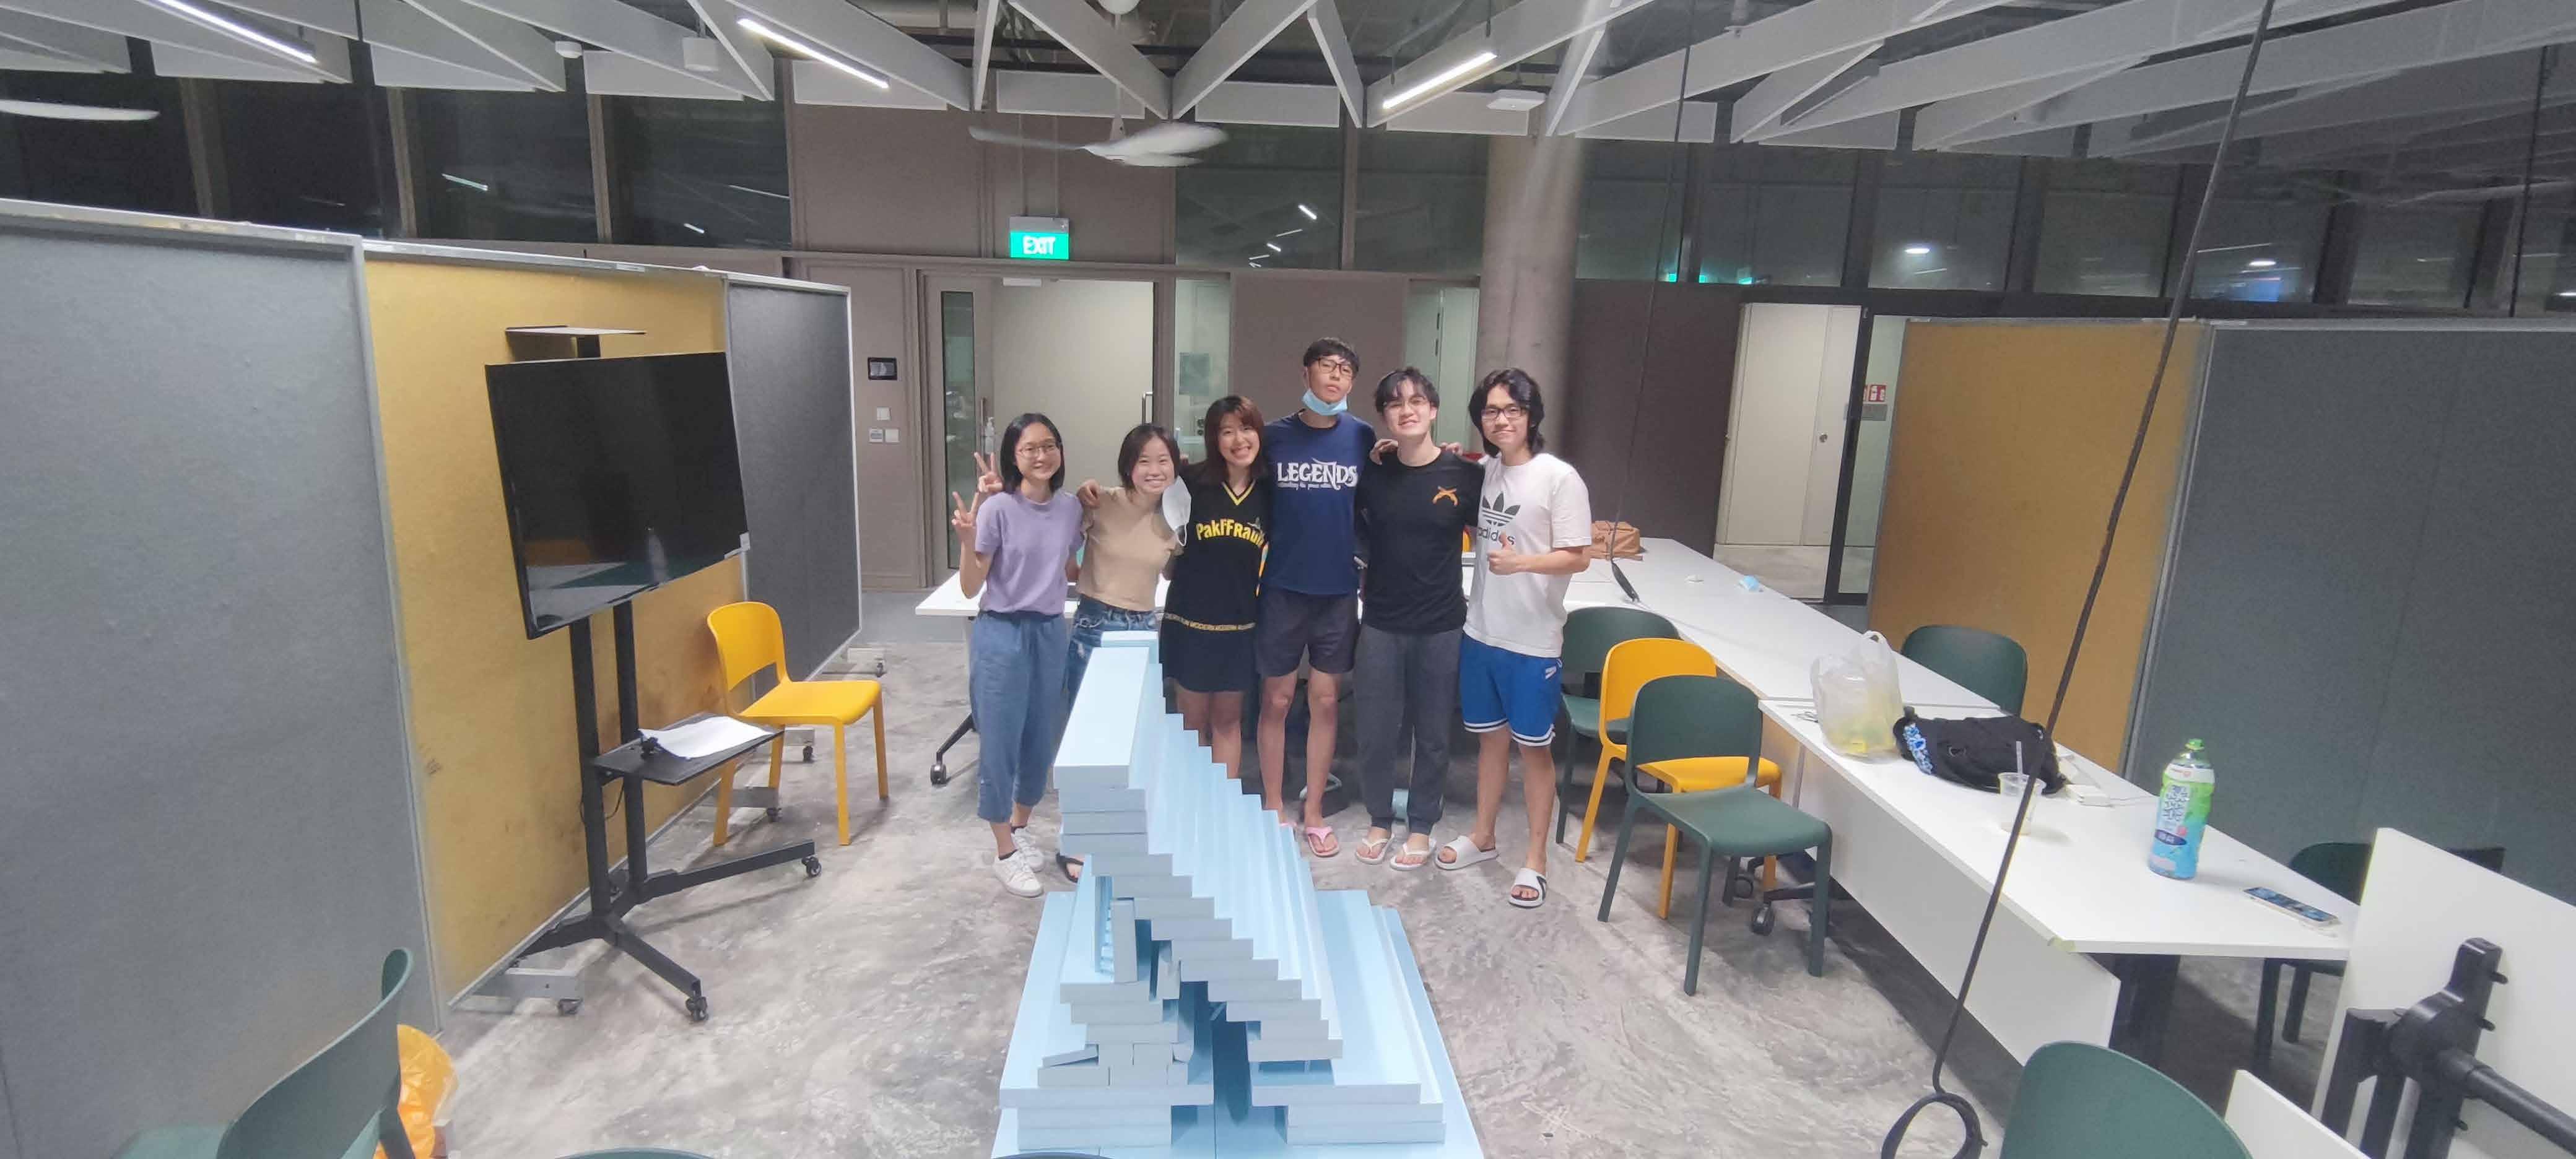
In Week 0, we started our very first exercise to understand the beauty of classical architecture through model-making and drawings of their plan,section and elevations. The 12-student studio was divided into two groups for the comparative study of ancient eastern and western architectures, Angkor Wat and Parthenon. For clear presentation and easy comparison, we decided to use the same material of blue foam and same scale of 1:100 to convey its construction method and quality such as stereotomy, mass and heaviness. Since the actual model is approximately 0.8m x 0.85m for Angkor Wat and 0.6m x 0.3m for Pantheon, a base of 1m x 1m is added so that the context (surrounding buildings) and topography (Parthenon on the hill of the Acropolis compared with Angkor Wat generally on flat site) can be encapsulated.
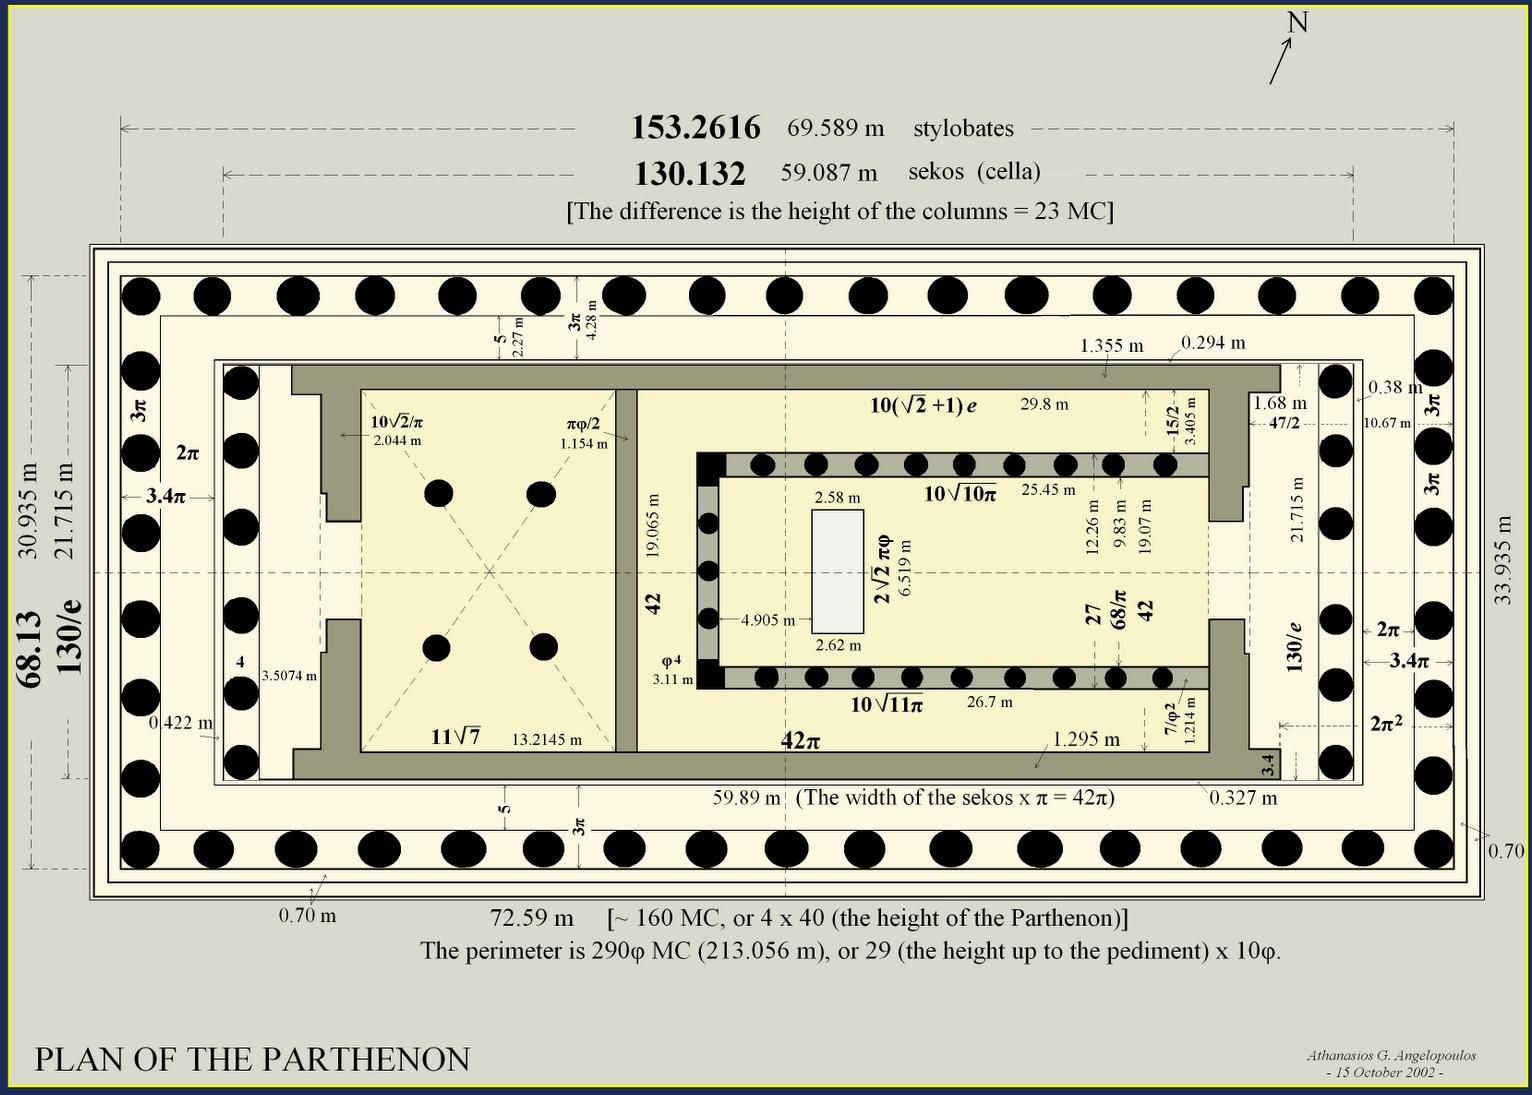
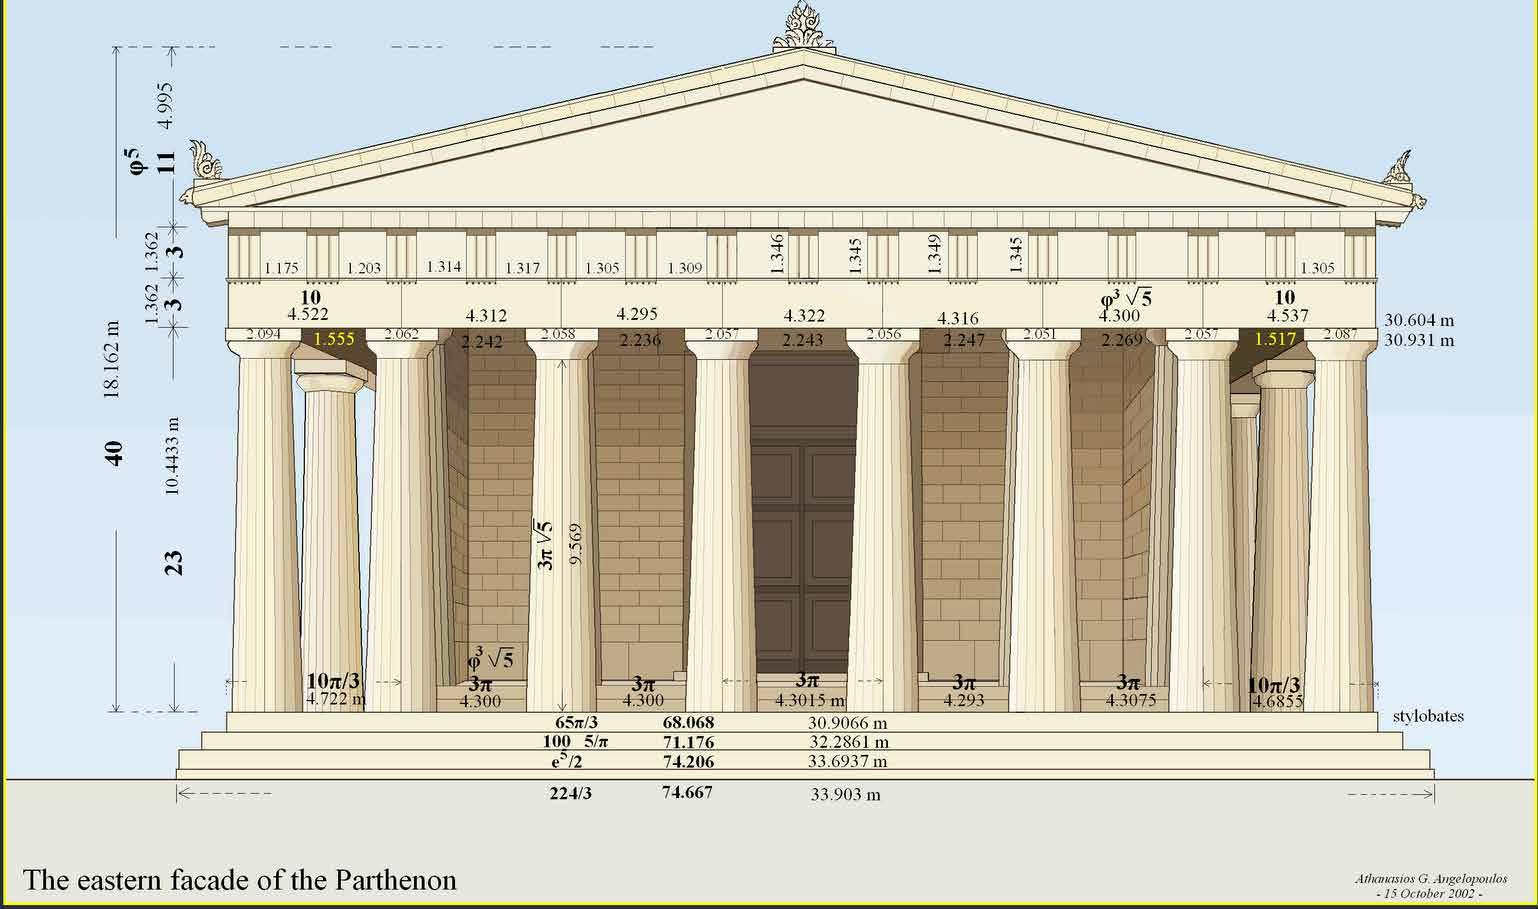
In the process of measuring and calculating each segment of Parthenon, I was amazed by the extensive use of Golden Ratio, which not only demonstrates the outstanding scientific achievements of Greece thousands years ago but also represents the ancient appreciation of precision and perfection in creating uppermost visual harmony. These discoveries eventually inspired the theme and presentation of my work.
Apart from researching, this exercise also aimed to train our analog drawing skills and ability to articulate ideas coherently in a limited space of one A1 cartridge drawing paper. Our professor William encouraged us to dig into different aspects of Parthenon and use drawings and diagrams to tell different stories of the same building.

The theme for my drawings is Beauty in Science and Perfection. The plan is angled at 13 degrees following how the Parthenon building is orientated at an angle to the north point. The angle is special because it was painstakingly found by Greek scientists and mathematics so that on the birthday of goddess Athena, Parthenon would be directly facing the sunrise. The section and elevation are correspondingly extruded from the plan using generating lines with an intent to express the idea that the building was designed in a system proportions that binds all three into one.
The decision for using a single material for the entire model making stems from the fact that Partheon was constructed of one material, which is marble. There is a one-ness which may be lost if we construct them from a palette of different materials.
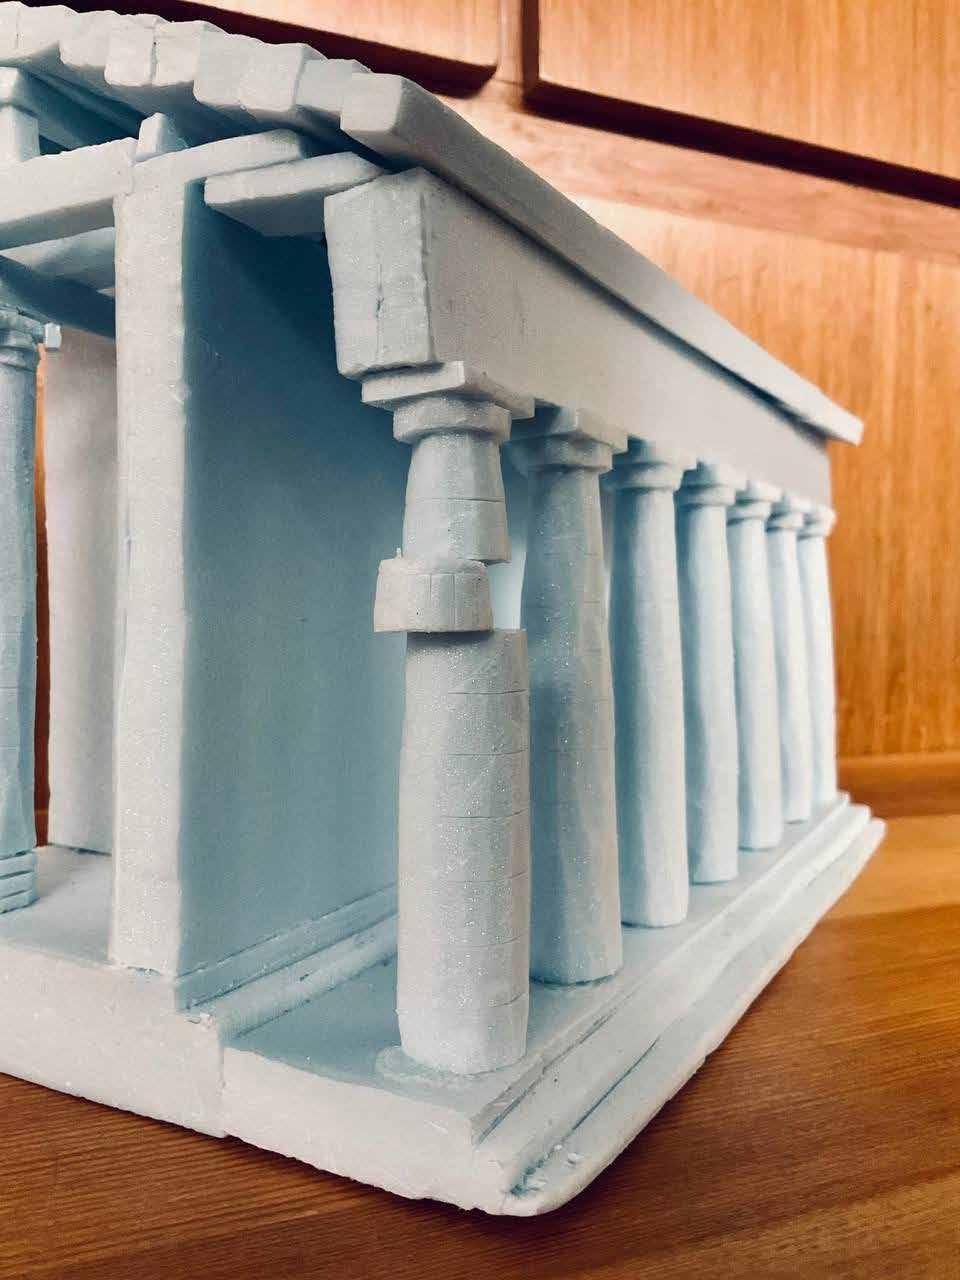
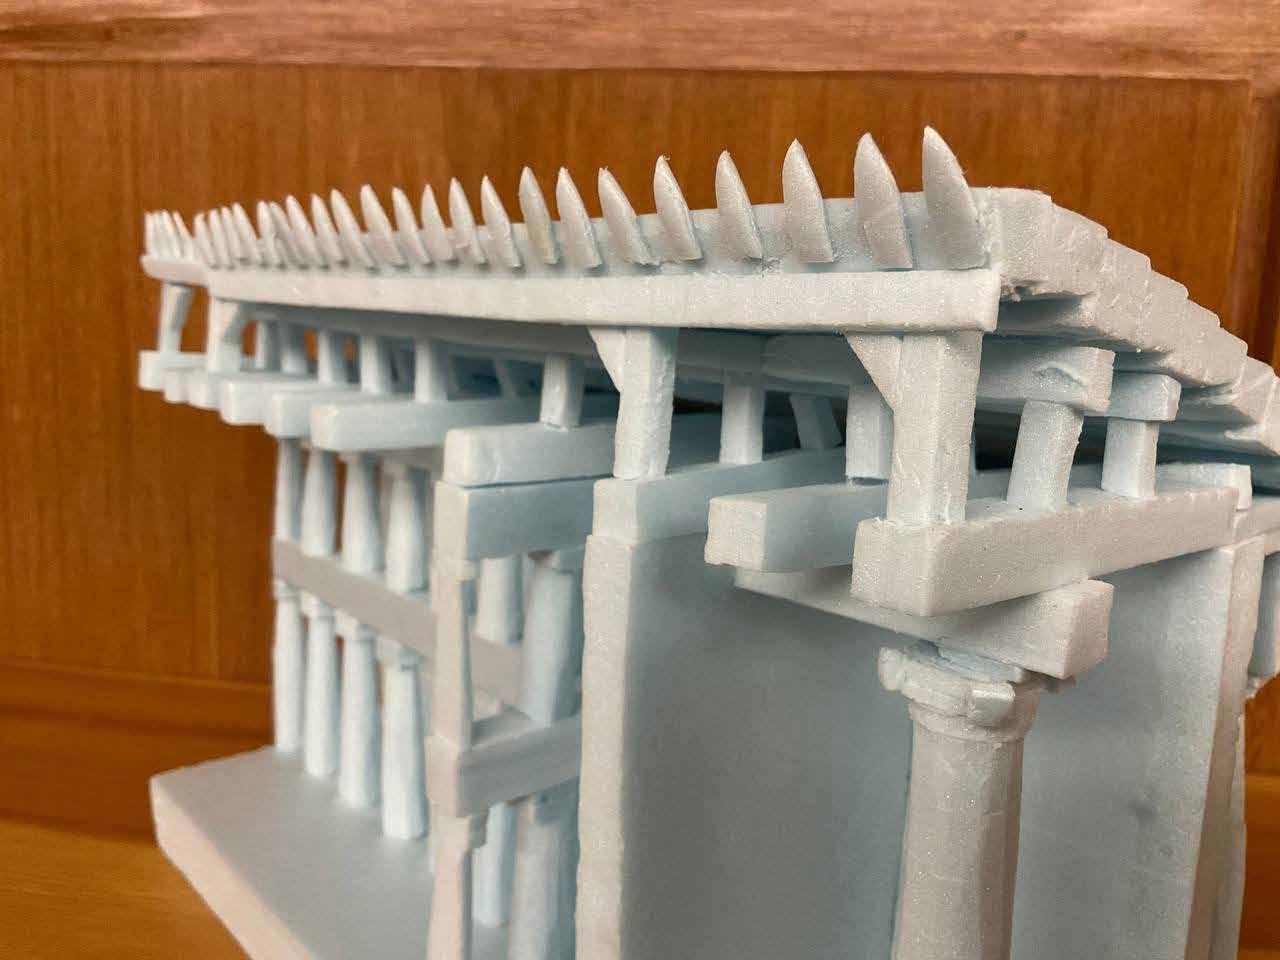
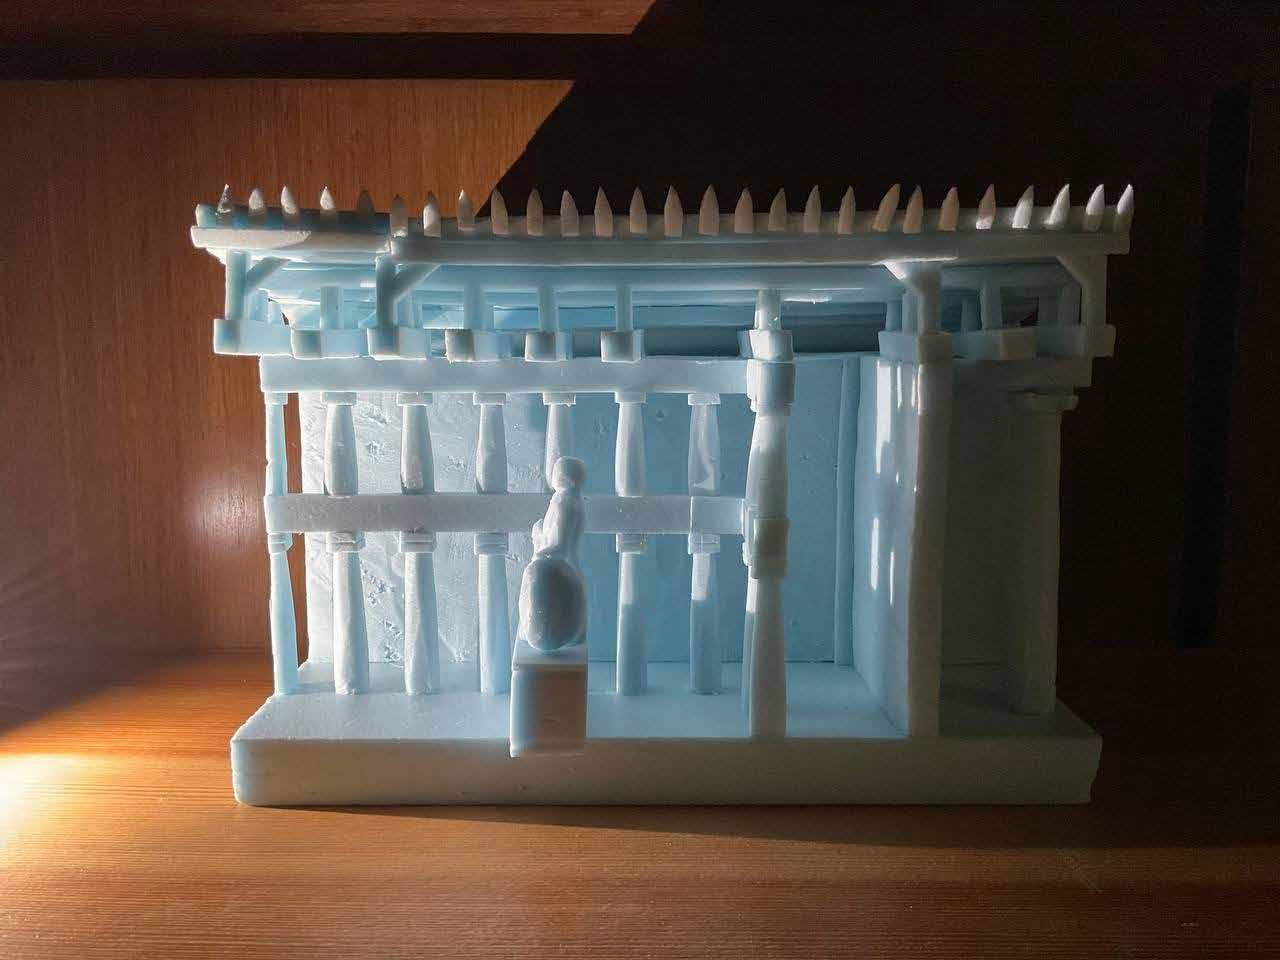
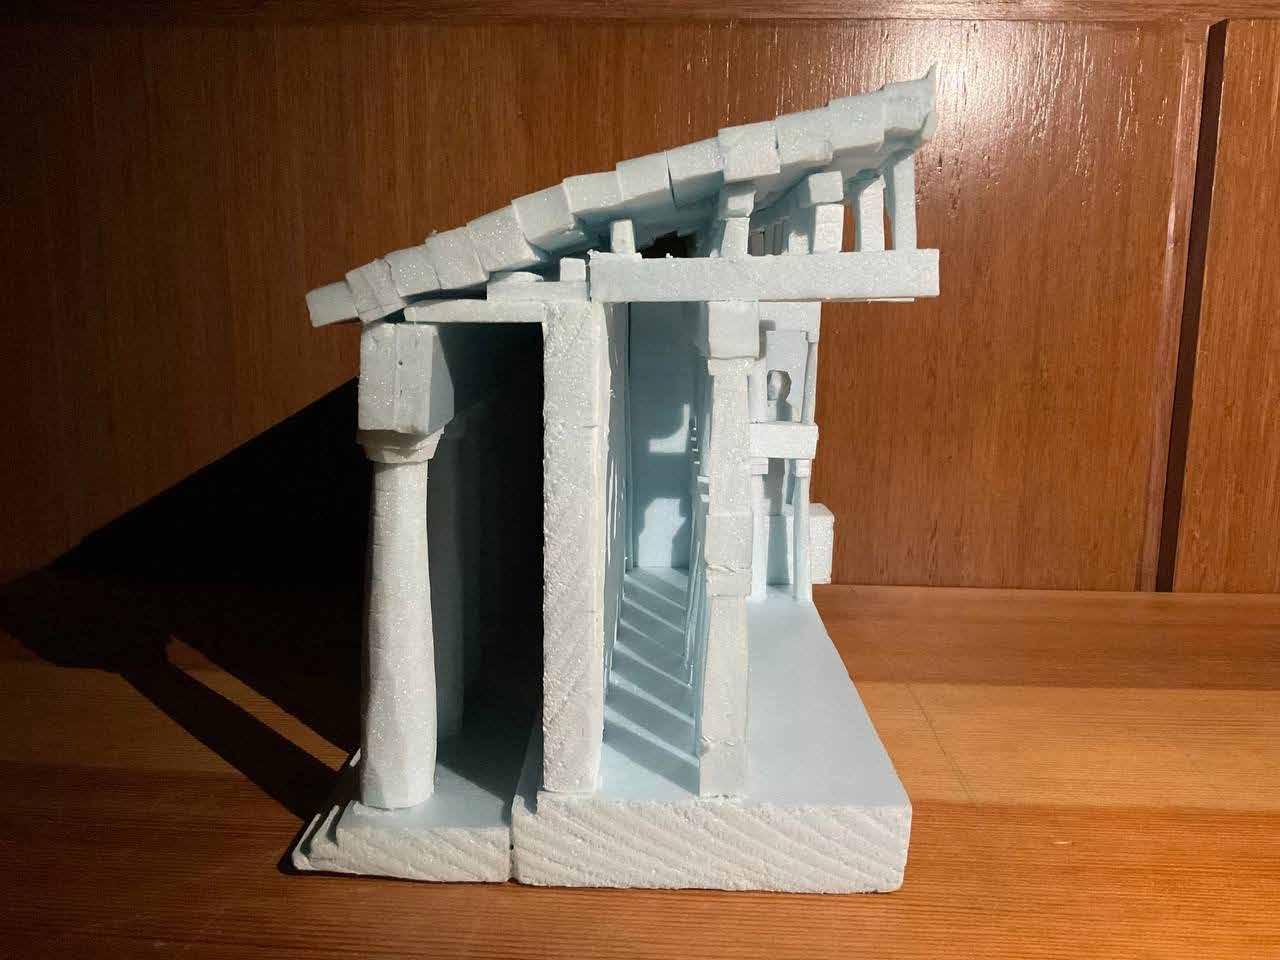
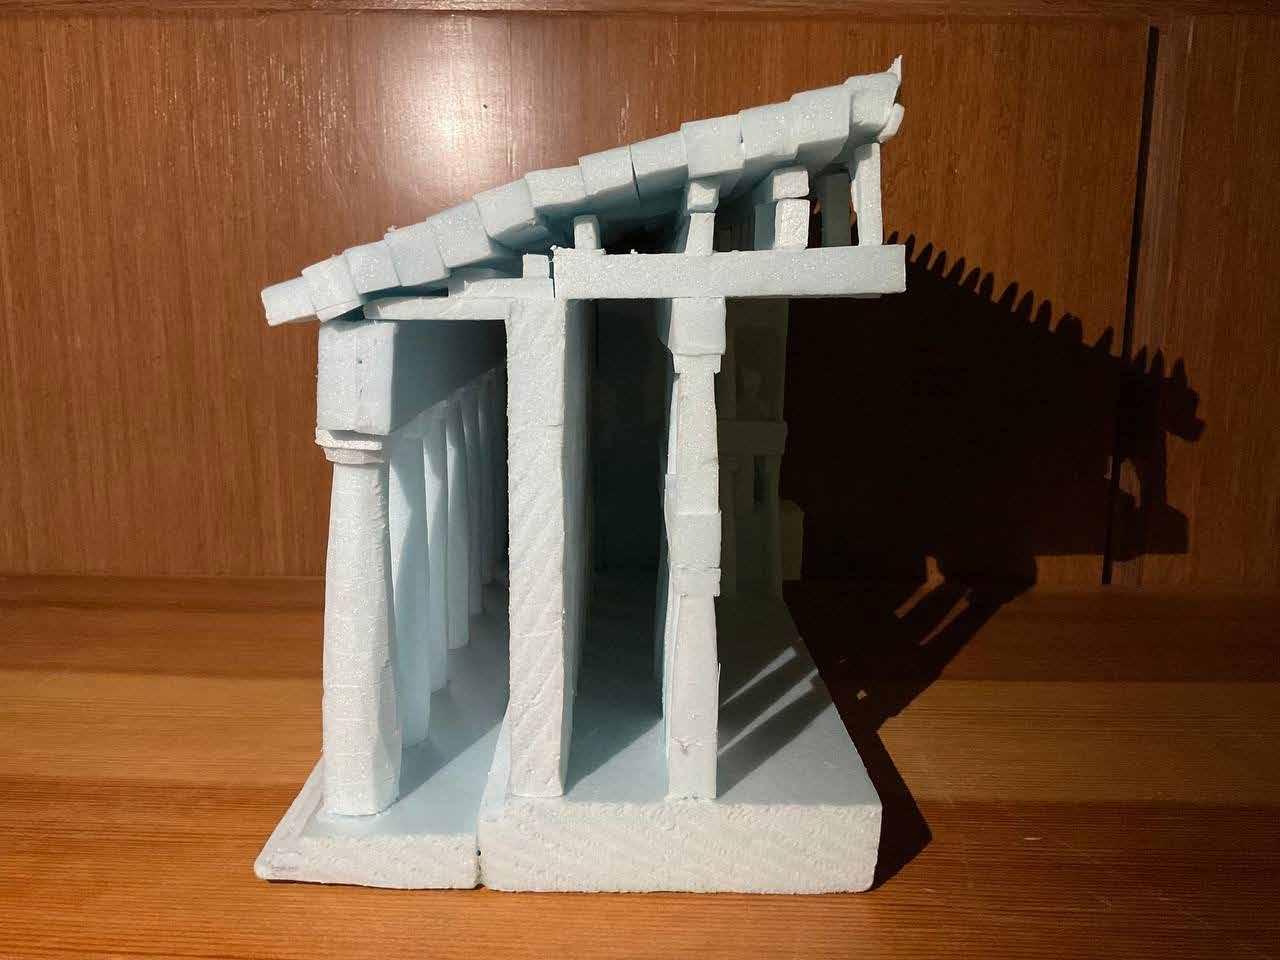
Model is also to accurately depict the construction of the buildings i.e. how the various architectural elements (floor, wall, ceiling, columns, beams, openings etc) are put together. Therefore, I improved my model by adding details to the roof and using one column to demonstrate the drum assembly method and the cutting of flutes.




Discover: Asymmetry, Facade, Space, Light, Tectonic, Iterate diagrams, Systematic ideation
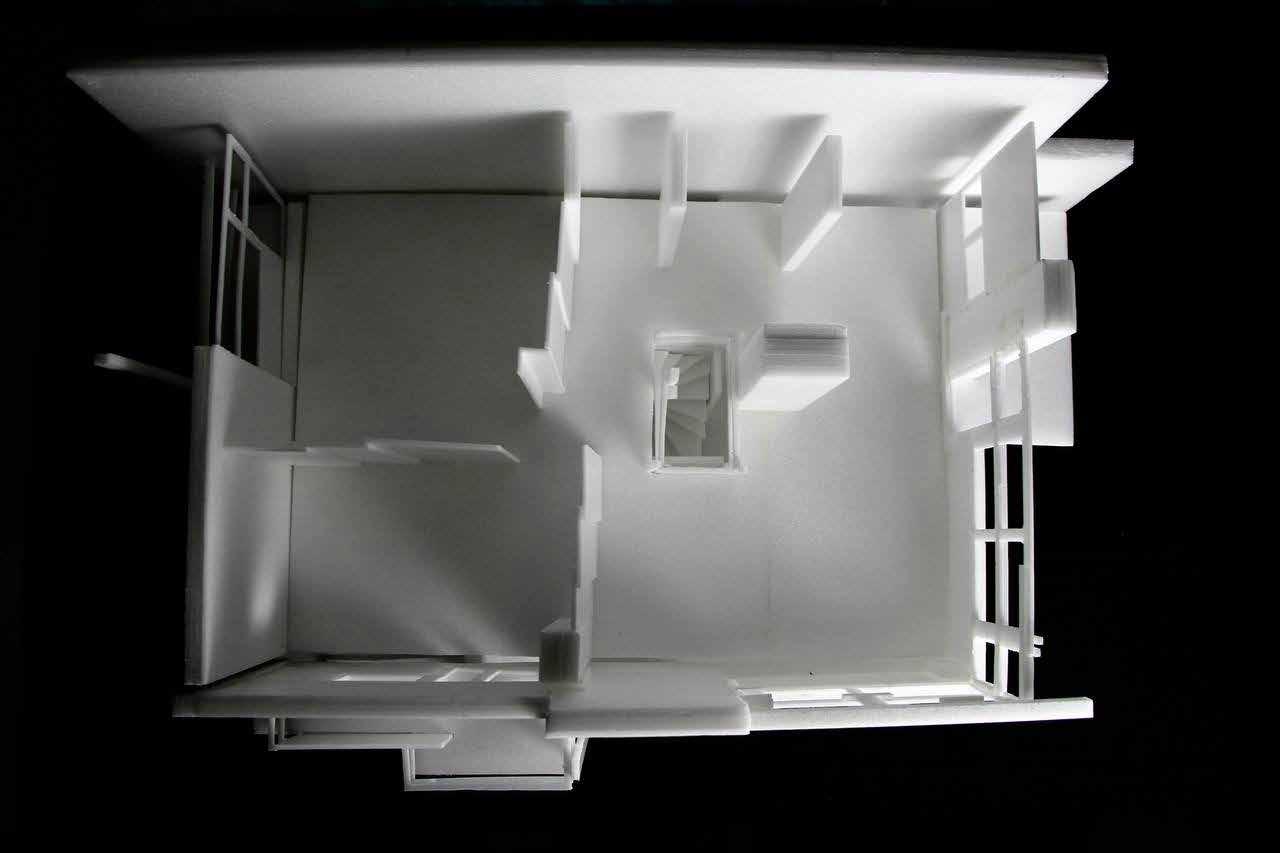
In Week 3, we launched the second exercise for the comparative study of the two stylistic residential buildings, The Rietveld-Schroder House and Maison Cook (or Villa Cook).
This time, Each group made two models scaled 1:100 and 1:20 respectively, which not only gave us a better sense of scale but also inspired us with various lens to approach a building. Some of the building analysis we discussed are as the following.
• Context/ Siting
• Circulation (Approach/ Entry, Intra-floor, Inter-floor)
• Program (Zoning of Private/ Public)
• Structural (‘Supporting’ and ‘supported’, ‘Load-bearing’ vs ‘Non Load-bearing’)
• Enclosure (Open/ Enclosed, Void/ Solid, Transparent/ Opaque, In/ Out, Wall/ Window)
• Assembly/ Tectonic (How is the building put together)
Analyzing different aspects of the building consistently across all levels allowed us to arrive at an understanding of the design intent of the building and our own original viewpoint which subsequently determines the isometric or axonometric drawing that best illustrates our interpretation of the building.
There are at least a variety of 12 iso/ axo (view points) for an orthogonal building like Maison Cook and Schroder House and that is not including a possible Axo Degree Zero such as Project A, Diamond House, 1969 byJohn Hejduk and White U by Toyo Ito.
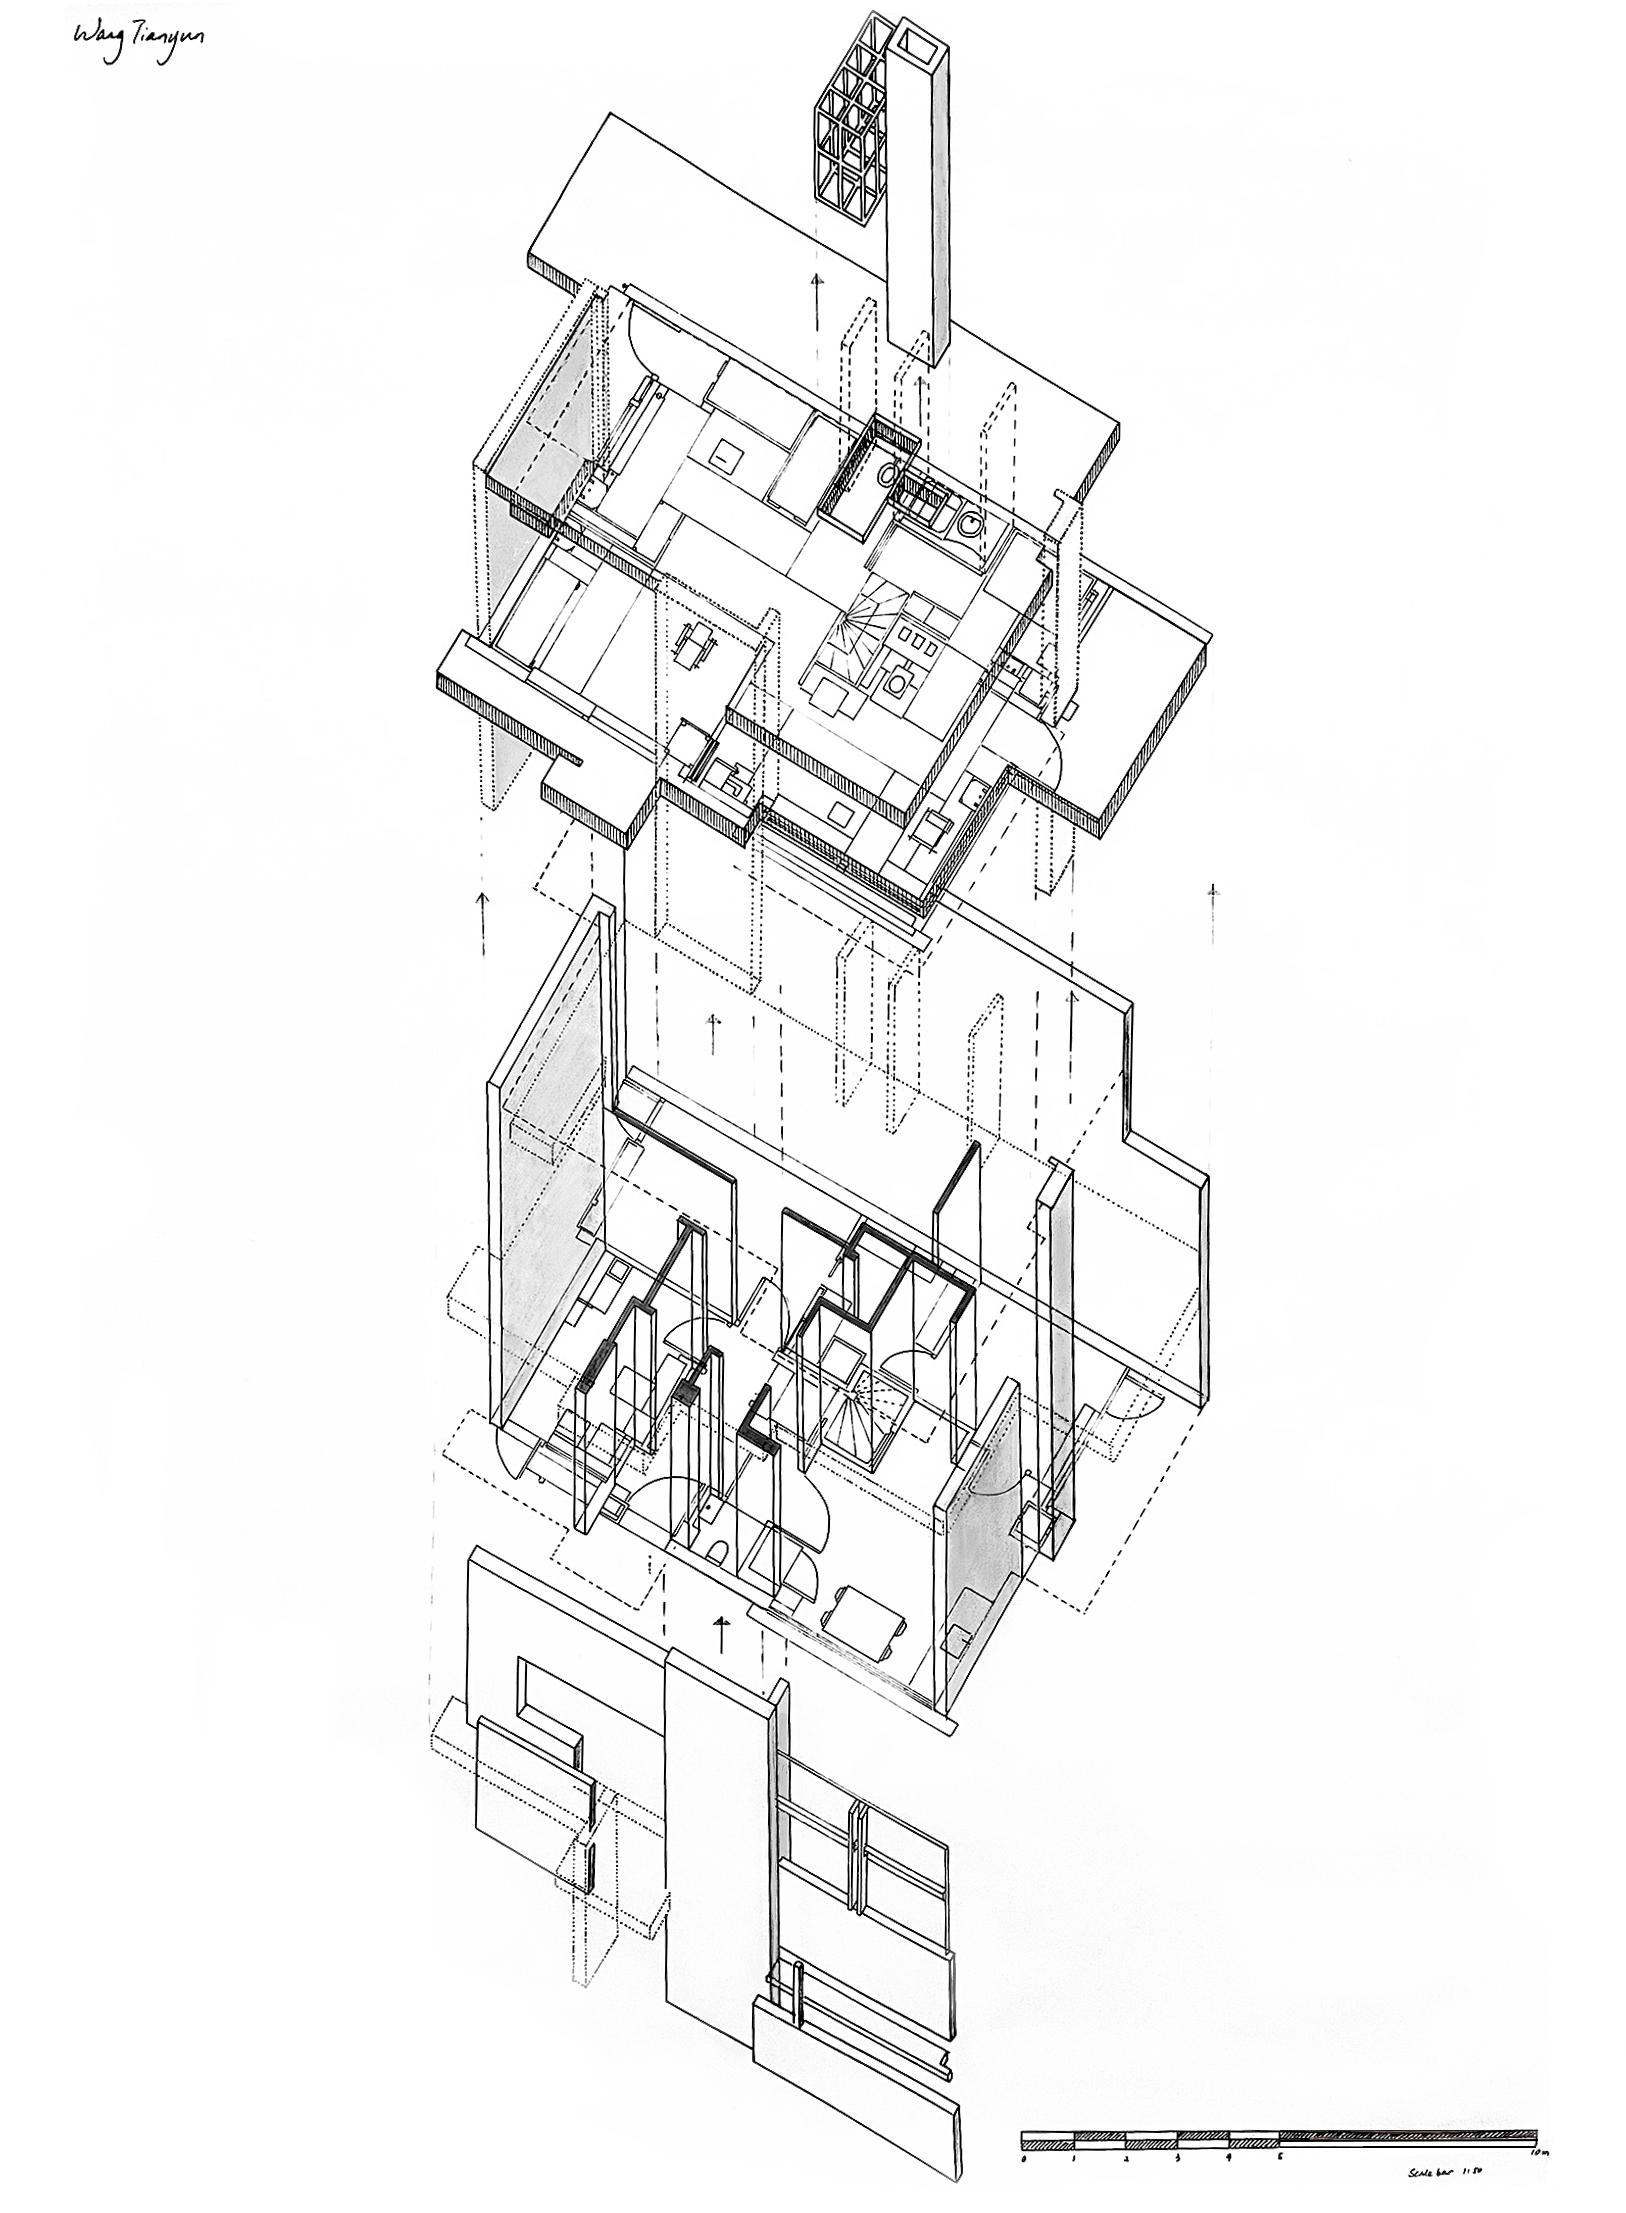
Fascinated by the 3D assembly of Schroder House, I chose to use a 3060 degree exploded axonometric drawing reveal the relationship between external facade composition and internal space division. Like a carefully designed burr puzzle, Schroder House has double-height facades interlocking the slabs to form a block complex, in a sense challenging the traditional load bearing concept. Scale Bar 1:50
Unlike Maison Cook, which has rather rigid square-facades and ordered floor plans via sub-division and pilotis principle, Rietveld-Schroder House is heavily influenced by De Stijl Movement which emphasizes on asymmetrical equilibrium, evident on the composition of the exterior, segregation of interior space and coloring of floors and furniture.
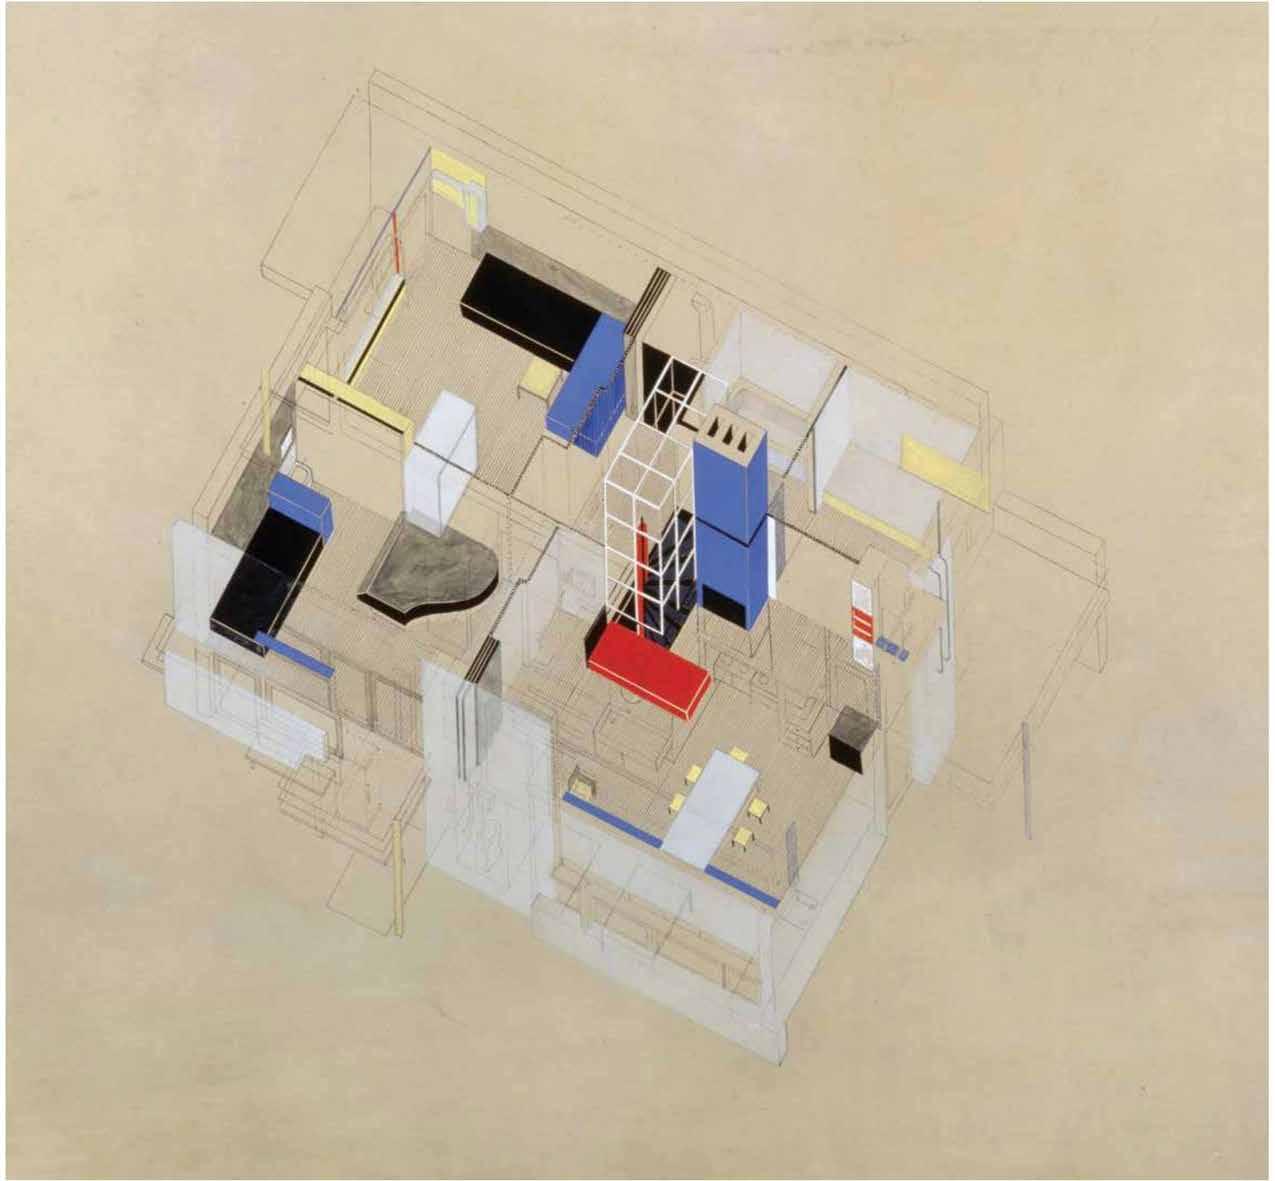
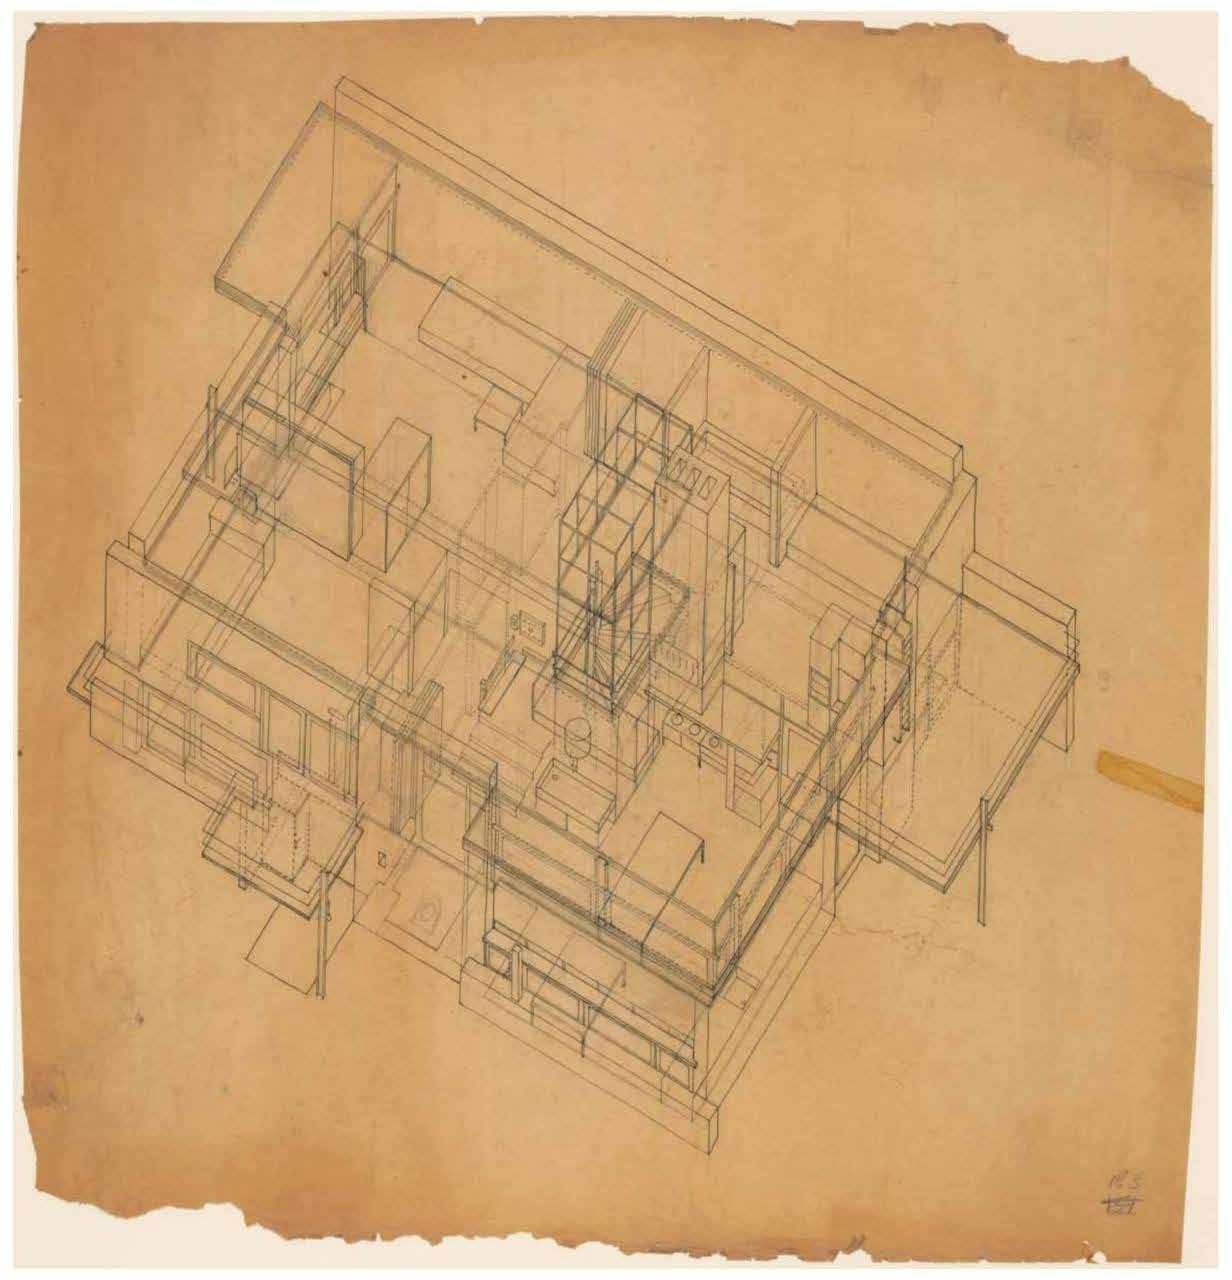
Notably, the formation of 3D space through the 2D interlocking planes is intriguing, which is presented and further explained in the exploded axonometric drawing scaled at 1:50. This set of analytical diagrams focuses on the transformation between 2D and 3D elements guided by Neoplastercism pattern and beliefs, together with the introduction of 4D concept on the second floor with the architect’s play of time. Unconventional as a building, Schroder House has minimized the notion of hierarchy in traditional architecture. Avant-garde as an art piece, Schroder house expanses the definition of De Stijl in a new dimension.




Discover: Perspective, Approach, Sequence and Vignettes, Private/ Public, Empathy, Context, Multiple Users and Perspectives
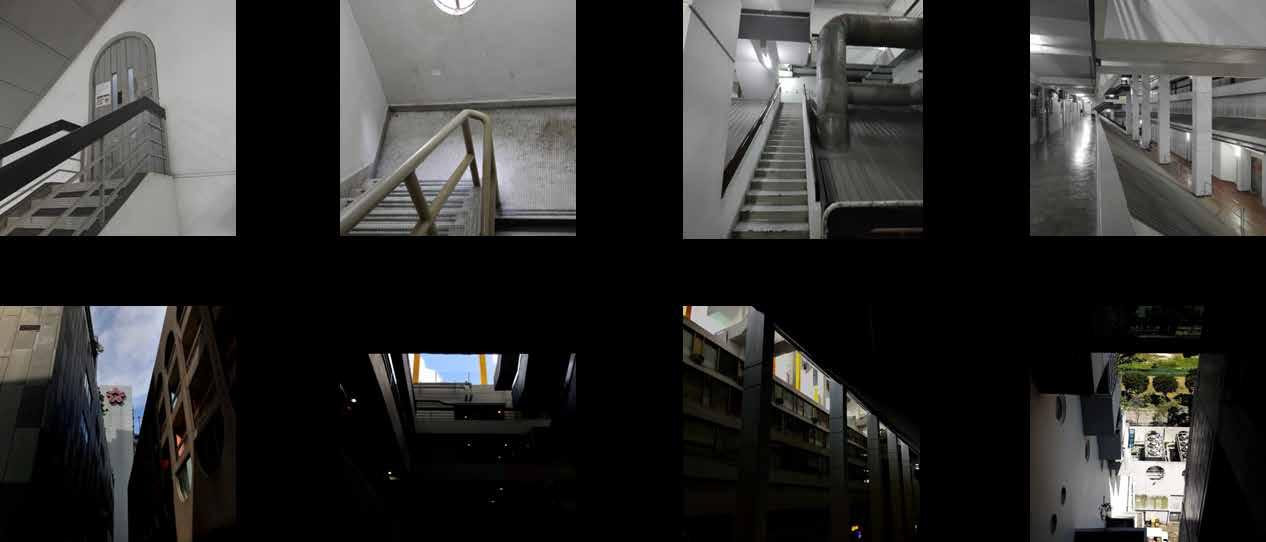
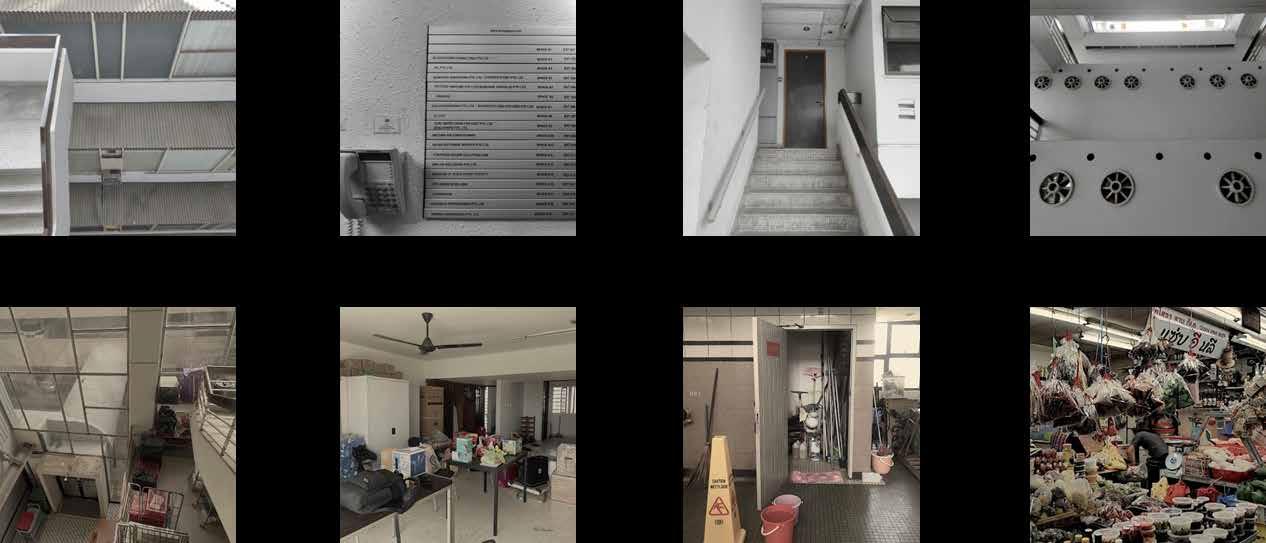
Exercise 3 brought the entire studio together with a fun group activity --- linking our individual perspective drawings to tell a story of little boy William’s one day in Golden Mile Complex. In order to map the entire circulation and activities in building, we had a site visit. The trip was so memorable as it elevated our understanding of the building beyond paper and books. Each of us came back with hundreds of photos vividly capturing various moments of life. 12 locations in the building are chosen as interesting view-ports to observe Golden Mile Complex’s day and night.
William decided to pay a surprise visit to his grandparents’ new house at Golden Mile Complex. His parents dropped him off at the bus stop opposite Golden Mile Complex since it would be more convenient than driving into the car park and they had another destination to go to.
William crossed the overhead bridge and entered the building. As he had been reminded by his parents to help his grandparents collect the mail using the spare key that they had, he headed towards the mailbox area. He was unsure about where the mailboxes were located but soon found it, thanks to the captivating view of the shadows cast by the window grills towards the back of the mailboxes. William collected the mail from his grandparents’ mailbox and then walked up the staircase right behind to the retail shops on the second floor.
William had wanted to buy his grandparents a housewarming gift and thus entered the retail space to look for one. Upon entering the area, the first thing he noticed was the letterbox area, and his line of vision drew towards the atrium ceiling, from which he could see several overlapping pipes. Walking past the atrium, he found a store of his liking and decided to buy the gift there. Before he could get to the store, he had to squeeze past crowds of people that were also there to shop. William quickly purchased the gift and decided to go up to his grandparents’ house.
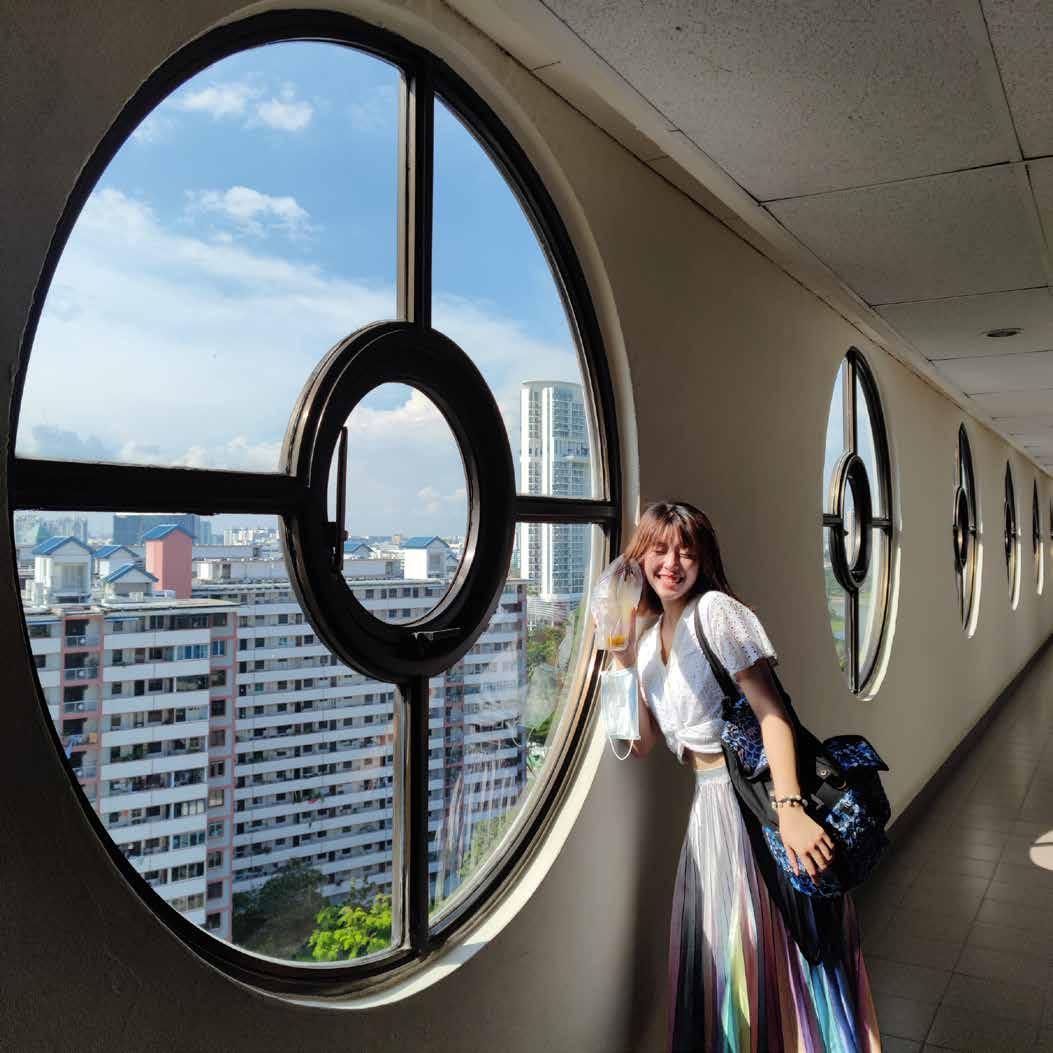
As he walked out of the store, he noticed an isolated door on the fourth level. Curious about what it would lead to, he walked up the stairs and through the door, amazed at how the hustle and bustle of the place quietened down instantly as he entered the canyon. It felt as though he was teleported to another place. William walked through the canyon, looking for stairs that would lead him up to the residences at Golden Mile Complex. He found the offices and after walking along the path of the corridor, he discovered a staircase that would lead him up to the houses directly. William reached his grandparents’ house on the 10th floor and after spending a while with them, his grandparents encouraged him to go down to the deck on the 9th floor to make new friends with the other children who play there every afternoon. He went down to the deck and after meeting the children, they decided to play a game of hide and seek first. William then ran up the stairs to find a place to hide, and in doing so explored the corridors of the 15th and 16th floors. The views through the circular windows were indeed amazing. After a fun game of hide and seek, the children gathered again at the deck to continue playing other games. However, William grandparents called out to him from their balcony after a short while, letting him know that his parents were waiting for him at the car park to pick him up and go home. His grandparents accompanied him to the car park and he waved goodbye to them as his parents drive off.

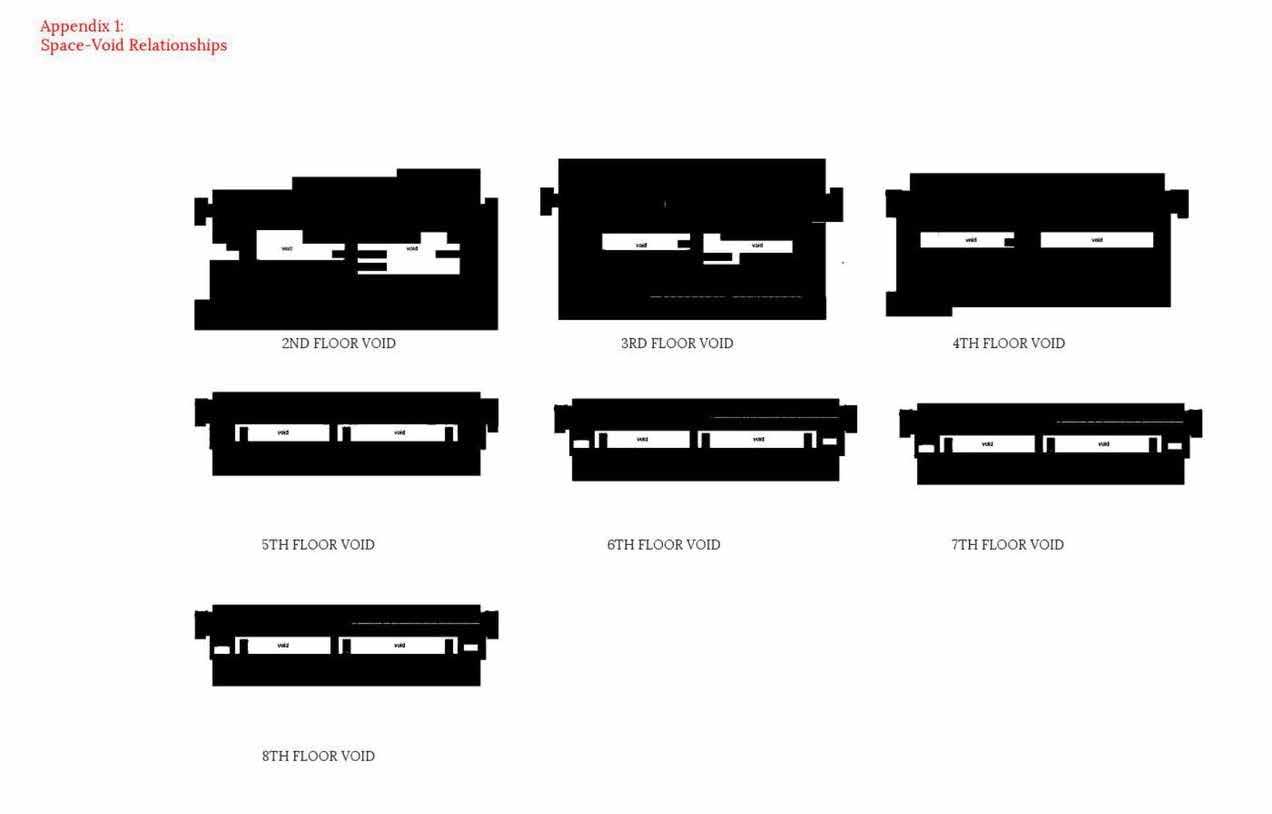
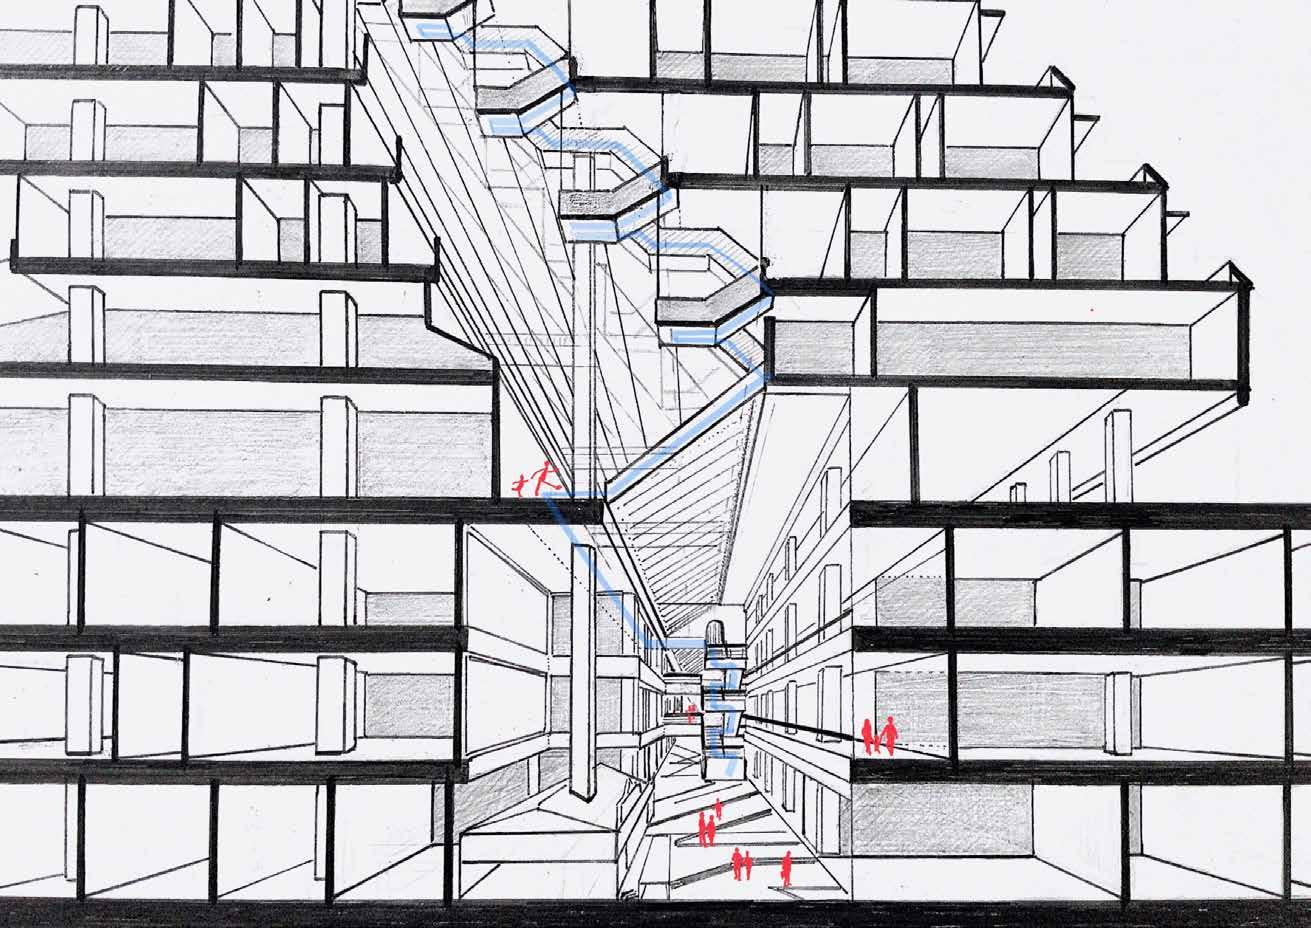
Level 1 to 3 is the atrium of Golden Mile Complex where there are lots of Thai shops and restaurants. This is also the busiest space in the building where different activities are carried out for people to enjoy themselves from day to night. The only entrance door in level 4 defines the boundary between work and life, public and private.
Both of the perspective drawings share the same focus point, one outlining the building structures to reveal the overall circulation in the building complex and the other one depicting the hustle and bustle of human activities.

Zooming into the details, the flooring captured my attention. Tiles are arranged in four ways to create the pattern of vertical and diagonal lines with varied thickness. I believe these serve as subtle visual guides for the people and also make the overall environment more dynamic.

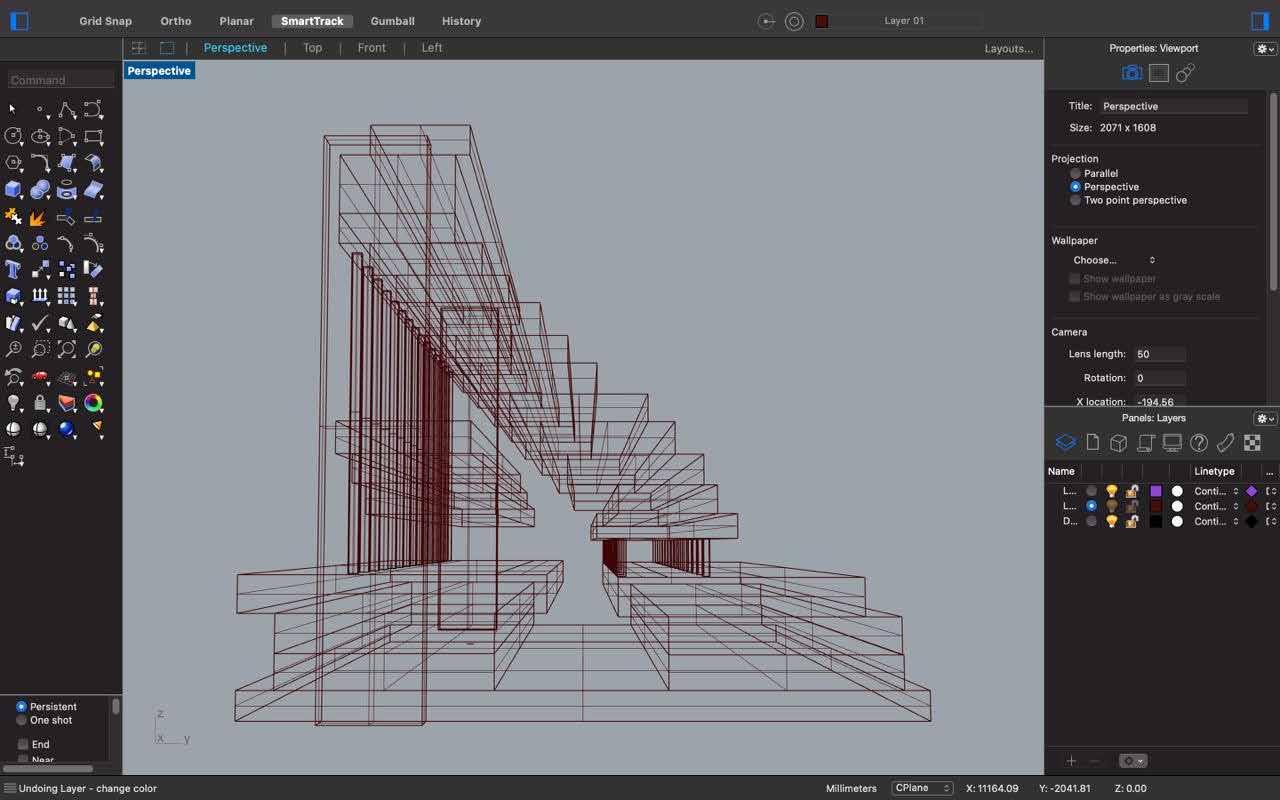

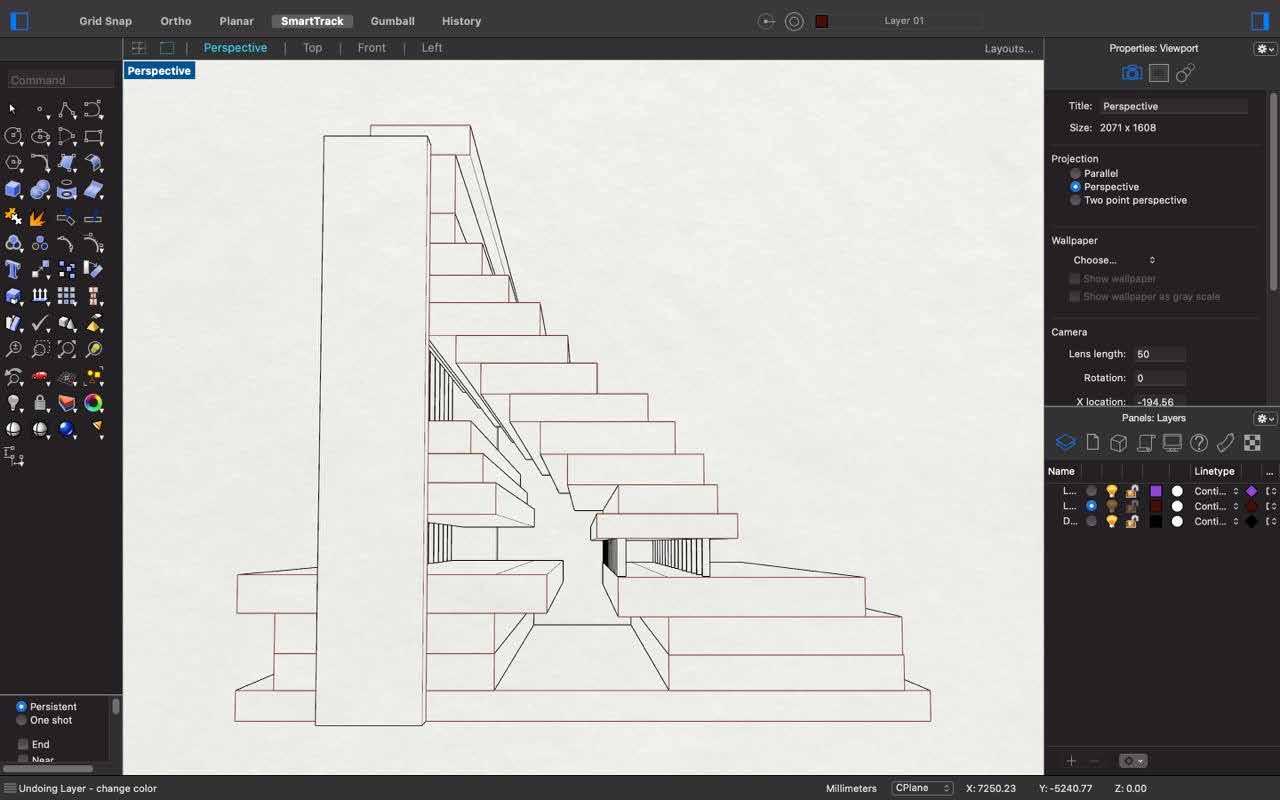

Computational design brings a set of process-driven and design strategies as complexities made possible by design capabilities evolved. As architecture shifts to value perfomative, iterative functions and less religious and philosophical ideologies, the premise for generative and evaluating architecture has correspondingly changed - focusing more on quantitative data. By understanding computer-aided design and digital fabrication as a tool, the translation of thought to form originates from the mind of the architect.
TOPIC B
ARCHITECTURAL REPRESENTATION IN COMPLEX GEOMETRIES
AND COMPUTATIONAL DESIGN THINKING
(3 bi-weekly assignments)

Discover: Digital Design, Extensive Properties (eg. Length, Area, Volume), Materiality, Rhino, Prototype

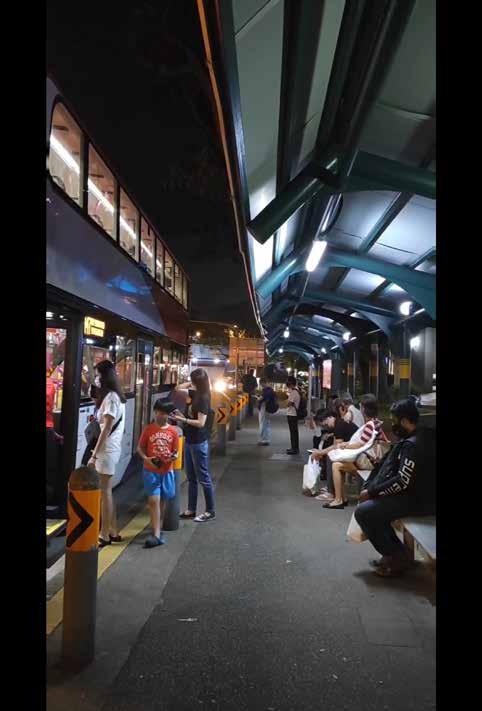
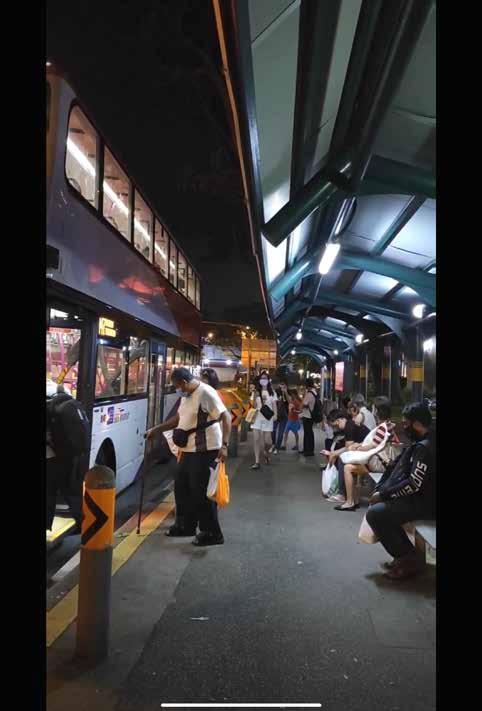
Each tutor had chosen a “site”- space and/or object within the SDE4 campus that is subject to frequent use and impact. For example, our studio chose the school bus stops. We were required to observe, count, quantify, measure the various effects, use, exertion etc. that this chosen “site” is subject to every day. These should be extensive qualities that can affect and alter the shape of a malleable material over time and may include impact to change of lengths, volumes, surface topographies, thickness etc. In our case, the change would be the deformation of the ground due to pressure exerted by passengers as they walk.
The objective of this exercise is to understand the means and ways that complex geometries can be achieved, what basic parametricism is and an initial undertaking of data collection and mapping. Design of freeforms, blobs and organic forms, afforded by new mathematical formulas and language, found new life in digital architectural design software by way of NURBS, mesh, splines. However, the hand too has long had the ability to record, resolve and construct complex geometries, such as needed in ship building. While to construct anything by hand takes a longer time, as a student of architecture and form making, it is important to understand the ideology and underpinnings to the rise of complex geometries: what they represent, how they manifest; to study and encapsulate complex forms and their intended consequences.
In this digital age, computer softwares seem to be indispensable to designers. For our studio, the entire Topic B aims to find answers for two question:
• What is the relationship between us designers and computers?
• How far can we go without the help of softwares?
Screenshot of video every 1.5 seconds
Video was taken at NTUC Fairprice Bus Stop zon September 27, 2021
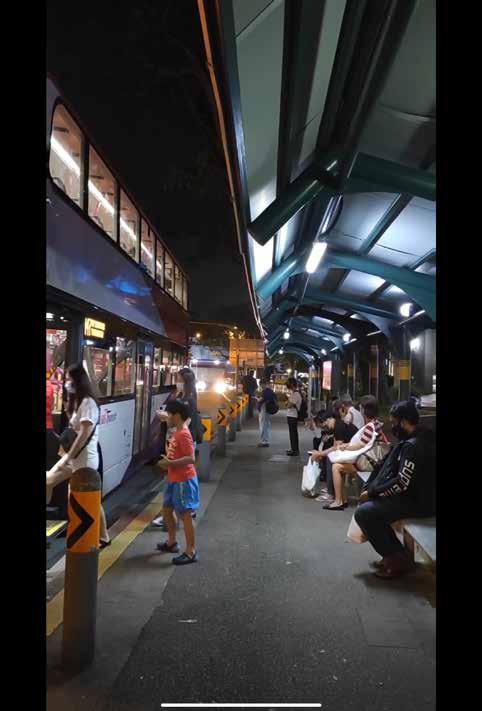
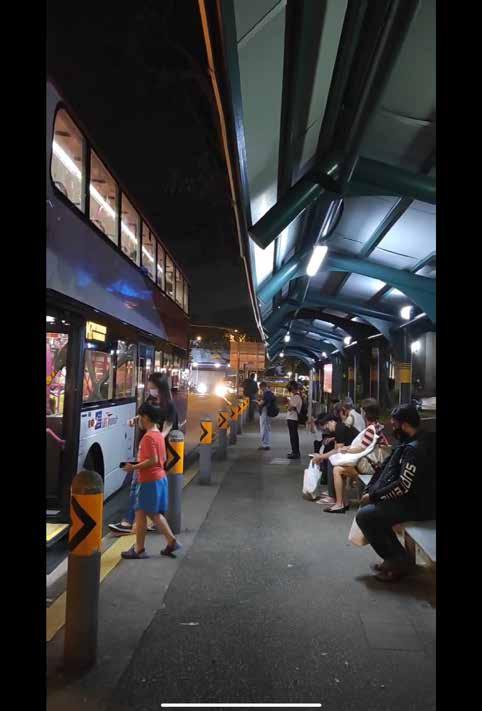
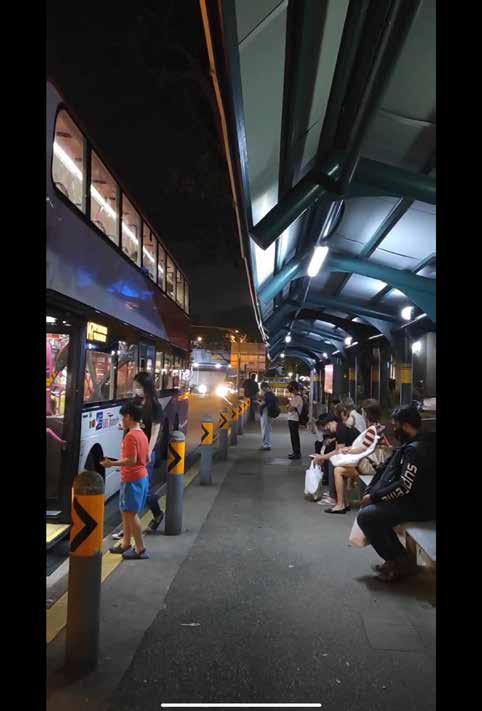
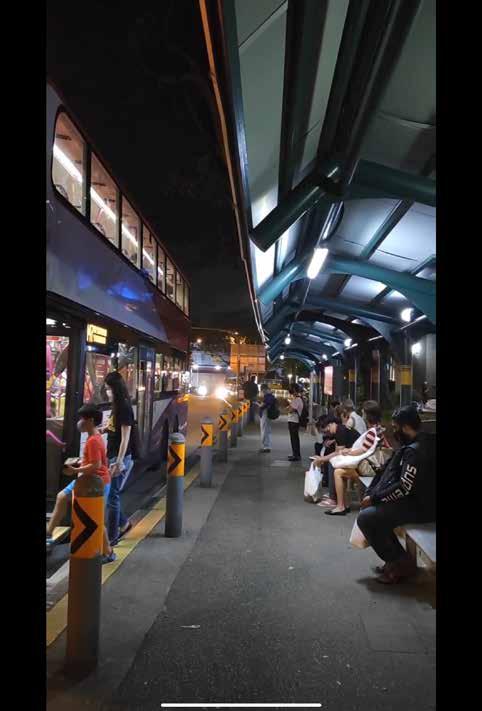
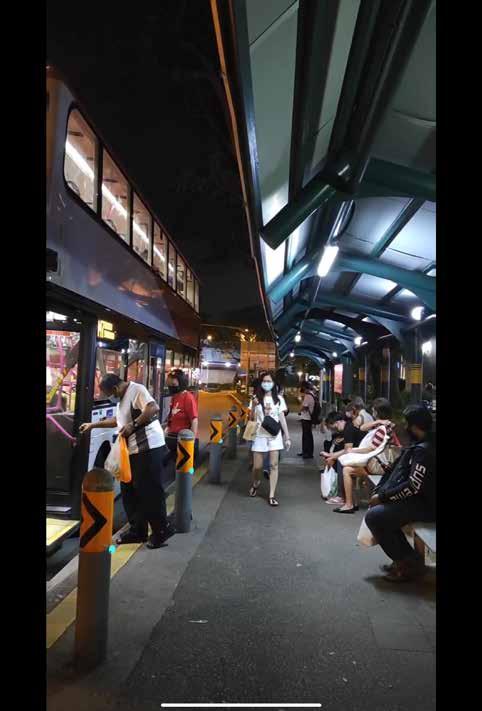
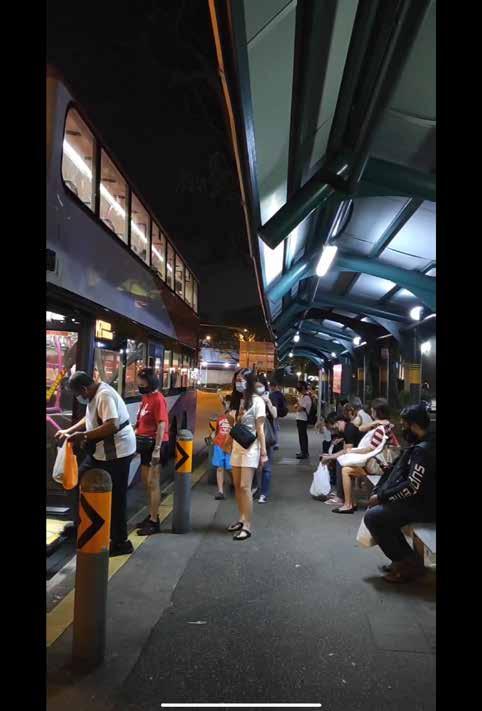
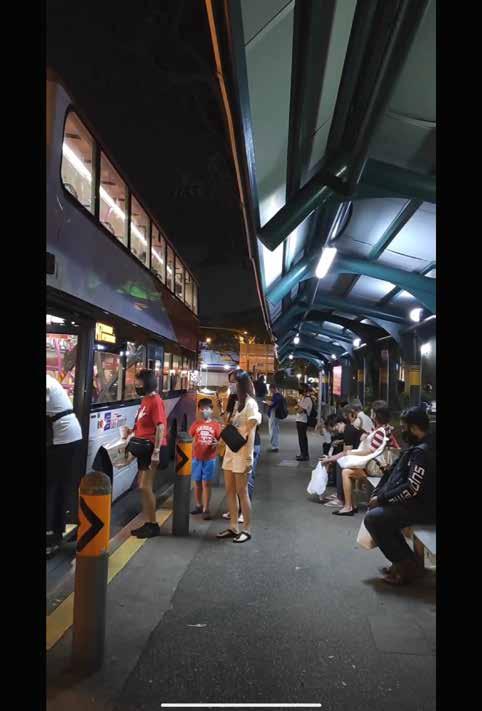
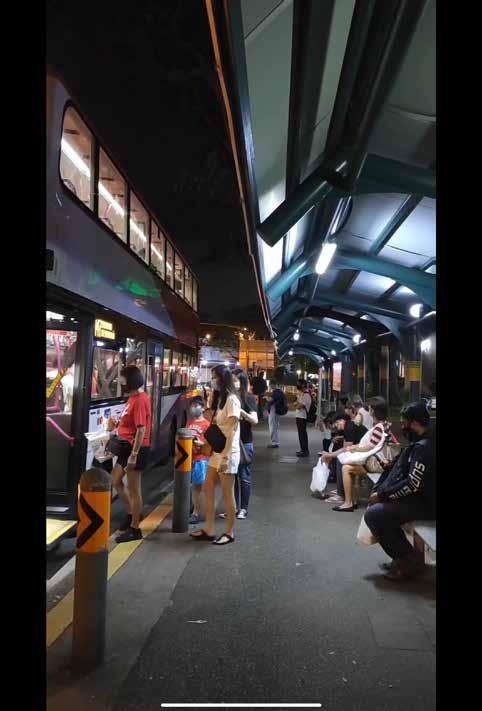
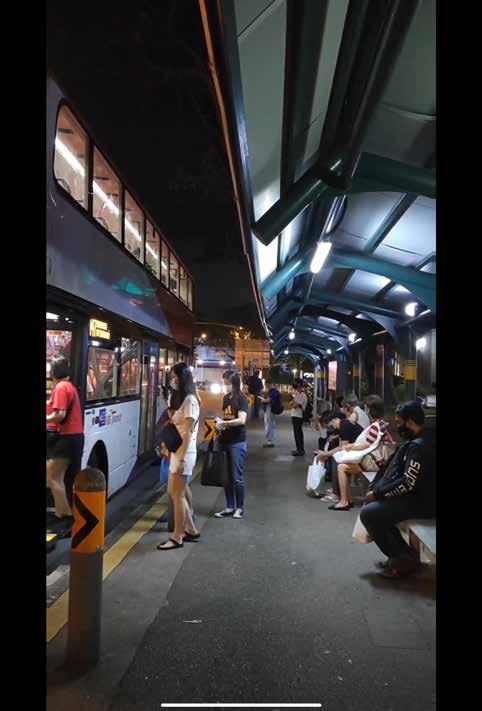
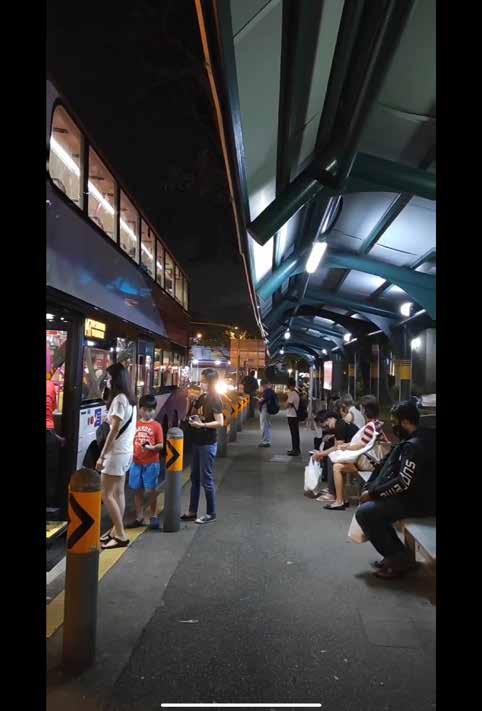
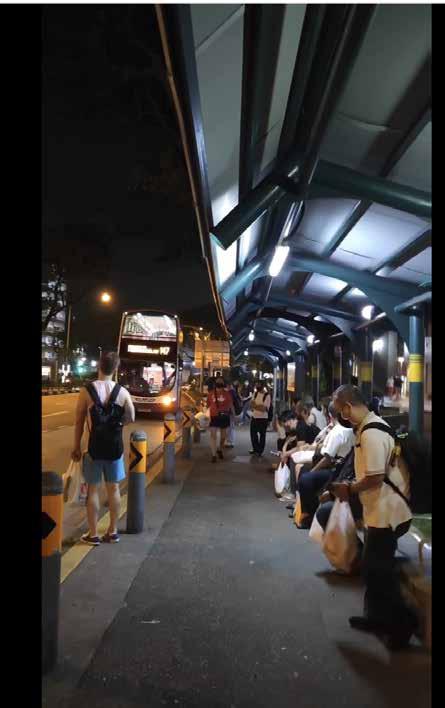
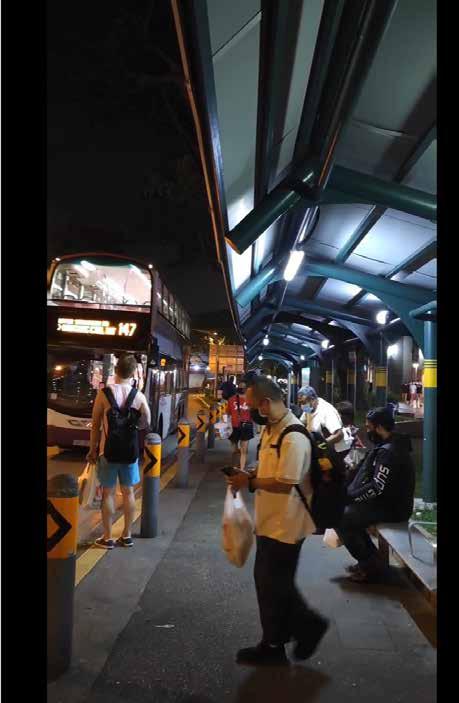
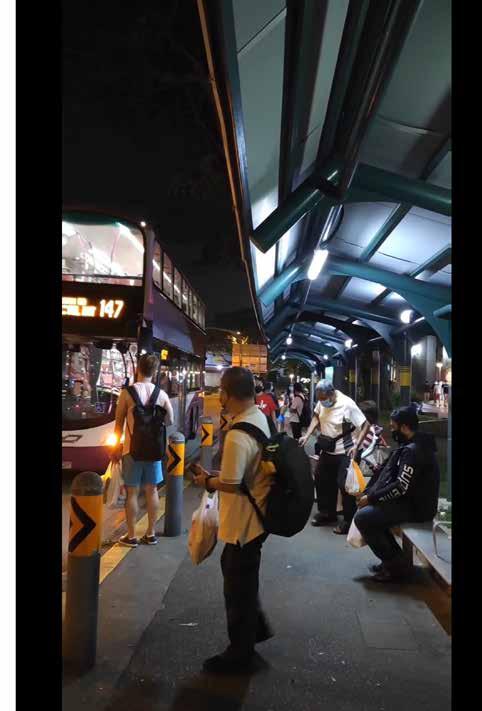
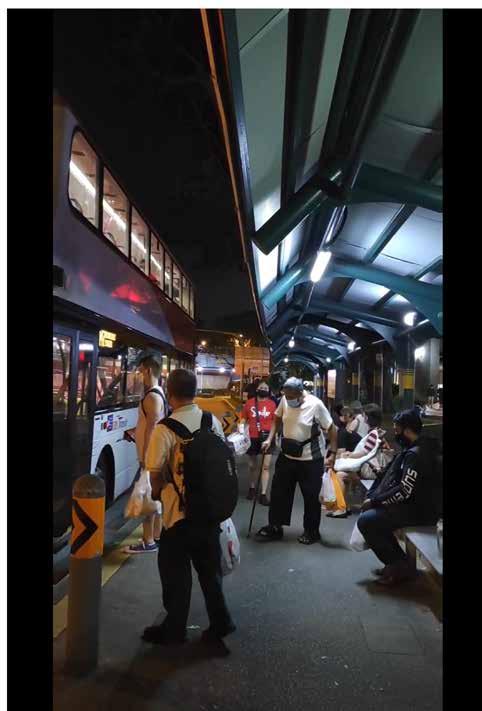
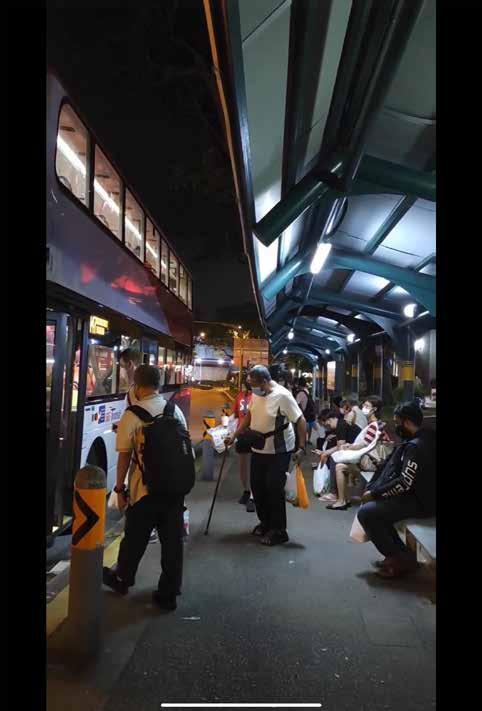
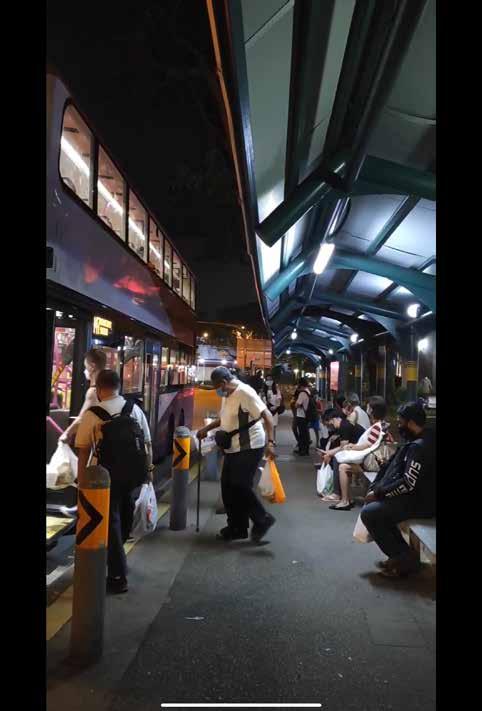
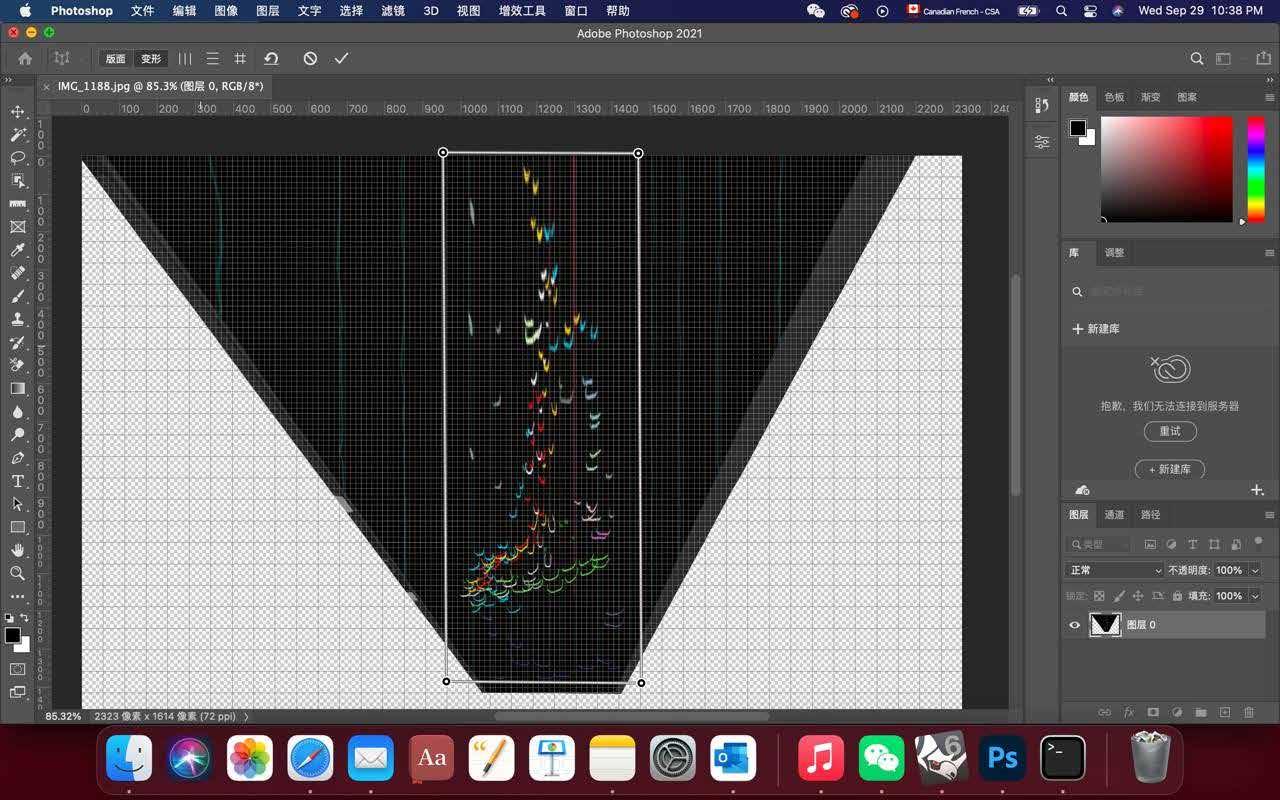
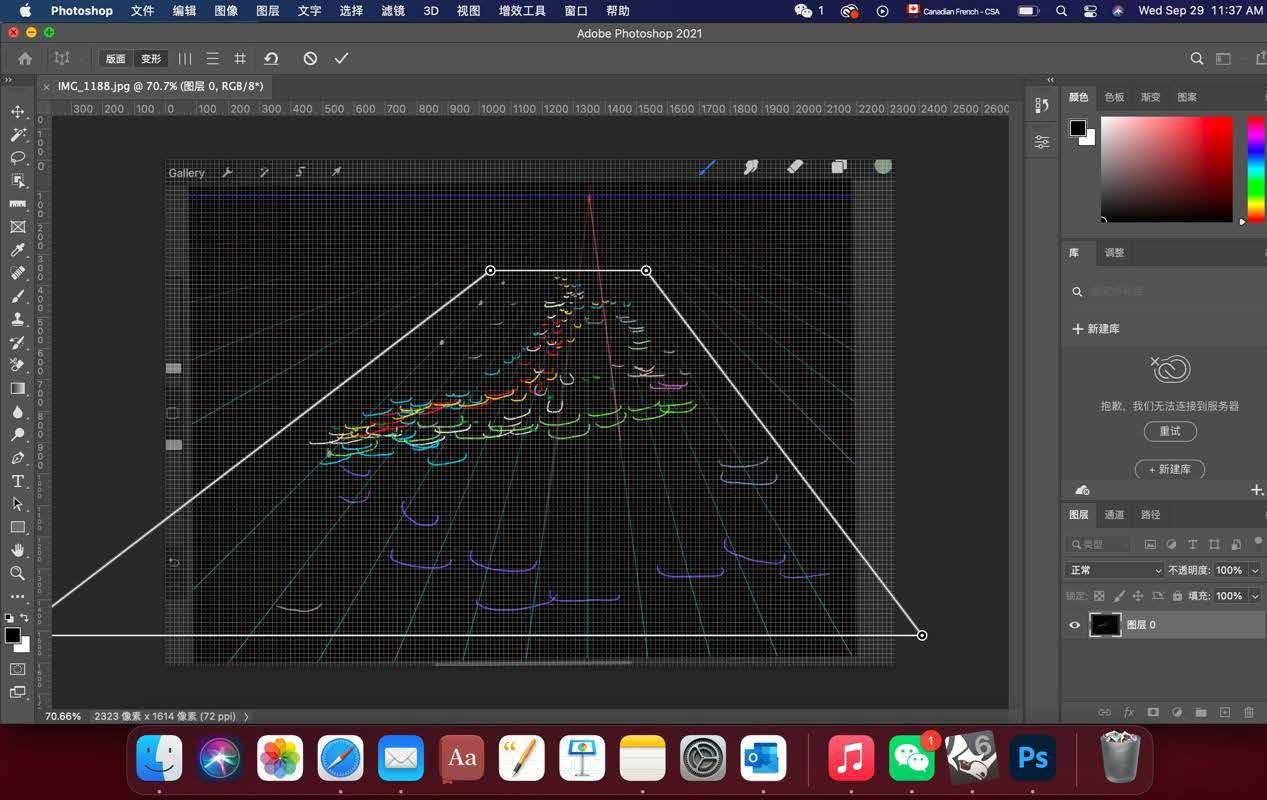

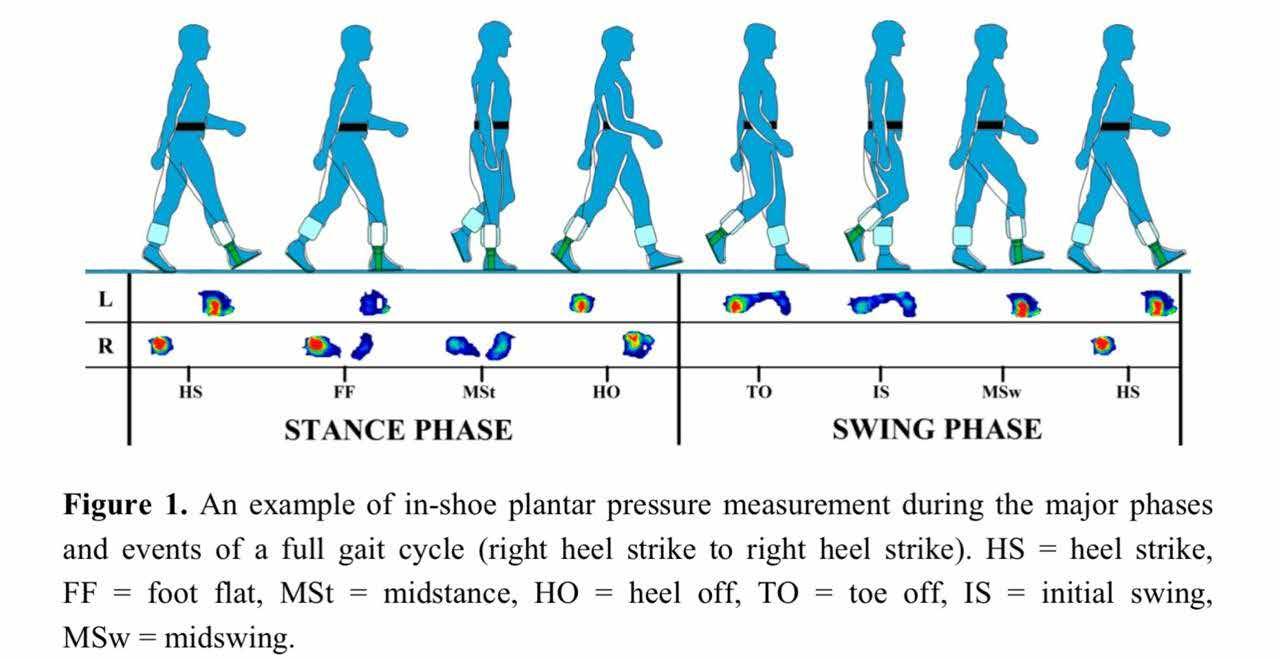
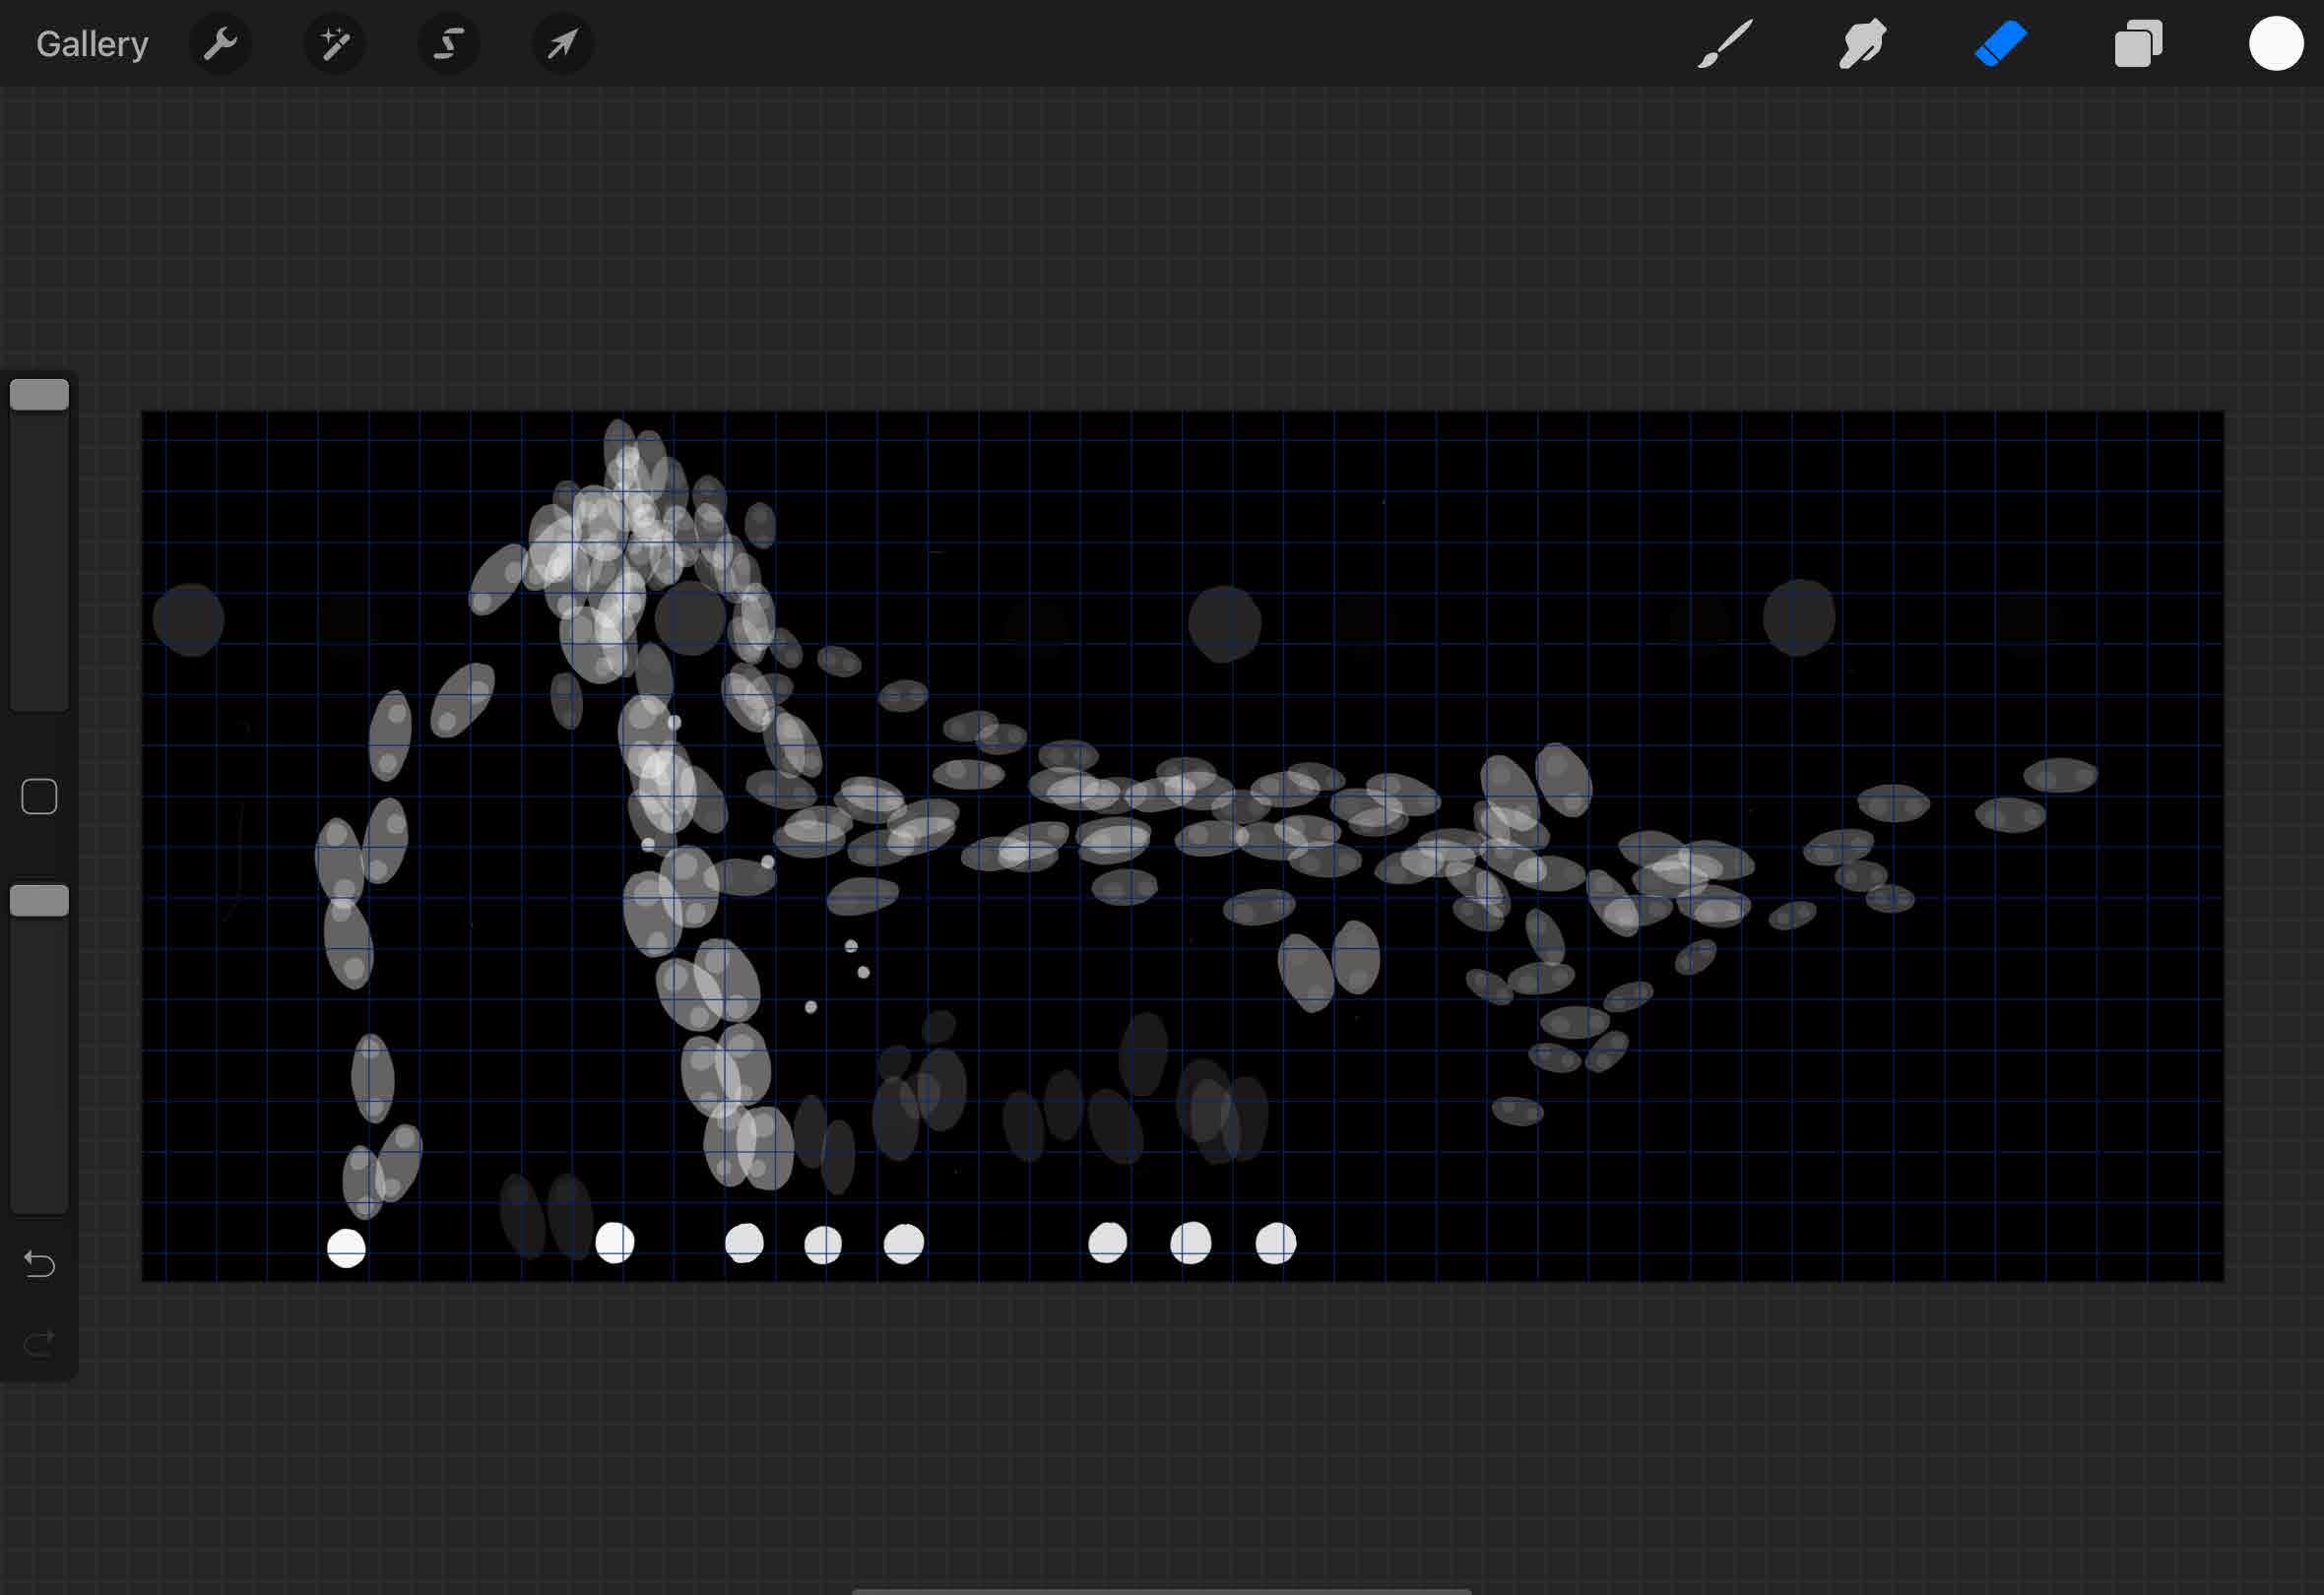
3. Calculating the pressure exerted by each passenger on the ground. Considering factors such as weight distribution and area of contact. In particular, the front and back of foot exert more pressure on the ground in a person’s full gait cycle.
 1. Tracing out the footprints of each passenger in different colors
Behaviors and walking speeds can be observed in the graph. For example, the small green dots around the series of very close big green circles show the old man walking slowly towards the bus with a walking stick. The curvy chain of sky blue footprints is created by the young boy wandering around.
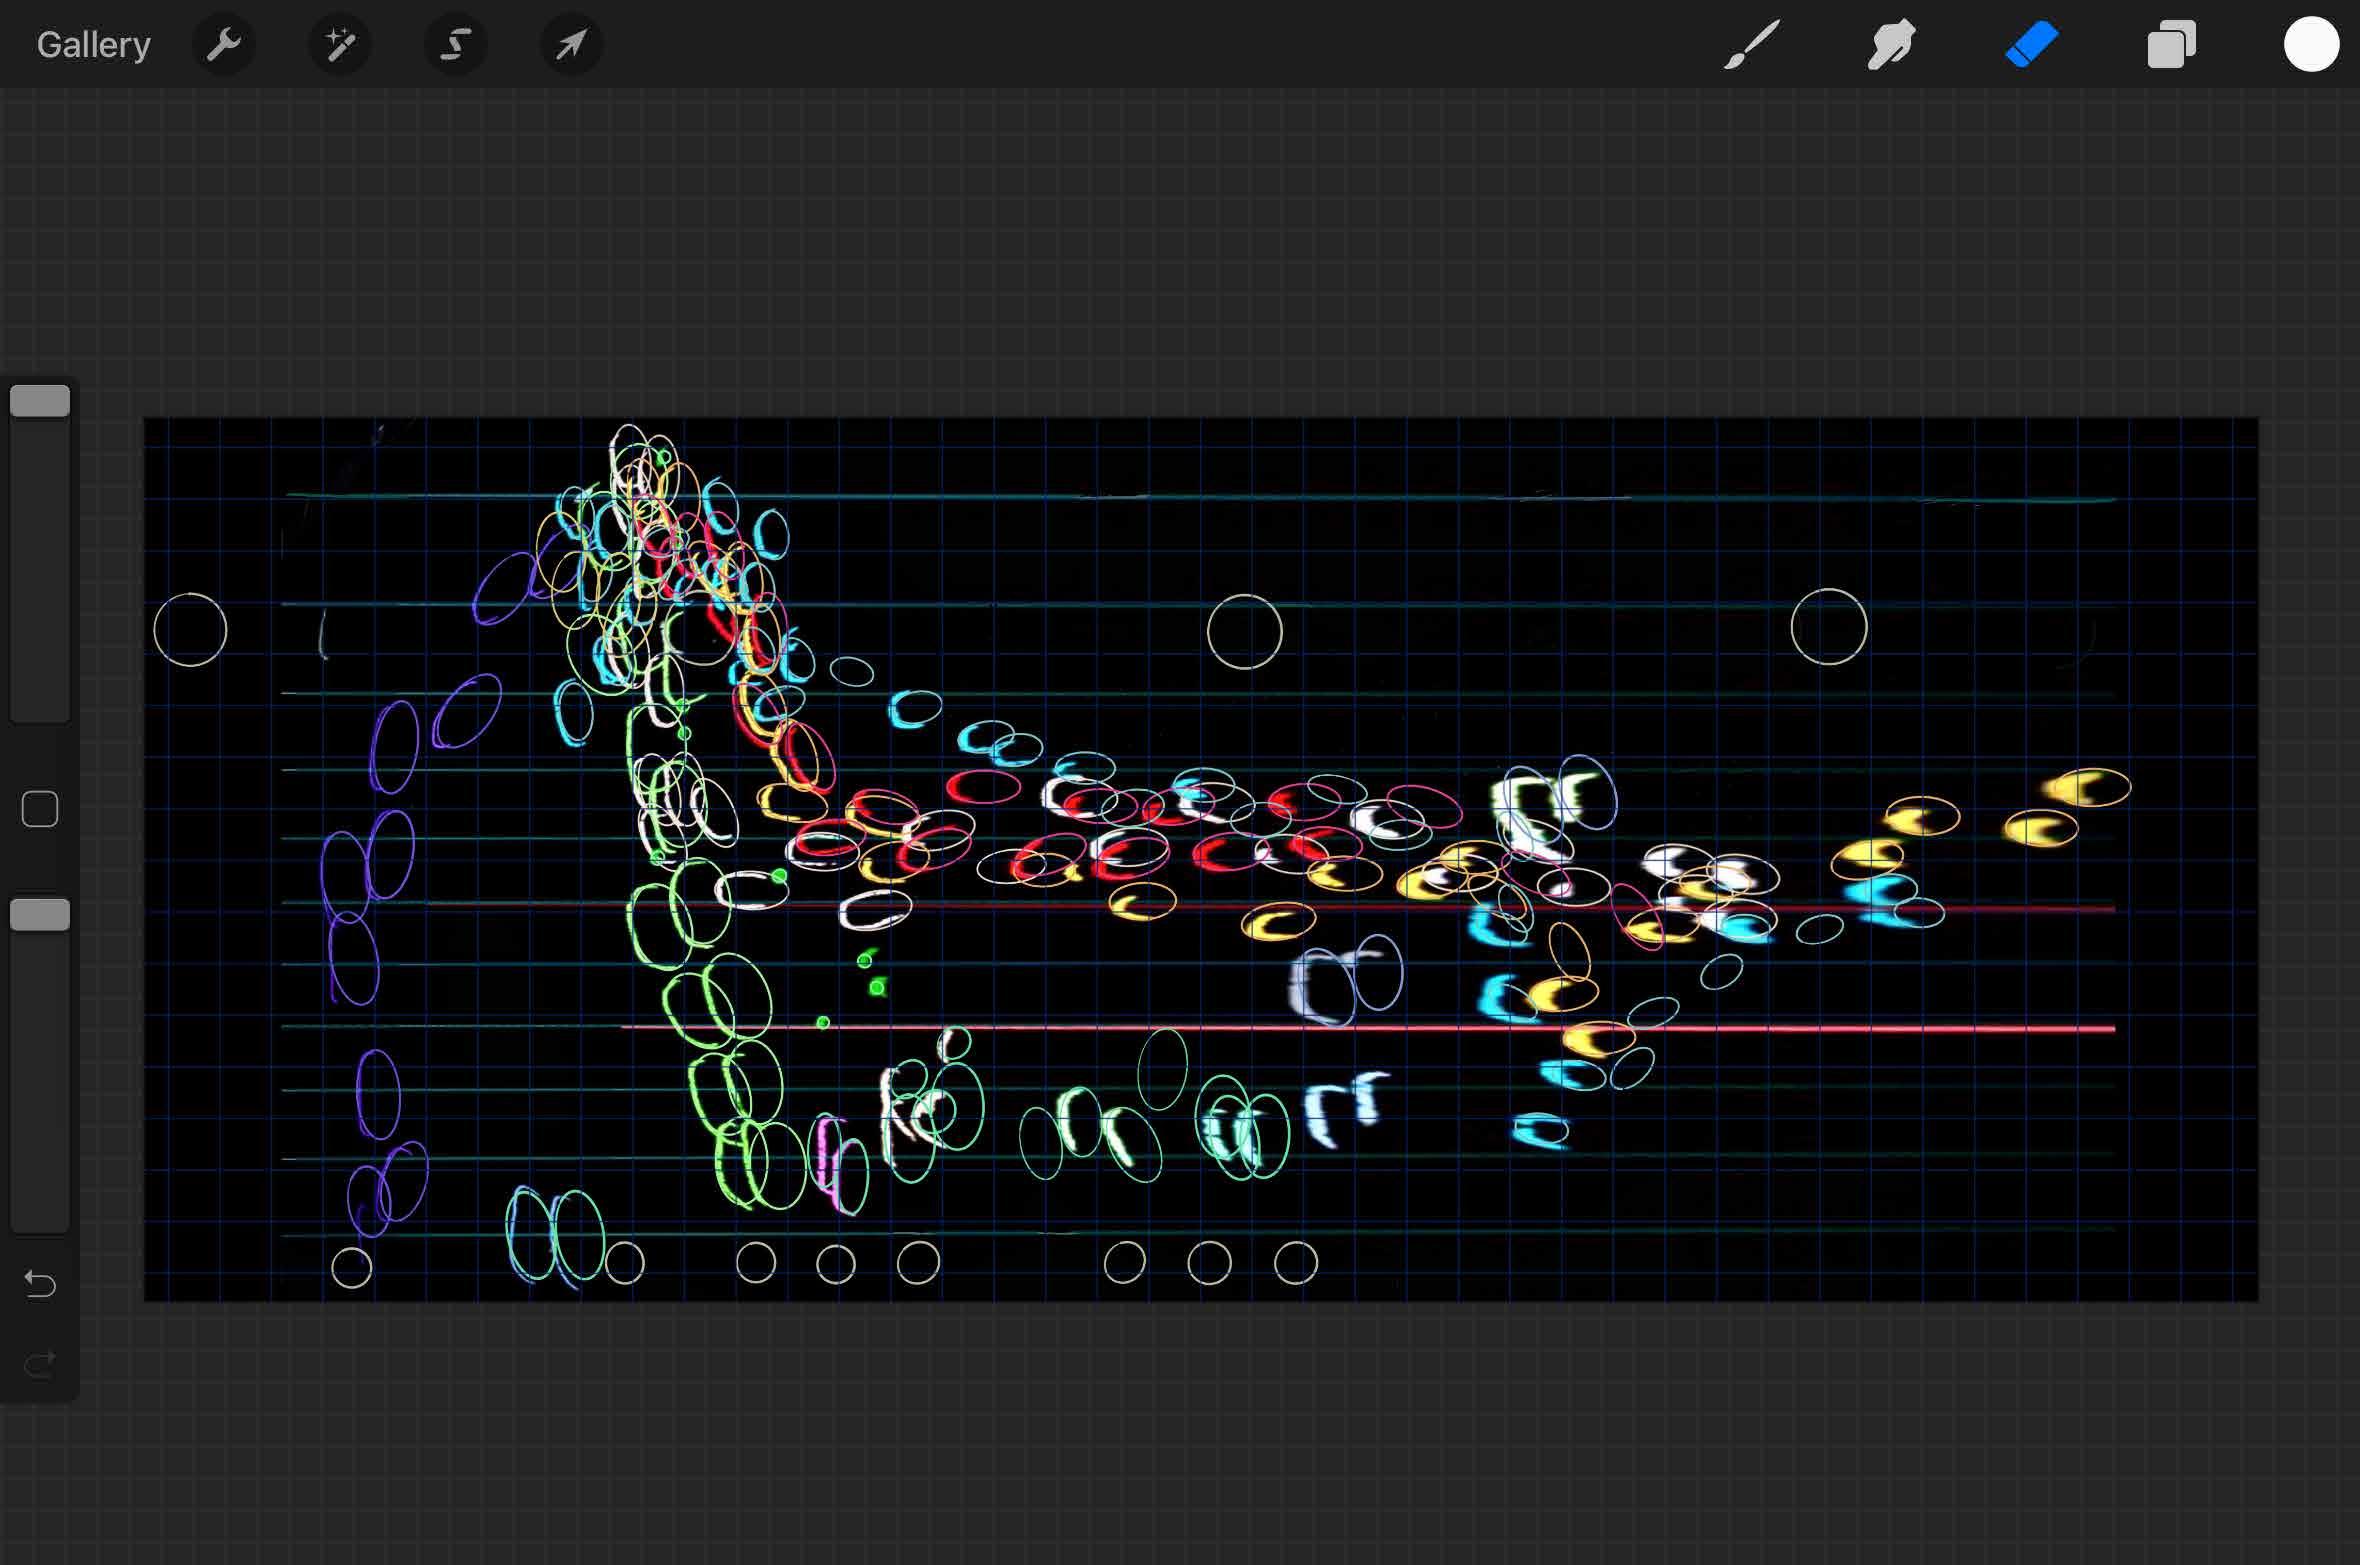
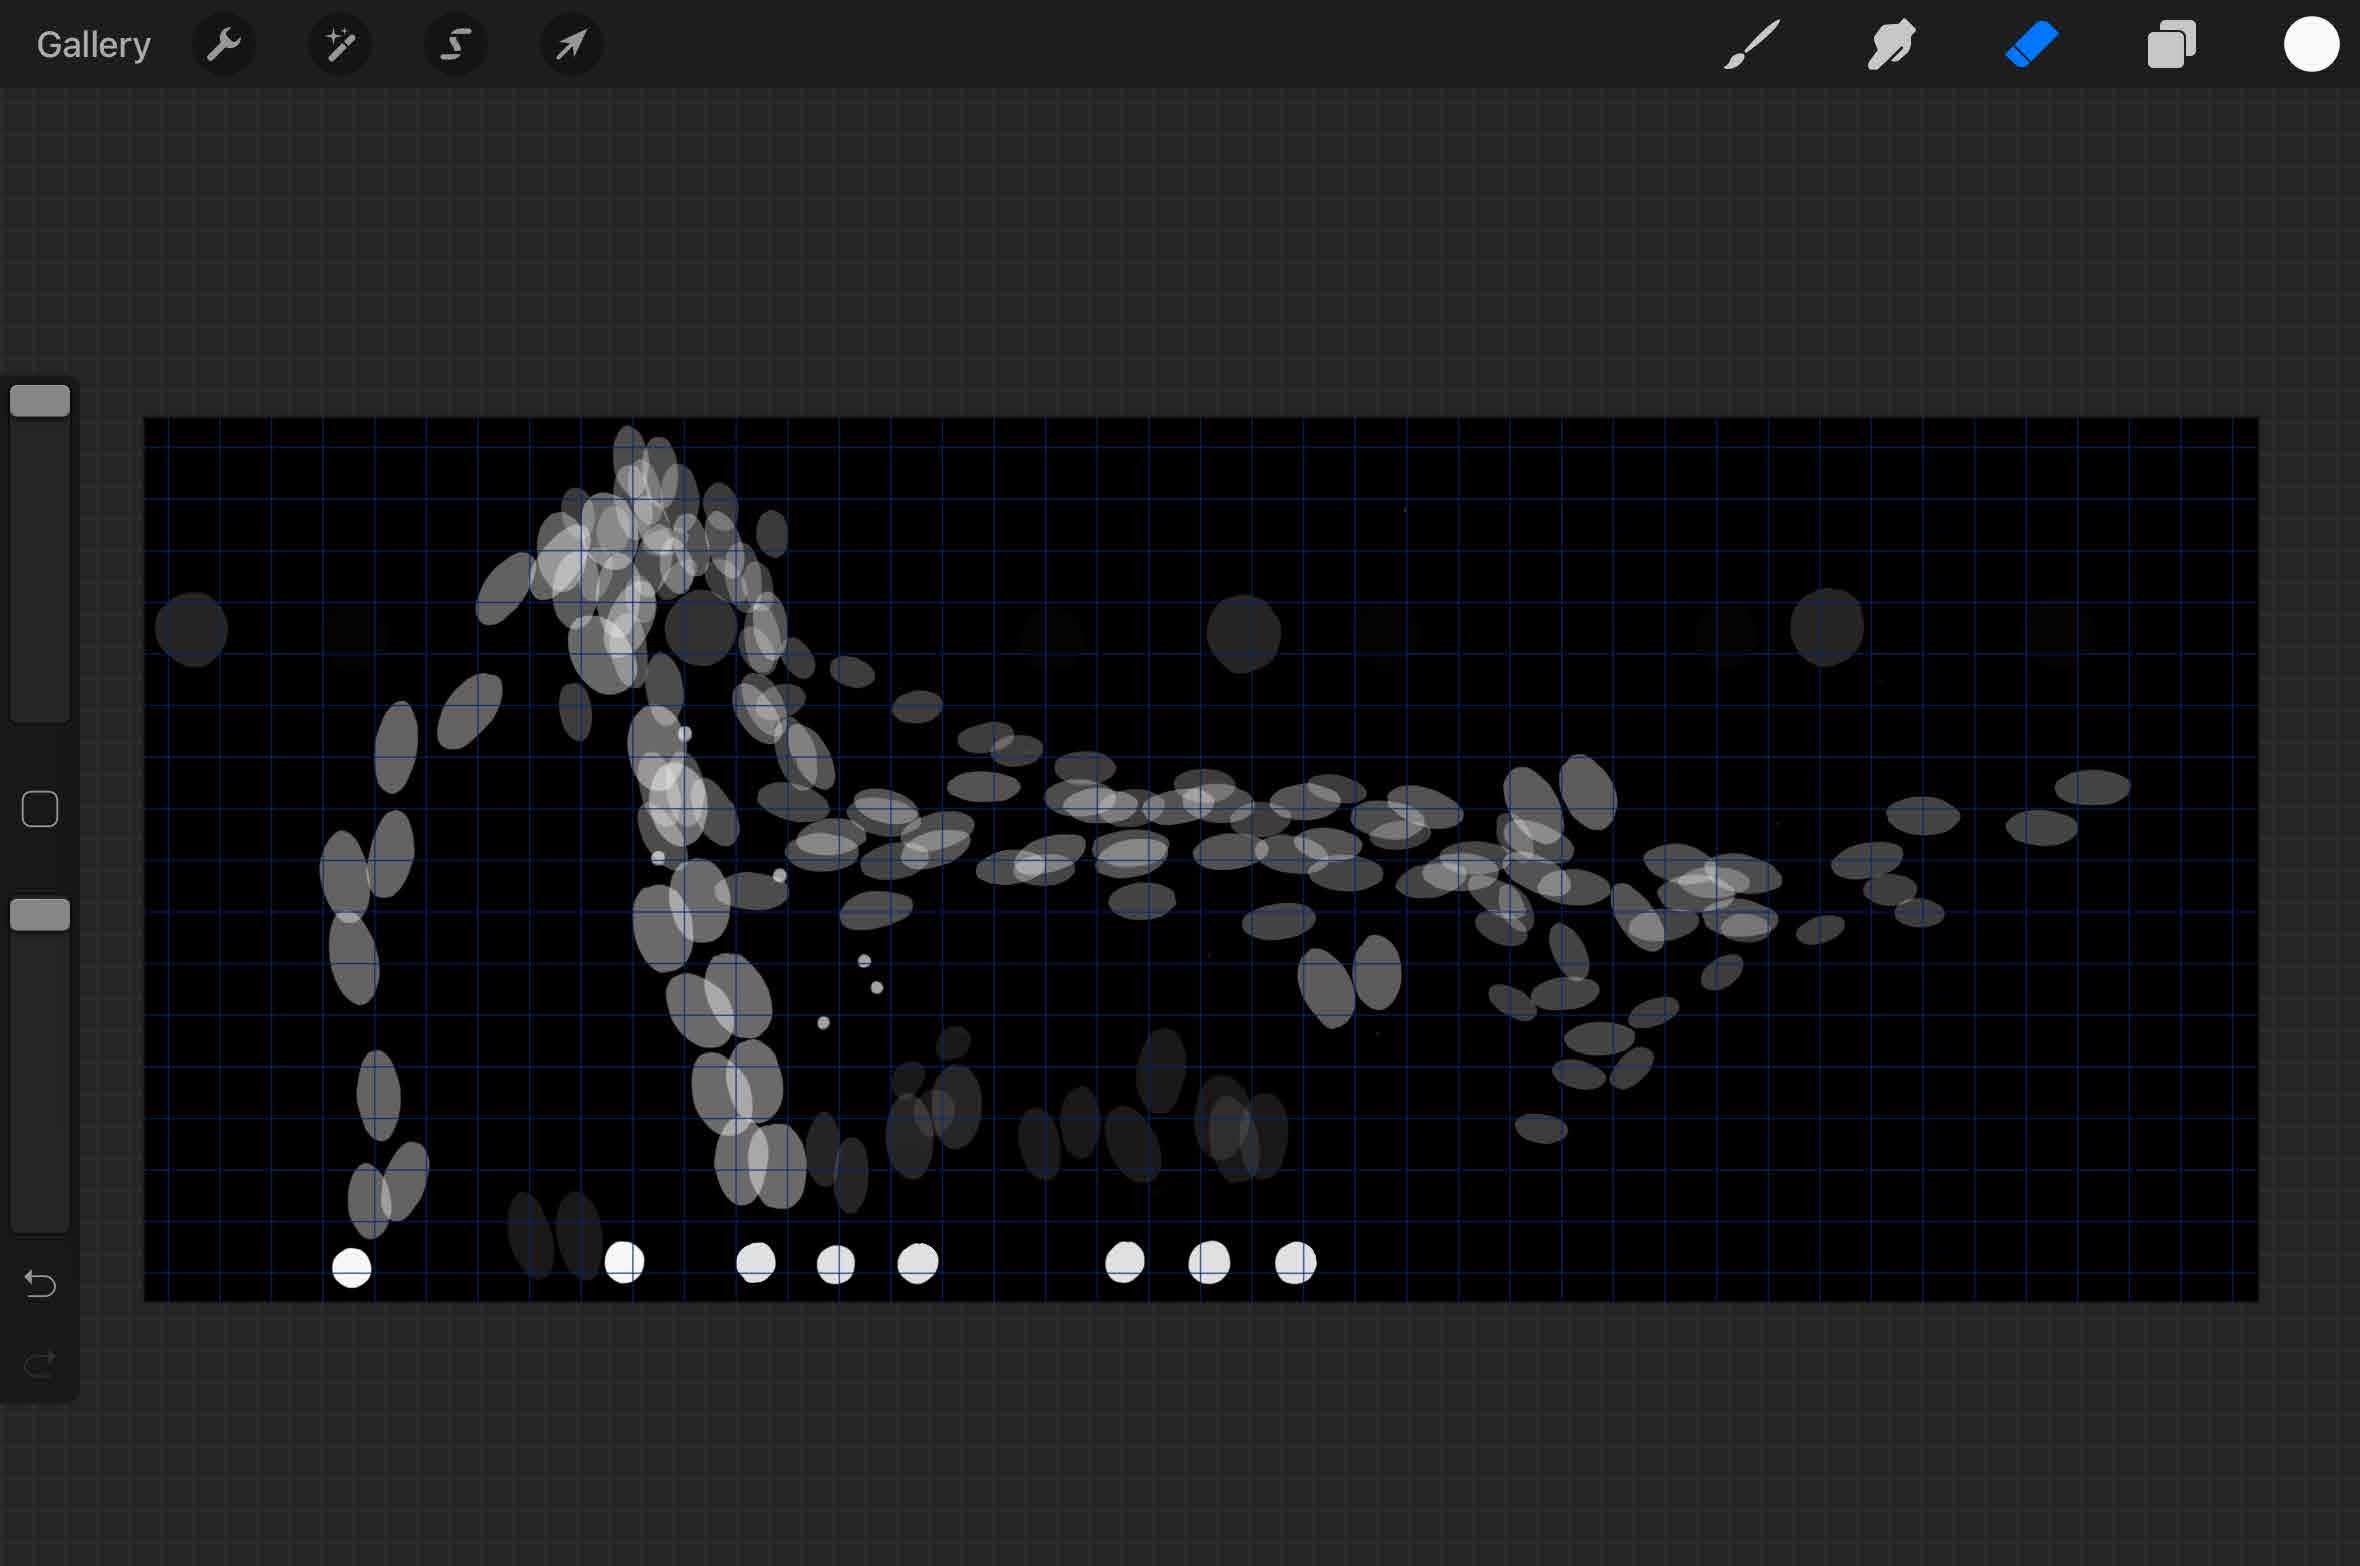

Pressure at each point is reflected by the opacity of white. The whiter the area, the greater the force exerted and/or the larger the number of footprints. An additional layer is included to indicate the front and back of each foot.
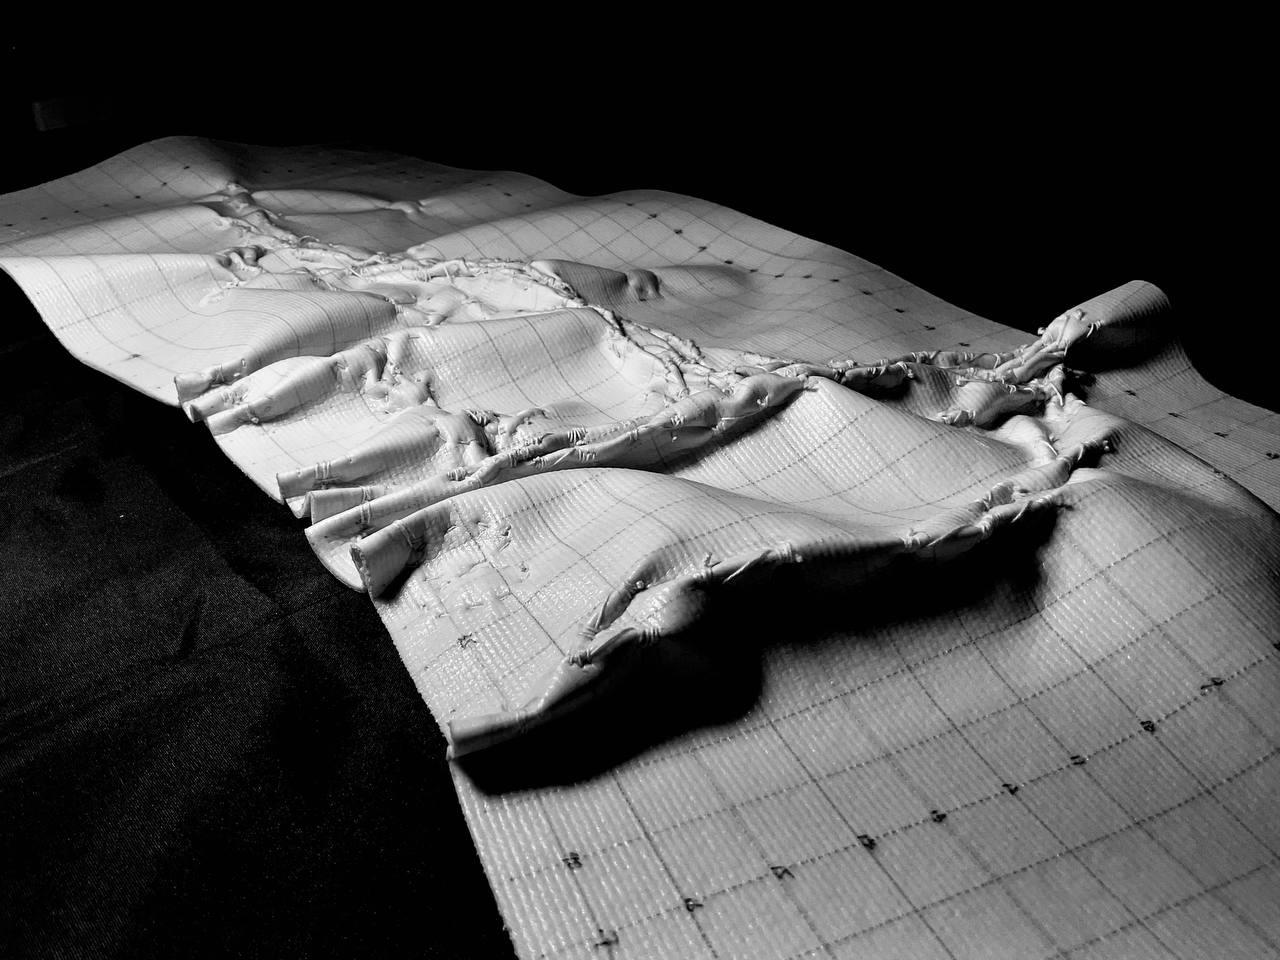
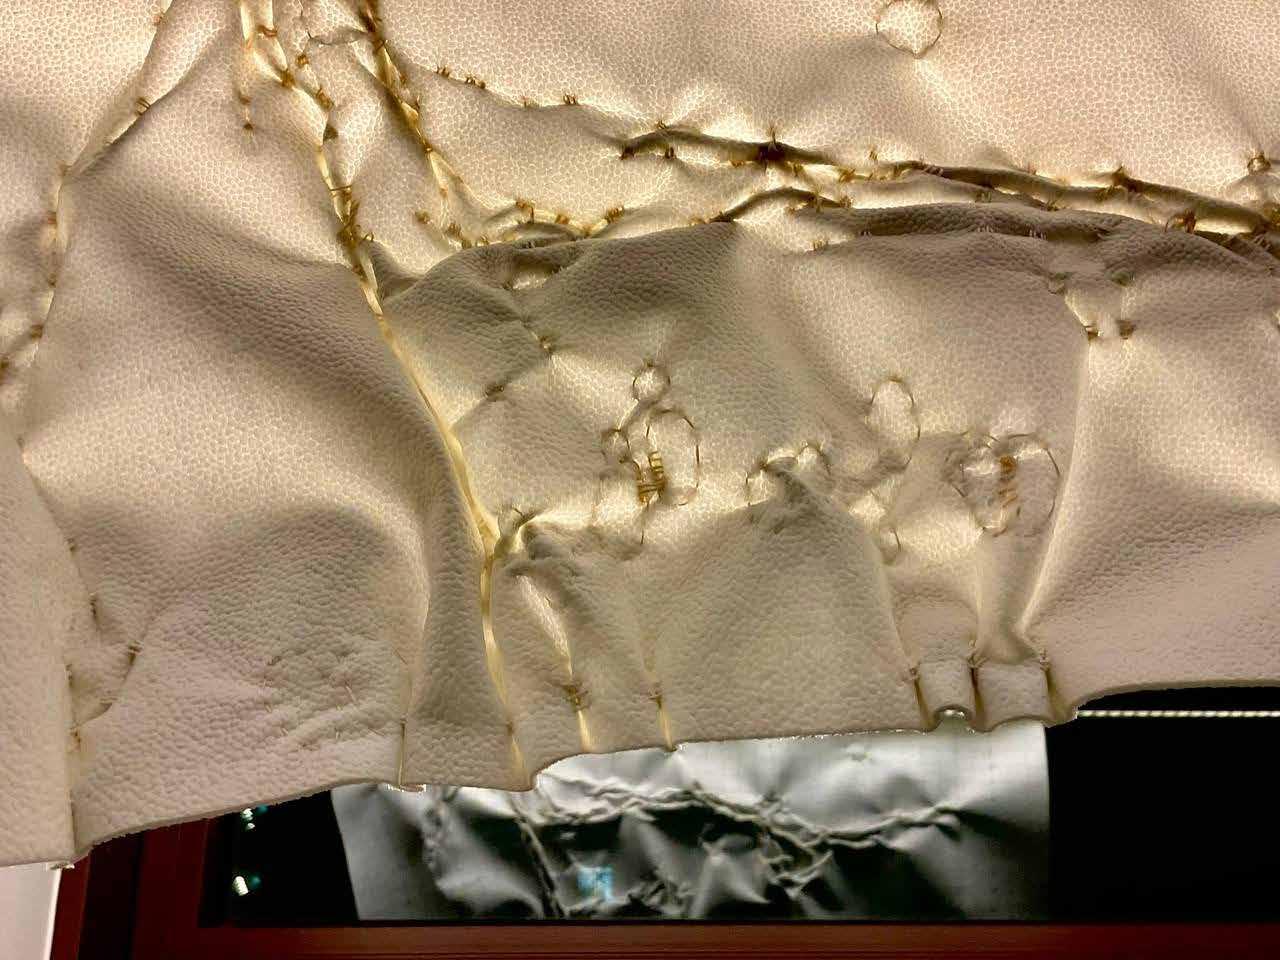
Then, starting with a malleable envelop material, vinyl sheet, that my studio tutor had selected for the “site”, we would transcribe transformations onto the chosen material, that due to recurrent use, force impacts will result in depressions, deformations etc. Through these actions over time, the new “sites” should register, respond, and undergo a series of formal transformations. Over time, and with repeated interactions and areas of contact with people, the “site” would result in a final organic form.


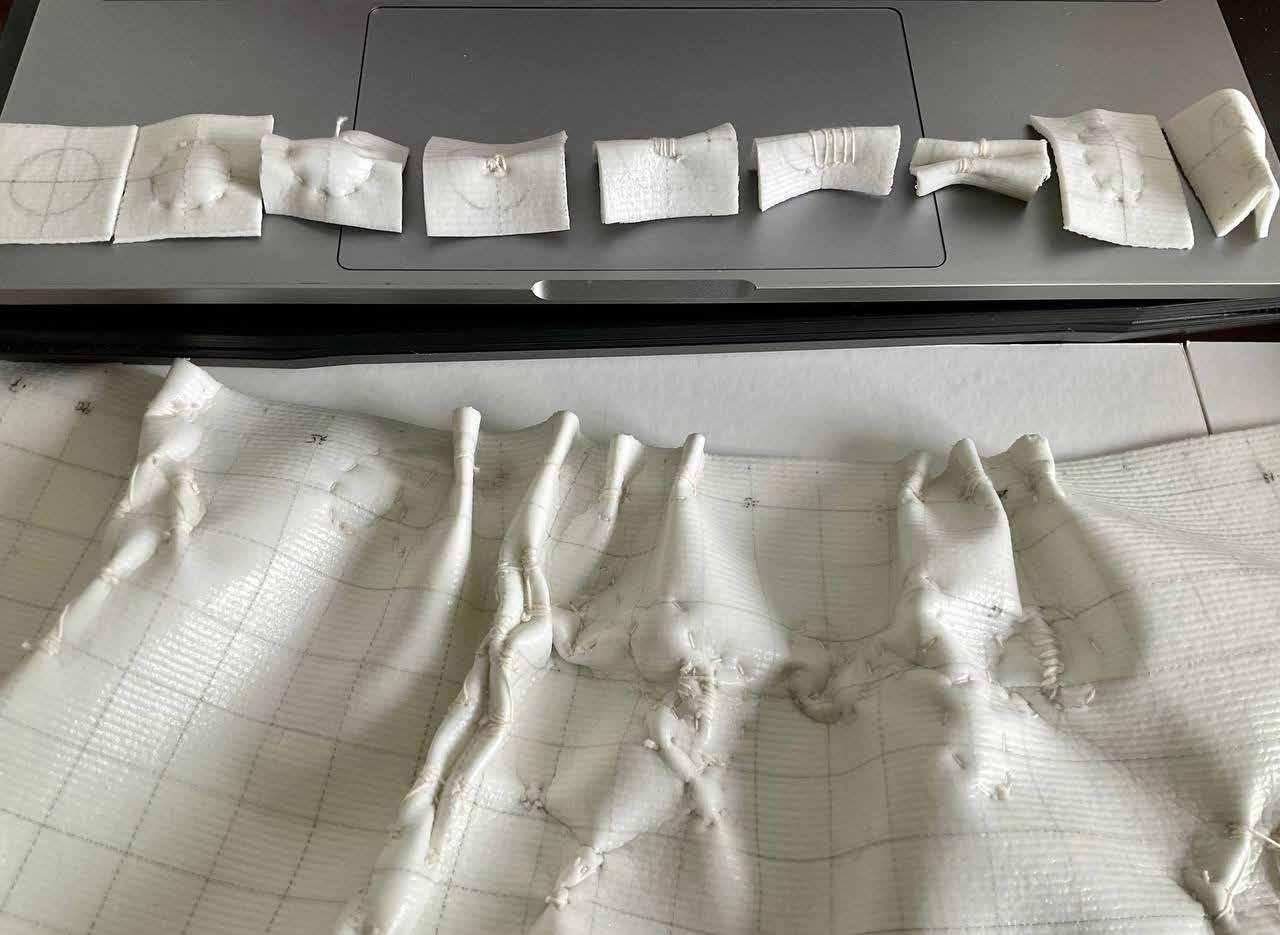
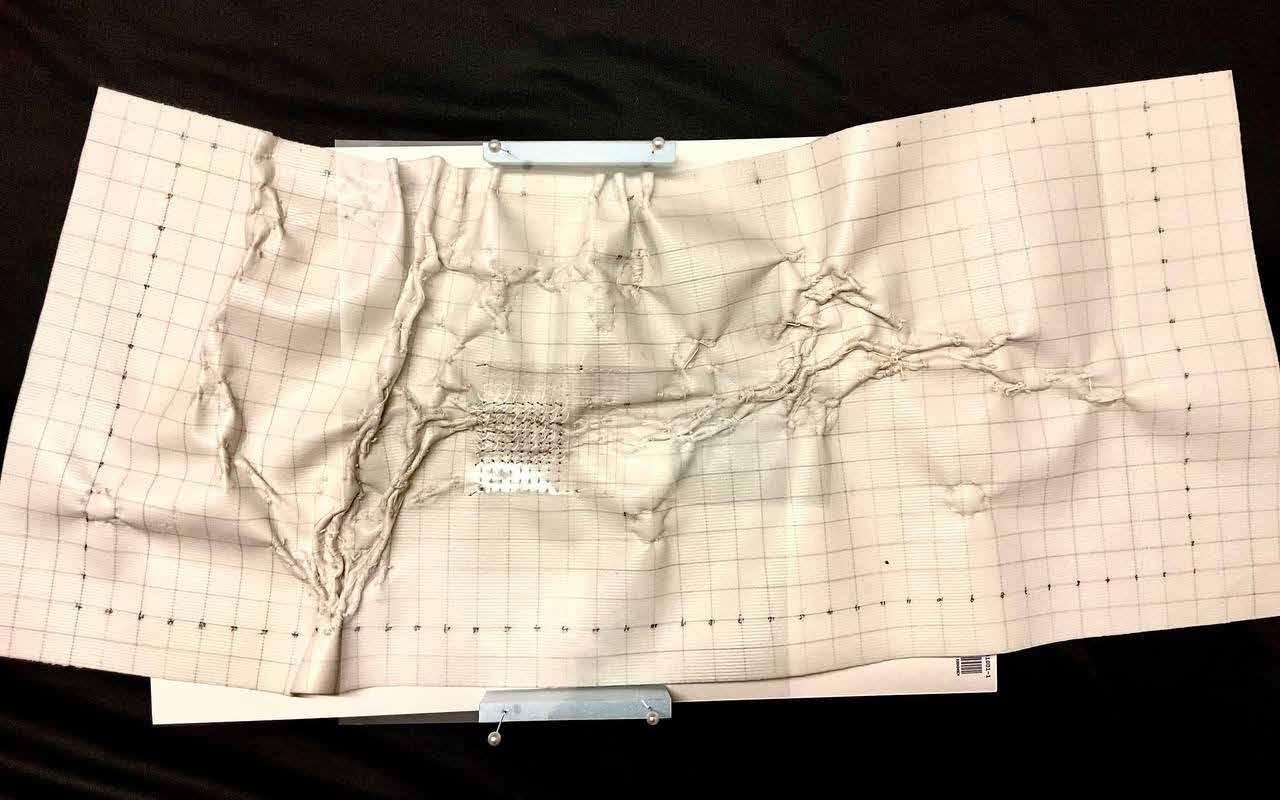
Lastly, we were tasked to design a measuring device with which the responsive model was measured, dimensions taken, for drawing.
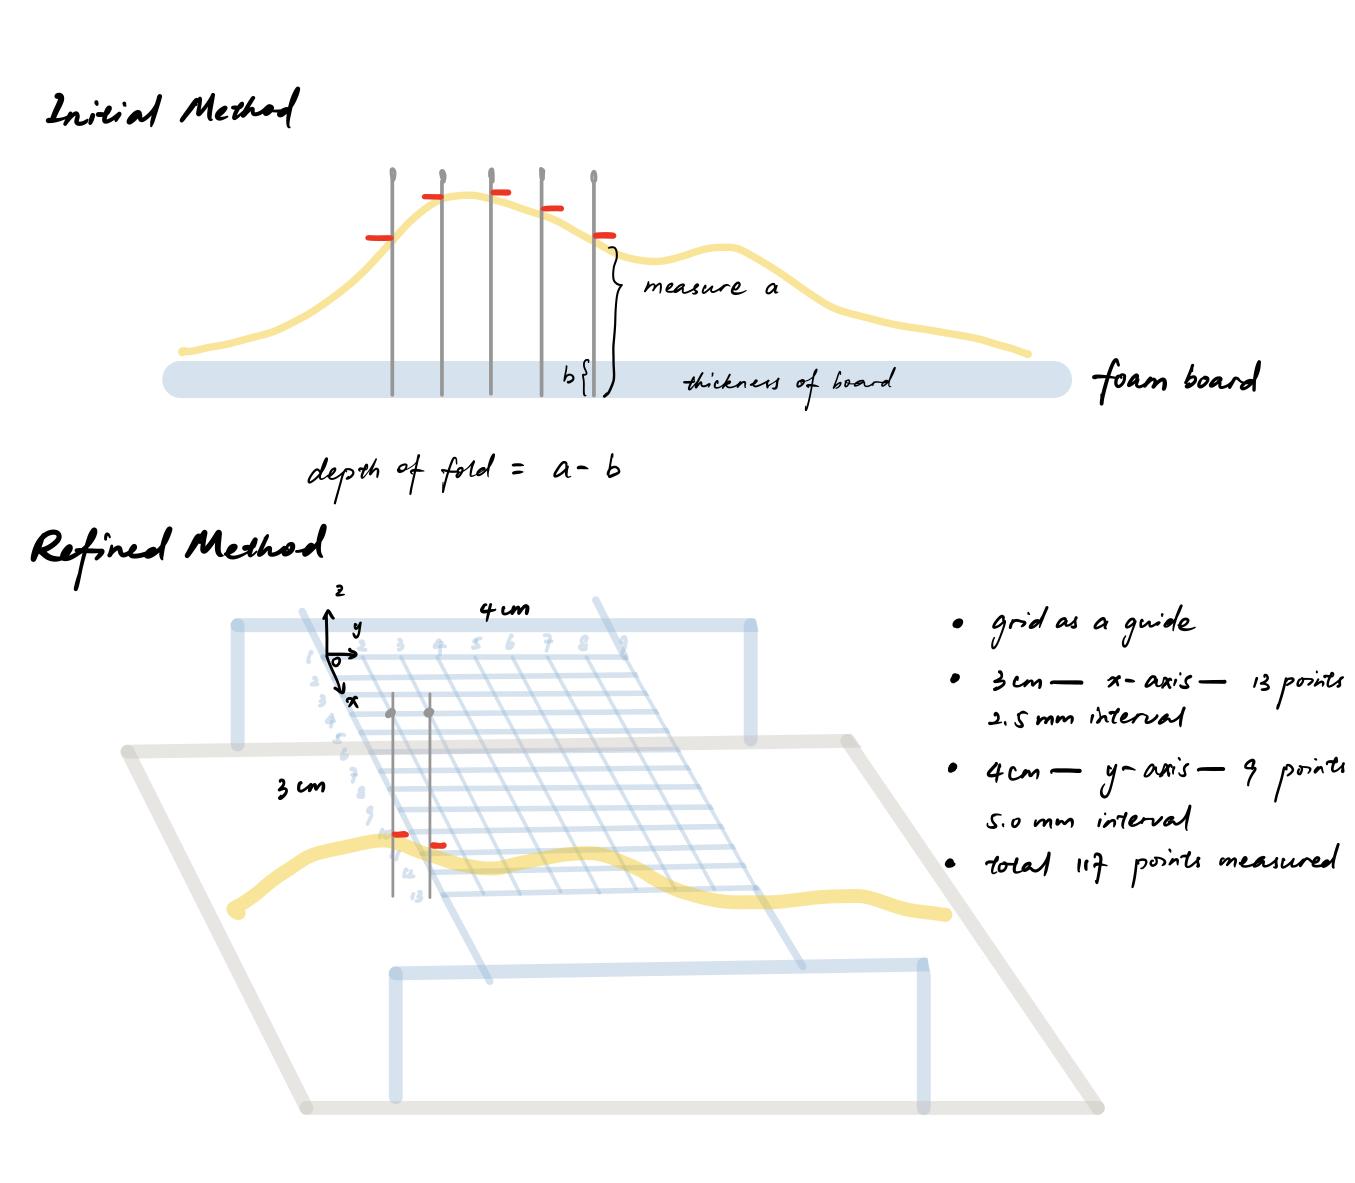
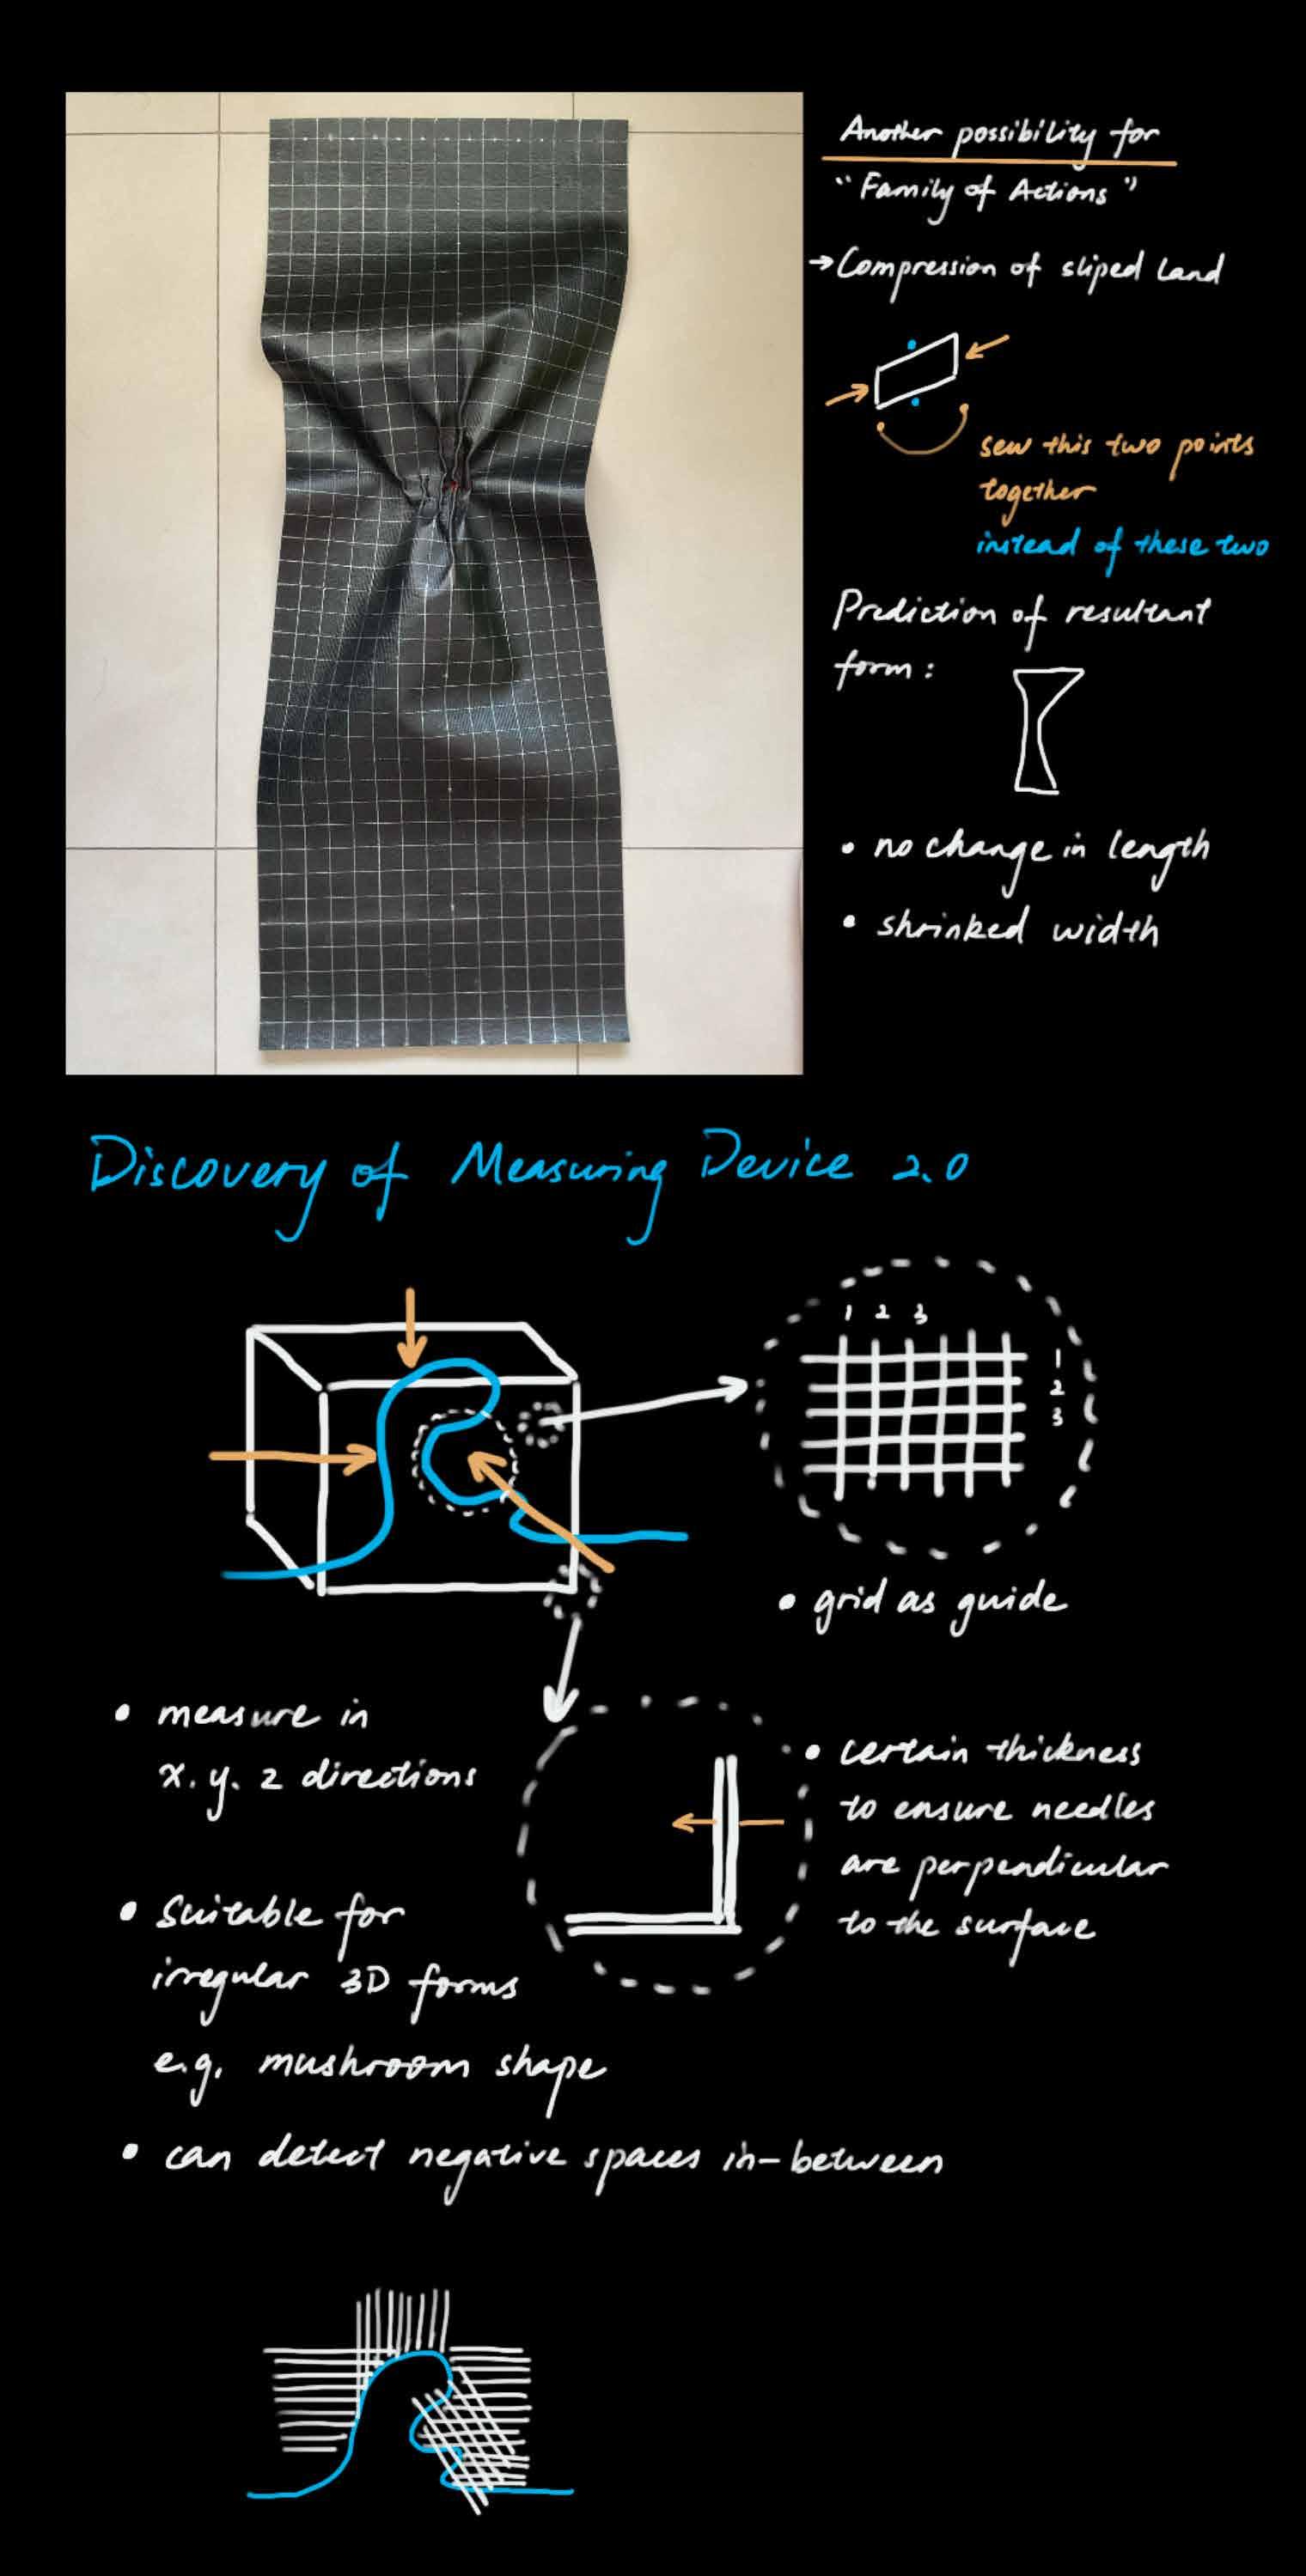
After all the trial and error with the use of metal wires and hardened threads, I suddenly discovered that the sharp needles can best measure the depth of a point precisely, without damaging the model as compared to casting.
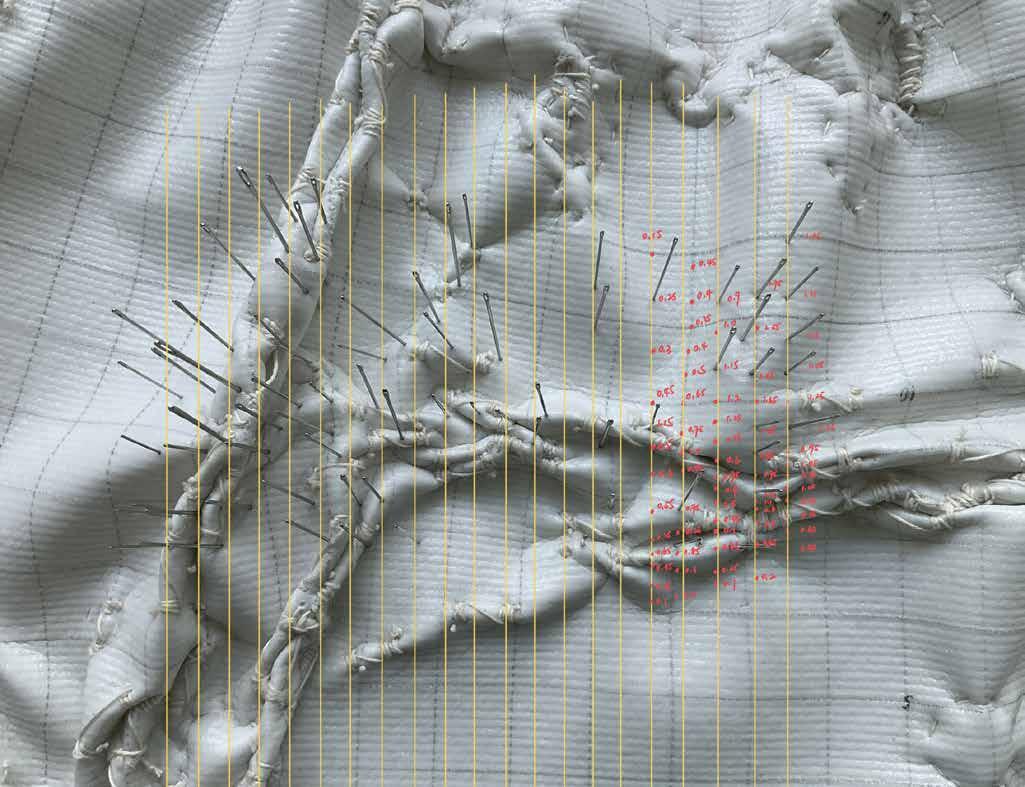
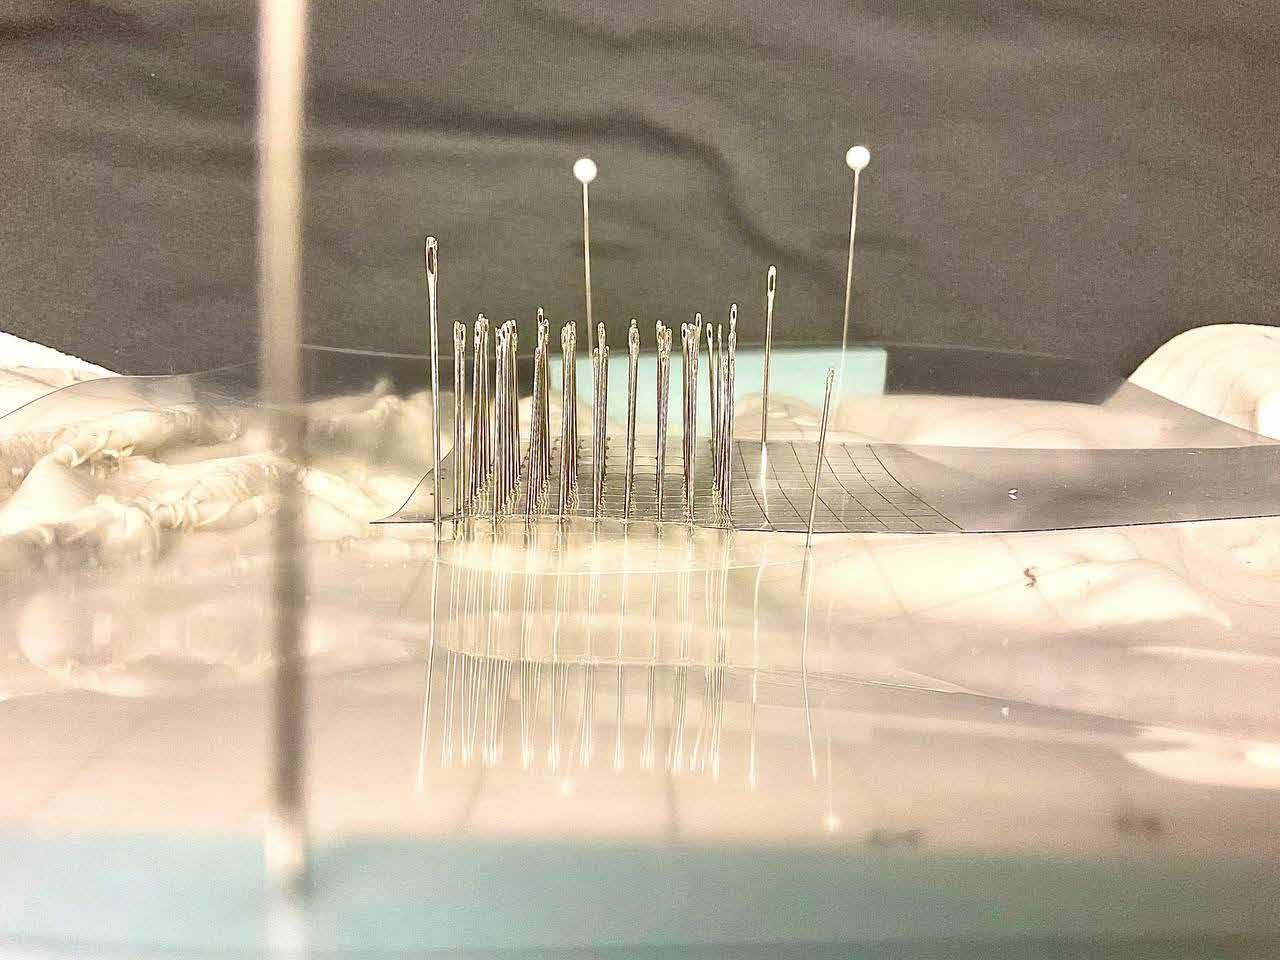
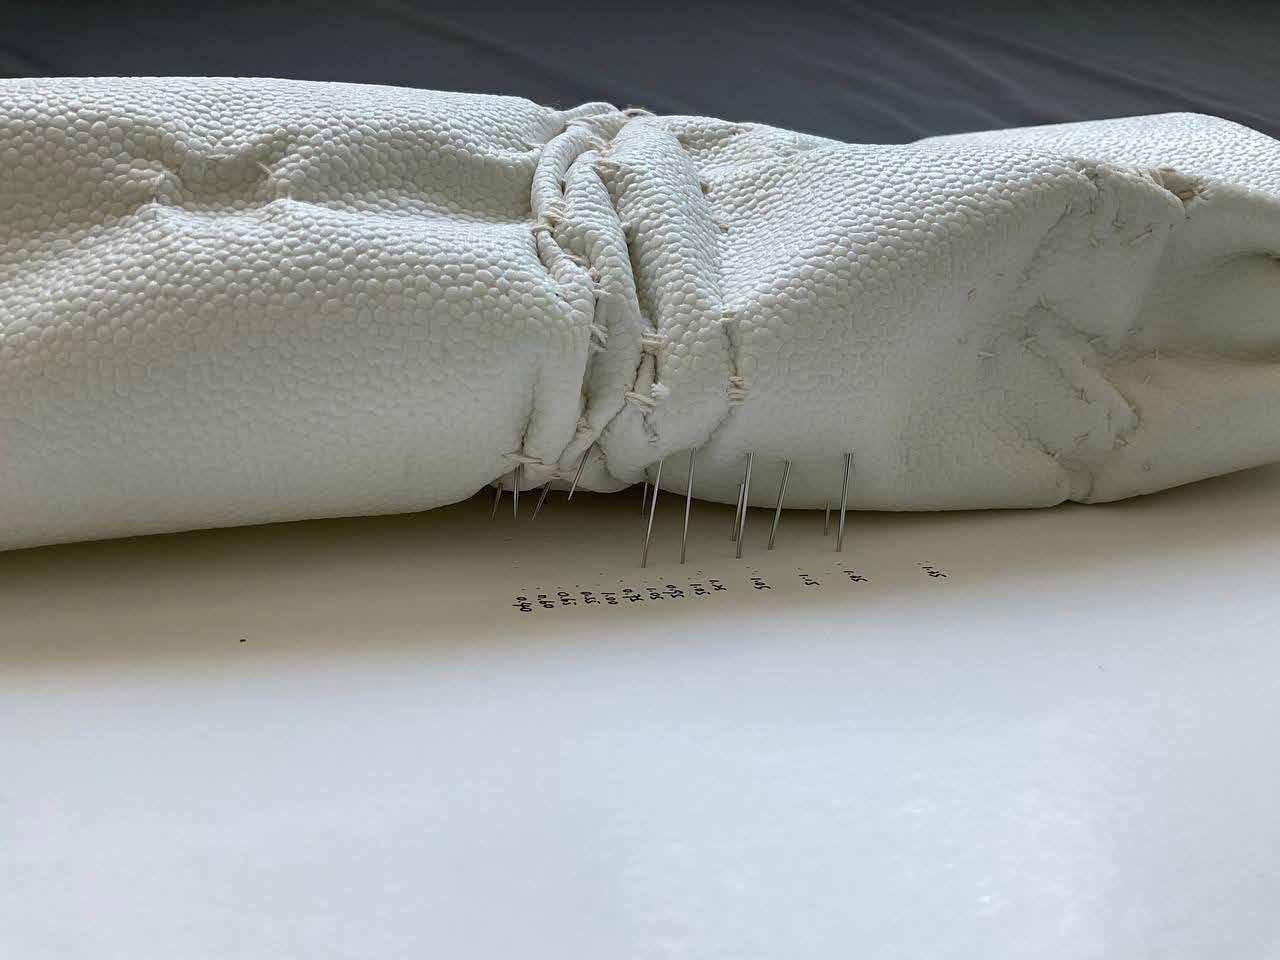
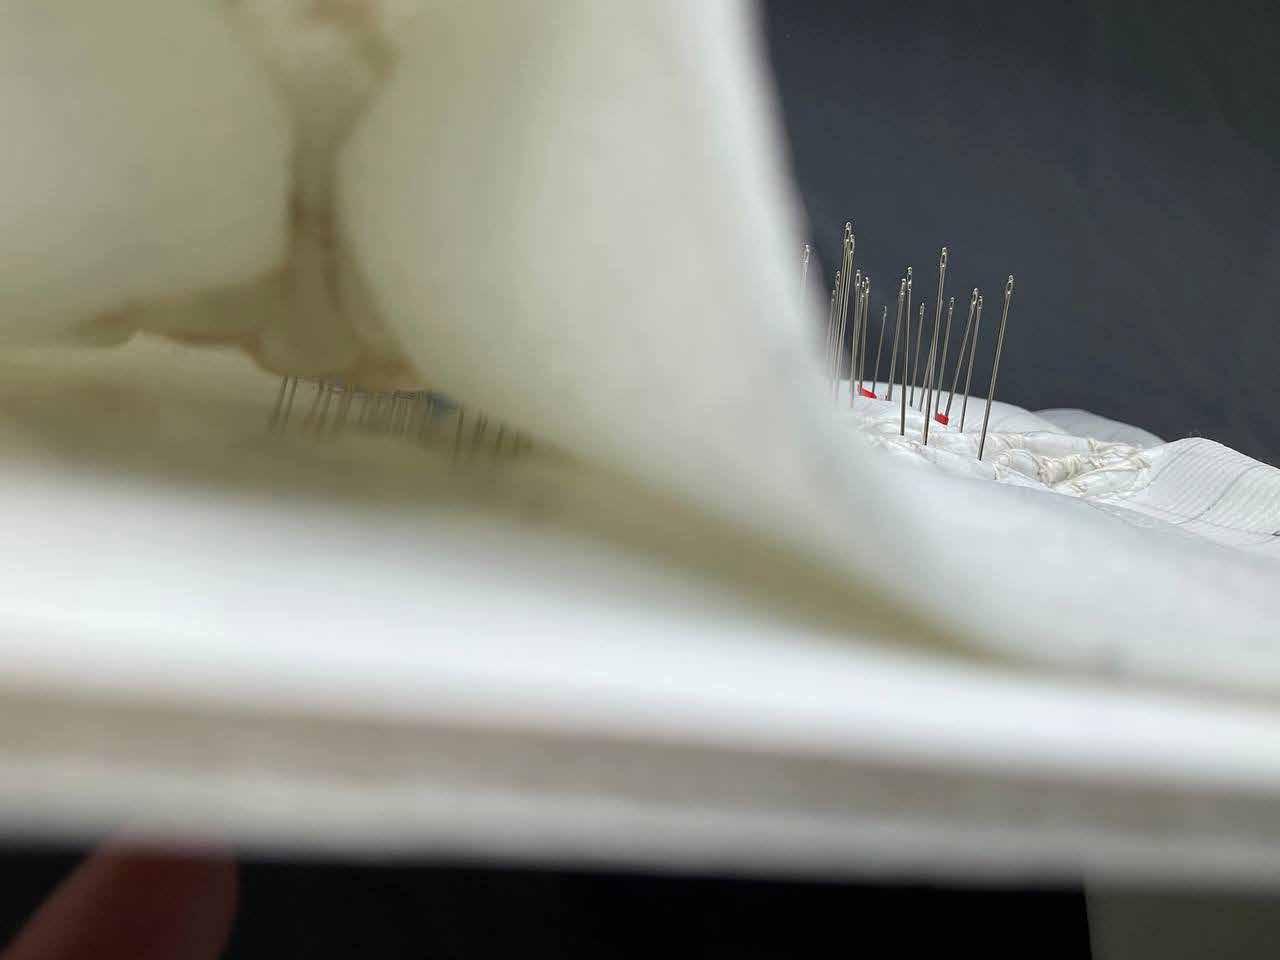
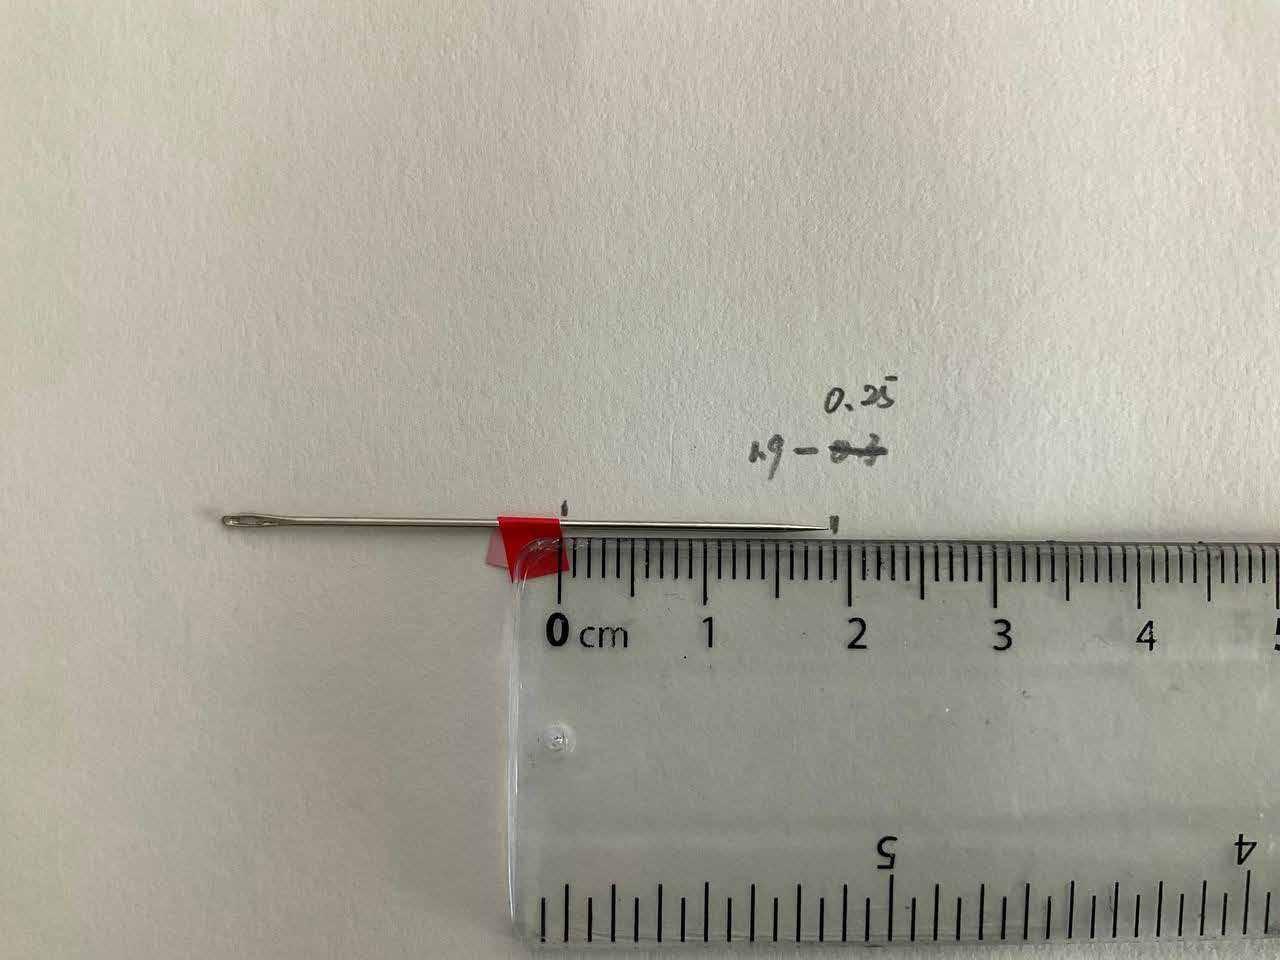
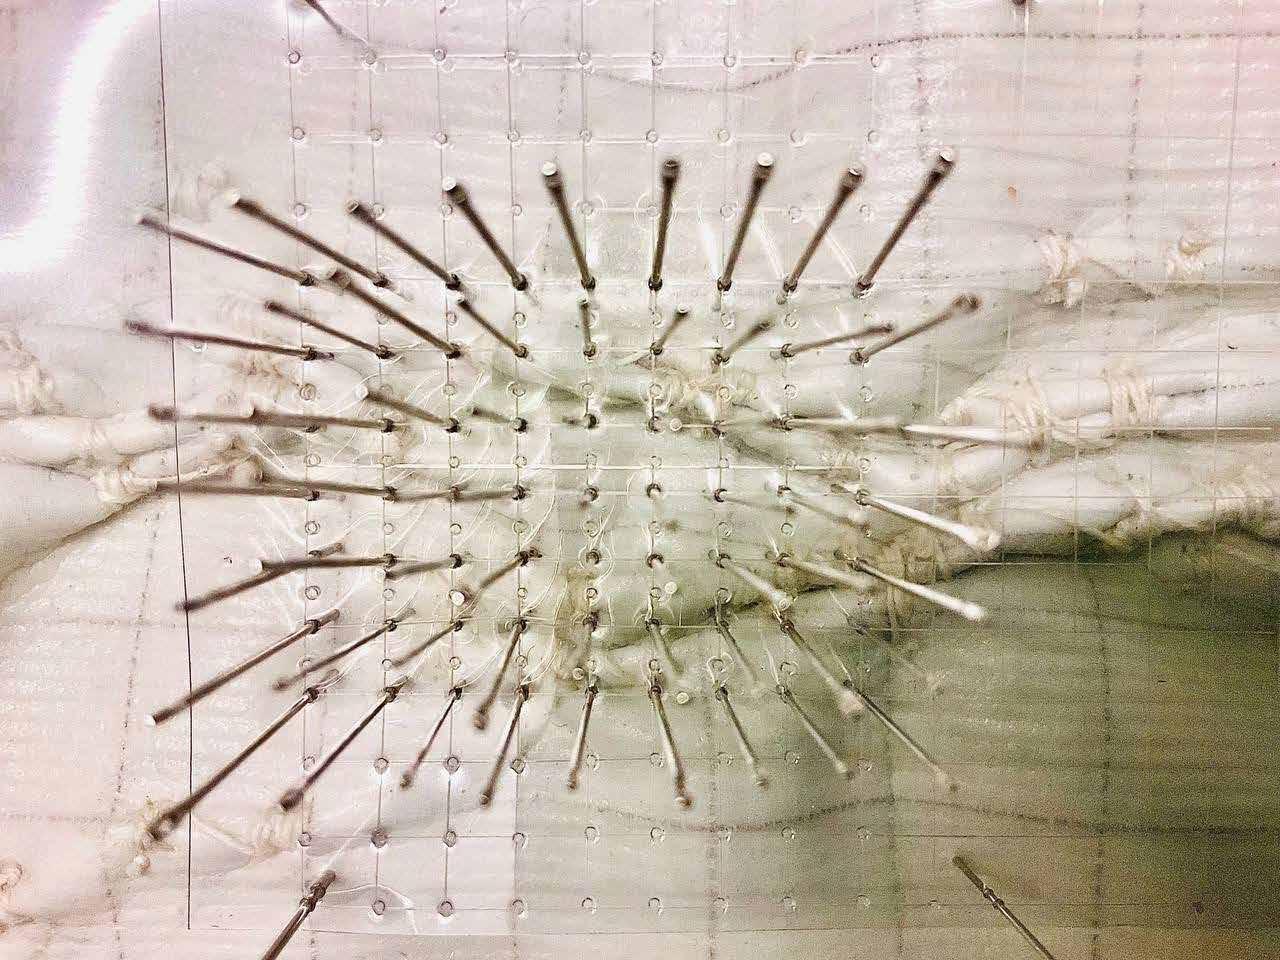
My initial proposal was to pin through the model and make a mark on the needle. But there are two problems with this design. First, we cannot ensure that the needles are vertical and straight. Second, pinning through the model has a tendency to change the original shape of the model. Therefore, as a studio, we had improved this design by adding a rigid grid to guide the needles, and stop the needles when they touch the surface of the model and measure the depth accordingly.


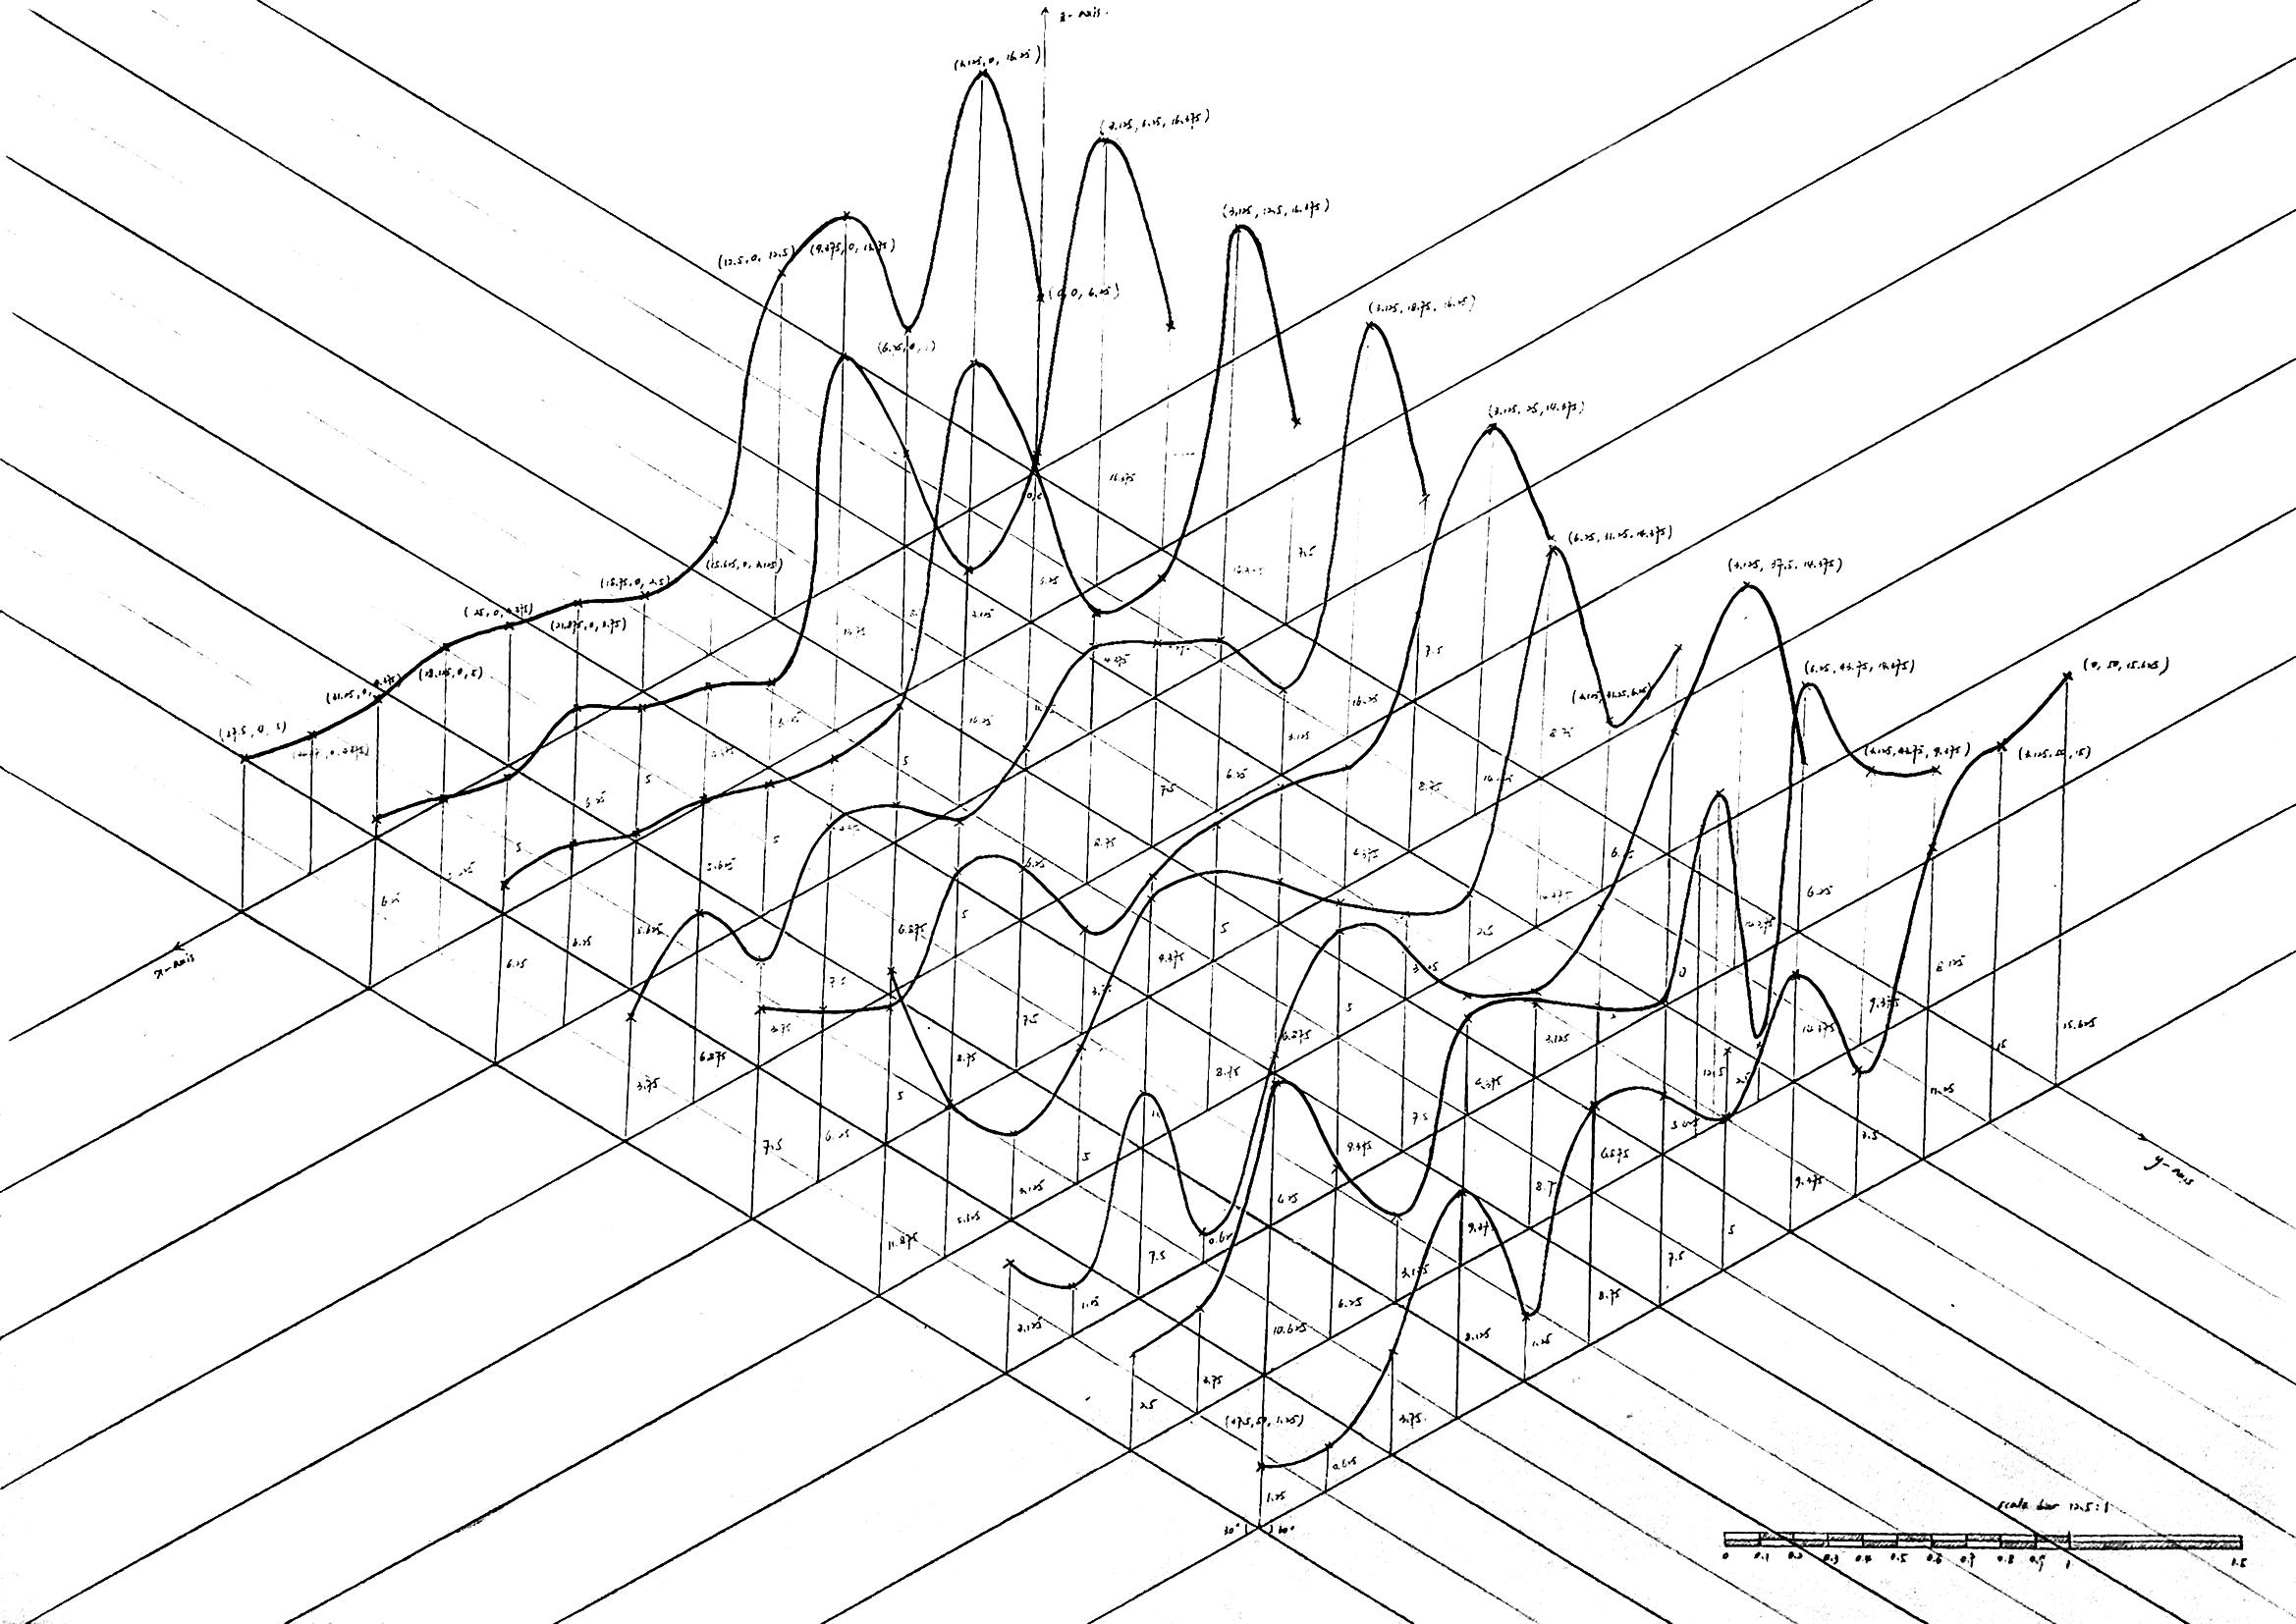
Finally, we need to transfer all the measurements from the measuring device to a digital model and an analogue drawing of all the section lines. In order to retain the high resolution of my physical model, I decided to measure a small area of 3cm by 4cm using 117 needles spacing out evenly at 2.5 mm and 5 mm respectively. The section lines were drawing by connecting the points using a curve ruler to form the best-fit line.
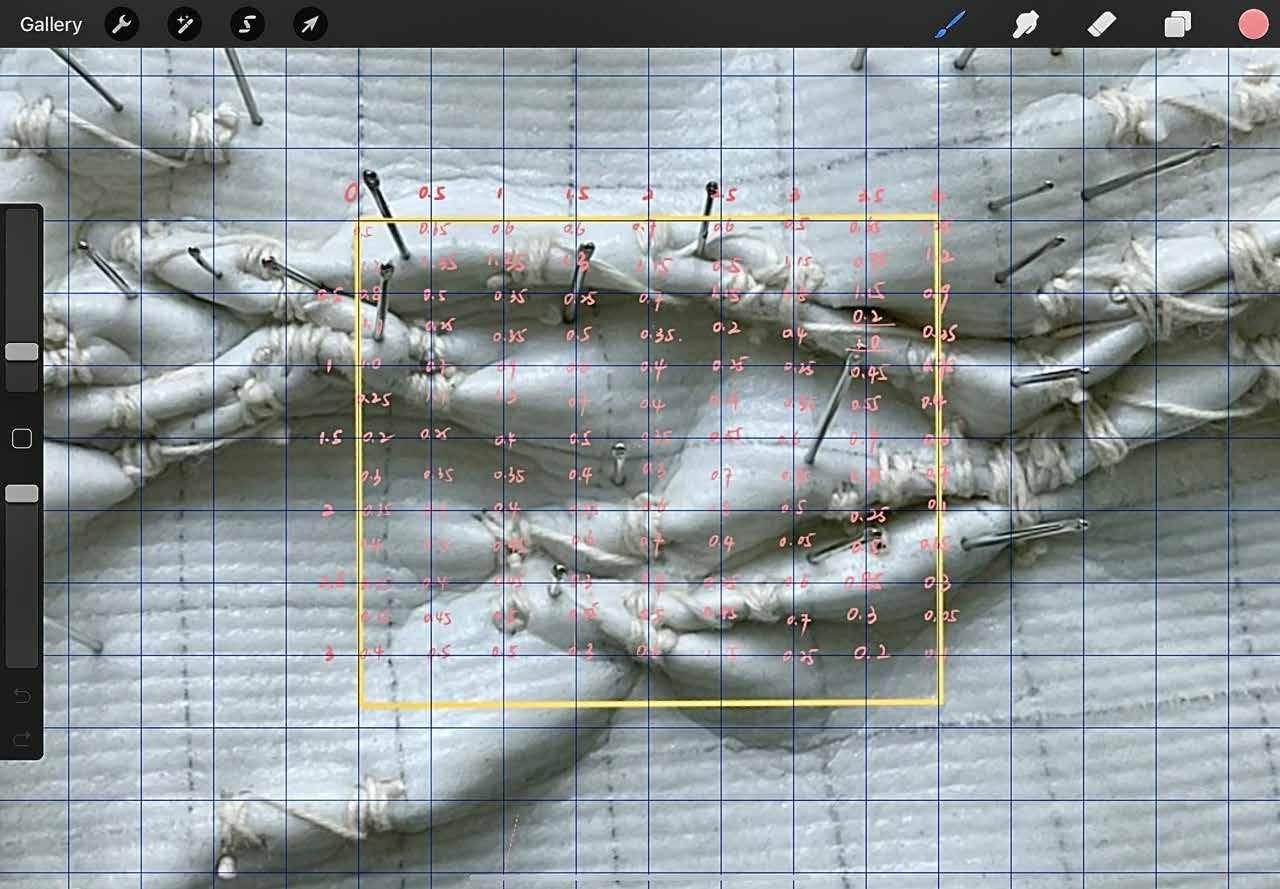
In Rhino 6
1. Use “point on curve” function
2. Key in 13 points with coordinates (x,y,z) on each curve
3. Draw 9 curves as section lines
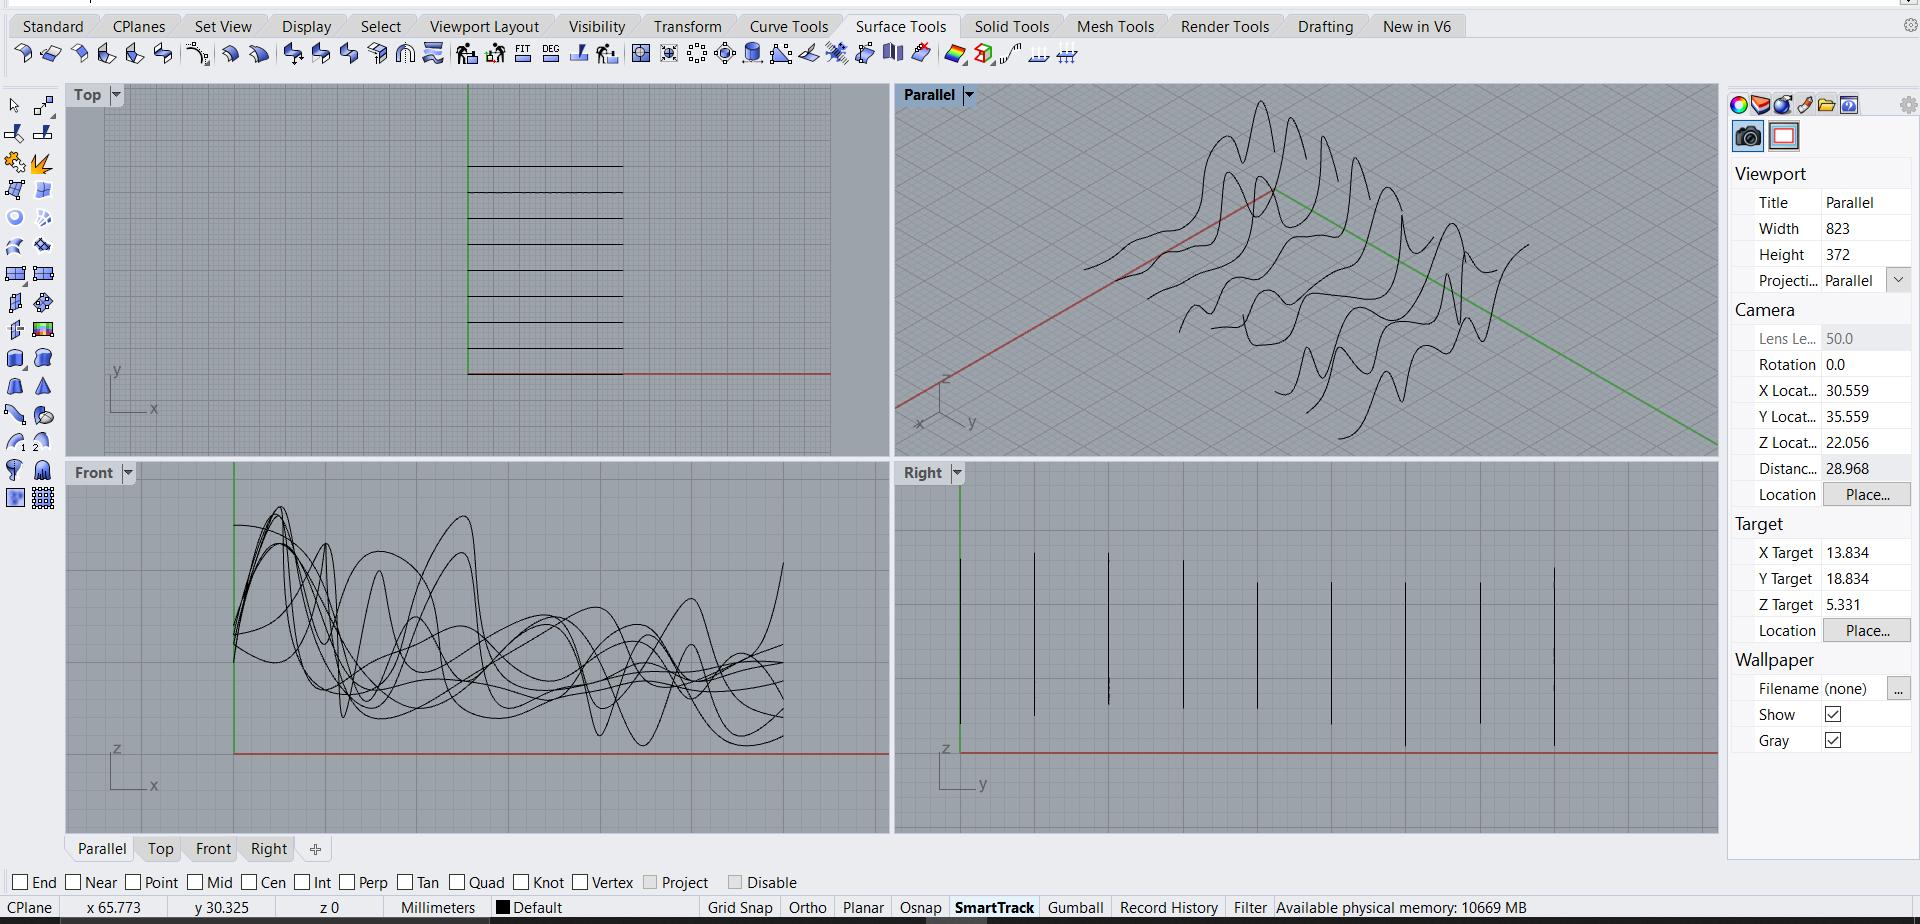
4. Loft the curves to obtain the surface
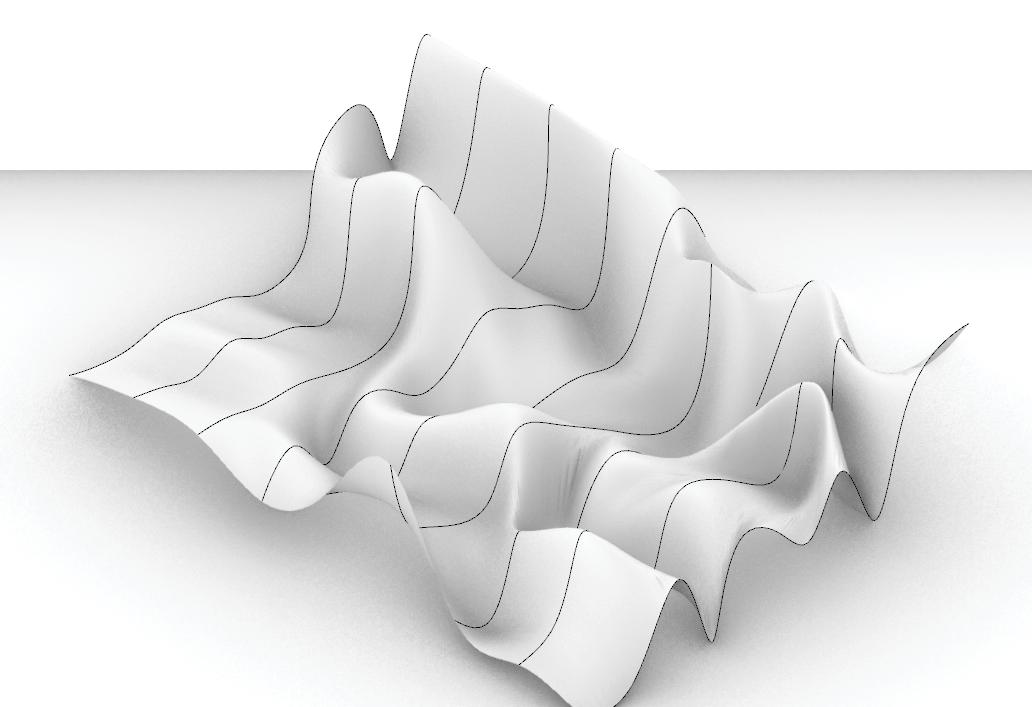
Discover: Complex Informational Systems, Algorithm, Topology, Field
The objective of this exercise is to introduce and use found information systems and the methods of how they can be represented through algorithm, methodical systematic translation into another syntax of form and space.
It is already fact and necessity that more and more, architects receive, analyze, strategise different sets of parameters and information that are expected to feedback and inform architectural design. This is a process-driven sequence that sometimes forms the principle logic and backbone of architectural strategy and formal expression.
If before, principles and fundamental design concepts came from geometry found in nature, or observe as found in mathematical calculus that is pleasurable to the eye, then today, even more, architectural formulation and evaluation of design and aesthetics, (or just making sense scientifically quantifiable data), is propelled by understanding how data is utilized, ordered and assessed through computational means into possible architectural outcomes.
Architectural coding has existed for a long time. Design thinking and invention utilizes computer digitization to help architects code and decode. It is NOT the other way around, where computer programs and computational design dictates design.
“Computing and drawing have intertwined histories. The first computer art was drawn. Limits on processing power and memory storage precluded pixels and images. (...) In most cases, merging computing and drawing involves merging cultures and methods. The territory within which we compute and the territory within which we draw are -- with a few exciting exceptions, largely distinct. For these reasons, deciding to (...) “compute in the space of the drawing” (is) no simply task. But they are exciting, productive and creative. (...) Rather, in concert with other technical aspect of coding while drawing tethered to creative inquiry.”
---- Lostritto, Carl, Computational Drawing: From Foundational Exercises to Theories of Representation, Applied Research & Design.
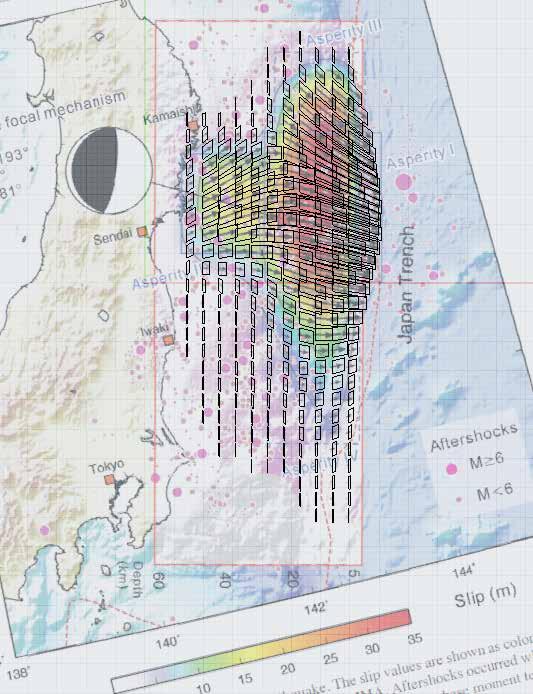
In order to simulate the real-world data translation, each studio was to find a found piece of 2D infogram that carries scale, at least three different sets of information layered onto one single graph (so that there are logical connections among the chosen data sets), and more importantly quantitative accuracy.
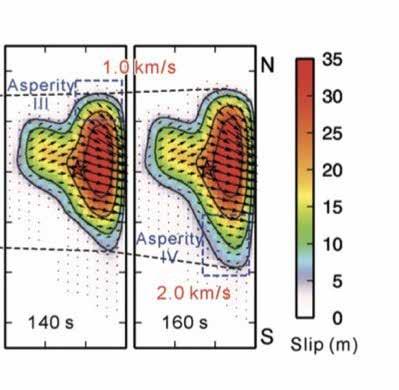
I chose the map of 2011 Japan Earthquake as it is a time-based event. The land rupture process has a certain level of intensity and complexity that allows me to assign qualitative parameters and explore their relationships. The resultant aftershocks also have potential to generate flux and turbulence in the following model making exercise.
https://www.researchgate.net/publication/260319236_Rupture_Process_of_the_2011_Tohoku-Oki_Earthquake_Based_ upon_Joint_Source_Inversion_of_Teleseismic_and_GPS_Data
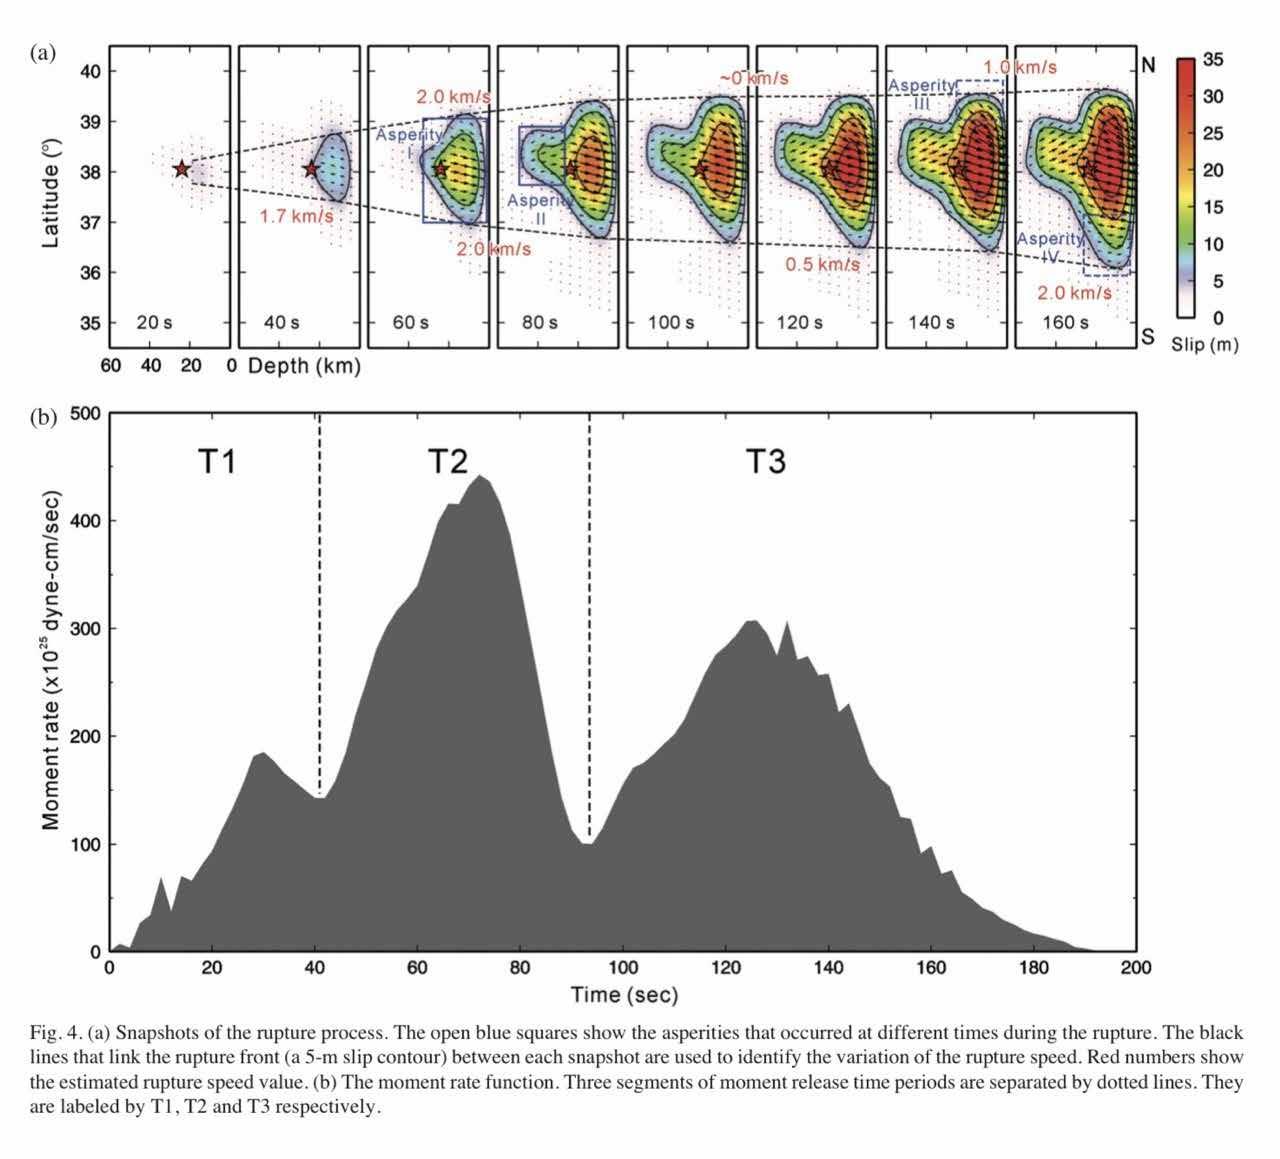
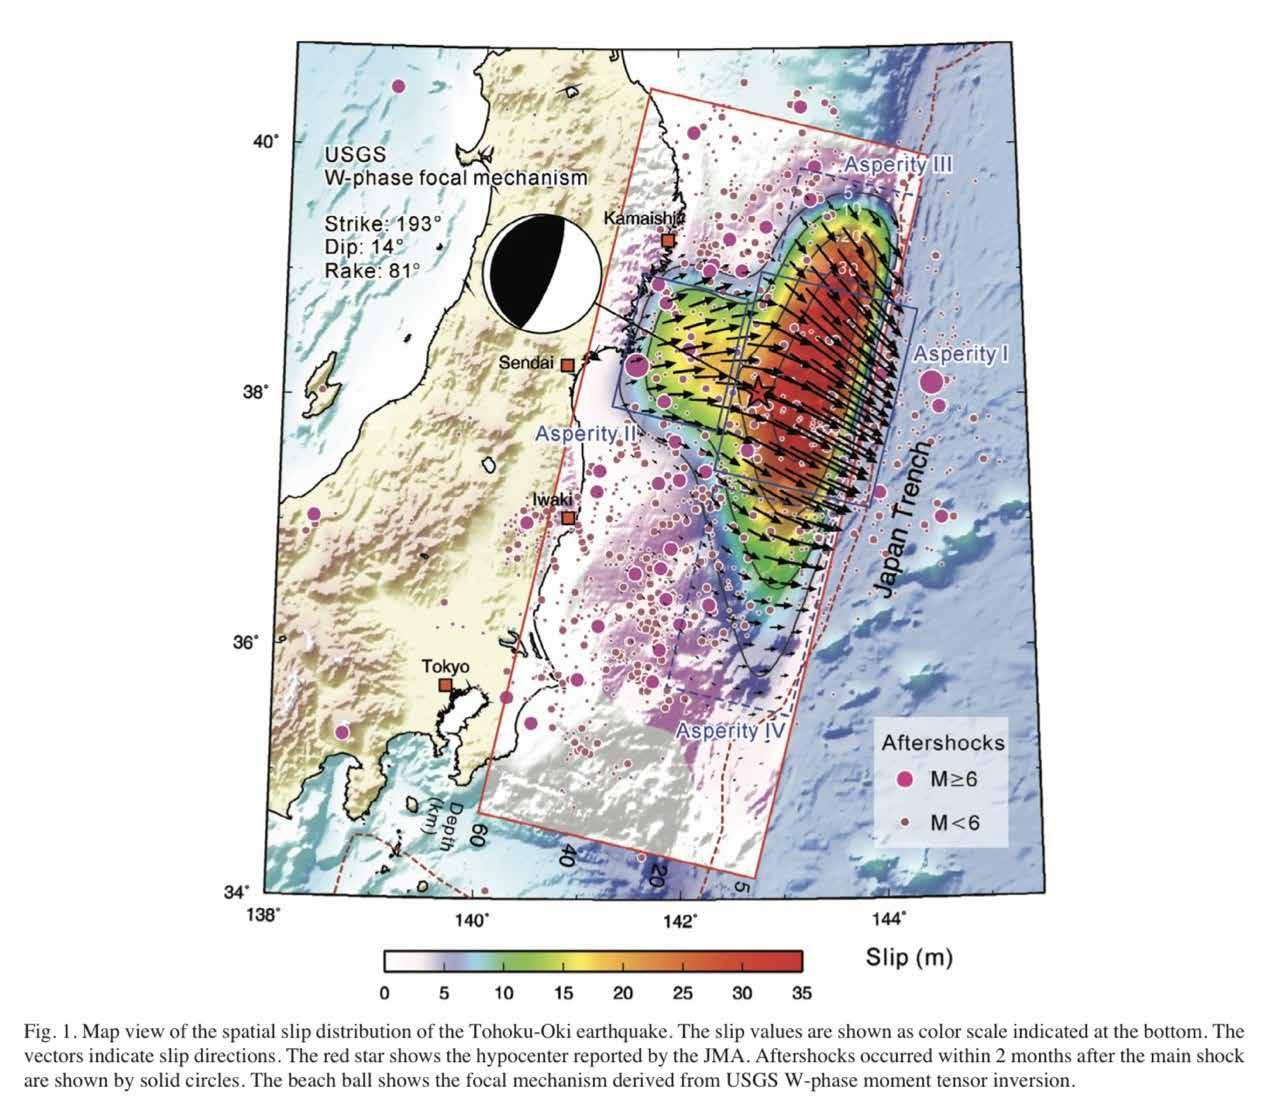
Known information annotated in the found infogram:
• Dot -- Aftershock (magnitude and distribution)
• Arrow -- Land Slip Direction
• Color -- Land Slip Distance
Extractable information annotated in the found infogram:
• Land Slip Timeline
• Land Slip Speed
• Land Deformation (before and after)
Each of us was tasked to design a representation of found information in our own “code” language through drawing, developing a strong, sophisticated legend by setting our own parameters that are able to code all aspects of the found information.
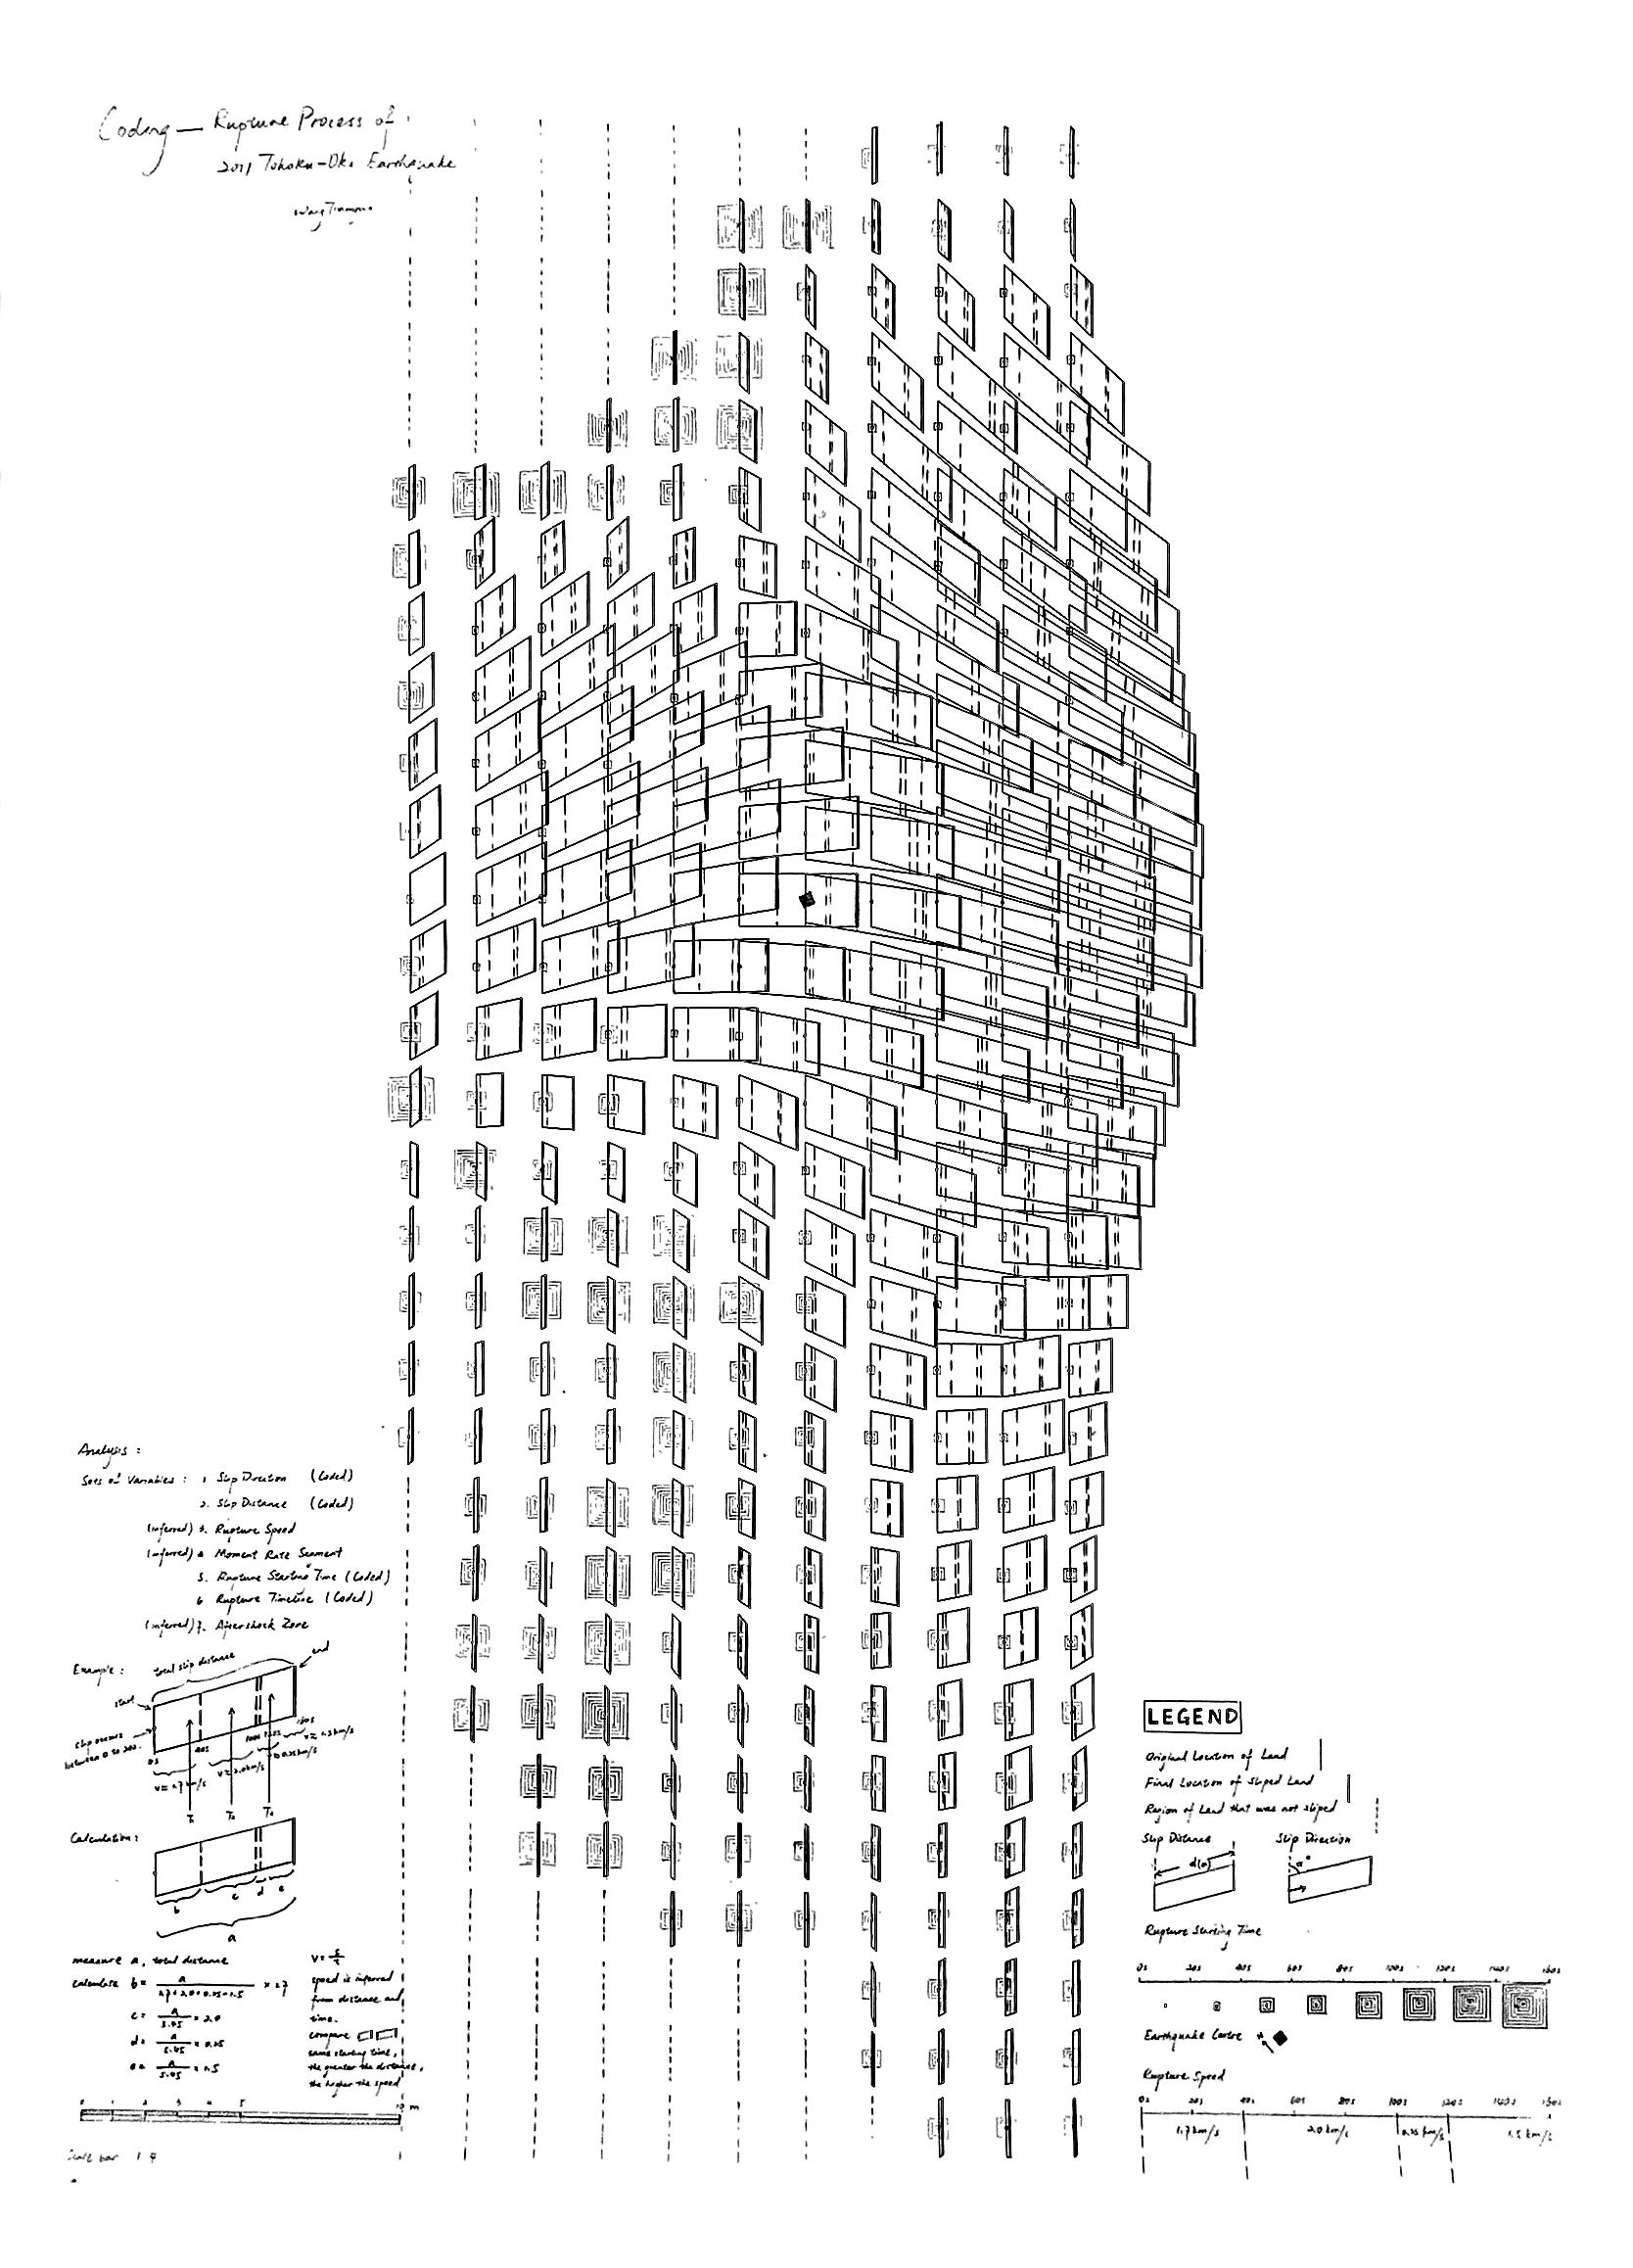
Considering the nature of land movements, I decided on the use of family of rectangles in coding, as rectangles are less stable and more flexible to be stretched and rotated to indicate land slip distance and directions.
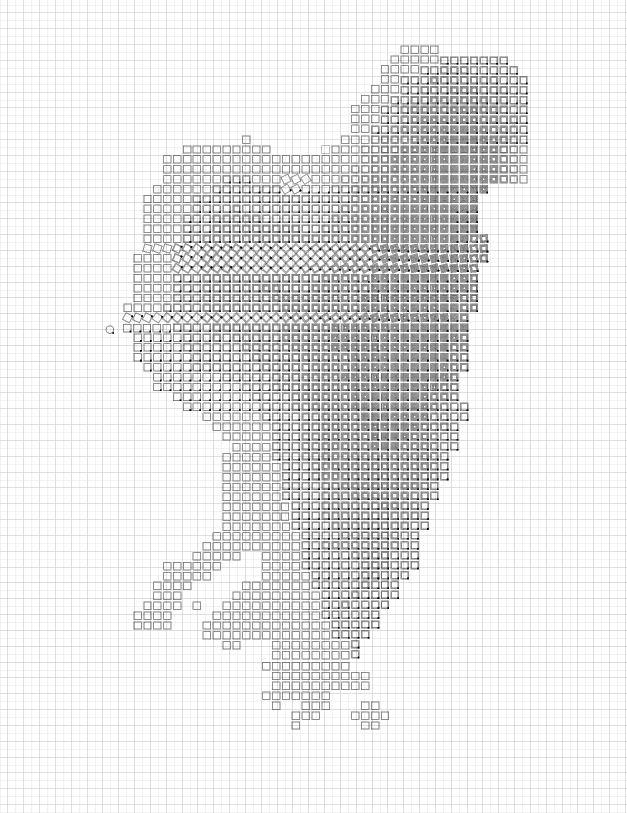
The initial idea to rotate squares in the direction of land slip was not effective. The equal sides of a square caused confusion about whether the square rotate in clockwise or anticlockwise direction.
Changes were made to use parallelograms as stretched planes to describe land deformation over time. A grid was suggested in the marking of land locations before and after the slip. Another notable improvement was the presentation of overall trend. One could almost predict the future should this event continues to happen.
The final coding design is both explicit and succinct. One parallelogram contains as much information as possible. Apart from distance and direction, slip speed at different time intervals (labeled as dotted lines) can be calculated. As viewers stand afar, the coding summarizes the overwhelming land rupture towards the right. Resigns with denser concentric squares (indicating the passing of time) also correspond to those experiencing more serious aftershock. It tells us that when the land endures more pressure over time, it is likely to have greater earthquakes.
Discover: Performance and Feedback. Intensive Properties, Process. Grasshopper. Evoke Feedback, Iterate with Purpose
Through the use of a responsive material or process that provides feedback depending on the “information” and action the author makes, the medium interacts and performs in a way that asserts its intrinsic nature of continuity or discreteness, resistance and other performances. In this exercise, we would learn how feeding information through action to material is akin to working with all other construction material of timber, concrete, glass etc, and understand the necessity to adopt those materials’ characteristics.
Essentially, Exercise 3 enabled us to appreciate design thinking in abstraction of information behind computation design, and understand this methodology of form generation. Technology has made definition and manipulation of parameters faster and easier, and it has enabled complex geometries, iterative transformations, defined by functions and sets of operations performed arithmetically to respond to design concerns resulting in what should be targeted design critical outcomes.
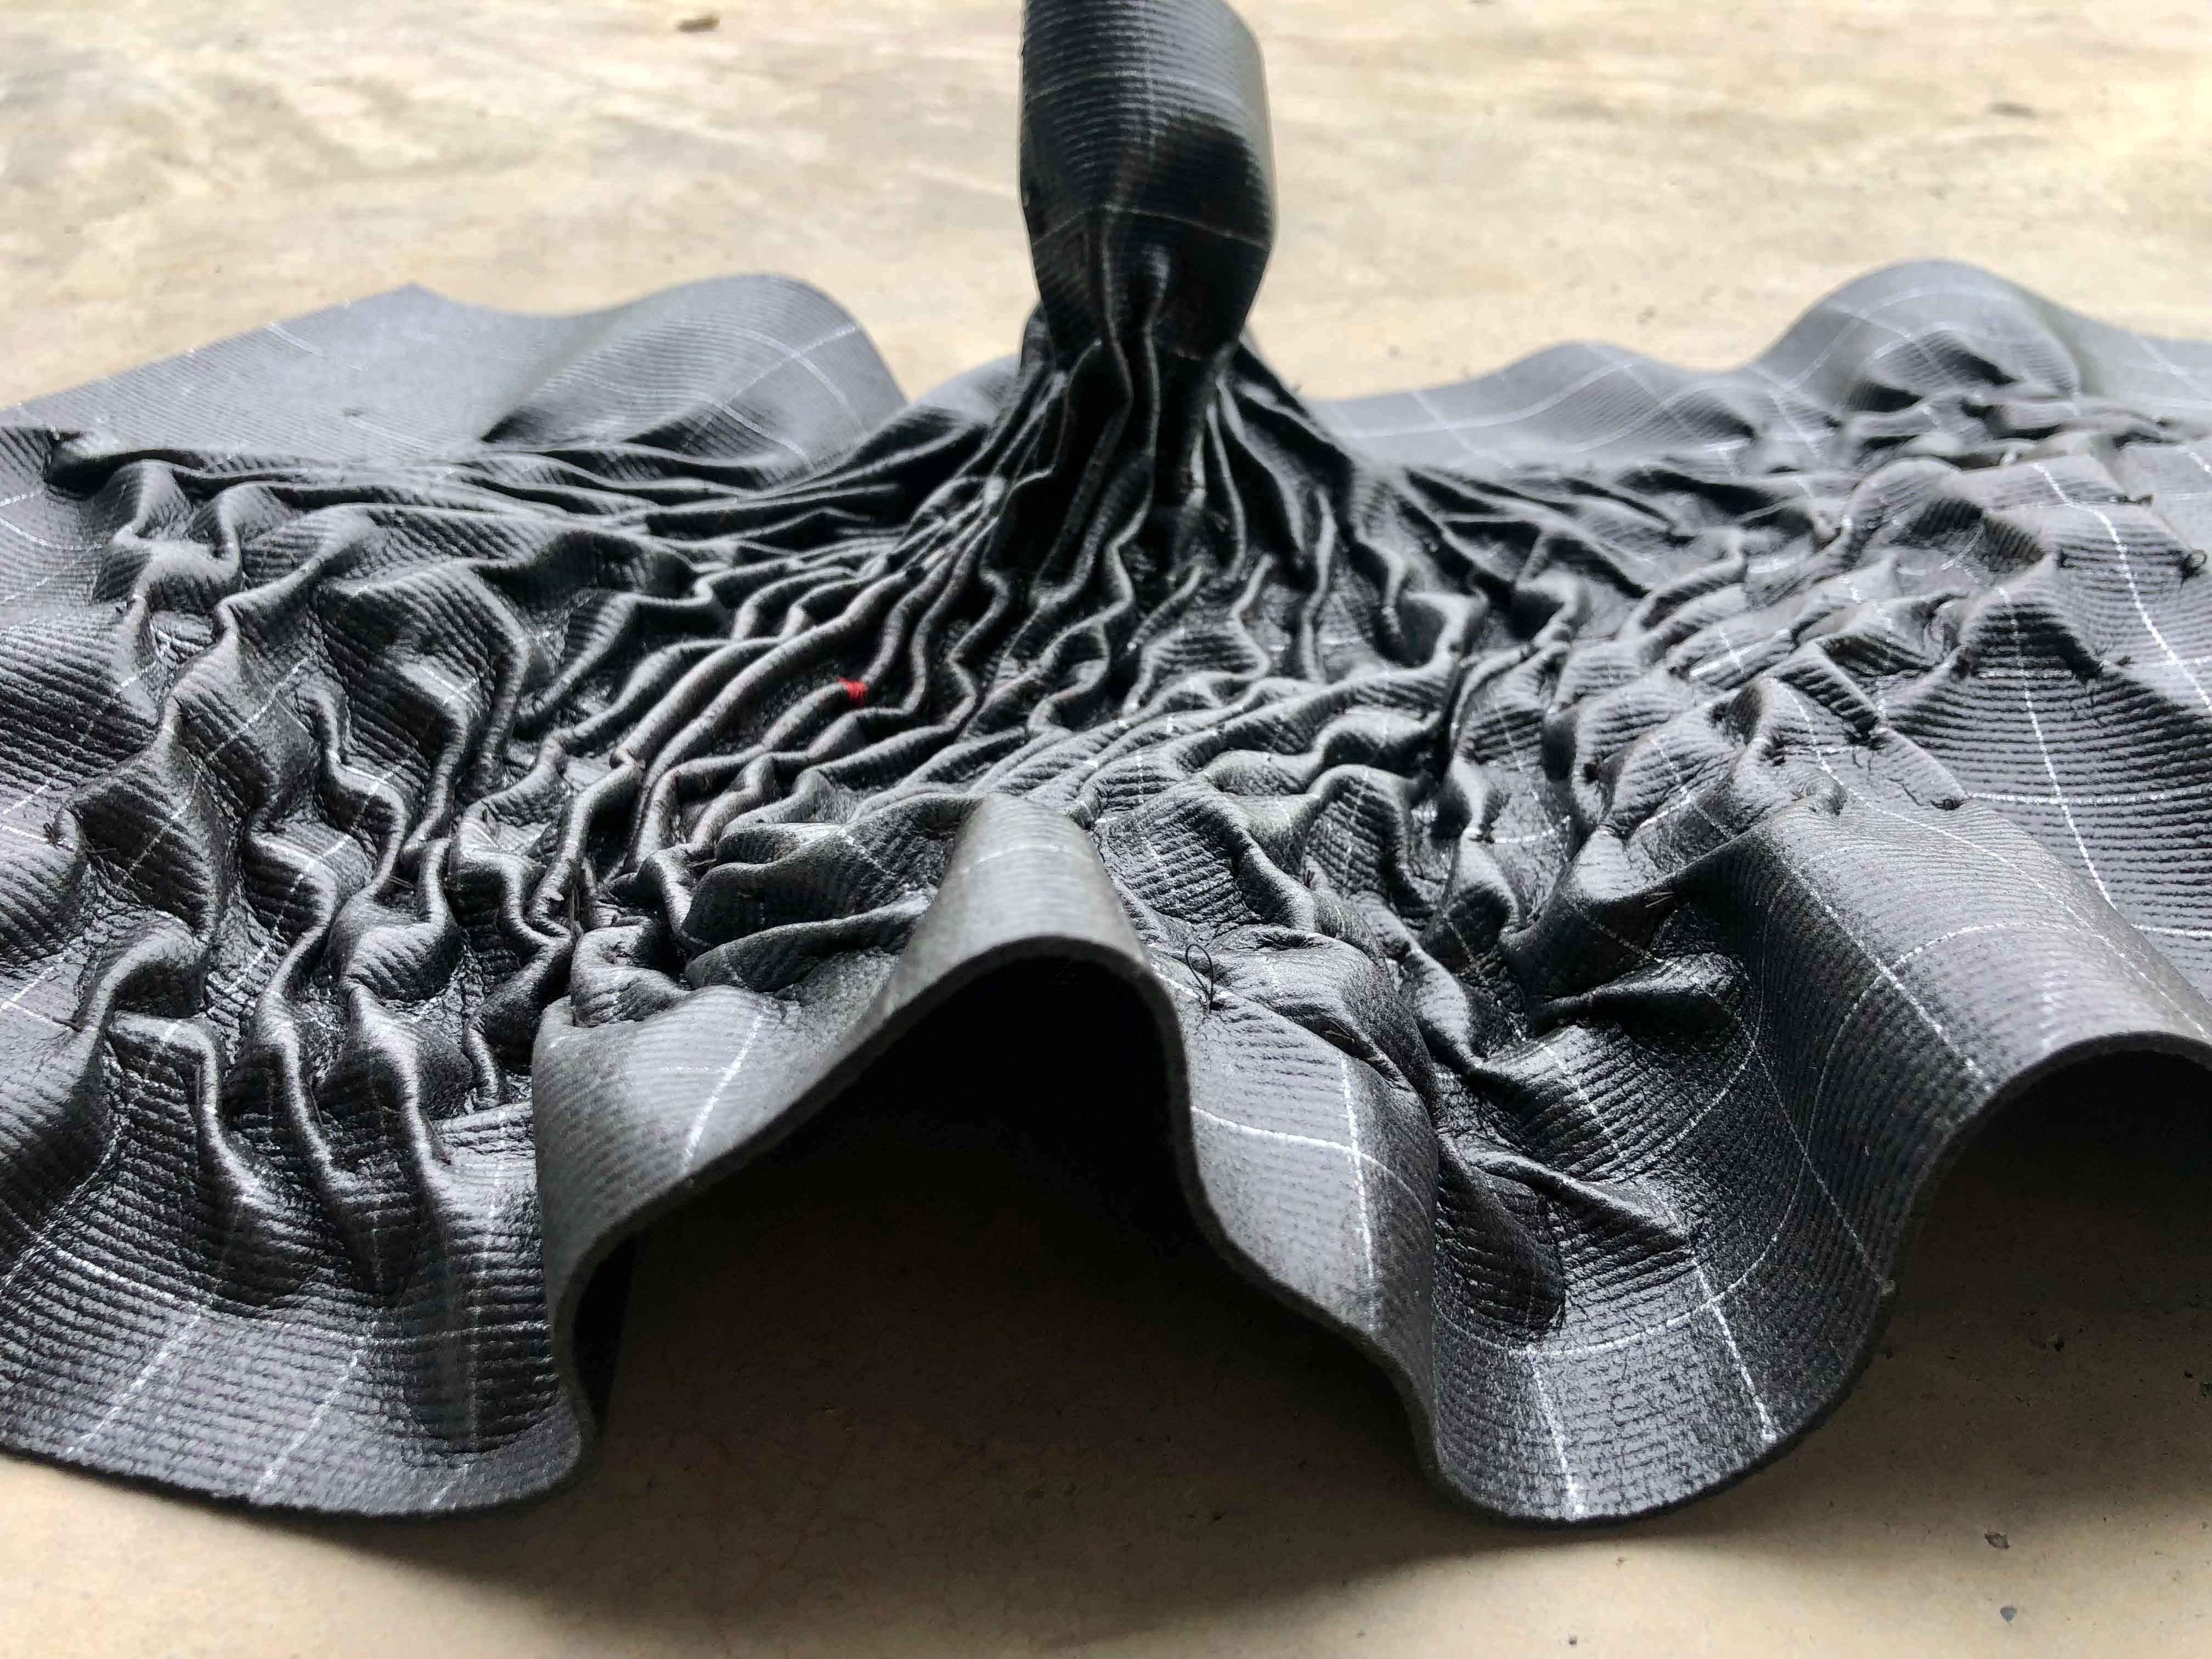
With the line drawing “code” that we have individually developed in Exercise 2, each legend and parameter is to be assigned, through translation, into a corresponding action that will “affect” the material. These actions are designed to best translate the nature of the code drawing from Exercise 2, into another form of syntax through exploration of materials and limits in selected material. Our studio continued with the use of vinyl sheet as this material is spongy, i.e. depression at one point can spread out to neighboring points in a chain effect.
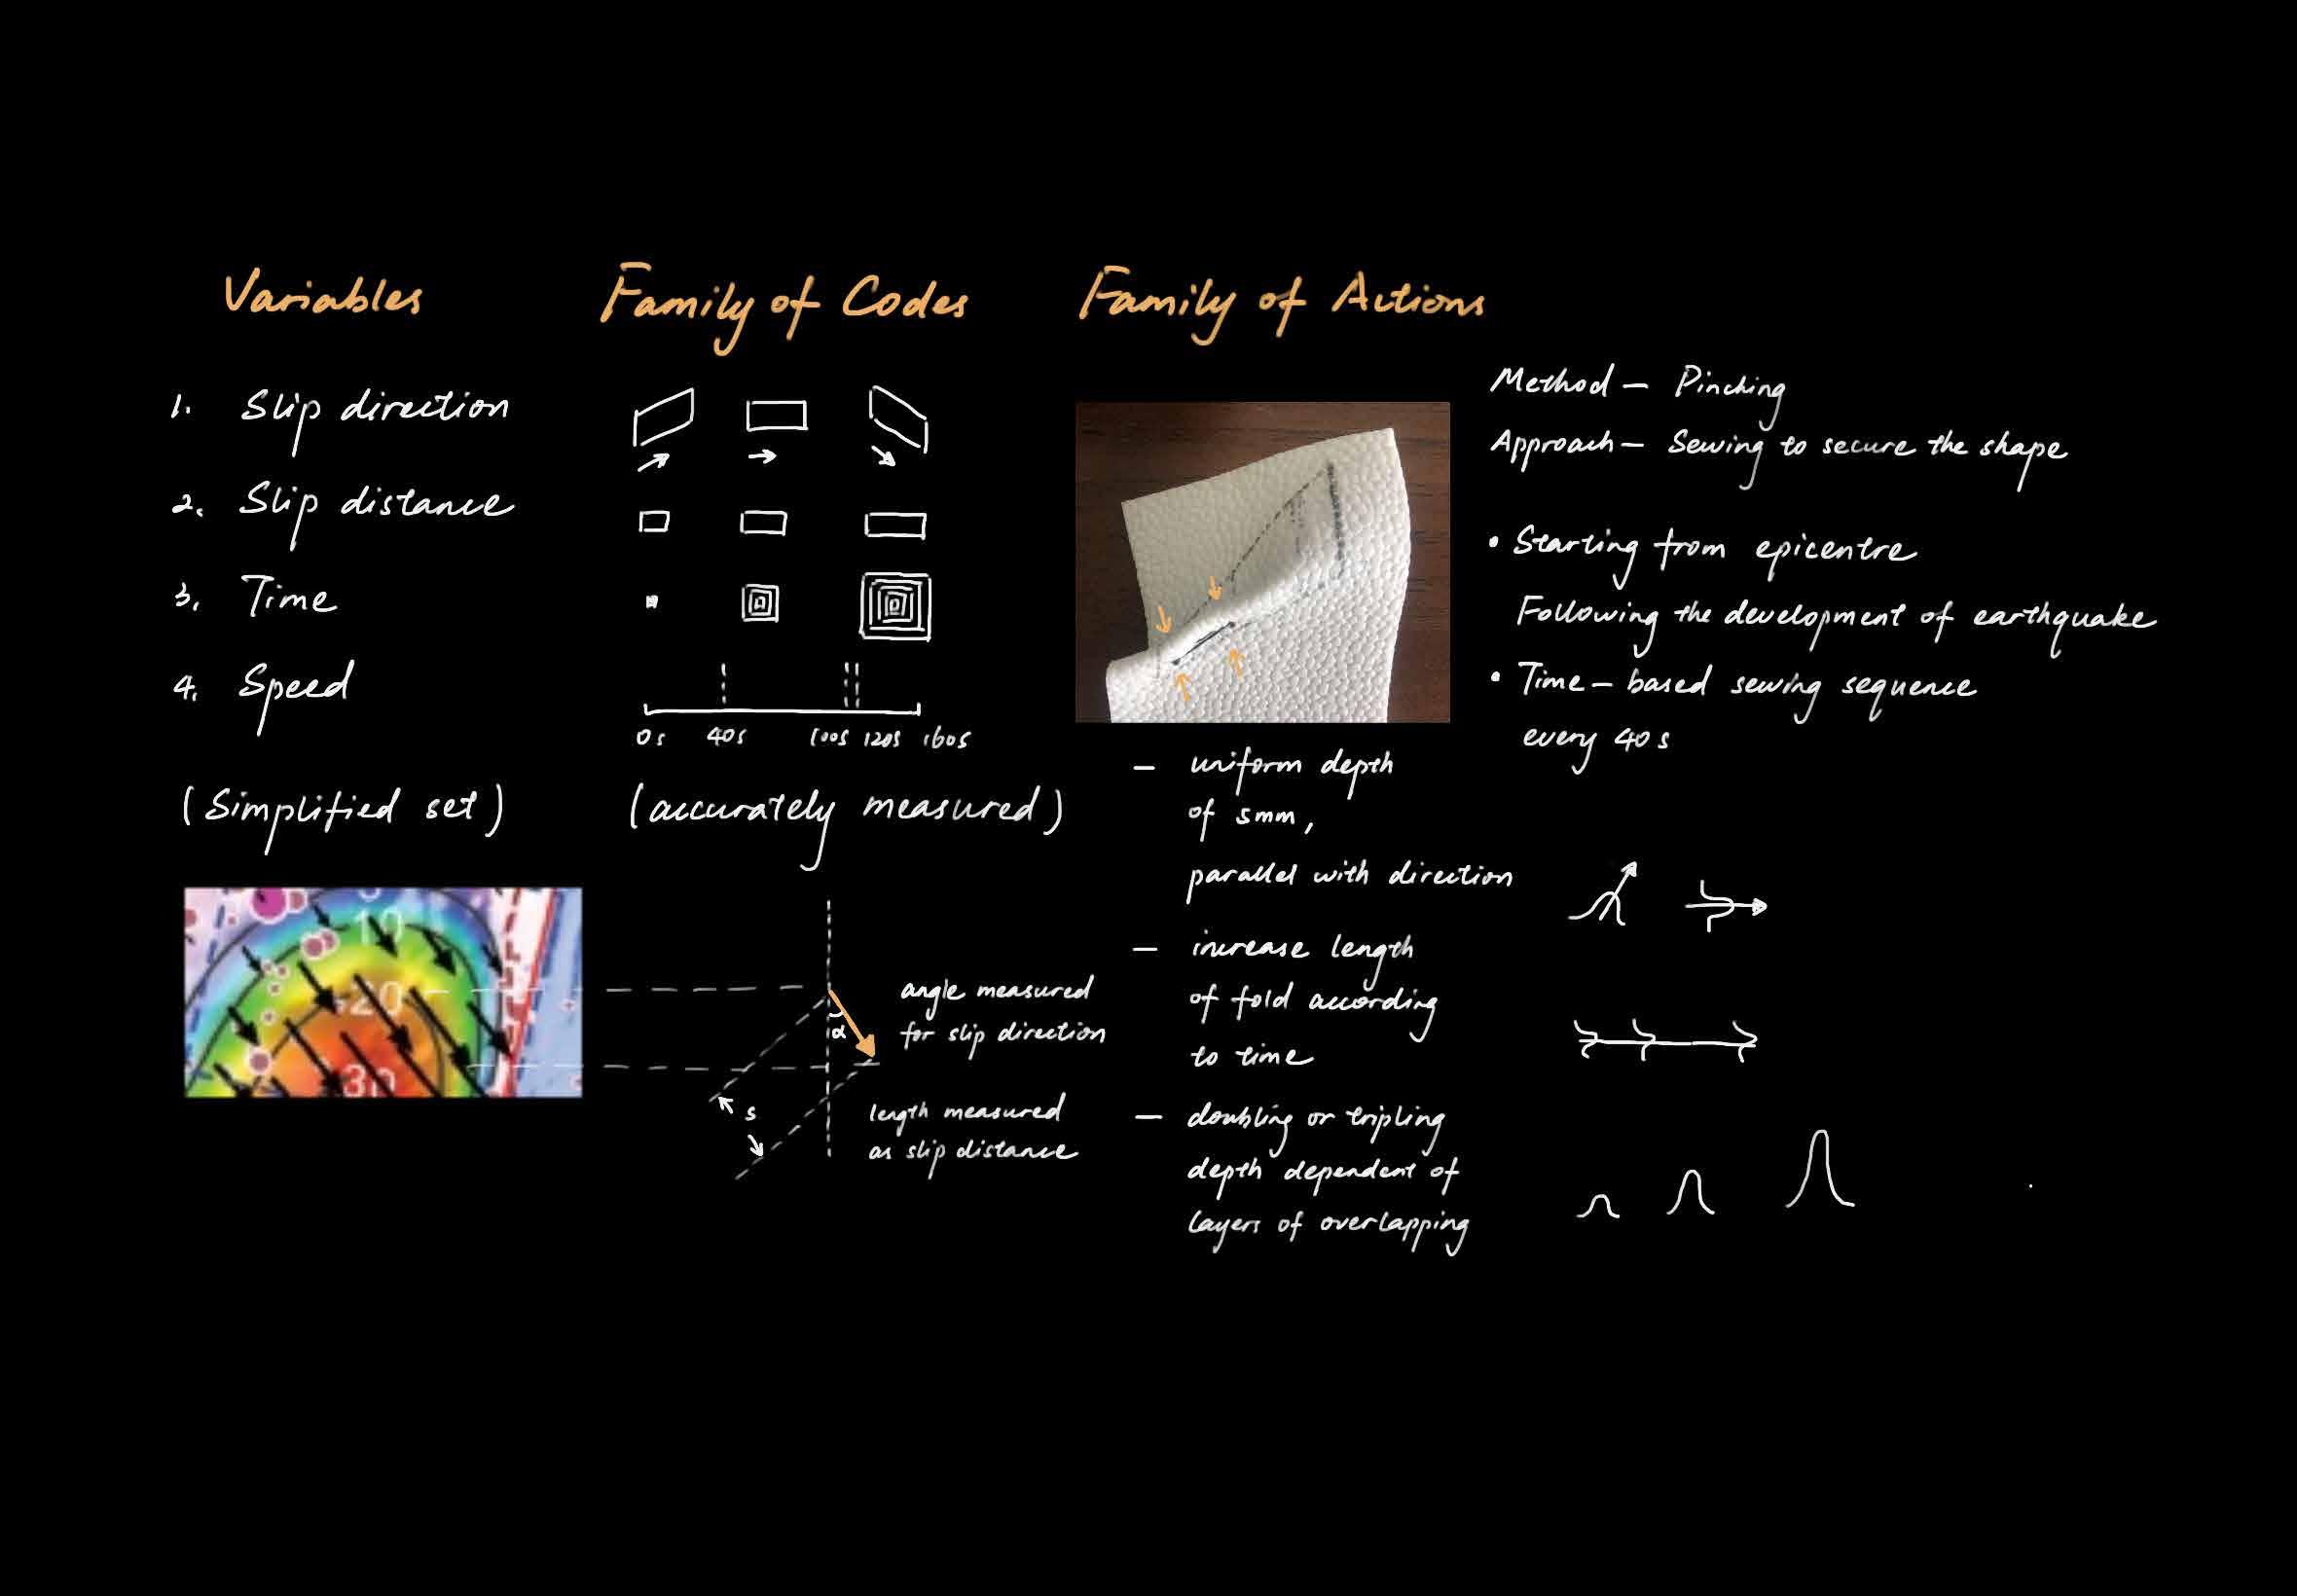
Land slip from 0--40 seconds
Pinching in the distance and direction of land slip
Land slip from 40--80 seconds
Bumps formed as pinching converged to the right
Land slip from 80--120 seconds
Form continued to change as slip developed


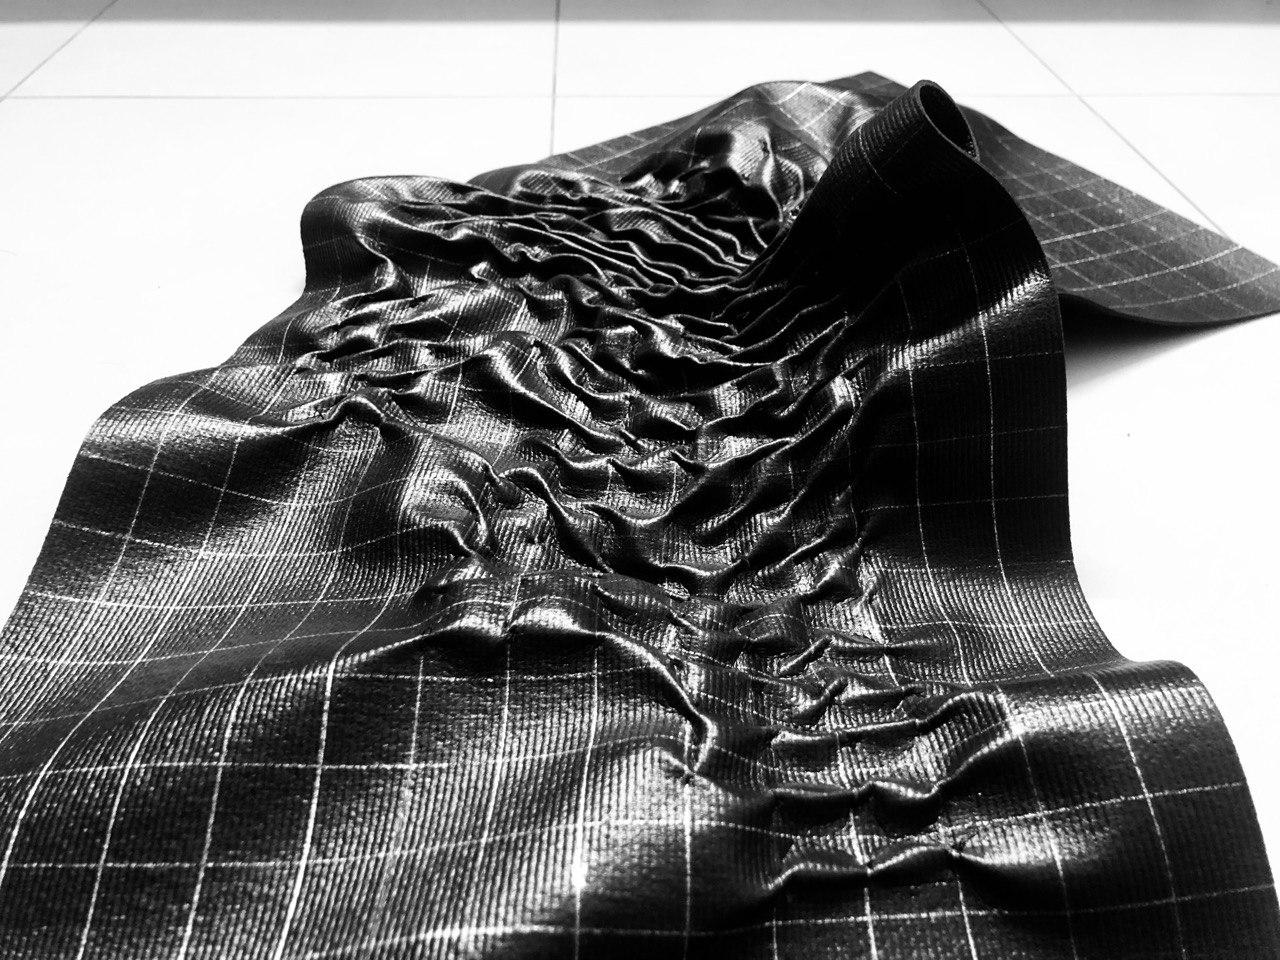

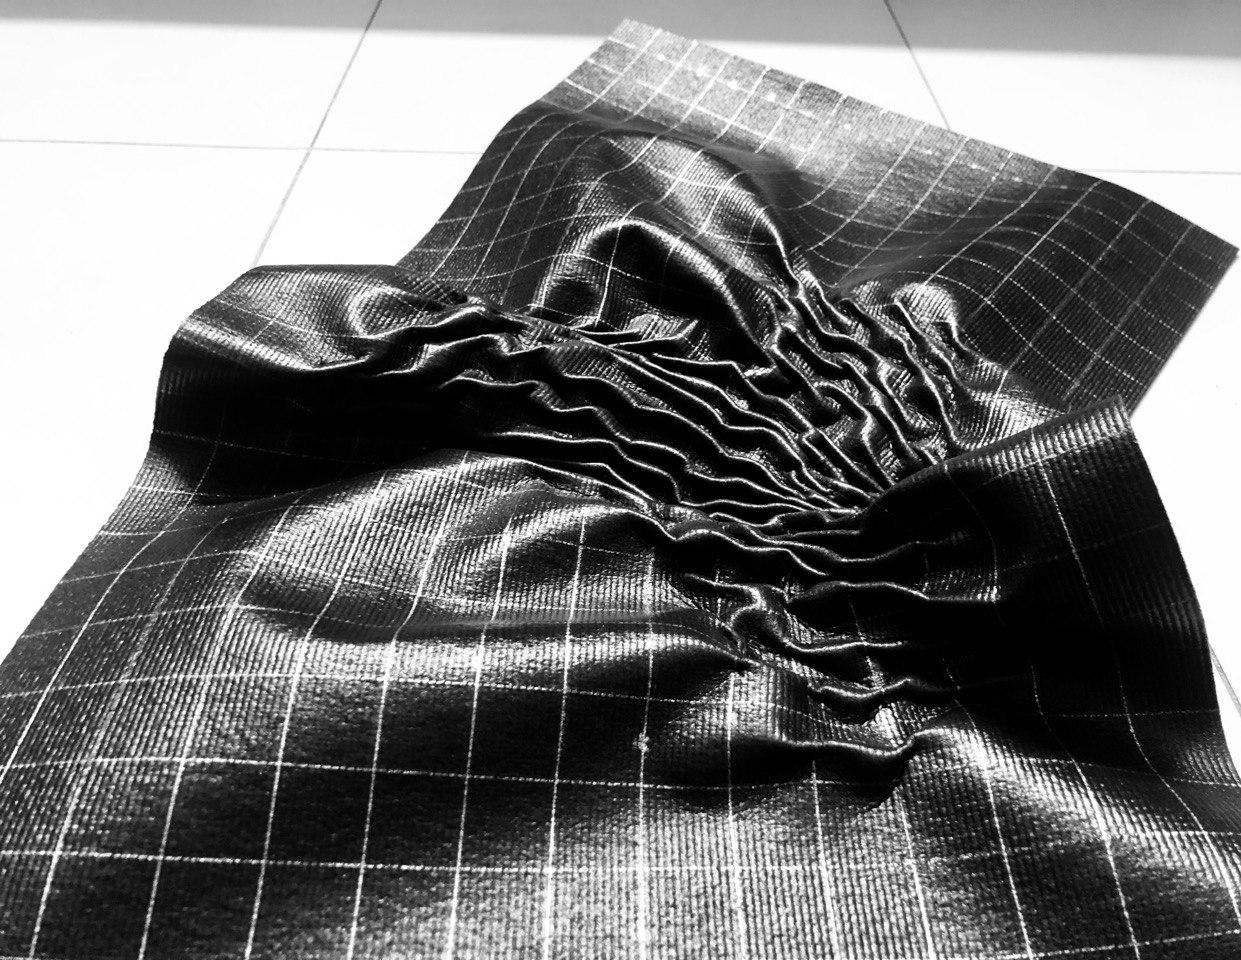
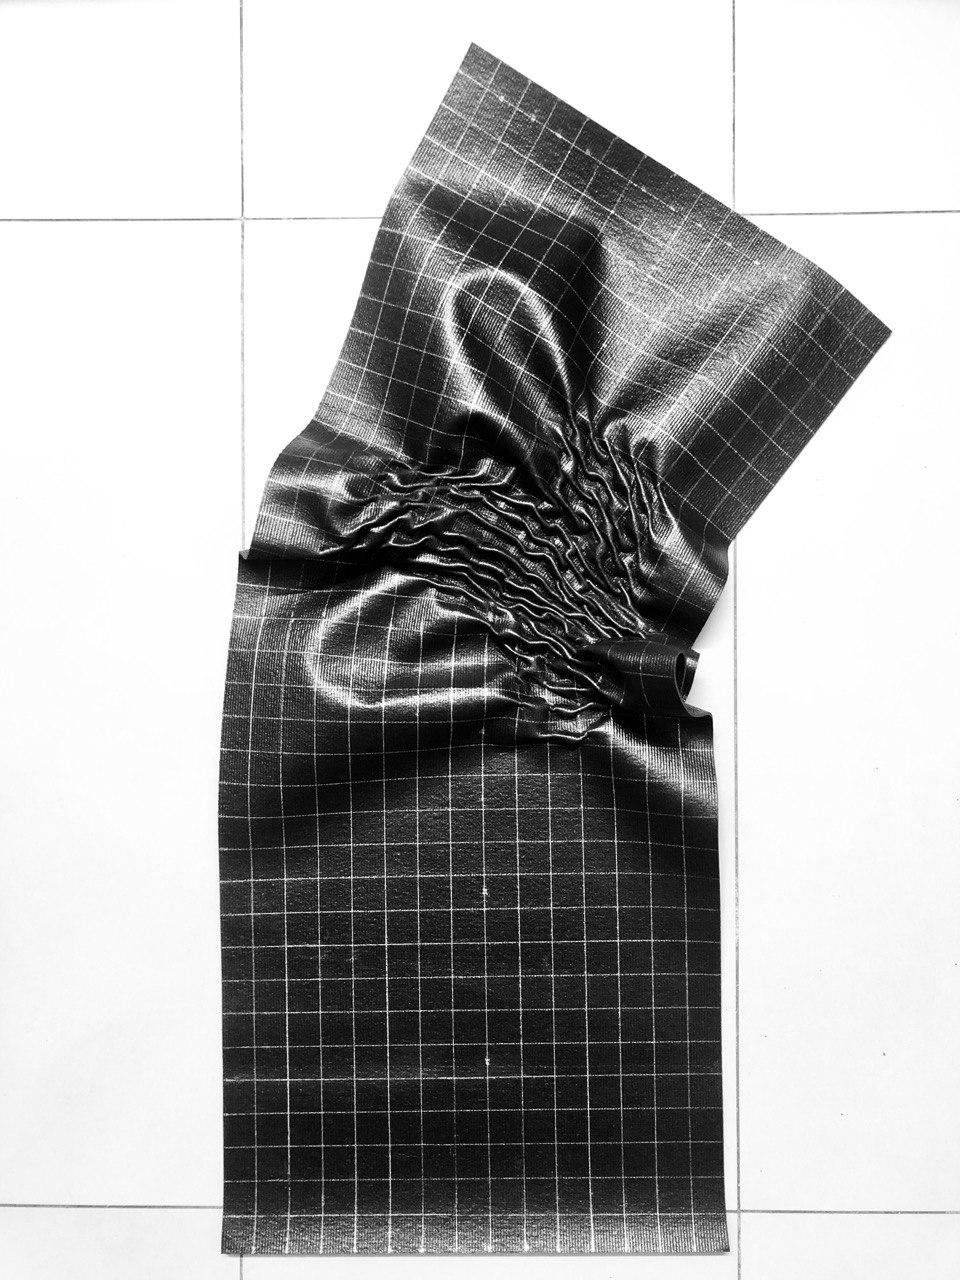

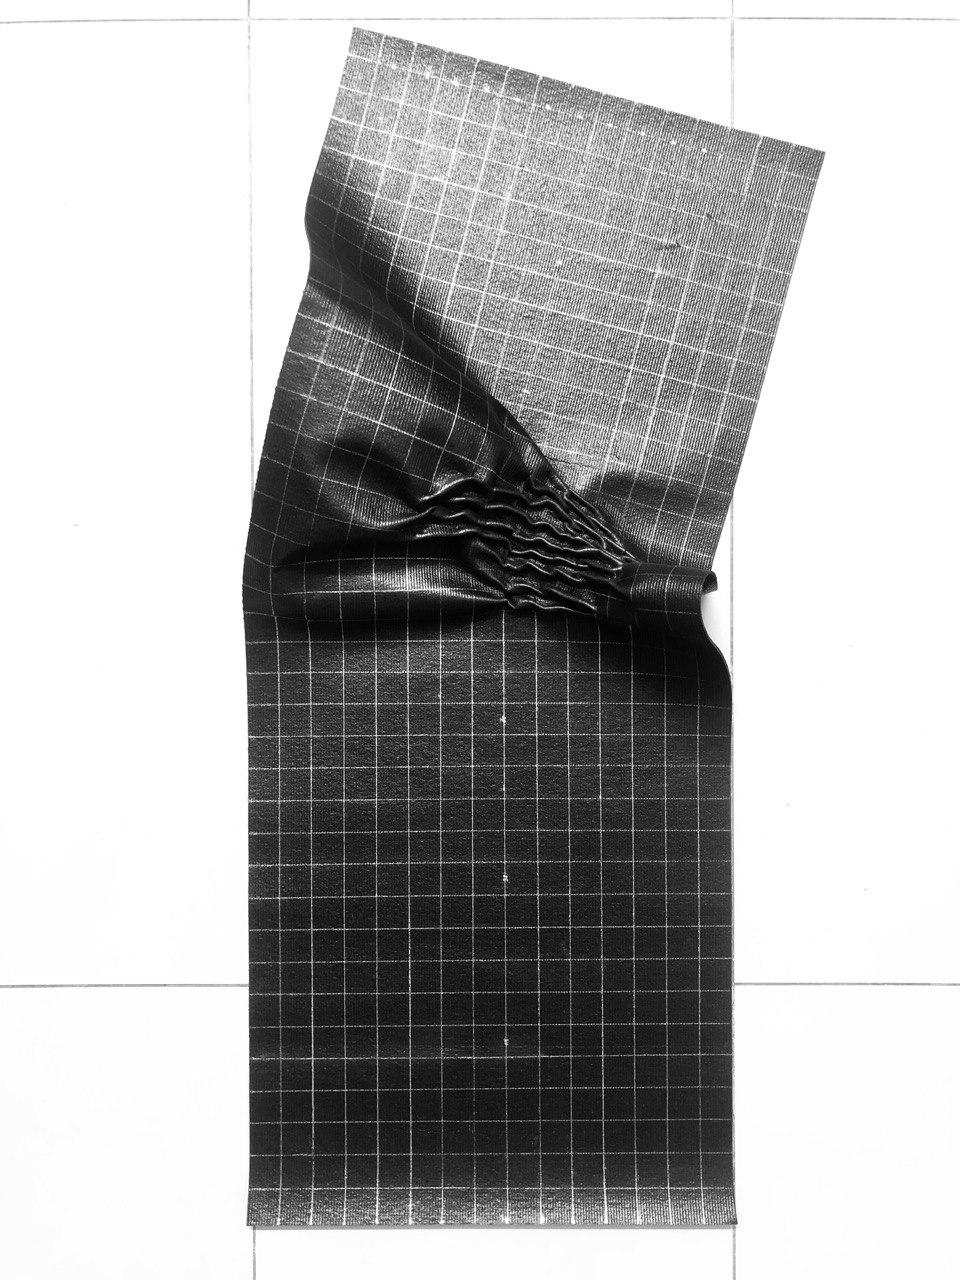
Land slip from 120--160 seconds
Final form corresponded to aftershock locations
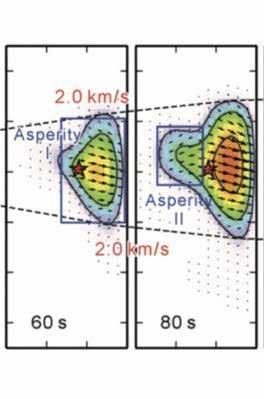
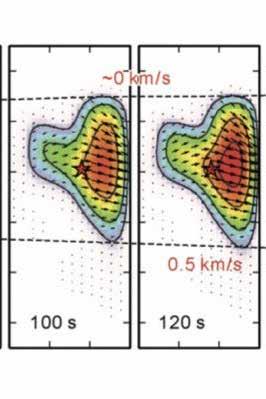
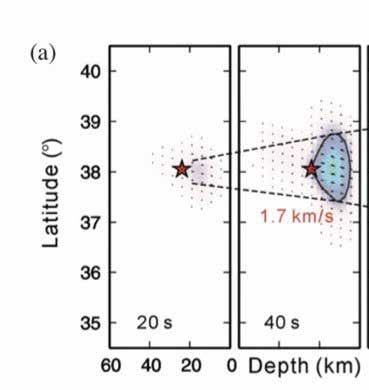
Two bumps in the model correspond to two locations with the largest aftershocks. Red dot is the epicenter.
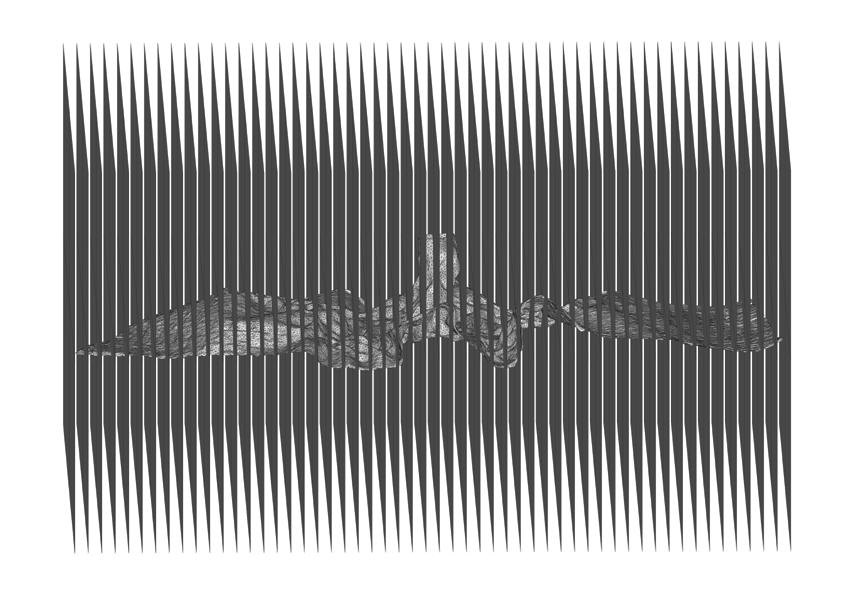
Since a digital model can be obtained manually using the measuring device designed in Exercise 2, to speed things up, we used 3D scan technology to digitalize the continuous vinyl-sheet model.
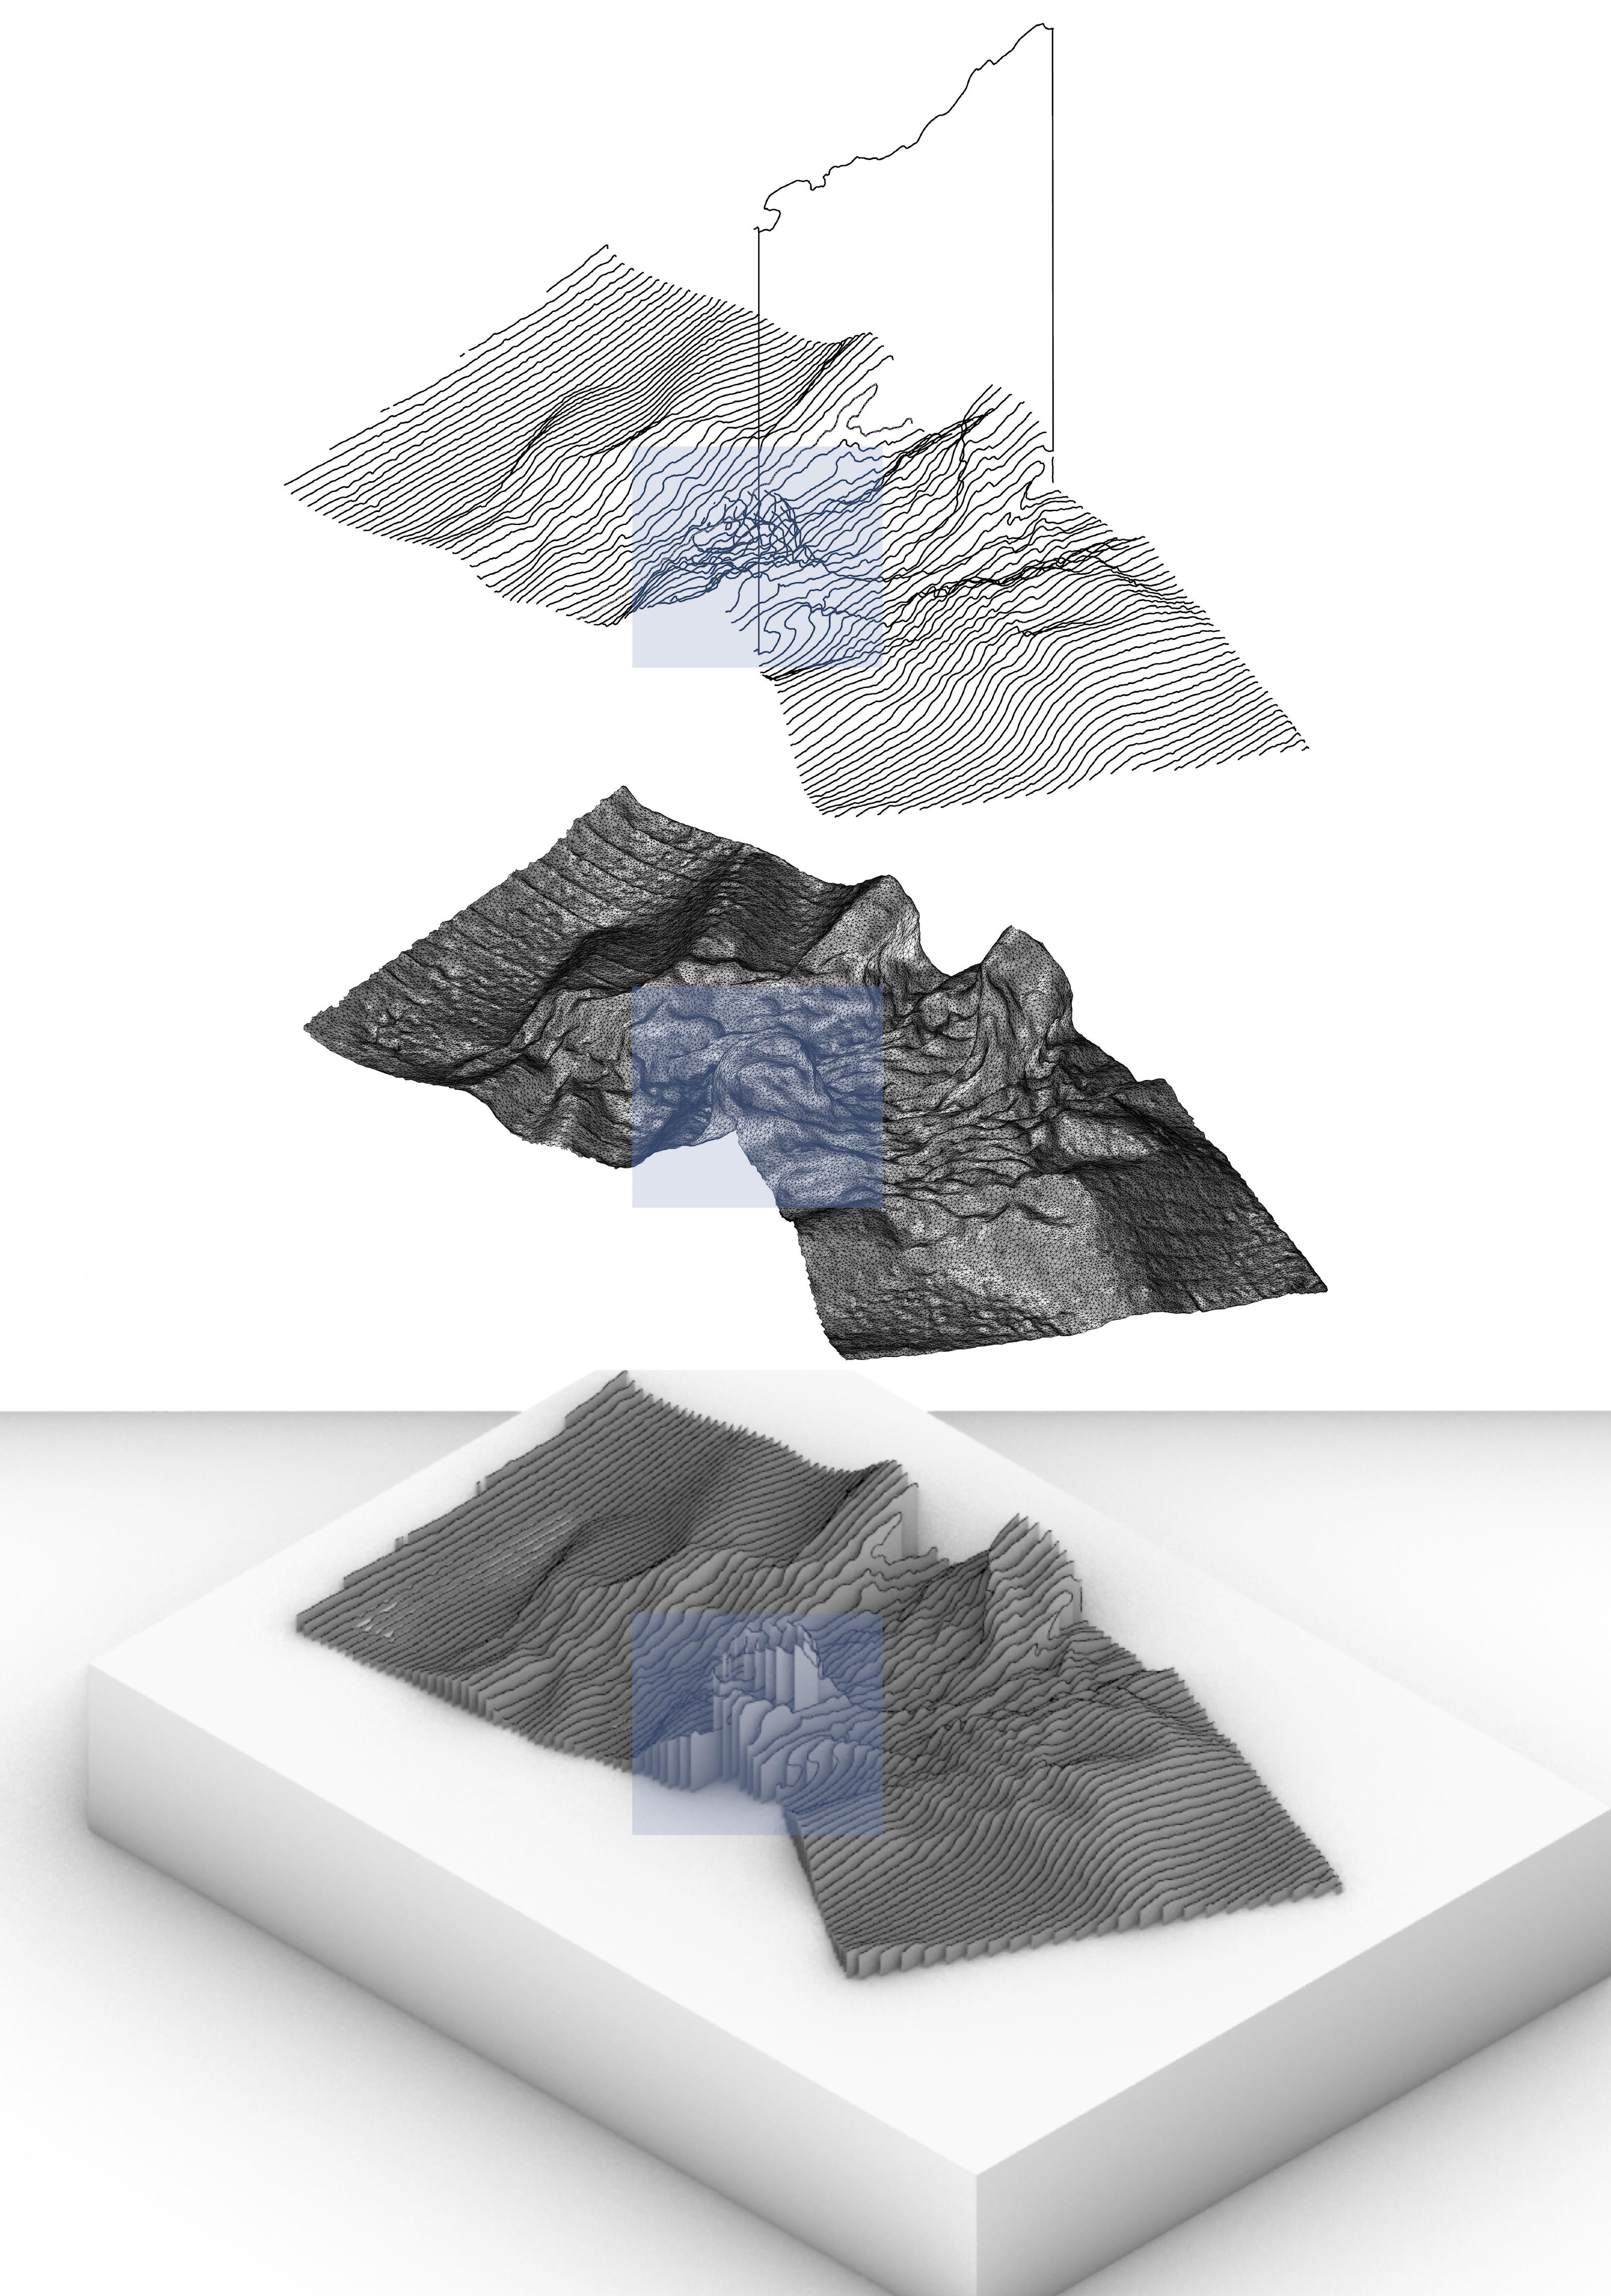
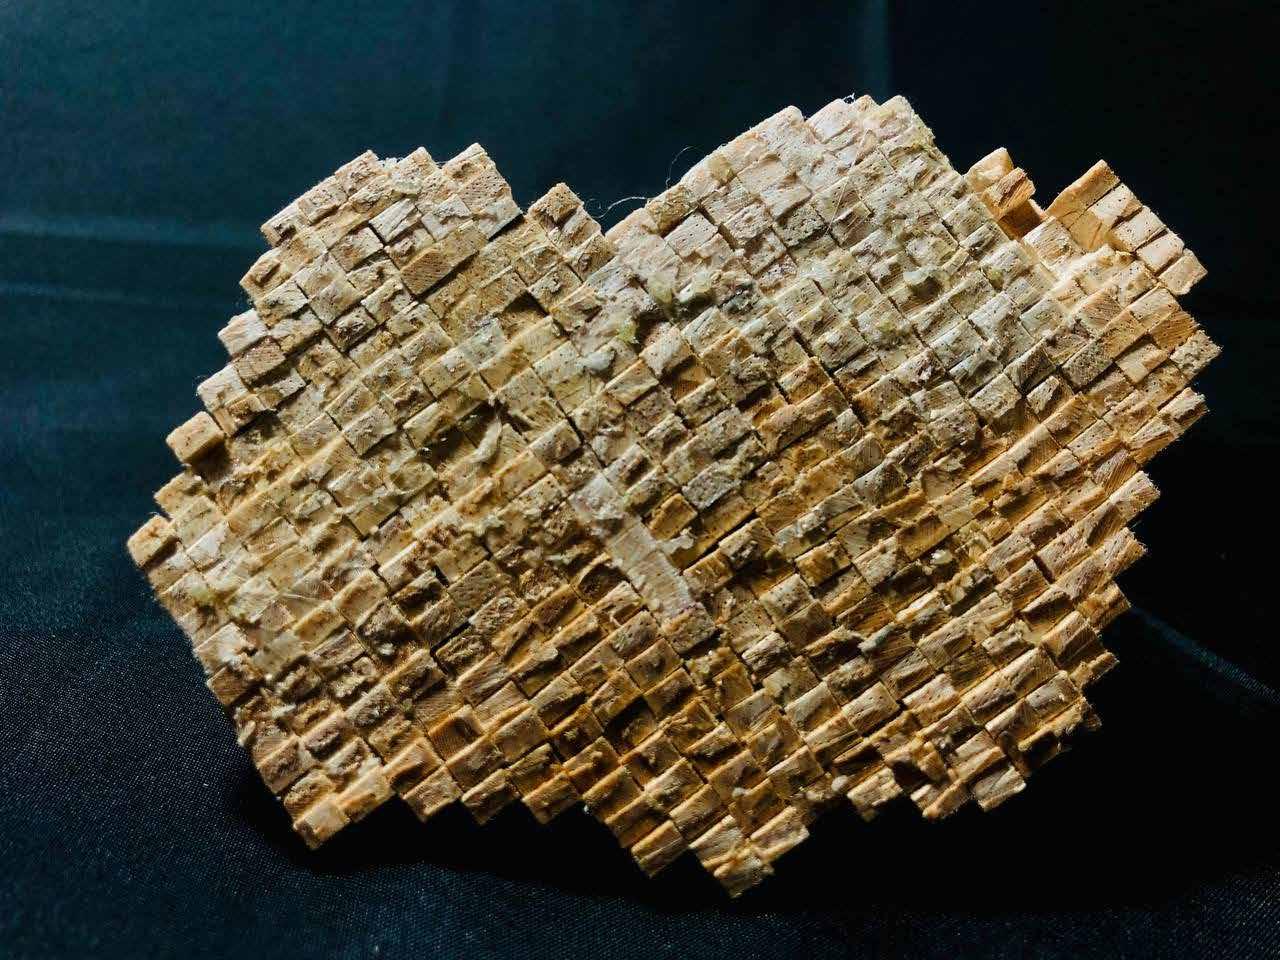
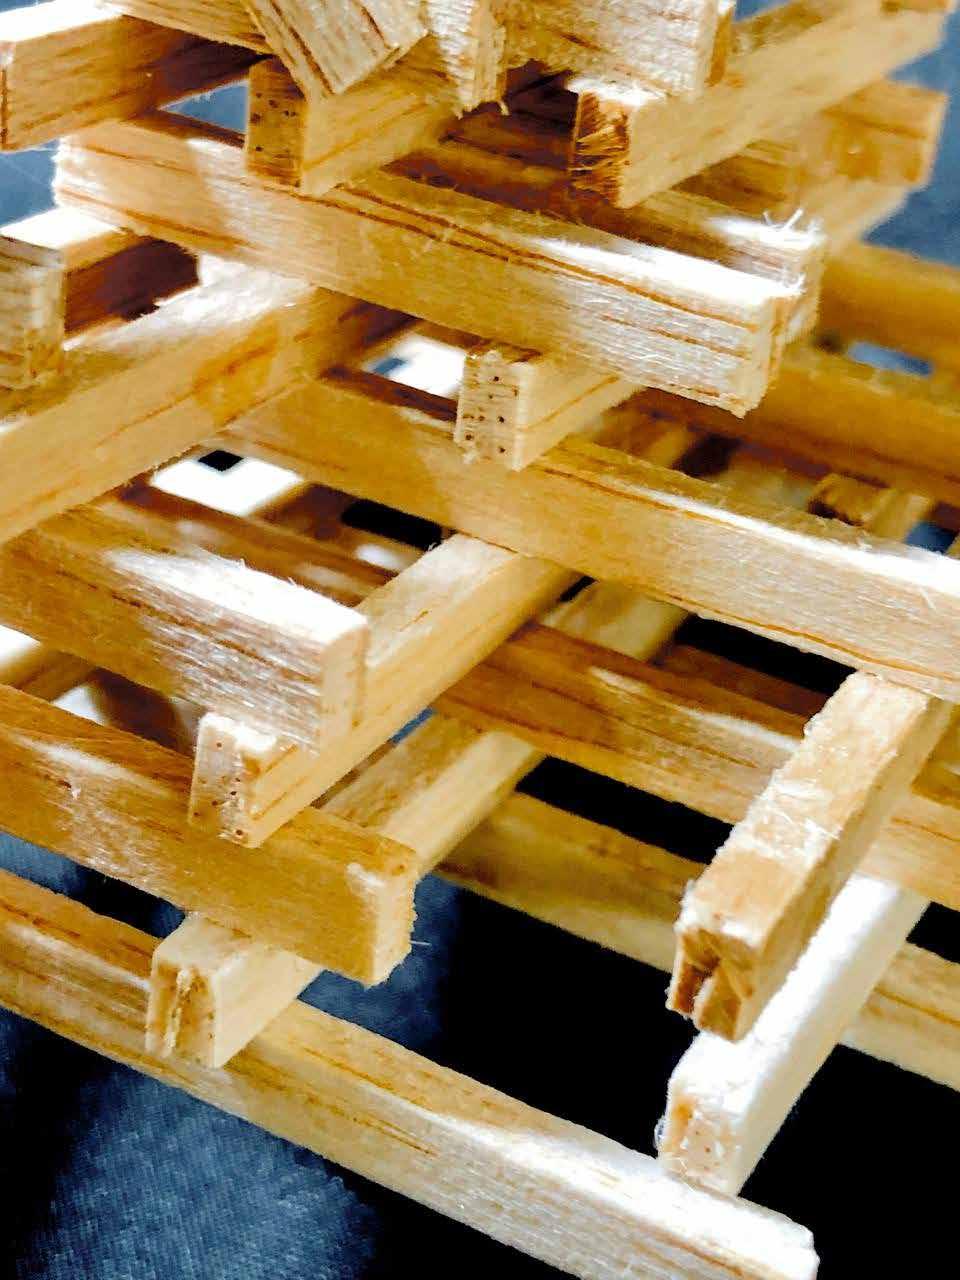
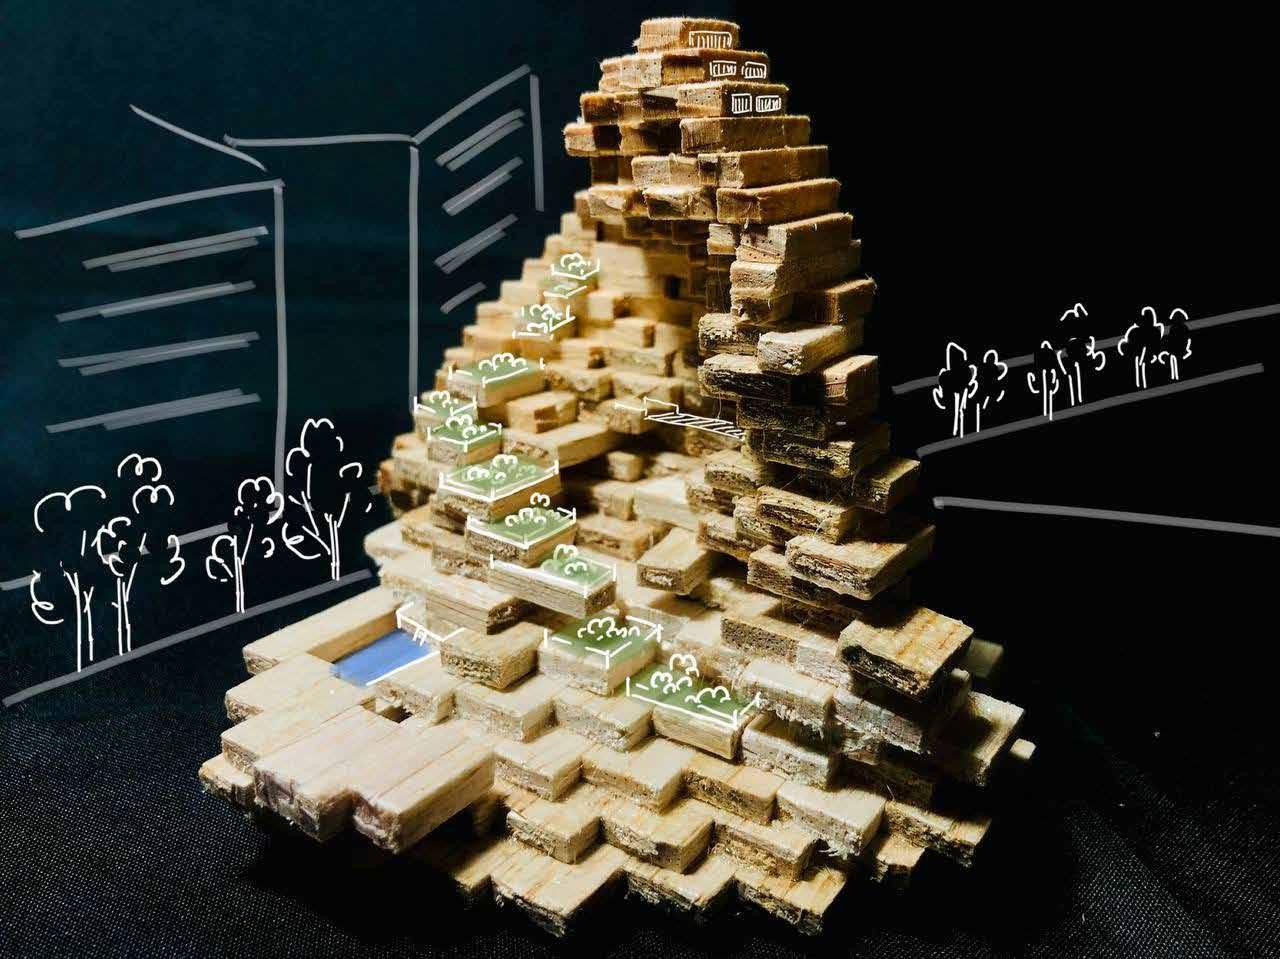
In the real world context, parametric architectural designs can be constructed using basic unit materials such as bricks. Inspired by this concept, each of us chose different materials to rebuild organic forms as rigid discrete models.
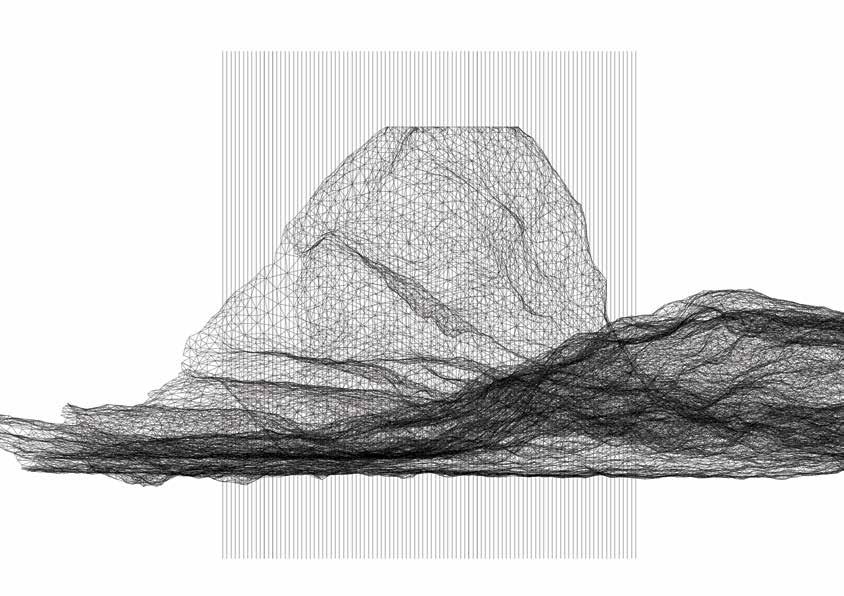
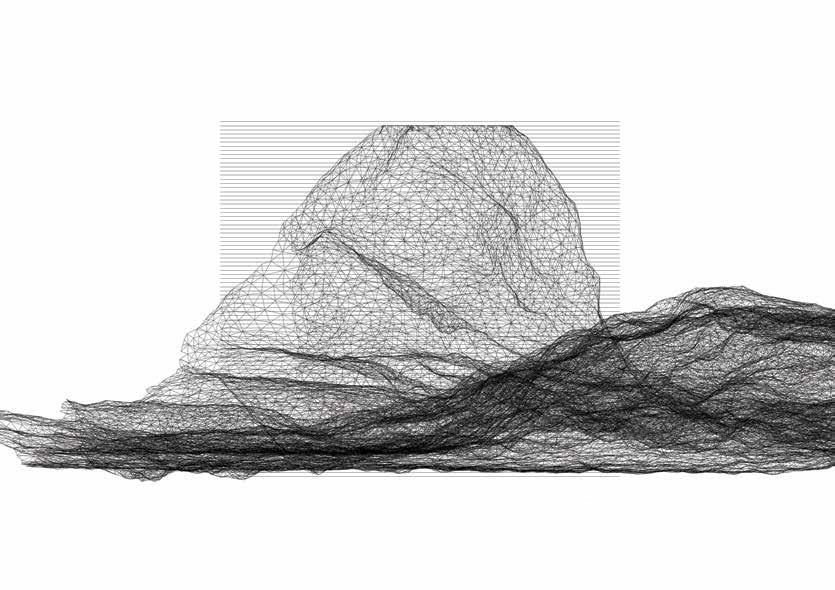
Referring to the regular section lines in the digital model, I decided on the use of square wooden strips rather than rounded sticks so that all areas can be filled up with no gaps and no loss of information. The thinner the unit material, the higher the resolution of the form.
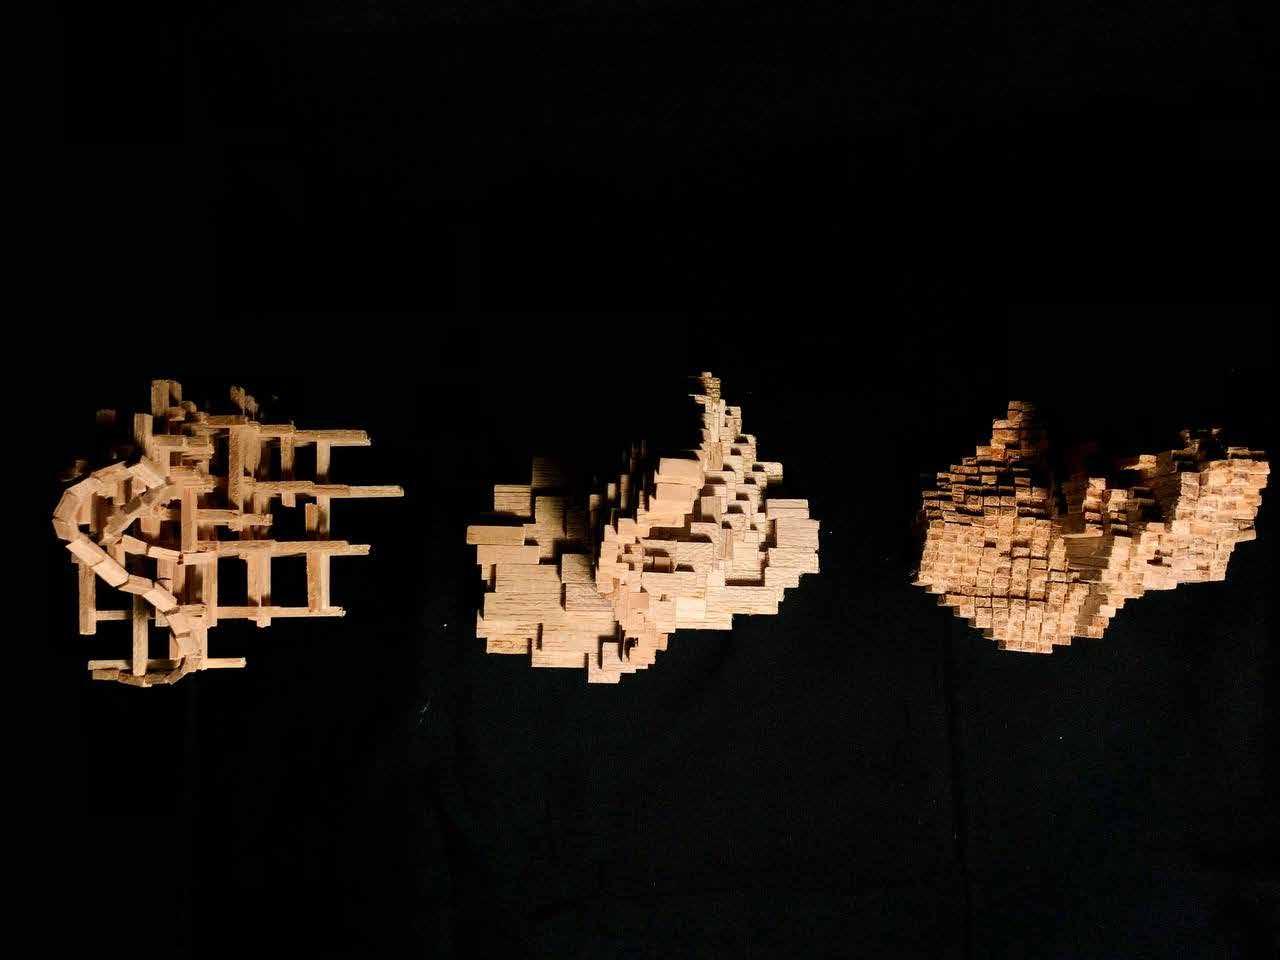

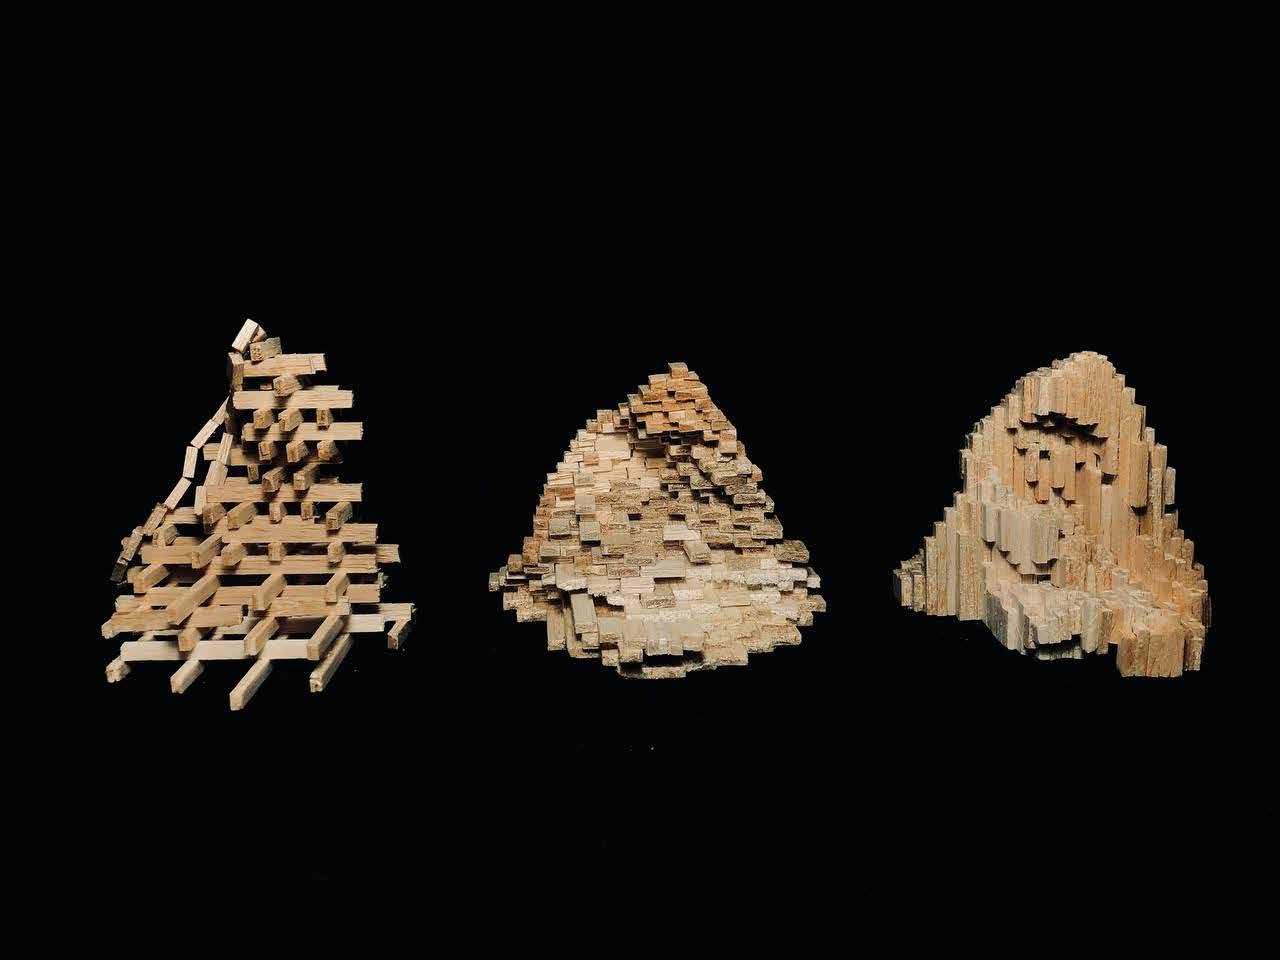


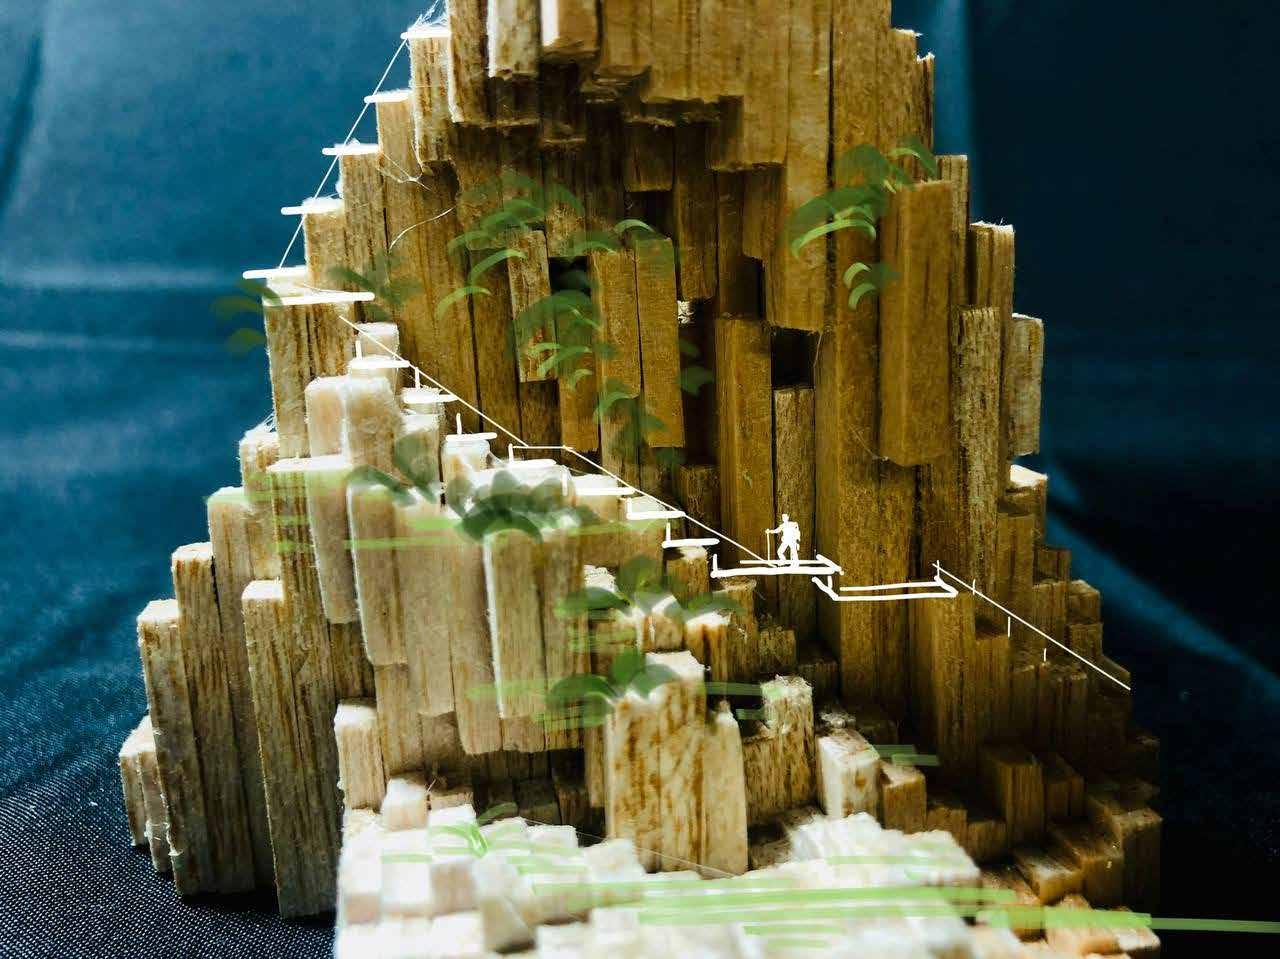
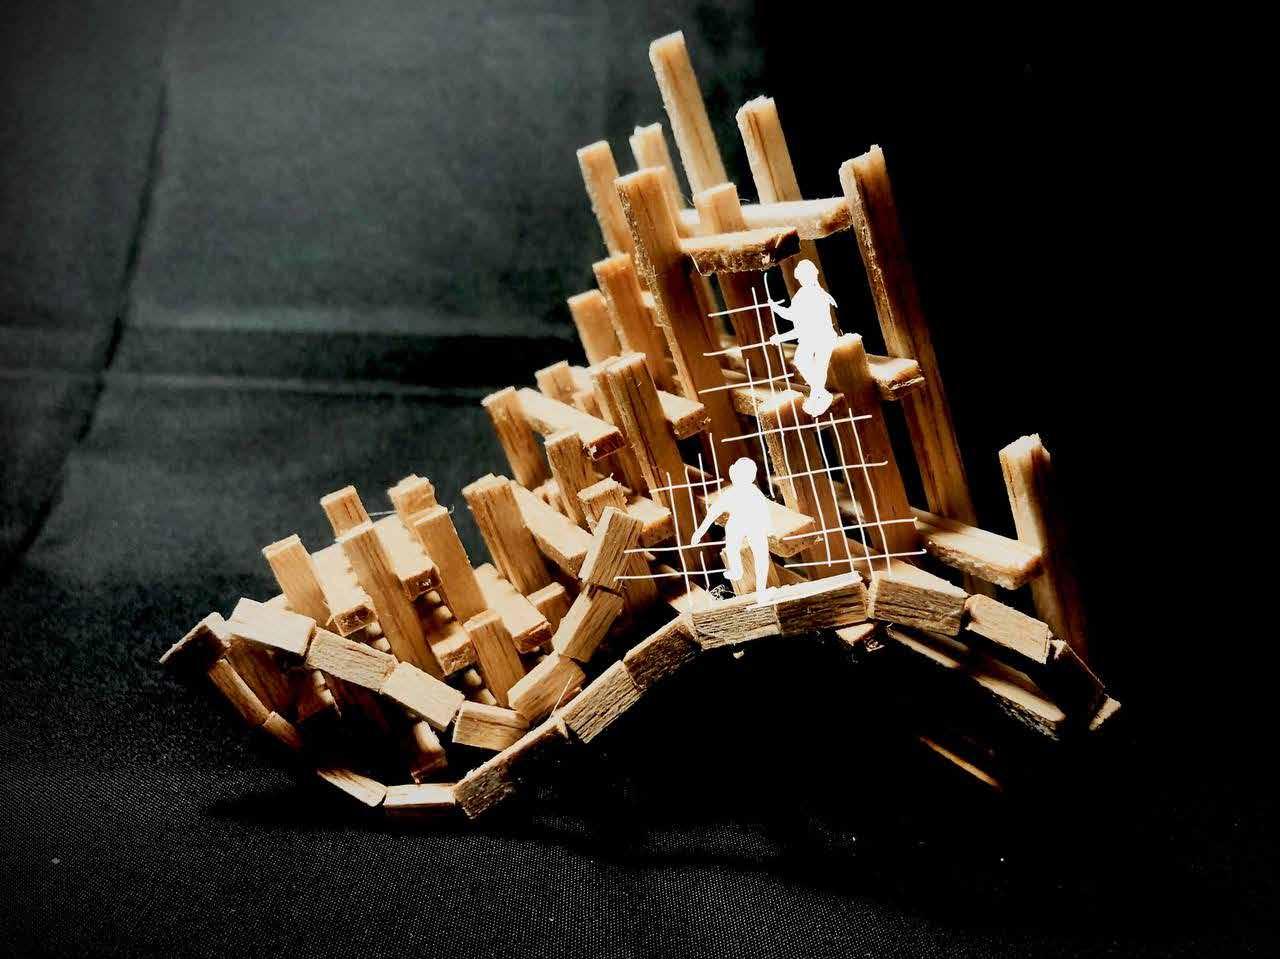
Unit construction concept now has been applied to furniture design, public art installation, interior design (such as ceilings and walls), building skin or facade and even city planning. Below are my imaginations of three contexts when I rotate the discrete models and play with scales.
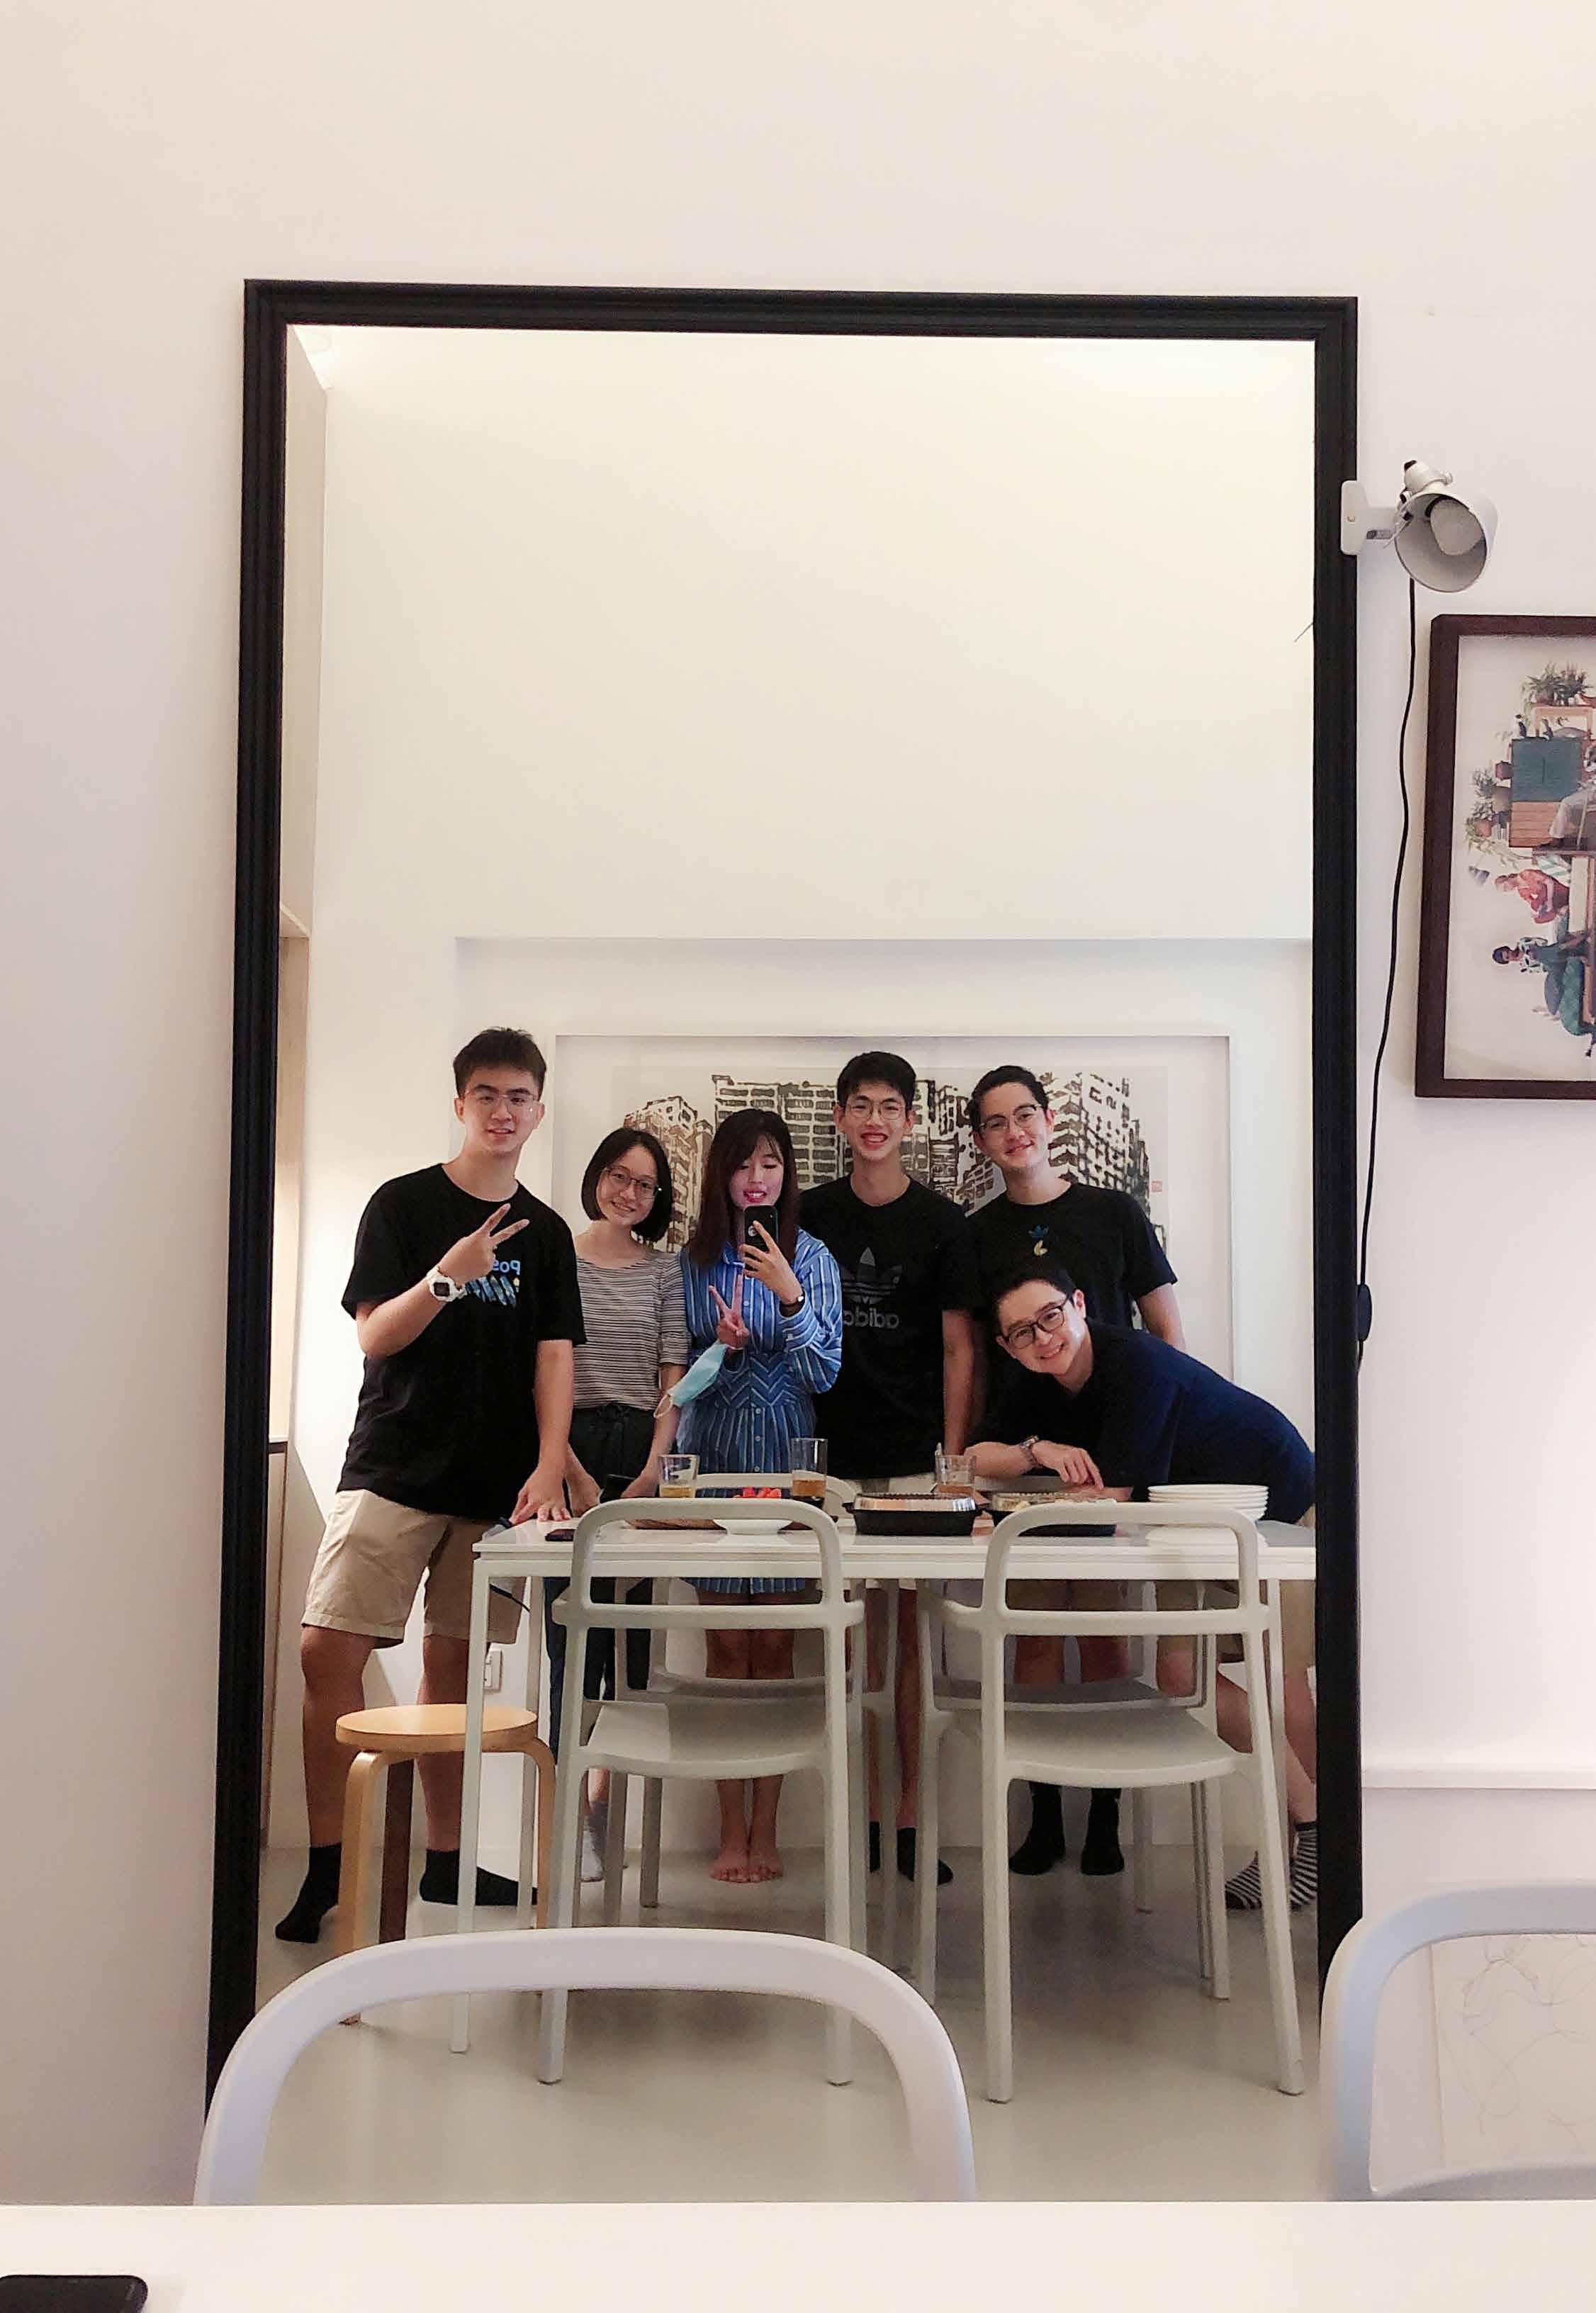
I cannot expect a better first semester of year one architecture, indeed. I enjoyed all the six assignments particularly three of them in Topic B so much that I am looking forward to our future studies in architecture. From the bottom of my heart, I would like to extend my genuine appreciation to my professor William. I felt myself being inspired and learning new things in every session we met, and the books he introduced us are especially helpful and eye-opening. I particularly enjoyed how clear and sharp he was in explaining the briefs and objectives of each assignment, which enabled us to quickly understand the essence and find the right direction to explore. I believe this clear guidance is the most important and beneficial step in building our foundation. This clarity also made me very much convinced by William’s suggestions and feedback. His reasonable comments and flexible approaches gave me space to explore beyond the limits, and really motivated me to successfully create unconventional work eventually. Towards the end, inspired by his exposures and passion, I was able to take a step back to see a greater picture to make sense of all our works and conduct meaningful in-depth discussions with him. Besides, I am very glad to see how our studio mates develop strong bonds through teamwork assignments. This positive learning environment is invaluable as we are not competing with one another but really inspire and help one another to improve together. I believe this is due to the openness in our tutorial discussions, in which everyone shared everything about their progress, and we all give feedback to solve problems and learn together.
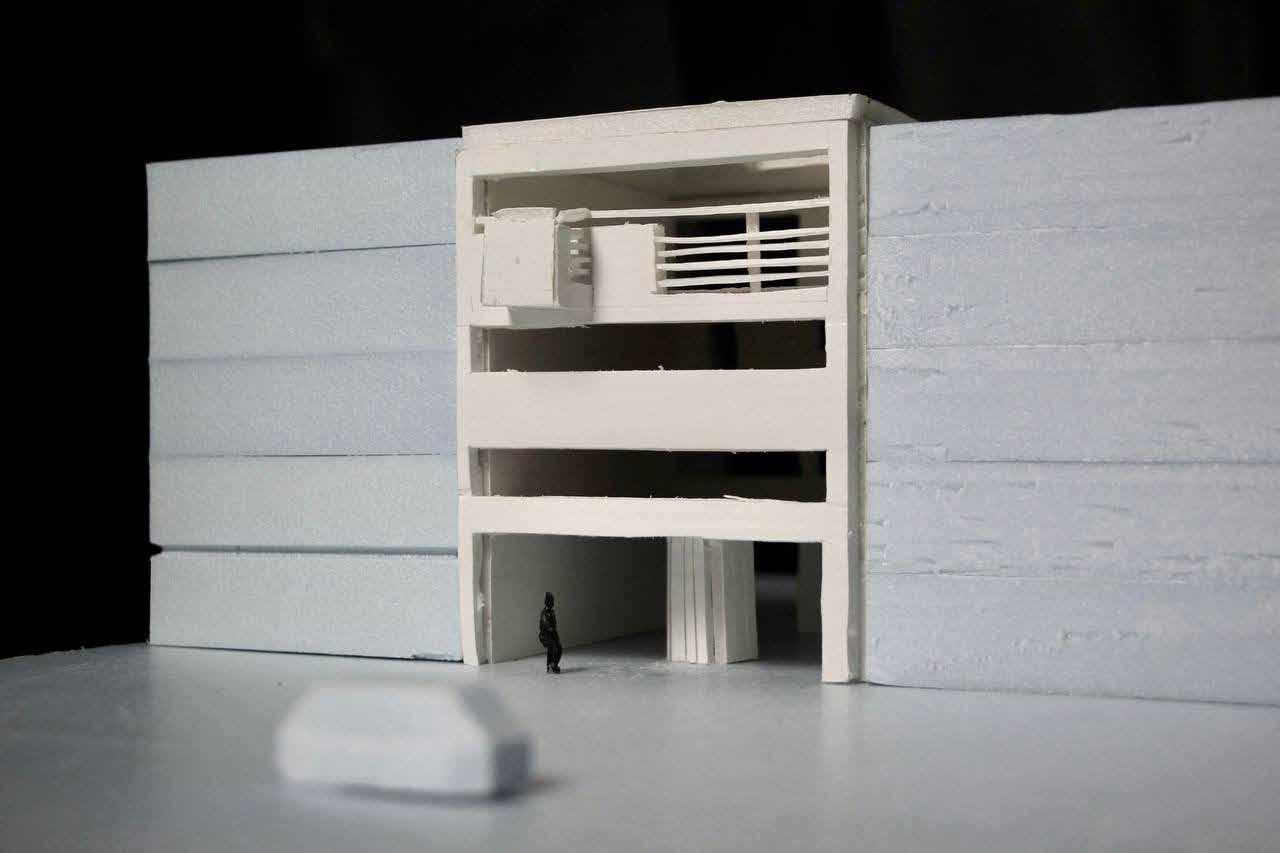
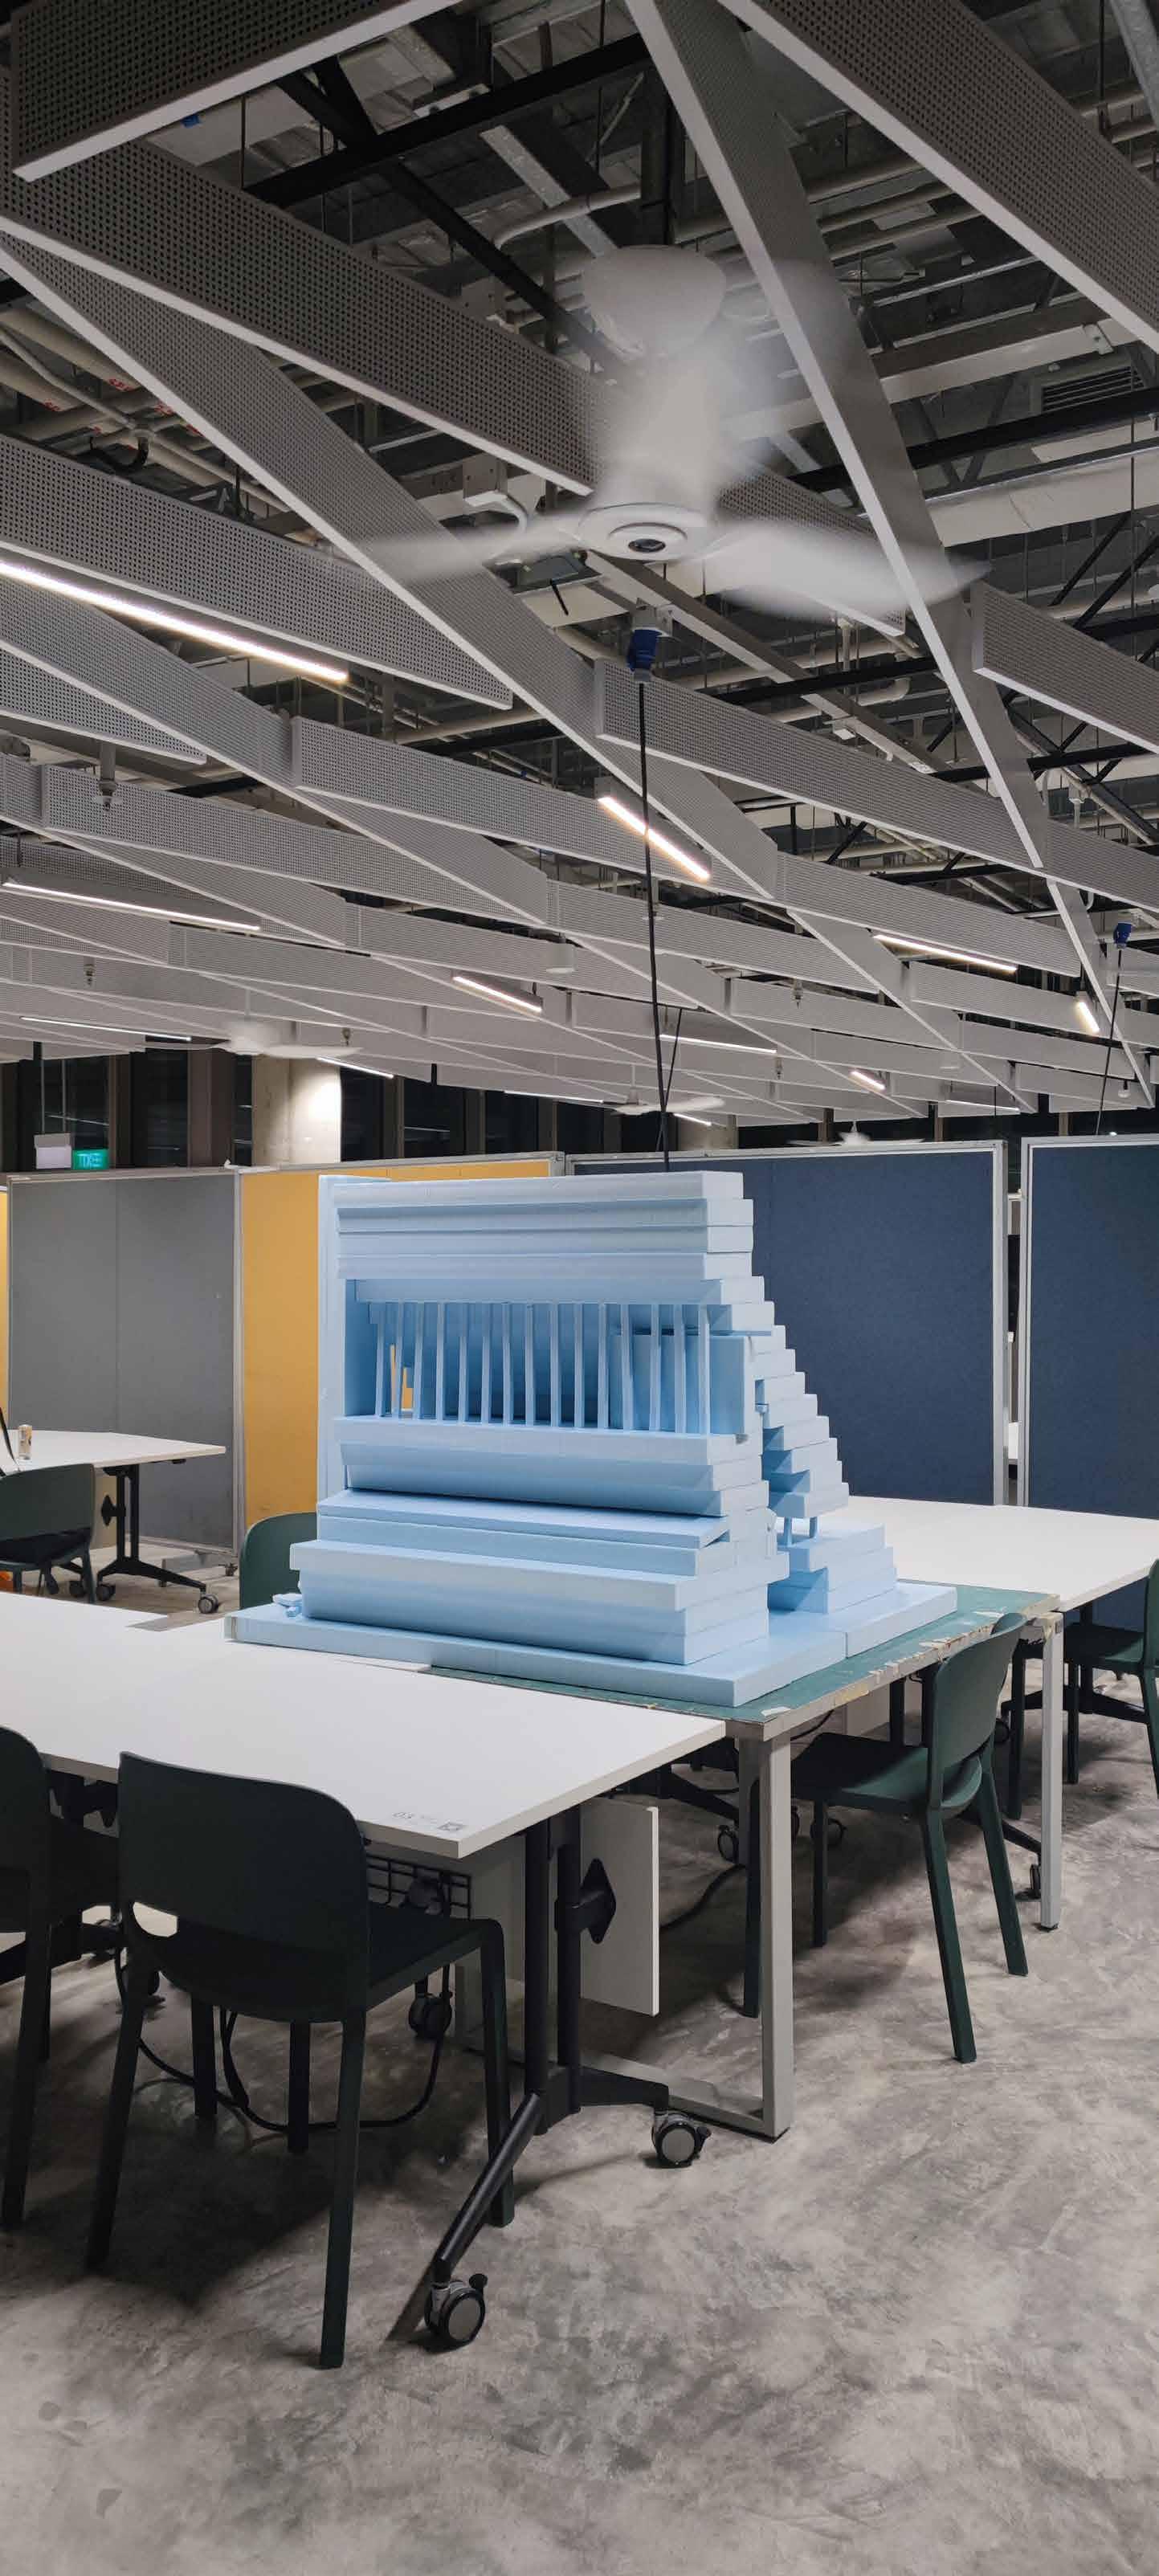
To be honest, I was very stressed at the beginning of each new assignment. The starting point was always difficult to find, but once I find the one special aspect, I could develop a strong and unique story. My stress level peaked in Topic B EX.2 three days before submission when I had to change everything about my coding. I almost gave up, really. But what does not kill me makes me stronger. Under extreme pressure, I was pushed to a new level, and think of the unique variable, live time. I believe the time-based coding is especial and very much fulfilling the requirement of complex variable with the quality of intensity. Although I believe it is inevitable to be stuck in creative jobs, the stress level in architecture is generally much higher than other majors and this has a negative effect on our physical and mental health. It would be better if the workload is reduced by unpacking and spacing out each assignment to give us more time to explore and digest and cutting down unnecessary or repeated steps and allow shortcuts just like how we 3D scanned our model for EX.3 as long as we have the skills. Time is always our limit, and the countless possibilities make designs forever improvable. No best but better. If there is one regret in this semester, it is our golden mile complex model. When details are not of a concern, the huge size hindered us more than helped us appreciate the realistic scale.
https://www.archival2022.com/projects/computational-design-thinking-%E2%80%94%E2%80%94visualisation-of-2011-japan-earthquake
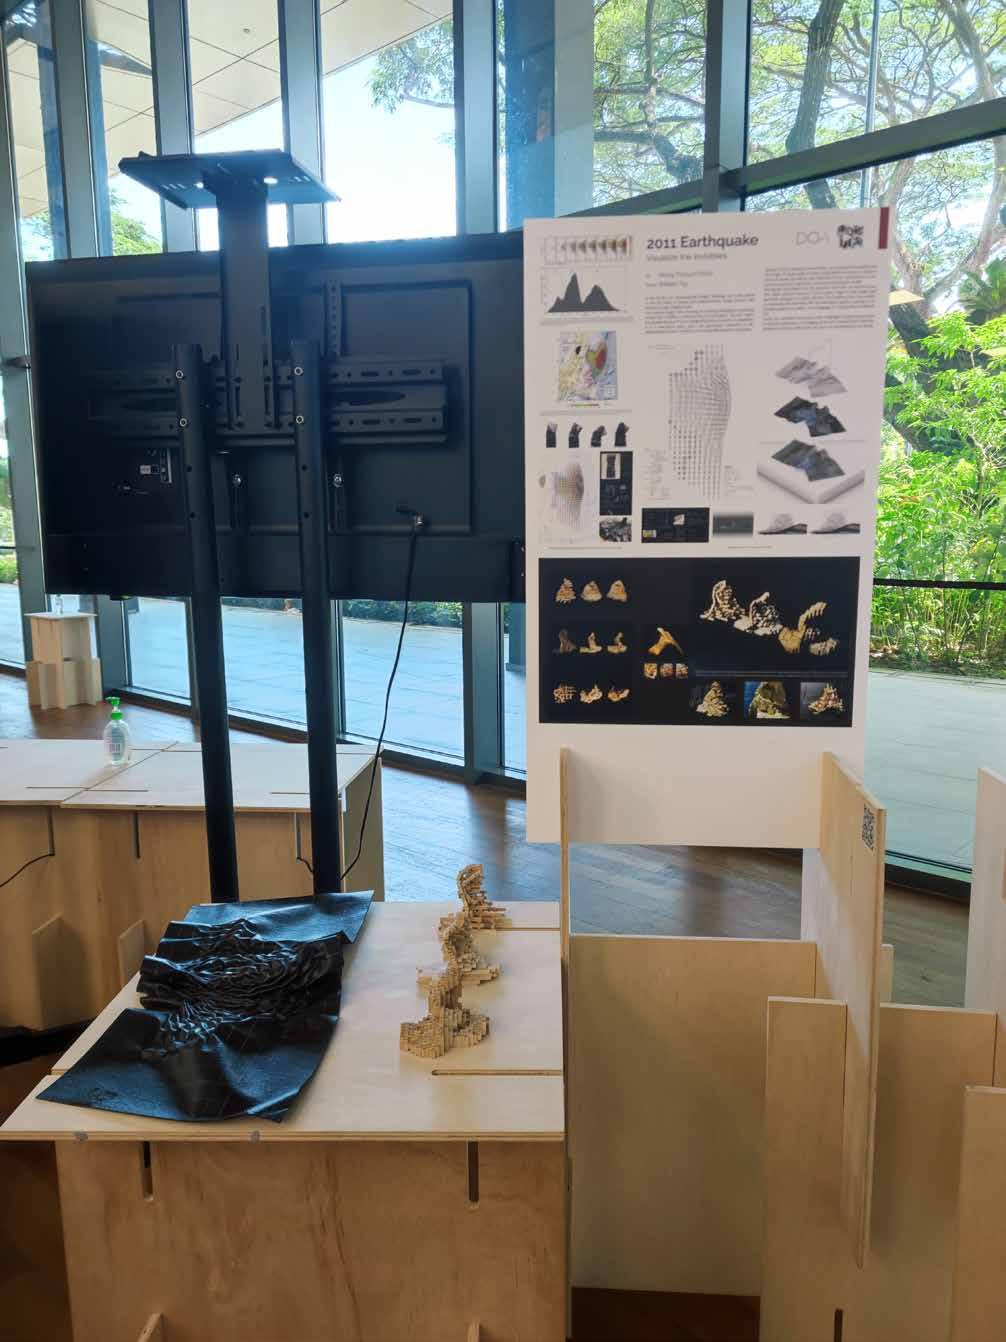

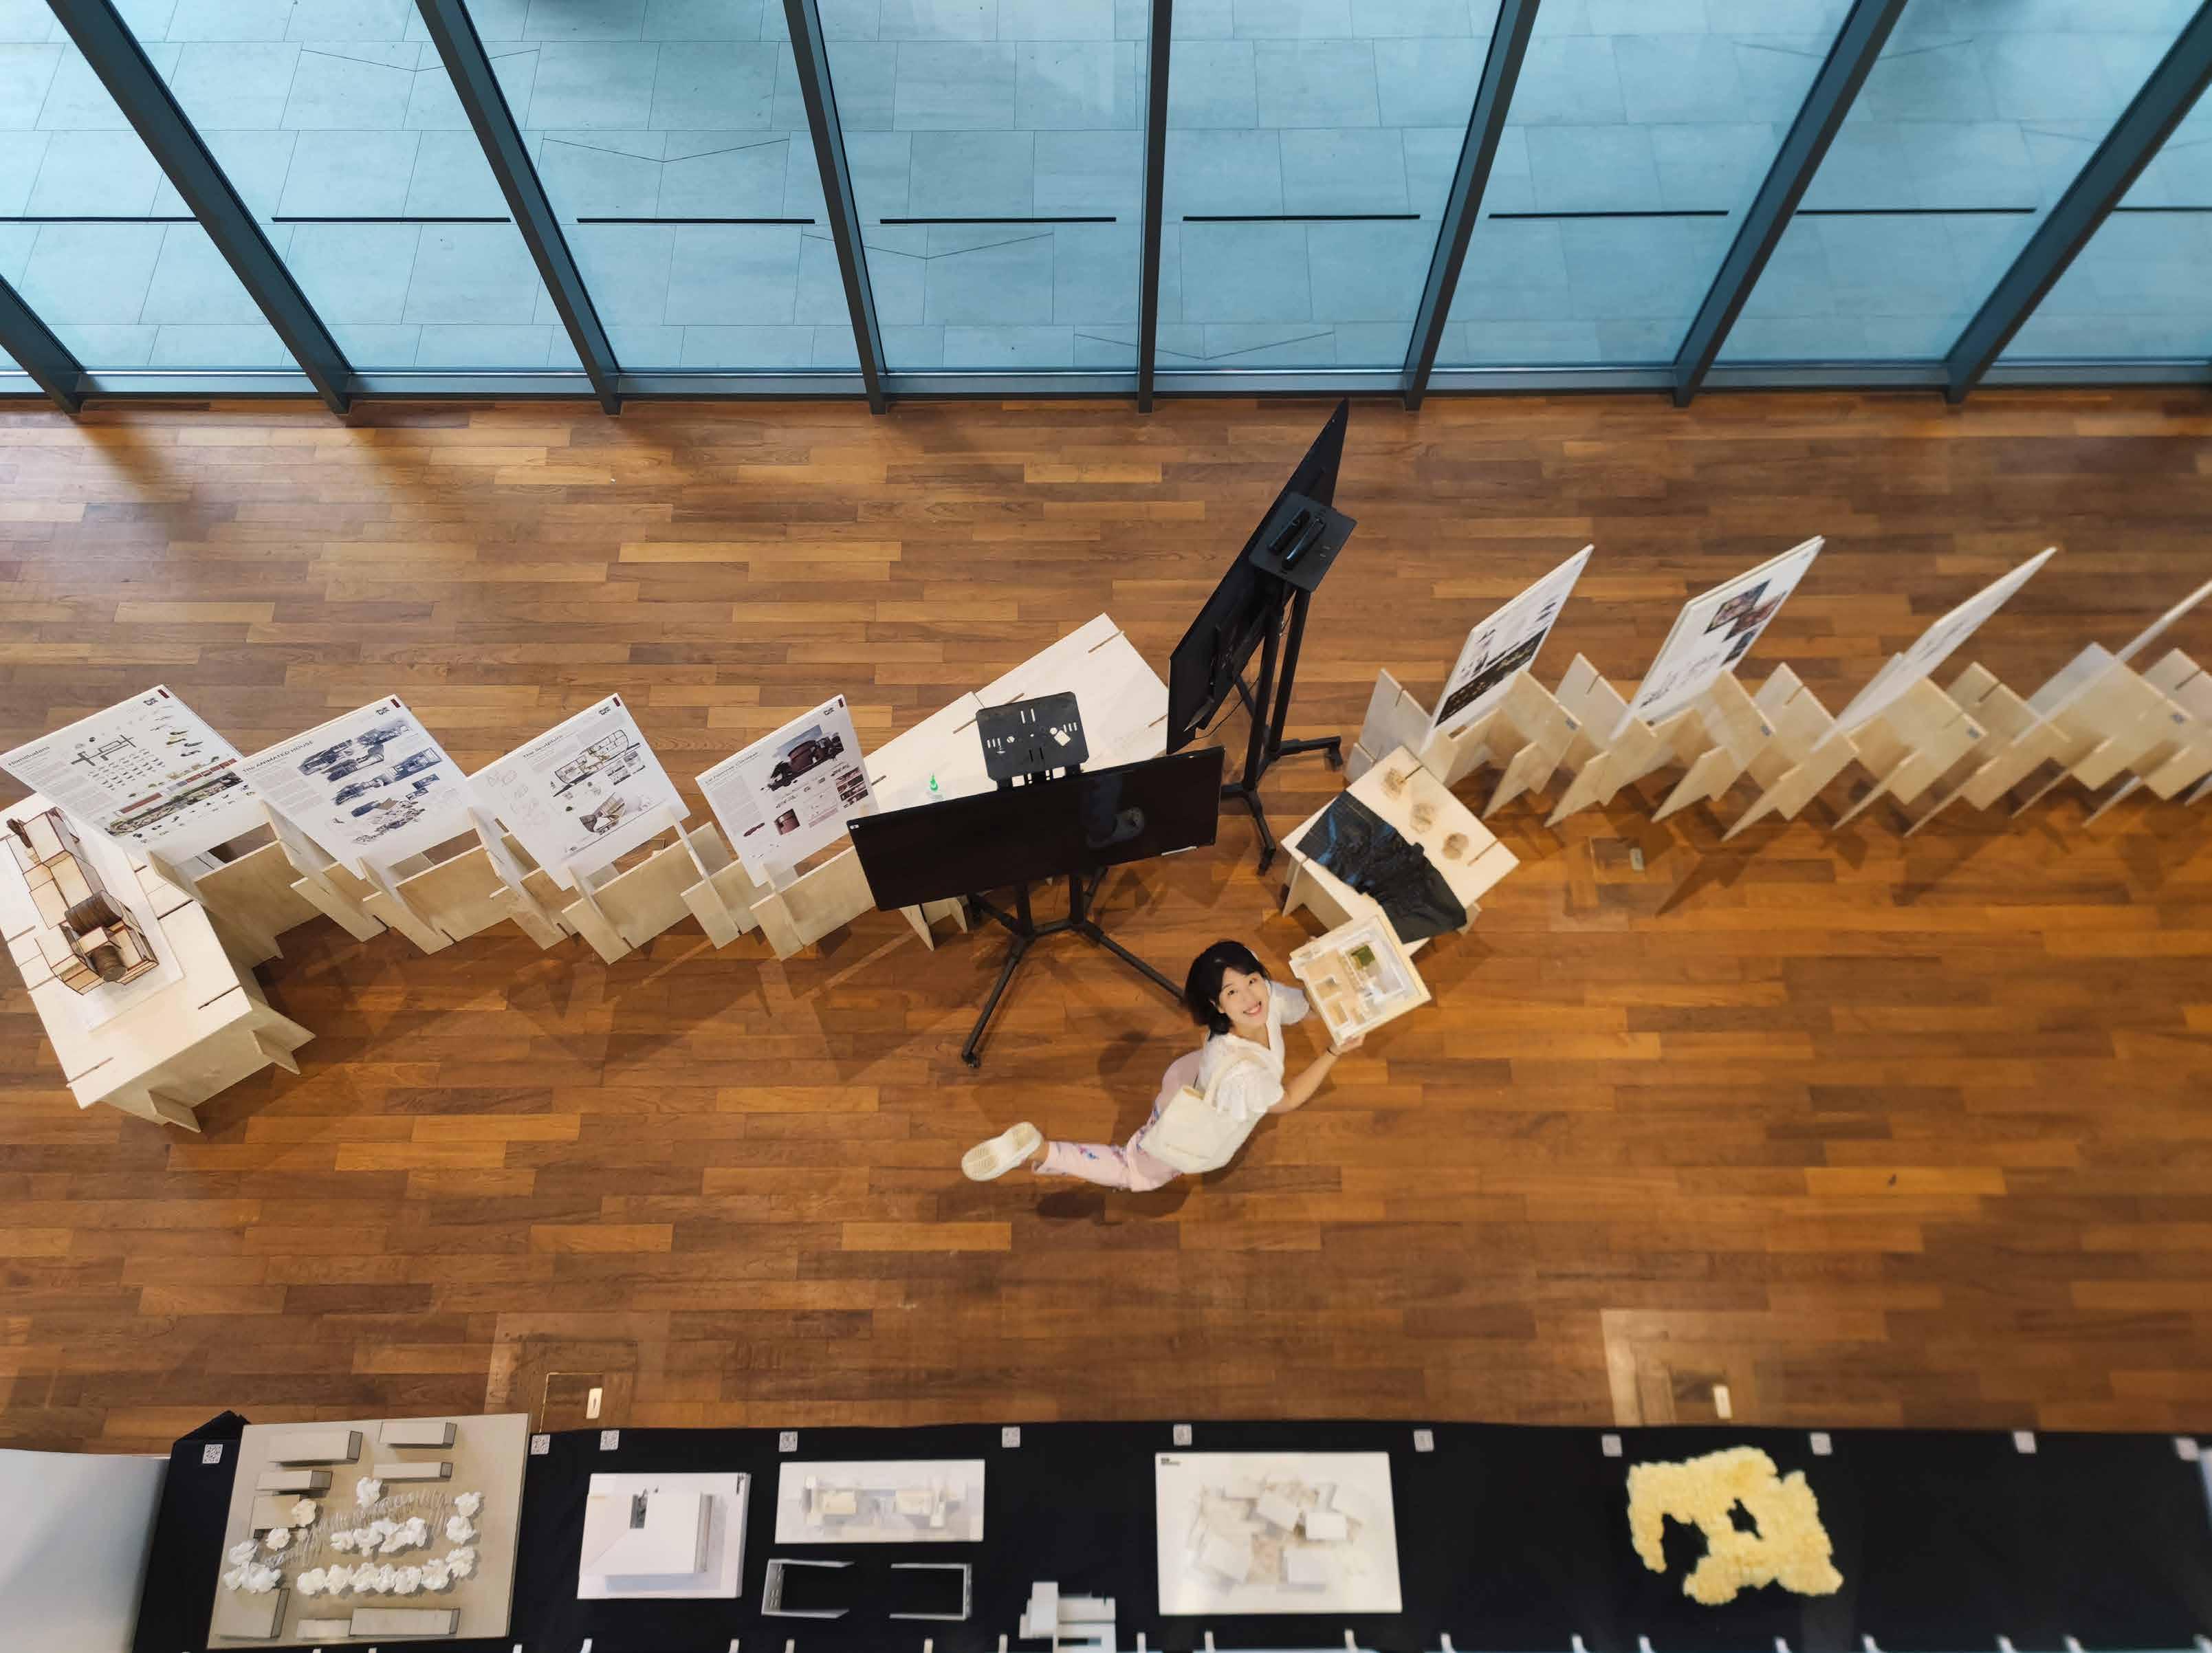
It is also featured in NUS DOA Official Instagram account @AKI.NUS
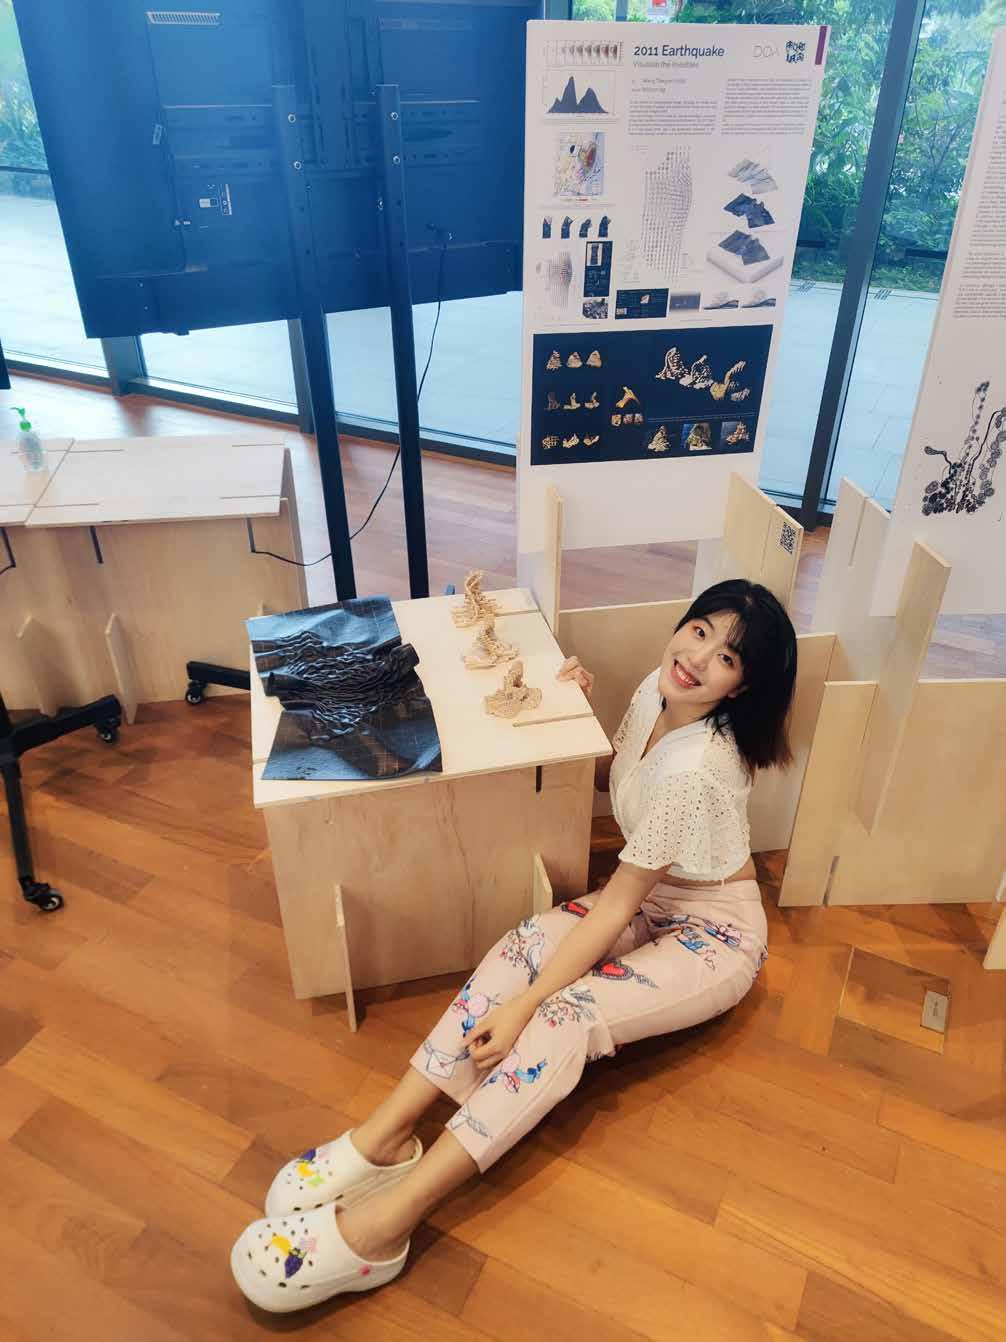
https://www.instagram.com/p/CaTaJpMvNq7/?igshid=YmMyMTA2M2Y=
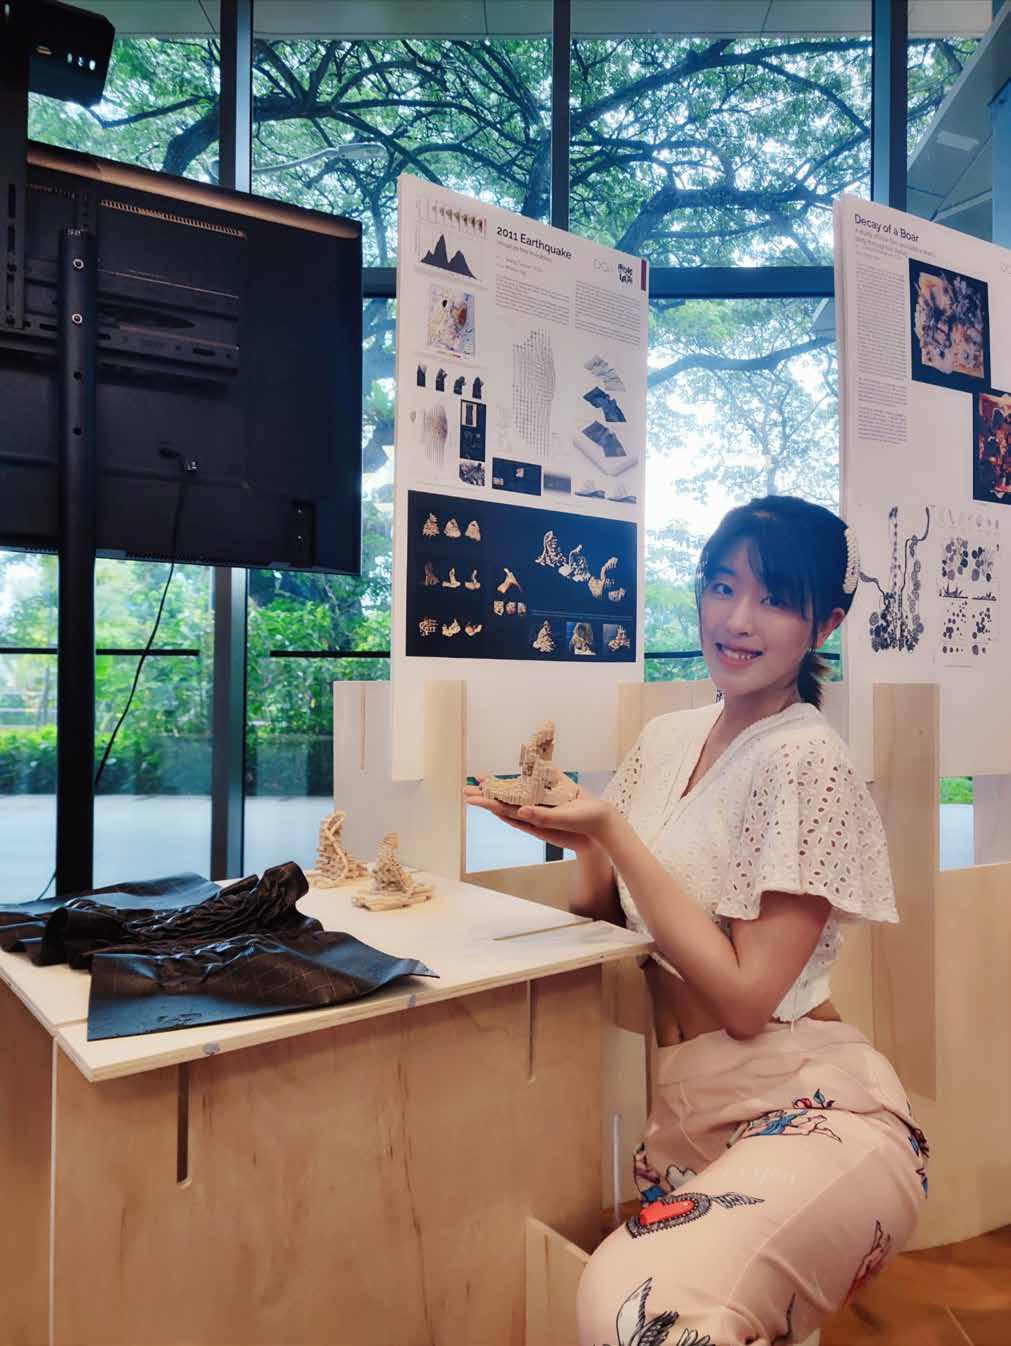 Topic B EX.3 “2011 Earthquake” is chosen as the top 10 outstanding student works displayed in Archival 2022, NUS annual architecture exhibition.
To my future self: Continue to dream, to love, and most importantly, to care.

Be daring, be wild, and be the change that I want to see in the world.
