12 minute read
Deltona–Daytona Beach–Ormond Beach ...............................35
Short Term Outlook for Deltona-Daytona Beach-Ormond Beach, FL March 2022 Forecast
2022:1 2022:2 2022:3 2022:4 2023:1 2023:2 2023:3 2023:4 2024:1 2024:2 2024:3 2024:4 2025:1
Personal Income (Billions $)
Total Personal Income 34.6 35.2 35.7 36.0 36.4 36.9 37.4 37.9 38.5 38.9 39.3 39.8 40.4 Pct Chg Year Ago -4.4 3.6 5.0 4.5 5.4 4.9 4.8 5.4 5.5 5.2 5.1 4.9 5.0 Wages and Salaries 11.4 11.7 11.9 12.0 12.1 12.2 12.3 12.5 12.6 12.8 12.9 13.1 13.2 Nonwage Income 23.1 23.5 23.9 24.0 24.4 24.7 25.1 25.4 25.8 26.1 26.4 26.8 27.2 Real Personal Income (12$) 30.1 30.5 30.7 30.9 31.1 31.4 31.7 32.0 32.3 32.5 32.7 32.9 33.2 Pct Chg Year Ago -9.5 -0.9 1.2 1.9 3.5 3.1 3.1 3.6 3.6 3.3 3.1 2.9 2.9 Per Capita Income (Ths) 50.4 51.3 51.9 52.2 52.6 53.2 53.7 54.3 54.9 55.4 55.9 56.4 57.1 Real Per Capita Income (12$) 43.9 44.4 44.7 44.8 45.0 45.2 45.5 45.8 46.1 46.2 46.4 46.7 46.9 Average Annual Wage (Ths) 54.0 54.6 55.0 55.4 55.8 56.1 56.5 57.2 57.9 58.6 59.2 59.9 60.6 Pct Chg Year Ago 8.8 4.8 3.6 3.1 3.3 2.7 2.6 3.3 3.8 4.3 4.9 4.7 4.7
Establishment Employment (Place of Work, Thousands, SA)
Total Employment 210.7 213.1 214.3 214.8 215.0 216.4 217.2 217.4 217.3 217.0 216.9 216.9 216.9 Pct Chg Year Ago 4.4 5.6 5.1 3.6 2.1 1.5 1.4 1.2 1.0 0.3 -0.1 -0.2 -0.2 Manufacturing 11.7 11.8 11.7 11.8 11.7 11.8 11.8 11.8 11.8 11.8 11.8 11.8 11.7 Pct Chg Year Ago 6.1 6.0 4.2 0.9 0.3 0.3 0.6 0.0 0.2 -0.3 -0.4 -0.2 -0.6 Nonmanufacturing 199.0 201.4 202.5 203.0 203.3 204.7 205.4 205.6 205.5 205.3 205.2 205.1 205.2 Pct Chg Year Ago 4.3 5.6 5.1 3.8 2.2 1.6 1.4 1.3 1.1 0.3 -0.1 -0.2 -0.2 Construction & Mining 15.2 15.3 15.2 15.2 15.1 14.9 14.8 14.6 14.5 14.3 14.2 14.1 14.0 Pct Chg Year Ago 2.5 3.4 0.8 -1.0 -1.2 -2.1 -3.0 -3.4 -3.8 -4.1 -4.1 -3.8 -3.2 Trade, Trans, & Utilities 39.7 40.4 40.2 39.5 39.0 39.6 39.5 39.6 39.2 38.4 38.1 38.0 37.8 Pct Chg Year Ago 3.0 6.9 5.1 1.2 -1.6 -2.0 -1.7 0.3 0.5 -3.0 -3.6 -4.0 -3.6 Wholesale Trade 5.0 5.1 5.2 5.3 5.3 5.3 5.4 5.4 5.5 5.6 5.6 5.6 5.7 Retail Trade 31.2 31.9 31.5 30.7 30.2 30.7 30.6 30.6 30.1 29.2 28.8 28.7 28.4 Trans, Wrhsng, & Util 3.4 3.5 3.6 3.5 3.6 3.5 3.6 3.6 3.6 3.6 3.7 3.7 3.7 Information 2.0 2.0 1.9 2.0 2.0 2.0 2.0 2.0 2.0 2.0 2.1 2.1 2.1 Pct Chg Year Ago 6.3 5.5 1.7 3.1 1.0 2.3 2.1 -0.6 0.6 1.5 4.4 6.1 6.5 Financial Activities 9.3 9.3 9.4 9.4 9.5 9.4 9.4 9.5 9.5 9.6 9.6 9.6 9.7 Pct Chg Year Ago 1.7 4.2 3.6 1.0 2.2 1.8 0.7 1.1 0.6 1.6 1.7 1.7 1.5 Prof & Business Services 24.8 25.0 25.3 25.3 25.5 25.3 25.2 25.3 25.4 25.5 25.5 25.5 25.5 Pct Chg Year Ago 1.9 3.3 3.0 1.2 2.6 1.1 -0.4 -0.3 -0.2 0.9 1.1 0.7 0.4 Educ & Health Services 41.1 41.2 41.3 41.2 41.2 41.3 41.4 41.5 41.7 41.9 42.1 42.2 42.4 Pct Chg Year Ago 3.7 5.8 2.3 1.4 0.1 0.3 0.1 0.6 1.2 1.4 1.8 1.7 1.7 Leisure & Hospitality 32.7 33.8 34.3 35.5 35.9 36.9 37.8 37.8 37.7 38.0 38.1 38.0 37.9 Pct Chg Year Ago 14.0 8.6 14.5 16.9 9.9 9.2 10.4 6.5 4.9 2.8 0.6 0.5 0.5 Other Services 8.6 8.8 9.0 9.1 9.3 9.3 9.4 9.5 9.6 9.8 9.9 10.0 10.2 Pct Chg Year Ago 7.6 7.3 10.1 10.5 7.7 5.4 3.5 3.8 4.1 5.6 6.0 5.9 5.5 Federal Government 1.5 1.5 1.5 1.5 1.6 1.6 1.6 1.6 1.6 1.6 1.6 1.6 1.6 Pct Chg Year Ago -2.6 1.6 8.1 2.2 2.1 1.7 1.1 0.6 0.2 -0.1 -0.1 -0.2 -0.2 State & Local Government 24.1 24.2 24.3 24.3 24.3 24.3 24.4 24.3 24.3 24.2 24.1 24.0 24.0 Pct Chg Year Ago -0.6 2.9 2.0 0.2 1.0 0.7 0.4 0.2 -0.2 -0.6 -1.0 -1.2 -1.0
Other Economic Indicators
Population (Ths) 685.7 687.0 688.6 690.2 692.4 694.5 696.6 698.3 700.2 702.0 703.9 705.7 707.5 Pct Chg Year Ago 1.1 0.9 0.9 0.9 1.0 1.1 1.2 1.2 1.1 1.1 1.0 1.1 1.0 Labor Force (Ths) 312.1 314.2 315.9 317.2 318.1 318.9 319.8 320.4 320.6 320.8 320.9 321.1 321.2 Pct Chg Year Ago 3.6 2.7 2.5 2.5 1.9 1.5 1.2 1.0 0.8 0.6 0.4 0.2 0.2 Unemployment Rate (%) 4.5 4.5 4.4 4.3 4.2 4.2 4.2 4.2 4.1 4.1 4.0 3.9 3.9 Total Housing Starts 6161.4 5895.5 5859.3 5776.2 5724.6 5693.8 5689.2 5575.5 5491.0 5430.7 5402.6 5370.6 5361.7 Single-Family 5706.5 5385.9 5249.2 5032.9 4805.4 4607.2 4532.5 4529.8 4434.8 4384.2 4369.3 4333.2 4337.3 Multifamily 454.9 509.5 610.1 743.3 919.1 1086.5 1156.7 1045.7 1056.2 1046.5 1033.3 1037.4 1024.5
PROFILES
The Broward County MSA Is located in Southeastern Florida. It is estimated to be the second-most populous county in the State of Florida and the 17th Most populous county in the United States.
QUICK FACTS
• Metro population estimate of 1,952,778 as of 2019 (5-Year Estimate) (U.S. Census Bureau). • Broward County population estimate of 1,952,778 as of 2019 (5-Year Estimate) (U.S. Census
Bureau). • Civilian labor force of 1,055,251 in December 2021 (Florida Research and Economic Database). • An unemployment rate of 3.6% as of December 2021, not seasonally adjusted. This amounts to 38,152 unemployed people (Florida Research and
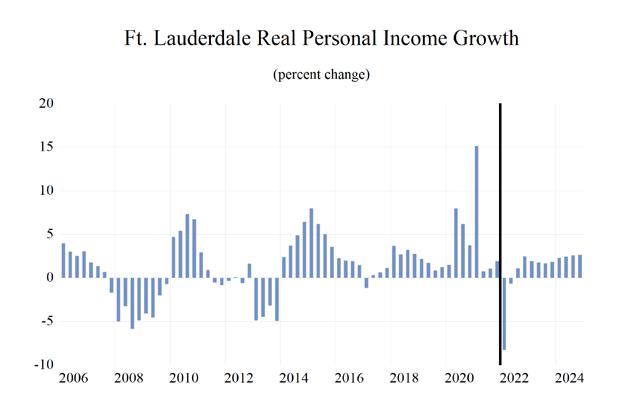
Economic Database).
OUTLOOK SUMMARIES
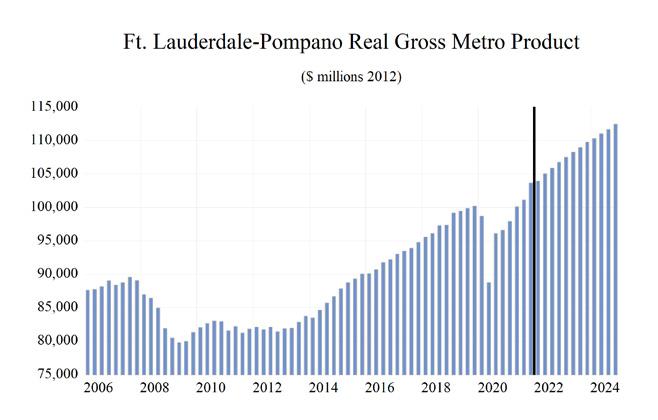
The Fort Lauderdale—Pompano Beach area expected to show strong levels of growth in the economic indicators. Personal income is expected to grow an average of 5.6 percent annually, higher than some of the 25 MSA’s studied. The average real per capita income level of $49,200 is in the middle of all areas studied. Average annual wage growth will be 6.1 percent. The annual wage level is expected to be $72,300, the fourth highest of the studied areas. Fort Lauderdale is expected to average a population growth of -0.4 percent each year. The area has one of the highest Gross Metro Product of the MSAs studied at an average level of $151,434.28 million.
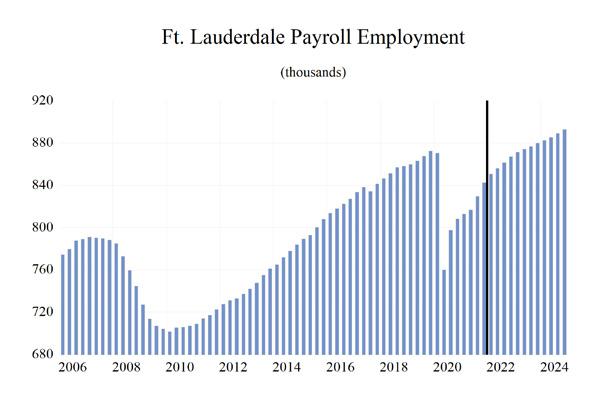
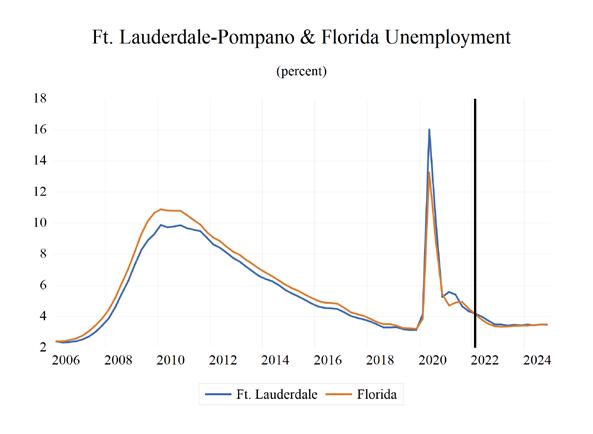
Employment is expected to grow at an average rate of 0.2 percent each year, while Unemployment is expected to be 5.6 percent.
Fort Lauderdale’s fastest growing sector is expected to be the Professional & Business Services sector, which will experience 3.2 percent average annual growth, followed by the Leisure & Hospitality sector which will grow at an average of 1.2 percent annually.
METRO NEWS SUMMARIES
Key International, Wexford buy Pompano Beach Marriott for $54M
• Pompano Hotel I LLC, in care of Pan Am
Equities in New York, sold the 219-room hotel at 1200 N. Ocean Blvd. to a joint venture between
Miami-based Key International and West Palm
Beach-based Wexford Real Estate Investors. • The hotel last traded for $45.15 million in 2018. The fact that it gained in value despite the negative impact the Covid-19 pandemic has had on the tourism market is a good sign for the future of the industry in Broward County.
Leisure hotels have generally rebounded faster than business travel hotels. • Key International and Wexford plan to renovate the Marriott-branded hotel with a new pool deck, enhancements to the hotel rooms, and a new restaurant. The hotel already has a fitness center, two restaurants and event space for 300 guests. Source: South Florida Business Journal, December 2, 2021
Disney Cruise Line names Port Everglades as second year-round homeport
• The Broward County Commission was joined by
Disney Cruise Line President Thomas Mazloum and Captain Minnie Mouse to celebrate a new agreement naming Port Everglades as Disney’s second year-round homeport. • The family-favorite cruise line is bringing its magic to Broward County’s cruise port under a 15-year partnership that includes a minimum 10.6 million passenger movements, and three 5-year extension options that could add another 11.25 million passenger movements.
The agreement provides for one ship to be homeported in Port Everglades year-round beginning fall 2023, joined by a second, seasonal ship in 2025.
• Adding Port Everglades as a second homeport gives Disney a dedicated terminal in a market with direct highway access and one of the nation’s fastest growing airports, Fort Lauderdale-
Hollywood International Airport (FLL). Disney’s original homeport is Port Canaveral, located in
Central Florida. Source: WDW News Today, December 15, 2021
‘Wynwood of Fort Lauderdale’ set to break ground soon
• Jonathan Fish, manager of Fish Property
Management LLC, has been assembling warehouse space near downtown Fort Lauderdale for a project dubbed the “Wynwood of Fort
Lauderdale”. He is set to break ground near the end of the month on a 5.3-acre arts district that will include spaces for artists, restaurateurs, entertainment venues, and even a brewery. • “This is not a small little project. This is an area that is going to be a new destination for people to go to in the Fort Lauderdale area,” Fish told the
Business Journal. • Streetscape improvements such as concrete sidewalks, curbs, irrigation, landscaping and bioswales will also be added, according to the
Fort Lauderdale Community Redevelopment
Agency’s webpage. Thrive Progresso is just a few blocks away from Flagler Village, where major redevelopment projects are being proposed by
Houston-based Hines, the Kushner Cos., and other developers. Source: South Florida Business Journal, January 10, 2022
Housing Authority files plans for nearly 600 apartments in Broward
• The Housing Authority of the City of Fort
Lauderdale is seeking to rezone property in an unincorporated part of Broward County to build affordable and workforce housing.The county’s Local Planning Agency will consider the land use amendment on Jan. 27 for the 39.4acre site at 4590 Peters Road in the Broadview
Park neighborhood. This is one of the few unincorporated parts of the county. • Tam A. English, executive director of the
Housing Authority, said it plans to partner with
Miami-based Atlantic Pacific Communities to build 575 units of affordable and workforce housing units. The buildings will be two and three stories and include some senior housing. • “This new site allows us to continue to address the affordable housing crisis in Broward County where developable land is scarce,” English said.
“We are working to develop a plan that will address these needs while blending into the greater Fort Lauderdale community.” Source: South Florida Business Journal, January 25, 2022
Spirit-Frontier merger aims to set up one of the nation’s largest discount airlines
• Spirit Airlines of South Florida and Frontier
Airlines of Denver have announced a merger that would turn the company into the largest discount airline in the country, and the fifth largest airline overall. • “This transaction is centered around creating an aggressive ultra-low fare competitor to serve our guests even better, expand career opportunities for our team members and increase competitive pressure, resulting in more consumer-friendly fares for the flying public,” said Spirit CEO Ted
Christie in a statement. • The deal raises questions about the status of
Spirit’s proposed new headquarters in Dania
Beach. The airline is now located in a corporate park in Miramar. In 2019, Spirit declared it would invest $250 million to build a headquarters near Fort Lauderdale Hollywood-International
Airport and move up to 1,000 employees to the location. Source: South Florida Sun Sentinel, February 7, 2022
Broward County MSA Industry Loca�on Quo�ents
Total Nonagricultural Employment
Total Private
Goods Producing
Service Producing
Private Service Providing
Mining, Logging, and Construc�on
Manufacturing
Trade, Transporta�on, and U�li�es
Wholesale Trade
Retail Trade
Transporta�on, Warehousing and U�li�es
Informa�on
Financial Ac�vi�es
Professional and Business Services
Educa�onal and Health Services
Leisure and Hospitality
Other Services
Government
0 0.2 0.4 0.6 0.8 1 1.2 1.4 1.6 1.8


Long Term Outlook for Fort Lauderdale-Pompano Beach-Deerfield Beach, FL (Division of Miami MSA) March 2022 Forecast
2017 2018 2019 2020 2021 2022 2023 2024 2025
Personal Income (Billions $)
Total Personal Income 93.7 98.3 103.4 109.5 118.3 120.3 125.2 131.3 138.7
Pct Chg Year Ago Wages and Salaries
5.0 4.9 5.2 5.9 8.1 1.6 4.2 4.8 5.6 46.4 49.1 51.5 51.9 57.2 62.4 65.4 68.4 72.3 Nonwage Income 47.3 49.2 51.8 57.6 61.1 57.9 59.9 62.9 66.4 Real Personal Income (12$) 81.4 82.5 86.3 89.5 92.9 90.6 92.8 95.4 98.8 Pct Chg Year Ago 2.4 1.4 4.6 3.7 3.8 -2.4 2.4 2.9 3.5 Per Capita Income (Ths) 48.6 50.6 53.1 56.4 61.2 62.1 64.2 66.5 69.4 Real Per Capita Income (12$) 42.1 42.5 44.3 46.1 48.0 46.8 47.6 48.3 49.5 Average Annual Wage (Ths) 55.2 57.3 59.3 63.9 68.9 72.3 74.4 76.8 79.9 Pct Chg Year Ago 3.4 3.7 3.5 7.8 7.9 4.9 2.9 3.2 4.1
Establishment Employment (Place of Work, Thousands, SA)
Total Employment 836.8 853.2 865.8 809.1 825.4 858.8 875.5 887.4 901.0 Pct Chg Year Ago 2.0 2.0 1.5 -6.5 2.0 4.0 1.9 1.4 1.5 Manufacturing 27.5 28.1 28.9 27.5 27.3 28.1 27.9 28.0 28.0 Pct Chg Year Ago -0.3 2.1 3.2 -5.1 -0.7 2.9 -0.5 0.2 0.0 Nonmanufacturing 809.3 825.1 836.8 781.6 798.1 830.7 847.6 859.4 873.0 Pct Chg Year Ago 2.1 1.9 1.4 -6.6 2.1 4.1 2.0 1.4 1.6 Construction & Mining 46.6 48.6 50.0 49.0 50.8 53.5 53.2 52.7 53.1 Pct Chg Year Ago 5.5 4.2 2.8 -1.9 3.7 5.3 -0.7 -0.9 0.7 Trade, Trans, & Utilities 187.3 192.5 195.3 185.5 188.8 196.7 196.6 195.4 195.2 Pct Chg Year Ago 1.0 2.8 1.4 -5.0 1.8 4.2 -0.1 -0.6 -0.1 Wholesale Trade 48.5 49.8 51.1 49.6 49.4 52.8 55.7 58.0 59.4 Retail Trade 110.3 111.8 111.1 102.7 104.3 105.6 101.7 97.5 94.6 Trans, Wrhsng, & Util 28.5 31.0 33.1 33.1 35.0 38.3 39.1 40.0 41.2 Information 20.1 20.1 19.8 18.7 18.7 19.7 20.0 20.2 20.9 Pct Chg Year Ago 4.0 -0.3 -1.4 -5.4 0.0 5.3 1.4 1.0 3.3 Financial Activities 60.1 61.7 64.7 63.9 63.4 65.3 65.7 65.5 66.0 Pct Chg Year Ago 1.9 2.6 4.9 -1.2 -0.9 3.1 0.5 -0.2 0.7 Prof & Business Services 148.5 151.7 153.4 145.8 145.3 150.3 153.4 159.6 166.1 Pct Chg Year Ago 3.2 2.2 1.1 -4.9 -0.3 3.4 2.0 4.1 4.0 Educ & Health Services 110.2 111.2 112.4 108.0 109.7 113.6 112.7 114.7 116.7 Pct Chg Year Ago 4.0 0.9 1.2 -4.0 1.6 3.6 -0.8 1.7 1.7 Leisure & Hospitality 94.4 96.0 97.5 75.8 86.1 90.9 102.1 105.3 106.7 Pct Chg Year Ago 0.4 1.7 1.6 -22.2 13.6 5.5 12.4 3.2 1.3 Other Services 38.3 38.0 37.4 31.3 32.8 34.9 36.1 37.0 38.6 Pct Chg Year Ago 0.0 -0.8 -1.7 -16.3 4.9 6.4 3.2 2.8 4.1 Federal Government 6.9 7.0 7.0 7.5 7.1 7.1 7.1 7.2 7.4 Pct Chg Year Ago 1.1 0.9 0.5 6.3 -5.1 0.8 -0.1 1.5 2.5 State & Local Government 96.9 98.4 99.4 96.2 95.3 98.6 100.8 101.6 102.5 Pct Chg Year Ago 1.2 1.6 1.0 -3.2 -0.9 3.5 2.2 0.8 0.8
Other Economic Indicators
Population (Ths) 1930.4 1941.3 1946.0 1940.1 1934.0 1936.5 1950.9 1973.8 1997.4 Pct Chg Year Ago 1.0 0.6 0.2 -0.3 -0.3 0.1 0.7 1.2 1.2 Labor Force (Ths) 1020.9 1031.3 1041.3 1019.7 1033.9 1062.3 1071.6 1080.3 1098.8 Pct Chg Year Ago 1.3 1.0 1.0 -2.1 1.4 2.7 0.9 0.8 1.7 Unemployment Rate (%) 4.0 3.4 3.2 8.9 5.0 3.9 3.4 3.5 3.5 Total Housing Starts 4329.4 2983.0 4349.9 4591.6 3487.4 5707.6 6941.6 7255.7 7764.0 Single-Family 1780.7 1500.4 1660.0 1430.1 1602.7 1783.8 2301.1 2723.2 3041.3 Multifamily 2548.6 1482.6 2689.9 3161.5 1884.6 3923.8 4640.5 4532.5 4722.7


