12 minute read
Tallahassee...........................................................................................130
Short Term Outlook for Tallahassee, FL March 2022 Forecast
2022:1 2022:2 2022:3 2022:4 2023:1 2023:2 2023:3 2023:4 2024:1 2024:2 2024:3 2024:4 2025:1
Personal Income (Billions $)
Total Personal Income 19.9 20.3 20.5 20.7 20.9 21.2 21.4 21.7 22.0 22.3 22.6 22.9 23.2 Pct Chg Year Ago -2.0 4.0 4.8 4.4 5.1 4.4 4.2 4.9 5.3 5.4 5.6 5.6 5.5 Wages and Salaries 10.6 10.8 11.0 11.1 11.1 11.3 11.4 11.5 11.6 11.8 12.0 12.1 12.2 Nonwage Income 9.3 9.4 9.6 9.6 9.8 9.9 10.1 10.2 10.4 10.5 10.7 10.8 11.0 Real Personal Income (12$) 17.8 18.1 18.2 18.3 18.4 18.5 18.7 18.9 19.0 19.2 19.3 19.5 19.7 Pct Chg Year Ago -7.2 -0.6 0.9 1.8 3.2 2.7 2.5 3.1 3.4 3.4 3.6 3.5 3.5 Per Capita Income (Ths) 51.8 52.8 53.6 54.1 54.7 55.4 56.0 56.7 57.5 58.1 58.8 59.6 60.3 Real Per Capita Income (12$) 46.4 47.1 47.5 47.8 48.1 48.5 48.9 49.3 49.6 50.0 50.3 50.7 51.1 Average Annual Wage (Ths) 57.7 58.3 58.6 58.9 59.3 59.6 59.9 60.6 61.2 61.8 62.5 63.1 63.7 Pct Chg Year Ago 8.2 4.6 3.2 2.8 2.8 2.3 2.2 2.8 3.2 3.7 4.3 4.2 4.1
Establishment Employment (Place of Work, Thousands, SA)
Total Employment 183.7 185.5 186.5 186.9 187.3 188.2 188.8 189.2 189.7 190.2 190.7 191.2 191.5 Pct Chg Year Ago 2.6 3.0 3.0 2.6 2.0 1.4 1.2 1.2 1.2 1.1 1.0 1.1 1.0 Manufacturing 3.6 3.6 3.6 3.6 3.6 3.6 3.6 3.6 3.5 3.5 3.5 3.5 3.5 Pct Chg Year Ago 2.1 2.5 -0.4 0.1 -0.4 -0.5 -0.1 -0.5 -0.5 -1.0 -1.3 -1.4 -1.5 Nonmanufacturing 180.1 181.9 182.9 183.4 183.8 184.6 185.2 185.6 186.1 186.6 187.2 187.7 188.0 Pct Chg Year Ago 2.6 3.0 3.0 2.6 2.0 1.5 1.3 1.2 1.3 1.1 1.0 1.1 1.0 Construction & Mining 8.8 8.8 8.8 8.8 8.7 8.7 8.6 8.5 8.5 8.4 8.4 8.4 8.3 Pct Chg Year Ago 4.5 5.7 2.7 -0.8 -0.3 -1.0 -2.0 -2.6 -2.9 -2.8 -2.4 -2.0 -2.0 Trade, Trans, & Utilities 24.9 25.1 24.9 24.3 24.1 24.4 24.3 24.3 24.1 23.7 23.6 23.6 23.5 Pct Chg Year Ago 4.0 4.6 3.4 -1.8 -3.1 -2.9 -2.4 0.0 0.1 -2.8 -3.0 -3.1 -2.6 Wholesale Trade 3.7 3.7 3.8 3.8 3.9 3.9 3.9 3.9 4.0 4.1 4.1 4.2 4.2 Retail Trade 18.6 18.8 18.4 17.8 17.5 17.8 17.7 17.7 17.4 16.8 16.6 16.6 16.4 Trans, Wrhsng, & Util 2.5 2.6 2.6 2.6 2.7 2.7 2.7 2.7 2.7 2.8 2.8 2.8 2.9 Information 3.0 3.0 2.9 3.0 2.9 2.9 2.9 2.8 2.9 2.9 2.9 2.9 3.0 Pct Chg Year Ago 0.8 -1.8 -4.2 1.0 -2.3 -1.2 -1.5 -4.5 -3.0 -1.5 1.7 3.7 4.6 Financial Activities 7.7 7.7 7.8 7.8 7.9 7.9 7.9 7.9 7.9 8.0 8.0 8.0 8.1 Pct Chg Year Ago 1.2 2.0 1.1 0.7 3.3 2.4 1.0 1.1 0.5 1.5 1.5 1.7 1.5 Prof & Business Services 22.3 22.4 22.7 22.8 22.9 22.7 22.7 22.7 23.0 23.1 23.2 23.4 23.4 Pct Chg Year Ago -2.8 0.4 2.4 0.9 2.6 1.5 -0.1 -0.2 0.3 1.8 2.5 2.7 2.0 Educ & Health Services 25.7 25.8 25.8 25.6 25.6 25.6 25.6 25.7 25.9 26.1 26.3 26.4 26.5 Pct Chg Year Ago 5.0 4.5 1.9 0.3 -0.7 -0.9 -1.0 0.2 1.4 2.3 2.8 2.8 2.4 Leisure & Hospitality 19.6 20.3 20.6 21.5 21.7 22.3 22.9 23.0 23.0 23.3 23.4 23.6 23.5 Pct Chg Year Ago 15.3 5.8 10.0 16.8 10.3 9.8 11.5 7.3 6.1 4.1 2.2 2.4 2.1 Other Services 9.7 9.9 10.2 10.2 10.2 10.1 10.2 10.3 10.4 10.6 10.7 10.9 11.1 Pct Chg Year Ago 6.9 7.2 10.1 8.8 5.2 2.0 0.1 0.7 1.9 4.6 5.7 6.4 6.4 Federal Government 2.1 2.1 2.2 2.2 2.2 2.2 2.2 2.2 2.2 2.2 2.2 2.2 2.2 Pct Chg Year Ago -0.4 2.0 3.4 1.2 1.0 0.7 0.4 0.2 0.2 0.1 0.1 0.2 0.0 State & Local Government 56.3 56.8 57.1 57.3 57.6 57.8 58.1 58.2 58.3 58.4 58.4 58.4 58.5 Pct Chg Year Ago -1.3 1.2 0.9 1.6 2.3 1.9 1.6 1.5 1.2 0.9 0.6 0.4 0.4
Other Economic Indicators
Population (Ths) 384.1 383.7 383.1 382.7 382.4 382.3 382.3 382.7 383.2 383.8 384.3 385.0 385.6 Pct Chg Year Ago 0.0 -0.1 -0.3 -0.4 -0.4 -0.4 -0.2 0.0 0.2 0.4 0.5 0.6 0.6 Labor Force (Ths) 199.9 201.5 202.5 203.2 203.6 204.0 204.1 204.3 204.2 204.4 204.7 205.0 205.0 Pct Chg Year Ago 4.0 2.8 2.3 2.5 1.9 1.3 0.8 0.5 0.3 0.2 0.3 0.3 0.4 Unemployment Rate (%) 4.2 4.3 4.1 3.9 3.8 3.8 3.7 3.7 3.5 3.4 3.4 3.2 3.2 Total Housing Starts 2731.5 2500.0 2361.6 2265.3 2232.8 2198.5 2204.2 2180.5 2158.5 2151.0 2141.9 2132.7 2136.0 Single-Family 1583.3 1539.6 1526.5 1486.4 1455.1 1411.4 1389.6 1364.4 1332.4 1328.0 1324.9 1306.7 1314.2 Multifamily 1148.2 960.4 835.1 778.9 777.7 787.1 814.6 816.2 826.1 823.0 816.9 826.0 821.7
PROFILES
The Tampa–St. Petersburg–Clearwater MSA is comprised of Hernando, Hillsborough, Pasco, and Pinellas counties. Located centrally on the west coast of Florida, this region includes Tarpon Springs, Sponge Docks, Ybor City, Bush Gardens, the University of South Florida, and the University of Tampa. The Tampa Bay Buccaneers and the Tampa Bay Rays call this region home.
QUICK FACTS
Census Bureau). • Pasco County population estimate of 553,947 as of 2019 (5-Year Estimate) (U.S. Census Bureau). • Pinellas County population estimate of 974,996 as of 2019 (5-Year Estimate) (U.S. Census
Bureau). • Civilian labor force of 1,654,474 in December 2021 (Florida Research and Economic
Database). • An unemployment rate of 3.3% as of December 2021, not seasonally adjusted. This amounts to 54,047 unemployed people (Florida Research and Economic Database).
• OUTLOOK SUMMARIES
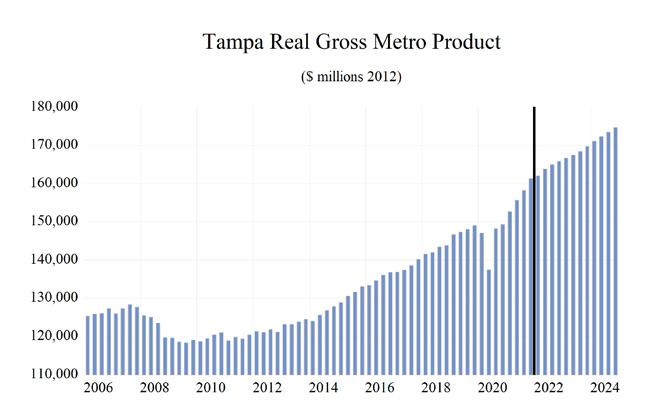
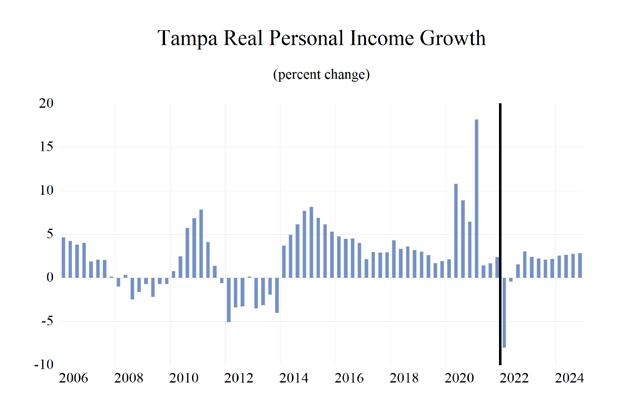
The Tampa—St. Petersburg—Clearwater Metropolitan Statistical Area (MSA) expected to show high levels of growth in the economic indicators relative to the other MSAs studied. The Tampa MSA will contribute the second-highest level of Gross Metro Product in the state at $165,481.58. Average annual wage growth of 5.2 percent will give the MSA the sixth-highest annual wage in the state at $70,900. Personal income growth of 6.0 percent, ranking fifth in the state, will place the per capita income level at $50,400. Tampa will experience modest population growth of 1.1 percent.
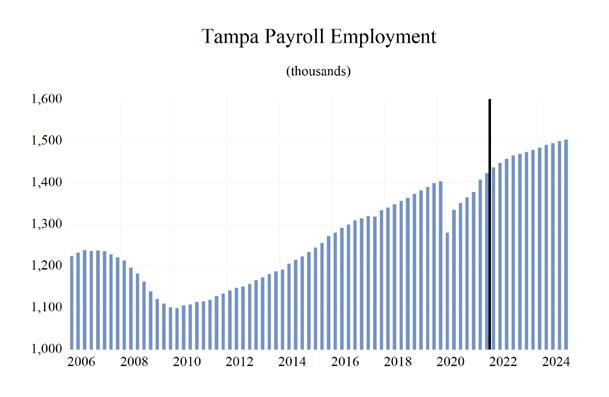
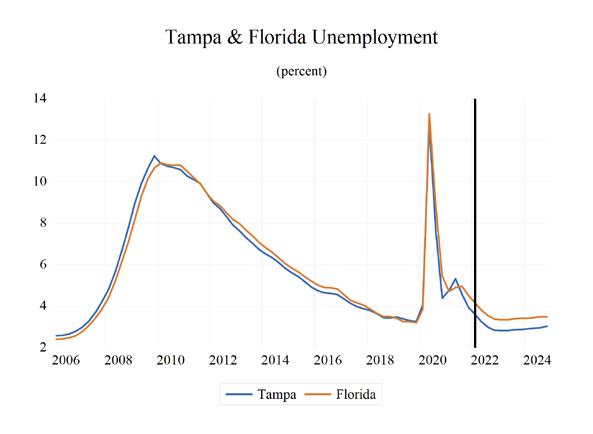
Employment growth is expected to average 2.8 percent annually. The MSA’s unemployment rate should average 3.4 percent.
The fastest growing sector in the Tampa area will be the Leisure & Hospitality sector with an average annual growth rate of 8.0 percent. This is followed by the Other Services sector with an average annual growth rate of 5.7 percent.
METRO NEWS SUMMARIES
HSP Group announces plans to establish corporate headquarters in Tampa
• Global expansion services firm HSP Group will open its first corporate global headquarters in
Tampa and will begin hiring in Q1 of 2022. • HSP Group anticipates creating hundreds of high paying local jobs in the next few years, targeting college graduates in fields such as international business, finance, human resources, sales, and accounting. • The finance and insurance industry in the Tampa
MSA has experienced 18% growth over the past 5 years, with persistent growth in the industry expected to continue over the next 5 years as companies like HSP Group continue to eye the
Tampa MSA for expansions. Source: Tampa Bay Economic Development Council, December 14, 2021
South Florida firm buys 34-acre St. Petersburg office park, plans apartments, retail
• Miami-Dade County based firm Atlis Cardinal bought 34 acres of land, currently home to the Ceridian Office Park, in St. Petersburg for $40 million cash. The firm has called it St.
Petersburg’s “largest land purchase in decades”. • Atlis Cardinal plans to keep about 180,000 of the existing 380,000 square feet of office space, with new developments featuring up to 1,500 apartments and approximately 50,000 square feet of retail.
• The project is expected to break ground in 2023.
The South Florida firm has been developing in
St. Petersburg for nearly a decade and plans to further its presence in the area. Source: Tampa Bay Times, December 17, 2021
2022 U.S. Gymnastics Championships and National Congress and Trade Show coming to Tampa in August
• Amalie Arena and the Tampa Convention Center will play host to the 2022 U.S. Gymnastics
National Championships and 2022 National
Congress and Trade Show this August, USA
Gymnastics announced. • The annual national championships for gymnastics will take place August 18-21 at
Amalie Arena and determine the men’s and women’s junior and senior all-around and individual event national champions. • The accompanying National Congress and Trade
Show will run concurrently in the nearby Tampa
Convention Center, which features roughly 2,000 attendees annually. Source: Tampa Bay Sports Commission, January 7, 2021
Amazon to open second Pasco County facility with robotic sorting
• Amazon has announced plans to open a second distribution site in Pasco County located at the 517,220 square-foot Eagle Industrial Park off
State Road 42. • The site will support a 100% robotics-based sorting system, also known as an Amazon
Robotic Sortation Center (ARSC). • The site will bring 500 new jobs to Pasco County, 300 of which will be full-time positions, opening doors for more high-paying jobs in the area. Source: Fox 13 Tampa Bay, January 26, 2022
Tampa airport businesses seek to fill more than 1,500 jobs
• With spring break just around the corner, companies and government agencies that operate at Tampa International Airport have more than 1,500 jobs to fill and will hold a hiring fair on
Feb. 15 at the airport. • According to a news release, Frontier Airlines alone needs to hire 1,000 flight attendants for crew bases around the country, while air services providers Global Aviation Services and dnata look to fill positions for British Airways,
Edelweiss, Air Canada and Cayman Airways. • The Transportation Security Administration also has multiple positions to fill, the release states, and is prepared to make job offers on the spot to qualified candidates. Retail and restaurant tenants, ground-handling service providers and rental car agencies also have a range of full- and part-time jobs available. Source: Business Observer, February 2, 2022
Tampa health startup sells to celebrity-backed fitness app FitOn
• A Tampa corporate health startup has sold to the company behind one of the more popular fitness apps in Apple’s App Store. • Peerfit, which provides health and fitness programs for employers and health care providers, announced Tuesday that it has sold for an undisclosed sum to the celebrity-backed fitness platform FitOn. • Peerfit will remain based in Tampa, home to 14 of its 50 global employees. Since its founding in Gainesville in 2011, the company has raised about $48.6 million in funding, including multiple rounds led by Lightning owner Jeff
Vinik. Employees mostly work remotely, though
Peerfit does keep space at the Vinik-backed startup hub Embarc Collective. Source: Tampa Bay Times, February 15, 2022
Tampa - St. Petersburg - Clearwater Industry Loca�on Quo�ents
Total Nonagricultural Employment
Total Private
Goods Producing
Service Producing
Private Service Providing
Mining, Logging, and Construc�on
Manufacturing
Trade, Transporta�on, and U�li�es
Wholesale Trade
Retail Trade
Transporta�on, Warehousing and U�li�es
Informa�on
Financial Ac�vi�es
Professional and Business Services
Educa�onal and Health Services
Leisure and Hospitality
Other Services
Government
0 0.2 0.4 0.6 0.8 1 1.2 1.4


Long Term Outlook for Tampa-St. Petersburg-Clearwater, FL March 2022 Forecast
2017 2018 2019 2020 2021 2022 2023 2024 2025
Personal Income (Billions $)
Total Personal Income 141.7 149.6 157.4 169.6 186.1 192.0 202.4 213.6 225.0
Pct Chg Year Ago Wages and Salaries
5.9 5.5 5.2 7.8 9.7 3.2 5.4 5.6 5.4 70.6 74.8 79.5 82.9 93.6 102.5 107.6 112.9 118.5 Nonwage Income 71.1 74.8 77.9 86.7 92.5 89.5 94.8 100.7 106.6 Real Personal Income (12$) 138.2 145.2 148.9 153.9 162.1 160.6 166.3 172.3 177.9 Pct Chg Year Ago 4.6 5.0 2.5 3.4 5.4 -1.0 3.6 3.6 3.3 Per Capita Income (Ths) 46.1 48.0 50.0 53.2 57.8 58.9 61.4 64.1 66.8 Real Per Capita Income (12$) 45.0 46.6 47.3 48.3 50.3 49.3 50.5 51.7 52.8 Average Annual Wage (Ths) 53.0 54.9 56.9 61.2 66.5 70.0 72.3 74.8 77.7 Pct Chg Year Ago 2.3 3.5 3.7 7.7 8.7 5.2 3.3 3.5 3.9
Establishment Employment (Place of Work, Thousands, SA)
Total Employment 1321.1 1351.8 1385.3 1342.1 1392.7 1451.4 1476.1 1496.8 1511.8 Pct Chg Year Ago 2.0 2.3 2.5 -3.1 3.8 4.2 1.7 1.4 1.0 Manufacturing 66.4 67.2 68.9 67.1 67.4 68.5 68.6 68.8 68.3 Pct Chg Year Ago 2.4 1.3 2.5 -2.7 0.5 1.6 0.1 0.2 -0.7 Nonmanufacturing 1254.7 1284.6 1316.3 1275.0 1325.3 1382.8 1407.5 1428.1 1443.5 Pct Chg Year Ago 2.0 2.4 2.5 -3.1 3.9 4.3 1.8 1.5 1.1 Construction & Mining 73.9 78.3 81.9 83.8 86.8 88.3 88.5 88.2 88.7 Pct Chg Year Ago 4.7 6.0 4.6 2.3 3.6 1.7 0.2 -0.4 0.6 Trade, Trans, & Utilities 247.2 249.2 252.6 249.0 257.5 267.5 265.0 261.4 258.9 Pct Chg Year Ago 0.2 0.8 1.3 -1.4 3.4 3.9 -0.9 -1.4 -1.0 Wholesale Trade 52.1 53.1 54.2 54.5 56.0 60.2 63.1 65.3 66.9 Retail Trade 160.0 160.3 158.7 153.3 158.3 161.2 154.3 147.2 141.7 Trans, Wrhsng, & Util 35.1 35.8 39.6 41.2 43.2 46.0 47.6 49.0 50.3 Information 25.1 25.6 25.5 24.2 24.6 25.6 26.0 26.1 26.9 Pct Chg Year Ago -1.7 1.8 -0.1 -5.1 1.5 4.1 1.4 0.6 3.0 Financial Activities 112.6 116.8 121.7 124.2 127.5 134.5 134.4 136.8 139.8 Pct Chg Year Ago 4.5 3.8 4.1 2.1 2.7 5.5 -0.1 1.8 2.2 Prof & Business Services 235.7 241.7 248.5 248.5 266.2 277.9 285.2 294.4 299.5 Pct Chg Year Ago 2.5 2.5 2.8 0.0 7.1 4.4 2.6 3.2 1.8 Educ & Health Services 205.2 210.9 218.6 213.2 214.9 222.0 223.0 227.8 231.5 Pct Chg Year Ago 2.7 2.8 3.7 -2.5 0.8 3.3 0.4 2.1 1.6 Leisure & Hospitality 153.2 158.9 162.7 132.9 147.9 160.1 174.8 180.2 182.3 Pct Chg Year Ago 2.6 3.8 2.4 -18.3 11.3 8.3 9.2 3.1 1.1 Other Services 45.7 46.8 47.5 43.7 48.5 52.7 53.6 54.5 55.7 Pct Chg Year Ago 1.3 2.6 1.4 -8.0 11.0 8.7 1.7 1.5 2.3 Federal Government 24.8 25.2 26.7 28.3 28.0 28.3 28.4 28.5 28.6 Pct Chg Year Ago 1.9 1.9 5.8 6.2 -1.1 1.0 0.2 0.4 0.5 State & Local Government 131.4 130.9 130.6 127.2 123.4 125.9 128.6 130.2 131.6 Pct Chg Year Ago 0.1 -0.4 -0.3 -2.6 -3.0 2.1 2.1 1.3 1.0
Other Economic Indicators
Population (Ths) 3072.1 3113.6 3150.2 3185.9 3221.8 3259.4 3296.5 3332.0 3367.3 Pct Chg Year Ago 1.7 1.4 1.2 1.1 1.1 1.2 1.1 1.1 1.1 Labor Force (Ths) 1504.2 1524.6 1555.2 1548.2 1613.1 1667.8 1694.5 1702.7 1710.1 Pct Chg Year Ago 1.6 1.4 2.0 -0.5 4.2 3.4 1.6 0.5 0.4 Unemployment Rate (%) 4.1 3.6 3.4 7.2 4.6 3.2 2.8 3.0 3.1 Total Housing Starts 17589.6 16718.8 21474.3 20399.7 24214.2 22071.7 21599.5 21388.5 21308.8 Single-Family 12731.8 13676.7 14896.0 15681.9 19467.5 17363.4 16031.7 15742.6 15684.3 Multifamily 4857.8 3042.1 6578.3 4717.8 4746.8 4708.3 5567.8 5645.9 5624.5


