
12 minute read
The Villages........................................................................................140


Short Term Outlook for The Villages, FL March 2022 Forecast
2022:1 2022:2 2022:3 2022:4 2023:1 2023:2 2023:3 2023:4 2024:1 2024:2 2024:3 2024:4 2025:1
Personal Income (Billions $)
Total Personal Income 8.0 8.2 8.4 8.6 8.7 8.9 9.1 9.2 9.4 9.5 9.7 9.9 10.0 Pct Chg Year Ago -8.1 4.3 7.7 8.2 9.3 8.1 7.4 7.6 7.6 7.1 6.9 6.7 6.8 Wages and Salaries 1.9 2.0 2.0 2.0 2.1 2.1 2.1 2.2 2.2 2.2 2.3 2.3 2.3 Nonwage Income 6.1 6.3 6.4 6.5 6.7 6.8 6.9 7.1 7.2 7.3 7.4 7.6 7.7 Real Personal Income (12$) 7.0 7.1 7.3 7.4 7.5 7.6 7.7 7.8 7.9 8.0 8.1 8.2 8.3 Pct Chg Year Ago -13.0 -0.3 3.8 5.5 7.3 6.3 5.6 5.8 5.6 5.2 4.9 4.7 4.7 Per Capita Income (Ths) 57.1 58.3 59.3 59.8 60.4 61.1 61.7 62.5 63.2 63.7 64.4 65.0 65.8 Real Per Capita Income (12$) 49.9 50.6 51.2 51.5 51.8 52.1 52.5 52.8 53.2 53.4 53.7 53.9 54.3 Average Annual Wage (Ths) 58.1 58.8 59.2 59.5 59.9 60.2 60.6 61.3 62.0 62.7 63.4 64.0 64.9 Pct Chg Year Ago 8.6 4.9 3.4 2.8 3.1 2.5 2.3 3.1 3.6 4.1 4.7 4.4 4.6
Establishment Employment (Place of Work, Thousands, SA)
Total Employment 32.5 33.3 33.7 33.9 34.2 34.6 34.8 35.0 35.2 35.3 35.4 35.5 35.7 Pct Chg Year Ago 3.8 6.4 6.8 6.9 5.3 3.9 3.2 3.2 2.9 2.1 1.8 1.5 1.4 Manufacturing 1.3 1.3 1.3 1.3 1.3 1.3 1.3 1.3 1.3 1.3 1.2 1.2 1.2 Pct Chg Year Ago 2.7 4.0 1.1 0.3 -0.1 -0.3 0.1 -0.3 -0.3 -0.9 -1.2 -1.3 -1.4 Nonmanufacturing 31.2 32.0 32.5 32.7 33.0 33.3 33.5 33.8 33.9 34.1 34.2 34.3 34.4 Pct Chg Year Ago 3.8 6.5 7.1 7.2 5.5 4.1 3.3 3.3 3.0 2.2 1.9 1.6 1.5 Construction & Mining 3.9 3.9 4.0 4.0 4.0 4.0 4.0 4.0 4.0 4.0 4.0 4.0 4.0 Pct Chg Year Ago 4.4 5.9 2.9 3.1 3.3 2.2 0.9 0.0 -0.5 -0.7 -0.5 -0.3 -0.1 Trade, Trans, & Utilities 5.8 5.9 6.0 6.0 6.1 6.2 6.3 6.3 6.3 6.3 6.2 6.2 6.2 Pct Chg Year Ago -2.1 5.2 7.9 7.3 5.6 4.9 4.4 5.0 4.0 0.3 -0.7 -1.3 -1.2 Wholesale Trade 0.8 0.8 0.8 0.9 0.9 0.9 0.9 0.9 0.9 1.0 1.0 1.0 1.0 Retail Trade 4.0 4.1 4.1 4.1 4.1 4.2 4.3 4.3 4.2 4.1 4.1 4.1 4.1 Trans, Wrhsng, & Util 1.0 1.0 1.0 1.1 1.1 1.1 1.1 1.1 1.1 1.2 1.2 1.2 1.2 Information 0.2 0.2 0.2 0.2 0.2 0.2 0.2 0.2 0.2 0.2 0.2 0.2 0.2 Pct Chg Year Ago -2.3 -5.6 -1.5 2.1 -0.2 0.7 0.4 -2.1 -0.7 0.7 3.7 5.6 6.2 Financial Activities 1.6 1.6 1.6 1.6 1.6 1.6 1.6 1.6 1.6 1.6 1.6 1.6 1.6 Pct Chg Year Ago 2.8 3.1 2.4 2.0 2.9 1.9 0.5 0.8 0.2 1.1 1.0 1.0 1.0 Prof & Business Services 2.5 2.5 2.6 2.6 2.6 2.6 2.6 2.7 2.7 2.8 2.8 2.8 2.8 Pct Chg Year Ago 0.1 1.6 2.4 3.1 5.4 4.4 3.4 3.7 3.9 4.9 4.9 4.3 3.4 Educ & Health Services 6.1 6.2 6.4 6.5 6.6 6.7 6.8 6.8 7.0 7.0 7.1 7.1 7.2 Pct Chg Year Ago -0.7 4.0 6.4 8.5 7.8 7.0 6.1 6.1 6.1 5.6 5.0 4.4 3.9 Leisure & Hospitality 5.4 5.7 5.7 5.7 5.7 5.8 5.8 5.8 5.8 5.9 5.9 6.0 6.0 Pct Chg Year Ago 24.2 15.8 16.4 14.2 5.6 1.8 1.8 2.2 2.1 1.5 1.7 1.8 1.9 Other Services 0.5 0.5 0.6 0.6 0.6 0.6 0.6 0.6 0.6 0.6 0.6 0.7 0.7 Pct Chg Year Ago 7.2 6.8 12.3 15.8 12.3 8.7 6.2 5.9 5.8 7.4 7.4 6.9 6.4 Federal Government 1.9 1.9 1.9 1.9 1.9 1.9 1.9 2.0 2.0 2.0 2.0 2.0 2.0 Pct Chg Year Ago 4.9 9.7 9.5 5.1 4.6 3.6 2.6 1.8 1.2 0.8 0.6 0.4 0.2 State & Local Government 3.4 3.5 3.5 3.6 3.6 3.6 3.7 3.7 3.7 3.7 3.7 3.7 3.7 Pct Chg Year Ago -1.7 4.6 2.3 4.8 4.9 3.9 3.1 2.6 2.1 1.7 1.3 1.1 1.2
Other Economic Indicators
Population (Ths) 140.0 141.2 142.4 143.5 144.7 145.8 146.8 147.9 148.8 149.7 150.6 151.6 152.5 Pct Chg Year Ago 3.6 3.4 3.3 3.3 3.3 3.2 3.1 3.0 2.9 2.7 2.6 2.5 2.5 Labor Force (Ths) 33.9 34.5 35.1 35.4 35.7 36.0 36.2 36.4 36.6 36.7 36.8 36.9 37.0 Pct Chg Year Ago 5.3 4.8 5.6 6.7 5.4 4.3 3.4 2.8 2.3 1.9 1.6 1.3 1.1 Unemployment Rate (%) 5.6 5.6 5.3 5.1 4.9 4.8 4.8 4.9 4.8 4.9 4.9 4.7 4.7 Total Housing Starts 4535.5 3994.3 3629.3 3258.7 2937.8 2683.0 2515.4 2414.3 2367.0 2340.2 2334.4 2319.6 2326.0 Single-Family 4384.5 3851.0 3497.7 3135.7 2823.6 2591.6 2454.5 2361.4 2313.6 2287.4 2282.2 2267.1 2273.1 Multifamily 151.0 143.3 131.6 123.1 114.2 91.4 60.9 52.9 53.5 52.9 52.3 52.6 52.9
PROFILES
The West Palm Beach-Boca Raton-Boyton Beach MSA stretches from the state’s Atlantic coast into the rural center and includes the northern edge of the everglades national park. It is known for its numerous golf courses along the coastline and its sandy beaches.
QUICK FACTS
• Metro population estimate of 1,496,770 as of 2019 (5-Year Estimate) (U.S. Census Bureau). • Palm Beach County population estimate of 1,496,770 as of 2019 (5-Year Estimate) (U.S.
Census Bureau). • Civilian labor force of 760,237 in December 2021 (Florida Research and Economic
Database). • An unemployment rate of 3.3% as of December 2021, not seasonally adjusted. This amounts to 25,223 unemployed people (Florida Research and Economic Database).
OUTLOOK SUMMARIES
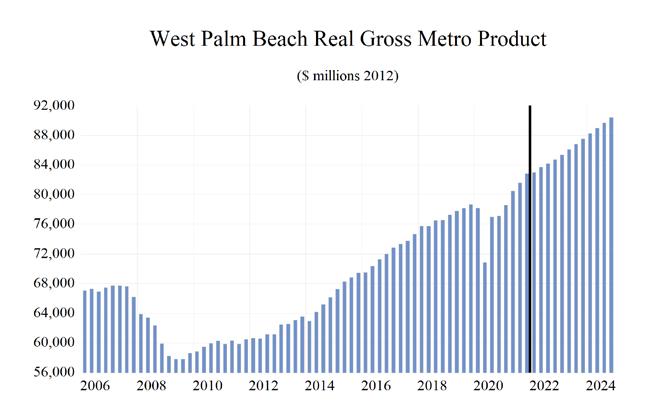
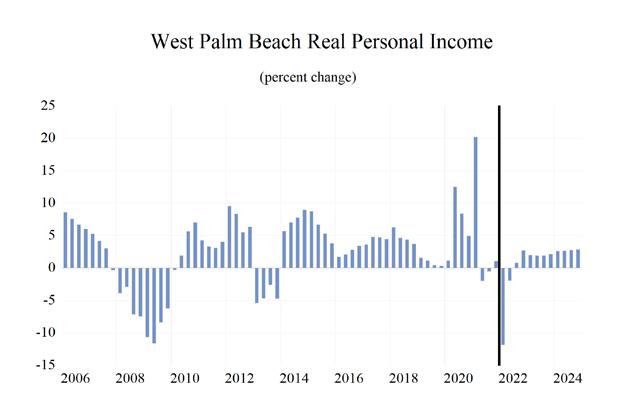
The West Palm Beach—Boca Raton area is expected to show relatively strong levels of growth in the economic indicators. Personal income is expected to grow an average of 5.3 percent annually. The average real per capita income level of $74,200 is third highest in state. Average annual wage growth will be 4.7 percent; however, the average annual wage level is expected to be $76,500, the highest of the studied metropolitan areas. West Palm Beach is expected to average a population growth of 0.9 percent each year. The area has one of the highest Gross Metro Product of the MSAs studied at an average level of $85,148.63 million.
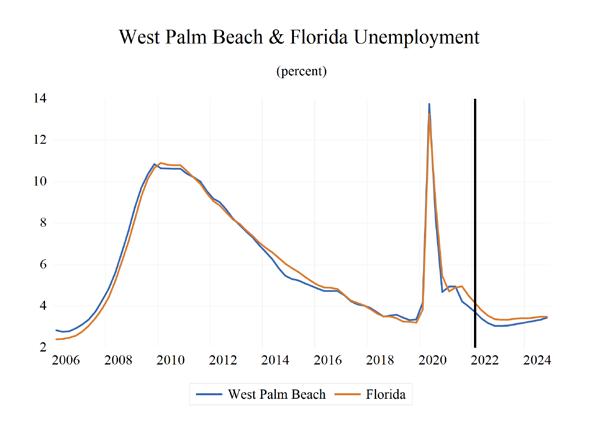
Employment is expected to grow at an average rate of 2.8 percent each year, while Unemployment is expected to be relatively high at an average rate of 3.6 percent.
West Palm Beach’s fastest growing sector is expected to be the by the Leisure & Hospitality sector, which will experience 8.6 percent average annual growth, followed by the Business Services sector, which will grow at an average of 2.8 percent.
METRO NEWS SUMMARIES
Palm Beach International welcomes new budget airline with routes to the Big Easy and Lowcountry
• Breeze Airways announced that starting
February 19, the airline, new to PBI, will offer round-trip flights between the airport and cities in Louisiana, South Carolina, Ohio, and
Virginia. • The budget airline will offer one-way flights to
New Orleans and Charleston starting at $39. • Breeze Airways airplanes are smaller, holding between 108 and 118 passengers, and the airline doesn’t have change or cancellation fees. Source: Palm Beach Post, December 6, 2021
Pandemic Turns Florida’s West Palm Beach Into Office Boomtown
• An influx of financial firms from New York and other locations is fueling an office-leasing boom and new development in West Palm Beach, Fla.
Related Cos. said Tuesday that it plans to build two office properties in the city with a price tag of about $750 million. • The two projects and two other Related developments are set to increase the total office space in the city’s central business district by more than 50% to 4.3 million square feet, from 2.8 million square feet last year, according to data from CBRE Group Inc. • The pandemic is starting to change the seasonality of work in West Palm Beach, which financial professionals used to visit over weekends or in the winter. Lower taxes and housing costs, combined with a new rail line to downtown
Miami, are encouraging more professionals to stay. Source: The Wall Street Journal, December 21, 2021
Palm Beach County home sales reach median price of nearly $500K during red-hot 2021
• A blistering 2021 housing market rocketed median prices of single-family homes in Palm
Beach County to nearly half-a-million dollars, a 22% bump in median price from 2020 to $475,000. • Demand is skyrocketing, fueled in part from an increase in people moving from New York to
Palm Beach County. The median time it took for a Palm Beach County home to go under contract last year was 15 days, down from 37 days in 2020, and 53 days in 2019. • The intensity of home buying was partly caused by a lack of inventory with an average of just 1.1 months’ supply available last year. That’s a decrease of 52 percent over 2020. Combined with a lack of supply, the increase in demand has driven prices upward. Source: The Palm Beach Post, January 21, 2022
Palm Beach County leaders hope to create more affordable housing
• There are renewed efforts to see more affordable housing in South Florida. Palm Beach County commissioners are taking aim at the growing cost to cover rent and mortgages. • Palm Beach County’s Department of Housing and Economic Development addressed county commissioners Tuesday concerning trends in the housing sector. Over the last year, the median home purchase price reached $500,000. The fair market rent for a two-bedroom apartment is more than $1,400 per month. • The county is looking at additional options to create and expand housing options, like rehabilitating older homes and building on county-owned property. However, the limited space from new developments has yet to keep up with demand. Source: WPTV, January 25, 2022
Medical moves in: North county shops, banks, a restaurant switch to doctor’s offices
• In Jupiter and Palm Beach Gardens, commercial property owners have transformed 67,130 square feet of commercial space into medical offices since the start of 2020. • The pandemic trends of increased migration to
Florida as well as increased need for medical care have both shaped Jupiter infrastructure. • In Jupiter, two banks, five office suites, one restaurant and one music store have been or are in the process of being converted into medical offices. As safe real estate investments, medical offices should see continued growth in a postpandemic economy. Source: The Palm Beach Post, February 14, 2022
Priced Out of Paradise: Higher rent costs threaten Palm Beach County workforce
• Rising rent prices are making it more difficult to live in Palm Beach County. According to rental website Zumper, compared to last year, rent is up nearly 30% in West Palm Beach, 40% in Delray
Beach and 52% in Palm Beach Gardens. • John Ries, owner of Hot Pie Pizza, says that he’s lost 10 employees due to a combination of these rising costs and competition from food delivery services. “Even though we give them a higher salary, it’s eaten alive with all the increases,” according to Ries. • WPTV found that to rent a one-bedroom apartment in the city of West Palm Beach, nurses will need to spend 27% of their annual salary, teachers 36% and waiters 75%. 30% of county jobs are located downtown, but rising rents could push out the local workforce. Source: The Palm Beach Post, February 14, 2022
Palm Beach County MSA Industry Loca�on Quo�ents
Total Nonagricultural Employment
Total Private
Goods Producing
Service Producing
Private Service Providing
Mining, Logging, and Construc�on
Manufacturing
Trade, Transporta�on, and U�li�es
Wholesale Trade
Retail Trade
Transporta�on, Warehousing and U�li�es
Informa�on
Financial Ac�vi�es
Professional and Business Services
Educa�onal and Health Services
Leisure and Hospitality
Other Services
Government
0 0.2 0.4 0.6 0.8 1 1.2 1.4 1.6
Long Term Outlook for West Palm Beach-Boca Raton-Delray Beach, FL (Division of Miami MSA) March 2022 Forecast
2017 2018 2019 2020 2021 2022 2023 2024 2025
Personal Income (Billions $)
Total Personal Income 114.0 121.7 127.6 131.9 141.6 144.3 153.0 161.9 171.0
Pct Chg Year Ago Wages and Salaries
9.6 6.7 4.9 3.3 7.4 1.9 6.0 5.9 5.6 36.1 37.7 39.5 40.7 45.3 49.1 51.9 54.5 57.4 Nonwage Income 77.9 84.0 88.1 91.1 96.3 95.2 101.1 107.4 113.6 Real Personal Income (12$) 99.0 102.2 106.5 107.8 111.2 108.7 113.3 117.7 121.8 Pct Chg Year Ago 6.9 3.2 4.3 1.2 3.1 -2.2 4.2 3.9 3.5 Per Capita Income (Ths) 77.9 82.5 85.8 88.4 94.6 95.7 100.3 104.8 109.2 Real Per Capita Income (12$) 67.6 69.3 71.6 72.2 74.2 72.1 74.3 76.2 77.8 Average Annual Wage (Ths) 58.1 59.5 61.4 67.2 72.3 75.4 77.8 80.6 83.8 Pct Chg Year Ago 3.2 2.5 3.1 9.4 7.6 4.4 3.2 3.6 4.0
Establishment Employment (Place of Work, Thousands, SA)
Total Employment 619.9 630.5 641.2 604.4 623.6 648.7 664.0 674.0 682.1 Pct Chg Year Ago 2.1 1.7 1.7 -5.7 3.2 4.0 2.4 1.5 1.2 Manufacturing 19.9 20.2 20.2 19.5 20.0 20.5 20.5 20.6 20.6 Pct Chg Year Ago 3.5 1.9 0.0 -3.7 2.5 2.4 0.1 0.6 -0.3 Nonmanufacturing 600.0 610.2 621.0 584.9 603.6 628.3 643.5 653.3 661.5 Pct Chg Year Ago 2.0 1.7 1.8 -5.8 3.2 4.1 2.4 1.5 1.2 Construction & Mining 36.0 37.8 38.8 37.7 38.6 40.2 39.9 39.8 40.4 Pct Chg Year Ago 4.8 5.0 2.9 -2.9 2.4 4.2 -0.9 -0.2 1.5 Trade, Trans, & Utilities 116.2 117.1 116.6 111.3 114.0 118.6 117.9 116.2 115.0 Pct Chg Year Ago 0.7 0.8 -0.4 -4.5 2.4 4.0 -0.6 -1.4 -1.1 Wholesale Trade 23.5 24.3 23.6 22.9 23.8 25.3 26.2 27.1 27.9 Retail Trade 79.9 79.8 79.6 74.7 75.6 77.4 75.2 72.1 69.4 Trans, Wrhsng, & Util 12.8 13.0 13.4 13.7 14.6 16.0 16.5 17.0 17.7 Information 11.6 11.0 10.6 9.7 9.7 10.1 10.3 10.3 10.6 Pct Chg Year Ago 4.3 -5.1 -3.4 -9.2 0.4 4.2 2.0 0.2 2.3 Financial Activities 40.4 41.8 43.1 43.5 44.3 46.3 46.3 46.9 47.7 Pct Chg Year Ago 1.2 3.3 3.2 0.8 1.8 4.6 -0.1 1.3 1.8 Prof & Business Services 113.1 114.3 116.4 114.9 119.6 122.1 123.9 128.4 131.9 Pct Chg Year Ago 2.6 1.1 1.8 -1.3 4.1 2.1 1.5 3.6 2.7 Educ & Health Services 99.1 101.9 106.1 102.1 105.1 108.1 109.3 111.3 112.7 Pct Chg Year Ago 2.5 2.9 4.0 -3.8 3.0 2.9 1.1 1.9 1.2 Leisure & Hospitality 87.4 88.8 90.6 73.7 82.3 89.3 99.7 102.2 102.9 Pct Chg Year Ago 2.3 1.5 2.1 -18.6 11.6 8.5 11.6 2.6 0.7 Other Services 33.0 33.1 33.0 30.0 30.9 32.2 32.5 33.3 34.5 Pct Chg Year Ago 1.2 0.2 -0.3 -9.2 3.0 4.2 0.9 2.6 3.7 Federal Government 6.7 6.8 7.0 7.2 6.9 7.0 7.0 7.0 7.0 Pct Chg Year Ago -0.6 0.7 2.6 3.2 -3.5 1.1 -0.6 -0.1 0.3 State & Local Government 56.5 57.7 58.7 54.9 52.3 54.4 56.9 57.9 58.9 Pct Chg Year Ago 1.7 2.1 1.8 -6.5 -4.7 4.0 4.6 1.9 1.6
Other Economic Indicators
Population (Ths) 1463.3 1475.2 1487.4 1492.6 1497.5 1508.2 1524.9 1545.1 1565.5 Pct Chg Year Ago 1.2 0.8 0.8 0.3 0.3 0.7 1.1 1.3 1.3 Labor Force (Ths) 721.5 726.3 735.2 716.7 738.3 759.8 770.4 780.0 791.1 Pct Chg Year Ago 1.4 0.7 1.2 -2.5 3.0 2.9 1.4 1.2 1.4 Unemployment Rate (%) 4.2 3.7 3.4 7.7 4.5 3.3 3.1 3.3 3.6 Total Housing Starts 3969.0 4536.1 4960.4 6885.8 7103.1 7588.2 8997.5 9523.5 9759.2 Single-Family 2597.4 2891.4 3297.7 4067.6 4485.4 4547.4 5471.8 5864.1 6023.6 Multifamily 1371.6 1644.6 1662.7 2818.1 2617.6 3040.8 3525.6 3659.4 3735.5


