11 minute read
Sebring.................................................................................................. 125
Short Term Outlook for Sebring, FL March 2022 Forecast
2022:1 2022:2 2022:3 2022:4 2023:1 2023:2 2023:3 2023:4 2024:1 2024:2 2024:3 2024:4 2025:1
Personal Income (Billions $)
Total Personal Income 4.3 4.3 4.4 4.4 4.4 4.5 4.5 4.6 4.7 4.7 4.8 4.8 4.9 Pct Chg Year Ago -6.0 1.9 2.8 2.9 3.9 3.8 3.6 4.4 4.8 4.6 4.7 4.6 4.8 Wages and Salaries 1.4 1.4 1.4 1.4 1.4 1.4 1.5 1.5 1.5 1.5 1.5 1.5 1.6 Nonwage Income 2.9 2.9 3.0 3.0 3.0 3.1 3.1 3.1 3.2 3.2 3.2 3.3 3.3 Real Personal Income (12$) 4.0 4.0 4.0 4.0 4.0 4.1 4.1 4.1 4.2 4.2 4.2 4.2 4.3 Pct Chg Year Ago -11.0 -2.6 -1.0 0.4 2.0 2.0 2.0 2.6 2.9 2.7 2.7 2.6 2.7 Per Capita Income (Ths) 42.4 43.0 43.6 43.9 44.3 44.8 45.3 45.8 46.3 46.7 47.2 47.7 48.3 Real Per Capita Income (12$) 39.2 39.5 39.9 40.0 40.2 40.5 40.7 41.0 41.3 41.4 41.7 41.9 42.2 Average Annual Wage (Ths) 52.7 53.3 53.6 53.9 54.2 54.6 54.9 55.6 56.4 57.0 57.8 58.4 59.2 Pct Chg Year Ago 8.7 4.9 3.3 2.8 2.8 2.4 2.5 3.3 3.9 4.5 5.1 5.0 5.1
Establishment Employment (Place of Work, Thousands, SA)
Total Employment 26.0 26.2 26.3 26.2 26.2 26.3 26.3 26.3 26.3 26.2 26.2 26.2 26.2 Pct Chg Year Ago 4.6 3.6 1.2 1.7 0.6 0.2 0.1 0.2 0.3 -0.3 -0.5 -0.6 -0.4 Manufacturing 0.6 0.6 0.6 0.5 0.5 0.5 0.5 0.5 0.5 0.5 0.4 0.4 0.4 Pct Chg Year Ago 1.4 0.4 -5.5 -10.5 -12.2 -12.6 -12.3 -12.7 -12.2 -11.9 -11.2 -10.3 -9.2 Nonmanufacturing 25.4 25.7 25.7 25.7 25.7 25.8 25.8 25.8 25.8 25.8 25.8 25.7 25.8 Pct Chg Year Ago 4.6 3.7 1.4 2.0 0.9 0.5 0.4 0.5 0.5 0.0 -0.3 -0.4 -0.2 Construction & Mining 1.8 1.8 1.8 1.8 1.8 1.8 1.8 1.8 1.8 1.8 1.7 1.7 1.7 Pct Chg Year Ago 8.8 5.3 1.4 1.4 1.4 0.6 -0.4 -1.1 -1.5 -2.0 -2.1 -2.2 -1.7 Trade, Trans, & Utilities 5.6 5.6 5.6 5.4 5.4 5.4 5.4 5.4 5.4 5.3 5.2 5.2 5.2 Pct Chg Year Ago 0.8 2.8 0.5 -1.9 -3.3 -3.3 -2.8 -0.6 -0.4 -3.1 -3.4 -3.7 -3.1 Wholesale Trade 0.8 0.8 0.8 0.8 0.8 0.8 0.8 0.8 0.8 0.8 0.8 0.8 0.8 Retail Trade 3.9 3.9 3.8 3.7 3.6 3.7 3.6 3.6 3.6 3.5 3.4 3.4 3.3 Trans, Wrhsng, & Util 0.9 0.9 1.0 1.0 1.0 1.0 1.0 1.0 1.0 1.0 1.0 1.0 1.0 Information 0.2 0.2 0.2 0.2 0.2 0.2 0.2 0.2 0.2 0.2 0.2 0.2 0.2 Pct Chg Year Ago 16.6 7.1 -4.9 -10.5 -11.8 -9.9 -9.1 -10.9 -9.8 -8.6 -5.8 -3.2 -1.0 Financial Activities 0.9 0.9 0.9 0.9 0.9 0.9 0.9 0.9 0.9 0.9 0.9 0.9 0.9 Pct Chg Year Ago 4.1 1.9 -0.3 -0.7 0.3 0.3 -0.3 0.1 -0.5 0.1 0.2 0.6 0.9 Prof & Business Services 2.5 2.5 2.5 2.5 2.6 2.5 2.5 2.6 2.6 2.6 2.6 2.6 2.7 Pct Chg Year Ago 10.0 5.0 0.3 0.4 1.9 1.0 0.1 0.9 1.5 3.1 3.6 3.3 2.4 Educ & Health Services 6.1 6.1 6.1 6.0 6.0 6.0 6.0 6.0 6.0 6.0 6.0 6.0 6.1 Pct Chg Year Ago 1.4 1.2 -0.7 -0.8 -1.2 -1.4 -1.6 -0.8 0.0 0.7 1.0 0.9 1.1 Leisure & Hospitality 3.5 3.7 3.7 3.9 3.9 4.0 4.1 4.1 4.1 4.1 4.1 4.1 4.1 Pct Chg Year Ago 14.6 10.4 12.5 18.6 11.2 9.6 10.3 5.8 4.2 1.9 -0.1 -0.3 0.0 Other Services 0.6 0.6 0.6 0.6 0.6 0.6 0.6 0.6 0.6 0.6 0.6 0.7 0.7 Pct Chg Year Ago 6.4 6.0 6.1 8.0 4.6 1.6 -0.7 -0.4 0.1 1.9 2.3 2.5 3.2 Federal Government 0.3 0.3 0.3 0.3 0.3 0.3 0.3 0.3 0.3 0.3 0.3 0.3 0.3 Pct Chg Year Ago 6.2 7.2 8.9 0.4 0.8 0.8 0.6 0.4 0.4 0.3 0.6 0.8 0.7 State & Local Government 3.9 4.0 4.0 4.0 4.0 4.0 4.0 4.0 4.0 4.0 4.0 4.0 3.9 Pct Chg Year Ago 1.4 1.1 -3.2 -0.1 0.5 0.0 0.0 0.1 0.0 0.0 -0.1 -0.2 -0.4
Other Economic Indicators
Population (Ths) 100.9 100.8 100.6 100.5 100.4 100.4 100.4 100.5 100.6 100.7 100.8 100.9 101.0 Pct Chg Year Ago -0.1 -0.3 -0.5 -0.5 -0.5 -0.4 -0.2 0.0 0.2 0.3 0.4 0.4 0.4 Labor Force (Ths) 36.7 37.0 37.1 37.2 37.2 37.2 37.2 37.2 37.3 37.3 37.3 37.3 37.4 Pct Chg Year Ago 4.4 3.8 3.1 1.9 1.2 0.6 0.2 0.2 0.2 0.3 0.3 0.3 0.3 Unemployment Rate (%) 5.5 5.4 5.2 5.0 4.8 4.9 5.0 5.1 5.0 5.2 5.2 5.1 5.1 Total Housing Starts 504.6 469.6 458.9 447.1 433.2 424.9 433.4 433.5 427.0 421.9 420.0 418.7 419.3 Single-Family 503.4 472.1 456.9 437.5 411.6 388.7 383.9 380.6 372.6 367.2 364.6 360.4 360.8 Multifamily 1.1 -2.5 2.0 9.6 21.6 36.2 49.5 53.0 54.4 54.7 55.4 58.3 58.5
PROFILES
The Tallahassee MSA is comprised of Gadsden, Jefferson, Leon, and Wakulla Counties. It is located between Pensacola and Jacksonville. Tallahassee is the capital city of Florida and houses Florida State University and Florida A&M University.
QUICK FACTS
Bureau). • Civilian labor force of 197,818 in December 2021 (Florida Research and Economic
Database). • An unemployment rate of 3.5% as of December 2021, not seasonally adjusted. This amounts to 6,933 unemployed people (Florida Research and Economic Database).
OUTLOOK SUMMARIES
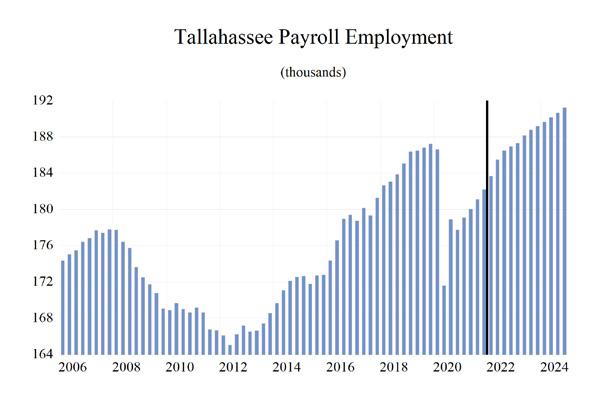
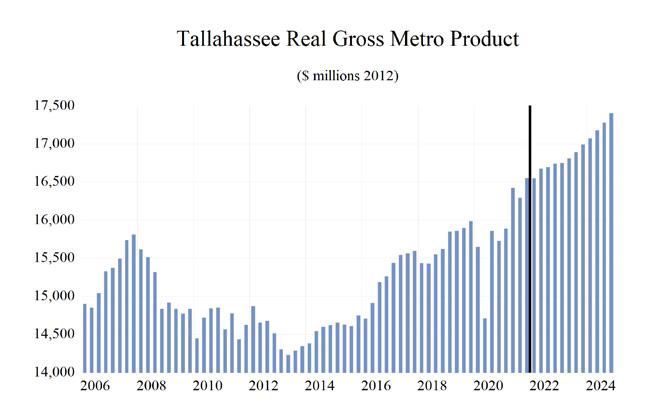
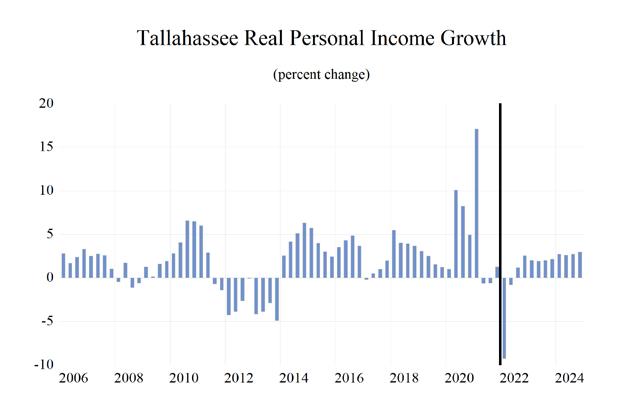
The Tallahassee Metropolitan Statistical Area (MSA) is expected to show mixed levels of growth in this forecast’s studied indicators. Tallahassee’s Gross Metro Product will be $17,121.69. Average annual wage growth of 3.7 percent should put the average annual wage at $61,200. Personal incomes will grow by 4.6 percent annually, placing the per capita income level at $49,400. Population growth will be 0.2 percent.
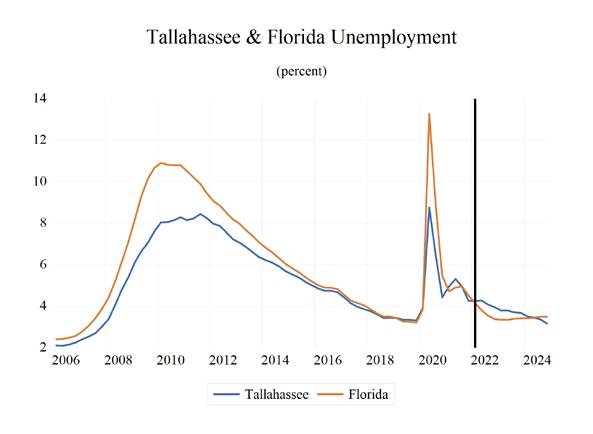
Average annual employment growth of 1.5 percent will lead to an unemployment rate of 3.6 percent for the MSA.
The Leisure & Hospitality sector will see the highest annual growth rate in the MSA at 9.0 percent. The Other Services sectors will follow with a growth rate of 5.4 percent. The Trade, Transportation, and Utilities and Construction & Mining sectors will contract at rates of -1.5 percent for both.
METRO NEWS SUMMARIES
Tallahassee City Commissioners to weigh Affordable Housing recommendations Wednesday
• 19% of households in Leon County are paying rent that is above their means, with many living paycheck to paycheck. • The Tallahassee City Commissioners will discuss more types of affordable housing such as multiplexes as well as speeding up the approval process. • There is an increased demand for affordable housing; however, the challenge is finding people that are ready to build these complexes. Source: WTXL Tallahassee, December 6, 2021
Betton Road construction project reaches halfway point
• Betton Road has been closed for six months. At first, stores in the area were nervous about how the road closure would affect business, but they say they haven’t been affected much. • The construction will make the road more accessible as well as allow for updating to underground utilities. • The construction is set to be done by this summer. Source: WTXL Tallahassee, December 23, 2021
The Tallahassee tech disconnect: Qualified candidates hard to come by for hidden sector
• There are more than 60 technology-based companies in Tallahassee, but not a lot of people are aware of them.
• The technology industry has helped create 13,000 jobs in Tallahassee, and there are currently 540 computer and mathematical job openings. • There is a clear and increasing demand, but it has been difficult to find qualified candidates. Source: Tallahassee Democrat, January 14, 2022
Nowhere to go: Time running out for residents of one Tallahassee mobile home park
• Florida Sun Estates, formerly known as The
Meadows, has new owners that have doubled the rent and refused to renew leases. • Florida Sun Estates LLC bought the trailer park on August 31, 2021 for $14 million. • Now the people who currently live there fear eviction. Source: Tallahassee Democrat, January 25, 2022
December Unemployment Rate Down to 3.4%
• In November 2021, the unemployment rate in
Leon County was 3.5%, but now it is down to 3.4%. • There were 151,375 people working in Leon
County in December. • This is 573 less than the number of people working in December 2019, but 8,006 more than the number of people working in December 2020. Source: Tallahassee Reports, February 2, 2022
January Airport Traffic Off 13% of Pre-Pandemic Levels
• In January 2022, the passenger traffic at
Tallahassee International Airport was 54,800 in comparison to 63,146 in January 2019. • This is 8,346 or 13.2% below the passenger traffic levels prior to the COVID-19 pandemic. • However, this is a significant increase from
January 2021 when the number of passengers was only 26,715. Source: Tallahassee Reports, February 26, 2022
Annual Passenger Traffic Passes 700,000, Up 4.7%
• As compared to traffic in February 2021, traffic at Tallahassee International Airport is up 166.5% for February 2022. • Traffic in February 2022 is down by less than 5,000 people as compared to the traffic in
February 2019, before the COVID019 pandemic. • The annual rate of passengers for February 2022 was 716,707, which is up 4.73% compared to the annual rate for January 2022. Source: Tallahassee Reports, March 31, 2022
Tallahassee MSA Industry Loca�on Quo�ents
Total Nonagricultural Employment
Total Private
Goods Producing
Service Producing
Private Service Providing
Mining, Logging, and Construc�on
Manufacturing
Trade, Transporta�on, and U�li�es
Wholesale Trade
Retail Trade
Transporta�on, Warehousing and U�li�es
Informa�on
Financial Ac�vi�es
Professional and Business Services
Educa�onal and Health Services
Leisure and Hospitality
Other Services
Government
0 0.5 1 1.5 2 2.5 3


Long Term Outlook for Tallahassee, FL March 2022 Forecast
2017 2018 2019 2020 2021 2022 2023 2024 2025
Personal Income (Billions $)
Total Personal Income 15.6 16.3 17.0 18.2 19.8 20.4 21.3 22.5 23.7
Pct Chg Year Ago Wages and Salaries
4.7 4.9 4.3 6.7 8.9 2.8 4.7 5.5 5.4 8.2 8.5 8.9 9.2 10.1 10.9 11.3 11.9 12.4 Nonwage Income 7.4 7.8 8.1 9.0 9.7 9.5 10.0 10.6 11.2 Real Personal Income (12$) 15.1 16.0 16.6 17.5 18.4 18.1 18.6 19.3 19.9 Pct Chg Year Ago 2.3 6.5 3.6 5.6 4.6 -1.4 2.9 3.5 3.3 Per Capita Income (Ths) 41.0 42.9 44.5 47.4 51.6 53.1 55.7 58.5 61.3 Real Per Capita Income (12$) 39.6 42.0 43.3 45.7 47.8 47.2 48.7 50.2 51.5 Average Annual Wage (Ths) 45.2 46.3 47.7 51.3 55.8 58.4 59.8 62.2 64.6 Pct Chg Year Ago 3.4 2.5 2.9 7.6 8.8 4.6 2.5 3.9 4.0
Establishment Employment (Place of Work, Thousands, SA)
Total Employment 179.9 183.7 186.7 178.7 180.6 185.6 188.4 190.4 191.8 Pct Chg Year Ago 1.4 2.1 1.7 -4.3 1.1 2.8 1.5 1.1 0.7 Manufacturing 3.2 3.2 3.4 3.4 3.5 3.6 3.6 3.5 3.5 Pct Chg Year Ago 1.3 0.3 4.7 0.4 4.8 1.1 -0.4 -1.1 -1.7 Nonmanufacturing 176.7 180.5 183.4 175.3 177.1 182.1 184.8 186.9 188.3 Pct Chg Year Ago 1.4 2.1 1.6 -4.4 1.0 2.8 1.5 1.1 0.8 Construction & Mining 7.4 8.0 8.8 8.3 8.5 8.8 8.6 8.4 8.3 Pct Chg Year Ago 3.8 8.2 9.4 -4.9 2.2 2.9 -1.5 -2.5 -1.7 Trade, Trans, & Utilities 24.3 24.5 24.6 23.6 24.2 24.8 24.3 23.7 23.5 Pct Chg Year Ago -0.6 0.8 0.3 -4.1 2.6 2.5 -2.1 -2.2 -1.0 Wholesale Trade 3.8 3.8 3.9 3.8 3.8 3.8 3.9 4.1 4.3 Retail Trade 18.5 18.5 18.5 17.6 18.0 18.4 17.7 16.8 16.3 Trans, Wrhsng, & Util 2.0 2.1 2.2 2.2 2.4 2.6 2.7 2.8 2.9 Information 3.4 3.1 3.1 3.1 3.0 3.0 2.9 2.9 3.0 Pct Chg Year Ago 6.9 -8.3 0.1 -1.1 -2.4 -1.1 -2.4 0.2 4.1 Financial Activities 7.8 7.9 7.8 7.5 7.6 7.7 7.9 8.0 8.1 Pct Chg Year Ago 3.4 2.1 -2.2 -2.9 1.3 1.2 1.9 1.3 1.1 Prof & Business Services 20.3 21.6 22.3 22.6 22.5 22.5 22.8 23.2 23.5 Pct Chg Year Ago 0.7 6.5 3.3 1.1 -0.2 0.2 0.9 1.8 1.3 Educ & Health Services 23.2 24.0 24.8 24.4 25.0 25.8 25.6 26.2 26.7 Pct Chg Year Ago 5.3 3.4 3.3 -1.5 2.6 2.9 -0.6 2.3 1.8 Leisure & Hospitality 20.0 20.4 21.0 16.5 18.3 20.5 22.5 23.3 23.4 Pct Chg Year Ago 1.2 1.8 2.9 -21.5 11.4 11.8 9.7 3.6 0.5 Other Services 8.9 9.4 9.0 8.8 9.2 10.0 10.2 10.7 11.3 Pct Chg Year Ago -5.3 6.3 -4.0 -3.0 5.2 8.3 2.0 4.6 5.7 Federal Government 2.1 2.0 2.1 2.2 2.1 2.1 2.2 2.2 2.2 Pct Chg Year Ago 3.8 -2.8 4.2 2.9 -2.5 1.5 0.6 0.1 0.0 State & Local Government 59.4 59.5 60.0 58.5 56.5 56.9 57.9 58.4 58.5 Pct Chg Year Ago 1.3 0.3 0.8 -2.5 -3.3 0.6 1.8 0.8 0.2
Other Economic Indicators
Population (Ths) 380.2 381.5 383.5 384.0 384.1 383.4 382.4 384.1 386.5 Pct Chg Year Ago 0.8 0.3 0.5 0.1 0.0 -0.2 -0.2 0.4 0.6 Labor Force (Ths) 190.2 192.4 194.5 189.4 196.1 201.8 204.0 204.6 205.2 Pct Chg Year Ago 0.8 1.2 1.1 -2.7 3.5 2.9 1.1 0.3 0.3 Unemployment Rate (%) 4.1 3.6 3.4 5.9 4.9 4.1 3.7 3.4 3.1 Total Housing Starts 2691.6 2982.8 2326.6 2348.0 2609.0 2464.6 2204.0 2146.0 2153.1 Single-Family 1803.8 2016.1 1190.8 1294.6 1488.7 1534.0 1405.1 1323.0 1307.5 Multifamily 887.8 966.7 1135.8 1053.4 1120.2 930.7 798.9 823.0 845.6


