12 minute read
Crestview–Ft. Walton Beach–Destin......................................... 30
Short Term Outlook for Crestview-Fort Walton Beach-Destin, FL March 2022 Forecast
2022:1 2022:2 2022:3 2022:4 2023:1 2023:2 2023:3 2023:4 2024:1 2024:2 2024:3 2024:4 2025:1
Personal Income (Billions $)
Total Personal Income 18.4 18.8 19.0 19.2 19.4 19.6 19.9 20.2 20.5 20.7 21.0 21.3 21.6 Pct Chg Year Ago -4.5 3.5 4.9 4.3 5.2 4.5 4.5 5.2 5.7 5.7 5.7 5.6 5.6 Wages and Salaries 9.0 9.2 9.3 9.4 9.5 9.6 9.7 9.8 10.0 10.1 10.2 10.3 10.5 Nonwage Income 9.4 9.6 9.7 9.8 9.9 10.1 10.2 10.4 10.5 10.7 10.8 11.0 11.2 Real Personal Income (12$) 16.0 16.2 16.4 16.4 16.6 16.7 16.8 17.0 17.2 17.3 17.5 17.6 17.8 Pct Chg Year Ago -9.6 -1.1 1.0 1.7 3.3 2.8 2.8 3.4 3.7 3.7 3.7 3.6 3.5 Per Capita Income (Ths) 62.9 64.0 64.7 65.0 65.5 66.1 66.8 67.5 68.3 68.9 69.7 70.5 71.4 Real Per Capita Income (12$) 54.7 55.3 55.7 55.7 56.0 56.2 56.5 56.9 57.3 57.5 57.9 58.2 58.7 Average Annual Wage (Ths) 63.9 64.6 65.1 65.5 66.0 66.4 66.9 67.8 68.7 69.6 70.4 71.2 72.1 Pct Chg Year Ago 6.9 4.0 3.2 2.9 3.3 2.7 2.6 3.5 4.2 4.8 5.3 5.0 4.9
Establishment Employment (Place of Work, Thousands, SA)
Total Employment 121.5 123.0 123.6 124.1 124.3 125.0 125.6 125.8 125.9 126.0 126.2 126.4 126.3 Pct Chg Year Ago 3.0 4.8 4.7 3.5 2.3 1.7 1.6 1.4 1.3 0.8 0.4 0.5 0.4 Manufacturing 3.5 3.5 3.5 3.5 3.4 3.4 3.4 3.4 3.4 3.4 3.3 3.3 3.3 Pct Chg Year Ago 2.6 4.5 -0.1 -1.0 -1.3 -1.5 -1.2 -1.7 -1.6 -2.2 -2.5 -2.6 -2.4 Nonmanufacturing 118.1 119.5 120.1 120.7 120.9 121.6 122.2 122.4 122.5 122.6 122.8 123.1 123.0 Pct Chg Year Ago 3.0 4.8 4.8 3.6 2.4 1.8 1.7 1.4 1.3 0.9 0.5 0.5 0.4 Construction & Mining 7.0 7.0 7.0 6.9 6.9 6.8 6.7 6.6 6.6 6.5 6.4 6.4 6.3 Pct Chg Year Ago 2.1 0.9 -2.1 -2.8 -2.3 -2.9 -3.8 -4.3 -4.6 -4.6 -4.2 -3.8 -3.3 Trade, Trans, & Utilities 21.1 21.4 21.3 20.7 20.5 20.7 20.7 20.7 20.5 20.1 20.0 20.0 19.9 Pct Chg Year Ago 2.8 6.0 4.3 -1.1 -3.1 -3.3 -2.8 0.0 0.4 -2.9 -3.3 -3.5 -3.2 Wholesale Trade 1.7 1.7 1.8 1.8 1.8 1.8 1.8 1.8 1.8 1.9 1.9 1.9 1.9 Retail Trade 16.9 17.2 16.9 16.3 16.1 16.3 16.3 16.3 16.1 15.6 15.4 15.4 15.2 Trans, Wrhsng, & Util 2.5 2.5 2.6 2.6 2.6 2.6 2.6 2.6 2.6 2.7 2.7 2.7 2.7 Information 1.3 1.3 1.3 1.3 1.3 1.3 1.2 1.2 1.2 1.2 1.3 1.3 1.3 Pct Chg Year Ago 1.6 -2.1 -3.3 -1.9 -3.6 -2.2 -2.2 -4.2 -2.7 -1.0 2.2 4.3 5.2 Financial Activities 7.5 7.4 7.5 7.5 7.6 7.6 7.6 7.7 7.7 7.8 7.9 7.9 7.9 Pct Chg Year Ago 1.7 3.8 1.8 -0.9 1.0 2.0 1.7 2.3 1.9 3.1 3.3 3.4 2.8 Prof & Business Services 19.1 19.3 19.5 19.5 19.6 19.4 19.4 19.4 19.5 19.6 19.6 19.6 19.7 Pct Chg Year Ago -2.8 0.5 0.7 1.1 2.4 0.8 -0.6 -0.5 -0.2 1.0 1.4 1.2 0.8 Educ & Health Services 12.6 12.6 12.6 12.6 12.6 12.6 12.6 12.7 12.8 12.9 13.0 13.1 13.2 Pct Chg Year Ago 3.7 3.2 0.8 -0.2 -0.5 -0.5 -0.2 1.2 2.2 3.1 3.3 3.1 2.6 Leisure & Hospitality 23.9 24.7 25.0 26.0 26.2 26.9 27.5 27.5 27.4 27.7 27.8 27.9 27.8 Pct Chg Year Ago 13.6 12.7 17.5 15.8 9.5 8.8 10.3 5.9 4.8 3.0 1.1 1.4 1.1 Other Services 5.1 5.2 5.3 5.3 5.3 5.3 5.3 5.3 5.4 5.4 5.5 5.6 5.6 Pct Chg Year Ago 7.4 7.2 7.9 7.5 4.3 1.5 -0.3 0.3 1.1 3.2 4.0 4.5 4.7 Federal Government 9.1 9.2 9.3 9.4 9.4 9.4 9.5 9.5 9.5 9.5 9.5 9.5 9.5 Pct Chg Year Ago -1.1 2.6 3.1 3.1 3.3 2.4 1.5 1.0 0.4 0.4 0.3 0.3 0.2 State & Local Government 11.2 11.3 11.5 11.5 11.6 11.6 11.7 11.7 11.7 11.8 11.8 11.8 11.8 Pct Chg Year Ago -3.2 1.2 0.9 2.9 3.5 2.7 2.1 1.8 1.3 1.1 0.7 0.6 0.7
Other Economic Indicators
Population (Ths) 292.9 293.4 294.2 294.9 295.9 296.9 297.9 298.9 299.8 300.7 301.6 302.3 303.0 Pct Chg Year Ago 0.9 0.8 0.8 0.8 1.0 1.2 1.3 1.4 1.3 1.3 1.2 1.1 1.1 Labor Force (Ths) 135.7 136.7 137.7 138.2 138.7 139.1 139.3 139.7 139.9 140.1 140.4 140.8 140.9 Pct Chg Year Ago 2.3 2.2 3.2 2.9 2.2 1.7 1.2 1.1 0.9 0.8 0.8 0.8 0.7 Unemployment Rate (%) 3.5 3.3 3.2 3.2 3.0 3.0 3.0 2.9 2.8 2.7 2.7 2.6 2.6 Total Housing Starts 3807.3 3550.4 3366.4 3113.8 2815.1 2689.0 2585.9 2417.6 2366.5 2334.0 2315.2 2302.1 2292.4 Single-Family 3235.8 2911.3 2707.2 2477.9 2241.2 2117.4 2056.9 2011.0 1961.4 1935.1 1925.2 1905.8 1903.7 Multifamily 571.5 639.1 659.2 635.9 573.9 571.6 528.9 406.6 405.1 398.9 390.0 396.3 388.7
PROFILES
The Deltona–Daytona–Ormond Beach MSA is comprised of Volusia and Flagler Counties. It is located on the east coast of Florida and is notable for special events that occur throughout the year such as Bike Week. It is home to NASCAR headquarters and the Daytona International Speedway, which hosts popular races such as the Daytona 500.
QUICK FACTS
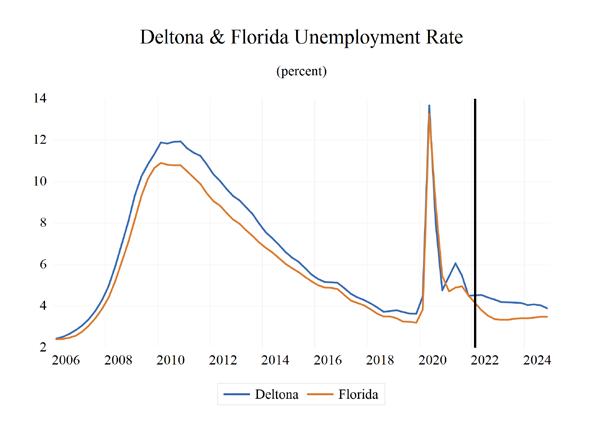
• Metro population estimate of 646,288 as of 2019 (5-Year Estimate) (U.S. Census Bureau). • Volusia County population estimate of 553,284 as of 2019 (5-Year Estimate) (U.S. Census Bureau). • Civilian labor force of 309,838 in December 2021 (Florida Research and Economic Database). • An unemployment rate of 3.8% as of December 2021, not seasonally adjusted. This amounts to 11,670 unemployed people (Florida Research and
Economic Database).
OUTLOOK SUMMARIES
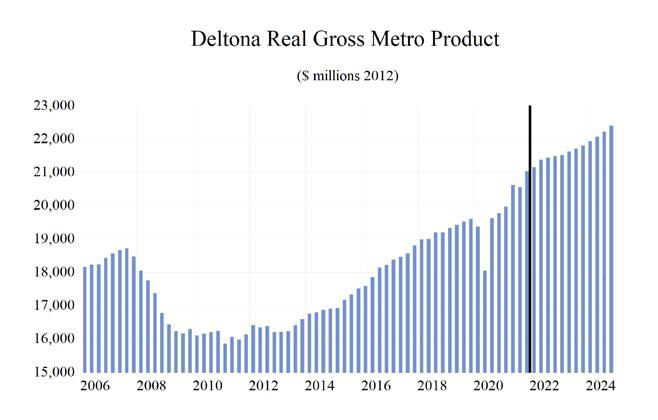
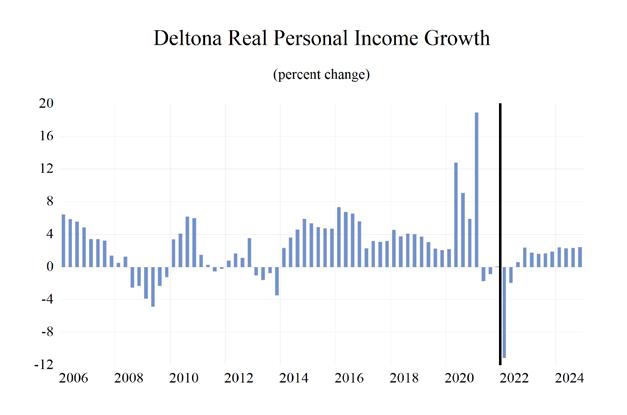
Growth in the economic indicators studied in this forecast is expected to be around the state averages for the Deltona – Daytona – Ormond Beach Metropolitan Statistical Area (MSA). Gross Metro Product in the Deltona MSA will be $21,436.33 million, placing it 12th in the state for metro output. Personal income levels will grow by an average annual rate of 5.1 percent, driven by a 5.5 percent increase in the average annual wage to $55,500. Per capita income levels will come in at $45,500, placing it 19th out of the studied MSAs. We expect population growth of 1.1 percent per year.
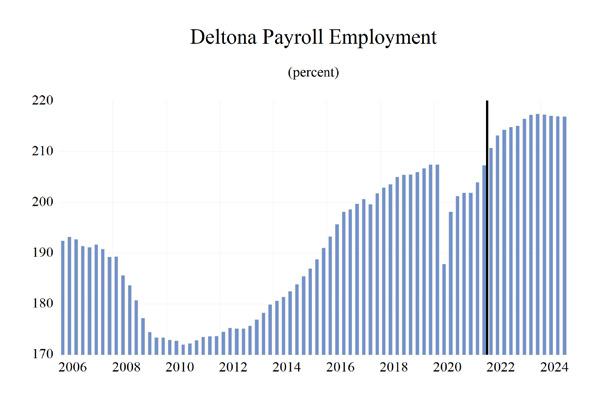
The Deltona – Daytona – Ormond Beach MSA labor market will experience an average level of annual employment growth at 2.3 percent, leading to an unemployment rate of 4.5 percent.
The Leisure & Hospitality sector will experience the fastest growth rate in this MSA with an annual growth rate of 8.4 percent. The Other Services sector will follow at 5.1 percent. Manufacturing will be the thirdfastest growing sector at a rate of 2.4 percent.
METRO NEWS SUMMARIES
Amazon promising 1K jobs at new $200M Daytona Beach fulfillment center
• Daytona Beach officials revealed the city could see 1,000 new jobs as part of a proposed massive
Amazon distribution center. • The deal involves a $200 million, 2.8 millionsquare-foot, five story facility on property between Belville and Bellevue roads east of
Williamson Blvd; the facility will be more than three times the size of the Volusia Mall. • The fulfillment center will provide at least 1,000 jobs at the end of five years, with 250 in the first year, and a minimum starting wage of at least $15 an hour. Source: Orlando Sentinel, December 2, 2021
Deltona builds to draw water from lake
• Deltona will soon build a $9.5 million system as a source of water for a fast-growing state and region. • The water will not be used for drinking; however, the treated river water will be provided to the customers connected to the city’s reclaimed water system. • The initial operations of the new reclaimed-water system will involve taking about 4 million from the river each day, but the system will be capable of withdrawing and treating as much as 12 million gallons per day. Source: The West Volusia Beacon, December 18, 2021
Hillwood and NASCAR partner to bring development to Volusia County
• Hillwood and NASCAR will develop more than 200 acres of land adjacent to NASCAR home base Daytona International Speedway; the project is expected to add hundreds of quality jobs for area residents.
• The new project will be developed in phases with the potential to build out to about two million square feet of industrial space, new roads, and infrastructure for the surrounding community. • Located at the intersection of 1-4 and I-95, the project offers tenants access to Central Florida and Eastern Volusia County. Source: PR News Wire, January 25, 2022
Deland narrowly approves housing on old golf course
• The application to rezone the 167-acre former
Southridge Golf Course in southeast DeLand to allow a 597-unit housing development was approved by the DeLand City Commission. • The project includes a public park of approximately 21 acres that will be constructed during the first phase. Source: The West Volusia Beacon, January 31, 2022
Deltona loves food trucks, but wants to regulate them
• Food trucks are becoming more popular, and
Deltona is interested in capitalizing on the trend. • As city leaders wrestle with an ordinance to regulate the growing numbers of restaurants on wheels — to the extent state law allows —
Deltona is hosting gatherings of food trucks each
Friday afternoon and evening at Wes Crile Park. • The first such city-sponsored food-truck gathering, an experiment to determine if it should become a regular weekly event, took place
Jan. 21 at Deltona City Hall. Source: Beacon Online News, February 4, 2022
MetroNet Announces Expansion of 100 Percent Fiber Optic Network to Daytona Beach and Surrounding Communities, Construction to Begin this Summer
• Metronet today announced that the company will soon bring ultra-high-speed 100 percent fiber optic internet service directly to homes and businesses of Daytona Beach, Holly Hill, and
Ormond Beach. • Metronet, the nation’s largest independently owned, 100 percent fiber optic provider, will fully fund the project through a private multimilliondollar investment. • Metronet’s two-year construction process will begin this summer, with the first customers able to receive service before the end of 2022. Once completed, Daytona Beach, Holly Hill and
Ormond Beach will all become Gigabit Cities, with Metronet’s fiber optic network widely available. Source: BusinessWire, March 28, 2022
Volusia Business News: Jobs, houses and a lot of new people
• The Volusia County economy could only be described as starting 2022 with a boom based on the latest housing and employment information. • The county’s unemployment rate dropped to 3.3% in February, nearing the 3% rate that economists consider full employment. The state estimates 249,141 workers were employed while 8,624 were unemployed in February. • Growth in Flager and Volusia Counties from migration has driven up housing prices. Despite a shrinking inventory, there was a 2.9% growth in existing house sales in February along with a 24.7% median house price increase from last year.
Construction employment has also grown by 700 jobs in the last year. Source: Hometown News, March 31, 2022
Deltona - Daytona Beach - Ormond Beach MSA Industry Loca�on Quo�ents
Total Nonagricultural Employment
Total Private
Goods Producing
Service Producing
Private Service Providing
Mining, Logging, and Construc�on
Manufacturing
Trade, Transporta�on, and U�li�es
Wholesale Trade
Retail Trade
Transporta�on, Warehousing and U�li�es
Informa�on
Financial Ac�vi�es
Professional and Business Services
Educa�onal and Health Services
Leisure and Hospitality
Other Services
Government
0.0 0.2 0.4 0.6 0.8 1.0 1.2 1.4


Long Term Outlook for Deltona-Daytona Beach-Ormond Beach, FL March 2022 Forecast
2017 2018 2019 2020 2021 2022 2023 2024 2025
Personal Income (Billions $)
Total Personal Income 27.2 28.7 30.2 32.1 34.7 35.4 37.2 39.1 41.1
Pct Chg Year Ago Wages and Salaries
6.5 5.8 5.2 6.1 8.0 2.1 5.1 5.2 5.1 8.4 8.9 9.3 9.5 10.7 11.7 12.3 12.9 13.4 Nonwage Income 18.7 19.9 21.0 22.6 24.0 23.6 24.9 26.3 27.7 Real Personal Income (12$) 25.9 27.2 28.7 30.1 31.2 30.6 31.6 32.6 33.6 Pct Chg Year Ago 4.8 5.0 5.4 4.8 3.7 -2.0 3.3 3.2 3.0 Per Capita Income (Ths) 42.2 44.0 45.7 47.8 50.9 51.4 53.5 55.7 57.9 Real Per Capita Income (12$) 40.3 41.7 43.3 44.7 45.8 44.4 45.4 46.4 47.3 Average Annual Wage (Ths) 41.8 43.2 44.7 47.5 52.1 54.8 56.4 58.9 61.6 Pct Chg Year Ago 2.7 3.3 3.5 6.4 9.7 5.0 3.0 4.4 4.6
Establishment Employment (Place of Work, Thousands, SA)
Total Employment 200.4 204.2 206.4 198.6 203.7 213.2 216.5 217.0 216.9 Pct Chg Year Ago 2.0 1.9 1.1 -3.7 2.6 4.7 1.5 0.2 -0.1 Manufacturing 11.6 11.8 11.4 10.7 11.3 11.7 11.8 11.8 11.6 Pct Chg Year Ago 0.9 1.1 -3.4 -6.0 5.4 4.3 0.3 -0.2 -1.3 Nonmanufacturing 188.8 192.4 195.0 187.9 192.4 201.5 204.7 205.3 205.3 Pct Chg Year Ago 2.1 1.9 1.3 -3.6 2.4 4.7 1.6 0.3 0.0 Construction & Mining 12.9 13.8 14.2 14.2 15.0 15.2 14.9 14.3 14.0 Pct Chg Year Ago 6.6 6.8 2.7 0.2 5.6 1.4 -2.4 -3.9 -2.2 Trade, Trans, & Utilities 38.3 38.7 38.9 38.1 38.4 39.9 39.4 38.4 37.8 Pct Chg Year Ago 3.1 1.2 0.4 -2.1 0.8 4.0 -1.3 -2.5 -1.6 Wholesale Trade 5.1 5.2 5.2 5.0 5.1 5.1 5.4 5.6 5.8 Retail Trade 30.6 30.9 31.0 30.1 30.1 31.3 30.5 29.2 28.3 Trans, Wrhsng, & Util 2.6 2.6 2.7 3.0 3.2 3.5 3.6 3.7 3.8 Information 2.4 2.4 2.4 2.0 1.9 2.0 2.0 2.0 2.2 Pct Chg Year Ago -3.3 0.0 -0.7 -16.1 -7.1 4.1 1.2 3.1 5.2 Financial Activities 8.4 8.5 8.7 9.0 9.1 9.3 9.4 9.6 9.7 Pct Chg Year Ago -1.9 0.8 2.2 4.2 0.5 2.6 1.5 1.4 1.1 Prof & Business Services 23.7 23.2 23.4 23.5 24.6 25.1 25.3 25.5 25.6 Pct Chg Year Ago 1.3 -2.5 1.2 0.2 4.5 2.3 0.8 0.6 0.3 Educ & Health Services 38.8 39.8 40.7 39.7 39.9 41.2 41.3 42.0 42.6 Pct Chg Year Ago 2.2 2.5 2.2 -2.5 0.6 3.3 0.3 1.5 1.6 Leisure & Hospitality 31.4 33.0 32.9 27.6 30.0 34.1 37.1 37.9 37.6 Pct Chg Year Ago 1.6 5.0 -0.3 -16.2 9.0 13.5 8.9 2.2 -0.8 Other Services 9.0 9.0 8.9 8.1 8.2 8.9 9.3 9.8 10.3 Pct Chg Year Ago 2.0 0.0 -0.8 -9.5 1.1 8.9 5.0 5.4 4.7 Federal Government 1.4 1.4 1.5 1.6 1.5 1.5 1.6 1.6 1.6 Pct Chg Year Ago 5.0 0.6 5.3 6.0 -6.2 2.2 1.4 -0.1 -0.2 State & Local Government 22.3 22.5 23.4 24.2 23.9 24.2 24.3 24.1 24.0 Pct Chg Year Ago 1.5 1.3 3.7 3.6 -1.2 1.1 0.6 -0.8 -0.6
Other Economic Indicators
Population (Ths) 643.5 653.0 662.4 671.9 681.3 687.9 695.4 702.9 710.0 Pct Chg Year Ago 1.8 1.5 1.4 1.4 1.4 1.0 1.1 1.1 1.0 Labor Force (Ths) 295.6 299.1 301.9 296.1 306.2 314.9 319.3 320.9 321.7 Pct Chg Year Ago 1.3 1.2 0.9 -1.9 3.4 2.8 1.4 0.5 0.3 Unemployment Rate (%) 4.5 3.9 3.7 7.7 5.4 4.4 4.2 4.0 3.9 Total Housing Starts 3081.2 3568.4 4524.4 5827.3 5526.9 5923.1 5670.8 5423.7 5379.9 Single-Family 2860.0 3274.5 3878.5 4666.3 5317.1 5343.6 4618.7 4380.4 4325.1 Multifamily 221.2 293.9 645.9 1161.0 209.7 579.4 1052.0 1043.3 1054.8


