11 minute read
Gainesville...............................................................................................45
Short Term Outlook for Gainesville, FL March 2022 Forecast
2022:1 2022:2 2022:3 2022:4 2023:1 2023:2 2023:3 2023:4 2024:1 2024:2 2024:3 2024:4 2025:1
Personal Income (Billions $)
Total Personal Income 15.7 16.0 16.2 16.4 16.5 16.7 16.9 17.2 17.4 17.6 17.8 18.1 18.3 Pct Chg Year Ago -1.2 4.5 5.4 4.7 5.0 4.3 4.3 5.0 5.4 5.3 5.4 5.2 5.2 Wages and Salaries 9.3 9.5 9.6 9.6 9.7 9.8 9.9 10.0 10.2 10.3 10.4 10.5 10.6 Nonwage Income 6.5 6.6 6.7 6.7 6.8 6.9 7.0 7.1 7.3 7.3 7.4 7.6 7.7 Real Personal Income (12$) 13.9 14.1 14.2 14.3 14.4 14.5 14.6 14.7 14.9 15.0 15.1 15.2 15.3 Pct Chg Year Ago -6.4 -0.1 1.5 2.1 3.1 2.6 2.6 3.2 3.4 3.4 3.4 3.2 3.1 Per Capita Income (Ths) 52.4 53.3 53.9 54.3 54.7 55.3 55.9 56.6 57.3 57.9 58.5 59.1 59.8 Real Per Capita Income (12$) 46.4 46.9 47.2 47.3 47.6 47.9 48.2 48.5 48.9 49.1 49.5 49.7 50.1 Average Annual Wage (Ths) 62.2 62.7 63.0 63.3 63.6 63.9 64.3 65.1 65.8 66.5 67.3 68.0 68.8 Pct Chg Year Ago 8.6 4.8 3.2 2.6 2.3 2.0 2.2 2.9 3.5 4.1 4.6 4.5 4.5
Establishment Employment (Place of Work, Thousands, SA)
Total Employment 148.7 150.3 151.2 151.6 152.0 152.7 153.2 153.5 153.7 153.8 153.9 154.0 154.0 Pct Chg Year Ago 3.2 3.4 3.8 3.1 2.2 1.6 1.3 1.3 1.1 0.7 0.5 0.3 0.2 Manufacturing 4.6 4.6 4.6 4.6 4.6 4.6 4.6 4.5 4.5 4.5 4.5 4.5 4.5 Pct Chg Year Ago -1.1 -1.2 -0.2 -0.1 -0.5 -0.6 -0.2 -0.6 -0.6 -1.1 -1.4 -1.5 -1.5 Nonmanufacturing 144.1 145.7 146.6 147.0 147.4 148.1 148.7 149.0 149.2 149.3 149.4 149.5 149.5 Pct Chg Year Ago 3.4 3.5 3.9 3.2 2.3 1.7 1.4 1.3 1.2 0.8 0.5 0.4 0.2 Construction & Mining 6.7 6.8 6.8 6.7 6.7 6.7 6.6 6.5 6.4 6.4 6.3 6.2 6.2 Pct Chg Year Ago 8.6 8.4 4.7 -0.6 -0.6 -1.6 -2.5 -3.4 -4.0 -4.4 -4.3 -4.0 -3.6 Trade, Trans, & Utilities 21.1 21.3 21.2 20.7 20.5 20.6 20.5 20.5 20.3 19.9 19.7 19.6 19.6 Pct Chg Year Ago 1.5 1.3 2.0 -1.6 -3.2 -3.2 -2.9 -0.9 -0.7 -3.5 -3.9 -4.2 -3.7 Wholesale Trade 3.1 3.1 3.2 3.2 3.2 3.2 3.2 3.2 3.3 3.3 3.3 3.4 3.4 Retail Trade 14.3 14.4 14.1 13.6 13.3 13.5 13.4 13.4 13.1 12.6 12.4 12.3 12.2 Trans, Wrhsng, & Util 3.8 3.8 3.9 3.9 3.9 3.9 3.9 3.9 3.9 3.9 3.9 4.0 4.0 Information 1.6 1.6 1.6 1.6 1.6 1.6 1.6 1.6 1.6 1.6 1.7 1.7 1.7 Pct Chg Year Ago 1.4 0.9 1.0 1.3 -0.2 1.3 1.2 -1.4 -0.5 0.7 3.2 4.9 5.2 Financial Activities 7.2 7.2 7.3 7.3 7.4 7.3 7.3 7.3 7.4 7.4 7.4 7.4 7.5 Pct Chg Year Ago 6.7 8.2 5.3 0.8 1.9 1.4 0.3 0.8 0.3 1.3 1.4 1.4 1.1 Prof & Business Services 16.4 16.7 17.1 17.3 17.5 17.6 17.6 17.8 18.0 18.2 18.3 18.4 18.4 Pct Chg Year Ago -1.2 3.5 4.8 5.5 6.9 5.1 3.1 2.7 2.6 3.5 3.8 3.4 2.3 Educ & Health Services 28.3 28.5 28.6 28.5 28.6 28.6 28.7 28.9 29.1 29.3 29.4 29.5 29.6 Pct Chg Year Ago 3.7 3.8 3.2 1.6 0.9 0.6 0.4 1.2 1.8 2.3 2.4 2.2 1.8 Leisure & Hospitality 14.9 15.5 15.7 16.3 16.4 16.7 17.1 17.0 16.9 16.9 16.9 16.9 16.7 Pct Chg Year Ago 12.3 4.3 10.3 17.7 9.5 7.8 8.5 4.3 3.1 1.1 -0.9 -0.8 -0.6 Other Services 4.2 4.2 4.3 4.3 4.3 4.3 4.3 4.3 4.3 4.4 4.4 4.4 4.5 Pct Chg Year Ago 8.0 5.6 7.9 7.1 3.8 1.0 -0.9 -0.3 0.2 2.2 2.9 3.2 3.6 Federal Government 4.7 4.7 4.8 4.8 4.8 4.8 4.8 4.8 4.8 4.8 4.8 4.8 4.8 Pct Chg Year Ago -4.1 -0.1 1.3 1.9 1.7 1.2 0.7 0.2 -0.2 -0.4 -0.5 -0.5 -0.6 State & Local Government 38.8 39.1 39.3 39.4 39.7 39.9 40.1 40.3 40.3 40.4 40.5 40.5 40.5 Pct Chg Year Ago 2.2 3.1 2.4 1.6 2.2 2.0 2.0 2.1 1.7 1.4 1.0 0.7 0.5
Other Economic Indicators
Population (Ths) 300.4 300.6 301.0 301.4 301.9 302.4 302.9 303.4 304.0 304.5 305.0 305.5 306.0 Pct Chg Year Ago 0.7 0.5 0.4 0.4 0.5 0.6 0.6 0.7 0.7 0.7 0.7 0.7 0.7 Labor Force (Ths) 152.0 153.7 155.2 156.2 157.0 157.7 158.3 158.8 158.9 159.2 159.5 159.8 159.7 Pct Chg Year Ago 5.3 4.1 3.3 4.0 3.3 2.6 2.0 1.6 1.2 0.9 0.8 0.6 0.5 Unemployment Rate (%) 3.7 3.7 3.6 3.5 3.4 3.3 3.2 3.2 3.0 2.9 2.9 2.7 2.8 Total Housing Starts 1788.5 1585.4 1478.0 1418.5 1381.2 1385.2 1418.3 1421.0 1406.4 1394.9 1387.3 1385.6 1381.8 Single-Family 881.9 874.2 894.8 896.4 872.7 867.0 867.1 874.0 854.5 845.1 842.4 834.6 835.7 Multifamily 906.5 711.2 583.3 522.2 508.5 518.2 551.1 546.9 551.9 549.8 544.9 551.1 546.0
PROFILES
The Homosassa Springs MSA is located in the central northwest portion of the state. Homosassa Springs is a Census designated place in Citrus county and is known for and named after the warm spring located in Homosassa Springs Wildlife State Park which attracts manatees to the area.
QUICK FACTS
• Metro population estimate of 145,169 as of 2019 (5-Year Estimate) (U.S. Census Bureau). • Citrus County population estimate of 145,169 as of 2019 (5-Year Estimate) (U.S. Census Bureau). • Civilian labor force 48,696 in December 2021 (Florida Research and Economic Database). • An unemployment rate of 4.7% as of December 2021, not seasonally adjusted. This amounts to 2,313 unemployed people (Florida Research and
Economic Database).
OUTLOOK SUMMARIES
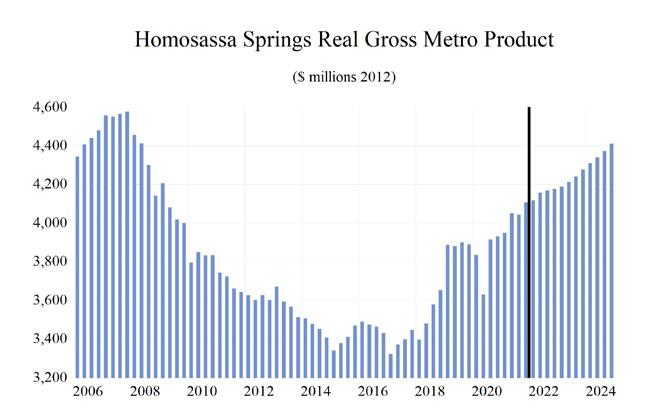
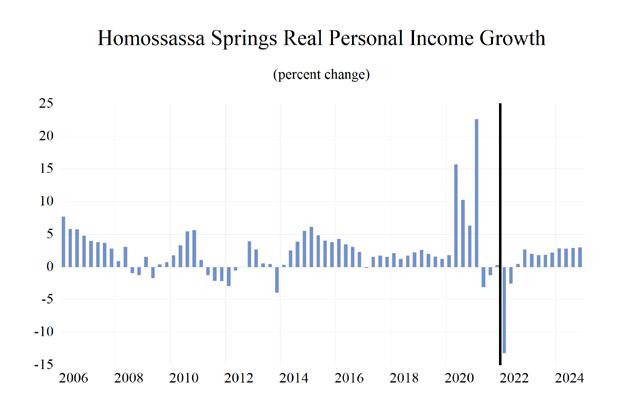
The Homosassa Springs Metropolitan Statistical Area (MSA) is expected to see below-average growth in most of the economic indicators, relative to the other MSAs studied. Homosassa’s expected Gross Metro Product of $4,196.15 million will be second to last in the state. Personal income growth of 5.6 percent will put the MSA’s per capita income level at $41,100. Average annual wage growth of 5.3 percent will push the average annual wage up to $52,300, becoming the lowest the state. Population growth will be 1.4 percent.
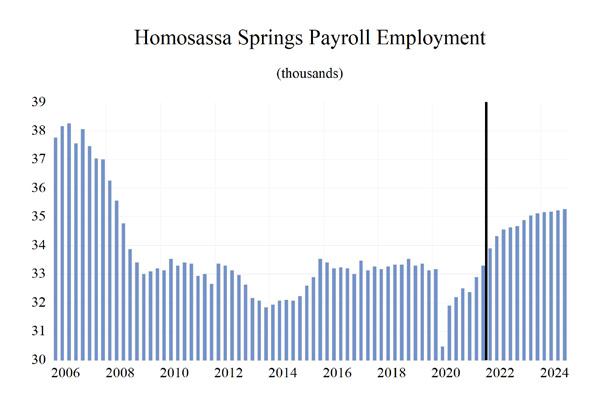
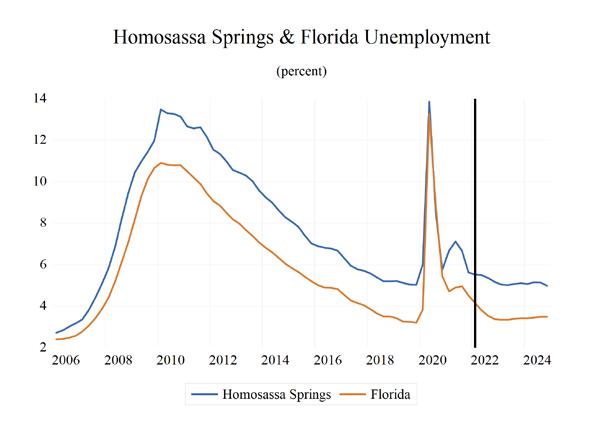
Employment growth is expected to average 2.5 percent annually. Homosassa’s unemployment rate will come in at 5.5 percent.
The fastest growing sector in the Homosassa Springs MSA will be the leisure sector, which will see an average annual growth rate of 7.2 percent. The Professional & Business Services sector will come in second at a growth rate of 4.4 percent, followed by the other services sector at 2.9 percent. The Trade, Transportation, and Utilities sector will experience a pullback in growth at -0.4 percent.
METRO NEWS SUMMARIES
957-home housing development planned for Lecanto
• The proposed Crystal Ridge development would border both Crystal Oaks and Cinnamon Ridge and would cater to all ages and budgets: from larger, pricier estate homes to traditional ranch models. • Chuck Pigeon, of Pigeon-Ardurra in Ocala, says construction on the first of five phases of the project could begin by May 2023, assuming all zoning hurdles are overcome. • During phase one of the development, 80 acres would be developed north of Crystal Oaks Drive.
During phase two, Rock Crusher Road would be developed just south of the RV campground.
The entire development will take 15 years to complete. Source: Chronicle Online, December 7, 2021
Pirate’s Cove purchase back on county’s radar
• County Commissioner Ruthie Schlabach asked her colleagues to revisit the twice-rejected proposed county purchase of the Pirate’s Cove property in Ozello. • The Pirate’s Cove property owner last month rejected the county’s bid to buy the property for $616,000 so the board would have to authorize staff to seek new appraisals. • Commissioner Kinnard recommended the county’s take $190,000 out of District 1 impact fees to also help pay for the property. Source: Chronicle Online, December 15, 2021
Citrus County officials discuss economic development plans, raising impact fees
• County commissioner Kinnard suggested the county look at raising impact fees to help pay for the tens of millions of dollars in new public projects prompted by growth, including a new courthouse and the widening of North Croft
Avenue in Inverness and West Venable Street in
Crystal River.
• County commissioners last updated impact fees in 2018. The current fee is $5,413 for a single-family home. The fees are set at 50% of a consultant’s recommendation. Source: Florida Politics, January 5, 2022
School board talks $34.2M in relief funds
• The Citrus County School District is currently planning how to spend $34.2 million from the
Elementary and Secondary Emergency Relief III (ESSER) funding under the American Rescue
Plan (ARP) Act. • Director of finance Tammy Wilson said at least 20% of the funds must be spent to address learning loss. The district hopes to utilize approximately $7.2 million toward bus and kindergarten aides, reading intervention, summer school and after school enrichment. • The district hopes to spend approximately $13.4 million on educational technology, including hardware, software, and connectivity. Source: Chronicle Online, January 12, 2022
TSCG Arranges $10.5 Million Sale of GroceryAnchored Center in Central Florida
• TSCG has arranged the $10.5 million sale of Springs Plaza, a Publix-anchored center in
Homosassa. • The property was 96 percent leased at the time of sale to tenants including Aaron’s Rents, T-Mobile and Quick Care Medical Clinic. • The 96,647 square feet center is situated at the intersection of US Highway 98 and Halls River
Road in Citrus County. Source: Shopping Center Business, February 8, 2022
Developer of affordable housing in Inverness to meet with opponents of proposed project
• Green Mills Group has bought 6.5 acres for $250,000 to develop an affordable housing project for those 55 and older.
• This project began as the city of Inverness wanted to increase its maximum density from 12.5 units per acre to 17.5 units per acre. • The county argued the higher density would allow for better urban infill on less property and allow for better infrastructure. Source: Chronicle Online, February 15, 2022
Riverwalk project fully funded after state antes $3 million
• After legislators allocated $3 million for the
King’s Bay Riverwalk project, construction to set to begin in 2023. • The entire project is expected to cost nearly $9 million. • Joe Meek, the Mayor, said that this project along with several other restoration projects that the state contributed to “will have a major impact on
Crystal River, Citrus County, and the state of
Total Nonagricultural Employment
Total Private
Homosassa Springs MSA Industry Loca�on Quo�ents
Goods Producing
Service Producing
Private Service Providing
Government
0.85 0.9 0.95 1 1.05 1.1 1.15


Long Term Outlook for Homosassa Springs, FL March 2022 Forecast
2017 2018 2019 2020 2021 2022 2023 2024 2025
Personal Income (Billions $)
Total Personal Income 5.4 5.7 6.0 6.4 7.0 7.1 7.5 8.0 8.4
Pct Chg Year Ago Wages and Salaries
3.6 4.6 5.3 7.6 8.7 2.3 5.7 5.7 5.7 1.3 1.4 1.4 1.4 1.6 1.8 1.9 2.0 2.0 Nonwage Income 4.1 4.3 4.5 5.0 5.3 5.3 5.7 6.0 6.4 Real Personal Income (12$) 5.7 5.6 5.9 6.2 6.5 6.4 6.7 6.9 7.2 Pct Chg Year Ago 4.2 -2.3 5.4 6.6 4.4 -1.8 3.9 3.7 3.6 Per Capita Income (Ths) 36.9 37.9 39.3 41.4 44.2 44.6 46.5 48.7 51.1 Real Per Capita Income (12$) 38.8 37.3 38.6 40.3 41.3 40.0 41.0 42.2 43.4 Average Annual Wage (Ths) 40.2 41.2 42.1 44.8 49.3 51.6 53.0 55.1 57.5 Pct Chg Year Ago 3.1 2.6 2.2 6.4 10.0 4.7 2.6 4.1 4.3
Establishment Employment (Place of Work, Thousands, SA)
Total Employment 33.2 33.3 33.3 31.9 32.8 34.4 34.9 35.2 35.4 Pct Chg Year Ago -0.1 0.2 0.2 -4.2 2.6 4.8 1.7 0.8 0.4 Manufacturing 0.5 0.5 0.5 0.5 0.6 0.6 0.6 0.5 0.5 Pct Chg Year Ago 1.7 2.8 4.2 1.3 10.5 -0.4 -1.2 -1.6 -2.1 Nonmanufacturing 32.7 32.8 32.8 31.4 32.2 33.8 34.4 34.7 34.8 Pct Chg Year Ago -0.2 0.1 0.1 -4.3 2.5 4.9 1.7 0.8 0.5 Construction & Mining 2.9 3.0 3.0 3.0 3.0 3.1 3.1 3.1 3.1 Pct Chg Year Ago -0.4 3.4 1.6 -0.3 0.9 2.3 0.3 -1.2 -0.8 Trade, Trans, & Utilities 7.4 7.4 7.3 7.1 7.2 7.5 7.3 7.2 7.2 Pct Chg Year Ago -1.5 0.1 -1.1 -2.8 0.8 4.0 -1.8 -1.5 -0.7 Wholesale Trade 1.0 1.0 1.0 1.0 1.0 1.0 1.1 1.1 1.2 Retail Trade 5.1 5.1 5.1 4.9 5.0 5.2 4.9 4.7 4.6 Trans, Wrhsng, & Util 1.2 1.2 1.2 1.2 1.2 1.3 1.3 1.4 1.4 Information 0.3 0.3 0.3 0.3 0.3 0.3 0.3 0.3 0.3 Pct Chg Year Ago -0.7 -7.4 -6.9 -7.7 -7.1 3.3 -0.8 2.2 4.8 Financial Activities 1.2 1.2 1.2 1.2 1.3 1.4 1.4 1.4 1.4 Pct Chg Year Ago -1.3 2.9 3.9 -0.3 8.3 2.3 0.5 1.7 1.8 Prof & Business Services 3.1 3.0 3.0 3.0 3.4 3.6 3.8 3.9 4.0 Pct Chg Year Ago 2.8 -3.8 0.3 0.9 13.9 5.8 3.8 3.5 1.9 Educ & Health Services 7.7 7.5 7.9 7.3 7.2 7.3 7.3 7.5 7.6 Pct Chg Year Ago -1.8 -1.8 4.1 -6.8 -2.1 1.5 0.4 2.6 1.7 Leisure & Hospitality 4.8 4.9 4.7 4.3 4.6 5.2 5.6 5.6 5.5 Pct Chg Year Ago 2.3 2.6 -4.0 -9.7 7.4 14.1 7.5 -0.3 -1.5 Other Services 1.1 1.1 1.0 0.9 0.9 1.0 1.0 1.0 1.1 Pct Chg Year Ago 9.1 2.4 -11.7 -10.2 6.0 6.2 2.1 3.0 4.6 Federal Government 0.2 0.2 0.2 0.2 0.2 0.2 0.2 0.2 0.2 Pct Chg Year Ago 3.8 3.6 3.6 -7.7 -11.4 12.5 2.2 1.8 1.4 State & Local Government 4.1 4.1 4.2 4.1 4.1 4.2 4.4 4.4 4.4 Pct Chg Year Ago -1.4 0.9 1.2 -1.9 0.0 3.9 2.9 1.3 0.6
Other Economic Indicators
Population (Ths) 146.7 149.2 151.7 155.0 157.9 160.0 162.1 163.6 164.9 Pct Chg Year Ago 1.9 1.7 1.7 2.1 1.9 1.4 1.3 0.9 0.8 Labor Force (Ths) 47.8 47.5 47.4 46.5 48.5 49.9 50.1 49.4 49.0 Pct Chg Year Ago -0.4 -0.7 -0.2 -1.9 4.2 2.9 0.3 -1.2 -0.8 Unemployment Rate (%) 5.9 5.3 5.1 8.5 6.5 5.4 5.1 5.1 5.0 Total Housing Starts 514.6 845.3 872.8 895.5 1017.8 1222.0 1337.6 1294.8 1271.6 Single-Family 432.1 824.2 726.6 863.9 965.6 1183.6 1311.3 1268.6 1244.8 Multifamily 82.5 21.1 146.2 31.5 52.2 38.4 26.2 26.2 26.8


