11 minute read
Florida News Summaries................................................................. 23
Florida bill would let businesses sue local governments if an ordinance hurts profits
• Despite warnings from a parade of city and county officials from across the state that a Senate preemption bill could put taxpayers on the hook for millions of dollars in damages when nuisance businesses face regulation, a Florida Senate committee Thursday approved the measure on a mostly party-line vote. • The Senate Appropriations Committee voted 11-7 for Senate Bill 620, which would allow businesses from pill mills to puppy mills to sue local governments if they lose up to 15 percent of their profits or revenues because of a local ordinance attempting to regulate them. • The bill is sponsored by Sen. Travis Hutson, a St.
Augustine Republican, but is the brainchild of
Senate President Wilton Simpson, a Trilby egg farmer and 2022 candidate for state agriculture commissioner. Source: Tampa Bay Times, January 21, 2022
Florida tops 30 million tourists in fourth quarter
• Florida attracted nearly 30.9 million visitors during the final three months of 2021, the second consecutive quarter of drawing more tourists than in the comparable period of 2019 before the coronavirus pandemic slammed into the state,
Gov. Ron DeSantis said Tuesday. • The estimate could bring the overall number of tourists during 2021 to 122.3 million, which is less than the record 131.069 million visitors in 2019 but a 54 percent increase from the pandemic-ravaged 2020. • Domestic travelers accounted for 94 percent of the visitors in the fourth quarter of 2021 and 96 percent for the entire year. Florida reported 4.958 million overseas travelers in 2021, which was up from 2.047 million in 2020 but down from 9.801 million in 2019. Source: Florida Trend, February 15, 2022
Rents reach ‘insane’ levels across U.S. with no end in sight
• In the 50 largest U.S. metro areas, median rent rose an astounding 19.3% from December 2020 to December 2021, according to a Realtor. com analysis of properties with two or fewer bedrooms. • The biggest jump occurred in the Miami metro area, where the median rent exploded to $2,850, 49.8% higher than the previous year. • Tampa-St. Petersburg-Clearwater, FL, and
Orlando-Kissimmee-Sanford, FL ranked second and third with increases of 35.0% and 34.1%
Year-Over-Year. Median rent rose to $2,038 and $1,807 respectively. Source: AP News, February 20, 2022
PROFILES
The Cape Coral MSA is comprised of Lee County. It is in the southwest coast. It is known for its many canals having over 400 miles of canals. Cape Coral has the most extensive canal system of any city in the world and is the largest master-planned community in the U.S.
QUICK FACTS
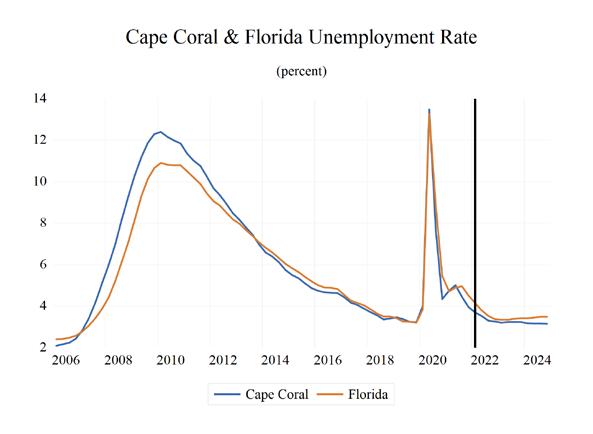
• Metro population estimate of 737,468 as of 2019 (5-Year Estimate) (U.S. Census Bureau). • Lee County population estimate of 737,468 as of 2019 (5-Year Estimate) (U.S. Census Bureau). • Civilian labor force of 364,988 in December 2021 (Florida Research and Economic Database). • An unemployment rate of 3.3% as of December 2021, not seasonally adjusted. This amounts to 12,102 unemployed people (Florida Research and
Economic Database).
OUTLOOK SUMMARIES
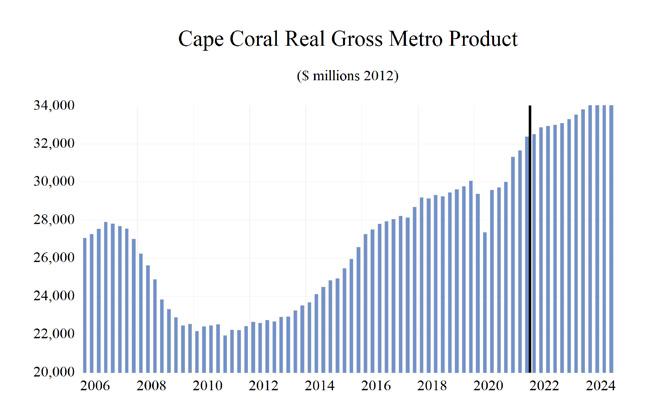
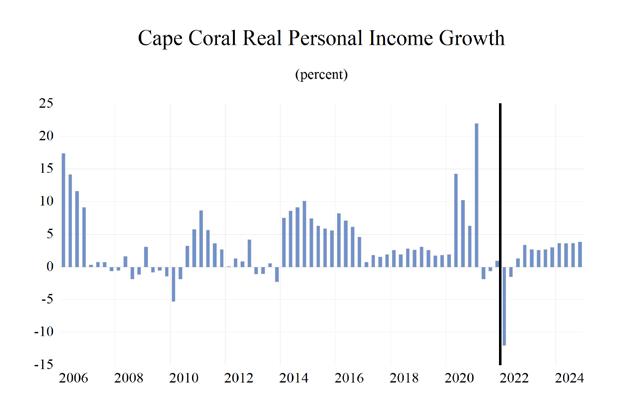
The studied economic indicators are predicted to show mixed levels of growth in the Cape Coral Metropolitan Statistical Area (MSA). Gross Metro Product for the MSA will come in at $34,088.00 million. The MSA will experience above-average personal income growth of 5.7 percent, but per capita income will be more moderate at $53,200. The average annual wage will grow at an annual rate of 4.1 percent to $65,600. Cape Coral’s population will grow at an annual rate of 1.1 percent.
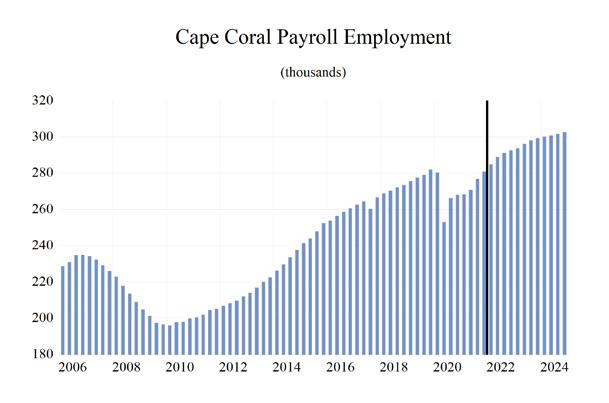
Employment growth is expected to average 2.6 percent, but Cape Coral will experience one of the lowest unemployment rates in the state at 2.6 percent.
The Leisure & Hospitality sector will lead the MSA in average annual growth at 8.0 percent. The Other Services sector will follow at 5.8 percent. The Construction & Mining sector will see contractions in growth of -0.4 percent.
METRO NEWS SUMMARIES
High demand for apartments pushes up rental rates in Southwest Florida
• The high demand is reflected in the skyrocketing rental rates, and the prices paid for the real estate when it changes hands. • Encore Vive, a 288-unit luxury apartment community at The Forum in Fort Myers, sold for $91 million in December 2021. That equates to more than $315,000 a door, making it one of the top sales of its kind. • “Sales like this prove the demand for multifamily projects continues to shine as one of the investment darlings of Southwest Florida,” said
Paige Rausch, a real estate broker and analyst with Aslan Realty Advisors in Fort Myers. Source: Fort Myers News-Press, December 29, 2021
Cape Coral wants to incentivize businesses to hire Cape Coral residents
• Cape Coral is known as a city where many people live, and few people work, and local government officials are working to change this. The city of Cape Coral is working to bring in new jobs, so homeowners and renters don’t have to cross the bridges for work. They will be doing this by offering business incentives. • “The incentives are going to focus on attracting and expanding opportunities for office light industries and mixed-use developments, which do yield higher property values and better-paying jobs while diversifying our economic base,” said
Melissa Mickey, public information specialist for
Cape Coral. • “It’s really on the hands of the policymakers in devising a policy that is catering to the local community, and aligning incentives and outcomes really well so we can have a sustainable impact in the community,” said Amir Neto, director of the Regional Economic Research
Institute at FGCU. Source: WINK News, December 8, 2021
Prime waterfront land in Fort Myers sells twice in same day, nets $20 million
• A stretch of prime riverfront property near downtown Fort Myers has changed hands. The property, along with nearby land off the water, fetched $20 million — after generating multiple offers and two sales on the same day. Ultimately,
NRIA, a New Jersey-based real estate investment and development group, scooped it up, with plans for redevelopment. • The nearly 5-acre property, made up of 10 parcels, includes the Legacy Harbour Marina and a hotel operating under the same name, as well as a restaurant lease for Joe’s Crab Shack, which had been generating significant income for the previous owners. • The big-ticket property sale “further demonstrates the appeal that Fort Myers is now generating from the nation’s top-tier investors” said Phil
Fischler, the founder and president of Fischler
Property Co. in Fort Myers. “The property ties together the recent residential growth along the western end of the River District with a walkable connection to the core of downtown’s business and cultural activity,” he said. Source: Fort Myers News-Press, January 6, 2022
Bimini Basin project in Cape Coral moving forward
• The goal of the Bimini Basin project is to bring a parking garage, apartments, stores and even a waterfront restaurant to Cape Coral. Now, that goal is one step closer to being complete. The project could mean a rise in tourism, however, the time it will take is causing some to oppose the
Bimini Basin project. • Bimini Basin is just off Cape Coral Pkwy, near
Palm Tree Dr and Sunset Ct. Jeff Wilby lives in Cape Coral and says the planned luxury apartments, even a health care facility, would do some good in that area. “This area is a little depressed. It could use some work,” Wilby said. • Not everyone in Cape Coral is excited about the project, though. Norman Zurfluh says he’s worried about too much growth in the city. “I’m just worried about light pollution, noise pollution, anything that comes with a bigger complex like
this and even the traffic,” Zurfluh said. Source: WINK News, January 28, 2022
Affordable housing complex in Cape Coral sells for $22.8 million
• Dominium, a Minnesota-based developer, bought
The Crossings at Cape Coral at 1150 Hancock
Creek S. Blvd. and plans to spend $5.1 million on a renovation of the property. • The eight-building complex, which was built in 2000 using 4% low-income tax credits, is made up of 168 income-restricted units. These include one- to four-bedroom apartments for residents living at 50% and 60% of the area median income. According to the U.S. Census Bureau, the median household income in Cape Coral is $61,599. • The renovation will include upgrading the clubhouse, landscaping, building exteriors and outdoor amenities as well as improvements in individual units, according to a release announcing the sale. Source: Business Observer, February 7, 2022
Cape Coral city council approves annual business tax on vacation rentals
• Cape Coral’s city council has approved a business tax to be levied on the rentals in a move to keep vacation rentals in Southwest Florida safe • Later this year, Cape Coral will impose a $5.50 tax per bedroom. As an example, a four-bedroom vacation rental would see a tax of $22. Each owner would pay that fee once every year. This tax will ensure that smoke alarms are intact, and the pools are safe in these homes. • “We don’t believe it’s a heavy burden on any property owner to pay the tax, but we believe it’s essential in terms of doing business,” said
Councilmember Tom Hayden. “It’s important because we believe the property owners of these vacation rentals should share their conducting business. It’s really no different than hotels, and because of that, we believe they should be a part of this tax,”. Source: WINK News, February 10, 2022
Cape Coral-Ft. Myers MSA Industry Loca�on Quo�ents
Total Nonagricultural Employment
Total Private
Goods Producing
Service Producing
Private Service Providing
Mining, Logging, and Construc�on
Manufacturing
Trade, Transporta�on, and U�li�es
Wholesale Trade
Retail Trade
Transporta�on, Warehousing and U�li�es
Informa�on
Financial Ac�vi�es
Professional and Business Services
Educa�onal and Health Services
Leisure and Hospitality
Other Services
Government
0 0.2 0.4 0.6 0.8 1 1.2 1.4 1.6 1.8 2


Long Term Outlook for Cape Coral-Fort Myers, FL March 2022 Forecast
2017 2018 2019 2020 2021 2022 2023 2024 2025
Personal Income (Billions $)
Total Personal Income 37.4 39.3 40.8 43.3 47.3 49.0 52.1 55.5 59.0
Pct Chg Year Ago Wages and Salaries
5.7 5.0 3.9 6.0 9.4 3.5 6.3 6.5 6.3 12.6 13.3 14.1 14.6 16.4 18.1 19.0 20.2 21.3 Nonwage Income 24.9 26.0 26.7 28.7 30.9 30.9 33.1 35.3 37.7 Real Personal Income (12$) 34.9 36.1 37.6 39.3 41.3 41.0 42.9 44.8 46.7 Pct Chg Year Ago 4.9 3.4 4.2 4.6 5.1 -0.6 4.5 4.5 4.2 Per Capita Income (Ths) 51.8 53.5 54.4 56.4 60.3 61.3 63.9 66.8 69.7 Real Per Capita Income (12$) 48.2 49.1 50.1 51.2 52.6 51.3 52.6 53.9 55.2 Average Annual Wage (Ths) 47.4 48.8 50.4 54.3 59.4 62.2 63.8 66.6 69.8 Pct Chg Year Ago 3.5 3.0 3.3 7.8 9.4 4.6 2.6 4.4 4.7
Establishment Employment (Place of Work, Thousands, SA)
Total Employment 263.5 271.2 278.6 266.9 274.2 289.4 296.9 301.3 303.9 Pct Chg Year Ago 2.4 2.9 2.7 -4.2 2.7 5.5 2.6 1.5 0.8 Manufacturing 6.0 6.3 6.5 6.4 6.6 6.8 6.8 6.8 6.7 Pct Chg Year Ago 3.0 6.0 2.8 -2.3 3.7 3.6 0.1 -0.5 -1.3 Nonmanufacturing 257.5 264.9 272.0 260.5 267.6 282.6 290.0 294.5 297.1 Pct Chg Year Ago 2.3 2.9 2.7 -4.2 2.7 5.6 2.6 1.6 0.9 Construction & Mining 27.5 30.7 32.6 33.1 35.2 36.1 35.8 35.0 34.6 Pct Chg Year Ago 5.7 11.6 6.2 1.5 6.3 2.5 -0.9 -2.2 -0.9 Trade, Trans, & Utilities 53.7 54.1 54.8 53.2 54.4 55.9 55.6 55.1 55.0 Pct Chg Year Ago 0.5 0.8 1.2 -2.9 2.2 2.8 -0.6 -0.9 -0.3 Wholesale Trade 7.5 7.5 7.7 7.7 7.9 8.1 8.6 8.9 9.4 Retail Trade 41.2 41.4 41.3 39.3 39.8 40.7 39.8 38.7 37.9 Trans, Wrhsng, & Util 4.9 5.3 5.8 6.2 6.7 7.1 7.3 7.5 7.7 Information 2.8 2.8 2.8 2.8 2.7 2.8 2.7 2.8 2.9 Pct Chg Year Ago -4.0 -1.1 1.8 -2.6 -3.3 3.7 -0.9 1.9 5.1 Financial Activities 13.3 13.6 14.0 13.5 14.1 14.7 14.9 15.1 15.4 Pct Chg Year Ago 2.4 1.7 3.3 -3.5 4.0 4.9 0.9 1.4 1.8 Prof & Business Services 35.6 37.2 37.6 36.4 36.7 37.5 38.7 40.3 41.0 Pct Chg Year Ago 3.0 4.6 1.2 -3.3 0.8 2.4 3.2 4.0 1.9 Educ & Health Services 29.2 30.1 31.4 30.7 32.4 34.2 34.4 35.1 35.8 Pct Chg Year Ago 2.7 3.2 4.2 -2.3 5.8 5.3 0.7 2.1 1.8 Leisure & Hospitality 41.1 41.9 43.6 36.3 38.2 44.8 49.6 51.6 51.7 Pct Chg Year Ago 0.9 2.0 4.1 -16.8 5.4 17.2 10.6 4.0 0.2 Other Services 11.7 11.6 11.7 10.7 11.0 11.9 12.4 13.1 13.7 Pct Chg Year Ago 2.6 -0.8 0.7 -8.1 2.2 8.7 4.6 5.0 5.1 Federal Government 2.4 2.4 2.4 2.6 2.4 2.5 2.5 2.5 2.6 Pct Chg Year Ago -3.0 -2.4 1.1 8.2 -7.4 5.1 1.5 0.0 0.3 State & Local Government 40.2 40.5 41.1 41.3 40.6 42.1 43.3 44.0 44.5 Pct Chg Year Ago 4.0 0.7 1.4 0.5 -1.7 3.8 2.9 1.5 1.2
Other Economic Indicators
Population (Ths) 722.6 734.6 749.5 766.9 784.8 799.9 815.0 831.0 846.7 Pct Chg Year Ago 2.1 1.7 2.0 2.3 2.3 1.9 1.9 2.0 1.9 Labor Force (Ths) 334.9 341.1 349.0 345.4 356.0 373.5 382.4 386.7 389.9 Pct Chg Year Ago 1.3 1.8 2.3 -1.1 3.1 4.9 2.4 1.1 0.8 Unemployment Rate (%) 4.1 3.5 3.3 7.4 4.5 3.5 3.2 3.2 3.2 Total Housing Starts 6618.2 7979.2 8110.5 10758.4 12381.4 11946.1 9524.7 9082.3 9185.9 Single-Family 4789.9 5579.8 5799.7 6667.2 11127.3 9883.0 6684.6 5989.1 6004.2 Multifamily 1828.3 2399.3 2310.8 4091.2 1254.0 2063.2 2840.1 3093.2 3181.7


