12 minute read
Miami-Miami Beach-Kendall...........................................................70
Short Term Outlook for Miami-Miami Beach-Kendall, FL
March 2022 Forecast
2022:1 2022:2 2022:3 2022:4 2023:1 2023:2 2023:3 2023:4 2024:1 2024:2 2024:3 2024:4 2025:1
Personal Income (Billions $)
Total Personal Income 171.4 174.1 176.4 177.7 179.9 181.9 183.6 185.1 187.3 189.8 192.6 195.1 198.0 Pct Chg Year Ago -1.7 4.4 5.0 4.1 5.0 4.5 4.1 4.2 4.1 4.4 4.9 5.4 5.7 Wages and Salaries 88.7 90.5 91.9 92.9 93.9 94.7 95.4 96.0 97.0 98.2 99.6 101.1 102.5 Nonwage Income 82.7 83.6 84.5 84.8 86.0 87.2 88.3 89.1 90.3 91.6 92.9 94.1 95.5 Real Personal Income (12$) 130.2 131.4 132.5 133.0 134.1 135.0 135.7 136.2 137.1 138.3 139.6 140.8 142.1 Pct Chg Year Ago -6.9 -0.2 1.2 1.5 3.1 2.8 2.4 2.4 2.2 2.4 2.9 3.4 3.6 Per Capita Income (Ths) 64.2 65.2 66.1 66.6 67.5 68.2 68.7 69.1 69.8 70.6 71.5 72.3 73.2 Real Per Capita Income (12$) 48.8 49.3 49.7 49.9 50.3 50.6 50.8 50.9 51.1 51.5 51.9 52.2 52.6 Average Annual Wage (Ths) 73.8 74.8 75.5 76.0 76.5 77.0 77.5 78.0 78.7 79.5 80.4 81.2 82.1 Pct Chg Year Ago 7.5 5.1 4.5 4.0 3.7 2.9 2.6 2.7 2.9 3.3 3.7 4.1 4.2
Establishment Employment (Place of Work, Thousands, SA)
Total Employment 1194.6 1202.6 1210.1 1215.6 1220.5 1222.8 1223.5 1223.6 1224.7 1227.9 1232.6 1237.0 1241.3 Pct Chg Year Ago 6.0 5.1 4.0 2.8 2.2 1.7 1.1 0.7 0.3 0.4 0.7 1.1 1.4 Manufacturing 42.1 42.2 42.0 42.2 41.7 41.7 41.6 41.5 41.4 41.3 41.1 40.9 40.7 Pct Chg Year Ago 4.0 4.3 3.5 0.9 -0.8 -1.1 -1.1 -1.6 -0.9 -1.0 -1.1 -1.3 -1.6 Nonmanufacturing 1152.6 1160.5 1168.1 1173.4 1178.8 1181.2 1182.0 1182.1 1183.3 1186.6 1191.5 1196.1 1200.6 Pct Chg Year Ago 6.0 5.1 4.1 2.8 2.3 1.8 1.2 0.7 0.4 0.5 0.8 1.2 1.5 Construction & Mining 53.1 53.4 53.6 53.9 54.1 54.0 53.8 53.6 53.4 53.4 53.6 53.8 54.1 Pct Chg Year Ago 0.8 5.5 6.6 2.5 1.8 1.2 0.3 -0.6 -1.3 -1.1 -0.5 0.4 1.2 Trade, Trans, & Utilities 296.9 299.6 300.3 297.1 296.3 297.8 296.5 296.2 295.1 293.1 293.2 293.5 293.9 Pct Chg Year Ago 6.0 6.2 4.9 1.4 -0.2 -0.6 -1.3 -0.3 -0.4 -1.6 -1.1 -0.9 -0.4 Wholesale Trade 71.8 72.4 75.0 75.7 76.5 76.3 76.3 76.6 77.3 78.2 78.9 79.6 80.3 Retail Trade 136.3 137.5 133.5 129.3 127.0 129.0 127.7 127.0 124.6 120.8 119.8 118.7 117.5 Trans, Wrhsng, & Util 88.8 89.8 91.8 92.1 92.9 92.5 92.5 92.6 93.2 94.1 94.5 95.1 96.1 Information 18.6 18.7 18.8 19.0 19.1 19.2 18.9 18.6 18.7 18.9 19.1 19.2 19.4 Pct Chg Year Ago 1.4 2.4 1.7 2.8 2.3 2.4 0.2 -1.9 -1.9 -1.4 1.3 3.3 3.8 Financial Activities 85.3 85.3 86.2 85.5 85.0 83.5 82.6 82.0 81.7 81.7 81.6 81.6 81.5 Pct Chg Year Ago 4.8 4.6 1.8 0.4 -0.3 -2.0 -4.2 -4.2 -3.9 -2.2 -1.1 -0.4 -0.2 Prof & Business Services 200.6 201.4 203.7 204.4 206.3 205.5 205.5 206.4 207.8 209.2 210.1 211.0 212.3 Pct Chg Year Ago 10.9 8.0 7.4 2.7 2.9 2.0 0.9 1.0 0.7 1.8 2.2 2.3 2.1 Educ & Health Services 186.8 187.8 188.4 187.1 187.0 186.3 186.3 186.4 187.1 188.1 189.3 190.1 191.3 Pct Chg Year Ago 0.1 1.8 1.2 0.4 0.1 -0.8 -1.1 -0.4 0.0 1.0 1.6 2.0 2.2 Leisure & Hospitality 120.5 122.1 123.8 133.2 137.5 141.8 145.9 147.0 147.7 150.0 151.9 153.5 153.9 Pct Chg Year Ago 16.2 3.1 2.4 14.2 14.1 16.1 17.8 10.4 7.4 5.8 4.1 4.4 4.3 Other Services 49.1 49.6 50.5 50.4 50.3 49.6 49.3 49.1 49.1 49.3 49.6 49.9 50.2 Pct Chg Year Ago 8.8 5.1 6.1 3.3 2.4 -0.1 -2.4 -2.6 -2.3 -0.5 0.7 1.6 2.2 Federal Government 21.2 21.1 21.0 20.9 20.8 20.8 20.7 20.7 20.6 20.6 20.7 20.8 20.8 Pct Chg Year Ago -0.4 2.3 2.7 -2.2 -1.7 -1.4 -1.2 -1.1 -1.0 -0.7 -0.1 0.5 1.1 State & Local Government 120.5 121.4 121.7 122.1 122.4 122.7 122.5 122.3 122.1 122.2 122.5 122.8 123.2 Pct Chg Year Ago 3.1 6.1 3.2 1.9 1.6 1.1 0.6 0.2 -0.3 -0.4 0.0 0.4 0.9
Other Economic Indicators
Population (Ths) 2669.4 2667.7 2666.5 2666.1 2667.0 2668.8 2672.6 2677.5 2682.4 2687.4 2692.4 2697.4 2703.0 Pct Chg Year Ago -0.6 -0.5 -0.3 -0.2 -0.1 0.0 0.2 0.4 0.6 0.7 0.7 0.7 0.8 Labor Force (Ths) 1350.9 1354.2 1356.1 1357.6 1359.6 1361.8 1362.5 1362.0 1362.1 1365.2 1369.6 1374.8 1380.0 Pct Chg Year Ago 4.4 3.7 1.3 0.7 0.6 0.6 0.5 0.3 0.2 0.3 0.5 0.9 1.3 Unemployment Rate (%) 4.2 3.8 3.5 3.4 3.4 3.4 3.5 3.6 3.6 3.7 3.8 3.9 4.0 Total Housing Starts 11083.1 10775.7 10758.3 10732.5 10815.3 10884.4 10860.2 10745.5 10682.7 10553.4 10464.8 10468.8 10432.7 Single-Family 3186.4 3339.8 3538.5 3649.3 3698.4 3723.0 3743.1 3781.2 3764.0 3757.7 3775.8 3771.8 3805.6 Multifamily 7896.7 7435.8 7219.8 7083.2 7116.9 7161.4 7117.2 6964.4 6918.6 6795.7 6689.0 6697.0 6627.1
PROFILES
The Naples–Immokalee–Marco Island MSA is comprised of Collier County only. Located on the southwest coast of Florida it is notable for numerous recreation and leisure activities. This region is sometimes referred to as the “Crown Jewel of Southwest Florida.”
QUICK FACTS
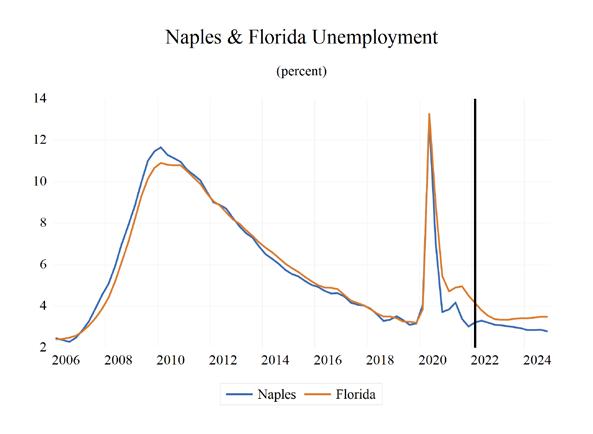
• Metro population estimate of 371,453 as of 2019 (5-Year Estimate) (U.S. Census Bureau). • Collier County population estimate of 384,902 as of 2019 (5-Year Estimate) (U.S. Census Bureau). • Civilian labor force of 194,009 in December 2021 (Florida Research and Economic Database). • An unemployment rate of 2.7% as of December 2021, not seasonally adjusted. This amounts to 5,300 unemployed people (Florida Research and
Economic Database).
OUTLOOK SUMMARIES
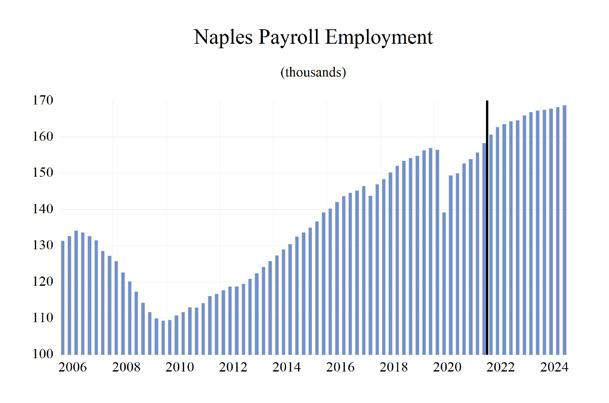
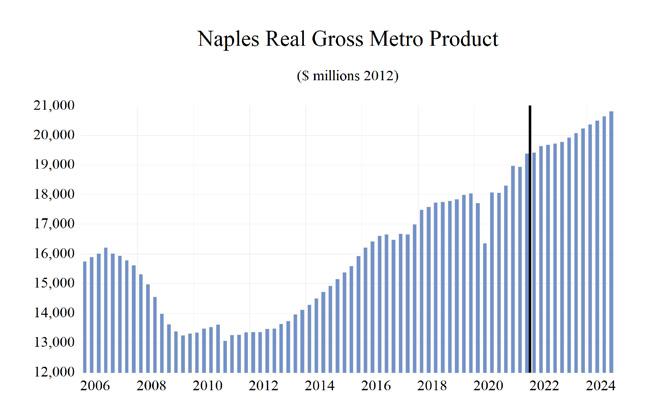
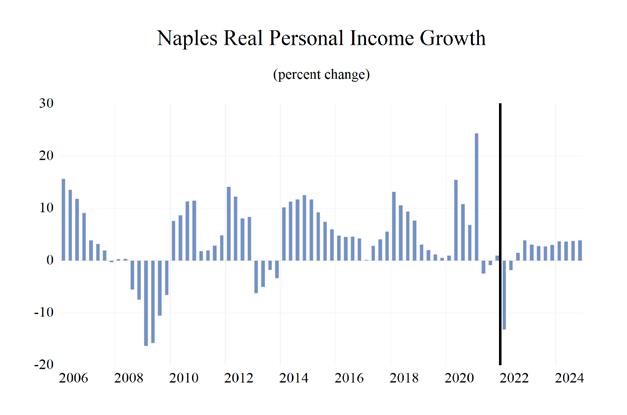
The Naples—Immokalee—Marco Island Metropolitan Statistical Area (MSA) is expected to show relatively strong performance in most of the economic indicators studied in this forecast. Gross Metro Product will come in at $20,370.16. Average annual wage growth of 3.7 percent will push the average annual wage level to $71,500, the fifth highest in the state. Personal income growth of 5.8 percent will lead to the highest per capita income level in the state at $102,000. The Naples – Marco Island MSA will a population growth of 1.2 percent.
The Naples area will experience an employment growth rate of 2.3 percent. This will lead to an unemployment rate of 3.0 percent.
The Leisure & Hospitality sector will lead Naples with the highest average annual growth rate of 6.6 percent. This is followed by the Other Services and the Education -Health Services sectors at respective rates of 4.6 percent and 2.5 percent.
METRO NEWS SUMMARIES
Trader Joe’s anchored shopping center sells for $97 million
• The Granada Shoppes in Naples has been sold.
New York-based Brixmor paid $97 million for the property. • The 307,000-square-foot center is 98% leased, according to JLL Retail Capital Markets, which brokered the deal for the seller, Courtelis
Company, and announced the sale in a release.
The center serves a trade area made up of 44,821 residents earning an average annual household income of $126,240 within three miles. • Granada Shoppes is on 39 acres and its eclectic tenant mix includes Trader Joe’s, PF Chang’s,
Haverty’s and First Watch along with Marshalls,
Dollar Tree, Tuesday Morning and Men’s
A sign of the times: Twin office towers at Pelican Bay fetch $55.5 million
• Two high-profile office towers near the main entrance to the upscale Pelican Bay community in North Naples have sold for a pretty penny. • The Offices at Pelican Bay, a two-building, topclass development totaling 177,557 square feet, fetched $55.5 million. • The sellers, a joint venture between funds managed by Apollo Global Management,
Square2 Capital and Steelbridge Capital, purchased the property for $33.65 million in 2014. Source: Naples Daily News, December 30, 2021
With COVID cases rising, Naples, Fort Myers restaurants face some struggles, see big business
• Despite COVID-19 cases surging across
Southwest Florida, some restaurants reported stronger business than ever.
• Geoff Luebkemann, senior vice president of the
Florida Restaurant and Lodging Association, pointed to strong holiday patronage. “We had very strong demand through the Christmas season and certainly into the big holiday week between Christmas and New Year’s. That seems to be universal statewide for restaurants,” he said.
“So far, we have not seen major disruptions like we did from previous spikes.” • As of Jan. 3, cases more than doubled in Collier
County — up to 2,866 from 1,130 the previous week — and rose to 6,019 cases from 1,815 in
Lee County from the previous week. Source: Naples Daily News, January 6, 2022
• The Naples Winter Wine Festival returns to an in-person format this weekend with a live auction
Saturday, including fine food and wine, at the
Ritz-Carlton Golf Resort in Naples. • More than 50 nonprofit organizations have benefited from the event, which has raised almost $220 million since its inception. • About $20 million was raised in 2020 alone, the most recent live event; $7.3 million was raised last year during a virtual auction. Source: WINK News, January 28, 2022
High net worth NY investment group adds office in Naples
• A nine-person, multigenerational wealth management firm from New York City is expanding to Naples. • Joe Matina - a managing director and private wealth adviser - leads the office, the Matina
Group. The Matina Group will move into UBS’s
Naples office at 801 Laurel Oak Drive, according to a statement. • A financial adviser for more than 30 years,
Matina has been recognized for his commitment to clients via numerous industry accolades including the Financial Times Top 400 Advisors
list from 2015-2021, the release states. Source: Business Observer, February 6, 2022
Six new tenants, including restaurant, coming to Naples design hub
• The design hub, at 111 10th St. S. is now adding a realtor, a luxury outdoor furniture manufacturer, a roofing company, an interior design group, and an Italian art and fashion business. • Warren American Whiskey Kitchen is coming aboard as well with a new restaurant on the first floor of The Collective. • According to a press release, all six of the new tenants will move in by the end of the year.
Among them is The Earls Lappin Team, a real estate agency focused on Naples’ luxury market. Source: Business Observer, February 11, 2022
Naples property firm at center of fraud lawsuits got $245,000 in COVID-19 relief funds
• A Naples property management company accused in lawsuits of a multimillion-dollar embezzlement scheme may have violated federal law when it applied for $245,000 in federal COVID-19 relief funds, according to legal experts. • American Property Management Services allegedly swiped more than $200,000 from
Naples’ Eagle Creek community association in fall 2019, according to a complaint the association would later file with state regulators in October 2020. • But when APMS sought a loan from the
Paycheck Protection Program in April 2020, the application required it to certify that it was not “engaged in any activity that is illegal under federal, state or local law.” But when APMS sought a loan from the Paycheck Protection
Program in April 2020, the application required it to certify that it was not “engaged in any activity that is illegal under federal, state or local law.” Source: Naples Daily News, March 30, 2022
Naples - Immokalee - Marco Island MSA Industry Loca�on Quo�ents
Total Nonagricultural Employment
Total Private
Goods Producing
Service Producing
Private Service Providing
Mining, Logging, and Construc�on
Manufacturing
Trade, Transporta�on, and U�li�es
Wholesale Trade
Retail Trade
Transporta�on, Warehousing and U�li�es
Informa�on
Financial Ac�vi�es
Professional and Business Services
Educa�onal and Health Services
Leisure and Hospitality
Other Services
Government
0 0.2 0.4 0.6 0.8 1 1.2 1.4 1.6 1.8 2


Long Term Outlook for Naples-Immokalee-Marco Island, FL March 2022 Forecast
2017 2018 2019 2020 2021 2022 2023 2024 2025
Personal Income (Billions $)
Total Personal Income 33.9 37.9 39.8 40.8 44.2 45.7 48.8 52.0 55.4
Pct Chg Year Ago Wages and Salaries
7.6 11.7 5.2 2.5 8.3 3.4 6.8 6.6 6.5 7.5 8.1 8.6 8.9 10.2 11.1 11.6 12.2 12.9 Nonwage Income 26.4 29.7 31.2 31.9 34.0 34.6 37.2 39.8 42.5 Real Personal Income (12$) 30.7 34.0 36.0 36.4 37.8 37.6 39.4 41.2 43.1 Pct Chg Year Ago 7.5 10.5 6.0 1.0 4.0 -0.7 4.9 4.6 4.4 Per Capita Income (Ths) 93.6 103.3 107.1 108.1 115.4 117.9 124.2 130.8 137.8 Real Per Capita Income (12$) 84.9 92.7 96.8 96.4 98.8 96.8 100.3 103.7 107.0 Average Annual Wage (Ths) 51.2 53.7 55.4 59.8 65.5 67.9 69.5 72.6 75.8 Pct Chg Year Ago 1.6 4.8 3.1 8.1 9.4 3.6 2.5 4.3 4.5
Establishment Employment (Place of Work, Thousands, SA)
Total Employment 145.6 151.0 155.6 148.7 155.1 162.8 166.1 168.1 169.6 Pct Chg Year Ago 2.0 3.7 3.0 -4.4 4.3 4.9 2.1 1.2 0.9 Manufacturing 4.0 4.3 4.7 4.9 5.1 5.4 5.4 5.4 5.4 Pct Chg Year Ago 5.6 7.8 10.2 5.2 3.4 5.9 0.0 -0.5 0.3 Nonmanufacturing 141.6 146.7 150.9 143.8 150.0 157.4 160.7 162.7 164.2 Pct Chg Year Ago 1.9 3.6 2.8 -4.7 4.3 4.9 2.1 1.2 0.9 Construction & Mining 15.4 17.2 17.7 17.3 18.0 18.1 18.0 17.6 17.5 Pct Chg Year Ago 3.1 11.6 2.6 -2.0 3.9 0.8 -0.7 -1.9 -0.7 Trade, Trans, & Utilities 27.9 28.6 29.2 28.2 29.0 30.3 29.9 29.4 29.1 Pct Chg Year Ago 2.0 2.5 2.1 -3.3 2.7 4.5 -1.4 -1.7 -0.7 Wholesale Trade 4.1 4.4 4.8 4.8 4.9 5.0 5.2 5.4 5.6 Retail Trade 21.9 22.1 22.2 21.3 21.9 22.9 22.1 21.3 20.7 Trans, Wrhsng, & Util 1.9 2.1 2.2 2.1 2.2 2.5 2.6 2.7 2.8 Information 1.5 1.4 1.4 1.3 1.3 1.3 1.3 1.3 1.4 Pct Chg Year Ago -8.4 -4.0 0.0 -8.5 1.4 -0.7 -0.9 2.2 5.2 Financial Activities 8.3 8.4 8.7 8.7 8.9 9.1 9.2 9.2 9.4 Pct Chg Year Ago 3.2 1.1 4.6 -1.1 2.5 2.9 0.4 0.7 1.7 Prof & Business Services 16.1 16.7 17.3 17.4 19.5 19.5 19.7 20.4 20.9 Pct Chg Year Ago 0.9 3.8 3.7 0.8 12.1 0.0 0.8 3.7 2.2 Educ & Health Services 21.5 22.3 23.1 23.1 24.0 24.8 25.1 25.9 26.5 Pct Chg Year Ago 2.4 3.6 3.3 0.1 4.0 3.2 1.1 3.1 2.7 Leisure & Hospitality 28.3 29.1 30.0 25.3 27.7 32.1 35.0 35.7 35.6 Pct Chg Year Ago 2.9 2.8 3.2 -15.5 9.6 15.8 9.0 2.1 -0.4 Other Services 8.9 9.2 9.2 8.5 8.6 9.2 9.4 9.8 10.3 Pct Chg Year Ago -0.9 3.6 0.4 -8.1 1.6 6.9 2.4 3.6 5.2 Federal Government 0.7 0.7 0.7 0.8 0.7 0.7 0.7 0.7 0.8 Pct Chg Year Ago 1.2 0.0 2.3 7.8 -8.9 4.6 1.8 0.0 0.4 State & Local Government 13.1 13.2 13.6 13.2 12.3 12.1 12.5 12.6 12.7 Pct Chg Year Ago 1.4 1.0 2.6 -2.4 -7.2 -1.0 2.6 1.2 1.0
Other Economic Indicators
Population (Ths) 362.2 366.4 372.0 377.5 383.0 387.8 392.8 397.6 402.3 Pct Chg Year Ago 1.5 1.2 1.5 1.5 1.5 1.3 1.3 1.2 1.2 Labor Force (Ths) 173.1 177.6 180.6 177.5 186.6 195.2 199.9 201.6 203.0 Pct Chg Year Ago 1.9 2.6 1.7 -1.8 5.1 4.6 2.4 0.8 0.7 Unemployment Rate (%) 4.2 3.5 3.3 6.9 3.6 3.2 3.0 2.8 3.0 Total Housing Starts 3697.4 4229.0 4017.4 4232.1 5793.5 5310.1 5102.8 5156.0 5215.9 Single-Family 2910.0 3120.6 3383.6 3160.1 4181.2 3784.4 3323.2 3213.0 3199.9 Multifamily 787.4 1108.4 633.9 1072.0 1612.3 1525.7 1779.6 1943.0 2016.0


