12 minute read
Naples–Immokalee–Marco Island ................................................ 75
Short Term Outlook for Naples-Immokalee-Marco Island, FL March 2022 Forecast
2022:1 2022:2 2022:3 2022:4 2023:1 2023:2 2023:3 2023:4 2024:1 2024:2 2024:3 2024:4 2025:1
Personal Income (Billions $)
Total Personal Income 44.3 45.4 46.3 46.8 47.6 48.4 49.2 50.0 50.9 51.6 52.4 53.2 54.1 Pct Chg Year Ago -4.4 5.3 7.1 6.3 7.4 6.5 6.3 6.9 7.0 6.7 6.5 6.4 6.4 Wages and Salaries 10.8 11.1 11.2 11.3 11.4 11.5 11.7 11.8 12.0 12.2 12.3 12.5 12.7 Nonwage Income 33.5 34.3 35.1 35.5 36.2 36.8 37.6 38.2 38.9 39.4 40.1 40.7 41.5 Real Personal Income (12$) 36.7 37.4 37.9 38.2 38.7 39.1 39.7 40.2 40.6 41.0 41.4 41.9 42.4 Pct Chg Year Ago -9.5 0.6 3.1 3.7 5.4 4.7 4.6 5.0 5.1 4.7 4.4 4.3 4.3 Per Capita Income (Ths) 114.8 117.3 119.2 120.2 121.7 123.3 125.1 126.8 128.6 130.0 131.6 133.3 135.2 Real Per Capita Income (12$) 95.0 96.6 97.6 98.1 98.9 99.8 100.8 101.7 102.7 103.2 104.0 104.9 105.8 Average Annual Wage (Ths) 67.1 67.8 68.2 68.5 68.9 69.2 69.6 70.5 71.4 72.2 73.0 73.7 74.6 Pct Chg Year Ago 7.0 3.4 2.4 2.0 2.6 2.1 2.1 3.0 3.6 4.3 4.8 4.6 4.6
Establishment Employment (Place of Work, Thousands, SA)
Total Employment 160.6 162.7 163.6 164.3 164.6 165.9 166.8 167.3 167.5 167.8 168.2 168.7 169.0 Pct Chg Year Ago 5.2 5.8 5.0 3.8 2.5 1.9 2.0 1.8 1.8 1.2 0.8 0.9 0.9 Manufacturing 5.4 5.4 5.4 5.4 5.4 5.4 5.4 5.4 5.4 5.4 5.4 5.4 5.4 Pct Chg Year Ago 8.3 10.2 5.5 0.3 0.3 0.0 0.1 -0.3 -0.3 -0.6 -0.6 -0.7 -0.3 Nonmanufacturing 155.3 157.3 158.2 158.8 159.2 160.5 161.4 161.8 162.1 162.4 162.9 163.4 163.6 Pct Chg Year Ago 5.1 5.6 5.0 3.9 2.5 2.0 2.1 1.9 1.8 1.2 0.9 0.9 0.9 Construction & Mining 18.1 18.1 18.2 18.2 18.1 18.1 17.9 17.8 17.8 17.7 17.6 17.6 17.5 Pct Chg Year Ago 0.2 2.0 1.0 -0.1 0.4 -0.3 -1.2 -1.8 -2.1 -2.2 -1.9 -1.5 -1.3 Trade, Trans, & Utilities 30.3 30.7 30.4 29.7 29.5 30.0 30.0 30.1 29.8 29.3 29.1 29.1 29.1 Pct Chg Year Ago 7.5 8.3 3.7 -1.1 -2.6 -2.5 -1.6 1.1 1.2 -2.3 -2.7 -3.0 -2.6 Wholesale Trade 4.9 5.0 5.1 5.1 5.1 5.1 5.2 5.2 5.3 5.3 5.4 5.4 5.5 Retail Trade 23.0 23.3 22.9 22.2 21.8 22.3 22.2 22.3 21.9 21.3 21.0 21.0 20.8 Trans, Wrhsng, & Util 2.4 2.4 2.5 2.5 2.5 2.6 2.6 2.6 2.6 2.7 2.7 2.7 2.8 Information 1.3 1.3 1.3 1.3 1.3 1.3 1.3 1.3 1.3 1.3 1.3 1.3 1.4 Pct Chg Year Ago 1.0 -0.3 -3.3 -0.1 -1.6 0.0 0.1 -2.0 -0.7 0.6 3.6 5.4 6.0 Financial Activities 9.1 9.1 9.2 9.1 9.2 9.2 9.2 9.1 9.2 9.2 9.2 9.3 9.3 Pct Chg Year Ago 4.1 5.4 2.2 0.1 0.9 0.8 0.0 0.0 -0.2 0.6 0.8 1.4 1.5 Prof & Business Services 19.6 19.5 19.5 19.5 19.7 19.6 19.6 19.9 20.2 20.4 20.5 20.7 20.8 Pct Chg Year Ago 2.1 1.7 -1.4 -2.3 0.4 0.6 0.5 1.7 2.5 4.0 4.4 3.9 3.0 Educ & Health Services 24.6 24.8 24.9 24.9 24.9 25.0 25.1 25.2 25.5 25.8 26.0 26.1 26.3 Pct Chg Year Ago 3.6 4.7 2.7 2.0 1.4 1.0 0.7 1.5 2.4 3.1 3.5 3.5 3.1 Leisure & Hospitality 30.6 31.9 32.3 33.7 33.9 34.8 35.6 35.6 35.4 35.7 35.8 35.9 35.7 Pct Chg Year Ago 15.5 11.8 17.6 18.4 10.7 9.3 10.3 5.8 4.5 2.5 0.6 0.7 0.7 Other Services 9.0 9.2 9.4 9.4 9.5 9.4 9.4 9.5 9.6 9.7 9.8 10.0 10.1 Pct Chg Year Ago 5.8 4.8 8.4 8.7 5.4 2.5 0.7 1.2 1.7 3.7 4.4 4.7 5.1 Federal Government 0.7 0.7 0.7 0.7 0.7 0.7 0.7 0.7 0.7 0.7 0.7 0.7 0.7 Pct Chg Year Ago -2.7 3.7 17.0 2.2 2.4 2.1 1.6 1.0 0.4 -0.1 -0.2 -0.3 -0.1 State & Local Government 12.0 12.1 12.2 12.3 12.4 12.4 12.5 12.5 12.6 12.6 12.6 12.6 12.7 Pct Chg Year Ago -6.3 -0.7 0.6 2.7 3.2 2.7 2.4 2.2 1.7 1.3 0.9 0.8 0.9
Other Economic Indicators
Population (Ths) 386.0 387.1 388.4 389.6 390.9 392.2 393.5 394.7 395.8 397.0 398.2 399.4 400.6 Pct Chg Year Ago 1.3 1.2 1.2 1.2 1.3 1.3 1.3 1.3 1.3 1.2 1.2 1.2 1.2 Labor Force (Ths) 192.1 194.5 196.4 197.7 198.8 199.6 200.3 200.9 201.1 201.4 201.7 202.1 202.4 Pct Chg Year Ago 5.5 4.1 4.6 4.2 3.5 2.6 2.0 1.6 1.2 0.9 0.7 0.6 0.6 Unemployment Rate (%) 3.2 3.3 3.2 3.1 3.1 3.0 3.0 2.9 2.8 2.8 2.9 2.8 2.9 Total Housing Starts 5744.6 5366.7 5157.1 4971.9 4978.0 5050.6 5158.7 5223.8 5189.1 5150.7 5136.4 5147.6 5154.6 Single-Family 4092.0 3827.0 3701.7 3516.8 3383.8 3292.0 3315.7 3301.1 3242.4 3210.6 3208.4 3190.5 3199.8 Multifamily 1652.6 1539.7 1455.3 1455.0 1594.2 1758.5 1843.0 1922.7 1946.6 1940.1 1928.0 1957.2 1954.8
PROFILES
The North Port-Sarasota-Bradenton is located in Sarasota County in the southwest segment of the state. North Port Encompasses fourteen miles of interstate 1-75 within its boundaries and it has two international airports within 45 minutes.
QUICK FACTS
• Metro population estimate of 803,709 as of 2019 (5-Year Estimate) (U.S. Census Bureau). • Sarasota County population estimate of 384,213 as of 2019 (5-Year Estimate) (U.S. Census
Bureau). • Civilian labor force of 388,705 in December 2021 (Florida Research and Economic Database). • An unemployment rate of 3.1% as of December 2021, not seasonally adjusted. This amounts to 12,057 unemployed people (Florida Research and
Economic Database).
OUTLOOK SUMMARIES
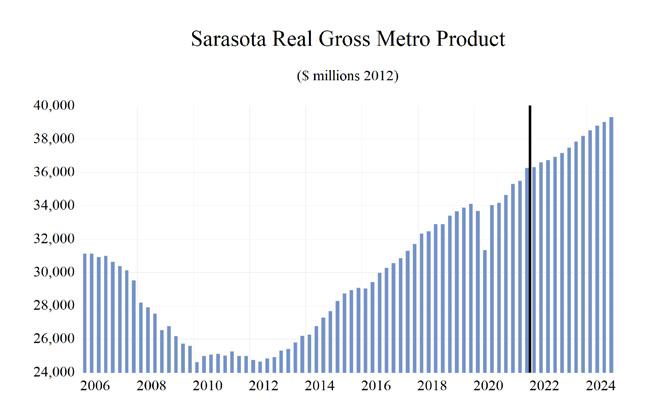
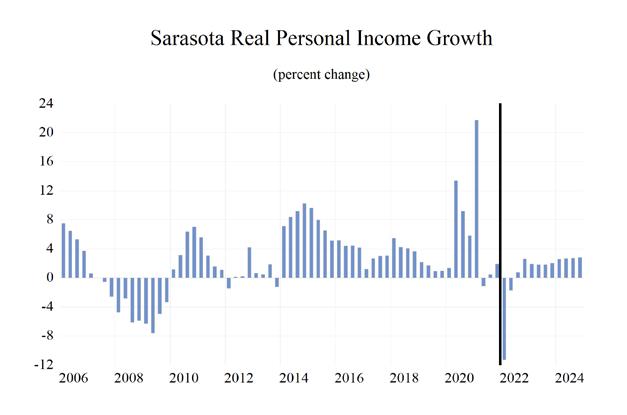
The North Port—Bradenton—Sarasota Metropolitan Statistical area is expected to show relatively strong levels of growth in the economic indicators. Personal income is expected to grow an average of 5.7 percent annually, higher than most of the 25 MSA’s studied. The average real per capita income level of $57,000 is the fourth highest in state. Average annual wage growth will be 4.9 percent; however, the average annual wage level is expected to be $62,500. West North Port is expected to average a population growth of 1.8 percent each year. The area has one of the highest Gross Metro Product of the MSAs studied at an average level of $37,167.52 million.
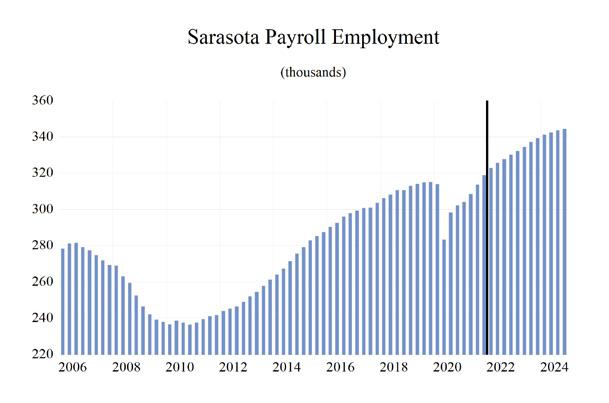
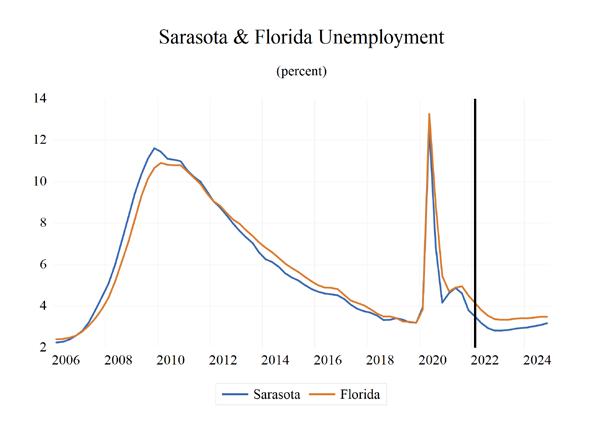
Employment is expected to grow at an average rate of 3.5 percent each year while unemployment is expected to be moderate at an average rate of 3.4 percent.
North Port’s fastest growing sector is expected to be the Leisure sector, which will experience 6.8 percent average annual growth, followed by the Prof. & Business Services sector, which will grow at an average of 6.5 percent annually. The Manufacturing sector will experience an average 1.6 percent growth over our forecast horizon.
METRO NEWS SUMMARIES
Sarasota launches ‘Work Where You Want To Live’ campaign to draw in new residents, workforce
• The Economic Development Corporation of
Sarasota joined with “Visit Sarasota County” to start a new initiative titled “Work Where You
Want To Live.” The focus is to turn tourists into permanent residents seeking and finding jobs within the county. • Due to the pandemic, local businesses have had to adapt to new marketing strategies to attract quality employees. This new program lures in new residents to fill in these labor shortages. • “Work Where You Want To Live” would provide information about businesses, neighborhoods, shopping and recreation, schools and various resources through digital media and advertising. Source: WTSP, December 14, 2022
Manatee County breaks ground on $20 million library in Lakewood Ranch
• Manatee County officials held a groundbreaking ceremony for the $20 million East County
Branch Library in Lakewood Ranch. • The 50,000-square-foot will include a rooftop terrace to grab a nice breath of fresh air while overlooking the planned Premier Park. • Fawley Bryant Architecture and Willis Smith
Construction will build the seventh full-service branch of the Manatee County Public Library
System. Source: WTSP, December 15, 2021
Gapin Institute introduces a precision health optimization & performance center in Sarasota Florida
• The Gapin Institute addresses men and women’s top health concerns with a fusion of modern medicine with hormone optimization, genetics, and epigenetics. • The Gapin Institute integrates precision hormone optimization, peptide therapy, stateof-the-art biometrics, genetic coaching, and age management strategies. In addition, fitness coaches, nutritionists, and other experts work at
Gapin Institute. Source: EDC of Sarasota County, January 12, 2022
City of Sarasota gets $10 million grant to shore up Bayfront area
• The City of Sarasota was awarded $10.4 million from the U.S. Department of Housing and Urban
Development for the state’s Rebuild Florida
Mitigation General Infrastructure Program. • In addition to improving water quality in Hog
Creek, Sarasota will also enhance the fish quality for the community’s fishermen and families who enjoy the creek. • This project will provide natural infrastructure for the park and the surrounding communities, including a stepped floodwall and a resilient rock revetment to protect against storms and flooding. Source: WWSB-TV, January 21, 2022
Booming growth fuels $786 million effort to build and expand Manatee County schools
• Over the next five years, the Manatee County
School District plans to expand existing schools, build new schools, or replace older schools to accommodate 4,810 additional students. • Several projects on six different middle school campuses are slated to add space for 2,062 more students, including renovations at Braden River and Sugg middle schools now underway. • The district plans to expand its high schools to add space for 750 students. For Braden River
High School, it funded a project to build 10 classrooms to accommodate 250 additional students and Lakewood Ranch is planning to add 20 classrooms. Source: Herald-Tribune, February 2, 2022
The median home price in Bradenton is now nearly $500K after a record-setting January
• The median house price in Manatee County increased from $340,000 last year, to $480,000 this year. Alongside Manatee County, Sarasota
County experienced a similar 36.6% increase in single-family house prices, now $464,000. • Inventory for single-family homes decreased 39.1% in Manatee County and decreased 46.7% in Sarasota County resulting from many out-ofstate homebuyers moving into west Florida. • The median price of condos and townhomes also increased dramatically with 30% and 15.8% increases in Manatee County and Sarasota
County respectively. Source: Bradenton Herald, February 22, 2022
North Port-Sarasota-Bradenton MSA Industry Loca�on Quo�ents
Total Nonagricultural Employment
Total Private
Goods Producing
Service Producing
Private Service Providing
Mining, Logging, and Construc�on
Manufacturing
Trade, Transporta�on, and U�li�es
Wholesale Trade
Retail Trade
Transporta�on, Warehousing and U�li�es
Informa�on
Financial Ac�vi�es
Professional and Business Services
Educa�onal and Health Services
Leisure and Hospitality
Other Services
Government
0 0.2 0.4 0.6 0.8 1 1.2 1.4


Long Term Outlook for North Port-Sarasota-Bradenton, FL March 2022 Forecast
2017 2018 2019 2020 2021 2022 2023 2024 2025
Personal Income (Billions $)
Total Personal Income 44.9 47.7 50.2 53.0 57.5 58.5 62.1 66.0 69.6
Pct Chg Year Ago Wages and Salaries
7.6 6.1 5.3 5.5 8.5 1.8 6.1 6.3 5.4 14.2 15.3 15.9 16.3 18.5 20.3 21.5 22.6 23.7 Nonwage Income 30.7 32.4 34.3 36.6 39.0 38.2 40.6 43.4 45.9 Real Personal Income (12$) 41.0 43.3 45.7 47.4 49.4 48.2 50.3 52.5 54.2 Pct Chg Year Ago 4.7 5.7 5.4 3.8 4.2 -2.3 4.3 4.3 3.3 Per Capita Income (Ths) 56.6 59.0 61.0 63.1 67.2 67.1 69.9 73.2 76.1 Real Per Capita Income (12$) 51.6 53.6 55.5 56.5 57.8 55.3 56.7 58.2 59.3 Average Annual Wage (Ths) 47.0 49.1 50.4 54.3 59.0 61.9 63.6 65.6 67.9 Pct Chg Year Ago 2.6 4.5 2.6 7.8 8.7 4.8 2.8 3.2 3.5
Establishment Employment (Place of Work, Thousands, SA)
Total Employment 301.1 308.9 314.3 299.5 311.3 326.6 335.8 342.9 346.8 Pct Chg Year Ago 2.4 2.6 1.7 -4.7 4.0 4.9 2.8 2.1 1.1 Manufacturing 16.6 16.8 17.1 16.2 16.9 17.4 17.3 17.3 17.0 Pct Chg Year Ago -0.1 1.0 2.1 -5.0 4.0 2.9 -0.3 -0.3 -1.4 Nonmanufacturing 284.5 292.2 297.2 283.2 294.4 309.2 318.5 325.7 329.8 Pct Chg Year Ago 2.5 2.7 1.7 -4.7 4.0 5.0 3.0 2.3 1.3 Construction & Mining 23.5 25.4 26.4 26.6 27.6 28.7 29.1 29.5 29.9 Pct Chg Year Ago 6.6 8.1 4.2 0.9 3.5 4.2 1.4 1.2 1.5 Trade, Trans, & Utilities 57.4 59.5 60.0 57.9 60.0 62.6 62.5 61.6 60.7 Pct Chg Year Ago 0.5 3.6 0.9 -3.6 3.6 4.4 -0.2 -1.4 -1.4 Wholesale Trade 8.4 8.7 8.9 8.4 8.5 9.1 9.8 10.4 10.9 Retail Trade 43.6 44.9 44.6 42.8 44.2 45.5 44.2 42.3 40.6 Trans, Wrhsng, & Util 5.4 6.0 6.5 6.7 7.3 8.0 8.4 8.8 9.2 Information 3.5 3.4 3.5 3.5 3.5 3.6 3.7 3.7 3.8 Pct Chg Year Ago -2.1 -1.0 1.7 0.2 0.7 3.8 2.6 0.4 2.4 Financial Activities 14.9 14.8 15.4 15.5 15.5 16.0 16.2 16.6 17.1 Pct Chg Year Ago 0.8 -0.5 3.9 1.0 -0.5 3.4 1.1 2.9 2.5 Prof & Business Services 47.2 47.4 46.2 43.1 48.5 52.3 53.5 55.3 56.0 Pct Chg Year Ago 4.0 0.3 -2.5 -6.7 12.5 7.9 2.1 3.5 1.2 Educ & Health Services 52.9 54.5 56.3 55.4 58.1 60.4 60.5 62.3 63.2 Pct Chg Year Ago 2.8 3.0 3.2 -1.5 4.8 4.0 0.1 2.9 1.4 Leisure & Hospitality 44.4 44.9 46.1 38.8 39.3 41.7 47.8 50.2 51.7 Pct Chg Year Ago 3.5 1.1 2.7 -15.8 1.1 6.1 14.8 4.9 3.0 Other Services 13.3 14.2 14.8 14.0 14.5 15.1 15.5 16.0 16.5 Pct Chg Year Ago 2.0 6.9 3.9 -5.5 3.9 4.3 2.1 3.2 3.2 Federal Government 2.0 2.0 2.0 2.1 2.0 2.1 2.1 2.1 2.1 Pct Chg Year Ago 4.4 0.0 0.8 4.4 -4.4 2.4 1.3 1.1 1.0 State & Local Government 25.4 26.0 26.5 26.2 25.5 26.6 27.6 28.4 28.8 Pct Chg Year Ago 0.2 2.3 1.7 -0.9 -2.6 4.3 3.8 2.7 1.5
Other Economic Indicators
Population (Ths) 793.8 807.7 823.1 839.0 855.0 871.6 888.0 901.5 914.3 Pct Chg Year Ago 1.9 1.7 1.9 1.9 1.9 1.9 1.9 1.5 1.4 Labor Force (Ths) 359.1 364.9 369.7 361.1 378.9 394.8 405.1 410.4 413.1 Pct Chg Year Ago 1.8 1.6 1.3 -2.3 4.9 4.2 2.6 1.3 0.7 Unemployment Rate (%) 4.0 3.5 3.3 6.9 4.5 3.1 2.9 3.1 3.3 Total Housing Starts 7231.2 9659.5 9235.0 9714.5 14397.0 11476.9 8842.7 8265.0 8055.0 Single-Family 5926.3 6234.1 6677.2 8136.0 12061.7 9360.4 7050.6 6529.0 6366.2 Multifamily 1304.9 3425.3 2557.7 1578.5 2335.3 2116.5 1792.1 1736.0 1688.8


