12 minute read
Punta Gorda.......................................................................................... 115
Short Term Outlook for Punta Gorda, FL March 2022 Forecast
2022:1 2022:2 2022:3 2022:4 2023:1 2023:2 2023:3 2023:4 2024:1 2024:2 2024:3 2024:4 2025:1
Personal Income (Billions $)
Total Personal Income 9.6 9.9 10.0 10.1 10.3 10.4 10.6 10.7 10.9 11.0 11.1 11.3 11.5 Pct Chg Year Ago -5.0 4.5 6.3 5.7 6.5 5.5 5.0 5.6 5.8 5.5 5.4 5.4 5.4 Wages and Salaries 2.8 2.9 2.9 3.0 3.0 3.0 3.0 3.1 3.1 3.1 3.2 3.2 3.3 Nonwage Income 6.8 7.0 7.1 7.2 7.3 7.4 7.5 7.6 7.8 7.8 8.0 8.1 8.2 Real Personal Income (12$) 8.3 8.5 8.6 8.6 8.7 8.8 8.9 9.0 9.0 9.1 9.2 9.3 9.4 Pct Chg Year Ago -10.0 -0.1 2.4 3.1 4.5 3.7 3.3 3.8 3.8 3.5 3.4 3.3 3.4 Per Capita Income (Ths) 49.4 50.4 51.1 51.4 51.8 52.4 52.9 53.5 54.1 54.5 55.1 55.7 56.3 Real Per Capita Income (12$) 42.7 43.3 43.7 43.8 44.0 44.3 44.5 44.8 45.1 45.2 45.5 45.7 46.0 Average Annual Wage (Ths) 54.2 54.9 55.1 55.4 55.7 56.0 56.3 56.9 57.6 58.3 59.0 59.6 60.4 Pct Chg Year Ago 7.9 4.2 2.9 2.4 2.8 2.0 2.1 2.8 3.5 4.1 4.8 4.8 4.8
Establishment Employment (Place of Work, Thousands, SA)
Total Employment 51.8 52.7 53.1 53.1 53.1 53.4 53.6 53.7 53.6 53.5 53.5 53.5 53.6 Pct Chg Year Ago 6.9 7.3 6.4 4.5 2.6 1.5 1.0 1.0 0.9 0.2 -0.1 -0.2 -0.1 Manufacturing 0.8 0.8 0.8 0.8 0.8 0.8 0.8 0.8 0.8 0.8 0.8 0.8 0.8 Pct Chg Year Ago 9.4 1.2 -0.5 -0.7 -0.4 0.5 1.2 1.2 1.8 1.6 1.6 1.6 0.8 Nonmanufacturing 51.0 51.9 52.3 52.3 52.3 52.7 52.8 52.9 52.8 52.7 52.7 52.7 52.8 Pct Chg Year Ago 6.8 7.4 6.5 4.6 2.6 1.5 1.0 1.0 0.9 0.1 -0.1 -0.2 -0.1 Construction & Mining 4.8 4.8 4.8 4.8 4.8 4.8 4.8 4.7 4.7 4.7 4.7 4.7 4.6 Pct Chg Year Ago 5.9 7.6 4.9 0.8 1.1 0.1 -1.1 -1.8 -2.3 -2.3 -2.0 -1.7 -1.5 Trade, Trans, & Utilities 12.5 12.7 12.7 12.4 12.2 12.4 12.4 12.4 12.3 12.0 11.9 11.9 11.8 Pct Chg Year Ago 6.7 8.4 7.0 0.7 -1.7 -2.3 -2.2 0.3 0.3 -3.2 -3.7 -4.2 -3.6 Wholesale Trade 0.9 0.9 0.9 1.0 1.0 1.0 1.0 1.0 1.0 1.0 1.0 1.0 1.1 Retail Trade 9.8 10.0 9.9 9.6 9.5 9.7 9.6 9.6 9.5 9.2 9.1 9.0 9.0 Trans, Wrhsng, & Util 1.7 1.8 1.8 1.8 1.8 1.8 1.8 1.8 1.8 1.8 1.8 1.8 1.8 Information 0.3 0.3 0.3 0.3 0.3 0.3 0.3 0.3 0.3 0.3 0.4 0.4 0.4 Pct Chg Year Ago 5.0 1.9 0.8 7.3 5.5 6.6 6.1 3.4 4.5 5.8 8.7 10.4 9.5 Financial Activities 2.2 2.3 2.3 2.3 2.3 2.3 2.4 2.4 2.4 2.4 2.4 2.4 2.4 Pct Chg Year Ago 1.8 3.9 3.8 4.4 4.9 3.8 2.2 2.3 1.7 2.5 2.3 2.1 1.6 Prof & Business Services 4.6 4.6 4.7 4.7 4.7 4.7 4.7 4.7 4.8 4.8 4.8 4.8 4.8 Pct Chg Year Ago 2.4 3.7 2.5 3.0 4.0 2.0 0.3 0.2 0.3 1.4 1.7 1.3 1.0 Educ & Health Services 10.2 10.3 10.3 10.3 10.3 10.3 10.3 10.4 10.5 10.5 10.6 10.6 10.7 Pct Chg Year Ago 8.1 7.3 4.3 1.6 0.8 0.1 -0.2 1.0 1.8 2.5 2.9 2.6 2.3 Leisure & Hospitality 7.6 8.0 8.1 8.5 8.5 8.7 8.8 8.8 8.7 8.7 8.7 8.7 8.7 Pct Chg Year Ago 15.3 13.6 18.2 20.5 11.5 8.9 8.9 4.1 2.7 0.7 -1.2 -1.1 -0.7 Other Services 2.5 2.6 2.6 2.6 2.6 2.5 2.5 2.5 2.5 2.6 2.6 2.6 2.6 Pct Chg Year Ago 4.5 2.2 2.4 4.7 1.4 -1.5 -3.4 -2.5 -1.5 0.9 2.4 3.3 3.9 Federal Government 0.3 0.3 0.3 0.3 0.3 0.3 0.3 0.3 0.3 0.3 0.3 0.3 0.3 Pct Chg Year Ago -8.2 -4.6 19.6 2.7 2.3 1.4 0.6 0.0 -0.5 -0.8 -0.8 -0.8 -0.6 State & Local Government 6.0 6.1 6.2 6.2 6.2 6.3 6.3 6.3 6.3 6.4 6.4 6.4 6.4 Pct Chg Year Ago 3.3 5.3 2.1 3.1 3.4 2.6 2.1 2.0 1.7 1.6 1.4 1.3 1.1
Other Economic Indicators
Population (Ths) 195.1 195.9 196.7 197.4 198.1 198.7 199.5 200.1 200.8 201.4 202.0 202.7 203.3 Pct Chg Year Ago 1.9 1.7 1.7 1.6 1.5 1.4 1.4 1.4 1.4 1.3 1.3 1.3 1.3 Labor Force (Ths) 76.3 77.2 77.8 78.2 78.3 78.5 78.7 78.8 78.8 78.8 78.7 78.6 78.5 Pct Chg Year Ago 5.6 5.0 4.2 3.7 2.6 1.7 1.1 0.9 0.6 0.4 0.0 -0.3 -0.3 Unemployment Rate (%) 4.5 4.4 4.2 4.1 4.0 4.1 4.1 4.1 4.1 4.2 4.2 4.1 4.1 Total Housing Starts 3867.5 3297.2 2879.1 2512.9 2239.5 2041.0 1851.1 1787.8 1758.9 1736.1 1723.0 1709.2 1702.0 Single-Family 3174.1 2688.0 2348.4 2050.3 1773.6 1576.7 1446.8 1392.2 1358.1 1337.6 1327.3 1309.7 1306.3 Multifamily 693.4 609.2 530.7 462.7 465.9 464.3 404.3 395.6 400.8 398.5 395.7 399.5 395.7
PROFILES
The Sebastian MSA is located in central east Florida and is comprised of the Indian River County. Sebastian is home to Pelican Island, America’s first National Wildlife refuge, and is known for its Atlantic-facing beaches.
QUICK FACTS
• Metro population estimate of 153,989 as of 2019 (5-Year Estimate) (U.S. Census Bureau). • Indian River County population estimate of 153,989 as of 2019 (5-Year Estimate) (U.S.
Census Bureau). • Civilian labor force of 68,473 in December 2021 (Florida Research and Economic Database). • An unemployment rate of 3.7% as of December 2021, not seasonally adjusted. This amounts to 2,567 unemployed people (Florida Research and
Economic Database).
OUTLOOK SUMMARIES
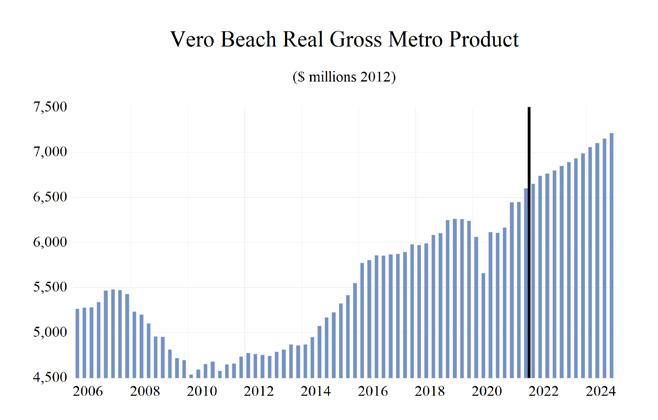
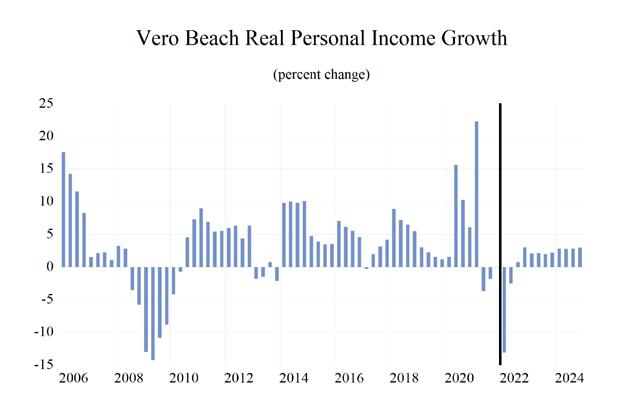
The Sebastian Metropolitan Statistical Area (MSA) is expected to show below-average growth in the economic indicators studied in this forecast. The MSA’s Gross Metro Product level will be at $6,800.36. Average annual wage growth of 4.9 percent will lead the average annual wage level to $60,300. The per capita income level of $82,500, the second highest in the state MSAs will be boosted by personal income growth of 5.6 percent. Population growth will be 1.2 percent.
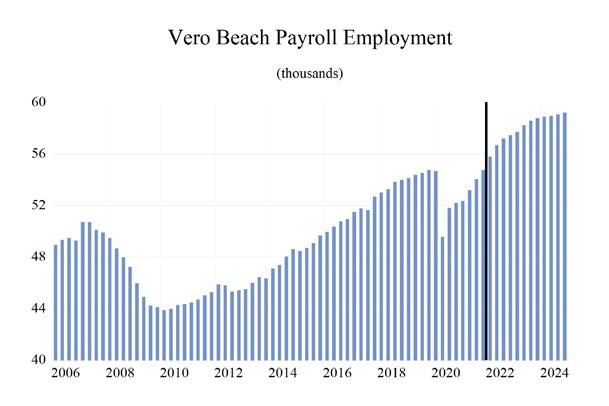
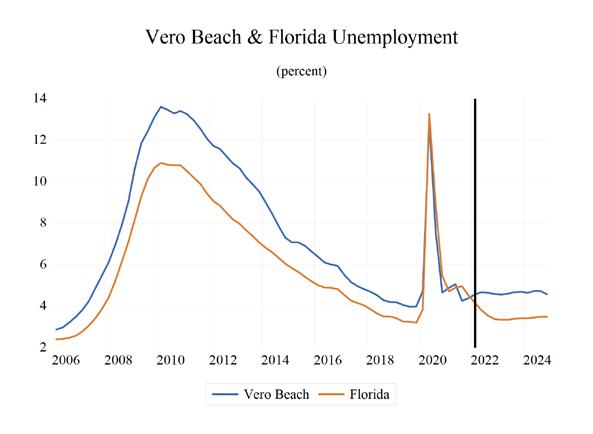
The Sebastian MSA will experience above average employment growth rate in the state at 3.2 percent annually. Sebastian’s unemployment rate should average 4.6 percent.
Leisure sector is expected to be the fastest growing sector in the area, averaging 10.0 percent growth annually. The Other Services sector will see the secondhighest average annual growth rate at 5.7 percent, followed by the Professional and Business Services at 4.5 percent.
METRO NEWS SUMMARIES
Sebastian annexes land for commercial and lowdensity residential
• With the cooperation of the landowners, the
Sebastian City Council approved the initial vote to annex nearly 60 acres of land to expand the city of Sebastian. • Much of the property is commercial. However, the approval was also for mixed-use and low-density residential, compatible with its surrounding uses. There are some plans to build a new apartment complex providing 220 units, with 20% of them becoming affordable housing, • The process involved four annexation requests.
There will soon be a public hearing and a second vote to make it official. Source: Sebastian Daily, December 22, 2021
Indian River County hotels beat pre-pandemic occupancy rates in 2021
• Tourists and visitors filled the inns at rates higher than the pre-pandemic year 2019, according to a private firm that tracks such data. • “Our occupancy rate is way up,” said Christy
Heskel, co-owner of Island View Cottages along Indian River Drive in Sebastian. “People are attracted to this 4-mile strip along the river where we’re at. And Coastal Living magazine has
Sebastian among its top 10 places to visit.” • In Indian River in 2021, that happened, with a 66.7% occupancy rate, beating the 53% rate in 2020. But last year’s occupancy rate was also slightly better than 2019, which was 65.9%, according to STR, which has hospitality data. Source: TCPalms, January 28, 2022
Sebastian decides how to use $3.3 million in federal pandemic funds
• The City Council held the first of two meetings to get input from residents about how to spend the pandemic-relief money. About $1.66 million already has been received by the city, with the second payment scheduled due May 19. • Resident Susan Lorusso, a former city employee, said the funds should go to current employees who worked hard during the pandemic. “The city employees have been through a lot,” said
Lorusso. “And while I didn’t work here during the pandemic, I can just imagine what they must have been going through.” • “There are a lot of things that need to be done in the city, especially over the next few years,”
McPartlan said. “Inflation’s going up, every project we do in the city is costing more. I love hearing some concrete ideas that we can look at because we have to look at our priorities and allocate it that way.” Source: TCPalms, January 27, 2022
Vacation resort to be transformed into affordable housing on Treasure Coast
• Non-profit organization, “The Source,” has purchased an old vacation resort which is now being turned into affordable housing to help combat the issue of sky-rocketing rental rates in the region. • “Once we discovered this beautiful parcel of land located minutes away from Sebastian’s Riverfront
District (in between U.S. One and Indian
River Drive), we knew this was meant to be our long-awaited Dignity Village,” said Anthony
Zorbaugh, Executive Director of a local homeless shelter. “This is our first foray into affordable housing for those in our community in need of having a roof over their heads.” • The individual air-conditioned units will be repainted indoors and outdoors, fully furnished with new furniture and appliances, towels and linens, well-equipped kitchenettes, flat-screen
TVs, and high-speed Wi-Fi. Source: CBS 12, February 2, 2022
Florida Gov. Ron DeSantis awards $750k infrastructure grant to Fellsmere
• Florida Gov. Ron DeSantis visited Indian River
County to award an infrastructure grant to the city of Fellsmere. • Speaking at CJ Cannon’s restaurant, located at 3414 Cherokee Drive in Vero Beach, the governor announced a $750,000 grant through the state’s “Rural Infrastructure Fund.” • The money will be used to accommodate new industrial business by extending the sewer systems at the Commerce Parks. Source: WPTV, February 28, 2022
Pipeline finally will bring natural-gas service to Indian River County’s barrier island
• Construction is set to begin as early as this summer on an 11½-mile natural gas pipeline to
Orchid Island, the last barrier island on Florida’s east coast without natural gas service. • Natural gas is considered an alternative to electricity and propane and is used by both residential and commercial customers to heat buildings and water, operate refrigeration and cooling equipment, cook, dry clothes, fuel backup generators and provide outdoor lighting. • Natural gas is already available in most communities in Indian River County including
Fellsmere, Sebastian, and Vero Beach, and demand for the service is at an all-time high with many new developments such as the Spirit of Sebastian community receiving natural gas service. Source: TCPalm, March 4, 2022
Sebas�an-Vero Beach MSA Industry Loca�on Quo�ents
Total Nonagricultural Employment
Total Private
Goods Producing
Service Producing
Private Service Providing
Mining, Logging, and Construc�on
Manufacturing
Trade, Transporta�on, and U�li�es
Wholesale Trade
Retail Trade
Transporta�on,Warehousing and U�li�es
Informa�on
Financial Ac�vi�es
Professional and Business Services
Educa�onal and Health Services
Leisure and Hospitality
Other Services
Government
0 0.2 0.4 0.6 0.8 1 1.2 1.4 1.6


Long Term Outlook for Sebastian-Vero Beach, FL March 2022 Forecast
2017 2018 2019 2020 2021 2022 2023 2024 2025
Personal Income (Billions $)
Total Personal Income 11.6 12.6 13.3 13.8 14.8 15.2 16.1 17.1 18.0
Pct Chg Year Ago Wages and Salaries
6.6 8.4 5.9 3.4 7.4 2.9 6.2 5.8 5.5 2.4 2.6 2.7 2.7 3.1 3.4 3.6 3.8 4.0 Nonwage Income 9.2 10.0 10.6 11.0 11.7 11.8 12.6 13.3 14.1 Real Personal Income (12$) 11.6 12.3 12.7 13.0 13.4 13.2 13.8 14.3 14.8 Pct Chg Year Ago 6.4 6.1 3.4 2.3 3.1 -1.3 4.4 3.8 3.4 Per Capita Income (Ths) 75.7 80.8 84.2 85.6 90.5 92.2 96.8 101.3 105.8 Real Per Capita Income (12$) 75.6 78.9 80.3 80.8 82.0 80.2 82.7 85.0 87.0 Average Annual Wage (Ths) 46.5 47.8 49.2 52.5 57.2 59.4 60.9 63.6 66.4 Pct Chg Year Ago 1.0 2.8 2.8 6.8 8.8 3.9 2.5 4.4 4.5
Establishment Employment (Place of Work, Thousands, SA)
Total Employment 51.9 53.5 54.4 52.1 53.6 56.8 58.3 59.0 59.3 Pct Chg Year Ago 2.8 3.1 1.7 -4.4 2.9 6.0 2.7 1.2 0.5 Manufacturing 2.0 2.2 2.3 2.2 2.2 2.3 2.4 2.4 2.3 Pct Chg Year Ago 4.4 12.8 4.9 -6.2 1.8 4.0 2.4 0.6 -1.2 Nonmanufacturing 49.9 51.3 52.1 49.9 51.4 54.5 56.0 56.7 57.0 Pct Chg Year Ago 2.7 2.8 1.6 -4.3 3.0 6.1 2.7 1.2 0.6 Construction & Mining 4.0 4.3 4.5 4.4 4.8 5.0 4.9 4.8 4.7 Pct Chg Year Ago 7.6 6.9 3.7 -0.9 7.6 4.4 -1.1 -2.5 -1.3 Trade, Trans, & Utilities 10.4 10.8 10.6 10.4 10.5 10.8 10.7 10.5 10.4 Pct Chg Year Ago 2.0 3.7 -1.8 -1.7 0.9 3.3 -0.8 -2.0 -1.6 Wholesale Trade 0.8 0.9 0.9 1.0 1.0 1.1 1.1 1.1 1.2 Retail Trade 8.7 9.0 8.7 8.5 8.5 8.7 8.5 8.2 7.9 Trans, Wrhsng, & Util 0.8 0.9 0.9 0.9 0.9 1.0 1.1 1.2 1.3 Information 0.6 0.6 0.6 0.5 0.5 0.5 0.5 0.5 0.6 Pct Chg Year Ago 0.0 0.0 -5.6 -11.3 -0.5 4.3 0.1 3.4 5.5 Financial Activities 2.6 2.7 2.8 2.7 2.7 2.8 2.9 2.9 3.0 Pct Chg Year Ago -1.9 2.3 3.4 -0.7 -0.9 4.4 2.2 1.7 1.1 Prof & Business Services 5.9 6.2 6.5 6.2 6.6 6.9 7.1 7.4 7.5 Pct Chg Year Ago 4.9 5.2 4.2 -4.4 7.8 4.0 3.3 3.2 1.8 Educ & Health Services 10.4 10.5 10.9 10.8 10.9 11.1 11.2 11.5 11.8 Pct Chg Year Ago 2.0 1.1 4.0 -0.9 0.6 2.3 0.9 2.8 2.4 Leisure & Hospitality 8.1 8.1 8.3 7.0 7.6 9.0 10.0 10.2 10.1 Pct Chg Year Ago 3.8 1.0 2.4 -15.8 7.9 19.4 10.6 2.0 -1.1 Other Services 2.7 2.9 2.8 2.7 2.7 3.0 3.1 3.3 3.5 Pct Chg Year Ago 0.9 4.0 -2.9 -4.4 2.3 9.9 4.8 5.9 5.6 Federal Government 0.4 0.4 0.4 0.4 0.4 0.4 0.4 0.4 0.4 Pct Chg Year Ago 17.7 -6.8 9.6 4.9 -5.0 3.5 2.2 0.6 0.0 State & Local Government 4.9 4.9 4.9 4.8 4.7 4.9 5.0 5.0 5.0 Pct Chg Year Ago 0.5 1.8 -0.8 -2.6 -1.3 3.1 2.7 0.9 0.2
Other Economic Indicators
Population (Ths) 152.9 155.4 158.0 160.6 163.2 164.8 166.8 168.6 170.4 Pct Chg Year Ago 1.8 1.7 1.6 1.7 1.6 1.0 1.2 1.1 1.0 Labor Force (Ths) 63.9 64.9 65.7 64.2 66.4 69.8 70.7 70.9 70.9 Pct Chg Year Ago 2.4 1.6 1.2 -2.3 3.4 5.2 1.4 0.3 -0.1 Unemployment Rate (%) 5.1 4.4 4.0 7.5 4.6 4.6 4.6 4.7 4.6 Total Housing Starts 1112.3 1294.0 1449.1 1133.6 1282.8 1226.8 1418.4 1469.9 1453.7 Single-Family 1108.8 1255.7 1413.8 1125.3 1282.6 1210.5 1272.5 1252.5 1232.2 Multifamily 3.5 38.3 35.3 8.3 0.2 16.3 146.0 217.3 221.5


