12 minute read
Orlando–Kissimmee–Sanford....................................................... 90


Short Term Outlook for Orlando-Kissimmee-Sanford, FL March 2022 Forecast
2022:1 2022:2 2022:3 2022:4 2023:1 2023:2 2023:3 2023:4 2024:1 2024:2 2024:3 2024:4 2025:1
Personal Income (Billions $)
Total Personal Income 140.6 143.7 146.3 148.7 151.2 153.6 156.2 158.6 161.5 164.1 166.8 169.4 172.3 Pct Chg Year Ago -1.0 5.6 6.3 6.4 7.6 7.0 6.7 6.6 6.8 6.8 6.8 6.8 6.7 Wages and Salaries 84.0 86.6 88.5 90.7 92.5 94.3 96.1 97.8 99.5 101.2 102.9 104.6 106.3 Nonwage Income 56.6 57.1 57.8 58.1 58.7 59.3 60.1 60.9 62.0 62.9 63.8 64.8 66.0 Real Personal Income (12$) 119.0 120.9 122.6 124.1 125.7 127.1 128.7 130.1 131.8 133.3 134.8 136.3 137.8 Pct Chg Year Ago -6.3 0.9 2.4 3.7 5.6 5.1 5.0 4.8 4.8 4.8 4.8 4.7 4.6 Per Capita Income (Ths) 51.3 52.2 53.0 53.6 54.3 55.0 55.7 56.3 57.1 57.7 58.4 59.1 59.9 Real Per Capita Income (12$) 43.4 44.0 44.4 44.8 45.2 45.5 45.9 46.2 46.6 46.9 47.2 47.6 47.9 Average Annual Wage (Ths) 65.4 66.4 67.0 67.4 67.9 68.4 69.0 69.6 70.2 70.9 71.5 72.1 72.8 Pct Chg Year Ago 6.2 4.4 3.9 3.7 3.8 2.9 3.0 3.2 3.5 3.6 3.7 3.7 3.6
Establishment Employment (Place of Work, Thousands, SA)
Total Employment 1279.3 1298.6 1316.9 1339.6 1358.4 1374.8 1388.5 1400.3 1411.8 1423.5 1435.0 1445.9 1455.8 Pct Chg Year Ago 9.1 8.2 6.4 6.3 6.2 5.9 5.4 4.5 3.9 3.5 3.3 3.3 3.1 Manufacturing 48.9 49.1 49.1 49.5 49.5 49.8 50.0 50.2 50.3 50.4 50.5 50.6 50.6 Pct Chg Year Ago 3.4 5.8 3.0 1.8 1.1 1.5 1.9 1.5 1.7 1.3 1.0 0.7 0.4 Nonmanufacturing 1230.4 1249.5 1267.8 1290.1 1308.9 1325.0 1338.5 1350.1 1361.5 1373.0 1384.5 1395.3 1405.2 Pct Chg Year Ago 9.3 8.3 6.6 6.5 6.4 6.0 5.6 4.6 4.0 3.6 3.4 3.4 3.2 Construction & Mining 90.2 90.3 90.4 90.5 90.6 90.7 90.7 91.0 91.4 91.9 92.3 92.9 93.6 Pct Chg Year Ago 5.9 7.7 4.7 0.8 0.5 0.5 0.4 0.6 0.9 1.2 1.7 2.0 2.4 Trade, Trans, & Utilities 246.6 250.1 250.4 247.3 246.9 250.1 250.2 251.5 251.1 248.7 248.6 248.5 248.4 Pct Chg Year Ago 7.3 9.2 6.3 1.8 0.2 0.0 -0.1 1.7 1.7 -0.6 -0.7 -1.2 -1.1 Wholesale Trade 47.4 48.0 50.0 50.7 51.4 51.5 51.8 52.4 53.2 54.0 54.5 55.1 55.7 Retail Trade 150.0 152.2 149.1 145.0 143.3 146.4 145.9 146.1 144.2 140.3 139.3 138.1 136.8 Trans, Wrhsng, & Util 49.2 49.9 51.2 51.6 52.3 52.2 52.5 53.0 53.7 54.4 54.8 55.3 56.0 Information 25.6 25.7 25.9 26.3 26.6 26.9 26.5 26.2 26.4 26.8 27.1 27.3 27.6 Pct Chg Year Ago 4.3 6.3 3.8 4.1 3.9 4.7 2.1 -0.3 -0.7 -0.3 2.4 4.2 4.6 Financial Activities 81.1 81.8 83.5 83.6 83.8 82.9 82.8 83.0 83.7 84.3 84.8 85.2 85.6 Pct Chg Year Ago 5.7 7.5 5.4 4.2 3.3 1.4 -0.9 -0.7 -0.1 1.7 2.4 2.6 2.4 Prof & Business Services 234.4 239.6 246.1 250.3 256.1 258.8 261.9 266.3 271.3 275.4 278.5 281.5 285.0 Pct Chg Year Ago 9.7 12.5 10.5 9.4 9.3 8.0 6.4 6.4 5.9 6.4 6.3 5.7 5.0 Educ & Health Services 167.8 169.5 170.8 170.3 170.9 171.2 172.1 172.9 174.2 175.3 176.2 176.8 177.7 Pct Chg Year Ago 6.6 6.0 3.9 2.0 1.8 1.0 0.8 1.5 2.0 2.4 2.3 2.2 2.0 Leisure & Hospitality 209.1 215.3 222.0 242.4 253.7 263.7 273.5 277.6 281.0 287.5 293.2 298.4 301.5 Pct Chg Year Ago 21.1 5.9 8.2 19.6 21.3 22.5 23.2 14.5 10.8 9.0 7.2 7.5 7.3 Other Services 45.2 45.9 46.9 47.0 47.2 46.9 47.0 47.0 47.3 47.6 47.8 48.1 48.4 Pct Chg Year Ago 14.5 8.8 5.1 5.1 4.5 2.2 0.1 0.0 0.1 1.4 1.9 2.2 2.3 Federal Government 15.9 15.8 15.8 15.8 15.8 15.8 15.9 15.9 16.0 16.1 16.1 16.2 16.3 Pct Chg Year Ago 2.5 6.0 5.9 -0.8 -0.3 0.0 0.4 0.9 1.2 1.5 1.6 1.7 1.8 State & Local Government 114.6 115.5 116.1 116.6 117.2 117.7 117.9 118.5 119.0 119.5 120.0 120.4 121.1 Pct Chg Year Ago 3.7 7.8 3.6 2.2 2.2 2.0 1.6 1.7 1.6 1.5 1.8 1.6 1.8
Other Economic Indicators
Population (Ths) 2740.7 2750.7 2761.6 2772.9 2783.4 2794.4 2805.8 2817.9 2830.0 2841.9 2853.8 2865.8 2878.0 Pct Chg Year Ago 1.3 1.3 1.4 1.5 1.6 1.6 1.6 1.6 1.7 1.7 1.7 1.7 1.7 Labor Force (Ths) 1352.2 1365.0 1377.8 1389.8 1400.3 1410.8 1420.6 1429.7 1437.1 1445.5 1454.4 1463.8 1472.7 Pct Chg Year Ago 6.4 5.4 4.1 3.6 3.6 3.4 3.1 2.9 2.6 2.5 2.4 2.4 2.5 Unemployment Rate (%) 4.2 3.8 3.5 3.3 3.3 3.3 3.3 3.3 3.4 3.4 3.5 3.5 3.6 Total Housing Starts 32658.0 30942.7 29945.3 28814.8 27961.0 27331.7 26894.0 26572.7 26293.0 26065.5 26041.2 26066.0 26105.4 Single-Family 19823.9 19731.2 19957.4 19809.2 19570.4 19355.5 19267.3 19328.5 19186.8 19089.8 19134.3 19085.3 19185.0 Multifamily 12834.1 11211.5 9987.9 9005.5 8390.7 7976.2 7626.7 7244.3 7106.2 6975.8 6906.9 6980.7 6920.4
PROFILES
The Palm Bay–Melbourne–Titusville MSA is comprised of Brevard County only. Typically known as “Florida’s Space Coast”, this area is home to the Kennedy Space Center. Located in the central part of Florida’s east coast, the region is home to Cape Canaveral Air Force Base, Patrick Air Force Base, and government contractors such as Harris Corporation. Like much of Florida, this area is growing fast; Port Canaveral is now a leading cruise ship port.
QUICK FACTS
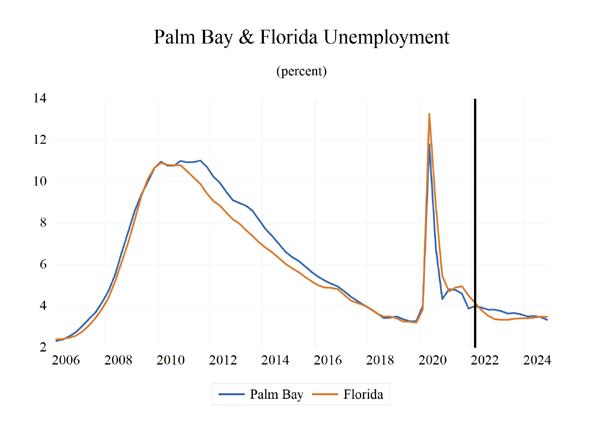
• Metro population estimate of 585,507 as of 2019 (5-Year Estimate) (U.S. Census Bureau). • Brevard County population estimate of 601,942 as of 2019 (5-Year Estimate) (U.S. Census Bureau). • Civilian labor force of 299,527 in December 2021 (Florida Research and Economic Database). • An unemployment rate of 3.2% as of December 2021, not seasonally adjusted. This amounts to 9,613 unemployed people (Florida Research and
Economic Database).
OUTLOOK SUMMARIES
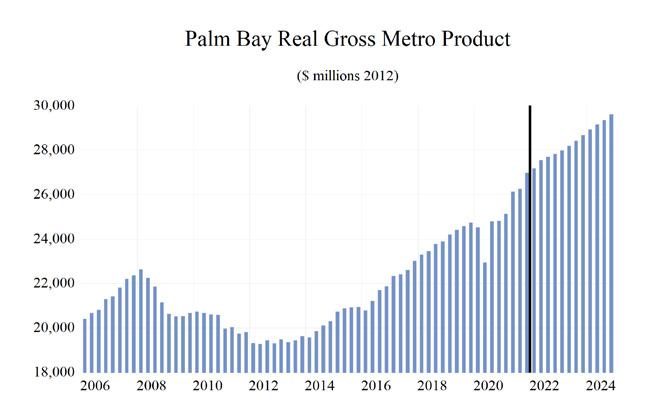
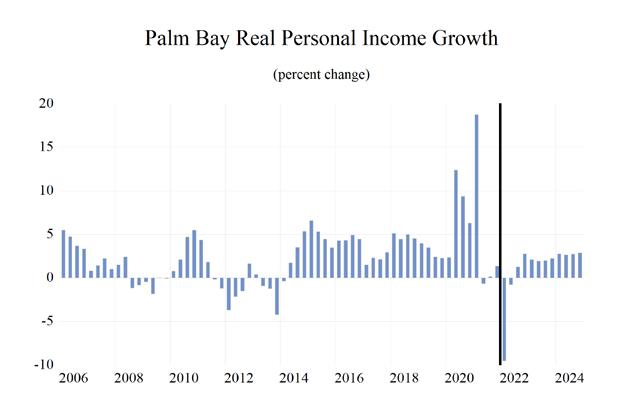
The Palm Bay—Melbourne—Titusville Metropolitan Statistical Area (MSA) will show moderate growth in the studied economic indicators when compared to other MSAs. The MSA will have the eleventh-highest Gross Metro Product at $27,823.05. Average annual wage growth will average 5.2 percent, leading to the seventh-highest average annual wage of $69,100. Personal income growth will average 5.8 percent, leading to a per capita income level of $49,900. Population growth will expand at an average annual rate of 0.8%.
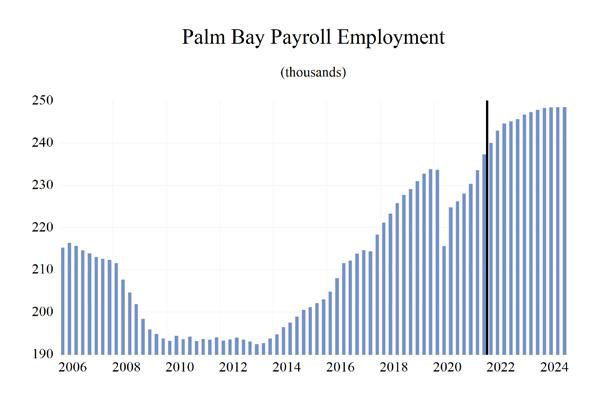
Employment growth will average 2.5 percent. Palm Bay’s unemployment rate will hover around 3.9 percent.
The leisure sector will lead the way in Palm Bay with an average annual growth rate of 7.9 percent. The Financial Services sector will follow with a growth rate of 4.0 percent, and Other Services will be third at 3.2 percent average annual growth.
METRO NEWS SUMMARIES
Palm Bay City Council Approves Commercial Property Enhancement Program
• The Palm Bay City Council approved the
Commercial Property Enhancement Program, which is a grant that aims to encourage private investment. • The hope is that through this program, the city can improve its street view making the area more competitive and attractive to new businesses. • The grant is only available to commercial properties that have frontage along specific roads. Source: Space Coast Daily, December 7, 2022
Palm Bay-Melbourne ranks No. 3 in growth among U.S. cities in new U-Haul study
• In a study that ranked the top 25 growth cities in the nation by measuring the one-way U-Haul trucks entering the area as compared to those leaving the area, Palm Bay-Melbourne came in third. • Kissimmee-St. Cloud took first place. • The number of one-way U-Haul trucks coming into Palm Bay-Melbourne increased 32% from last year. Source: Florida Today, January 4, 2022
City of Palm Bay Soliciting Public Input on Use of $18 Million American Rescue Plan Act Funding
• The City of Palm Bay is seeking input on how to allocate the American Rescue Plan Act funding, so that it can be used to address homelessness and the affordable housing crisis. • In June 2021, the City received $9,004,932.50 and is expected to receive the next allotment in
June 2022. • They will use the proposals as a guide for potential projects. Source: Space Coast Daily, February 25, 2022
Space balloon company to bring 240 jobs to Brevard County
• Space Perspective announced it would make a $38 million investment that projects the creation of 240 full-time permanent jobs in Brevard
County by the end of 2026. • The company said the annual average wage would be $80,000 and hiring will continue through 2022. • Central to Space Perspective’s plans is the construction of a $9 million, 120,000 square foot manufacturing building projected to be up and running within 24 months. Source: Orlando Sentinel, December 17, 2021
‘Project Griffin’ seeks to invest $300 million into Melbourne spacecraft facility
• Discussed during a Space Florida board meeting,
“Project Griffin” intended to invest more than $300 million “in new construction and highvalue equipment and tooling.” • The company would also create about 2,100 jobs by the end of 2025 with an average annual wage of $84,000 plus benefits. • Space Florida would then intend to sublease the 60 acres to the company behind Project Griffin to develop and construct a commercial spacecraft and constellation facility. Source: News 13, January 26, 2022
Space Coast Office of Tourism to launch $1.1M marketing campaign this month
• The Space Coast Office of Tourism said tourism development tax revenue paid for a lot of local projects, including park improvements and beach renourishment. • The office of tourism is launching a new $1.1 million marketing campaign this February hoping to break some tourism records. • At the end of last year, tourism development tax revenue was higher than before the pandemic.
With recent rocket launches boosting the local economy. Source: WFTV, February 1, 2022
Canaveral Port Authority Officials Break Ground on Cargo Berth Project
• The Canaveral Port Authority joined with business and space industry representatives, and ceremonially broke ground on a massive $48M project to rebuild Port Canaveral’s North Cargo
Berth 3 (NCB3). • As stated by Capt. John Murray, Port Director and CEO: “This berth project is critical to expand our abilities to accommodate a growing and very diverse cargo business portfolio. After a couple of difficult years, it’s great to be back and, once again, building our future on a solid foundation of current business and a wide horizon of new opportunities.” • The Florida Department of Transportation (FDOT) is supporting the project with $33 million in state grant funding, the other $14 million was awarded from the USDOT. Source: Hometown News, March 31, 2022
Palm Bay - Melbourne - Titusville MSA Industry Loca�on Quo�ents
Total Nonagricultural Employment
Total Private
Goods Producing
Service Producing
Private Service Providing
Mining, Logging, and Construc�on
Manufacturing
Trade, Transporta�on, and U�li�es
Wholesale Trade
Retail Trade
Transporta�on, Warehousing and U�li�es
Informa�on
Financial Ac�vi�es
Professional and Business Services
Educa�onal and Health Services
Leisure and Hospitality
Other Services
Government
0 0.5 1 1.5 2 2.5 3 3.5
Long Term Outlook for Palm Bay-Melbourne-Titusville, FL March 2022 Forecast
2017 2018 2019 2020 2021 2022 2023 2024 2025
Personal Income (Billions $)
Total Personal Income 25.8 27.5 29.2 31.3 34.3 35.4 37.1 39.2 41.3
Pct Chg Year Ago Wages and Salaries
6.4 6.3 6.3 7.4 9.4 3.2 5.0 5.4 5.4 11.3 12.1 13.0 13.6 15.3 16.8 17.5 18.3 19.2 Nonwage Income 14.5 15.4 16.1 17.8 19.0 18.6 19.7 20.8 22.1 Real Personal Income (12$) 24.5 25.7 27.4 29.1 30.5 30.3 31.2 32.3 33.4 Pct Chg Year Ago 4.4 4.9 6.7 6.1 5.1 -0.9 3.2 3.5 3.3 Per Capita Income (Ths) 43.9 46.1 48.5 51.5 55.7 57.1 59.5 62.2 65.0 Real Per Capita Income (12$) 41.6 43.2 45.6 47.8 49.6 48.9 50.0 51.3 52.5 Average Annual Wage (Ths) 51.9 53.2 55.6 59.6 65.0 68.3 70.0 72.9 76.2 Pct Chg Year Ago 3.7 2.5 4.6 7.3 9.0 5.0 2.6 4.1 4.5
Establishment Employment (Place of Work, Thousands, SA)
Total Employment 215.3 224.5 231.7 225.0 232.3 243.2 246.9 248.4 248.7 Pct Chg Year Ago 2.9 4.3 3.2 -2.9 3.2 4.7 1.5 0.6 0.1 Manufacturing 23.7 25.8 27.4 28.8 30.0 30.3 30.0 29.9 29.5 Pct Chg Year Ago 6.0 8.9 6.1 5.2 4.1 1.0 -0.9 -0.3 -1.2 Nonmanufacturing 191.6 198.7 204.3 196.2 202.3 212.9 216.9 218.5 219.1 Pct Chg Year Ago 2.6 3.7 2.8 -3.9 3.1 5.2 1.9 0.8 0.3 Construction & Mining 13.4 14.9 15.4 16.1 16.8 17.0 17.0 16.5 16.0 Pct Chg Year Ago 7.4 10.9 3.7 4.1 4.5 1.4 -0.1 -3.0 -3.0 Trade, Trans, & Utilities 36.5 37.8 38.2 37.0 38.6 39.7 39.1 38.2 37.8 Pct Chg Year Ago -0.3 3.7 1.0 -3.1 4.3 2.7 -1.4 -2.2 -1.0 Wholesale Trade 4.6 5.0 5.3 5.2 5.3 5.4 5.7 6.0 6.3 Retail Trade 28.2 28.6 28.4 27.5 28.9 29.4 28.2 26.9 26.0 Trans, Wrhsng, & Util 3.7 4.2 4.6 4.3 4.4 4.9 5.1 5.4 5.6 Information 2.6 2.6 2.4 1.9 1.9 1.9 1.9 2.0 2.1 Pct Chg Year Ago 10.6 -0.6 -7.1 -20.0 -3.1 4.4 -0.3 2.7 4.9 Financial Activities 8.0 8.6 8.6 8.8 9.1 9.3 9.5 9.7 9.9 Pct Chg Year Ago 5.5 6.4 0.8 2.2 3.2 2.2 2.3 2.1 1.5 Prof & Business Services 31.9 33.0 35.2 36.6 38.4 40.8 41.6 42.4 42.8 Pct Chg Year Ago 6.9 3.5 6.6 3.8 5.1 6.1 2.0 1.9 1.0 Educ & Health Services 35.6 36.9 38.3 35.3 35.6 37.2 37.7 38.6 39.3 Pct Chg Year Ago 0.9 3.5 3.8 -7.8 0.8 4.7 1.3 2.4 1.7 Leisure & Hospitality 26.9 27.9 28.6 24.1 26.2 30.2 32.6 33.0 32.6 Pct Chg Year Ago 2.1 3.5 2.6 -15.9 9.0 15.2 7.9 1.2 -1.0 Other Services 8.7 8.9 9.0 8.1 8.2 8.9 9.1 9.4 9.8 Pct Chg Year Ago 2.4 2.2 1.6 -10.6 1.9 8.1 2.0 3.3 4.4 Federal Government 6.3 6.3 6.4 6.7 6.8 6.8 6.7 6.7 6.7 Pct Chg Year Ago 0.7 -0.4 1.9 4.8 1.2 0.4 -1.7 -0.2 -0.2 State & Local Government 21.6 21.9 22.0 21.6 20.7 21.0 21.6 22.0 22.1 Pct Chg Year Ago 0.6 1.3 0.7 -1.7 -4.4 1.4 3.0 1.7 0.5
Other Economic Indicators
Population (Ths) 588.5 595.3 601.7 608.8 615.6 619.5 624.8 629.6 635.1 Pct Chg Year Ago 1.7 1.2 1.1 1.2 1.1 0.6 0.9 0.8 0.9 Labor Force (Ths) 268.6 276.4 283.9 281.6 294.0 306.2 312.7 314.4 316.0 Pct Chg Year Ago 2.0 2.9 2.7 -0.8 4.4 4.2 2.1 0.5 0.5 Unemployment Rate (%) 4.4 3.6 3.4 6.7 4.5 3.9 3.7 3.5 3.4 Total Housing Starts 2918.5 2758.2 3558.6 4181.4 4909.1 5638.0 4684.1 4316.1 4288.9 Single-Family 2292.8 2312.1 2517.7 3236.7 4181.3 4689.1 3815.8 3499.3 3454.0 Multifamily 625.7 446.1 1040.8 944.7 727.8 948.9 868.3 816.8 834.9


