rishikesh urban lab

 Investigating risk and resilience in Rishikesh
UEP_UDR 2015

Investigating risk and resilience in Rishikesh
We would like to thank a number of people for their time, support, and hospitality in facilitating our Urban Action Planning field trip to Rishikesh.
We are extremely grateful to the community members of Rishikesh who generously gave their time to speak with us during our visit. Without their engagement and enthusiasm to share their stories and knowledge, this report would not have been possible.
We would like thank our home university, the Norwegian University of Science and Technology (NTNU) for this opportunity and our facilitators, Prof. David Sanderson, Prof. Moulshri Joshi, and Vilde Ulset (Course Assistant), for their support and guidance during our studies.
Further, we would like thank our partnering university, the School of Planning and Architecture (SPA) New Delhi, particularly for the interesting conference and events during the initial phase of our field trip in Delhi.

Additionally, we would also like to extend our thanks to our second partnering university, the Indian Institute of Technology (IIT) Roorkee, for an informative conference and visit to their campus. A special thanks also goes to the IIT students for their participation and enthusiasm during our combined mapping workshop.


Appreciation is given to SEEDS for their hospitality and support during our field trip. In particular, we would like to thank Anshu Sharma for his support and wise words, particularly during our times of stress.

Appreciation is also given to Kush Chowdhury for his support and advice during our ToR workshop.
Lastly, a special thanks to Parmarth Niketan for hosting us throughout our stay in Rishikesh and our inclusion in the ashram’s many activities.

Editors:
Cathleen Reilly (AUSTRALIA), Mariann Stensaas (NORWAY), Sylvia Green (CANADA), Tathabrata Bhattacharya(INDIA), Vaishali Aggarwal (INDIA), Kule Yosia (UGANDA)
Authors:
Aayushi Maheshwari (INDIA), Alejandra Madero(MEXICO), Bipul Nayak (INDIA), Cathleen Reilly (AUSTRALIA), Frederick Mugisa (UGANDA), Kokob Mezgebe Abera (ETHIOPIA), Leonardo Soria Hernandez (MEXICO), Magnus Nordal Hauken(NORWAY), Mariann Stensaas (NORWAY), Maxmilian Nawrath (GERMANY), Melisa Mundzic (SWEDEN), Mina Afsari- Rad (NORWAY), Mohammed Hamidul Hasan (BANGLADESH), Nicholas Clive Sanderson (ENGLAND), Preetam Pandey (NEPAL), Revi Bharathan (SINGAPORE), Susanne Støyle Alsaker (NORWAY), Sylvia Green (CANADA),Tripti Mahaseth (NEPAL), Tathabrata Bhattacharya(INDIA), Vaishali Aggarwal (INDIA), Weijun Zhang (CHINA), Kule Yosia (UGANDA).
Other contributors:
Students from Indian Institute of Technology (IIT) Roorkee: Akshar Mendhe; Ankita Choudhary; Chandan Bhagat; Deepa P; Kranti Kumar Maurya; Kuldeep; Mane Sanket; Mohammad Ahmad; Piyush Soni; Pradeep Kumar Kori; Ratna Ghosh; Riyan Habeeb; Surabhi Shandil; Vandana Patel
This report has been produced by students from: Norwegian University of Science and Technology (NTNU) NO-7491 Trondheim, Norway
© Copyright 2015
Cover page by Mina Afsari-Rad
India has been and is traditionally vulnerable to natural disasters on account of its unique geo-climatic conditions. Floods, droughts, cyclones, earthquakes and landslides are recurrent phenomena. About 60% of the landmass is prone to earthquakes of various intensities; over 40 million hectares are prone to floods; about 8% of the total area is prone to cyclones and 68% of the area is susceptible to drought.
Due to the above risks, disaster management in India is an ongoing national requirement, important to governments and people alike. Most prudently, the Government of India has put in place a law on disaster, the Disaster Management Act, 2005 which establishes a centralized authority to coordinate various disaster management efforts, mandates the States to develop State Disaster Management Plans, and provides the legal and institutional framework for disaster management in India among others. Further, this policy framework is in conformity with the International Strategy for Disaster Reduction, the Hyogo Framework 2005-2015 and the new Sustainable Development Goals (SDGs) 11 and 15.
As elaborated in SDG Target 15.4 “to ensure the conservation of mountain ecosystems, including their biodiversity, in order to enhance their capacity to provide benefits that are essential for sustainable development”, the Himalayas represent an area experiencing high vulnerability and resilience. The State of Uttarakhand, in which Rishikesh is located, has developed a Disaster Management Plan in 2014. Different projects have also been implemented under the Ganga Action Plan. However, with rapid urbanization inducing uncontrolled and densely populated settlements, there is an increasing number of people at risk in the hazard-prone areas.
In the conventional practice of intervention, the most prevalent thinking is that the solution has to come from professionals like engineers, planners, and architects etc, often ignoring a lot of local wisdom, ideas, insights and knowledge from the local community. A team of international and local students from the Norwegian University of Science and Technology (NTNU) and School of Planning and Architecture (SPA), New Delhi under the course Urban Action Planning have set out to investigate the alternative. Based in the town of Rishikesh, the students have conducted a study to learn from the everyday life experience of the city, engage with the community and as an outcome gather community voices to inform a set of recommendations.
These recommendations complement the ongoing concern for sustaining development process in the face of the periodic disasters that occur in India.
Prof. (Dr.) Vinod K. Sharma, Professor, Disaster Management, Indian Institute of Public Administration, New Delhi
This report is the result of five (5) weeks of fieldwork research conducted in Rishikesh, a small town in Northern India. The location of Rishikesh, with its position at the base of the Himalayas, was chosen as it was considered a good case for studying adaptation in a place demonstrating both high vulnerability and high resilience. With sustainable mountain development as one of the new 2015-2030 Sustainable Development Goals (SDGs), a case study in Rishkesh also represents a way to test how this goal can be realized. The major impact of the 2013 flood in Uttarakahand also provides the impetus for investigating the design and planning practices in the State.
The field trip was initiated by the Norwegian University of Technology and Science (NTNU) Norway, as part of the Master programme in Urban Development and Resilience/Urban Ecological Planning. Twenty (20) students from NTNU, a gapyear student, and four (4) students from different universities in India joined the team – in total, our team consisted of twentyfive (25) students from fourteen (14) different countries.
This report aims to understand and uncover the hidden layers that make up the city of Rishikesh. Our focus over the five (5) week research period was been on identifying the capacity and resilience the town has, in view of the risks and vulnerabilities it faces.
Methods involving participatory processes were a key focus, where the voices, knowledge, insights and the wisdom of the local community were given precedence. A key part of this process was playing the role of ‘urban detectives’ where students had to immerse themselves in the ‘messy reality’ of the urban environment and undertake real-time assessments of the on-the-ground conditions. Through participating in this process, we have developed critical self-awareness of our roles as urban practitioners in challenging environments –we have also gauged insights into the complexities of urban development and resilience.
As a result of this research, ten (10) recommendations have been developed. The key themes of the recommendations reflect focus areas that emerged from the different case studies during the fieldwork. Development and priorisitation of the recommendations occurred through a number of the bottomup approaches and democratic decision-making techniques. The final ten (10) recommendations were also validated by the local community at the final presentation day in Rishikesh. Each recommendation consists of incremental actions working at different levels that can be applied in the short, medium or long term. It is hoped that our recommendations can be beneficial and informative to the processes of disaster management, urban growth and development in Rishikesh.
To guide the fieldwork, a set of ten (10) Terms of Reference (ToRs) were given. The ToRs raise questions linked to risk, resilience, vulnerability and capacity in Rishikesh. These questions defined the purpose of the fieldwork and established a degree of accountability to the outcomes of our research. Through clustering the ToRs around the key themes above, the structure of the report was also established.
The ToRs are as follows:
1. What tensions and stresses underlie the calm and meditative surface of Rishikesh
2. What is the spatial and temporal landscape of risk and resilience?
3. Who are the most vulnerable and why?
4. Who are the major actors and what are their respective roles in increasing and/or decreasing vulnerability?
5. What can be done to reduce vulnerability in the short, medium and long term?
6. What measures to build resilience really work? Why do they work?
7. What are the various layers of the city to understand how risk is situated – its perception, its human dimension and its manifestation in the landscape?
8. What are the methods to effectively map risk and resilience in a context of change and scarcity of resources?
9. How does the city negotiate these risks?
10. Where does this negotiation or ‘resilience’ of the city lie in space?
Initially, a workshop was conducted to develop a better understanding of the ToRs as some of the formulations were complex or ambiguous. From this workshop, key issues and themes emerged – these are explored in more detail throughout the report.
Due to the limited timeframe of the research, our study does not cover the entire town of Rishikesh nor all the angles in which risk and resilience can be viewed. However, the emphasis of investigation has been placed on five (5) areas, which form the basis of the report case studies. The micro and meso level perspectives represented in these case studies have also provided a basis for linking to broader issues at a macro level. The areas and the process for determining them are further discussed in Chapter 7.
Due to the limited timeframe and difficulty in accessing base data and good internet connections, the level of secondary research and supporting information has been limited. However, this loss is considered a trade-off for having direct access to the local community and other key informants through which valuable, local knowledge was sourced.
Rishikesh…a hillside town at the base of the Himalayas – a place with deep ties to religion; a place where people seek themselves; a place where it is all about yoga. Or is it???
We are twenty-five students from fourteen different countries who have descended on Rishikesh as part of an urban planning studio. We seek answers to some big questions…what is the temporal and spatial landscape of risk and resilience?? Who are the most vulnerable??? What tensions and stresses lie beneath the calm and meditative surface of Rishikesh?
Our report tells the stories of different communities in Rishikesh. Through engaging with local citizens and hearing their stories, we have, as ‘urban detectives’, sought to uncover the “real” Rishikesh. We came to Rishikesh to investigate and piece together the different factors that contribute to risk and resilience in an urban landscape.
Our journey started with trying to understand the landscape –a landscape defined by multiple layers of the city that interact and overlap; that in turn, create new layers of complexity and highlight new ways of seeing. Through these layers, we have sought to understand ’The Existing Situation’. We found layers of transportation, of infrastructure systems and one very complicated governance structure.
With this new understanding (or lack of in many cases), we sought out more clues – clues that have highlighted tensions and stresses: between tourism and cultural heritage; between ecological systems and the built environment; in transportation and circulation; and from seasonal flooding to sudden rickshaw strikes.
Armed with these clues, we hoped to find more evidence of the ‘Vulnerabilities and Capacities’ that exist within the town and its citizens. We chose to assess the vulnerability of communities using the livelihoods framework. Our aim was to test the hypothesis that the absence of certain crucial assets makes communities more vulnerable and prone to risks.
Using some Participatory Rapid Appraisal (PRA) tools, we triangulated our initial assumptions via a survey of three settlements with varying levels of formality. The data supported our early assumptions and also revealed some similarities and exceptions between the different communities. These similarities and exceptions extended to the perception of hazards: for one settlement, seasonal flooding was a major concern. In the others, it was not a major concern. Unemployment, however, was a consistently high concern across all three settlements.
Additionally, we realised that it was not only important to find factors that contribute to vulnerability, but that we also need to understand the influence of major actors on creating this vulnerability. In Rishikesh, we found a wide spectrum of actors that influence the decisions and dynamics of the town. Importantly, many of these major actors operate outside the formal government structures and instead, function within other informal or religious systems.
In the consideration of ‘Risk and Resilience’ we used a causal loop diagram to introduce the dynamic relation of these two concepts – this relationship was expressed across time and space using an adapted risk assessment matrix to quantify vulnerability and capacity. The scatter graphs highlighted that the capacity or vulnerability of a person, household, or system varies across time and space, and also between different asset categories. It also highlighted the concentration of many factors at the settlement level and the human aspects at the individual level. The case study concluded with an important point to note – that when seeking to reduce vulnerability, both the shocks and ongoing stresses must be considered and addressed if communities are to stay above the ‘survival line’. These findings were further support by case study examples of everyday risk in term of waste and traffic management. In our investigations, we also uncovered many hidden dynamics linked to the ‘Negotiation of Risk’: that this negotiation occurs across different spectrums of time: from the everyday, to the periodic and by chance. This negotiation of risk also occurs across many different scales and spaces: the negotiation can lie with the individual or household; on the roads; on the land; in the abandoned spaces; on and by the water; and of course, in the temples and ashrams.
The amount of negotiation that people can perform depends on how resilient or capable a community or an individual has. This capability in turn depends on the degree to which the community has access to resources and is able to organise itself both prior to and during times of needs. The ‘measures of building resilience’ need to be both top-down and bottomup. There is a need to work across multiple levels and efforts should be made to embed disaster risk reduction across all aspects of governance, including the municipalities that are the grassroots governance bodies. It is important that the ability and responsibility of building capacities be distributed across multiple actors in both formal and informal governance structures in a time-bound fashion.
Ten (10) ‘Recommendations’ were also developed – these set out an incremental approach to reducing vulnerability over the short, medium and long term. The involvement of different actors in implementing these recommendations was also noted.
As a conclusion it can be said, that below the meditative state of Rishikesh there lies evidences of numerous issues some of which are very unique. The unique nature of issues demands unique interventions. While the city is focused to many projects, its overall character has remained that of a tourist-based economy - this increases the risks manifold with ramifications transcending borders. Hence, it is advisable that the government in partnership with the local community take actions and strengthen at the grassroots (inc. urban local bodies) to reduce vulnerability over time and thus being better prepared for any hazard.
Ten (10) recommendations have been developed based on our fieldstudy. These recommendations have been reached through a combination of means: through our on the ground research and findings; through intensive classbased workshops; through secondary research on other case studies; and most importantly, by reaching out to key informants and members of the local community.
Our ten (10) recommendations are:
1. Unify Rishikesh
All actors; local, national and international, including both local citizens and tourists, should take shared responsibility and work towards a common goal; the future development of Rishikesh
2. Take stock of the policies that already exist
Noting there is an existing body of policies that already target many of the core issues, priority should be given to building institutional capacity to assist in existing policy implementation and enforcement.
3. Map land tenure
A land tenure map should be developed and made accessible to the public in order to guide future development of the city; to identify public infrastructure that needs renewal; and to locate potential areas with capacity for city growth.
4. Get into the business of trash

Strengthen local waste management policies by targeting waste reduction, source segregation and recycling through financial incentives.
5. Pedestrianise the streets
Given the dominance of pedestrian movement on the bridges, specifically Ram and Lakshman Jhulla, and the market street on both sides of Ram Jhulla, designate these areas as pedestrian-only to increase security.
6. Break the poverty cycle through education
Encourage children to go to school regularly by offering economic incentives.
7. Build a better future through hands-on skills


Build capacity of the local population by providing start-up centres that create diverse economic opportunities; provide training; workspaces; and assistance in financing of microbusinesses based in skilled labour.
8. Provide city services to all inhabitants


Access to basic needs of all inhabitants should be guaranteed, regardless of their status and their land tenure.
9. Be ready for the next event
Disaster mitigation and risk reduction should be incorporated in everyday life at multiple levels; at policy as well as grass-roots, to build a culture of preparedness.
10. Make the risks visible
Communicate the existing physical risks through public signage and design solutions.
This report seeks to investigate the risk and resilience present in Rishikesh by uncovering the vulnerabilities and capacities that exist. The concept of Disaster Risk Reduction (DRR) underpins this investigation – through the findings of our research and our ten (10) recommendations, it is hoped that this report can contribute to DRR practice in Rishikesh and the Uttarakhand region.
The investigations have been undertaken with the help of Participatory Rapid Appraisal (PRA) tools along with other qualitative and quantitative methods of data collection and analysis. This bottom-up approach based on ground-level knowledge has been supported by existing literature and triangulated with government sources where possible. (Refer Chapter 7 for further information on research methodology applied)
Key terminology relevant to the study has been identified below. These definitions, developed by the United Nations International Strategy for Disaster Reduction (UNISDR) aim to “to promote common understanding and common usage of disaster risk reduction concepts and to assist the disaster risk reduction efforts of authorities, practitioners and the public.”
Disaster risk reduction: “The concept and practice of reducing disaster risks through systematic efforts to analyse and manage the causal factors of disasters, including through reduced exposure to hazards, lessened vulnerability of people and property, wise management of land and the environment, and improved preparedness for adverse events” (UNISDR 2009, pg. 10).
Hazard: “A dangerous phenomenon, substance, human activity or condition that may cause loss of life, injury or other health impacts, property damage, loss of livelihoods and services, social and economic disruption, or environmental damage” (UNISDR 2009, pg. 17).
Hazards may “… arise from a variety of geological, meteorological, hydrological, oceanic, biological, and technological sources, sometimes acting in combination” (UNISDR 2009, pg. 17).
Vulnerability: “The characteristics and circumstances of a community, system or asset that make it susceptible to the damaging effects of a hazard” (UNISDR 2009, pg. 30).
“There are many aspects of vulnerability, arising from various physical, social, economic, and environmental factors. Examples may include poor design and construction of buildings, inadequate protection of assets, lack of public information and awareness, limited official recognition of risks and preparedness measures, and disregard for wise environmental management. Vulnerability varies significantly within a community and over time” (UNISDR 2009, pg. 30).
Capacity: “The combination of all the strengths, attributes and resources available within a community, society or organization that can be used to achieve agreed goals” (UNISDR 2009, pg. 5).
“Capacity may include infrastructure and physical means, institutions, societal coping abilities, as well as human knowledge, skills and collective attributes such as social relationships, leadership and management. Capacity also may be described as capability” (UNISDR 2009, pg. 5).
Risk: “The combination of the probability of an event and its negative consequences” (UNISDR 2009, pg. 25).
“The word “risk” has two distinctive connotations: in popular usage the emphasis is usually placed on the concept of chance or possibility, such as in “the risk of an accident”; whereas in technical settings the emphasis is usually placed on the consequences, in terms of “potential losses” for some particular cause, place and period. It can be noted that people do not necessarily share the same perceptions of the significance and underlying causes of different risks” (UNISDR 2009, pg. 25).
Resilience: “The ability of a system, community or society exposed to hazards to resist, absorb, accommodate to and recover from the effects of a hazard in a timely and efficient manner, including through the preservation and restoration of its essential basic structures and functions” (UNISDR 2009, pg. 24).
“Resilience means the ability to “resile from” or “spring back from” a shock. The resilience of a community in respect to potential hazard events is determined by the degree to which the community has the necessary resources and is capable of organizing itself both prior to and during times of need” (UNISDR 2009, pg. 24).
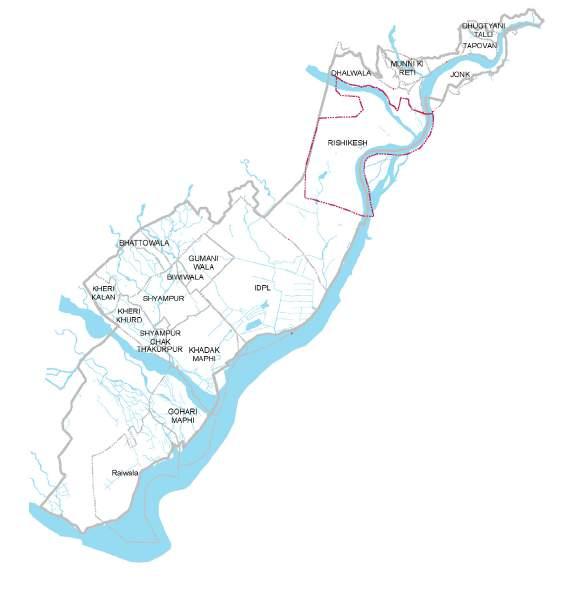
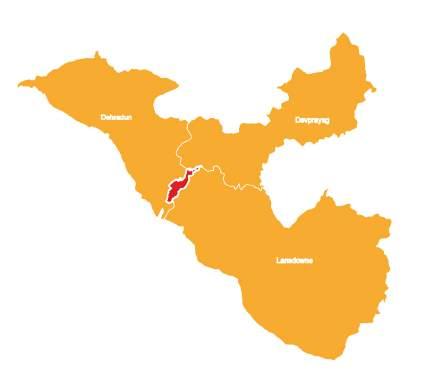
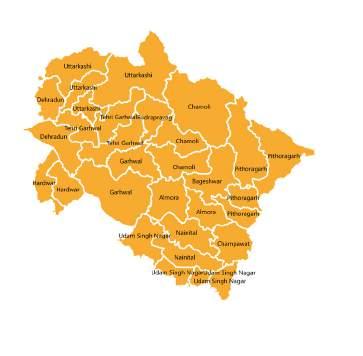
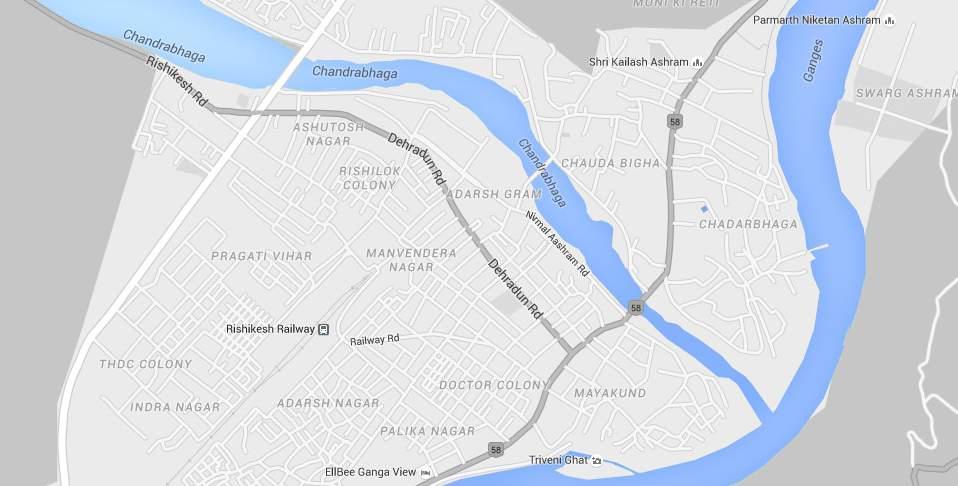
Rishikesh is located in the state of Uttarakhand, in the North West of India. It is surrounded by the Himalaya Mountains on three sides and has the holy River Ganga flowing through it.
The name Rishikesh is loosely applied to four (4) distinct sections encompassing the town as well as the hamlets and settlements on both sides of the Ganga River. These include Rishikesh itself, which is the commercial and communication hub; the sprawling suburban Muni-ki-Reti or the “sands of the sages”; the temple town Lakshman Jhula; and the assorted ashrams around Swarg Ashram on the East Bank. The city is governed by three districts: Dehradun, Pauri Garhwal, Tehri Garwal, and has a population of 102,000.
For more than a century, Rishikesh has been a pilgrimage destination central to Hinduism. In 1968, Rishikesh was put on the global map by The Beatles, when they stayed in the city for spiritual purposes for about two (2) months. In 2000 it became the ‘capital for yoga’, hosting the International Yoga Festival annually. On average, there is a floating population of thirty-thousand (30,000) pilgrims and tourists that come to the city every month (Mittal et al., 2008) They come to the area for the Holy Ganga, the many ashrams, yoga and meditation classes and to join outdoor activities such as hiking and rafting.
The Rishikesh area is within a highly seismic zone and subject to seasonal flooding along the Ganga River and other tributaries. These conditions make the region vulnerable to disasters like earthquakes, landslides and flooding. Of these hazards, the most notable in recent times has been flooding – the last major occurrence was in 2013 where the impacts of the flooding were described as “devastating” and “the worst flood in a hundred years” (Bhowmick 2013). Despite these vulnerabilities, the region has also demonstrated a high level of resilience, built through the communities and institutions that negotiate this risk. Since the 2013 floods, improving this resilience through disaster risk reduction and management has become a greater focus both within the Uttarakhand region and on the central government level (Business Standard 2013)
A timeline of the key events in the town’s history, particularly relating to the local case studies, are presented.
“The tragedy in Uttarakhand in June [2013], which caused large scale loss of life, property and public infrastructure, points not only to India’s vulnerability to disasters but also to the need to take effective measures to prevent them and contain their fallout when they occur…
It is also very important that we integrate and mainstream disaster risk reduction strategies into our mainstream initiatives… Our common endeavor should be to ensure that adequate capacities are built across our institutions and communities to reduce the adverse impact of disasters. While doing so, we also need to pay attention to the weaker sections of our society who are impacted by disasters in a disproportionately large manner”
(Business Standard 2013, quoting Prime Minister Manmohan Singh)
The structure of this report is based around a clustering of the ToRs. The first chapters of the report (1-7) present background information and seek to establish a basic understanding about the context (both the physical and theoretical).
Chapter 8 focuses on the existing situation, encompassing information developed in response to ToR 1 and 7 relating to the layers of the city and the tensions and stresses that underlie the “calm and meditative surface of Rishikesh”.
Chapter 9 draws on the two (2) settlement based case studies to answer ToR 3 and 4. Through these case studies, an assessment has been made using the Livelihood Model in order to determine the level of assets present relative to different levels of formality. This assessment is used to identify characteristics associated with the most vulnerable – in particular, the amount of resources the communities have in order to cope with a hazard or disaster. The major actors that contribute to creating vulnerable are also identified across the three different settlements.
Chapter 10 seeks to answer ToR 9, 10 and 2. The focus of this chapter is on the manifestation and negotiation of risk in time and space. Content derived from all five case studies are presented.
Chapter 11 focuses on reducing vulnerability over time. Firstly, aspects relating to disaster management practices are discussed, focusing on how different measures and approaches can be used to build resilience over time (ToR 6). ToR 5 is then addressed through information about the ten (10) recommendations proposed. This section includes a matrix that identifies the relevant actors involved in implementing the recommendations and breaks down the different steps that can be taken over time.
Chapter 12 focuses on the methods used to map risk and resilience in the development of this report (ToR 8)
Chapter 13 seeks to bring it all together and identify the key findings for each ToR.
Lakshman Jhula built1927
The ashram of Maharishi Mahesh Yogi was established. Later titled as ‘Beatles Ashram’ or ‘Chourasi Kutia’ (84 Huts)
The lease of Maharishi Mahesh Yogi’s ashram expired - it was reclaimed by the government as it was built on land belonging to the forest.
1961
1981
1980
The Government of India passed an act in the Parliament named ‘Forest Conservation Act, 1980’.
Construction of the Haridwar Highway
1983
3rd Settlement established in New Triveni Colony.
Khali Temple built at New Triveni Colony
ca. 1985
Around 820 sq. km forestland between the river Ganga and the Himalayas declared as ‘Rajaji National Park’ including the land of Maharishi Mahesh Yogi’s ashram.
Ram Jhula built Ganga Action Plan Phase I set in motion 1986
1990Formation of the Taxi Owners Association/Union
1994Beatles Ashram closed
Uttarakhand became an independent state - previously under Uttar Pradesh
First International Yoga Festival in Rishikesh
First public toilet built in New Triveni Colony (1st section)
Clean Himalya NGO was founded
Ganga Action Plan phase II started1993 2000
Proposed plans for highway and bridge next to Chandribhaga River ca. 1998
Rishikesh became a census town
ca. 2003
New Triveni Colony erased to ground2001 2006
Rafting businesses started to boom in Shivpuri 2003
June 16th - devastating floods hit the State of Uttarakhand
Garud Chatti Pull finished
The forest department makes decision to develop ‘Rajaji National Park’ as Nature Care Centre
The Beatles Ashram will be opened as a tourist attraction from 15th November
2013
Public toilets built at New Triveni Colony (2nd section) 2009
Second Temple built at New Triveni Colony2012
2015
Conversion of the Municipality of Swarg ashram into Nagar Panchayat
Swachh Bharat Abhiyan (Clean India Mission) was launched
Expected completion of the new bridge, Janki Pull (Sita Jhula)
Urban Action Planning is a Masters course that gives students the opportunity to study urban development and resilience practice by undertaking real-time assessments in a low or middle-income country. In 2015, the course is focused in Rishikesh, India – in previous years, the course has taken place in other countries such as Nepal and Uganda. Key learning outcomes of the course include the ability to: critically self-assess one’s own assumptions and beliefs concerning urban development and resilience practice; demonstrate an ability to work effectively in teams; and, judge which research skills and methods work in complex environments.
Collaboration with the Indian Government, local partner universities, NGOs and the local community is a key focus of the fieldwork. In 2015, the academic partnership is between the School of Planning and Architecture (SPA) in Delhi, the Indian Institute of Technology Roorkee (IIT Roorkee) and Norwegian University of Science and Technology (NTNU). Collaboration with SEEDS has also provided a valuable local link to India and Rishikesh. SEEDS is a non-profit organization “that seeks to protect the lives and livelihoods of people exposed to natural disasters and living in disaster prone areas” (SEEDS 2013).
A main aim of the course is to engage with local communities to better understand the complex urban environment through a bottom up approach. Simultaneous to this, however, engaging with different levels of Indian Government was necessary in order to critically analyse the situation from both a micro and macro perspective. The Indian Institute of Public Administration (IIPA) was also a key avenue for accessing local resources and networks.
We are twenty (20) students from NTNU, a gap-year student, and four (4) students from different universities in India – in total, our team consists of twenty-five (25) students from fourteen (14) different countries. Together we are the ‘Urban Detectives’. Our study backgrounds are within architecture, urban planning, landscape architecture, urban ecology and civil engineering. Each of us also brings knowledge from our own countries and work experience, providing a valuable resource and benefit of the team’s diversity. We have sought to learn from and share knowledge with the local community and other actors. Through this approach, we have tried to see the town of Rishikesh in new ways, connect different pieces of information and uncover the layers of the town the make it tick.


• Introducing Delhi Preparation
•Introduction (Lectures, observation)
•Site location&Focus
•ToR&PRA tools Practices
•Hard data collection (Interviews, survey, resources combination)
Secondary Research
•Data analysis (Case study)
•Planning for the real workshop
•Structure of the report
•Critique the methods (integrate the ToR questions)
•Data combination (from each group)
1st Week Delhi 2nd Week Rishikesh
3rd Week Rishikesh
4thWeek Rishikesh 5thWeek Rishikesh
The course time schedule has been divided into following four phases;
6thWeek Rishikesh
1. Preparation- First week was spent in Delhi with introduction to the city and preparation for field trip to Rishikesh. (1 week)
2. Primary research-Field trip and project introduction in Rishikesh through; Lectures about theory and methods, orientation walks and identifying focus areas. (2 weeks)
3. Secondary research- Introduction to mapping and collecting data using PRA tools. (2 weeks)
4. Analysis and report-Analysing case studies and combining information to one report. Ending the field trip with separate presentation to the public in Rishikesh and the county in Delhi. (2 weeks)
Participatory Rapid Appraisal (PRA)
Participatory Rapid Appraisal (PRA) is a commonly used method in participatory planning or action planning. It is an educational method for all individuals to learn, analyse and assess the challenges and opportunities and adopts attitudes towards projects & development programs. The PRA tools enable the research team to gather information in a rapid and organized way to be used in evaluating the needs of the habitants and analyse the general condition. PRA tools are particularly favourable because they offer; Flexibility, Triangulation and Participation. Flexibility refers to the ability to be used in a variety of environments; Triangulation is a method where information collected is cross-checked between different sources; and Participation in that it involves and engages the wider community in action planning and decision making (Chambers R. 1992).[ Luigi Cavestro.(2003). P.R.A. - Participatory Rural Appraisal Concepts
PFR is a participatory process for community to quickly find easy solutions for local problems. It is a ‘nationally recognized community planning process based on a 3D model, which allows residents to register their views on a range of issues, to work together to identify priorities, and in partnership with local agencies go on to develop and action plan for change’ [Works]. At the stage of primary and secondary research along with final discussion among 20 students, the research groups attended PFR workshop to figure out the recommendations based on the findings. The recommendations were sorted out based on case study of each group and combined with all information to sum up the final ten recommendations given in this report which are the result of ntegration of the outcomes of three PFR workshops.
Mapping- Interactive and involves community to map in different layers; physical, social characteristics, individual drawings or identifying local organisations and their interactions
Observing- Most of information is collected by “watching” and is a more relaxed tool that invites interaction.


Daily schedule- Time related data collection.
Seasonal calendar- Identifies seasonal trends within communities and periods of stresses and vulnerability


Notes-To avoid memory bias it’s important that team members take notes during activities.
Sketching- Engaging tool


Survey- Quantitate data supports statements and observations
Transect walks- Observations, interactions and mobile interviews can be held. Asking questions related to what is being seen while walking through communities.
Timeline- Information gathered from interviews and secondary data can be visualised in a timeline diagram
Chapati diagram (Venn)- Visualises different groups and organisations within a community and their relations to each other.

Interviewing- The main core is flexible conversations that adapts according to the interview situation.
Photo and Video- Part of documentation.
The research carried out in Rishikesh employed a wide range of PRA tools that were used to get an understanding of the different communities and circumstances. The initial step involved the entire research team walking around different parts of the city while observing different aspects of the city with an aim of identifying interesting areas. The team was later on split into five groups on the basis of theme and location. All five teams were introduced to a number of PRA tools which were include among others; mapping, Focus Group Discussion, key informant interviews, transect walks, timeline, sketches, photographs and videos, and seasonal calendar.
Uptown/Downtown (The Real Fake)
Uptown/downtown (The Real Fake)
Informal Settlements in Dried River Bed (Masala) Eco-sensitive zone (??)
Bridges (??)
Informal Settlements in Dried River Bed (Masala) Eco-Sensitive Zone (??) Bridges (??)
Waste management(??)
Waste management (??)
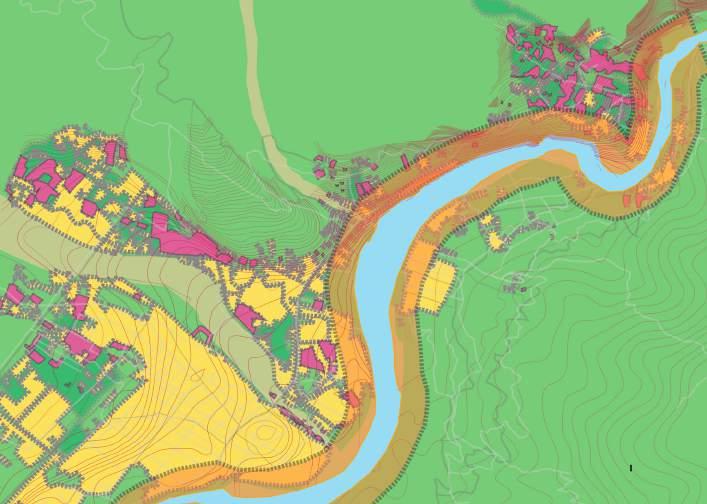
It is necessary to understand many layers of the city to determine where risk is situated. Within the scope of the study, the following layers were identified: the location of hazards, flood plains and ecological boundaries, the land use and cultural transformation, governance, education, economic opportunity, health, and infrastructure. Risk is found in the interaction of these layers and therefore, each of these layers play an important role in the overall functioning of the system and the risk within it.
tensions & stress in cases themes connected to cases
Themes
Sub-themes
Institutions & Governance
Social dynamics
Government Sturcture Perceptions Financial investment Regulations Population structure Occupation Income&Expenditure Migration Health care Education Right circulation Water management system Solid waste Energy supply Storm water drainage Sewage&Sanitation Facilities
Infrastructure Built environment Ecology
Transpotation&Road Buildings Urban fabric Land use
Disaster management Green structure soil & Topology Biodiversity Ecosystem services Tourism
Historical background Attractions Arch heritage Material&Intangiable values
Uptown/Downtown Waste Eco-Sensitive Zone Informal Settlements in Dried River Bed Bridge
Rishikesh is loosely associated with three different adminisrating bodies governing the town. This make risks, in the human dimension due to unclarity in responsibilities and ownership of systems. Hinterland is composed of villages that provide day to day aid to Rishikesh in form of farm products, cheap labour etc.

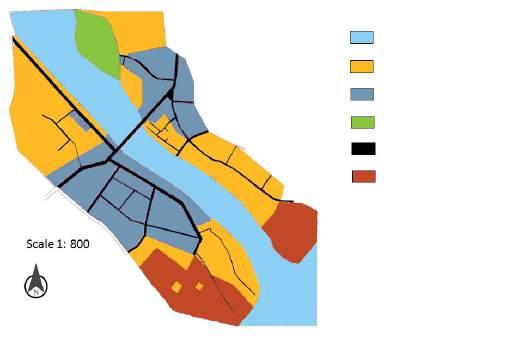
Map: Informal and formal dumping sites Index 1:30,000
Map shows formal and informal dump sites in the Swargashram area plotted with land use patterns. 10 informal dump sites are situated on public or openaccess land, 3 informal dump sites are situated inside trust land or cremation/ burial ground. It can be concluded that areas that have an open access for the public are more likely to be used as informal dump sites compared to private/ trust land in Swargashram.
Government land Business
Parks & Gardens
Primary residence Agriculture Waste dumping sites
The cleanliness index perception map shows the perceived cleanliness in the Swargashram municipality on a scale from 1 (very dirty) to 5 (very clean). The survey was distributed to domestic and international tourists as well as locals. International tourists perceive the Rishikesh environment to be less clean than domestic tourists. Generally, places close to the river are perceived to be cleaner than places far away. Places with a high commercial activity like Lakshmanjhula show a perceived low grade of cleanliness.
Cleanliness Index 1:30,000

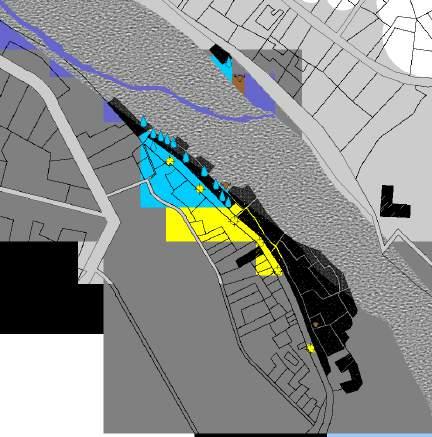
Map: Settlement Locations Map
Map: Contour Map
Legend Flood flow Contours (0.5m intervals)
Map: Infrastructure Map
The seasonal floods in the dried riverbed affect the settlements there. Pattern of the water is depicted from looking at the contour map, and from that analysing its flow.
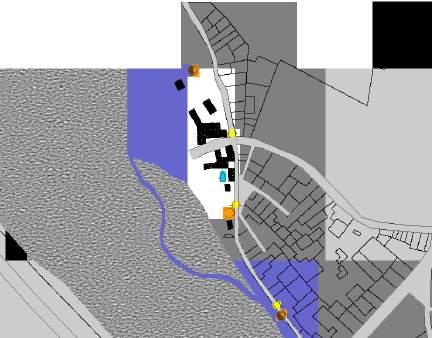
Localization of water pumps are close to sewage
Legend
Sewage Discharge Water Pump Cow
Light pole
Sewage water stream

The circulation routes near and on the bridge have more interactions and are perceived as having more risk. While further away from the bridge, there are lesser interactions and towards Laxman Jhula.
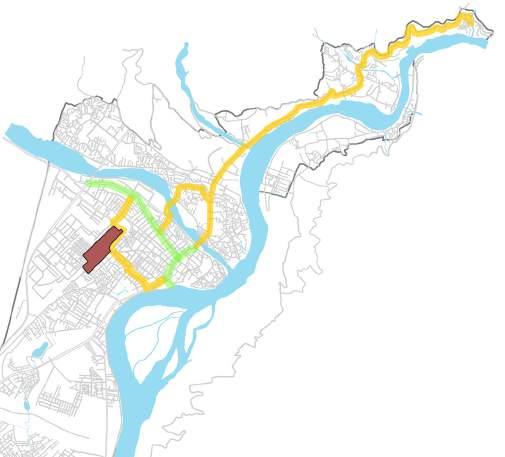
The zero zone is the centre of the city which has the most number of travellers coming and going less. So if your auto is not allowed to stop and pick up passsengersyou

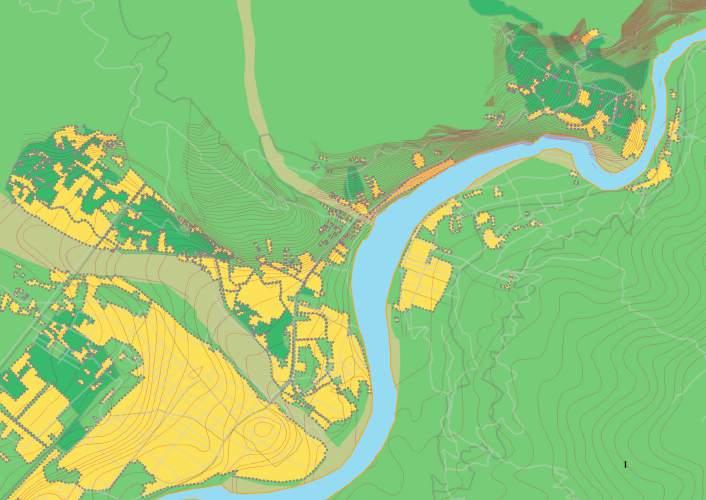
Map: Land use before 2003
Map: Land use after 2003
Forest Settlement Agricultural land Settlement after 2003 200m buffer zone Contour line
1km 1km
Forest Settlement Agricultural land Settlement after 2003 200m buffer zone Contour line
“Shortage of dwelling units has led to mushrooming of illegal structures, some right on the riverbanks. The state government’s notification in the year 2000 to prohibit construction within 200 meters from the riverbanks was not adhered to.” (DEMYSTIFYING A HIMALAYAN TRAGEDY: STUDY OF 2013 UTTARAKHAND DISASTER).
‘Forest Conservation Act, 1980’ prohibit construction on forest land, and the 200 m buffer zone restrict construction close to the river Ganges. The urban growth around our study areas the last decade can be seen in the context of these restrictions, where most have happened outside the forest boundaries and the 200 m zone. It has happened on agricultural land in the fields of Dhalwala and the slopes of Topovan. Loss of agricultural land is in itself a risk to food security and livelihood diversity. On slopes, impact of earthquake is worse, and landslides are more likely to happen.
Certain tensions and stresses were found to exist within the scope of the study. Each one of these has at least one corresponding case study, to illustrate the tension or stress with an example on the ground. The tensions and stresses fall under seven (7) broad categories: tourism vs. cultural heritage, formal vs. informal, unemployment, ecology vs. development, tourism and trash, transportation and circulation, the caste system, and flooding.
“In the middle ages, people were tourists because of their religion, but now they are tourists because tourism is their religion.” (Robert Runcie, an English clergyman)
Rishikesh as a home of spiritual inspiration continues to build influence not only in India but across the world. Quite surprising is the manner in which development in this fragile area has happened over the last 50 years. Traditionally, Rishikesh was known as a pilgrim town but over the years it has observed a change in character. In 2000, the International Yoga Festival was introduced, which resulted in increased numbers of international tourists. After this time, the town observed an economic transformation, shifting from local and religious handicrafts to provision stores, cafes, hotels and yoga and meditation. Pilgrimage, heritage and cultural value is becoming somewhat extinguished because of this tourism industry, which is the only viable economy for the people at present. This is why it’s important to know where to draw a line and what possible regulations and interventions can help maintain the cultural value of Rishikesh.
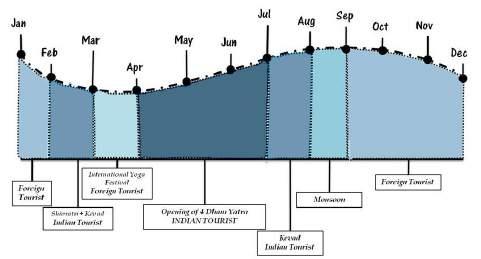
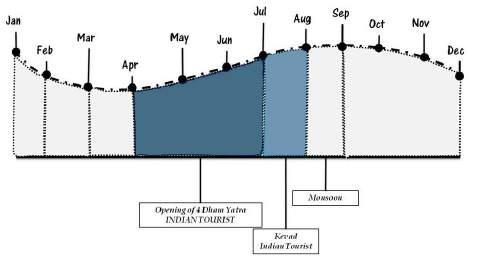
Above: The image above depicts an increase in tourists which has resulted in a change in season time of work. Earlier which was only a 5 month season from April to July (a religious season) being the gateway to 4 dham yatra and Kevad in the month of July has now transformed to a 12 month (tourist) season. This includes an introductory cycle of foreign tourists. This change is observed since last 10-15 years mainly accustomed to the introduction of International Yoga Festival, allowing people from across the globe to experience and learn yoga. This has led to the change in total cycle and composition of tourists overcoming the religious character.
There are nineteen (19) slums in Rishikesh that are not officially recognised by the state (Indian Census, 2011). After weeks working in New Triveni Colony, residents informed us that the settlement is informal, in the sense that it not recognized by the government as a proper living space and the people living there do not have property rights. This was reaffirmed in a government land use map of the city, where the residential area was classified as part of the river, indicated by light blue shading, shown in opposite (HDA Master Plan). We observed, however, that although the settlements are not officially recognized, some basic infrastructure such as electricity lines, water pumps, public toilets and drainage lines are still provided.
Residential Commercial Vegetation Roads
Social, cultural and religion
Rishikesh lies in a hilly terrain, and city expansion is naturally restricted by the amount of available land in the flat parts of the landscape (Forest Conservation Act 1980). In 2000, the government enacted a 200 metre buffer zone from the bank of the Ganga River where no construction is to be made, in order to reduce pollution to the Ganga River and the negative impact of flooding (Writ Petition 2013). The ‘Forest Conservation Act, 1980’, states that no forest land may be used for any non-forest purpose. These restrictions on development are in tension with the urban expansion the last decade.
Although some buildings have been left unfinished due to the buffer zone, satellite images show new structures within the zone. On the ground, the 200 metre buffer zone has not been fully adhered to, as illegal buildings have been reported (Kumar 2013). Additionally, certain building types are exempt from the buffer zone, and can be constructed within certain restrictions, such as Math, ashrams, temples and heritage buildings (Writ Petition 2013). However, most of the new structures in the 200 metre zone lie outside religious and cultural zones in the existing land use map of Rishikesh.
Rather than having a 200 metre buffer zone along the full river, the State Government has addressed the need to scientifically devise a more precise boundary for the buffer zone (Forest Conservation Act 2013). A new demarcation of this kind will be more specific to the differing needs along the river, and can release some tension that is obvious today between development and restrictions by freeing up space.
200 m from river 130 m from river 200 m from river 50 m from river 50 m2 m
Water level 2013 flood (342 a.h.d.)
Normal water level (335 a.h.d)
Danger mark (340 a.h.d)
200 m 200 m
level 2013 flood without Tehri Dam (345 a.h.d.)
Above: Illustration showing the lack of specificity of the 200m rule. On one side of the river much of the area within the buffer is safe from flooding. On the other side, the buffer corresponds to actual risk. (Source: Magnus Nordal Hauken)
Like many cities in India, Rishikesh suffers from a waste problem. About 300,000 to 400,000 tourists visit Rishikesh annually (Mittal et al. 2008), creating waste that the town has to deal with. However, the already overstretched structures of governance and waste management infrastructure in Rishikesh do not have the capacity to handle this additional waste. Tourist behaviour and the administrative environment are two main factors that drive tourism induced waste generation (Holden & Fennell 2012). Although the policy around waste management is adequate, the reality is that it isn’t adhered to on the ground. This problem is likely to continue since the city will depend on tourism as its main economic pillar for the next years. Similar added pressure from the seasonal influx of tourist are likely on other types of infrastructure.
Right: Water courses and stormwater drains become clogged with deposits of waste generated by the surrounding land uses. These empty into the Ganga River, in turn polluting the holy river (Source: Cathy Reilly)
Life in India historically has been regulated by the caste system, a system of social stratification which is forming ranked groups by descent and is linking to particular occupations (Human Rights Watch, 2014). There are four major castes: Brahmins, Khsatriyas, Vaishyas and Shudras. Some groups, today known as Dalits, were historically excluded from the caste system and are still to some extent stigmatised as untouchables (Sadangi, 2008). Although the caste system was abolished by the Indian government in 1950, there is still a correlation between caste and occupation that can end up in discrimination. For example, jobs related to waste management are often performed by members of the Shudra caste and the Dalits (Human Rights Watch, 2014). In Rishikesh, the division into castes is observable in the spatial exclusion of sweepers and ragpickers in Valmiki colony. The inhabitants of the settlement lack the opportunity to pursue alternate career paths traditionally performed by higher castes. This spatial and socio-economic exclusion is constituted as a major tension among the society of Rishikesh.
Below: A comic based on interviews of three sweepers working in Swargashram (Source: Mina Afsari-Rad)
CAN YOU IMAGINE THAT WE HAVE NOT BEEN PAID FOR FOUR MONTHS TO THIS?!
THIS IS US; KARAN, RAJI & ARJUN WE ARE SWEEPERS EMPLOYED BY THE MUNICIPALITY OF SWARGASHRAM
WHEN I DO GET PAID I GET 5000 A MONTH 3000 GOES TO RENT...
THIS IS OUR ROUTE. WE WORK 8 HOURS EVERYDAY, SIX AND A HALF DAYS A WEEK...
I STILL DO MY JOB BECAUSE I WANT A CLEAN CITY AND BECAUSE EVERYONE IN MY FAMILY WORKS IN THE WASTE SECTOR
I DREAM OF HAVING MY OWN BUSINESS SO I CAN HAVE ECONOMIC SECURITY AND CLEANER STREETS!
THE REST GOES TO SUSTAIN MY WIFE AND FOUR KIDS
FOR NOW, WE WILL CONTINUE WORKING AND HOPE THE NEXT PAYMENT COMES SOON ...
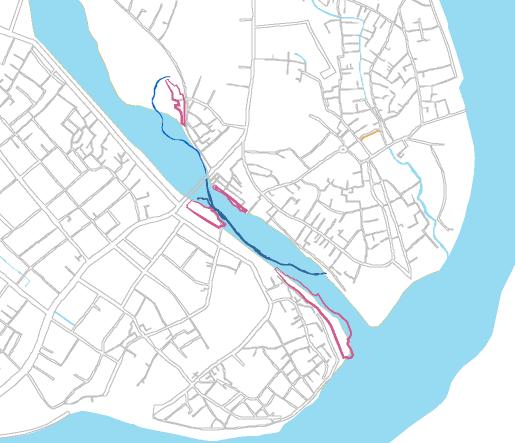
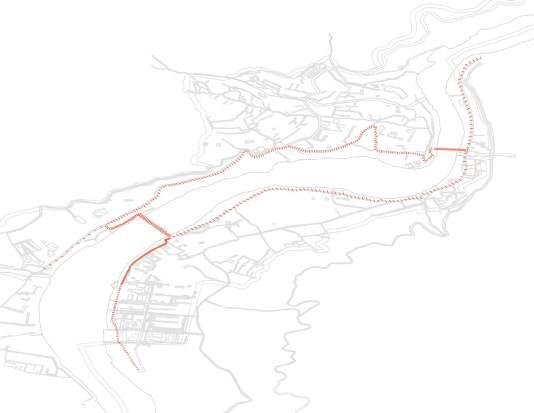
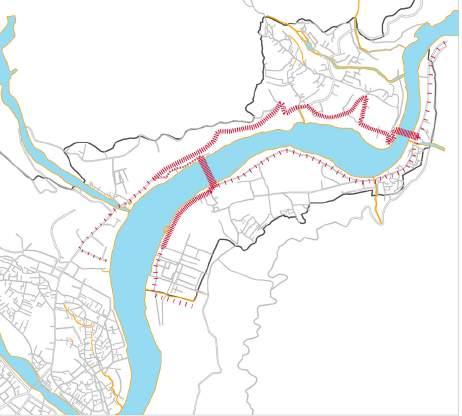
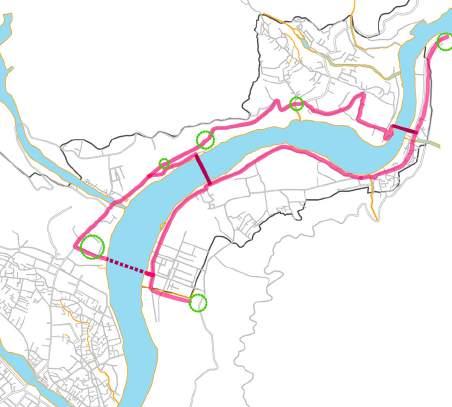
With many people coming into Rishikesh from different parts of the world as tourists, pilgrims, visitors, workers, and traders among others; the need of them to move from one place to another cannot be underestimated or played down. Mobility and accessibility are very important aspects of every city’s transport system. El-Geneidy (2006) considers mobility as the ability to move from one place to another. In the case of Rishikesh, this is made possible through various means; motorcycles, bicycles, taxis, the famous auto rickshaws and walking. On the other hand, accessibility represents the potential of opportunities for interaction (Hansen, 1959). This refers to the network of roads, pathways, passages and bridges that enables the city residents (and different people) to access different parts of the town whenever they need to.
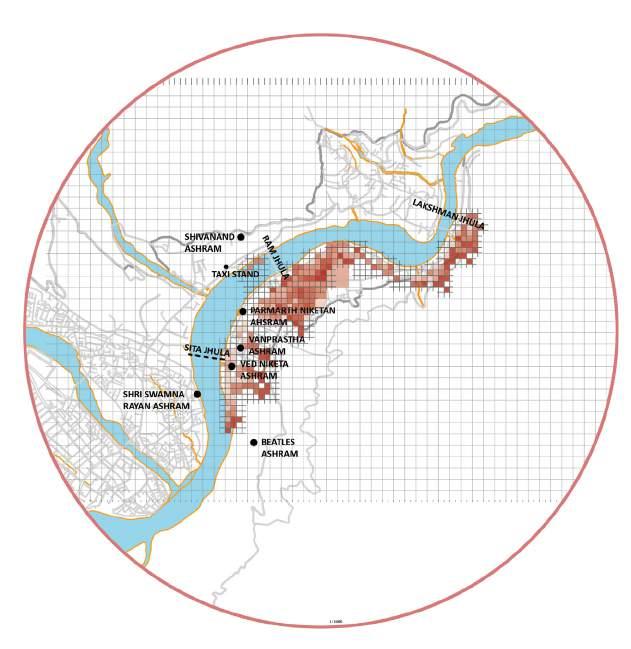
Of interest is that the religious spaces like; temples, ashrams and other places of worship are the key drivers of mobility and accessibility in Rishikesh; this is true for both tourists and locals. The other places that influence the city population’s movements are market places and shopping streets/areas.
Lakshman Jhula and Ram Jhula, built in 1927 and 1986 respectively, are bridges in Rishikesh that have enabled quick and convenient access to the places of interest mentioned above. However, there is a conflict playing out on the bridges between motorists and pedestrians. The initial purpose and design of the bridges was to accommodate only pedestrian traffic. However, with the increased urban population and the need to access places quickly and conveniently, motorcycles have made it to the bridges. The result is that pedestrians now have to negotiate through a mixture of pedestrian and vehicular traffic on a daily basis. This is risky, time consuming and chaotic, with potential for pedestrians to get run over or injured by motorcycles.
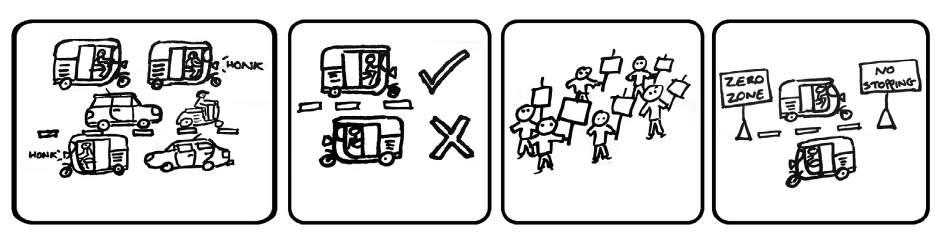
Further tensions in the city’s transportation system exist within the vehicular means of transport, particularly between the auto rickshaws, tourist taxis and private vehicles. This conflicts stems from the proposals to address the problem of traffic congestion. To address the problem, a new public policy was initially proposed, and this restricted the mobility of the auto rickshaws to certain areas. The resultant strikes by the auto rickshaw union paralysed mobility in Rishikesh, a clear demonstration of their importance to local people. The initial proposal is one of a series of solutions that have turned out to be untenable and opposed altogether largely because they are selectively applied only to the auto rickshaws, suggesting they are the only contributors to traffic jam. Currently, there has been a temporary arrangement known as the zero-zone policy in which auto rickshaws may neither stop to pick up nor drop off passengers along the main road; from Jairam Ashram to Nataraj Chowk and from Government Girls’ Inter College (GGIC) to Rishikesh Kotwali (police station). The tension still exists as the fines for compliance are both high and depend on the discretion of the police.
Unemployment is a large stress within Rishikesh. This became evident though both interviews and the results of our livelihood survey. In the survey of the dry river bed settlement, although few people were found to be unemployed, approximately 40% of people stated that they had inconsistent employment. Further, 50% of residents stated that unemployment was a major risk for them. This may be a result of the nature of the employment that the people living in the settlement have access to. According to an interview of a local resident, people who are labourers convene at one area of Triveni Ghat each morning where they present themselves as able-bodied labourers. Some days, due to market fluctuations, no one asks them to work and they are left without payment for the day. Further, the levels of unemployment may also be exacerbated by a lack of upward mobility – approximately 70% of people were found not to have made it past primary school education.
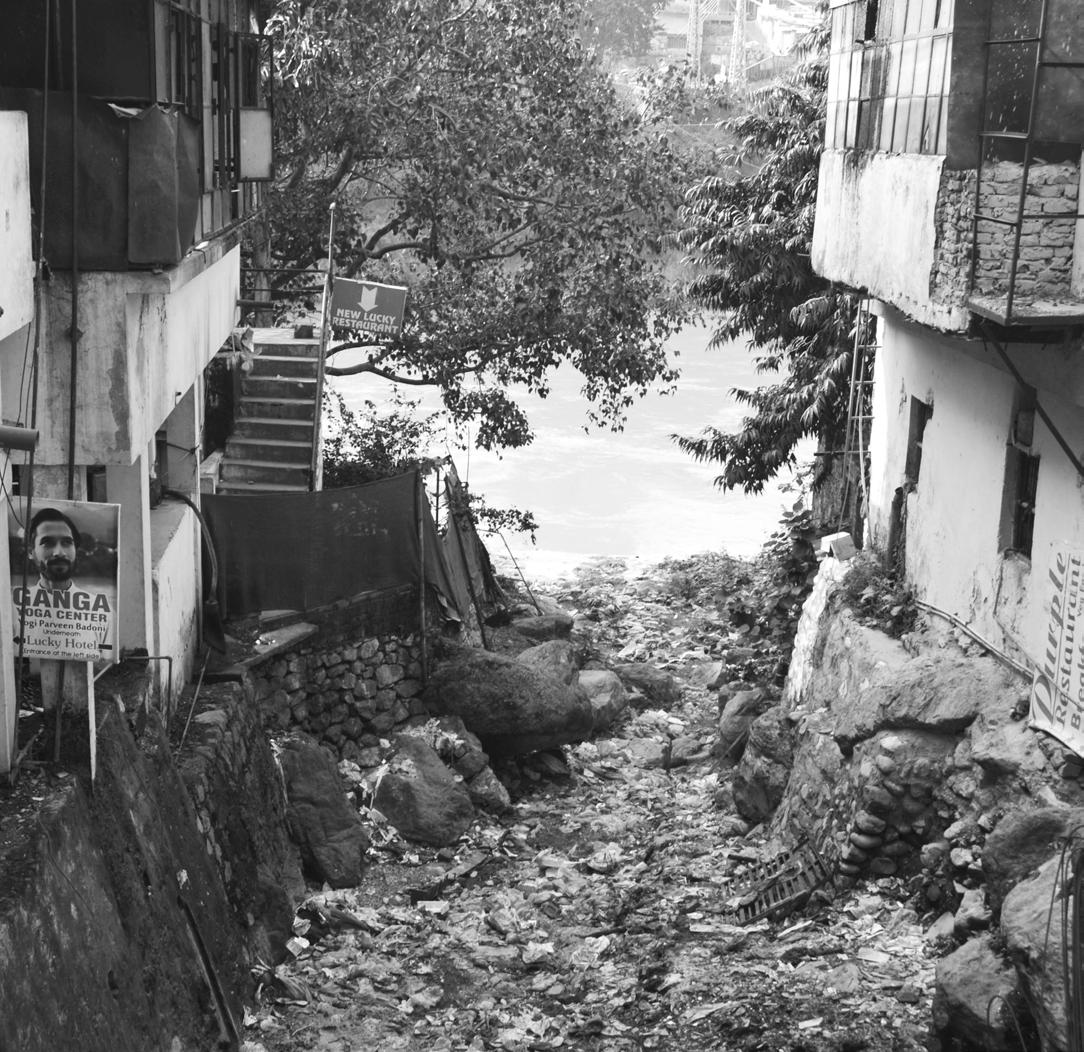
Flooding is a major stress within the city of Rishikesh. One specific case of how flooding influences the city is in the informal settlements, New Triveni Colony, that lies in in the dry river bed. Every year from around June to August there are seasonal floods. The flooding is a result of storm water runoff from the mountains after heavy rains and influences around one 1,000 residents. Many of the resident’s shelters are heavily damaged or washed away every year. These residents have to evacuate when the floods come, and often lose sources of livelihood during the flood season. This has major implications for their lives and is a large stress, shown by the approximately 90% of residents who listed flooding as one of the biggest risks they faced. (Refer Chapter 9 for additional information about survey findings and Chapter 10 about temporal and spatial risks)
Vulnerability can exist in many contexts, both in the physical sense and the psychological sense and in various combinations. In the case of a disaster, the International Federation of Red Cross and Red Crescent Societies (IFRC) defines vulnerability as “the diminished capacity of an individual or group to anticipate, cope with, resist and recover from the impact of a natural or man-made hazard” (IFRC, no date). Vulnerability can also be expressed in terms of how susceptible a system is to the effect of a hazard, and by assessing the system one can determine the vulnerability of people in that particular system.
Most pertinent to the disaster management discourse, the Office of the Disaster Preparedness and Management (Ministry of National Security, Govt. of Trinidad & Tobago), gives the following forms of vulnerability:
• Physical Vulnerability: Manifested in the location, design, material used for critical infrastructure.
• Social Vulnerability: Inability of people, organizations and societies to withstand adverse impacts to hazards due to characteristics inherent in social interactions, institutions and systems of cultural values.
• Economic Vulnerability: Determined by the economic status of people. Varies from case to case. It is widely believed that people with no fixed source of income or livelihood become economically vulnerable.
• Environmental vulnerability: Natural resource depletion and resource degradation are key aspects of environmental vulnerability.
The livelihood model, first developed to understand the idea of sustainable livelihoods, is a simple way to understand the vulnerability of people through the identification of their assets, access to resources and the actors that control them. When applied in a development and resilience scenario it helps to identify a strategy of mitigation of hazards or resilience approach.
Discovering the relationships or restrictions within the system is one of the key aspects of the livelihood model. With this we can connect the micro level activities with the macro level control of resources :
• Financial: it can be defined as the economical ability to obtain resources, create networks of different income sources. In an urban context, the vulnerable populations tend to obtain income from informal jobs. Working in poor conditions serve to increase long-term vulnerability to disease and ill-health.
• Human: They can be defined as the individual capacities, whether they are naturally obtained or developed. The increase of this assets can influence or increase the capacity of obtain other resources and assets such as Financial, Physical, Social, and so on.
• Social: The capacity to build human connections, social relations and contacts which helps to strengthen or develop new assets. For example, a rickshaw driver within the union is more likely to obtain mechanical support for their auto than a non affiliated one.
• Physical. This category can be defined as the already obtained material positions, whether they are natural or man made, of an individual or a community: In the context of Rishikesh we considered land tenure as one of the key aspects to reduce vulnerability due to the stability that this can cause.
• Political. The ability to influence in public policies or city level decisions, whether it’s a direct influence as a Ward Member or indirectly, like a Union Rickshaw driver.
In order to apply the livelihood model in a representative city scale, the first proposal was to apply it to communities of varying economic backgrounds. This wasn’t possible due to time limitations and lack of manpower. The decision was use the PRA tools to study three potentially vulnerable settlements. We then applied our initial learnings to build a livelihood model for each settlement. The survey, conducted over the three settlements, was an effort to quantify these findings.
To be able to identify the assets, resources, constraints and hazards within the settlements, our first approach was to build trust with the community by applying the participatory observation method- trying to actively engage in settlement activities and creating exercises and games where we attracted the interest of the children, eventually leading to interviews and FGDs. As a result we were able to develop a broad survey to compare the three settlements.
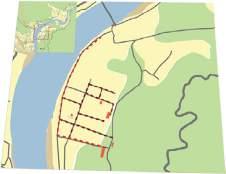
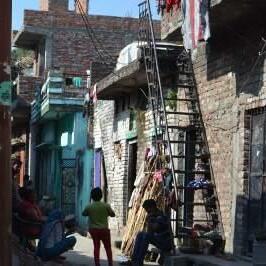
The New Triveni Colony is a jhuggi jhopdi migrant settlement, with a population of around 1,000 people, located on the dry bed of the seasonal river Chandrabagha. It largely consists of masons and laborers. The river floods annually between the months of June and August, forcing the residents of the settlement to find alternative housing in the adjacent area. The master plan does not recognise the presence of the community, having marked the land use of the riverbed as blue (meaning river).
he New Jatav Basti is a consolidated settlement that is situated between a large vacant area belonging to the railway and a high income residential area. One of the main sources of income for many families in the area are from driving auto rickshaws in the city. The women (mostly housewives) often complement the household income by small skill based jobs like tailoring along with collecting wood from the nearby forests and selling them. All the residents belong to the Jatav community of the scheduled castes. The floods do not directly affect the settlement but the damage to the roads affect their regular operations and income. Recently, the proposition of a new public policy that modifies their transit routes, affecting the incomes, has stimulated multiple citywide strikes.
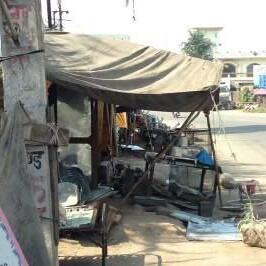
Dehradun Road informal settlement is situated in a resourceful location on the edge of the Balaji Orchards right next to Dehradun road, which is one of the busiest highways of Rishikesh. The main source of income for the dwellers mainly consists of iron works and handcrafting. The people who live here are considered migrants and nomads. A recent municipal mandate states that the land must be vacated after the festivals, for the upcoming Ardh Kumbh Mela.


basic literacy
access to health
diversity of skills traditional knowledge
children go to school high adaptability
shared beliefs and traditions union representation
sense of community sense of family
ward member representation have voter IDs political connections
regular income loans from union microfinance
financial savings loans from neighbours government compensation
electricity water roads shelter adequate sanitation public services
Figure: natural
low pollution rates low risk of flood
access to public spaces
partial land ownership use of natural resources
The comparative measurement of different assets between the three settlements was made through venn diagrams:
In terms of human assets, the New Jatav Basti ranks highest due to higher levels of education, a wider skill set leading to greater employment opportunities and better access to health and education services. The New Triveni Colony, however, displays a high capacity for adaptation to the seasonal effects of the flood but have much lower literacy rates, although most children of the community attend school. This is not the case with the Dehradun Road settlement. Their location is much further away from the nearest school as well as hospital and do not have the financial capacity to use public transport (rickshaw/vikram).
Though the New Triveni Colony and the Dehradun Road settlement all show a high sense of community and family as major social assets, they lack common belief systems and a larger social network within the city, as is the case with the New Jatav Basti, who are associated through their livelihood with the Rickshaw Union.
When it comes to political assets, the three settlements share only one capacity, the majority of them own a Voter ID card. This gives them to the political system during elections. In this case we can identify that the Dehradun Road settlement its the least connected into the policital system. On the other hand the other two have at least some direct connection within their settlements, such as to the ward member in case of New Jadav Basti and political connected local leaders like the Chai Walla in the case of the New Triveni Colony.
The comparison between the different sources of financial support help us to understand economical stability within the community and the way they access and manage their different assets. While the three settlements share community based financial systems such as lending from neighbours or relatives, a stable source of income makes New Jadav Basti the least financially vulnerable. While in the other two there is no stable source of income, most of them depend on a daily labour.
In terms of physical infrastructure, all the three communities have access to electricity. In addition to this, the New Triveni Colony and the New Jadav Basti, also have good access to water and public services (schools, hospitals, temples). The New Jadav Basti, however, shows the highest physical capacity with additional assets such as formal shelters, road network as well as better sanitation and waste management system.
Even in terms of natural assets, the New Jadav Basti showcases a very high capacity with lower pollution rates, no risk of flooding and secure land tenure. The New Triveni Colony has very low natural capacity only having access to natural resources such as food and cowdung and a large public space in the form of the riverbed. The Dehradun Road settlement ranks the lowest with nothing but access to firewood.
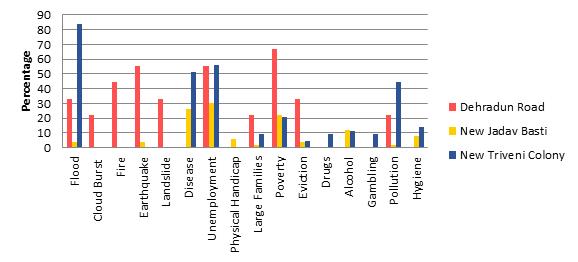
When it comes to hazards, the perception of risks to seasonal flooding is higher in New Triveni Colony, due to their location right in the course of the river Chandrabhaga making them the most vulnerable community during the this period. Although this might seem the only hazard, the most perceived risk within the three settlements is unemployment. With a total of 43% of perception, the lack of financial stability becomes an everyday risk, which affects other assets and creates larger vulnerabilities related to money and health, reducing the possibilities of overcome natural hazards.
When comparing the three settlements, it becomes clear that the New Jadav Basti, though prone to livelihood related situational hazards, are far better equipped to overcome them due to significantly higher assets. However, both the New Triveni Colony, affected by a seasonal risk of flooding, and the Dehradun Road settlement, affected by the day to day risks of living along a highway, are far less capable of overcoming their respective hazards because of major asset limitations.
Here, we can conclude, that capacities developed due to higher assets of a specific nature (physical, human, etc.) induce the ability to cope with certain hazards. Identifying vulnerable communities requires a larger understanding of the interconnected nature of city systems such as political, social and economical. Not having conducted a city-wide survey, we cannot directly name any one community or individual as the most vulnerable. However, we can safely conclude that all communities that display specific asset limitations and lower connectivity to the macro-level systems are vulnerable to a varying range of hazards.
Figure: Venn diagram showing comparison of hazards


physical handicap

gambling
alcohol
abuse
Within all human settlements, from nomadic to settled communities, there are systems that control the access to resources and the way they are distributed. The member of these systems can be called actors. In our modern systems, government structures are considered the major controller of resources within cities. But in a context of urban disparity, fast urbanization and overcrowding; this formal structure becomes inefficient, leading to the creation of informal actors, that also control resources but in a far more flexible manner.
Here, we can define formal actors within cities as those that are backed by law, while the informal ones are those that are born out of necessity, within the social networks of citizens and their relations.
To identify the many different actors and their effects on the residents, we implemented the PRA tools, leading to the creation of a diagram of relations and connections within the settlement and outside of it. The next series of diagrams shows the connections between different actors and the settlement. The size of the circle is representative of the extent of impact that the actor has on the residents while the arrows signify the direction of influence.
Within the three settlements, the major prevalent actors that influence the residents in a positive way are largely informal. In each settlement, the residents displayed a preference to seek help from their neighbours and relatives as opposed to reaching out to local government, in times of need. The New Triveni Colony, though strongly benefitted by political influence in their favour, accesses this influence through informal channels i.e. the Chaiwala.
The only settlement that has a direct positive input from a formal actor is the New Jatav Basti due to their source of livelihood. The Auto Rickshaw Union helps to preserve labour conditions for their workers but also provides financial support in case of emergencies. Their power relies on the need of public transportation from the local population.
When it comes to negative relations, there’s a mix between formal and informal actors. For example, the Dehradun road is largely affected by the state government due to threats of eviction. The New Jadav Basti, on the other hand, is plagued by perception of outsiders that deems them as an “insecure” and uneducated settlement. However, the largest negative impact comes from the municipality in terms of land tenure, for all three settlements.
In conclusion, when it comes to mapping actors in a settlement approach, we must first understand their social dynamics. Within our study and survey, we came to understand that the connection between informal actors and the residents from the settlement are stronger and affect them in a far more positive manner. The informal system is directly connected to the grass root and offers a strong sense of approachability. However, the formal system of governance controls almost all resources, thereby introducing a need for a mediator between citizen and government. We can safely say that this disparity of connection with the formal system forces the creation of a flexible, informal one. In many cases, the informal actors are the sole source of connection with the formal network and the strongest reason for their survival. The informal actor network, in a sense, is an organic negotiation that the city system generates to counteract its vulnerabilities and build capacity for risk mitigation.
The negotiation of risk pervades in a similar spectrum as that of risk itself. Like risk, negotiation also has a critical dependence on space, time and the actors and varies accordingly. Popular perception equates risk as a function of future “possibilities” and hence adds an “indeterminable or unknown” shade to its existence. However, our observations suggests that in an urban context, citizens are often conversant with the risks, but devise ways to either live with, mitigate or confront with them. The following three examples highlight the temporal aspect of negotiation of risk in the context of Rishikesh.
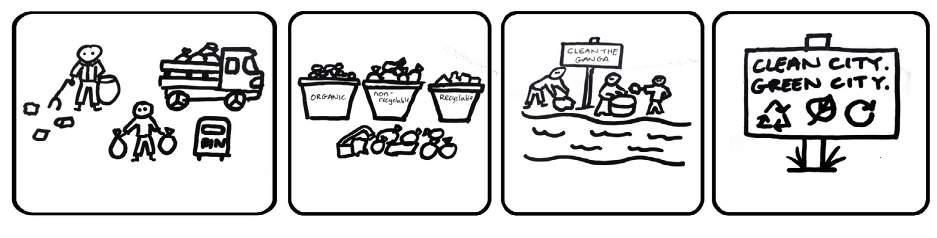
In Rishikesh a lot of waste is being displaced in the streets, nalas, drains, arbitrary open plots and other undefined spaces (Refer to maps in in Chapter 8). These conditions are largely attributed to the unsatisfactory waste management system that exists currently. The presence of these large volumes of waste creates an everyday, chronic risk, which therefore also requires ‘everyday negotiation’. As a result, individuals and organisations have taken action and responsibility for a cleaner city. The Clean Himalaya NGO is one of them.
Clean Himalaya’s work is divided into four areas. Firstly, garbage collection is done by paid workers, as an alternative formal waste management system. Currently they are serving 200 units including households, ashrams, shops and restaurants in the Lakshman Jhula and the Tapovan area for a small charge of their customers.
After collection, the waste is segregated and all non-organic recyclable waste is sold. While the organic waste is taken to a local pit, the non-recyclables are currently taken to a dump site. The NGO, however, hopes to develop an ecofriendly method of either reusing or disposing of non-recyclables in the future.
Clean Himalaya also provide a free community public service of cleaning the roadsides and drains of their project area, including a weekly voluntarily trash picking action along the stretch of Omkarnanda Ghat. They arrange regular clean up campaigns in collaboration with students, rafting companies, ashrams, locals, domestic and international tourists linked to education.
The finances of the organisation are 90% self-sustaining and the remaining 10% is founded by donations from Ashrams (Amritarupananda, 2015). The local government has no land to dispose the trash, however receiving small annual contribution from the municipality of Rs. 5,400.
This mitigation is the everyday negotiation of the city to avoid the pressing health and environmental risk. There is a wish to achieve a clean and more appealing city. Negotiation in this sense is the actions of the people expressing a want or a need for change. This is a constantly on-going process which is not always spoken.
The acts of negotiation are however not always for the better as there several informal dumpsites in Rishikesh. This is an example of an informal and illegal system polluting the soil and the ecosystem (Refer to maps in Chapter 8). According to one of the local sweepers, these are used by locals as well as government. Even with a sufficient system, the cleanliness index map shows that a change in the attitudes of people is also needed.
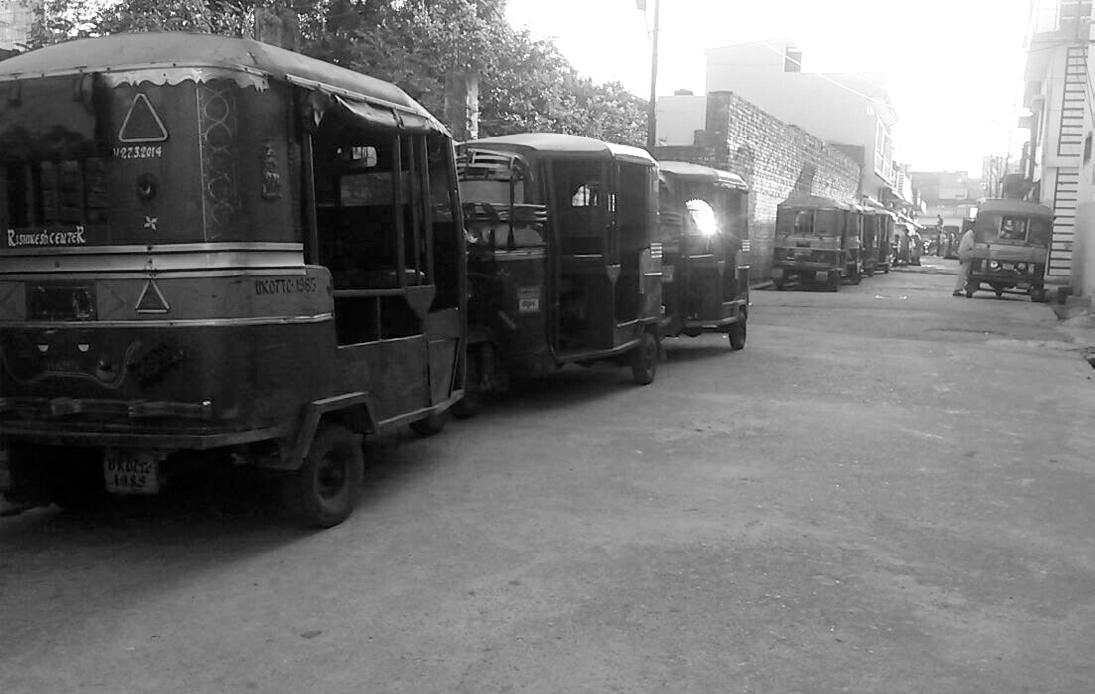
Certain instances of negotiation of risks arise suddenly and uncover the way the parties resolve an issue. Such cases illustrate the way people strike negotiation in special circumstances. These have been termed as ‘chance negotiations’ and are exemplified by an auto-rickshaw strike.
The auto rickshaws, which provide local and regional connectivity are an affordable and essential form of travel for the citizens and tourists of Rishikesh. Dominating the traffic system in the city, autos also serve as school vehicles. With established routes and pickup points all over the town and its outskirts, they are also a quick and easy way to gain access to the city for villagers and thereby directly support numerous livelihoods.
However, due to the high volume of traffic in the centre of Rishikesh, coupled with limited scope for increasing road capacity and route expansion, the rickshaw drivers have recently come under scrutiny and been diagnosed as the leading source of the congestion. Hence, a one-way system, applicable to only auto-rickshaws, was created through the centre of Rishikesh. This resulted in longer routes for rickshaws but lesser passengers and increased fuel consumption, posing threat of substantially reduced income to the rickshaw driver families.
Interestingly, the traffic congestion was solely blamed on the autos, while the private vehicles parked along the roads (even during peak hours), the commercial encroachments on the road seemed to be excluded from consideration. As a response, the rickshaw union organised an indefinite strike until they reached an agreement with the local authorities. During this time the city suffered as people had to find alternative forms of transport which were either more time consuming or more expensive. This in turn created an acute risk, effecting people’s livelihoods by limiting their ability to reach work and secure daily incomes. If the auto-strike continued indefinitely, there could have been significant negative impact on the local community and businesses.
After four days of pressure from the city to end the formal protest, however, the strike was called off after a temporary negotiation between the rickshaw union and city police. The product of this negotiation is the creation of ‘Zero Zone’ that allows the autorickshaws to ply both ways in the previously forbidden routes under certain strict conditions (Refer to maps in Chapter 8). Being seen as a mid-way arrangement by the authorities, this incident also highlights the collective initiative of a focussed group (the auto union) to make its voice heard through a conflict and its ability to strike a dialogue and create situations for negotiation.
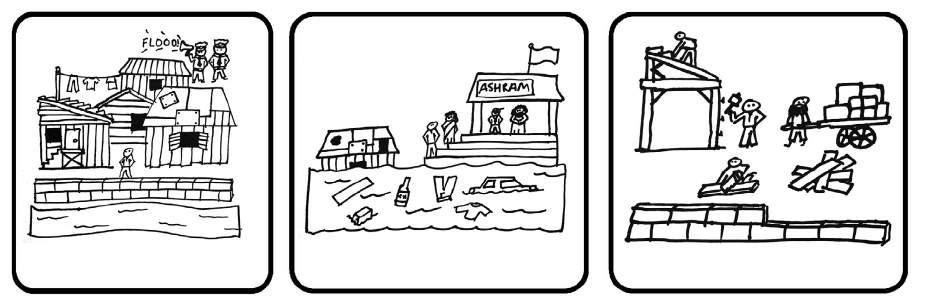
Sometimes, people have to negotiate risks in a recurring manner. Where this occurs, elements of both chronic and acute risks need to be considered. In communities encountering this situation, people often mould their existence in response to the risk they face and learn to live with it in the best way possible. Such an example is the settlement on the dried bed of the River Chandrabhaga, called the New Triveni Colony.
The dry riverbed of Chandrabhaga, owing to its centrality attracts migrant communities from nearby states and villages that setup housing informally in the riverbed. Knowing that annual floods wash their tenements every time, they still build embankments around their shacks from stones available locally to combat the initial floods. In addition, they save a part of their yearly income regularly to use it for food and accommodation during floods. During the floods these families are chased by the police and take shelter in the nearby ashrams and dharamshalas, only to return to the riverbed after the floods have subsided. With the meagre compensation they receive from the government, they build their tenements and embankments again and thus begins another yearlong wait for the floods.
From the point of view of the negotiations, the fact that the community is well conversant that the river would flood annually, yet repeatedly prepare for it from scratch directing all their efforts to build their capacity to survive by either creating embankments, saving money or returning to the same spot to rebuild showcases the tenacity of human existence and a trade-off with the risks posed by nature. It is this sort of cycle of negotiation that we term as Periodic negotiation, the essence of which lies in the repetitive arrangements to tackle a risk in time.
Negotiation can be seen as form of ‘give-and-take’ for two or more entities. Cities are hubs of diverse people and opinions, where negotiation is a natural part of everyday life. Some negotiation takes place in the physical sphere e.g. land, infrastructure and buildings, while other negotiations occur in a non-physical realm, manifested in policies and laws, which have a long time implication on the spaces they are supposed to govern.
National and local policies shape the image, management and functionality of cities, of which Rishikesh is no exception. It is therefore interesting to note that Rishikesh falls at the confluence of environment sensitivity, rapid urban growth, dearth of developable space, risks by natural hazards and a huge presence of cultural sensibilities – all this has heavy impact on the spaces in the city and beyond it. Such a spectrum of spatial manifestations leads to risk. These could be uncovered by studying any geographical area in the city, especially those that have a historical background and are a playing field for national, state and local policies. A glaring example of such complexity is presented by the Maharishi Mahesh Yogi’s Ashram that illustrates the negotiation of risk and the effects on resilience through different decisions that affect spaces.
Popularly known as the Beatles Ashram, the Maharishi Mahesh Yogi’s Ashram was built in 1961. In its heyday, it hosted the Beatles, hence the name. Irrespective of its historical significance and cult-presence, however, the complex is abandoned for the last 20 years.
Being within a protected forest, the ashram has been the focus of various policy regulations that have highlighted a lack of coordination between policies of different departments within the same government jurisdictions. In the 60s-80s, the ashram was a place for spiritual learning and meditation. However, it was closed in 1981 when the lease expired. Following this, renewal was refused on the basis of the Forest Conservation Act 1980 and the land was declared as Rajaji National Park in 1983.
Irrespective of its closure, owing to its huge cultural impact, the Ashram has been attracting a significant flow of tourist to this abandoned premise. The culture, the history and the architecture have contributed the pull of high tourist footfall.
Looking at the heavy tourist inflow, the forest department has finally conceded to open the ashram gates for tourists as a Nature Care Centre. As an outcome of this negotiation, the Department will not only be able to regularise the informal footfall of tourists to the premises but also will be able to generate a local economy. The result is a place where the ecosystem is cared for, the demand from tourists is met and history brought to life in the same geographical location. Interestingly, the disadvantage of such an effort is also embedded spatially in that the negotiations will lead to increased tourist activity within an ecologically sensitive forest and will likely have ramifications in the form of extended utilities and support services.
Land lease and Trustee offers
Sometimes cultural and religious sentiments affect the application of spatial policies. A classic example of this sort is the case of ashrams (trustees) who are allowed to build or extend in the 200mm no-built zone, while others are prohibited strictly. As the Beatle’s Ashram falls within this zone, it automatically earns the right to construct or extend it’s built up area. Whether or not the ashram will enjoy this exemption or will have to follow the forest department’s resolution to conserve the forest is still to be determined. This highlights, however, that the negotiation is rooted in the space that the Ashram is located in and occupies. Further, tt is believed that this exception to urban transformation in the face of legal prohibition has been solely done considering the ashrams’ position in the Hindu faith system; their perceived responsibility of helping people in need; and their role in preserving the spirit of Rishikesh being a temple town. Thus, this negotiation of space highlights a potential trade-of between the preservation of culture and the preservation of ecology.
The image of the city is a product of both what we see and what we don’t see. The network of invisible partners could give birth to ‘Silent partnerships’. A silent partnership is an example of actors in the city collaborating or providing complementary services with mutual benefits with or without legal recognition.
“Ashrams attract people to their premises, where they first introduce themselves to the leaders in Ashrams and put up temporary stalls. Over the years they graduate to wooden stalls or to more permanent options.” Laxman, 26, Local resident of Rishikesh
These types of partnerships are a form of everyday resilience: where informal vendors provide services to the city on site where it is needed; are flexible to changing venues for crowds; and can maximize their income, irrespective of what policies say against them. Such negotiations of resilience are found on the streets and hence, are spatially located in the city. Based on this observation, the future projection of what will happen on ground in proximity to the proposed Nature Care Centre (also known as Beatles Ashram) is an expression of different types of such silent partnerships in space.
The phenomenon of globalization, urbanization and industrialization brings large number of migrants from rural to urban, especially in developing countries. Meanwhile, urbanization increases the speed of climate change and exposes urban population in disastersaffected areas. According to UN, “Over three-fourths of the one hundred largest cities and exposed to at least one natural hazard” (UNISDR 2004, pg 59), which is an extreme situation should be paid attention to. Different from the common recognition, there is strong connection between vulnerability and urban poor, influenced by both economic and non-economic factors. However, this is not a specific problem only exposed to poor – the medium-income and high-income people also suffered from disasters because of inappropriate physical planning and building regulations, weak governance and bad quality of construction, etc.
In order to understand the spatial and temporal landscape of risk, we have developed a model which defines risk and resilience as alternate states resulting from the sum of the measure of vulnerability and the measure of capacity.
In this model, the shocks are defined as momentary and spontaneous hazards: conversely, the stresses are defined as ongoing hazards that remain present over extended periods of time. Both can converge to create vulnerability and lower the capacity. On the opposite, the coping strategies which can be defined as the actions the community takes to raise its assets, add to the measure of capacity, and lower the vulnerability.
As a result, this model proposes that when the measure of vulnerability is higher than that of capacity, individuals, communities, or a larger system for that matter, can be in a state of risk. On the other hand, when the measure of capacity is higher, a state of resilience may be reached. When both measures are equal and lie in a state of zero growth (in vulnerability or capacity), a state of ‘survival’ may eventuate.
Image: Causal loop of vulnerability-capacity-risk-resilience
stresses capacity
R shocks
vulnerability
vulnerability WHERE: vulnerability vulnerability
> < =
capacity risk capacity resilience capacity survival
Rural populations come to cities seeking work opportunities in urban areas. Without social or financial capacity, most of these people have to resort to living in informal settlements or slums. Due to a lack of land in urban areas, people often build temporary shelters with cheap materials in dangerous spots illegally such as on a cliff and riverbed. In addition, due to a lack of facilities and infrastructure like sanitation and water in the slums, people frequently become segregated and are exposed to health problems. It is important to note, however, that living in a formal settlement does prevent exposure to potential hazards. Rather, the nature of hazards, and the levels of vulnerability and capacity may vary. E.g. owners of higher value properties may be economically vulnerable to volatile markets but may also have more assets or resources to cope with a shock or stress.
The case of New Triveni Colony is particularly enlightening for understanding how vulnerability is not an isolated fact, but rather a sum of changing forces that ultimately negatively affect a community. As previously noted, this settlement lies on the edges of a seasonal riverbed – the seasonal flooding season typically lasts three months, from June to August. From the point of view of risk perception, the dwellers of this area consider flooding to be the major hazard, as noted in several interviews and surveys conducted on site. However, flooding alone is far from being the only challenge the people face when living in New Triveni.
As a matter of fact, the inhabitation of the riverbed by the people of New Triveni Colony can be seen as the result of a combination of pre-existing stresses, adding to their vulnerability rather than defining it. In the first place, extreme poverty prevents them to access adequate shelter when migrating towards the city, forcing them to squat in whatever available space there is in Rishikesh. Unemployment, low education rates and overall limited access to city services also play a major role in preventing the community to develop. In this scenario, the cyclical shock of seasonal flooding –despite its huge impact on the dweller’s livelihoods- is the condition New Triveni Colony dwellers must accept as their last resort due to their lack of assets to access the city.
For clarity, we have isolated the temporal and spatial frames of where the vulnerability and capacity lie – in reality, however, these overlap, intersect and can reinforce each other. To understand where the vulnerabilities and the capacities lie in a temporal and spatial frame – and the impact of these on the creation of risk or vulnerability – we have developed an adapted risk assessment matrix. This tool is designed to assess and quantify the value of vulnerability or capacity through the quantification of ‘likelihood’ and ‘consequence’ (positive or negative).
In the original tool, hazards are given a certain value on a scale depending on how likely is it for that particular hazard to occur, and another value depending on how significant their potential impact may be. These two values are represented on two sides of a matrix, which in turn assigns a final value resulting from the interaction of both aspects. In our adaptation, we have substituted the hazards with shocks or stresses and coping capacities –a positive value is assigned if the outcome is a capacity or a negative value where the outcome creates vulnerability. By doing this, we can proceed to map the values in a cartesian plane, also introducing a second variable of scale, in in time or space.
The case of New Triveni Colony provides the example of the complex spatial-temporal dynamics of risk. The riverbed is the space upon which this relation relies. In the dry season, it is used as a social hub and also provides means for livelihoods due to its exploitation as a sand bank building up social and financial capacities. However, the temporal frame intersects this nature during the three months of flood in which the previously mentioned capacities get replaced by major vulnerability derived from the loss of shelter, income and savings, and health related issues that come as a consequence of the flooding.
Following to the quantification of vulnerabilities and capacities identified for the case study of New Triveni Colony – derived through the application of the assessment matrix and their grouping by their human, financial, physical, natural or social nature – the next step was to understand where they lie in a spatial and temporal framework.
In order to do so, we propose to map them within a cartesian plane in which the vertical axis represents the magnitude of the value outputted from the matrix, and the horizontal axis marks the scale on the spatial or temporal frame. For the temporal frame the scale includes six markers of frequency consisting of: daily; weekly; monthly; yearly’ 2+ years; and 5+ years. For the spatial frame, the scale marks the dimension of their influence comprising: the individual; household; settlement; group of settlements; downtown; and the city.
As a result of plotting in the temporal and spatial cartesian planes, can identify the patterns that define risk for
time.
particular
Waste inceneration
What can be understood from this case study is the fluctuation of the location of risk in a temporal-spatial frame, in which the same space undergoes a cycle shifting between vulnerability and capacity highlighting the complex dynamics derived from the incorporation of a composite framework that includes both time and space for the same event. Furthermore, it demonstrates how risk is not a fixed point in space nor time but rather a state in which a certain individual or community may be, defined by the sum of its vulnerabilities and capacities.
Also, the physical characteristics of the site along with physical coping strategies such as self-built terraced embankments amplify the impact of the shock into a wide spectrum of magnitude in which it affects the settlement. What can be read from the cross-sections is that a gradient of risk increments with the proximity to the center of the river course. Indeed, informants from the community confirm that the lower houses get washed away each flood, while the upper ones receive major damage but are likely to stand. The pakka (permanent) houses in the formal settlement over the natural embankment receive no damage from the water flow.
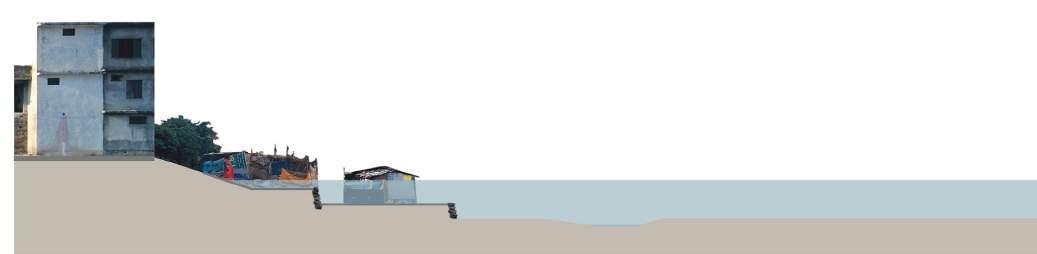
When the temporal scope is limited to a year, what could be perceived is a state of survival – where the assets the community possesses are only enough to return to the previous state after the shock of a hazard. In other words, the measure of vulnerability and capacity are equal.
However, when the temporal scope is extended beyond one cycle, yearly shocks such as flooding can be exacerbated by underlying stresses such as unemployment, poverty or poor health. In these situations, what can be observed is a trend where the addition of underlying stresses creates an increasing level of vulnerability that grows with each cycle. For example, the cycle of debt is reinforced through the continual economic loss derived from each flooding event. Therefore, when ‘summing up’ the measures of vulnerability over an extended period of time, the result shifts from a continual state of survival to a downward spiral into risk.
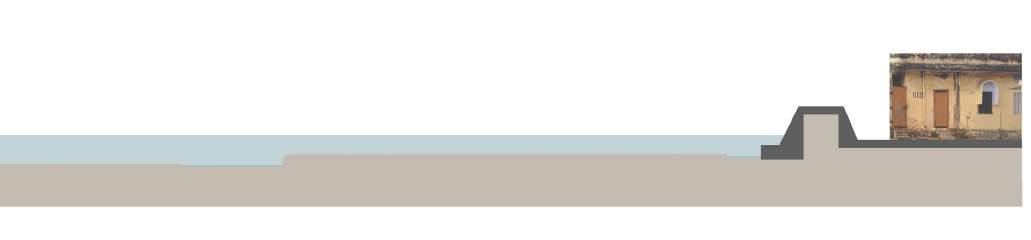
Soil-, air-, and water pollution are caused by an inadequate waste management system that enforces everyday risks on the city. The lack of resources, political will and inadequate education is the major reasons as to why many developing countries don’t prioritize waste management (Giusti 2009). Another reason which in particular is relevant to Rishikesh is the government structure. “Solid waste is being managed at municipal level in India,(…) and requires 80% of the total budget of all municipal corporations…”(Gupta et. Al 1998) In addition to the usual financial disputes, waste disposal sites require governmentally owned land. The acute shortage of land and the rising land prices is a growing problem for municipalities. (Gupta et. Al 1998). Rishikesh is no exception, with the eco-sensitive zone and the no–build buffer zone further complicating the matter. A number of informal dumpsites have been observed in and around the city, as a result of the lack of a proper waste management system (Refer to maps in Chapter 8).
Through different ways of exposure, there are a number of health risks related to inadequate management of waste. Inhalation of smoke from incineration and landfills; consumption of drinking water; contamination from landfill leakage, through the food chain, by consumption of food contaminated with bacteria and viruses from land spreading of sewage and manure, and food enriched with persistent organic chemicals that may be released from incinerators. Research also shows a high risk of gastrointestinal problems related to pathogens the come from sewage treatment plants.
A study on the health effects of breathing the smoke from burning of solid waste, found the smoke to contain high levels of toxic pollutants. The smoke and its tiny particles, “dioxins” can get stuck in lungs, and potentially increase the risk of, or worsen several diseases like asthma, lung and heart disease and other cardiovascular problems, and even cause cancer. Already vulnerable groups, such as elders, children, pregnant women and people with heart or respiratory diseases are most at risk from breathing toxic smoke. When this pollution in the air eventually fall to the ground, it can still find its way to humans through contaminating the ecosystem, to be perpetuated in the system by plants and animals. The toxic smoke’s ability to travel distances with the wind makes the pollution problem extremely hard to undo after its been done (Giusti 2009)
The health risks from pollution is relevant to all people. All genders, ages, income levels and casts are facing the same risks from breathing the polluted air, eating contaminated food or drinking water infused with bacteria or dioxins. To some extent the economically disadvantaged might me more exposed to the sources of pollution, like the sweepers in Swarg Ashram municipality , but the fact is that even the economically advantaged cannot fully protect themselves (Giusti 2009). It is important to minimize the impact on the environment through reducing soil, water and air pollution. Cleaning up is expensive and complicated to reverse. A significant contribution of greenhouse gases comes from different waste management practices. The loss of potential resources is also an important aspect. In India 40-80% of plastic is being recycled compared to 10-15% in the developed countries in the world (Gupta et. Al 1998). The level of consumption in India is much lower compared to the developed countries in the world (Gupta et. Al 1998).
The impacts of waste management are unlike many other typical risks. Hazards like floods, earthquakes or fires come as shocks, pulling the carpet from under your feet. Trash imposes a chronic disaster, the health risk from the waste problem does not demand an acute action in the same way as the previously mentioned hazards do. However it’s a constant threat present all over the city, steadily worsening over time if not mitigated.
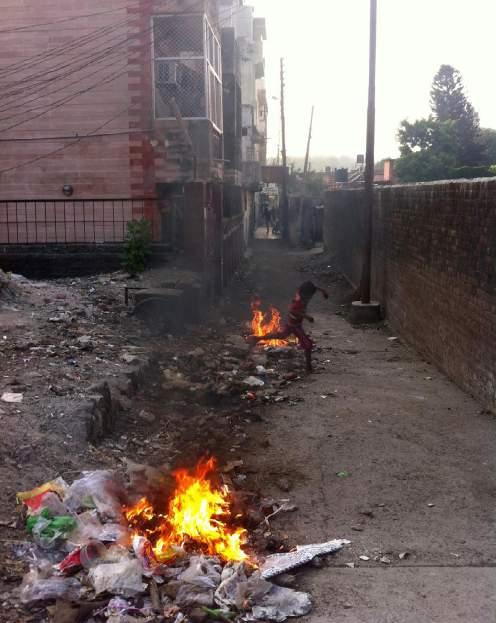
After the main roads, the bridges of Rishikesh are the most important avenues through which one can access different parts of the city. Built in 1935, Laxman Jhula was built as a convenient way to enable residents get from one end of the river Ganga to the other. Over the years, with growth in the city population and the need to increase access and mobility, the Ram Jhula was built 50 years later. Construction for another bridge, the Janki Setu is underway is due to be completed by November 2016. Despite this, the bridges have overtime; and become a space where a conflict plays out between motorbikes and pedestrians. The initial purpose and design of the bridges was to accommodate only pedestrian traffic. However, with the increase in the city population and more intensive commercial activity, motorbikes have made it to the bridges. The result is that pedestrians now have to manoeuvre daily through a mixture of pedestrian and vehicular traffic. This is done at the risk of being run over, and as a result there unnecessary delays and stops while crossing the bridges. A similar observation can also be extended to the streets around the bridges with shops and informal vendors.
The elements highlighted in red are seen as causing disruption and tension to the daily pedestrian flow on and around the bridges. The two major agents in this area are the pedestrians and people on motorbikes. Both agents, are motivated by the path of least effort (Still,2000) in order to get to their desired destination. However, it can be further observed that while the motorbikes take a linear path, with a slight angle of deviation, the pedestrians adapt and conform to the elements of disruption (highlighted in red) in these areas, hence creating erratic paths of circulation. These erratic circulation paths are not just deviations from a linear path, but there exists torque moments, where the pedestrian physically turns his body around an axis to adapt to the disruptive elements. These torque moments are especially frequently observed to be during moments when the motorbikes disrupt the circulation flow by honking to make way for themselves. It is these that are of particular interest as it can aggregate to stampedes and other disasters during high periods of congestation.
In addition to the motorbikes, the stalling of tourists on the bridge to take photos and absorb in the vast panoramic views causes static clusters (Still, 2000) and further tension on the bridge. The above diagram illustrates how pedestrians adapt and manoeuvre their way on the bridge in accordance to their sound perception.
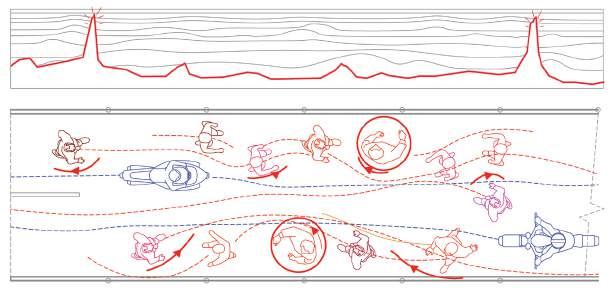
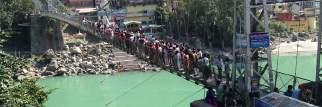
While a barrier currently exists on the bridges to mitigate these tensions, it is somewhat deemed futile due to its placement only at the ends of the bridges. As a result the circulation only appears to get some order and clarity at the very ends of the bridges.

During periods of high congestion, the crowd can be seen moving closely in a finger like movement (Fruin, 1993) slowly. This finger like movements are also motivated by the least effort movement where it is easier to simply follow the person in front of you who appears to be doing the work of manoeuvring through the bridge.


During periods of high congestion, these self-organised lines pose a hidden risk if they encounter disruptive elements on a large scale. For example a bridge with high congestion can easily turn to disaster if a panicked motorbike or tourists causes disruption to the self organized lines creating a form of ripple effect that could easily escalate into stampede or disaster. During such a scenario, a simple torque motion can aggregate across the congestion. This is especially potent during an event of flood, where the bridge plays a huge part in evacuation efforts and panic is rampant among individuals
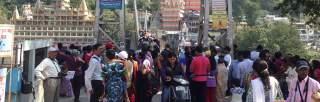
The measures to build resilience can be implemented by both top-down and grass-roots measures. They could be embedded in measures such as policy framework, partnerships between institutions, and practices for responding to the risk of disaster.
In India, disaster management is primarily the responsibility of State Governments. A top-down approach towards resilience building can be carried out through policy reform with the aim of changing laws and regulations. The key policies here include: the Disaster Management Act 2005 and State Disaster Management Plans.
For Example, key contributions of the Disaster Management Act include:
• It establishes the State Disaster Management Authority (Section 14 of the Disaster Management Act, 2005) Act and constituted by Government Order No. 1198/XVIII(2)/07-3(6)/2007 dated 10th October, 2007 (forms a body specifically to deal with risk and resilience)
• It provides the legal and institutional framework for Disaster Management in India, systemising the processes
• It mandates the plan’s application to all levels of State Government, its administrative sub divisions, districts, tehsils, blocks, Panchayats and villages, including the distribution of responsibilities and coordination requirements between all levels.
Enabling the above actions were the defining steps towards formulating a systematic, comprehensive and holistic approach to all disasters. This Act broke away from the “response and relief-centric approach to a proactive, and comprehensive mind-set towards disaster management covering all aspects from prevention, mitigation, preparedness to rehabilitation, reconstruction and recovery” (National Disaster Management Guidelines, 2007).
The floods that hit Uttrakhand on 18th June 2013 were a devastating event for the State – but on the other hand, the event was also an eye opener in terms of the need for strict implementation of Disaster Management Act. The Act had been in place since 2005, however, there was no action plan to implement it until 2014, when Uttarakhand published the State Disaster Management Plan as a tool to help define the disaster response structure. This Plan envisages standardizing pre and post disaster practices, actions and protocol so as to institute a culture of disaster resilience in Uttrakhand. Thus, it must be acknowledged that policies can become resilience building tools, but only if they are implemented and translated successfully into actions.
“Section 23 of the Disaster Management Act 2005... provides for annual review and updating of the state plan, and enjoins upon the state governments to make provisions for financing the activities to be carried out under the state plans.” (National Disaster Management Guidelines, 2007). The need for flexibility and updating according to changes in time is of utmost importance since vulnerabilities and hazards are not constant and new ways to adapt and cope with them are continually emerging.
“Increased coordination, convergence and synergy among the departments and institutions should be promoted in order to promote sharing of resources, perspectives, information and expertise through support of training centres, academic and applied research, education and awareness generation programme, etc” (National Disaster Management Guidelines, 2007).
According to Santosh Badoni, the Deputy Secretary to the Chief Minister of Dehradun, there is strong coordination with the Army and Air-force during relief operations. The coordination system within the government, however needs to be improved. He mentioned that as opposed to western countries in which there is a special force for response to disasters, in India the responders are the Urban Local Bodies. These bodies are, however, not adequately supported by the State Government as of yet. After the 2013 disaster, plans are being made for them, they are trying to allocate some money to awareness and training, and to equip them with urban fire officers who can respond at the time of disaster. In order to better respond and build capacity, the Urban Local Bodies should be strengthened and given more power and resources over disaster response.
In reviewing the 2013 disaster, the key shortcomings found in Uttrakahand were; limited capacity of local bodies, limited land use planning, and limited building laws or compliance.
According to Santosh Badoni, there three (3) pillars of the governance systems that need be simultaneously improved: these are regulatory, structural and administrative systems – critically, balance and coordination between the 3 can build resilience.
The functions of the three systems are:
• Regulatory: Regulation through acts and laws provides a system to prepare. For example the Flood Act 2002 decides the active flood zones of an area. This in turn gives risks and hazards and allows for preparedness.
• Structural: Building by-laws and land use planning falls under the structural component. This is the component that gives shape to the actions that take place on ground and steer towards an optimum way of building. In the event that structural norms aren’t followed; buildings are built on areas that are not suitable to particular land uses – this becomes a primary concern where these outcomes increase the vulnerability of the inhabitants to hazards. A major measure to build resilience in this regard would be to follow correct protocol for land use planning and build the capacity of Urban Local Bodies to execute these.
• Administrative: Administrative component takes into account the system of policies and its implementation. For example, an upcoming attempt in Uttrakhand is to shift summer holidays from May-June to July-August. The reason behind this is to match the holiday months with the onset of hazards, namely the floods that occur so as to keep children at home with family where they can be safe.
“Many a time during storms our sheets fly away, the poles sometimes fall and break leaving our homes torn apart; we are left to rebuild once more” (Kamal Singh).
Local community participative approaches must be taken to build on local knowledge and educate people on the risks they live with; how to prepare; how to overcome risk; and how to prevent hazards from becoming disasters.
Resilience through construction: Masons are they key
“Masons are the key actors who translate designs into reality, especially in developing countries where more than 90% of the buildings are non-engineered, and the masons are commonly serving as the “best technical hands” available for building construction” (NSET 2011).
The mason training programme from Nepal which the above statement refers to can be remodelled to the Indian context – especially in areas like Rishikesh which are geographically similar to Nepal in terms of the hill and mountain terrain as well as lying in the zone 4 and 5 of the earthquake zone. The risk of an impending earthquake looms over Rishikesh and requires the people, especially the masons, to be prepared.
The Nepal-Gujarat Masons Exchange and Training Programme (NGMET) was a collaborative effort between NSET, SEEDS India, and Gujarat State Disaster Management Authority (GSDMA) post the Gujarat earthquake in 2001. The objective of this collaboration was that the masons of Gujarat learn building technology methods of Nepal and experience grass-roots mason training programmes from the Nepalese masons. This training was considered to be successful in terms of: benefiting the community in a longer run with skilled masons; the masons improved their skillsets and therefore, livelihood; and improvement in overall building construction quality. Importantly, although there was a language gap challenge, the programme nonetheless worked successfully since it was masons sharing knowledge with masons through practical activities rather than a technical professional trying to teach a mason. Given the recent earthquake that occurred in Nepal in April 2015, this may be an opportunity for another collaboration in which masons from earthquake prone areas like Rishikesh can learn about rebuilding efforts on the ground, which in turn can increase resilience against the future highlighted risks in RIshikesh.
Living with the risk, Shiv Lal’s story “….agar ganga ke tatt pe sukun se sone ka socha hai May, June or July mai toh ek bar fir sochlo! Kashmir mai bhi sukun hai!”
Literally meaning that “if you have thought of having a sweet sleep near the banks of River Ganga in the month of May, June and July…then think again!” says Kashmir.
During the monsoon period, people of Rishikesh living near the banks of Ganga are forced to make adjustment in their routine living by running to high land.
Shiv Lal aged 42, one of the many migrants in Rishikesh, lives with his wife and two daughters in their JJ (Jhuggi-Jhopadi) type house near the Bombay Ghat at Laxman Jhula. His tenure security comes from the lease he acquired from Sansewa Ashram. “When the rain starts in May, I move my belongings; cooking stuffs, clothes and grocery items uphill. I am not always sure of the specific place to stay uphill but I know that I will find somewhere safer to stay, safer than this place” says Shiv Lal.
As Shiv Lal explains, after witnessing the 2013 floods which killed people and destroyed properties, he decided to temporarily vacate his home until the risky months pass. He is happy to own the place rather than being homeless. As Shiv Lal routine depicts, measures of resilience are not a trial and error exercise; they are efforts grounded in everyday life in the city and forecast of the future predictable and unpredictable risk.
Since the local community is the most affected population during disasters, community awareness and preparedness is the effective way forward. The application of one such awareness and training programme started post-disaster; a 10 day programme in which boys and girls receive search and rescue training conducted in both rural and urban periphery areas. Santosh Badoni states that till now 8000 children have been trained. This is to increase daily resilience amongst the younger generation to cope with the frequent disasters that take place. Initiatives on ground have started, the need for continuation and regular appraisal is necessary.
Divided into five groups for four weeks, the detectives looked for evidences of risk and resilience in the city of Rishikesh. Armed with PRA tools of observation, key interviews, surveys etc., they embarked upon making an in-depth enquiry into what risks plague the city, how they make the people vulnerable and their means and methods of negotiating with these. Reflecting our collective faith on bottom-up approach, the teams began with interacting with locals about their problems and what they thought were their viable solutions. The opinions, suggestions and views that were received were then analyzed vis-à-vis secondary information and key informal interviews to establish a scientific evidence for conducting a ‘planning for real’ exercise. Planning for real involved participants writing recommendations on paper and a non-verbal exchange of ideas to reach a consensus.
Two rounds of such exercises, keeping in mind the group research and the agreed terms of references, revealed the final recommendations. These recommendations were drafted and systematically categorized into time frames viz. short term (achievable within a year), medium term (achievable within 1to 5 years) and long term (achievable in more than 5 years) depending on our experience with such programs in the past. The following section involves a detailed discussion on the recommendations that could help reduce the vulnerability of the city of Rishikesh.
Table: Matrix of recommendations
Recommendation
Short term (0-1) years
Medium term (1-5) years
Long term (5+) years
Take stock of the policies that already exist
Short term (0-1) years
Medium term (1-5) years
Map land tenure
Short term (0-1) years
Medium term (1-5) years
Timeline
• Map of boundaries and responsibility of local and district government. In order to understand the responsibilities of each one of the government levels in the city.
• Create a forum with major stakeholders to improve relations between them and align common projects.

• Tourist tax. Each year, the influx of tourists (domestic and international) put pressure on the city’s infrastructure, services and ecosystems. The costs of this added burden should be shared by all.
• Public Private Partnerships within the Ashrams and municipality to improve infrastructure conditions.
• Realignment of boundaries to have one governing body for Rishikesh. To improve governance and avoid conflicts between multiple local bodies and district administrations.
• Existing policy review in context of Rishikesh and assess their applicability and suggest relevant changes or adaptations (eg. Slum Policy of 2011)
• Create and enforce an action plan within the alignments of the existing policy.
• A transparent relocation and resettlement plan coordinated between municipalities and state level.
• Carry out survey of existing land tenure in order to understand the ownership within the city and to avoid the ecological impact with the expansion of it.

• Digitalize the land tenure map and make it available for the public to increase transparency within municipality, land management and citizens.
• Carry out research to assess sprawl capacity, based on the developed plan, for future development.
• evelop capacity for emergency requirement for shelter.
Actors (initiative – takers)
• Govt. of Uttarakhand
• Dehradun, Pauri and Tehri Distt. administration
• Rishikesh, Muni-kiReti, Swargashram Municipalities
• Ashrams / Trust
• Businesses
• Communities
• nGOs
• Institutions
• Private companies
• Tourists
• Rishikesh, Muni-kiReti, Swargashram Municipality
• Govt. of Uttarakhand
• Rishikesh, Muni-kiReti Municipality
• Tehsil office
• Govt. of Uttarakhand
Get into the business of trash
Short term (0-1) years
Medium term (1-5) years
• Awareness programs on waste management, to build social consciousness about the impact of trash in the environment.
• Installation of dust bins to strengthen the awareness program.
• Regulating the use of plastic bags through a regional tax to reduce waste generation and mitigate environmental harm
• Source segregation of waste. Efficient recycling, financial rewards for waste segregation are introduced

• Comprehensive study on the economics of waste management, in order to understand the amount of money that the city could made out of recycling and manage waste
Actors (initiative – takers)
• Govt. of Uttarakhand
• Rishikesh, Muni-kiReti, Swargashram
Municipality
• nGOs
• Communities
Pedestrianise the streets
Short term (0-1) years
Medium term (1-5) years
• Install lights on the bridges in order to improve visibility and enhance safety of pedestrians at night.
• Pedestrianizing Ram and Lakshman Jhula and the market street near Ram Jhula, to avoid collisions with motor bikes and create a pedestrian friendly environment.
• Light up heavily used streets, to increase visibility and safety during night time, prioritizing the pedestrian presence.
• Rishikesh, Muni-kiReti, Swargashram
Municipalities
• Private companies
Break the poverty cycle through education
Short term (0-1) years
Medium term (1-5) years
• Awareness program to highlight the need for education, along with simple skill development
• Taking stock of educational infrastructure in the city
• Monetary support for low income families which could include a small allowance for living costs as well as free transport to the schools.
• Skill development and disaster awareness workshops
• Creation of corpus for upkeep of existing schools
Long term (5+) years
Build a better future

Short term (0-1) years
Medium term (1-5) years
• Introduce disaster mitigation and management in school curriculum and Gurukul system. To promote general awareness and preparedness.
• Govt. of Uttarakhand
• Rishikesh, Muni-kiReti, Swargashram municipalities
• nGOs
• Ashrams
• Communities Union (eg autorickshaw union)
Provide city services to all inhabitants
• Set up of Trade Factories (FAROs), to provide opportunities for locals to build capacity through developing microbusiness. Centres to focus on increasing skilled labour and includes teaching, developing and financing to enable start-ups.
• Govt. of Uttarakhand
• nGOs
• Rishikesh, Muni-kiReti municipalities
• Private companies
Provide city services to all inhabitants

Short term (0-1) years Short term (0-1) years
Medium term (1-5) years Medium term (1-5) years
• Evaluation of existing infrastructure
• Temporary protection against immediate hazards
• Access to basic public needs of all inhabitants should be guaranteed
• Community based disaster warning system to build everyday capacity with the locals.

• Community awareness and training programmes (e.g. mason training)
• Adapt the State Disaster Management Plan to the local context
• Strengthen local disaster response by making adequate policies
• Implementation of early warning systems such as flood sensor

• Govt. of Uttarakhand
• Rishikesh, Muni-kiReti, Swargashram municipalities
• nGOs
• Govt. of Uttarakhand
• Dehradun, Pauri, Tehri District administration
• Rishikesh, Muni-kiReti, Swargashram municipalities (eg. Disaster response cell)
• Local communities
Make the risks visible
Short term (0-1) years
Medium term (1-5) years
Long term (5+) years
• Establish a data base of ecological vulnerability in order to understand the different possible disasters.
• Put up warning signings of multiple risk spots to inform the locals and especially tourist about the possible existing risks.
• Establish a data base of ecological vulnerability.
• Planning for alternate routes for evacuation and traffic diversion during emergencies
• Design green buffers along the river, combining ecological restoration with recreation, with multi-purpose uses.
• Govt. of Uttarakhand
• Rishikesh, Muni-kiReti, Swargashram
municipalities
• nGOs
Hence, it is understandable that there is no dearth of actions that can be taken in a time span that extends from immediately to at least this decade to build resilience of the citizens of Rishikesh. It is discernable from the above table that the government (central, state and local) has the central role in improving capacities and reducing vulnerabilities of the people. A due cognizance is also required to the effectiveness of the informal governance machinery that is already in place and popular with the people.
Commenting on the efficacy of the above recommendations in reducing vulnerabilities over the next few years, it is worthwhile noting that since the vulnerabilities are interconnected in a person’s life, the improvement in one changes the susceptibility to the other. This could be explained by taking the clarification of land tenure of Rishikesh as an example.
If the government takes up the clarification of land tenure, the ownership of land will stand clear in the city. This could mean that people would now know the extent of their ownership and their land rights. This would mean a better investment in housing and infrastructure, thereby reducing physical vulnerability. Evidence suggests that the secure land tenure builds confidence and improved social tie-ups that help reduce social vulnerabilities. Improved access to land could also translate into other economic opportunities that might results in diminishing economic vulnerabilities in due time.
This discussion proves that it is difficult to attribute the reduction of a particular vulnerability to one recommendation or action. Rather it can be thought of as a chain reaction and since all the changes, irrespective of their micro or macro level, will impact the life of every citizen (though to different extents), it is safe to conclude that every recommendation will ultimately serve to simultaneously reduce the different vulnerabilities of the people of Rishikesh.
The PRA tools mentioned in previous sections were helpful in developing an understanding of the realities of life, and getting a predictive insight into the rather complex context of Rishikesh. Our understanding of the city was also aided by the decision to divide the team based on themes and locations. The effective use the PRA tools required that a number of factors be taken into consideration;
• The application of these tools had to consider managing of the community expectations, ensuring that they were not raised too high or too low.
• Related to the above was the need to build trust among the respondents so that they could be able to open up and share their experiences.
• With limited experience in the use of the tools, it was helpful to be mindful that this was going to be a ‘learning by doing’ exercise, where learning is always an on-going process for the researcher as well as for the respondents.
• Our work was temporarily slowed down because there was some difficulty accessing the government offices from whom secondary data like; city maps, reports and such like could be collected. The challenge was further amplified by some unanticipated state holidays and some festivities that meant public offices were not open.
• After collecting a considerable amount of qualitative data, there was need to also gather quantitative data to support some of the claims made in the interviews and observations. Quantitative data was collected through surveys in settlements because the PRA tools at our disposal could not adequately do this.
• In hindsight, we should have tried to use a broader variety of PRA-Tools for our own learning and for more effective triangulation of the information gathered. This realization came late for us since our study was not initially focused on one specific area or group of people. In retrospect, we think that this could have been tested more tools if we had focused on a smaller area from the beginning.
• Chambers (1992) emphasises that community hand over is a key element of PRA that sets it apart from Rural Rapid Appraisal. Due to the limited timeframe we had and the varied areas of interest where we worked, it was not possible to have the ideal community hand over. However, a community presentation organised at Triveni Ghat was a good substitute and feedback from the community was collected.
• The phase of analysing and processing our findings from fieldwork and workshops proved quite time-consuming. If there was more time given to the different case studies the review of secondary studies would have been more analysed. Because of short time on field and the public holidays we experienced, it was difficult to build enough trust and relationships with the local community.
Table: Matrix of reflections on PRA tools used
Tool
Mapping
Description
Interactive and involves respondents drawing a map of what they perceive their settlement to be.
This can be in form of individual drawings or identifying key features.
Maps may also show organisations and their interactions
How was the tool deployed
Circulation of traffic at the bridge or the routes taken by the waste management personnel.
Postive
Very effective to attract community interest, a good starting point for the use of PRA tools
How could be improved
Putting the pen or pencil on a blank piece of paper
Transect walks
Involves taking a walk while observing.
Questions related to what is being seen can be asked.
Walking along roads and paths early in the morning to meet up the local trash pickers.
The observations provide a basis for interview question
It is easy to get distracted especially in business environments
The existing situation of the places is observed.
The method can be used hand in hand with other methods like transect walks
How was the tool deployed Activities and different levels of flux at the bridges and surrounding areas.
This provided the basis of some of the interviews to get more insights into what was being observed.
Visual representation of Information gathered from interviews and secondary data
The historical development and transformation that has taken place in Rishikesh.
Visual representation of factual information. Effective tool to get people’s attention for interviews because it involves conversation
An observation checklist is always helpful to help filter all the information being collected
Seasonal Calendar
Visual, graphic representation of activities that take place at different parts of the year
Comparison of seasonal income due to flooding and influx of tourists during holidays.We were able to identify the seasonal trends within communities; and periods of risk and vulnerability
It is highly visual and easy to understand
Chapati diagram (Venn diagram)
Was used to visualise different groups and organisations operating within community; their level of influence and relations to each other.
Organisational relations can be easily visualised
When there are many actors, the diagrams create confusion and may distort the message being portrayed
Interviews
These are mainly flexible conversations that swung between one topic to another, adapts according to the interview situation.
Information regarding sensitive topics like politics and religion discussed with local authorities are often better addressed individually.
Interviews were able to be done at different scales; from the household level to higher authorities.
A lack of understanding (comprehension) of the local language Hindi by most of the members the team meant that some information was lost in translation; It is difficult to sustain translated conversation
Data of the different activities people do at different times of the day, days of the week or months of the year
Comparison of the activities of different people; men, women and children throughout the day. Used to identify the number of hours spent per task or location
When we were interviewing local authority one member in the team was leading the conversation while another one was taking notes.
Depending on the time of day research is made different target groups and activities could be observed
Support team members by taking turns to note. To avoid memory bias it was important that team members took notes during activities.
It can sometimes disrupt the concentrations or even be awkward to document
Making sketches of interesting activity; usually by the respondents or of them

How was the tool deployed
We sketched portraits of children’s faces, children were invited to sketch shapes of houses in their settlement
Postive
Attracted attention and interest, and the products elaborated points that were made in the notes taken
How could be improved
Taking photos and recording of the events of interest as they unfold
Involves using a prepared questionnaire to collect both quantitative data to qualitative data
Facebook, blog, Instagram and twitter the research team has tried to reach out to more people
Photos and videos activities around cities bridges and daily activities in communities.
A survey was administered in formal and informal settlements to support observed data.
Generating of visual aids that Supplementing the information collected through interviews and observations
Connect inhabitants and foreigners with information about upcoming events.
It can be difficult to do in the beginning and targeting questions are identified during research process
Limitations using webbased media are that it is excluding the ones with no resources.
With the notion to build from local knowledge and wisdom to better prepare communities, towns, cities, etc, to become resilient in the face of proneness to disaster as well as disasters themselves, the Urban detectives set out to learn from the everyday life experience of systems, understand the vulnerabilities, locate the risk in space, Identify the players and uncover where/how negotiation of this risks is done. After 5weeks of investigation, fieldwork and consultations, it is important to note that:
• Tension between ecologically sensitive and development needs of Rishikesh is inevitable.
Rishikesh is one thread of City bounded different fragile ecosystems, the forest which is part of the National park, hilly terrain, R. Ganga and its valley among others, with the current pace of development, there is a clear tension calling for compromise from the State, local policy regulations, planning tools, different interest groups and community along the provisions in policy and the development needs of the area. It is evident that one way to address such tensions is by negotiation
• Daily survival needs equally need urgent response as the disaster event itself.
Whereas disaster could be regarded as an event or a process of series of events, everyday life issues could fuel vulnerability and thus increase risk. Livelihood options reduce the vulnerability risk amongst communities and thus a tool to building resilient communities. Whereas one could easily conclude that an area like Rishikesh is too much prone to land slides and flooding but the risk could be fuelled by unemployment and poverty in the community.
• Risk fluctuates through time and space
Risk is a dynamic state, and fluctuates through time and space and especially between their interaction: today’s capacities may be tomorrow’s vulnerabilities. Also, the same vulnerability may pose different risk to different places of the same space.
• Non formal networks (invisible players) are a strong foundation for building Resilience
Beyond the contemporary formal processes of negotiating risk , there are invisible -informal structures/networks which equally influence outcomes in space and thus are a good foundation to build resilience.