ACTA FACULTATIS XYLOLOGIAE ZVOLEN

VEDECKÝ ČASOPIS SCIENTIFIC JOURNAL


Vedecký časopis Acta Facultatis Xylologiae Zvolen uverejňuje pôvodné recenzované vedecké práce z oblastí: štruktúra a vlastnosti dreva, procesy spracovania, obrábania, sušenia, modifikácie a ochrany dreva, termickej stability, horenia a protipožiarnej ochrany lignocelulózových materiálov, konštrukcie a dizajnu nábytku, drevených stavebných konštrukcií, ekonomiky a manažmentu drevospracujúceho priemyslu. Poskytuje priestor aj na prezentáciu názorov formou správ a recenzií kníh domácich a zahraničných autorov.
Scientific journal Acta Facultatis Xylologiae Zvolen publishes peer-reviewed scientific papers covering the fields of wood: structure and properties, wood processing, machining and drying, wood modification and preservation, thermal stability, burning and fire protection of lignocellulosic materials, furniture design and construction, wooden constructions, economics and management in wood processing industry. The journal is a platform for presenting reports and reviews of books of domestic and foreign authors.
VEDECKÝ ČASOPIS DREVÁRSKEJ FAKULTY, TECHNICKEJ UNIVERZITY
VO ZVOLENE 66 2/2024
SCIENTIFIC JOURNAL OF THE FACULTY OF WOOD SCIENCES AND TECHNOLOGY, TECHNICAL UNIVERSITY IN ZVOLEN 66 2/2024
Redakcia (Publisher and Editor’s Office): Technická univerzity vo Zvolene (Technical university in Zvolen); TUZVO Drevárska fakulta (Faculty of Wood Sciences and Technology)
T. G. Masaryka 2117/24, SK-960 01 Zvolen, Slovakia
Redakčná rada (Editorial Board):
Predseda (Chairman): prof. Ing. Ján Sedliačik, PhD, TUZVO (SK)
Vedecký redaktor (Editor-in-Chief): prof. Ing. Ladislav Dzurenda, PhD, TUZVO (SK) Členovia (Members): prof. RNDr. František Kačík, DrSc. TUZVO (SK) prof. RNDr. Danica Kačíková, MSc. PhD., TUZVO (SK)
prof. Ing. Ivan Klement, CSc. TUZVO (SK) prof. Ing. Jozef Kúdela, CSc. TUZVO (SK) prof. Ing. Mariana Sedliačiková, PhD. TUZVO (SK) prof. Ing. Jozef Štefko. CSc. TUZVO (SK doc. Ing. Hubert Paluš, PhD. TUZVO (SK)
Jazykový editor (Proofreader): Mgr. Žaneta Balážová, PhD. Technický redaktor (Production Editor): Ing. Michal Dudiak, PhD.
Medzinárodný poradný zbor (International Advisory Editorial Board): Antov Petar Yordanov (Univ of Forestry, BG), Bekhta Pavlo (Ukrainian Nat Forestry Univ, UA), Deliiski Nencho (Univ of Forestry, BG), Hua Lee Seng (UiTM Cawangan Pahang, MY), Jelačić Denis (Univ Zagreb, HR), Kasal Bohumil (Tech Univ Carolo Wilhelmina Braunschweig, DE), Lubis Muhammad Adly Rahandi (Kyungpook Nat Univ, ID), Marchal Remy (Arts & Metiers ParisTech, FR), Németh Róbert (Univ Sopron, HU), Niemz Peter (Bern Univ Appl Sci, Architecture Wood & Civil Engn, CH), Orlowski Kazimierz A.(Gdansk Univ Technol, PL), Pohleven Franc (Univ Ljubljana, SI), Rogoziński Tomasz (Poznań Univ of Life Sci, PL), Teischinger Alfréd (Univ Nat Res & Life Sci, BOKU, AT), Smardzewski Jerzy (Poznań Univ of Life Sci, PL), Vlosky Richard P. (Louisiana State Univ, USA), Wimmer Rupert (Univ Nat Res & Life Sci, AT).
Vydala (Published by): Technická univerzita vo Zvolene, T. G. Masaryka 2117/24, 960 01 Zvolen, IČO 00397440, 2024
Náklad (Circulation) 80 výtlačkov, Rozsah (Pages) 171 strán, 14,07 AH, 14,20 VH
Tlač (Printed by): Vydavateľstvo Technickej univerzity vo Zvolene
Vydanie I. – december 2024
Periodikum s periodicitou dvakrát ročne
Evidenčné číslo: 3860/09
Acta Facultatis Xylologiae Zvolen je registrovaný v databázach (Indexed in): Web of Science, SCOPUS, ProQuest, AGRICOLA, Scientific Electronic Library (Russian Federation), China National Knowledge Infrastructure (CNKI)
Za vedeckú úroveň tejto publikácie zodpovedajú autori a recenzenti. Rukopis neprešiel jazykovou úpravou.
Všetky práva vyhradené. Nijaká časť textu ani ilustrácie nemôžu byť použité na ďalšie šírenie akoukoľvek formou bez predchádzajúceho súhlasu autorov alebo vydavateľa.
© Copyright by Technical university in Zvolen, Slovak Republic. ISSN (print) 1336–3824, ISSN (online): 2730-1176
01. KAZIMIERZ A. ORLOWSKI – DANIEL CHUCHALA – MONIKA SERAFINOWICZ – SYLWIA KOWALSKA: THE EFFECT OF BEECH WOOD DRYING ON HARDNESS IN THE LONGITUDINAL DIRECTION FROM THE BEGINNING TO THE REAR OF THE SAMPLES ...................................................................................................... 5
02. IVAN KLEMENT – TATIANA VILKOVSKÁ – PETER VILKOVSKÝ: CROSS WARPING DURING VARIOUS DRYING PROCESSES OF BEECH WOOD (FAGUS SYLVATICA L.) ....................... 13
03. LADISLAV DZURENDA – MICHAL DUDIAK: THE EFFECT OF STEAMING ON THE COLOR CHANGE OF FALSE HEARTWOOD BEECH 23
04. ZUZANA VIDHOLDOVÁ – GABRIELA SLABEJOVÁ – JOZEF KÚDELA – JÁN SVOCÁK: THE EFFECT OF NATURAL WEATHERING ON STABILITY OF COATING SYSTEM WITH SELFHEALING MICROCAPSULES ..................................................................... 35
05 RICHARD NADÁNYI – MICHAELA DŽUGANOVÁ – ALEŠ HÁZ: OPTIMIZED LIGNIN RECOVERY FROM BLACK LIQUOR FOR ENHANCED MECHANICAL PROPERTIES OF ACRYLONITRILE BUTADIENE RUBBER COMPOSITES .......................................................
06 LUKÁŠ ADAMČÍK – RICHARD KMINIAK – ADRIÁN BANSKI: COMPARISON OF THE ROUGHNESS OF THE CNC MILLED SURFACE OF SELECTED WOOD SPECIES ............................................. 61
07. ZHIVKO GOCHEV – PAVLIN VITCHEV: THE EFFECT OF THE FOCAL LENGTH POSITION OF THE FOCUSING LENS ON THE DISCOLORATION ROUGHNESS OF PLYWOOD UNDER DIFFERENT CO2 LASER ENGRAVING MODES ...............................................................
08. MIKHAIL CHERNYKH – ALINA KOREPANOVA – EKATERINA MAKSIMOVA – VADIM SEVRYUGIN – MAXIM GILFANOV –VLADIMIR STOLLMANN: SELECTING COLOR OF MOSAIC PATTERN ELEMENTS FOR LASER ENGRAVING ON WOOD 89
09. MARIÁN IHRING – SIMONA HANES: ALTERNATIVE DESIGN CREATION 103
10. DOROTA MICHALAK – ZDZISŁAW KWIDZIŃSKI – MARTA PĘDZIK – JOANNA BEDNARZ – ŁUKASZ SANKIEWICZ –BARTŁOMIEJ KNITOWSKI – MARCIN DREWCZYŃSKI –TOMASZ ROGOZIŃSKI: THE IMPACT OF DOOR LEAF PARAMETERS ON THE EFFICIENCY OF THE AUTOMATED TECHNOLOGICAL LINE .................................................................................. 115
11. JÁN PAROBEK – HUBERT PALUŠ – MARTIN MORAVČÍK –MIROSLAV KOVALČÍK – MICHAL DZIAN: UTILISATION AND QUANTIFICATION OF WOOD BY-PRODUCTS FROM PRIMARY WOOD PROCESSING 125
12. SILVIA LORINCOVÁ: TRENDS AND CHALLENGES IN MANAGING THE FORESTRY AND WOOD-PROCESSING
13. KATARÍNA MARCINEKOVÁ – ANDREA JANÁKOVÁ SUJOVÁ –MARTIN HALÁSZ: AGILITY ASSESSMENT IN THE WOODWORKING COMPANY
ACTA FACULTATIS XYLOLOGIAE ZVOLEN, 66(2): 5 12, 2024
Zvolen, Technická univerzita vo Zvolene
DOI: 10.17423/afx.2024.66.2.01
THE EFFECT OF BEECH WOOD DRYING ON HARDNESS IN THE LONGITUDINAL DIRECTION FROM THE BEGINNING TO THE REAR OF THE SAMPLES
Kazimierz A. Orlowski – Daniel Chuchala – Monika Serafinowicz –Sylwia Kowalska
ABSTRACT
The objective of this study was to determine the hardness of beech wood samples (Fagus sylvatica L.)in thelongitudinal directionfrom thebeginningto therearofthesamples versus the method of drying. The warm air-steam mixture drying process and the modified airdrying process were used in the experiment. The warm air-steam mixture drying process, in comparison to the modified air-drying process, caused a reduction of the Janka hardness by about 15.4%. Although the hardness along the length of the sample dried with a mixture of air and steam is leveled, this is not the case for the beginning and the rear of the sample, where drops in hardness are observed.
Keywords: beech wood; specific drying methods; Janka hardness.
INTRODUCTION
Most often, the re-sawing process is done for timber after drying. High quality of sawing, low material losses, and high efficiency are required for this kind of sawing process. Appropriateoptimization ofthesawingprocess allowstheseexpectations tobe metto alarge extent. Accurate forecasting of cutting power allows the sawing process to be optimized and, consequently, the above-mentioned expectations of the process to be met. A precise forecast of the cutting power demand for the sawing process encourages optimally choosing the numberofsawblades and theirspacing, whichensures effectiveuseofthesawingmachine’s capabilities and prevents overloading of these machines. To reduce the drying time, one of the methods is drying with the warm air-steam mixture process proposed in the works by Baranski et al. (2017) and Baranski (2018). The proposed method can reduce the drying time. However, this process affects the granularity of dust during sawing (Orlowski et al., 2019, Rogoziński et al., 2021), and also the mechanical properties of dried wood, such as fracture toughness and shear yield stresses along the shear plane in the cutting zone (Baranski et al., 2014, Chuchala et al., 2020, Muziński, 2021) similarly as the effect of the wood provenance (Hlásková et al., 2018), and colour changes (Barański et al., 2020, Suchta et al., 2024).
The effect of the drying treatment on the planing and moulding properties of wood has been the subject of only a few studies (Hernandez et al., 2001). Sehlstedt-Persson (1995),
Terziev and Daniel (2002), and Hansson and Antti (2006) have reported that no significant effect of the drying temperature was noticed in the case of softwood species, namely Scots pine and Norway spruce. The hardness, planing, and moulding properties of tamarack wood (Larix laricina (Du Roi) K. Koch) from natural forests were evaluated on kiln-dried specimens by Avila et al. (2009) following three types of drying schedules: high temperature, elevated temperature, and conventional. Machining and hardness properties appeared not to be affected differently by the drying process (Avila et al., 2009). They stated that tamarack wood is suitable for the fabrication of flooring products.
While investigating the effect of the drying method of beech wood (Fagus sylvatica L.) on the energy effects during sawing wood on the sash gang saw, lower cutting power values were observed at the beginning of the samples and at the exit of the saws from the cut beam (Muziński, 2021). This phenomenon was not observed during the tests conducted when cutting pine wood (Pinus sylvestrisL.) (Licow et al., 2020). Cutting forces are dependent on raw material provenance and wood density (Chuchala et al., 2014). Moreover, Avila et al. (2009) found that the hardness of tamarack wood was positively related to wood density.
The objective of this study was to determine the hardness of beech wood samples (Fagus sylvatica L.) in the longitudinal direction from the beginning to the rear of the samples versus the method of drying.
MATERIALS AND METHODS
Materials
The investigation was carried out for samples of beech wood (Fagus sylvatica L.) originating from the Baltic Natural Forest Region (PL) (the Pomeranian District, Poland). The wood specimens used in the sawing experiments were prepared as blocks in dimensions of W (Width) = 80 mm × H (Height) = 80 mm × L (Length) = 850 mm (for kiln drying) and 700 mm (for air drying) in the sawmill PHU Drew-Met, Kiełpino, Poland. Samples of beech wood were marked as BS for kiln-drying and BP for air-drying. Examined samples were dried with different modes in industrial and laboratory conditions. Both groups of analysed samples had a moisture content of about 72 % before the drying process. After drying, samples were prepared from the blocks mentioned above for hardness examination on the sash gang saw PRW15M (a prototype designed at the Department of Manufacturing Engineering and Automation. GUT, PL; manufactured by REMA-Reszel, PL) with a hybrid dynamically balanced driving system and elliptical teeth trajectory movement, as described by Wasielewski and Orlowski (2002). The oven-dry density of the air-dried samples averaged 661 kg∙m-3 with a standard deviation SD = 31.35, while the oven-dry density of the kiln-dried samples averaged 631 kg∙m-3 (SD = 17.1).
Warm air-steam mixture drying process
The drying process was conducted in an experimental semi-industrial kiln designed by Gdansk University of Technology employees and manufactured by ASM Elektronik CLP, Szczaniec, Poland. The mentioned kiln is located at the Gdansk University of Technology. The methodologies of the experimental warm air-steam mixture drying process were described in detail by Baranski et al. (2017), Klement et al. (2018), and Baranski (2018). The drying process was carried out in two stages and supervised by a control system. In the first stage, the drying medium temperature in the drying kiln was increased to 65 °C and in the second stage, to 80 °C. The final moisture content was obtained at around 10%. Wood
samples dried in the warm air-steam mixture drying process were additionally marked with S.
The combined air-drying process
This process was conducted outside the workshop at the Campus of the Gdansk University of Technology (Gdansk, Poland). The samples were stored under the sloped roof to keep from rain. Humidity and temperature were variable and dependent on weather conditions. The drying process was carried out in the Pomeranian Voivodeship in Poland and lasted 16 months. It started in late December and ended in April. At the end of the first process stage, the moisture content in dried material was approximately 16%. The second stage of the combined air-drying process was conditioning wood samples in a laboratory room (Gdańsk Tech laboratory), where thermal-flow conditions, such as temperature and air velocity, ensured reaching the final value of moisture content of around 10%. This modification allowed the receipt of moisture content values similar to those obtained from other analysed drying processes.
Hardness measurements
Vörös and Németh (2020) presented the history of the currently practiced static hardness test methods from 1860 till nowadays, considering the applied tool geometry and the definition and calculation of wood hardness. The most common tests for the determination of wood hardness are the Janka hardness test, Brinell hardness test, and Monnin hardness test (in France, according to Chalais – Meudon) (Riggio and Piazza, 2011, Vörös and Németh, 2020, Koczan et al., 2021).
In this study, the Janka test was selected, which is currently applied to assess the suitability of wood species for use as flooring (Riggio and Piazza, 2011, Avila et al., 2009). Before the hardness tests, the planks were divided into three parts: beginning B, middle M, and rear R (Fig. 1).
The hardness test was conducted by the ASTM D143 standard (ASTM, 1994), except for the dimensions of the specimens. The steel hemisphere with a diameter of 0.444 (ball 11.28 mm, projected area of 100 mm2) under the static loading is completely embedded in the wood. Hence, the hardness is always specified as the load H at the penetration of 0.222 in (5.64 mm). To ensure repeatability of penetration, the hemisphere was finished with a special collar; it should be emphasized that the particular hemisphere was CNC–machined. Indentations (Fig. 1) were made on two lines 30 mm apart on specimens with a pitch equal roughly to 28 mm.
The electromechanical Universal Testing Machine manufactured by Instron, model 1195 (capacity 100 kN) (Instron, Norwood, MA, USA), was used in the hardness tests. The hardness tool's penetration rate was equal to 7.5 mm×min-1 in each case. The test set-up allowed continuous recording of load with a sampling frequency of 10 Hz.
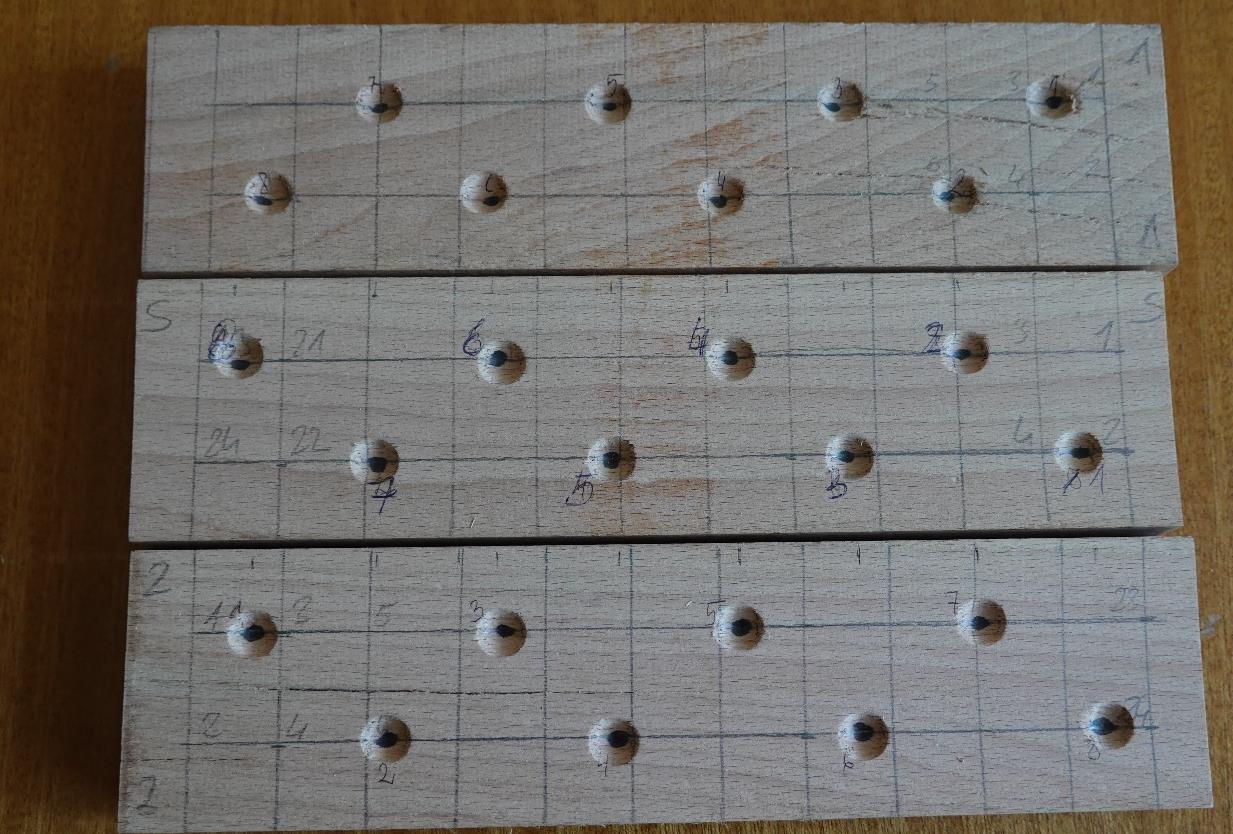
Fig. 1 Positions of indentations at the samples in the Janka hardness test, where: B – beginning part of the sample, M – middle part of the sample, R – rear part of the sample.
RESULTS AND DISCUSSION
The results of the average Janka hardness values for the modified air drying process samples as a function of relative distances from the sample beginning because of differences in sample total length are shown in Fig. 2. Each point in the graph is an average value of 3 measurements. Analysing the trend line, it can be seen that the changes in hardness are distributed parabolically, with the maximum values occurring at the mid-length of the sample. The average hardness value for the initial sample B (Fig. 1) (relative length range 0.04 - 0.32) was determined to be 7.156±0.135 kN. Confidence intervals were determined at a significance level of 0.05 according to the t-Student test (Kacew, 1978, Sachs, 1984). For the middle part M (relative length range 0.397 - 0.597), the average value was equal to 7.423 ±0.094 kN, and for the rear part, R (relative length range 0.680 - 0.960) was equal to 7.039 ±0.086 kN.
The results of the average Janka hardness values for warm air-steam mixture drying process samples as a function of relative distances from the sample beginning are presented in Fig. 3. Each point in the diagram is an average value of 8 measurements. In this case, it can be observed that in the range from 0.1 to 0.9, the trend of change is rather horizontal, not parabolical, and the hardness values are in the approximate range of 6 kN. For the latter range, an averagevalueoftheJankahardness equals 6.053±0.16 kN. Inboth cases, theJanka hardnesses are approximately 0.6 kN lower at the front and rear faces of the specimen. This phenomenon could be a reason for decreasing cutting power values, which were observed at thebeginningofthesamplesandatthe exitofthesawsfrom thecutbeam whileinvestigating the effect of the drying method of beech wood (Fagus sylvatica L.) on the energy effects during sawing wood on the sash gang saw (Muziński, 2021).
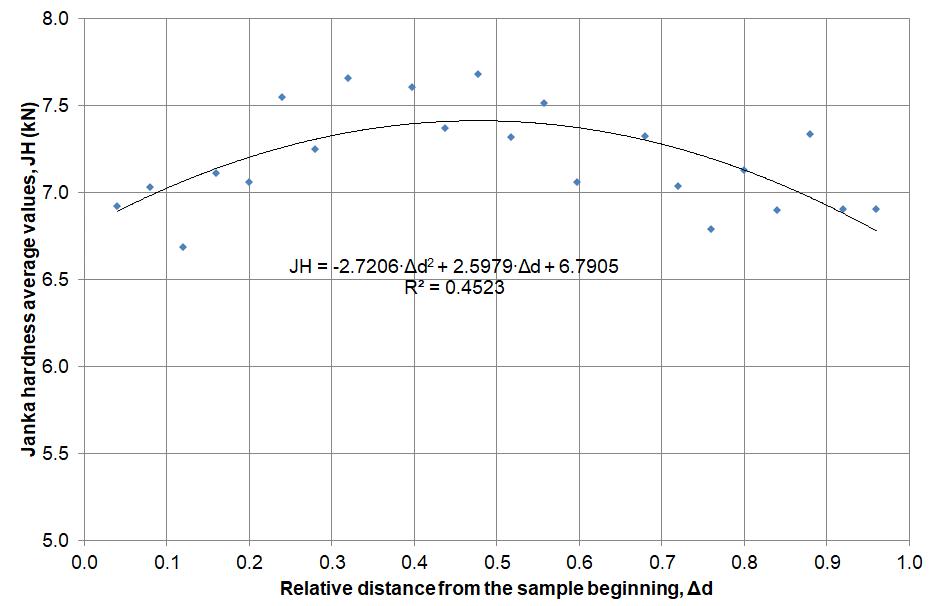
Fig. 2 Janka hardness average values for the combined air drying process of beech samples in a function of relative distances from the sample beginning.
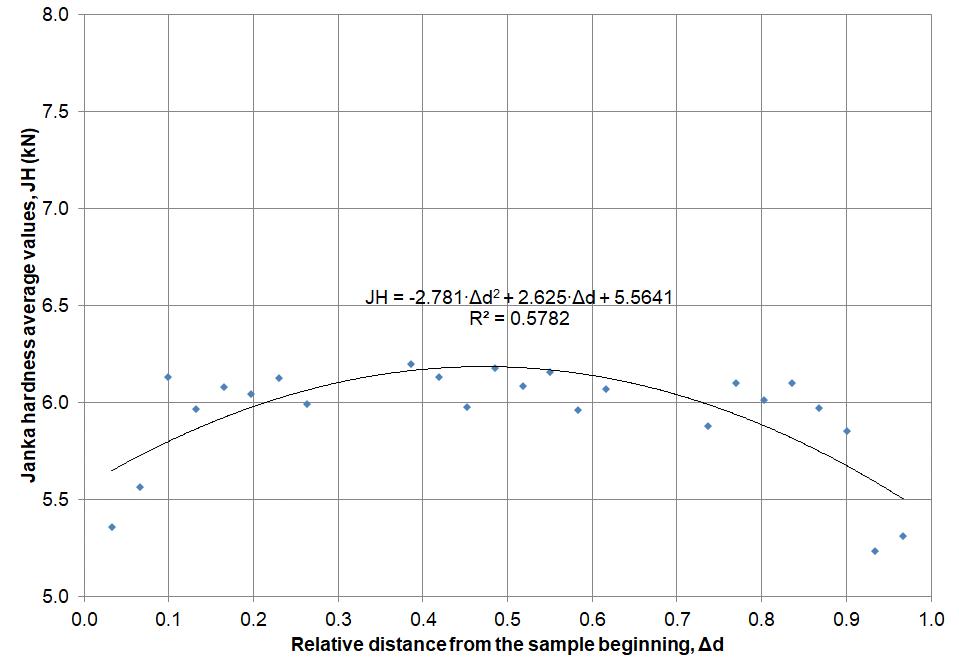
Fig. 3 Janka hardness average values for warm air-steam mixture drying process of beech samples in a function of relative distances from the sample beginning.
The drying method of beech wood (Fagus sylvatica L.) may reduce the Janka hardness in comparison with the hardness of wood dried with the combined air drying method. In the presented study, 15.41% of Janka hardness for the middle part of specimens decreased while the warm air-steam mixture drying process was applied.
The results obtained are difficult to compare with those of other authors, as no articles were found in which changes in wood hardness in the longitudinal direction were studied. Theonly research workconcernedthestudy ofthe physical properties ofbeechwood(Fagus
orientalis Lipsky) from different geographical parts of Greece, which showed that the Janka hardness values were lower than those obtained in the tests carried out (Skarvelis and Mantanis, 2013).As reportedbySkarvelis andMantanis (2013),the averagehardness values were equal to 4.854 kN. The latter authors compared their findings to the values of Bektaş et al. (2002). The opposite result was obtained by Büyüksari (2013), who observed that all of the compressed veneer laminated panels with Oriental beech (Fagus orientalis Lipsky) veneer sheets had higher hardness values compared to non-compressed veneer laminated panel. Thermally compressed veneer laminated MDF panels can be utilized for structural purposes due to higher hardness since the Janka hardness was 8.795 kN to 9.768 kN. These values were higher than ours by approximately 1.5 kN.
CONCLUSION
Based on the carried out analyses, it can be concluded that:
• The drying method of beech wood (Fagus sylvatica L.) while the warm air-steam mixture drying process was applied caused a reduction in the Janka hardness of about 15.41% in the middle part of specimens in comparison with the Janka hardness of wood dried with the modified air-drying method.
• AnalysingthetrendlineoftheJanka hardness forbeech wooddried with the combined air-drying method, it can be seen that the changes in hardness are distributed parabolically, with the maximum values occurring at mid-length of the sample.
• The latter phenomenon was not observed for wood dried with the warm air-steam mixture drying process, in which the Janka hardness was levelled (almost horizontal) on the whole length of the specimen, skipping the beginning and end of the sample.
• In both cases, the Janka hardnesses are approximately 0.6 kN lower at the front and rear faces of the specimen.
• Future studies should be carried out on the samples with larger cross-sections and lengths.
REFERENCES
ASTM D143. American Soc. for Testing and Materials (ASTM), 1994. Standard methods for testing small clear specimens of timber. Annual Book of ASTM Standards Vol. 04.10. ASTM, West Conshohocken, PA.
Avila, C., Hernández, R., Fortin, Y., 2009. Effect of kiln drying on the hardness and machining properties of tamarack wood for flooring. Forest Products Journal. 59(1/2):71-76.
Baranski, J., Chuchala, D., Orlowski, K. A., Muzinski, T., 2014. The influence of drying parameters on wood properties. Annals of Warsaw University of Life Sciences, Forestry and Wood Technology 86, 7-12.
Baranski, J., Klement, I., Vilkovská, T., Konopka, A., 2017. High temperature drying process of Beech Wood (Fagus sylvatica L.) with different zones of sapwood and red false heartwood. BioRes 12(1):1861–1870. https://doi.org/10.15376/biores.12.1.1861-1870
Baranski, J., 2018. Moisture content during and after high- and normal-temperature drying processes of wood. Dry Technol 36(6):751–761. https://doi.org/10.1080/07373937.2017.1355319
Barański, J., Konopka, A.,Vilkovska, T., Klement, I., Vilkovsky, P., 2020. Deformation and surface color changes of beech and oak woodlamellas resultingfrom the drying process. BioRes. 15(4), 8965-8980.
Bektaş, I., Güler, C., Baştürk, M.A., 2002. Principal mechanical properties of eastern beech wood (Fagus orientalis Lipsky) naturally grown in Andirin northeastern Mediterranean region of Turkey. Turkish Journal of Agriculture and Forestry 26: 147-154.
Büyüksarı, Ü., 2013. Surface characteristics and hardness of MDF panels laminated with thermally compressed veneer. Composites Part B: Engineering, Volume 44, Issue 1, pp. 675-678, https://doi.org/10.1016/j.compositesb.2012.01.087
Chuchala, D., Orlowski, K. A., Sandak, A., Sandak, J., Pauliny, D., Barański, J., 2014. The effect of wood provenance and density on cutting forces while sawing Scots pine (Pinussylvestris L.). BioResources 9(3):5349–5361.
Chuchala, D., Ochrymiuk, T., Orlowski, K., Lackowski, M., Taube, P., 2020. Predicting cutting power for band sawing process of pine and beech wood dried with the use of four different methods. BioResources 15(1), 1844-1860.
Hansson, L., Antti, L , 2006. The effect of drying method and temperature level on the hardness of wood.JMaterProcessTechnol.171.467-470.https://doi.org/10.1016/j.jmatprotec.2005.08.007
Hernandez, R.E., Bustos, C., Fortin, Y., Beaulieu, J., 2001. Wood machining properties of white spruce from plantation forests. Forest Prod. J. 51(6):82–88.
Hlásková, L., Orlowski, K. A., Kopecký, Z., Sviták, M., Ochrymiuk, T., 2018. Fracture toughness and shear yield strength determination for two selected species of central European provenance. BioResources 13(3), 6171-6186. https://doi.org/10.15376/biores.13.3.6171-6186
Kacew, P.G., 1978. Kontrola narzędzi skrawających metodami statystycznymi.Wydawnictwa Naukow Techniczne, Warszawa.
Klement, I., Vilkovská, T., Baranski, J., Konopka, A., 2018. The impact of drying and steaming processes on surface color changes of tension and normal beech wood. Dry Technol 37:1490–1497. https://doi.org/10.1080/07373937.2018.1509219
Koczan, G., Karwat, Z. Kozakiewicz, P., 2021. An attempt to unify the Brinell, Janka and Monnin hardness of wood on the basis of Meyer law. J Wood Sci 67, 7. https://doi.org/10.1186/s10086-020-01938-4
Licow, R.,Chuchala, D.,Deja, M., Orlowski, K.A., Taube, P.,2020. Effect of pine impregnation and feed speed on sound level and cutting power in wood sawing. Journal of Cleaner Production, Volume 272, 122833 https://doi.org/10.1016/j.jclepro.2020.122833
Muziński, T., 2021. The effect of drying method on fracture toughness and yield strength when sawing selected wood species (inPolish). PhD Dissertation, Gdansk University of Technology, Faculty of Mechanical Engineering and Ship Technology, Gdansk 2021. https://mostwiedzy.pl/pl/publication/wplyw-sposobu-suszenia-na-wiazkosc-i-naprezeniatnace-przy-przecinaniu-wybranych-gatunkow-drewna,157733-1
Orlowski, K.A,. Chuchala, D., Muzinski, T., Baranski, J., Banski, A., Rogoziński, T., 2019. The effect of wood drying method on the granularity of sawdust obtained during the sawing process using the frame sawing machine. Acta Facultatis Xylologiae Zvolen 61(1):83–92. https://doi.org/10.17423/afx.2019.61.1.08
Riggio, M., Piazza, M., 2011. Hardness Test. Chapter 9, In book: Kasal, B. and Tannert, T. (eds.). In Situ Assessment of Structural Timber. (pp. 87-97). https://doi.org/10.1007/978-94-007-0560-9
Rogoziński, T., Chuchala, D., Pędzik, M., Orlowski, K.A., Dzurenda, L., Muzinski, T., 2021. Influence of drying mode and feed per tooth rate on the fine dust creation in pine and beech sawing on a mini sash gang saw. Eur. J. Wood Prod. 79, 91–99. https://doi.org/10.1007/s00107-020-01608-8
Sachs, L., 1984. Applied Statistics. A Handbook of Techniques. Springer Series in Statistics. Springer New York, NY. pp. 707. https://doi.org/10.1007/978-1-4612-5246-7
Sehlstedt-Persson, S.M.B., 1995. High-temperature drying of scots pine. Acomparison between HTand LT-drying. Holz als Roh-und Werkstoff 53, 95–99. https://doi.org/10.1007/BF02716400
Skarvelis, M., Mantanis, G.I., 2013. Physical and mechanical properties of beech wood harvested in the Greek public forests. Wood Research 58 (1): 123-129 (2013).
Suchta, A., Barański, J., Vilkovská, T., Klement, I., Vilkovský, P., 2024. The impact of drying conditions on the surface color changes of pine wood. BioResources 19(1), 656-669.
Terziev, N., Daniel, G., 2002. Industrial kiln drying and its effect on microstructure, impregnation, and properties of Scots pine timber impregnated for above ground use. Part 2, effect of drying on microstructure and some mechanical properties of Scots pine wood. Holzforschung 56(4), 434-439. https://doi.org/10.1515/HF.2002.067
Vörös, Á., Németh, R., 2020. The History of Wood Hardness Tests. 6th International Conference on Environment and Renewable Energy, IOP Conf. Series: Earth and Environmental Science 505 (2020) 012020, IOP Publishing. https://doi.org/10.1088/1755-1315/505/1/012020
Wasielewski, R., Orlowski, K., 2002. Hybrid dynamically balanced saw frame drive. Holz Roh Werkst 60(3):202–206. https://doi.org/10.1007/s00107-002-0290-4
ACKNOWLEDGMENT
The authors would like to express their thanks to M. Sc. Eng. Lech Targan for his help in preparing the test stand measurement circuits.
AUTHORS’ ADDRESSES
Professor Kazimierz A. Orlowski, Dr. Sc., Ph. D., Eng. Gdansk University of Technology, Faculty of Mechanical Engineering and Ship Technology, 11/12 Narutowicza, 80-233 Gdansk, Poland kazimierz.orlowski@pg.edu.pl
Dr. Sc. Daniel Chuchala, Ph. D., Eng., Prof. of GdanskTech Gdansk University of Technology, Faculty of Mechanical Engineering and Ship Technology, 11/12 Narutowicza, 80-233 Gdansk, Poland daniel.chuchala@pg.edu.pl
MSc, Eng. Monika Serafinowicz
NM Design Office sp. z o. o., Al. Zwycięstwa 96/98 81-451 Gdynia, Poland, nowacka1995@wp.pl
MSc, Eng. Sylwia Kowalska Szkoła Podstawowa w Szonowie, 86 - 320 Łasin 86-320, Poland, tryc-sylwia@wp.pl
ACTA FACULTATIS XYLOLOGIAE ZVOLEN, 66(2): 13 22, 2024
Zvolen, Technická univerzita vo Zvolene
DOI: 10.17423/afx.2024.66.2.02
CROSS WARPING DURING VARIOUS DRYING PROCESSES OF BEECH WOOD (FAGUS SYLVATICA L.)
Ivan Klement – Tatiana Vilkovská – Peter Vilkovský
ABSTRACT
Wood drying does not only consist of removing moisture; the quality of the dried product is the main requirement for the industrial process. Because wood shrinks during drying, deformations and stresses develop, leading to unusable products. When developing drying technologies and methods, the aim is to achieve the shortest possible drying time. The most common defects in wood after drying include cross warping (cup), which significantly affects the efficiency of processing the raw material into products. The research was focused on the impact of different drying conditions (temperature, drying gradient) on the size of the cross warping. The lower values were for the low-temperature drying at 1.4 %. The hightemperature drying process increased values to double from 2.3 to 2.8%. A reduction in the size of the cross warping defects can also be achieved by effectively loading the samples in combination with more precise control of the high-temperature drying process so that smaller values of the moisture gradients of the samples at the end of the drying process are achieved.
Keywords: cross warping; beech wood; high-temperature drying; low-temperature drying; drying gradient.
INTRODUCTION
Wood is a hygroscopic material due to the abundance of hydroxyl groups associated with the cell wall polymers, and the material exhibits dimensional changes with variations in moisture content (MC) and atmospheric relative humidity. The degree to which wood shrinks and swells with changing moisture content is an important property that determines its suitability for different applications. This property, known as dimensional stability, is often a target property for improvement in wood modification research. Its importance makesitacommonlyquantifiedwoodproperty(Sargent2019).Dryingshrinkageiscommon during wood processing and utilization induced by moisture loss (Fu et al., 2022; Ormarsson 1999). The moisture content of a growing tree is high, and it is usually necessary to dry the timber before using it for construction purposes. It is essential to avoid excessive deformation of the sawn timber during wood drying. The deformation process is affected by differences in the moisture and temperature conditions. One may also optimize the conditions during the drying process to minimize unfavorable deformations, such as cup, twist, crook, and bow. A characteristic of wood is that its behavior is strongly orthotropic due to the internal structure of the material and is precisely dependent on moisture and temperature (Miyoshi et al., 2018). In addition, the material is characterized by a substantial
variation of the properties in the radial direction. Furthermore, the behavior of wood is strongly affected by variations in environmental conditions, especially when the trees are exposed to stress.
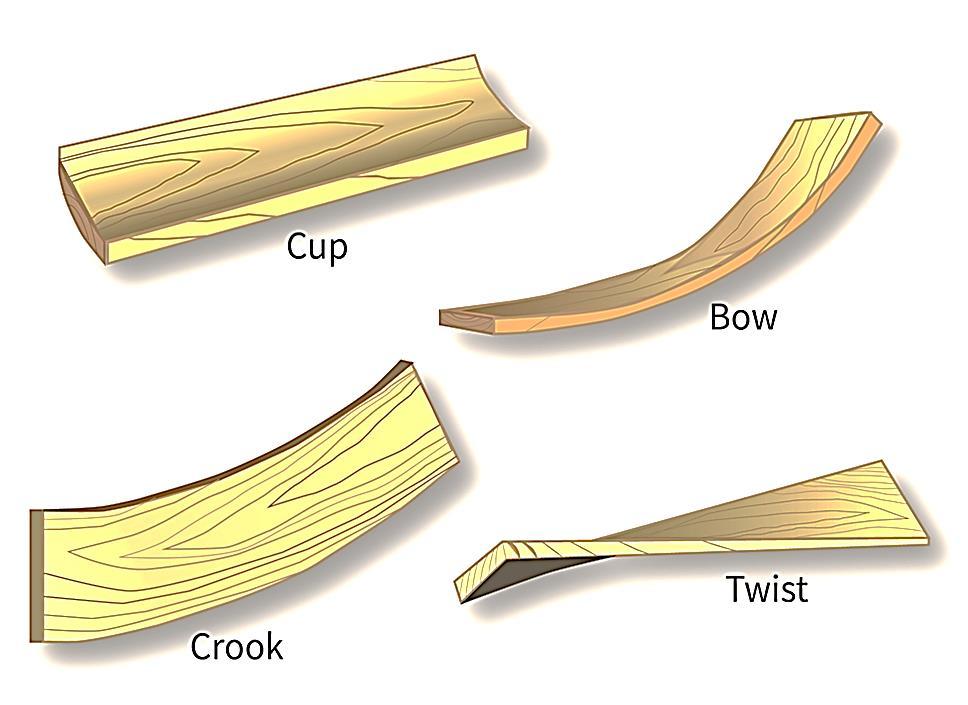
Fig. 1 Different forms of deformation of wood (Hill et al., 2022)
This anisotropy affects many wood species characteristics such as strength, shrinkage, swelling, and thermal and electrical conductivity (Fig.1). As a representative example, wood exhibits different shrinkage levels among tangential, radial, and longitudinal directions. The tangential shrinkage is commonly the greatest, around 6–12%, followed by radial shrinkage at 3–6%, and longitudinal shrinkage is less than 0.1–0.2%. I shall refer to authors Glass and Zelinka 2021; Nocetti et al., 2015. Based on the cited work (Barański et al., 2021; Dudiak et al., 2024), the cup deformation may occur in two directions, the xz- and the yz-plane, respectively. The average cross-warping was in the range of 1.8 to 2.8 %. Statistical analysis of the measured values showed that the thickness of the specimens is an essential factor affecting the size of the cross warping. The drying temperature was not considered statistically significant. Thestandarddeviationvalues werelower for thethickness of 32 mm than for the thickness of 25 mm. It means that the thickness positively affects the size of the cross warping.
The loss of moisture leads to different drying shrinkage in various grain directions of wood; thus, shrinkage anisotropy of wood is one of the reasons for the drying stresses (Bond and Espinoza 2016). Additionally, due to the reliabilities of moisture content between the surface and core layers during the drying process of wood, as well as differences in material properties between heartwood and sapwood or earlywood and latewood, there will be irregular moisture content distribution. The irregular distribution of wood moisture will produce moisture gradient stress, which forms an additional source of drying stresses in wood. Therefore, shrinkage anisotropy stress and moisture gradient stress are the two principal catalysts for drying stresses in wood (Fu et al., 2015; Dudiak and Dzurenda 2021). One type of deformation is a cup, defined as a board distortion in which there is a deviation from flatness across the width of the board (Simpson 1991, Vilkovský et al., 2023).
The main objective of the present paper is to characterize and analyze one of the most common wood defects after drying, namely cross warping. This defect significantly affects the efficiency of the raw material being processed into products. Therefore, the article is
designed to evaluate the effect of drying conditions on the cross warping size during hightemperature and low-temperature drying.
MATERIALS AND METHODS
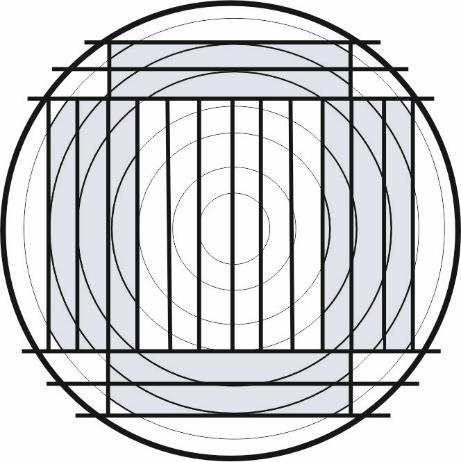
The testing tree species was beech (Fagus sylvatica L.), the most economically important tree species in the forests of Slovakia. The logs were harvested in the University Forestry Enterprise's forests in the Hronská Breznica (altitude 268 m n. m.) location. Logs with a diameter at the thinner end of 50 to 56 cm and a length of 4 meters were used. The logs were sawn from the ground part of the tree. The logs were sawed by a cant log sawing pattern (Fig. 2 ) to produce the tangential lumber. Subsequently, the prisms were cut into 25 mm thick sawn timber. The dimensions of the samples were 25 × 120 × 1000 mm. Specimens were cut from the center of the lumber so that their net dimension was 1000 mm (marked grey color Fig. 2 a.)). Specimens with annual circles with a slope of 0 to 30° tangential sawn timber were selected for test specimens. At regular time intervals, the selected samples were weighed. Based on this moisture content, the drying process was controlled.

Drying mode

Twodryingmodeswereused.Thesamples weredriedin thedryingkilnin thedrying laboratory at the Department of Wood Technology, Technical University in Zvolen, Slovakia,forhigh-temperatureandlow-temperaturedrying.Alow-temperaturedryingmode with constant drying environment parameters was used for low-temperature drying (40°C). Two drying modes were used for high-temperature drying (HT), which differ in the maximum temperature used in the last mo stage (130 and 150 °C). The parameters of the drying modes are given in Table 1. The samples were dried to a final moisture content of 10 ± 1 %.
Tab. 1 Parameters of used drying modes.
High-temperaturedrying process Low-temperaturedrying process
Figure 3 shows a graphical representation of the average values of the drying gradients for the moisture stages and each drying mode. The drying gradient characterizes the drying intensity and is the ratio between the actual wood moisture content w and the equilibrium moisture content wr Moisture measurement was carried out using the oven dry method according to STN 49 0103.
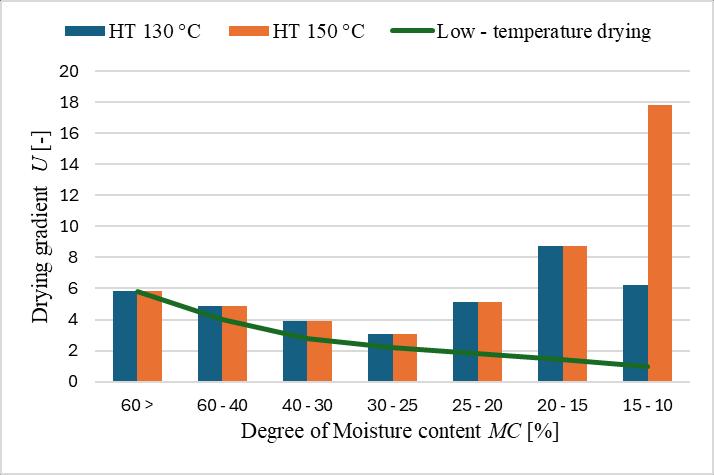
Fig. 3 Average values of drying gradient U in moisture levels and drying modes.
During drying, the drying samples were weighed at regular time intervals to determine the actual moisture content of the wood.
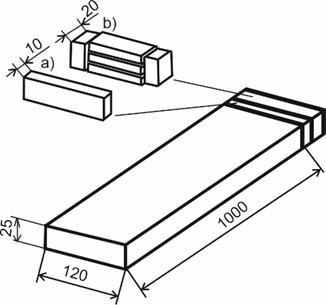
The moisture gradient characterizes the moisture distribution in the wood crosssection. The samples for the determination of the moisture gradient were processed, as shown in Figure 4. The moisture content of the individual layers was determined using the oven dry method. The level of the moisture gradient was calculated according to the equation:
Cross warping
The value of the cross warping level was evaluated using relative warping. Relative warping is the ratio of the maximum deflection f to the width of the sawn timber b (Fig. 4) and is expressed as a percentage.

Fig. 4 Measurement of cross warping
Due to the small volume of the dried samples in the dryer, their relative loading was small and did not affect the size of the measured cross warping. The values of cross warping K were calculated according to Eq. (2):
Where: f – maximum deflection [mm], b - width of timber [mm].
Measurement of density in the absolutely dry state
Density in the absolutely dry state was determined for each sample. The measurement was performed under laboratory conditions. Density in the absolutely dry state was calculated by equation (3) according to the Slovak standards norm STN 490 103
Where: m0 is the weight of oven-dried moisture samples (kg) and V0 is the volume of oven-dried moisture samples (m-3).
RESULTS AND DISCUSSION
Table 2 shows the average values of the samples' moisture contents, drying times and rates, and densities at the dry state. Figure 5 graphically shows the samples' moisture loss as a function of time.
Tab. 2 Basic drying characteristics for individual modes.
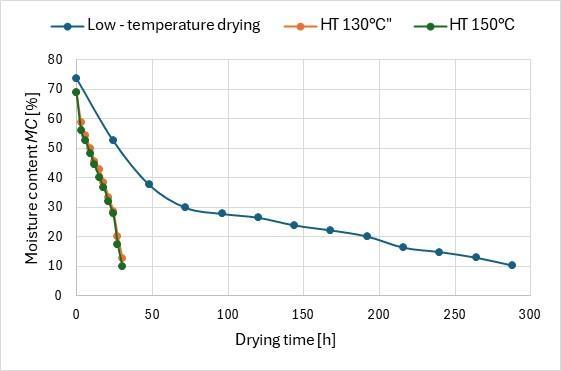
Fig. 5 Moisture content change of beech samples in high-temperature and low- temperature drying.
The initial moisture contents of the samples varied from 68 to 74.2 %, and the final moisture contents ranged from 9.4 to 12.8 %. With high-temperature drying and a drying temperature of 130 °C, the final moisture content was higher than initially planned, averaging 12 %. In the high-temperature drying, the curves were linear. This means that the moisture loss was proportional to the drying time. The average drying time was 30 hours, corresponding to the drying rate, which was slightly higher when a drying medium at a temperature of 150 °C was used.
The resulting drying times are very short compared with low-temperature drying of this wood due to the high drying intensity around the removal of bound water. In lowtemperature drying mode, the drying time was 288 hours, and the drying rate was ten times shorter compared to high-temperature drying.
This corresponds to the drying gradient values for the drying modes used. All modes started with the same value (5.82), and the drying gradient gradually decreased.
For a high-temperature drying process with an average moisture content of 25 %, the drying gradient increased to 8.5. At the last moisture content stage, at a drying medium temperature of 150 °C, it reached almost 18. The drying gradient values decreased for lowtemperature drying in the evaporation section of the water bound from the samples (below 25%). At the last moisture content stage, the drying gradient value was 1.
Moisture gradients were measured at three-hour intervals for both high-temperature drying modes. In the low-temperature drying process, the moisture gradient was measured at the beginning and the end. The calculated average values are shown in Figure 6.


Fig. 6 Average values of moisture gradients of samples (a) High-temperature drying (b) Low-temperature drying.
After drying experiments, the absolute value of the cross warping (f) was measured at the center of the samples with a mechanical device and then converted according to equation (2) to the relative warping (K), considering the width of the samples. The converted mean values and their basic statistical characteristics are shown in Table 3.
Tab. 3 Mean values and basic statistical characteristics of the cross-sectional grading of the samples
The changes in the shape of the samples were small for both drying methods. The average values of relative cross-warping ranged from 1.4 to 2.8 % (Table 4). The lower values were for the low-temperature drying at 1.4 %. The high-temperature drying process increased values to double from 2.3 to 2.8%. Statistical analysis of the measured values showed that drying temperature or drying method was a moderately significant factor influencing thesizeofthe crosswarping.Besidesthedryingtemperature,thedryinggradient positively affected the size of the cross warping. The drying gradient in the low-temperature drying method decreased significantly from a critical wood moisture content of 40 %. In high-temperature drying, the value of the drying gradient was increasing (Fig. 3).
Assessing the effect of the drying method on the amount of cross warping based on the drying gradient is a more complex assessment, which also includes the impact of the relative humidity of the drying environment. Our findings are in concordance with authors Hill 2022; Sargent 2019). Asalso shownin theresearchof Xiang et al., (2012)crosswarping happens because the shrinkage parallel is more significant than that perpendicular to the growth rings. In other words, cupping results from tangential shrinkage of wood being more excellent than radial shrinkage, and the more significant the difference, the more severe the degree. Our observations are consistent with authors Konopka et al., 2017 made comparable
measurements of cross-warping where the drying process was carried out at 150 °C. The effectofthesizeofthecrosswarpingwas analysedforloadedandunloadedbeechspecimens ("lamellas") at an initial moisture content of approx. 40% and a final moisture content of approx. 10%. The values of K of the cross warping were 1-5.5%, and the slope of the annual rings was also determined. Higher values were for tangential samples. Our observations about reducing the size of the warping are also possible by efficient loading of the samples in combination with more precise control of the high-temperature drying process so that smaller values of the samples' moisture gradients at the end of the drying process are achieved are in accordance with other cited authors.
Between130and150 °Cdryingtemperatures,therewasastatisticallynon-significant effect on cross-warping. High-temperature drying showed a positive impact of the high temperature on the amount of drying of the wood and, thus, on the size of the cross warping. When high temperatures are combined with the moisture content of the wood, partial plasticization occurs, which positively affects the formation of internal stresses in the wood and, ultimately, the size of the cross warping. Longitudinal warping was also observed in the samples, reflected by longitudinal bowing and twisting. Overall, it can be concluded that the values of cross-warping for both drying methods are positive, even because it was not possible for technical reasons to load the samples during drying, which eliminates the crosswarping further. Based on the cited work by Miyoshi (2014), it was revealed that the mechanical properties of wood in the lateral direction were significantly affected not only by the density but also by the structural features such as deformation of cell shapes, arrangement of rays or vessels, and the degree of the transition from the earlywood to the latewood.
CONCLUSION
When developing drying technology and methods, the aim is to achieve the shortest possible drying times; one way this can be achieved is by increasing the temperature of the drying environment. However, the dried wood must be protected. Cross-warping is one of the most common defects in the wood after drying, which considerably affects the efficiency with which the raw material can be processed into products. The following conclusions can be made from the measured results of the research:
- The high-temperature drying process is a very rapid drying method. Compared to the low-temperature drying method, the resulting drying times are, on average, 10 to 15%, corresponding to a drying rate approximately ten times higher.
- The drying curves for both modes of high-temperature drying were very rapid and linear. When a temperature of 150 °C was used in the last moisture level, the final moisture content of the samples was achieved more precisely.
- Thevaluesofmoisturegradients at theend of thehigh-temperaturedrying process were large (5.8 - 6.9%), which had a negative effect on the size of the cross-warping of the samples.
- This indicates that a more optimal control of the drying process based on achieving the average required moisture content could be achieved. For low-temperature drying, the moisture gradient was 1.8 %.
- The average values of the cross warping were lower in the low-temperature drying process by 1.4 % compared to the high-temperature drying process, increasing values to double by 2.3 to 2.8%. The differences between the high-temperature drying modes (130
and 150°C) and the statistics were insignificant.
- Research into the effect of drying conditions on the size of wood warping is essential to increase the efficiency of processing raw materials into final products.
REFERENCES
Barański, J., Suchta, A., Barańska, S., Klement, I., Vilkovská, T., Vilkovský, P., 2021. Wood Moisture-Content Measurement Accuracy of Impregnated and Nonimpregnated Wood. Sensors 21, 7033. https://doi.org/10.3390/s21217033
Bond, B.H., Espinoza, O., 2016. A Decade of Improved Lumber Drying Technology. Curr Forestry Rep 2. 106–118. https://doi.org/10.1007/s40725-016-0034-z
Dudiak, M., Dzurenda, L., 2021. Changes in the physical and chemical properties of alder wood in the process of thermal treatment with saturated water steam. Coatings - Vol. 11, issue 8 art. no. 898.
Dudiak, M., Kminiak, R., Banski, A., Chuchala, D., 2024. The Effect of Steaming Beech, Birch and Maple Woods on Qualitative Indicators of the Surface. Coatings 2024, 14, 117. https://doi.org/10.3390/coatings14010117
Fu, Z., Zhao, J., Huan, S., Sun, X., Cai, Y., 2015. The variation of tangential rheological properties caused by shrinkage anisotropy and moisture content gradient in white birch disks. Holzforschung 69. 573–579. Review on Wood Deformation and Cracking during Moisture Loss.
Fu, Z., Wang, H., Li, J., Lu, Y., 2022. Determination of Moisture Content and Shrinkage Strain during Wood Water Loss with Electro-chemical Method. Polymers 14. 778.
Glass, S., Zelinka, S., 2021. Moisture relations and physical properties of wood. Chapter 4 in FPLGTR-282; U.S. Department of Agriculture Forest Service: Washington. DC. USA.
Hill,C., Kymäläinen, M., Rautkari, L., 2022. Reviewofthe use of solidwood as anexternal cladding material in the built environment. J Mater Sci 57, 9031–9076. https://doi.org/10.1007/s10853-022-07211-x
Konopka, A., Barański, J., Vilkovská, T., Klement, I., 2017. The influence of the drying process on the deformation of the beech and oak wood samples Annals of WULS, Forestry and Wood Technology, 99, Article 99.
Miyoshi, Y., Kojiro, K., Furuta, Y., 2014 Deformation properties of wood in lateral tension effect of tensile direction to the annual rings. moisture. and temperature on lateral tensile deformation of hinoki (Chamaecyparisobtusa) (in Japanese). Mokuzai Gakkaishi 60:241–248
Miyoshi, Y., Kojiro, K., Furuta, Y., 2018. Effects of density and anatomical feature on mechanical properties of various wood species in lateral tension. J Wood Sci 64. 509–514. https://doi.org/10.1007/s10086-018-1730-z
Nocetti, M., Brunetti, M., Bacher, M., 2015. Effect of moisture content on the flexural properties and dynamic modulus of elasticity of dimension chestnut timber. Eur. J. Wood Prod. 73. 51–60. https://doi.org/10.1007/s00107-014-0861-1
Ormarsson, S., Dahlblom, O., Petersson, H., 1999. A numerical study of the shape stability of sawn timber subjected to moisture variation Part 2: Simulation of drying board. Wood Science and Technology 33 407–423 https://doi.org/10.1007/s002260050126
Sargent, R., 2019. Evaluating dimensional stability in solid wood: a review of current practice. J Wood Sci 65, 36 https://doi.org/10.1186/s10086-019-1817-1
Simpson, W. T., 1991. Dry Kiln Operator’s Manual. USDA Forest Service. Agricultural Handbook 188.
STN 490 103: 1993. Wood. Determination of the moisture content of the physical and mechanical testing. Slovak Standards Institute, Bratislava, Slovakia. Vilkovský, P., Klement, I., Vilkovská, T., 2023. The impact of the log-sawing patterns on the quantitativeandqualitativeyieldofbeechtimber(Fagussylvatica L.).AppliedSciences13(14). 8262. https://doi.org/10.3390/app13148262
Xiang, Z., Peralta, P., Peszlen, I., 2012. Lumber drying stresses and mitigation of cross-sectional deformation. Wood and Fiber Science 44(1). 94-102.
ACKNOWLEDGMENT
This work was supported by the Slovak Research and Development Agency under contract no. APVV-21-0049. This work was supported by the Scientific Grant Agency of the Ministry of Education Science Research and Sport of the Slovak Republic and the Slovak Academy of Sciences project VEGA no. 1/0063/22.
AUTHORS’ ADDRESSES
prof. Ing. Ivan Klement. CSc. Ing. Tatiana Vilkovská. PhD. Ing. Peter Vilkovský. PhD. Technical University in Zvolen Faculty of Wood Science and Technology Department of Wood Technology T. G. Masaryka 24 960 01 Zvolen Slovakia klement@tuzvo.sk tatiana.vilkovska@tuzvo.sk peter.vilkovsky@tuzvo.sk
ACTA FACULTATIS XYLOLOGIAE ZVOLEN, 66(2): 23 33, 2024
Zvolen, Technická univerzita vo Zvolene
DOI: 10.17423/afx.2024.66.2.03
THE EFFECT OF STEAMING ON THE COLOR CHANGE OF FALSE HEARTWOOD BEECH
Ladislav Dzurenda – Michal Dudiak
ABSTRACT
The work presents the results of the color change of false heartwood of beech wood during the steaming process in a pressure autoclave in individual modes in the temperature interval t = 90 to 120 °C. The color of the wood of the false heartwood, depending on the steaming conditions, changes in oppositeways, while at temperatures up to t ≈ 105 °C it becomespale, and at temperatures above t ≈ 115 °C it becomes darker.
Based on the results of the research on the color change of the false heartwood wood in the steaming process, 3 steaming modes were proposed to achieve a targeted change in the color of the false heartwood beech. By steaming the wood with saturated moist air tI = 90 ± 2.5 °C for τ = 8 h, the color of the wood lightens, which is numerically expressed in the color space CIE L*a*b*: L* = 69.2 ± 2.9, a* = 12.7 ± 1.6 and b* = 19.7 ± 1.4. Steam mode II with saturated water steam tII = 115 ± 2.5 °C during τ = 16 h, slight darkening of the wood color of the false heartwood reaches the following values: L* = 56.0 ± 2.4, a* = 12.4 ± 1.4 and b* = 19.2 ± 1.5. The dark brown color described in the color space CIE L*a*b* by the values: L* = 50.0 ± 2.1, a* = 12.4 ± 1.3 and b* = 18.5 ± 1.4 is achieved by the vaporization mode III. at the temperature of saturated water steam tIII = 120 ± 2.5 °C during τ = 24 h.
Keywords: beech wood; false heartwood; wood color; wood steaming; color difference; color dispersion.
INTRODUCTION
The beech wood belongs to the scattered-porous, coreless woods with the possibility of forming a false heartwood. In some older trees, there is wood of a different color in the middle of the trunk, from brown-yellow to red-brown to brown-red-gray, the so-called false heartwood.Afalseheartwood is agrowth defect in thezoneofmaturewood,whichis caused by the penetration of air into the tree trunk through wounded places of the trunk or branches of the tree and the subsequent oxidation of soluble carbohydrates and starch contained in living or partially dead parenchymal cells with the formation of polyphenolic compounds that penetrate into neighboring mesh and wood are colored by (Nečesaný 1958, Požgaj et al. 1997, Bauch and Koch 2001, Račko and Čunderlík 2006, 2010, Barański 2020, Vilkovský 2023). In extreme frosts lasting several consecutive days with temperatures below -30 °C, the parenchyma begins to die in the growing tree and conditions are created to form the socalled of brown-yellow to brown-red frosted false heartwood (Gorczynski 1951) According to the shape and position of the false heartwood on the cross-section of the trunk, the false
heartwood is divided into types: Round, Mosaic, Star, Flame (centric, eccentric) (Mahler and Höwecke 1991, Trenčiansky et al. 2017).
In contrast to sapwood, the wood of false heartwood is significantly more colorful. In the works of Dzurenda (2023), Dzurenda and Dudiak (2023), visual differences in the darkness and variety of yellow-brown-red shades of wood of individual types of false heartwood are quantified in the color space CIE L* a *b* in the form of the total color difference ΔEsx *. The color in mosaic wood of false heartwood with values on the lightness coordinate L* = 65.2 ± 6.9 and on the chromatic coordinates: red color a* = 13.2 ± 2.3 and yellow color b* = 19.2 ± 1.9 is the most diverse with a dispersity value of ΔEsx * = 7.5. The wood of round, flame and star false heartwood is more homogeneous in color with dispersity values in the interval ∆Exs * = 3.9 - 4.3.
Steaming of wood is a technological process in which wet wood is heated by the action of heat in the form of saturated moist air or saturated water steam and changes its physical, mechanicalandchemical properties.Whiletemporaryphysical-mechanical changes areused in the production of veneers, plywood, bent furniture, or pressed wood, permanent chemical changes manifested, among other things, by a change in color, serve to purposefully change the color of the wood into more or less distinct color shades (Deliiski 1991, Tolvaj et al. 2009, Dzurenda 2014, Milić et al. 2015, Geffert et al. 2017, Dzurenda and Dudiak 2021, Dzurenda et al. 2023, Dudiak 2023)
The aim of the work is based on experimental research aimed at monitoring the color changes of the false heartwood in the color space CIE L* a *b* in the steaming process with saturated atmospheric moist air at a temperature of tI = 90 ± 2.5 ° C, or of saturated water steam at atemperatureof tII =105 ± 2.5 °C,at temperaturetIII =115± 2.5 °C andtemperature tIV = 120 ± 2.5 °C.
MATERIAL AND METHODS
Blanks with dimensions of 40×50×800 mm were made by longitudinal and transverse sawing from the central lumber of thickness h = 40 mm from logs with a round and star false heartwood. 375 blanks of false heartwood were randomly selected. The blanks were divided into 25 groups, so there were 15 blanks. The blanks of the 1st group were unsteamed. The other blanks were steamed with saturated atmospheric moist air at a temperature of tI = 90 ± 2.5 °C, or with saturated water steam modes: mode II with a temperature of saturated water steam tII = 105 ± 2.5 °C, mode III with a temperature of saturated water steam tIII = 115 ± 2.5 °C and mode IV with the temperature of saturated water steam tIV = 120 ± 2.5 °C. Individual sets of steamed wood were taken from the steaming autoclave after steaming τ = 4 h, τ = 8 h, τ = 12 h, τ = 16 h, τ = 20 h, and τ = 24 h. Steaming of wood was carried out in a pressure autoclave AZ 240 (Himmasch AD, Haskovo, Bulgaria) installed at Sundermann s.r.o. Banská Štiavnica (Slovakia). The conditions of steaming the false heartwood of beech wood with saturated water steam with marked time intervals of sampling during thermal treatment v are shown in the diagram in Fig. 1.
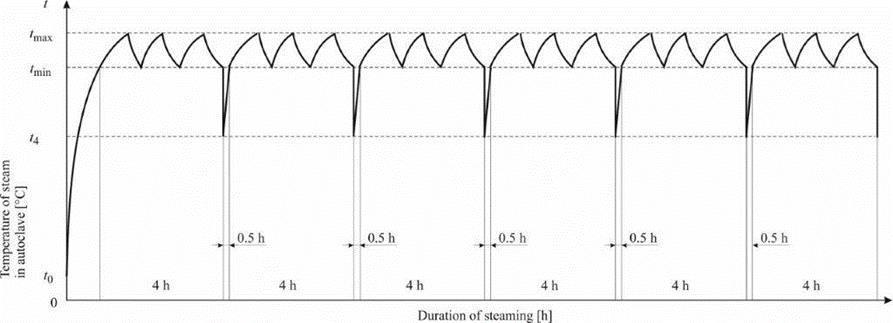
Fig. 1 Diagram of the steaming process of wood in a pressure autoclave.
The temperature of the steam-air mixture (Mode I), or of saturated water steam in steam Modes IIto IV is listed in Table 1. Temperatures tmax and tmin are temperature intervals in which saturated water steam is supplied to the autoclave for the implementation of the technological process. Temperature t4 is the temperature of the saturated water steam after reducing the pressure to atmospheric pressure, enabling the safe opening of the pressure device and selecting a group of steamed blanks in the specified steaming time.
Tab. 1 Technological conditions for the homogenization of the color of beech wood in a pressure autoclave.
Wood color homogenization time
Note: * taking a group of steamed blanks from the autoclave at planned intervals took 0.5 h. The actual steaming time compared to the planned steaming time was extended by the time of technological breaks.
Unsteamed and steamed beech wood blanks of the false heartwood were dried in a hot air oven according to Dzurenda (2022) mode in order to preserve the original color of the wood achieved by the technological process of steaming. The bedding surfaces of the dried lumber were machined on a FS 200 horizontal plane milling machine.
Color measurement was performed with a Color reader CR-10 Plus colorimeter (Konica Minolta, Japan) with a 400-700 nm reflection spectrum. A D65 light source was used and the diameter of the optical sensing aperture was 8 mm. The color measurement was performed on the milled surfaces of each blank at three points.
The results of the measured values: lightness L*, red color a*, yellow color b* on the coordinates of the color space CIE L* a *b* , are presented in the form of writing the average measured value �� and the standard deviation sx
Where: x – average value, sx – standard deviation.
The color dispersion of unsteamed and steamed wood beech wood of the false heartwood is determined through the standard deviations from the measured values at individual coordinates in the color space CIE L* a *b* and quantified by a modified equation of the total color difference Dzurenda (2023), Dzurenda and Dudiak (2024) in the form:
Where: ���� – value of standard deviation of lightness, ���� – value of the standard deviation on the red color coordinate, ���� – value of standard deviation on the yellow color coordinate.
The differences between the color of the sapwood and the color of the heartwood before steaming and after steaming are evaluated by the total color difference ΔE* :
Where: ��1, ��1, ��1 – average values on the coordinates of lightness, red and yellow color of unsteamed beech wood, ��2, ��2, ��2 – average values on the coordinates of lightness, red and yellow color of steamed beech wood.
RESULTS AND DISCUSSION
The course of changes in the color of the false heartwood on the individual coordinates of the color space CIE L* a *b* during τ = 24 h vaporization with saturated moist air at temperature tI 90 ± 2.5 °C and saturated water steam at temperature tII 105 ± 2.5 °C, temperature tIII = 115 ± 2.5 °C and temperature tIV 120 ± 2.5 °C are shown in Fig. 2 to 4.
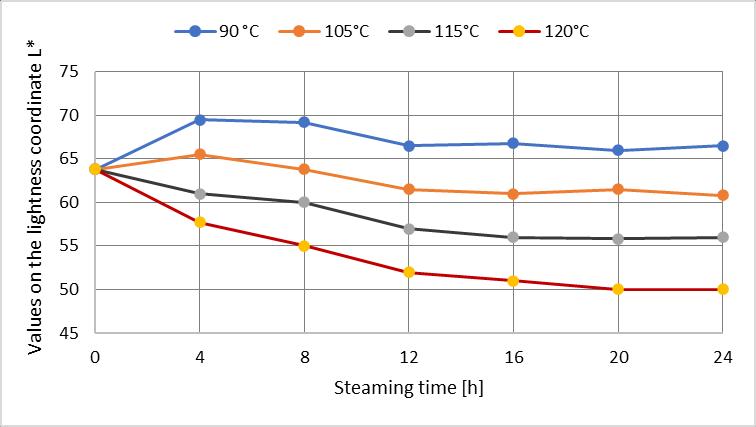
Fig. 2 Color changes on the lightness coordinate L* within 24 h steaming of wood of the false heartwood at individual temperatures.
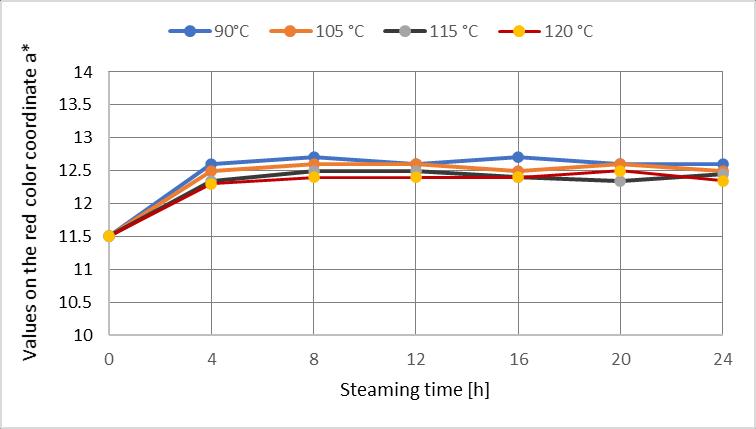
Fig. 3 Color changes on the chromatic coordinate of red a* within 24 h steaming of wood of the false heartwood at individual temperatures.
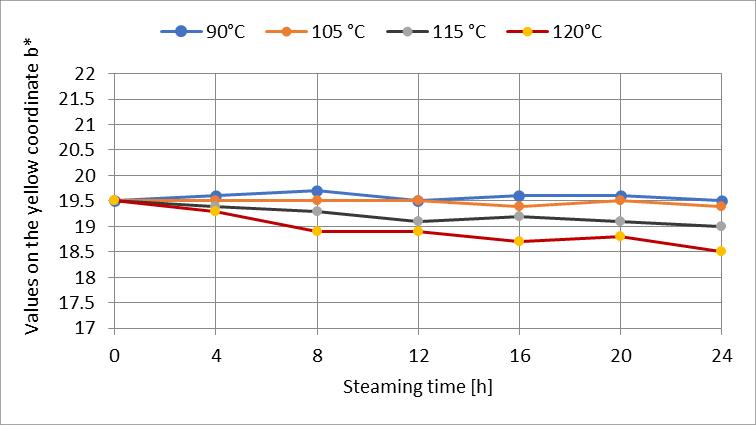
Fig. 4 Color changes on the chromatic coordinate of yellow b* within 24 h steaming of wood of the false heartwood at individual temperatures.
Changes in the lightness coordinate L* and the chromatic coordinates of red color a* and yellow color b* indicate changes in the color and color diversity of the wood of the false heartwood, which the wood acquires at individual temperatures during the steaming process. The most significant changes are on the lightness coordinate, minor changes on the chromatic coordinate of the red color a* and the chromatic coordinates of the yellow color b*
The wood color of the false heartwood by steaming at tI = 90 ± 2.5 °C during the first 8 h of steaming, as documented in Fig. 2. fades out. The fading of the color of the wood declares an increase in the lightness of the wood from the value L0 * = 63.7 to the value LI-4 *= LI-8 *= 69.3. Due to the further application of heat in the steaming process, the fading of the wood not only stopped but gradually darkened, which documents the decrease in lightness values to LI-24 *= 65.5.
At the steaming temperature tII = 105 ± 2.5 °C, the wood of the false heartwood also lightens at the beginning of steaming. Within 4 h of evaporation, the value on the lightness coordinate increased from L0 * = 63.7 to LII-4 * = 65.5. Due to the subsequent heat action, the wood darkens similarly to the steaming temperature tI = 90 ± 2.5 °C, which is reflected in the lightness coordinate by a decrease to LII-24 * = 60.8.
The lightness of the wood of the false heartwood at the steaming temperatures tIII = 115 ± 2.5 °C and tIV = 120 ± 2.5 °C during the entire steaming time decreased from the lightness value L0 * = 63.8 to the value LIII-24 * = 56.0 and at temperature tIV = 120 ± 2.5 °C to the value LIV-24 * = 50.0. The steamed wood darkened, and the rate of darkening increased as the temperature of the steaming process increased.
Fig. 5 shows the magnitude of changes in the lightness coordinate ∆L* at individual temperatures of the steaming process in bar diagram form at time intervals of 4 h.
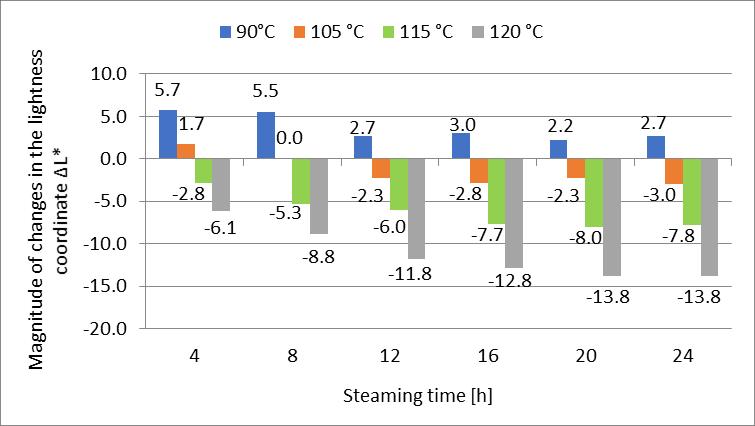
Fig. 5 The magnitude of changes in the lightness coordinate ∆L* over time at individual temperatures of the wood steaming process.
The lightening of the steamed wood of the false heartwood at the steaming temperature tI = 90 ± 2.5 °C and at the steaming temperature tII 105 ± 2.5 °C in the first 4 h point to the instability of the chromophoric system of the wood of the false heartwood formed by the enzymatic processes of peroxidase and polyphenoloxidase, which are responsible for the oxidation of phenolic compounds and the characteristic coloration of the wood of the false heartwood (Hofmann et al. 2004, Albert et al. 2003, Tolvaj et al 2009).
Wood darkening after 4 h steaming at temperature t = 105 ± 2.5 °C, or at higher steaming temperatures t ≥ 115 °C is consistent with the opinions of Bekhta and Niemz (2003), Geffert et al. (2017), Laskowska et al. (2020), Dzurenda and Dudiak (2021), who darken they attribute the decrease of hemicelluloses caused by hydrolysis processes and thus the increase of the lignin content in the steamed wood.
The values on the chromatic coordinate of the red color a* of beech wood of the false heartwood showed a slight increase during the first hours of steaming, independent of the steaming temperature, from thevaluea0 * =11.6to thevaluea* ≈ 13.5.However,thesevalues remained stable and did not change further during the steaming process, providing a clear picture of the color changes during the process.
The values on the chromatic coordinate of the yellow color b*of the wood of the false heartwood did not change at the steaming temperature tI = 90 ± 2.5 °C and the steaming temperature tII = 105 ± 2.5 °C. The measured values of the yellow color b* during the
steaming show the values oscillating around b* ≈ 19.5. The stated finding is similar to the works ofTolvaj et al (2009), andDzurendaand Dudiak(2024).At the steamingtemperature tIII = 115 ± 2.5 °C and the temperature tIV = 120 ± 2.5 °C, a slight decrease is recorded during τ = 24 h in the interval ∆b* = 0.5 - 1.0.
The influence of the steaming conditions on the chemical changes of beech wood in the steaming process is comprehensively expressed by the overall change in the color of the steamed wood. In Fig. 6 shows the change in the color of the wood of false heartwood during τ = 24 h of the steaming process, shown as the total color difference ∆E*.
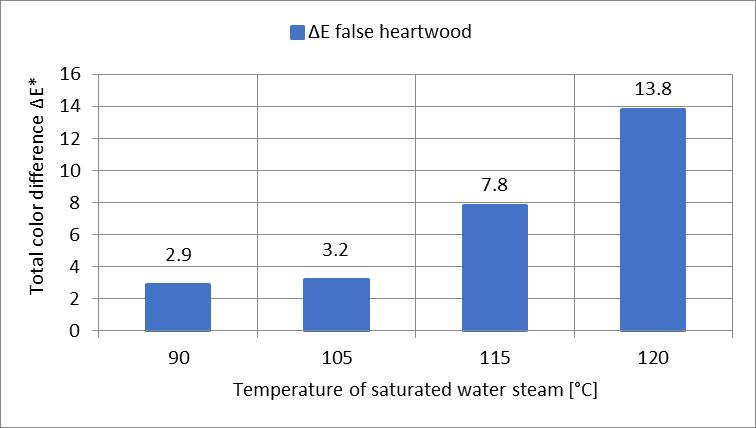
Fig. 6 Sizes of changes in the color of the false heartwood achieved by the steaming process during τ = 24 h for individual temperatures.
The lower values of the total color difference ∆E* = 2.9 – 3.2 at steaming temperatures t = 90 °C – 105 °C point to the partial resistance of wood ef the false heartwood to the influence of heat on the color change manifested by opposite changes in the lightening and darkening of the color of the wood. The effect of heat on the steaming process with temperatures above t ≥ 115 °C is more favorable for continuous changes in the color of the wood manifested by the darkening of the wood. Numerically, this is evidenced by a 2.5 to 4.5 fold increase in the values of the total color difference ∆E* compared to the value of the total color difference at temperature t = 90 °C.
Based on the presented results of the lightening of the wood color of the fake heartwood during the steaming process, fig. 7b, respectively darkening fig. 7c and fig. 7d the technological conditions of steaming were proposed. Technological conditions of steaming to achieve the targeted color of steamed wood, such as steaming temperature, the minimum steaming time required to achieve the targeted wood color, the steamed wood color identified by values on the coordinates of the color space CIE L* a *b*, the dispersion of the steamed wood color ∆Esx * is given in Tab. 2.
Tab. 2 Technological conditions of steaming to achieve the targeted color of steamed wood.
Beech wood of false heartwood
Steamed with mode I
with mode II
with mode III
Steaming time Values on the color space CIE L* a *b* coordinates Color
The color of the wood of the false heartwood before cooking and after steaming according to the proposed technological conditions is shown in Fig. 7b to 7d.
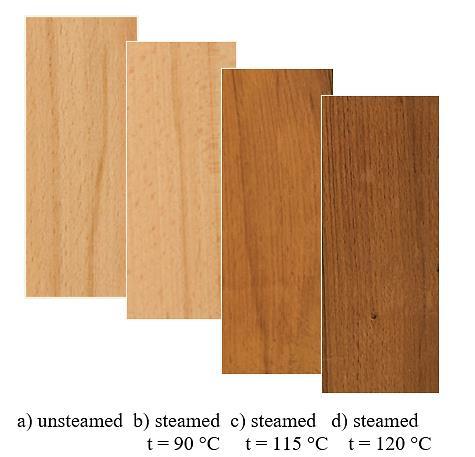
7 Color of unsteamed and steamed wood of false heartwood.
Changes in the color of steamed wood of false heartwood achieved by the proposed steaming modes are characterized by the following facts:
• Steaming mode I enables lightening of the wood color of the false heartwood of saturated atmospheric moist air at a temperature tI = 90 ± 2.5 °C during τ = 8 h. On the coordinates color space CIE L* a *b* values: L* = 69.2 ± 2.9, a* = 12.7 ± 1.6 and b* = 19.7 ± 1 4. The given coloring of steamed wood reaches the value on the lightness coordinate by ∆L* = +5.5 and the values on the chromatic coordinates of red color by ∆a* = +1.2 and yellow color by ∆b* = +0.2. A decrease in the color dispersion value from ∆Esx * = 4.4 before steaming to ∆Esx * = 3.6 points to the homogenization of the wood color of the false heartwood by the steaming process.
• The steaming mode II carried out by saturated steam with a temperature of tII = 115 ± 2.5 °C during τ = 16 h causes the wood to slight darkening and acquire a brown color with values on the coordinates of the color space L* = 56.0 ± 2.4, a* = 12.4 ± 1.4 and b* = 19.2 ± 1.5. The change in the color of the wood of the false heartwood is accompanied by a decrease in the value on the lightness coordinate by ∆L* = -7.7 and an increase in the value on the red color coordinate by ∆a* = +0.9 and a decrease in the value on the yellow color coordinate by ∆ b* = -0.3.
• Steam mode III with saturated steam with temperature tIV = 120 ± 2.5 °C during τ = 24 h changes the original color of the wood to a dark brown color. In the color space CIE L* a *b* it is identified by the values at the coordinates L* = 50.0 ± 2.1, a* = 12.4 ± 1.3 and b* = 18.5 ± 1.4. The stated steaming conditions not only contribute to the most significant darkening of the wood of the false heartwood, but also contribute to reducing the color dispersion of the steamed wood characterized by the color dispersion value ∆Esx * = 2.8.
CONCLUSION
Results of analysis of the effect of temperature on the steaming process of beech false heartwood within 24 h point to a relatively wide range of color changes from pale brown to dark brown color.
False heartwood steamed with saturated atmospheric moist air at a temperature of tI = 90 ± 2.5 °C in the first 8 h, or with saturated water steam at a temperature of t = 105 ± 2.5 °C in the first 4 h, fades from the original brown-red color to a pale brown color and then gradually darkens to a brown color. The mentioned facts point to a certain instability of the chromophoric system of false heartwood formed during the growth of the tree against the action of heat.
Steaming false heartwood core with saturated water steam with a temperature of t = 115 ± 2.5 °C and with a temperature of t = 120 ± 2.5 °C, the wood gradually darkens to brown to dark brown. The rate of wood darkening increases with increasing steaming temperature. Qualitative differences in wood color in the wood steaming process of false heartwood at temperatures above t ≥ 115 °C declare the values of the total color difference ∆E*, which are 2.5 to 4.5 times higher than the color changes at the steaming temperature t = 90 ° C.
On the basis of the presented results of the color changes of the false heartwood in the steaming process, the technological steaming conditions for 3 color changes of the false heartwood by the steaming process were proposed for the targeted color changes of the false heartwood.
Steaming mode I allows the color of the wood to lighten. By steaming wood with a saturated atmospheric moist air at a temperature of tI = 90 ± 2.5 °C for τ = 8 h, the original color of the wood changes to a pale brown color with coordinates in the color space CIE L* a *b*: L* = 69.2 ± 2 .9, a* = 12.7 ± 1.6 and b* = 19.7 ± 1 4.
Steaming mode II a slight darkening of the wood color is achieved. Steaming of wood of the false heartwood is carried out with saturated water steam with a temperature of tII = 115 ± 2.5 °C during τ = 16 h. The acquired wood color in the color space CIE L* a *b* is identified by the following values: L* = 56.0 ± 2.4, a* = 12.4 ± 1.4 and b* = 19.2 ± 1.5.
Steaming mode III it changes the color of the wood of the false heartwood to a dark brown. It is realized with saturated water steam with temperature tIII = 120 ± 2.5 °C during τ = 24 h. The dark brown color is in the color space CIE L* a *b* described by the values: L* = 50.0 ± 2.1, a* = 12.4 ± 1.3 and b* = 18.5 ± 1.4.
REFERENCES
Albert, L., Hofmann, T.,Németh, ZS.,Rétfalvi, T.,Koloszár, J., Varga,Sz.,Csepregi, I. 2003 Radial variation of total phenol content in beech (Fagus sylvatica L.) wood with and without red heartwood. Holz als Roh- und Werkstoff (61) 3: 227–230
Barański, J., Konopka, A., Vilkovska, T., Klement, I., and Vilkovsky, P., 2020 Deformation and surface color changes of beech and oak wood lamellas resulting from the drying process," BioResources. 15(4), 8965-8980.
Bauch, J., Koch, G., 2001. Biologische und chemische Untersuchungen über Holzverfarbungen der Rotbuche (Fagus sylvatica L.) und Möglichkeiten vorbeugender Maßnahmen. Abschlussbericht, Bundesforschungsanstalt für Forst- und Holzwirtschaft, Universi-tät Hamburg, 2001.
Bekhta, P., Niemz, P. 2003 Effect of high temperature on color change, dimensional stability and mechanical properties of spruce wood. Holzforschung 57 (5): 539-546.
Deliiski, N. 1991. The method extends the assessment of the degree of beech sawn timber during its drying process. Current problems and perspectives of beech lumber drying 1991. ES-VŠLD in Zvolen (Slovakia), 37−44.
Dudiak, M. 2023. Density of beech (Fagussylvatica L.) wood through a cross-section of the trunk. Acta Facultatis Xylologiae Zvolen. Zvolen, 65(2), 5-11.
Dzurenda, L. 2014. Colouring of Beech Wood during Thermal Treatment using Saturated Water Steam. Acta Fac. Xylologiae Zvolen 2014, 56, 13–22.
Dzurenda, L., Dudiak, M. 2021. Cross-correlation of color and acidity of wet beech wood in the process of thermal treatment with saturated steam. Wood Research 66 (1): 105-116.
Dzurenda, L., 2022. Mode for hot air drying of steamed beech blanks while keeping the colours acquired in the steaming process. Acta Facultatis Xylologiae Zvolen. Zvolen, 64(1), 81-88.
Dzurenda, L. Dudiak, M. 2023. Color diversity of beech wood with a false heartwood in the color space CIE L*a*b*. Wood Research 68(4): 68(4): 792-801.
Dzurenda, L. 2023. Natural Variability of the Color of Beech Wood in the Color Space CIE L*a*b*. Forests 14, 1103.
Dzurenda, L., Dudiak, M., Kučerová, V., 2023. Differences in Some Physical and Chemical PropertiesofBeechwoodwithFalseHeartwood,Mature Wood and Sapwood. Forests,14,1123.
Dzurenda, L., Dudiak, M. 2024. Homogenization of the color of beech sapwood and false heartwood by the steaming process. Forests 15(6):1009.
Geffert, A., Vybohová, E., Geffertová, J. 2017. Characterization of the changes of colour and some wood components on the surface of steamed beech wood. Acta Facultatis Xylologiae Zvolen 59(1): 49−57.
Gorczynski, T. 1951. Comparative anatomical studies on common beech wood (Fagussylvatica L.). Rocz.demdr.Polsk. Tow. Bot.7. 3-114.
Hofmann, T., Albert, L., Rétfalvi, T., Bányai, É., Visiné Rajczi, E., Börcsök, E., Németh, Z S. 2004 Quantitative TLC Analysis of (+)-Catechin and (-)-Epicatecin from Fagus sylvatica L. with and without Red Heartwood. Journal of Planar Chromatography (17): 350–354.
Laskowska, A. 2020. The influence of ultraviolet radiation on the colour of thermo-mechanically modified beech and oak wood. Maderas, Cienc. tecnol. Vol. 22 no.1 Concepción ene. 2020.
Mahler, G., Höwecke, B., 1991. Verkernungserscheinungen bei der Buche in Baden- Württemberg in Abhängigkeit von Alter, Standort und Durchmesser. Schweiz. Z. Forstwes. 142: 375−390. Makovíny I., 2010. Useful properties and use of different types of wood. TU Zvolen, Zvolen.
Milić, G., Todorović, N.;, Popadić, R. 2015. Influence of steaming on drying quality and colour of beech timber. Glas. Šumar. Fak. 112, 83–96.
Nečesaný, V., 1958. Beech false heartwood, structure, origin and development. Publishing House of the Slovak Academy of Sciences, Bratislava. 256 p
Požgaj, A., Chovanec, D., Kurjatko, S., Babiak, M., 1997. Structure and properties of wood. Bratislava, Slovakia, Príroda, 1997, 485 p.
Račko, V., Čunderlik, I. 2006. Qualitative and quantitative evaluation of false heartwood in beech logs of various age and qualitative structure. Wood Research, 51(3): 1−10.
Račko,V.,Čunderlík,I.,2010.Maturewoodasalimitingfactorintheformationofafalseheartwood beech (Fagussylvatica L.). Acta facultatis xylologiae Zvolen,52 (1), 15 – 24.
Tolvaj, L., Nemeth, R., Varga, D., Molnar, S.2009 Colour homogenisationof beech woodby steam treatment. Drewno, 52, 5–17.
Trenčiansky, M., Lieskovský, M., Merganič, J., Šulek, R. 2017. Analysis and evaluation of the impact of stand age on the occurrence and metamorphosis of red heartwood. ForestBiogeosciences and Forestry, 10(3):605-610.
Vilkovský, P., Klement, I., Vilkovská, T., 2023. The Impact of the Log-Sawing Patterns on the Quantitative and Qualitative Yield of Beech Timber (Fagussylvatica L.). Appl. Sci. 2023, 13, 8262. https://doi.org/10.3390/app13148262
ACKNOWLEDGMENT
This experimental research was prepared within the grant project: APVV-21-0051 Research of false heartwood and sapwood of Fagussylvatica L. wood in order to eliminate color differences by the process of thermal treatment with saturated water steam as the result of work of author and the considerable assistance of the APVV agency
AUTHOR ADDRESS
Ladislav Dzurenda
Michal Dudiak
Technical University in Zvolen
T. G. Masaryka 24 960 01 Zvolen, Slovakia dzurenda@tuzvo.sk xdudiak@tuzvo.sk
ACTA FACULTATIS XYLOLOGIAE ZVOLEN, 66(2): 35 49, 2024
Zvolen, Technická univerzita vo Zvolene
DOI: 10.17423/afx.2024.66.2.04
THE EFFECT OF NATURAL WEATHERING ON STABILITY OF COATING SYSTEM WITH SELF-HEALING MICROCAPSULES
Zuzana Vidholdová – Gabriela Slabejová – Jozef Kúdela – Ján Svocák
ABSTRACT
The performance of self-healing and standard coating systems on oak wood exposed to natural weathering for two years is investigated in the paper. The changes in coating thickness, colour coordinates L* , a *, b*, total colour difference ΔE* ab, impact resistance, and adhesion by Pull-off and Cross-cut tests are evaluated in the study. The results show that while both coating system types displayed slight colour alterations, the self-healing coating system containing microcapsules exhibited more colour stability, maintaining a colour difference (ΔE* ab) of 2.6. The primary factors contributing to colour change were variations in lightness (L*) and, to a* lesser degree, the b* coordinate leading to subtle darkening and yellowing of the coatings. However, the self-healing coating system exhibited lower impact resistance indicating increased brittleness and susceptibility to cracking corresponding to the standard coating system. Regarding adhesion, the self-healing coating system showed no changes after weathering, as measured by the Pull-off and Cross-cut tests. In contrast, the standard coating system experienced a 32% reduction in adhesion in the Pull-off test. These findings suggest that although self-healing coatings may offer advantages in colour retention, their application on exterior wood surfaces, particularly those exposed to mechanical stress, requires careful consideration.
Keywords: adhesion properties; colour stability; impact resistance; self-healing coatings, weathering.
INTRODUCTION
Mechanical damage and crack formation belong to the most harmful defects in wood surface coatings, as they compromise the integrity of the coating film, which leads to a significant reduction in its protective capabilities against environmental factors, particularly water, UV radiation, chemical agents, contamination, andbiological organisms suchas fungi and algae (Bulian and Graystone, 2009; Viitanen and Ritschkoff, 2011; Hochmańska et al., 2014; Reinprecht and Pánek, 2015; Kúdela et al., 2017, Liu et al., 2017; Vidholdová et al., 2017; Cogulet et al., 2018; Slabejová et al., 2019; Jirouš-Rajković and Miklečić, 2021; Hasanagić et al., 2024). These disturbed areas act as starting points for further degradation, mainly through moisture absorption, which induces swelling in the surface layers of the wood. The resulting tension at the wood-coating interface promotes crack propagation, accelerating the coating breakdown (Lagaňa et al., 2021). This process impairs adhesion between the coating and the wood substrate, leading to peeling, and necessitates frequent
and costly maintenance of the damaged surface. Considerable research efforts are focused on mitigating these negative effects to extend the lifespan of surface coatings.
A significant advancement in this field is the development of self-healing coatings (White et al., 2001; Suryanarayana et al., 2008; Cho et al., 2009; Samadzadeh et al., 2010; Zhao et al., 2012; Schreiner et al., 2017; Landry et al., 2023). Microencapsulation technologies offer a wide range of core and shell material combinations for producing selfhealing coatings (Ghosh, 2006). Recent reviews by Blanchet and Pepin (2021) and Chang et al. (2023) highlight the increasing use of microcapsules in wood surface treatments as a notable trend. A variety of organic and inorganic materials, such as melamine-formaldehyde resin, urea-formaldehyde resin, polyurethane, poly(methyl methacrylate), polystyrene, polyester, silica, calcium carbonate, titanium dioxide, and alumina, have been identified as suitable for the construction of microcapsule shells in phase-change materials (Maiti et al., 2023). These microcapsules, often filled with active agents such as low-viscosity polymers, release their contents when cracks form, filling and sealing the damaged areas. This selfrepair mechanism restores the integrity of the coating, enhancing its durability and reducing the frequency of required maintenance, thus providing a promising solution for more resilientwoodsurfacetreatments. These coatings areeffectiveformicrocrackrepairbut may not handle larger-scale damage effectively. However, the self-healing functionality of these capsules is typically single-use, as they cannot be refilled once the contents are released.
Research has explored several types of microcapsules for use in wood surface treatments. For instance, Queant et al. (2018) investigated microcapsules embedded with UVabsorbersin calcium carbonatetemplates,coatedwithalight-responsivepolymer,which enhanced UV protection by gradually releasing the absorbers, thereby extending the longevity of the wood coating. Yan and Peng (2020) demonstrated the use of ureaformaldehyde resin (UF) microcapsules in waterborne coatings intended to improve crack resistance on wood surfaces. Han et al. (2020) studied the influence of preparation processes on the performance of microcapsules, using paraffin as the core material and melamineformaldehyde as the shell material. Furthermore, Xia et al. (2024) examined how mixed shellac microcapsules coated with melamine rice husk powder, on the aging resistance and self-healing properties of waterborne coatings for Tilia europaea L. Wang et al. (2022) prepared intelligent wood coatings with dual functions of self-healing and discolouration, integrating fluorane microcapsules for discolouration and shellac resin microcapsules for self-healing.
Several studies were conducted to examine the effects of microcapsule addition on theopticalandmechanicalpropertiesofcoats. Forexample,inthestudybyYan et al. (2021), UF-coatedwaterborneacrylicresin microcapsules with varyingcore-shell ratios weretested. As microcapsule concentration increased, the colour difference and hardness of the coating film gradually increased while gloss and adhesion decreased. Impact resistance and elongation at break initially increased and then declined. Increasing the core-shell ratio also led to a similar trend: hardness and impact resistance rose initially and then decreased, while adhesion decreased consistently. In another study by Yan et al. (2022), melamine/rice husk powder-coated shellac microcapsules were prepared via in-situ polymerization, using melamineresin andricehuskpowderasthewallmaterial andshellacasthecore.Theauthors found that these coatings had minimal impact on optical properties. Following a UV aging resistance test, changes in colour difference and gloss were minimal. Wu et al. (2023) found that the gloss and adhesion of waterborne wood paint coatings decreased with increasing microcapsule concentration. The hardness, impact resistance, and tensile properties initially increased and decreased as microcapsule content rose. This study utilized microcapsules containing multi-walled carbon nanotubes and carbonyl iron powder as core materials and a
melamine-formaldehyde resin as the wall. Finally, in the study by Xia et al. (2024), it was found that waterborne coatings with mixed shellac microcapsules maintained their optimal optical and mechanical properties over time. According to aging resistance tests, these coatings demonstrated a prolonged effective lifespan.
To develop effective self-healing coatings, it is crucial to assess the impact of microcapsules on the properties of the coating and its interaction with other layers within the coating system. A study by Xia et al. (2022) further highlights that the impact resistance of a paint film with microcapsules added solely in the primer or topcoat was lower compared to the films with microcapsules incorporated into both layers. While microcapsules can enhance impact resistance to a certain extent, their agglomeration weakens the adhesion between the paint film and the wood surface, leading to reduced overall impact resistance. Consequently, the best impact resistance was observed in coatings containing microcapsules in both the primer and topcoat layers, as this configuration provided optimal attachment to the wood surface and improved durability.
The objective of this experimental study is to evaluate the effectiveness of self-healing coatings by investigating the influence of microcapsules on the selected coating's properties and its interaction with other layers in the coating system. These specific systems were designed for dimensionally stable wooden products such as windows, doors, and other exterior wooden construction. Specifically, it examines a self-healing surface treatment incorporating microcapsules within the intermediate layer. The research aims to evaluate the impact of this modified intermediate layer on colour stability during natural weathering, alongwithitseffects onselectedmechanicalpropertiesandadhesionofthesurfacetreatment systems to oak wood.
MATERIALS AND METHODS
Wood Material
Oak wood (Quercus petraea L) was used in the experiment. The dimensions of the test specimens were 375 mm × 78 mm × 20 mm Fourteen test specimens were used in experiment. The test specimens’ surface was sanded according to the recommendations listed in technical sheets for the coating materials.
Coating System
The following water-based white pigmented coatings were selected for the surface treatment of dimensionally stable components such as windows, exterior doors, and furniture for winter gardens and outdoor use:
• Basecoat – Aprotectiveimpregnationbasedon a mixtureofalkyd and acrylicresins, offering good coverage. It contains wood preservative – 0.8% of 3-iodo-2-propynylN-butyl-carbamate (IPBC) and 0.4% of tebuconazole.
• Intermediate coat with microcapsules – An acrylic dispersion-based coating with a low solvent content, enriched with microcapsules designed to seal cracks caused by weathering or mechanical damage.
• Top coat – An acrylic dispersion-based coating with excellent weather resistance. White pigmented coatings on oak wood often balance aesthetic goals with practical considerations, offering a clean, modern look while masking any natural imperfections or colour variations and ensuring consistency. They also enhance the wood's texture by highlighting its grain, adding depth and character to wooden constructions like windows and doors.
Two types of white pigmented coating system were created:
• Standard coating system – Consisting of one coat of the base (average wet film thickness of 100 μm) and one coat of the top coat (150-180 μm wet film thickness).
• Self-healing coating system – Consisting of one coat of the base (100 μm wet film thickness), one coat of the intermediate coat with microcapsules (150-180 μm wet film thickness), and one of the top coat (150-180 μm wet film thickness). The test specimens were surface finished on all sides by low-pressure spraying.
Natural Outdoor Weathering of Coated Wood Specimens
Exposure of all coated specimens in the exterior was carried out according to the standard STN EN 927–3 (2006) in frames facing south at an angle of 45° and placed approximately 1 m above the ground for 24 months at the Technical university in Zvolen
Thickness of the Coating Film
Non-destructive method was chosen to measure the film thickness using the ultrasonic instrument PosiTector 200. Thickness measurements were taken at 12 points on each coated specimen across the top surface before and after 2 years of weathering.
Colour Evaluation
The colour characteristics of the wood surfaces were measured using a spectro-photometer Spectro-guide 45/0 gloss manufactured by BYK – GARDNER GmvH. The device was configured with a D65 light source and a 10° observation angle. The parameters L* (= black/white), a *(+a*/ − a*= red/green), and b* (+b*/ − b* = blue/yellow) were measured at six points at the same position on each coated specimen over the tangential surface at the beginning of the experiment and after 2 years of weathering. The colourimetric parameters for each coated specimen were analysed according to the CIE Lab system (ISO 7724–3: 1984). A positive value for L* , a *, or b* indicates a lighter, redder, or yellower colour, respectively.
The relative colour changes ΔL*, Δa*, and Δb*, representing the differences between the chromaticity coordinates of the weathered coated specimens and the initially coated specimens, were used to calculate the total colour difference (ΔE* ab) according to Equation (1):
Impact Resistance
The impact resistance of the surface finishes was determined according to the standard STN EN ISO 6272–2 (2011). The intrusion (diameter of the intrusion) was measured and the surface finish was evaluated subjectively according to Tab 1 For the purposes of microscopic analysis, a Keyence VHX-7000 digital microscope (Keyence Corporation, Osaka, Japan) was used (Adamčík et al. 2023)
Tab. 1 Impact resistance: degree and evaluation.
Degree Visual evaluation
1 No visible changes
2 No cracks on the surface and the intrusion were only slightly visible
3 Visible light cracks on the surface, typically one to two circular cracks around the intrusion
4 Visible large cracks at the intrusion
5 Visible cracks were also off-site of intrusion, peeling off the coating
Adhesion Tests
Adhesion of the coating films to wood was determined by the Pull-off test according to the standard STN EN ISO 4624 (2023) and by the Cross-cut test according to the standard STN EN ISO 2409 (2020).
The testing machine PosiTest AT-M (Qualitest, Canada) was used for the Pull-off test. Small 20 mm diameter dollies were glued to the coating using two-component epoxy resin (Pattex Repair Epoxy).After24 hof curingat 20 °C anda relative airhumidity of60%, perimeters of glued dollies were carefully incised to prevent the propagation of failures outside the tested area. Pulling was carried at a rate of 1 mm/min up to separating the dolly from the surface. After each test, the fracture was evaluated visually using Tab 2
Tab. 2 Evaluation of the Pull-off area.
Classification
A Cohesive failure in the substrate
Nature of the violation
A/B Adhesion failure between the substrate and the first coating
B Cohesive failure in the first coating
B/C Adhesion failure between the first coating and the second coating
n Cohesive failure of the nth coating in a multi-layer system
n/m Adhesion failure between the nth coating and mth coating in a multi-layer system
-/Y Adhesion failure between the top coating and the adhesive
Y Cohesive failure in the adhesive
Y/Z Adhesion failure between the adhesive and the metal dolly
The Cross-cut test was done as follows: a cross hatch pattern was cut through the coating film to the substrate. The adhesion of the coating film was classified according to the standard STN EN ISO 2409 (2020) (Tab 3). The figures are examples of a cross-cut within each step of the classification. The percentages stated are based on the visual impressiongivenbythepicturesandthesamepercentageswillnotnecessarilybereproduced with digital imaging.
Tab. 3 Evaluation of the Cross-cut area.
Surface of crosscut area from which flaking has occurred.
(Example for six parallel cuts)
Statistical


Evaluation
The evaluation of colour changes and selected mechanical properties and adhesion of the coating systems during weathering was performed using an analysis of variance (ANOVA) and post hoc Duncan test with an α significance value of 0.05. All the statistical analyses were carried out in the software STATISTICA12(StatSoft, USA) andMSExcel (Microsoft, USA).
RESULTS AND DISCUSSION
Thickness of the Coating Film
The thickness of the surface finishes was determined using non-destructive method (Tab 4).
Tab. 4 Coating films thickness before and after 2-years of natural weathering.
Film Thickness of coating system (μm) Unweathered
Note: Average (x) and standard deviation (SD) were derived from a dataset of twelve values.
The thickness of the coating film plays a crucial role in determining the quality of the surface finish. Studies by Hundhausen et al. (2018) and Palija et al. (2018) investigated the factors influencing coating film thickness in industrial production, emphasizing the significant impact thickness has on overall surface quality. Furthermore, knowledge of the coating film thickness is essential for determining adhesion properties when applying the cross-cut method.
Effect of Weathering on Colour Changes
The changes in the colour coordinates L* , a *, and b* of the self-healing and standard coating system due to natural weathering are shown in Tab. 5. The a * and b* parameters changed more moderately compared to lightness (L*), with a similar pattern of change across all coordinates. The self-healing coating system, containing specialized microcapsules, displayed a change trend comparable to that of the standard coating system, with only slight differences.
Tab. 5 Colour stability analysis: CIE Lab parameters L* , a *, and b* of coated systems before and after 2-years of natural weathering.
CIE
Lab Parameters (–)
Note: Average (x) and standard deviation (SD) were derived from a dataset of forty-two values. A - Duncan's test compares the means between unweathered and weathered groups to identify statistically significant differences between them according to the p – level value
After two years of weathering, the self-healing coating system showed a slight advantage in colour stability compared to the standard system, with average ΔE* ab values of 2.6 and 2.7, respectively (Fig. 1). This colourdifferencedid not exceedavalueof3.5 (degree 3); according to the five-level scale (Mokrzycki and Tatol, 2011), this indicates that even an unexperienced observer would notice the difference. The primary contributors to the colour
change were the alterations in lightness (L*) and, to a lesser degree, in the b* coordinate. These changes led to a slight darkening of the coatings and a very subtle yellowish tone.
The statistical analysis of colour changes ΔL*, Δa*, Δb* and colour difference ΔE* ab between self-healing and standard coating system, conducted using Duncan's test, the type of coating system revealed a statistically significant effect on colour changes ΔL*, Δa*, and Δb* during weathering (p = 0.000). However, the total colour difference value (ΔE* ab) was not significantly affected by weathering (p = 0.331). This finding suggests that the selfhealing coating system exhibited colour stability due to having the same top coat as the standard coating system.
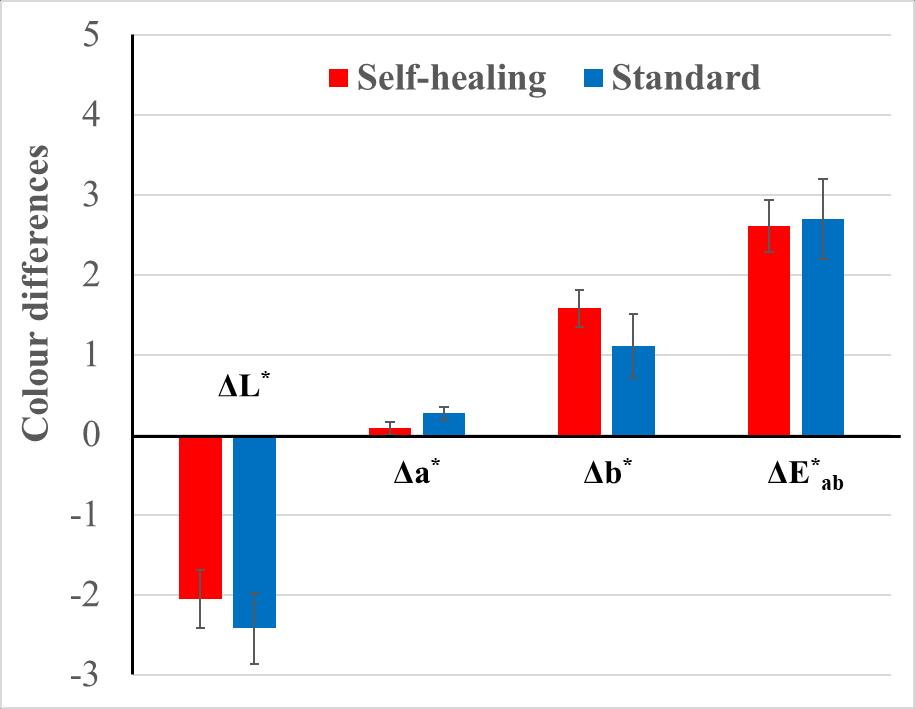
Fig. 1 Differences in colour coordinates and the total colour difference after 2-years of natural weathering.
The discolouration is among the first visible indicators of degradation, as supported by previous studies (Reinprecht and Pánek, 2015; Kúdela et al., 2017; Jirouš-Rajković and Miklečić, 2021). The colour change of coatings during weathering is linked to physical and chemical changes on the surface of the coating, as well as within its interior and the underlying substrate (Van den Bulcke et al., 2008). While the pigments in coatings serve to block UV radiation, thereby catalysing wood degradation, the resins as organic polymers undergo UV-induced degradation, leading to the breakdown of organic compound bonds. The degradation rate depends on the UV resistance of the polymer used (Williams, 2010). Based onthe evaluation oftotal colourdifferences, both whitecoatingsystems demonstrated superior colour stability following exposure to natural weathering, aligning with the findings of Oberhofnerová et al., (2018). In the study by Yan et al., (2022), the authors found that the Dulux waterborne primer with melamine/rice husk powder-coated shellac microcapsules had also little effect on colour difference after UV aging. They explained this by noting that aging creates bubbles in the primer, and that the use of microcapsules helped reduce their size.
Effect of Weathering on Impact Resistance
The impact resistance, measured as the penetration diameter, and the subjective evaluation of damage to the self-healing and standard coating system are presented in Tab. 6. No improvement in impact resistance at a drop height of 10 and 20 mm was observed to the naked eye for the self-healing coating system compared to the standard system. The self-
healing coating exhibited limited impact resistance. Visible light cracks on the surface, typically one to two circular cracks around the intrusion was after the impact resistance test at a drop height of 200 mm. This indicates that the self-healing system is less durable, as it is more brittle and prone to cracking than the standard system.
Tab. 6 Degree of change on the surface and diameter of the intrusions before and after 2-years of natural weathering.
Drop
(mm)
Note: For degree, two classifications of impact resistance on the surface is listed, noted as follows: X(Y) The first one is derived from the visual analyse observed to the naked eye. The second one is based on the microscopic analysis.
Microscopic analysis revealed predominantly circular cracks around the intrusion that were not visible to the naked eye. Cracks were also observed in the self-healing coating system prior to aging at adrop height of 100 mm (Tab. 6). Figure 2 shows the sample surface after the impact resistance test, with these cracks evident at a drop height of 200 mm on surface both before and after two years of natural weathering.
Unweathered Weathered
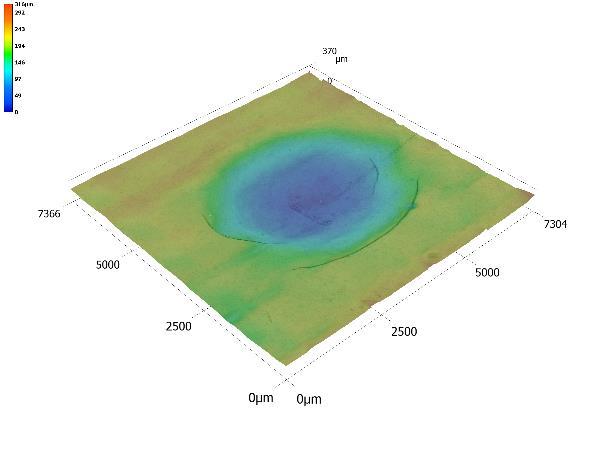
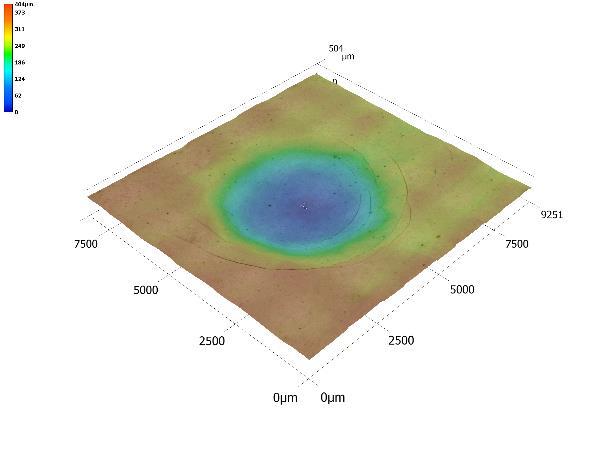
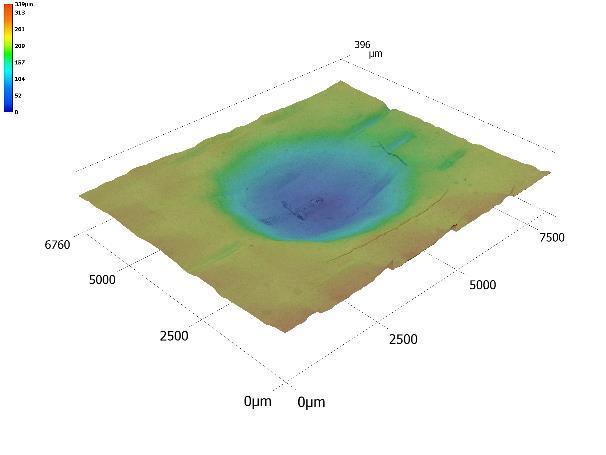
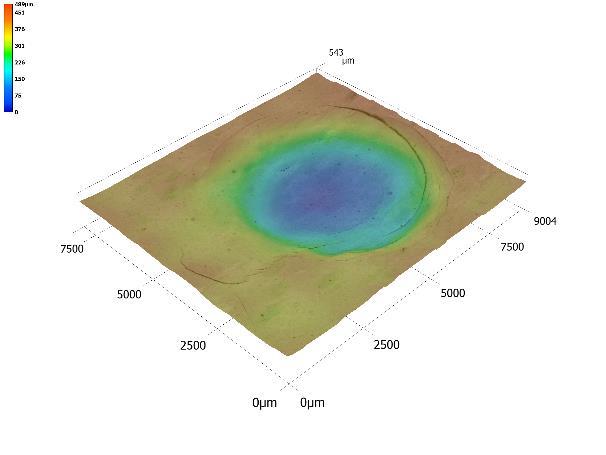
Fig. 2 Sample surface after the impact resistance test with typically circular cracks (marked as white arrows) around the intrusion at the drop height of 200 mm before and after 2-years of natural weathering.
Microscopic analysis revealed visible cracks were also off-site of intrusion. After two years of natural weathering, the number of cracks increased after the impact resistance test. However, the naked eye said they were less pronounced than in the standard coating system. These findings suggest that, while the self-healing coating system is designed to seal microcracks that develop during the aging of exterior treatments, it appears to be more susceptible to cracking under mechanical impacts, such as hail or small rocks. This highlights the potential vulnerability of the self-healing system to mechanical stress.
The impact resistance of coatings increases with coating thickness, but only up to a certain point (Slabejová, 2012; Slabejová et al., 2018). In this study, the self-healing coating system exhibited greater thickness than the standard coating, which supports the cited observation. Hazir and Koc (2019) emphasize that the type of coating system significantly influences impact resistance, as it depends on all components within the paint film. Our findings align with this, showing that the intermediate layer containing microcapsules in the self-healing system affected the impact resistance at specific drop heights. Also, a study by Xia et al. (2022) found that microcapsules can enhance impact resistance to a certain extent.
Effect of Weathering on Adhesion of the Coating Film (Pull-off Test)
As shown in Fig 3, the both self-healing and standard coating system exhibited similar failure in adhesion to oak wood. Minimal fibre separation occurred on surface of wood, from 5% to10% of the area before and after weathering (failure was classified as A/B) We also confirmed that the interlayer with microcapsules had no effect on the coherence of the coating system, i.e., relationship to the base coat as well as to the top coat. Adhesion was less strong than the cohesion of the coating system.
Unweathered
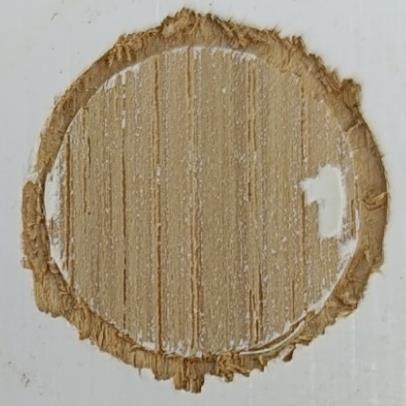
Weathered
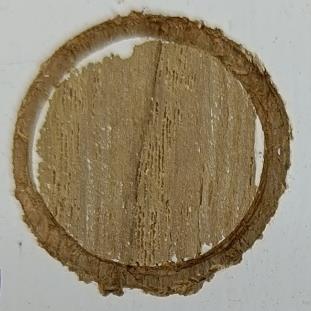
Self-healing Failure: A/B, 95% Failure: A/B, 95% Standard
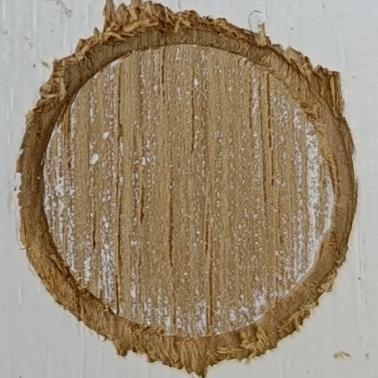
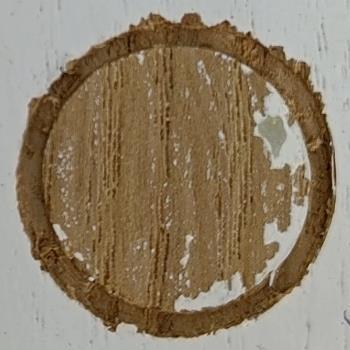
The difference between the standard and self-healing coating systems concerning their adhesion to oak wood was evident (Tab. 7). The adhesion of the coating film prior to the exposure of the self-healing coating system was 23% lower than that of the standard surface treatment system. After weathering, the self-healing coating system demonstrated betteradhesiontothesubstrateincomparisontothestandardcoatingsystem,thussuggesting that thestandard coating system exhibits ahighersusceptibilityto adhesion failurefollowing prolonged exposure. In contrast, the adhesion of the standard surface treatment system experienced a decline of 32% following exposure. These findings were confirmed by statistical evaluation using variance analysis of the Duncan test (Tab. 7). Grüll et al. (2013) demonstrated that the high film thicknesses contributed to better moisture protection, higher coating durability, and longer maintenance intervals. We assume that the greater thickness of the self-healing coating system ensured comparable adhesion after weathering to before weathering. The effect of weathering of the standard surface treatment system caused a decrease in adhesion. Bilgen (2010) noted that a reduction of the adhesion between the varnish layer and sample layer occurred due to the expansion of the varnish layer due to the weathering.
Tab. 7 Adhesion of the coating film before and after 2-years of natural weathering.
Adhesion of the Coating Film (Pull-off Test) (MPa) Before Weathering After Weathering Statistical Significance*
Note: Average (x) and standard deviation (SD) were derived from a dataset of twelve values. * Duncan's test compares the means between self-healing and standard coating system groups to identify statistically significant differences between them according to the p - level value
The significant impact of surface finish on adhesion was confirmed by Hazir and Koc (2019), Slabejová and Vidholdová (2019), Miklečić et al. (2017), and Delpech and Coutinho (2000). Hazir and Koc (2019) demonstrated that the type of coating significantly affects adhesion strength, surface hardness, layer thickness, and response to rapid deformation testing. Self-healing coatings typically use microcapsules that release healing agents upon damage to seal cracks. However, as demonstrated by studies such as Slabejová et al. (2020), the integration of these capsules into a coating can lead to reduced adhesion and impact resistance. The encapsulated healing agents may compromise the coating’s structural integrity, especially under mechanical loading. This aligns with our findings where the selfhealing coating system showed lower impact resistance and adhesion compared to the standard system.
Effect of Weathering on Adhesion of the Coating Film (Cross-cut test)
Figure 4 shows the adhesion results evaluated by the Cross-cut test. The adhesion of both the unweathered self-healing and the standard coating system coatings on oak wood was rated as grade 2.
As noted in the studies by Yan et al. (2021); Xia et al. (2022), Wu et al (2023), the coating's inability to encapsulate completely the microcapsules contained in high portions in coatings, may results in reduced adhesion. After two years of weathering, the adhesion of both the self-healing and standard coating on oak wood was rated as grade 2, with comparable performance.
Self-healing
Unweathered Weathered

Grade: 2

Grade: 2
Standard

Grade: 2

Grade: 2
Fig. 4 Adhesion of the coating film (Cross-cut test) before and after 2-years of natural weathering.
Acomparison ofthetwoadhesion test methods showedthat theCross-cut test provides less information than the Pull-off test. According to the Cross-cut test, the self-healing coating system did not influence adhesion. The results indicate that the intermediate layer with microcapsules reduced the adhesion of the coating film to the oak wood surface. Our observation that the Pull-off test provides more information than the Cross-cut test is consistent with the findings of Brzozowska et al. (2023). They report that the Cross-cut test is less sensitive to small-scale variations in adhesion, whereas the Pull-off test gives a more precise measure of bond strength across different layers. In contrast, the Cross-cut test is better suited for quick assessments of coating quality and adhesion uniformity. However, this test does not capture the more complex interactions between coating layers and substrates.
CONCLUSION
The study on self-healing and standard coating system for oak wood, including a microcapsule-based intermediate layer in the self-healing coating system, provided essential insights into the effects of natural weathering on coatings' optical and mechanical properties. After weathering, it was observed that:
• The self-healing coating system showed a slight advantage in colour stability compared to the standard system, with average ΔE* ab values of 2.6 and 2.7, respectively. The primary contributors to colour change were shifts in lightness (L*) and, to a lesser extent, the b* coordinate, resulting in subtle darkening and yellowing of the coatings.
• The self-healing coating system exhibited lower impact resistance than the standard system, being more brittle and more prone to cracking.
• The self-healing coating system showed no change in adhesion as measured by the Pull-off test, while the standard coating system exhibited a 32% decrease.
• The self-healing coating system also showed no change in adhesion according to the Cross-cut test.
These findings suggest that while self-healing coatings may offer advantages in colour retention, their use on exterior wood surfaces, especially those subject to mechanical stress, should be approached cautiously. For applications that prioritize both colour stability and structural integrity, further optimization of the microcapsule formulation is recommended to improve adhesion and impact resistance.
REFERENCES
Adamčík, L., Kminiak, R., Schmidtová, J., 2023. Measurement of the roughness of the sanded surface of beech wood with the profile measurement software of the Keyence VHX-7000 microscope. Acta Facultatis Xylologiae Zvolen, 65(1), 73–86. https://doi.org/10.17423/afx.2023.65.1.07
Bilgen, S., 2010. The Effects of Outside Conditions Over Some Characteristics of Varnished Juniper Wood. Institute of Science and Technology, Karabuk University, Karabuk, 48–52
Blanchet, P., Pepin, S., 2021. Trends in Chemical Wood Surface Improvements and Modifications: A Review of the Last Five Years. Coatings 11(12), 1514. https://doi.org/10.3390/coatings11121514
Brzozowska, K., Chowaniec-Michalak, A., Niewiadomski, P., Sadowski, Ł., 2023, Adhesive Properties of Polyurethane Paint Coatings Modified with Multi Walled Carbon Nanotubes for Hardwood Protection. In International Conference on Adhesive Bonding (pp. 41-51). Cham: Springer Nature Switzerland. https://doi.org/10.1007/978-3-031-48363-9_4
Bulian, F., Graystone, J., 2009. Wood coatings: Theory and practice. Elsevier. Cogulet, A., Blanchet, P., Landry, V., 2018. The multifactorial aspect of wood weathering: a review based on a holistic approach of wood degradation protected by clear coating. BioResources 13(1), 23 p https://doi.org/10.15376/biores.13.1.Cogulet
Delpech, M.C., Coutinho, F.M.B., 2000. Waterborne anionic polyurethane and poly(urethaneurea)s: influence of the chain extender on mechanical and adhesive properties. Polymer Testing 19(8), 939–952. https://doi.org/10.1016/S0142-9418(99)00066-5
Ghosh, S.K., 2006. Functional coatings and microencapsulation:a general perspective. In Functional Coatings: by polymer microencapsulation, WILEY-VCH Verlag GmbH & Co. KGaA, Weinheim, 1-28. https://doi.org/10.1002/3527608478.ch1
Grüll, G., Truskaller, M., Podgorski, L., Bollmus, S., De Windt, I., Suttie, E., 2013. Moisture conditions in coated wood panels during 24 months natural weathering at five sites in Europe. Wood Material Science & Engineering 8(2), 95–110. https://doi/full/10.1080/17480272.2013.771212
Hasanagić, R., Šljivo, U., Fathi, L., Gautam, P., Bahmani, M., Humar, M., 2024. Evaluation of Mechanical Properties and Surface Quality of Wood from Bosnia and Herzegovina Exposed to Outdoor Conditions. Journal of Renewable Materials 12(8), 1417–1431. https://doi.org/10.32604/jrm.2024.052826
Hazir, E., Koc, K.H., 2019. Evaluation of wood surface coating performance using water based, solvent based and powder coating. Maderas. Ciencia y tecnología 21(4), 467–480. http://dx.doi.org/10.4067/S0718-221X2019005000404
Hochmańska, P., Mazela, B., Krystofiak, T., 2014. Hydrophobicity and weathering resistance of wood treated with silane-modified protective systems. Drewno: prace naukowe, doniesienia, komunikaty 57(191), 99–110. https://doi.org/10.12841/wood.1644-3985.060.07
Hundhausen, U., Slabohm, M., Meinlschmidt, P., 2018. Industrial coating of wood cladding: In line control of board temperature, film thickness, and microfoam. Conference: PRA's 11th International Wood Caotings Congress. 10 p.
Chang, Y., Yan, X., Wu, Z., 2023. Application and prospect of self-healing microcapsules in surface coating of wood. Colloid and Interface Science Communications 56, 100736. https://doi.org/10.1016/j.colcom.2023.100736
Cho,S.H.,White,S.R.,Braun,P.V.,2009.Self-healingpolymercoatings. AdvancedMaterials21(6), 645 649. https://doi.org/10.1002/adma.200802008
ISO 7724–3, 1984. Paints and Varnishes Colorimetry Part 3: Calculation of Colour Differences; International Organization for Standardization: Geneva, Switzerland.
Jirouš-Rajković, V., Miklečić, J., 2021. Enhancing weathering resistance of wood A review. Polymers 13(12), 1980. https://doi.org/10.3390/polym13121980
Kúdela, J., Štrbová, M., Jas, F., 2017. Influence of accelerated ageing on morphology and wetting of wood surface treated with a modified water-based coating system. Acta Facultatis Xylologiae Zvolen res Publica Slovaca 59(1), 27.
Lagaňa, R., Svocák, J., Kúdela, J., 2021. A study of the surface properties of a solid wood coating system with self-healing microcapsules. In 9th Hardwood Proceedings-Part II; University of Sopron: Sopron, Hungary, 9, 61–67.
Landry, V., Boivin, G., Schorr, D., Mottoul, M., Mary, A., Abid, L., Carrère, M., Laratte, B., 2023. Recent Developments and Trends in Sustainable and Functional Wood Coatings. Current Forestry Reports 9(5), 319 331. https://doi.org/10.1007/s40725-023-00195-0
Liu, X.Y., Timar, M.C., Varodi, A.M., Sawyer, G., 2017. An investigation of accelerated temperature-induced ageing of four wood species: colour and FTIR. Wood science and technology 51, 357–378. https://doi.org/10.1007/s00226-016-0867-4
Maiti, T. K., Dixit, P., Suhag, A., Bhushan, S., Yadav, A., Talapatra, N., Chattopadhyay, S., 2024. Advancementsinorganic and inorganicshellmaterialsforthepreparationofmicroencapsulated phase change materials for thermal energy storage applications. RSC Sustainability 1(4), 665 697. https://doi.org/10.1039/D2SU00116K
Miklečić, J., Turkulin, H., Jirouš-Rajković, V., 2017. Weathering performance of surface of thermally modified wood finished with nanoparticles-modified waterborne polyacrylate coatings. Applied Surface Science 408, 103–109. https://doi.org/10.1016/j.apsusc.2017.03.011
Mokrzycki, W., Tatol, M., 2011. Color difference Delta E - A survey. Machine Graphics and Vision 20(4), 383 411.
Oberhofnerová, E., Hýsek, Š., Pánek, M., Böhm, M., 2018. Effect of artificial weathering and temperature cycling on the performance of coating systems used for wooden windows. Journal of Coatings Technology and Research 15, 851 865.https://doi.org/10.1007/s11998-017-0033-4
Palija, T., Jaić, M., Džinčić, I., Šućur, A., Dobić, J., 2018. Variability of dry film thickness of a coating applied by roller coater on wood in a real industrial process. Drewno 61(201), 153–164. https://doi.org/10.12841/wood.1644-3985.251.13
Reinprecht, L., Pánek, M., 2015. Effects of wood roughness, light pigments, and water repellent on the color stability of painted spruce subjected to natural and accelerated weathering. BioResources 10(4), 7203 7219.
Queant, C., Blanchet, P., Landry, V., Schorr, D., 2018. Effect of Adding UV Absorbers Embedded in Carbonate Calcium Templates Covered with Light Responsive Polymer into a Clear Wood Coating. Coatings 8, 265. https://doi.org/10.3390/coatings8080265
Samadzadeh, M., Boura, S.H., Peikari, M., Kasiriha, S.M., Ashrafi, A., 2010. A review on selfhealing coatings based on micro/nanocapsules. Progress in Organic Coatings 68(3), 159 164. https://doi.org/10.1016/j.porgcoat.2010.01.006
Schreiner, C., Scharf, S., Stenzel, V., Rössler, A., 2017. Self-healing through microencapsulated agents for protective coatings. Journal of Coatings Technology and Research 14, 809 816. https://doi.org/10.1007/s11998-017-9921-x
Slabejová, G., 2012. Vplyv vybraných faktorov na stabilitu systému drevo – tuhý náterový film [Influence of selected factors on the stability of the wood-solid paint film system]. Acta Facultatis Xylologiae Zvolen res Publica Slovaca 54(2), 57–65.
Slabejová, G., Šmidriaková, M., Pánis, D., 2018. Quality of silicone coating on the veneer surfaces. BioResources (13)1, 776−788. https://doi.org/10.15376/biores.13.1.776-788
Slabejová,G.,Vidholdová,Z.,Šmidriaková,M.,2019.Surfacefinishesforthermallymodifiedbeech wood. Acta Facultatis Xylologiae Zvolen res Publica Slovaca 61(2), 41 50. https://doi.org/10.17423/afx.2019.61.2.04
Slabejová, G., Šmidriaková, M., Svocák, J., 2020. Interlayer with microcapsules and its influence on the surface finish quality ofwood. Acta Facultatis Xylologiae Zvolenres Publica Slovaca 62(2), 61 74. https://doi.org/10.17423/afx.2020.62.2.06
STN EN 927–3, 2013. Paints and varnishes – Coating materials and coating systems for exterior wood - Part 3: Natural weathering test. Slovak Office of Standards, Metrology and Testing, Bratislava, Slovakia.
STNENISO4624,2023.Paintsandvarnishes.Pull-offtestforadhesion.SlovakOfficeofStandards, Metrology and Testing, Bratislava, Slovakia.
STNENISO2409,2020.Paintsandvarnishes.Cross-cuttest.SlovakOfficeofStandards,Metrology and Testing, Bratislava, Slovakia.
STN EN ISO 6272–2, 2011. Paints and varnishes – Rapid-deformation (Impact resistance) testsPart 2: Falling-weight test, small-area indenter. Slovak Office of Standards, Metrology and Testing, Bratislava, Slovakia.
Suryanarayana, C., Rao, K.C., Kumar, D., 2008. Preparation and characterization of microcapsules containing linseed oil and its use in self-healing coatings. Progress in organic coatings 63(1), 72 78. https://doi.org/10.1016/j.porgcoat.2008.04.008
Yan, X., Peng, W., 2020 Preparation of Microcapsules of Urea Formaldehyde Resin Coated Waterborne Coatings and Their Effect on Properties of Wood Crackle Coating. Coatings 10, 764. https://doi.org/10.3390/coatings10080764
Yan, X., Zhao, W., Wang, L., Qian, X. 2021. Effect of Microcapsule Concentration with Different Core-Shell Ratios on Waterborne Topcoat Film Properties for Tilia europaea Coatings 11, 1013. https://doi.org/10.3390/coatings11091013
Yan, X., Li, W., Han, Y., Yin, T., 2022. Preparation of Melamine/Rice Husk Powder Coated Shellac MicrocapsulesandEffectofDifferentRiceHuskPowderContentinWallMaterialonProperties of Wood Waterborne Primer. Polymers 14, 72. https://doi.org/10.3390/polym14010072
Van den Bulcke, J., Van Acker, J., Stevens, M , 2008. Experimental and theoretical behavior of exterior wood coatings subjected to artificial weathering. Journal of Coatings Technology and Research 5, 221-231. https://doi.org/10.1007/s11998-007-9074-4
Vidholdová, Z.,Slabejová,G., Kaloč,J., 2017. Influence of woodpre-weathering on selected surface properties of the system wood–coating film. Acta Facultatis Xylologiae Zvolen res Publica Slovaca 59(2), 67 77.
Viitanen, H., Ritschkoff, A.C., 2011. Coating and surface treatment of wood. In Fundamentals of mold growth in indoor environments and strategies for healthy living, Wageningen Academic. 463 488. https://doi.org/10.3920/9789086867226_018
Wang, L., Han, Y., Yan, X., 2022. Effects of adding methods of fluorane microcapsules and shellac resin microcapsules on the preparation and properties of bifunctional waterborne coatings for basswood. Polymers 14(18), 3919. https://doi.org/10.3390/polym14183919
Williams, R.S., 2010. Finishing of Wood. In: Wood Handbook-Wood as an Engineering Material. General Technical Report FPL-GTR-190, US Department of Agriculture, Forest Service, Forest Products Laboratory, Madison.
White, S.R., Sottos, N.R., Geubelle, P.H., Moore, J.S., Kessler, M.R., Sriram, S.R., Brown, E.N, Viswanathan, S., 2001. Autonomic healing of polymer composites. Nature 409, 794–797. https://doi.org/10.1038/35057232
Wu, Q., Li, W., Yan, X., 2023. Effect of Microcapsules on Mechanical, Optical, Self-Healing and Electromagnetic Wave Absorption in Waterborne Wood Paint Coatings. Coatings 13, 1478. https://doi.org/10.3390/coatings13091478
Xia, L., Han, Y., Yin, T.,Zhu, Y., Yan, X.,Li,J., 2024.EffectsofMixedMicrocapsulesinDifferent Proportions on Aging Resistance and Self-Healing Properties of Waterborne Coatings for Tilia europaea L. Coatings 14, 1042. https://doi.org/10.3390/coatings14081042
Xia, Y., Yan, X., Peng, W., 2022. Preparation of Cellulose Modified Wall Material Microcapsules and Its Effect on the Properties of Wood Paint Coating. Polymers 14, 3534. https://doi.org/10.3390/polym14173534
Zhao,J.,Zhang,W.,Liao,L.,Wang,S.,Li,W.,2012.Self-healingcoatingscontainingmicrocapsule. Applied Surface Science 258(6), 1915 1918. https://doi.org/10.1016/j.apsusc.2011.06.154
ACKNOWLEDGMENT
This work was supported by the Scientific Grant Agency of the Ministry of Education SR Grant No. VEGA 1/0656/23.
AUTHORS’ ADDRESSES
Ing. Zuzana Vidholdová, PhD.
Technical University in Zvolen Faculty of Wood Sciences and Technology, Department of Wood Technology
T.G. Masaryka 24, 960 01 Zvolen zuzana.vidholdova@tuzvo.sk
Ing. Gabriela Slabejová, PhD.
Technical University in Zvolen Faculty of Wood Sciences and Technology, Department of Furniture and Wood Products
T.G. Masaryka 24, 960 01 Zvolen slabejova@tuzvo.sk
prof. Ing. Jozef Kúdela, CSc.
Ing. Ján Svocák, PhD.
Technical University in Zvolen Faculty of Wood Sciences and Technology, Depatment of Wood Science
T.G. Masaryka 24, 960 01 Zvolen kudela@tuzvo.sk jsvocak@yahoo.com
ACTA FACULTATIS XYLOLOGIAE ZVOLEN, 66(2): 51 59, 2024
Zvolen, Technická univerzita vo Zvolene
DOI: 10.17423/afx.2024.66.2.05
OPTIMIZED LIGNIN RECOVERY FROM BLACK LIQUOR FOR ENHANCED MECHANICAL PROPERTIES OF ACRYLONITRILE BUTADIENE RUBBER COMPOSITES
Richard Nadányi – Michaela Džuganová – Aleš Ház
ABSTRACT
Due to climate change, the transition from petroleum-based materials to renewable sources is essential. Lignin, a complex aromatic polymer derived from lignocellulosic biomass, offers a promising alternative. This study is focused on optimizing lignin recovery from black liquor based on the LignoBoost™ process and evaluating its application in acrylonitrile butadiene rubber (NBR). The optimized conditions (80 °C, pH 2.0) yielded lignin with significantly lower phenolic hydroxyl group concentrations compared to lignins prepared according to the design of the experiment (DoE). Surface property analysis revealed a high surface free energy of 55.3 mJ/m², indicating potential for interaction with various substances. A DoE approach to investigate the influence of precipitation conditions on lignin properties is employed in the study. NIR spectroscopy and surface property measurements were used for lignin characterization. The results demonstrated that hydroxyl group concentrations, influenced by black liquor freshness and filtration temperature is significantly affected by the preparation method. Notably, pilot lignin (PL) application in NBR composites resulted in a more than twofold increase in tensile strength and elongation at break compared to NBR without additives or with commercial lignin. These findings suggest that lignin recovered through optimized processes can enhance the mechanical properties of NBR, offering a sustainable alternative to traditional additives. This research provides valuable insights for further exploration of lignin’s potential in industrial applications, particularly in the context of lignin recovery and utilization in pulp mills.
Keywords: lignin recovery; acrylonitrile butadiene rubber (NBR); design of experiment (DoE); kraft lignin; renewable resources.
INTRODUCTION
Theuseofrenewablesourcestoreplacepetroleum-basedmaterialsiscrucial,primarily due to climate change. Among the potential renewable resources, lignocellulosic biomass stands out for its potential to replace fossil-based sources. Lignin, a complex aromatic polymer abundantly found in plant cell walls, is particularly noteworthy. In the pulp and paper industry, lignin is mainly obtained during the pulping process and is often used as a low-value fuel burned in recovery boilers to produce heat and power.
Kraft Process
The Kraft process is a leading chemical pulping method that converts wood chips into nearly pure cellulose fibers using a highly alkaline solution of sodium hydroxide (NaOH) and sodium sulfide (Na2S) (SJÖSTRÖM, 1993; Worku et al., 2023). This process, known for its high selectivity in delignification, operates in very alkaline conditions (pH above 12) at temperatures of 160–180 °C for 1–3 hours (Biermann, 1996; Sjöström, 1993). The main active reagents are hydroxide and hydrosulfide anions, with hydrosulfide ions accelerating delignification (Sixta et al., 2008).
Kraft pulping is versatile, processing both hardwood and softwood, and is less dependent on debarking compared to the sulfite process (Sjöström, 1993). However, it emits malodorous chemicals like methyl mercaptan and hydrogen sulfide, posing environmental and safety hazards (Hansen, 1962; Taylor et al., 1961). Modern mills use recovery boilers and scrubbers to mitigate these impacts. Tab. 1 summarizes the most frequent advantages and disadvantages of Kraft pulping.
Tab. 1 Advantages and Disadvantages of the Kraft Pulping Process (Patt et al., 2000).
Advantages
Universal raw material basis
High insensitivity to bark
Fast pulping process, short cover-tocover times
High yields for hardwoods
Good pulp strength
Disadvantages
Small process flexibility
Low yields for softwood
High residual lignin content and poor bleachability of the pulps
High bleaching chemicals demand
Indispensable use of chlorine-containing bleaching agents; high water pollution
Low extract content of the pulps Offensive smell due to volatile reduced sulfur compounds
Considering that lignin content in hardwood and softwood ranges from 25 % to 30 %, the annual lignin supply is estimated to be between 67 and 81 million tons. Alternatively, based on projections by Keyoumu et al., (2004), lignin production from chemical pulping alone in 2025 is expected to be between 44 and 66 million tons (Nadányi et al., 2022).
LignoBoost™ process
Lignin recovery is essential in the pulp and paper industry, transforming a significant waste product into a valuable resource. The LignoBoost™ process, developed by Inventia AB and Chalmers University, marks a significant advancement in producing high-purity lignin from black liquor (Tomani, 2010). Before this innovation, lignin typically contained high levels of impurities and ash. The LignoBoost™ process addresses these issues by yielding high-purity lignin with low ash content. The process includes several key steps: lignin precipitation, filtration, re-slurrying of the lignin cake, a second filtration, and final washing (Zhu and Theliander, 2015). LignoBoost™ was the first to achieve high yields and exceptional quality in lignin precipitation and purification.
In the LignoBoost™ process, black liquor from the kraft process is treated with CO2 to lower the pH, causing lignin to precipitate. Key factors include temperature (60–80 °C), final pH (9–10), and CO2 concentration. After initial precipitation and filtration, the lignin filtercakeis resuspended andacidifiedwith sulfuricacid to pH2–4,thenfiltered and washed to remove impurities. This process reduces ash content, making the lignin suitable for highvalue applications (Öhman et al., 2007; Tomani, 2010; Ziesig et al., 2014).
Lignin-rubber applications
Natural rubber (NR) is widely used and often reinforced with carbon black for mechanical strength. However, due to sustainability concerns, lignin is being explored as an
alternative. Lignin is sustainable, produced on a large scale, and has high structural rigidity, making it suitable for industrial applications (Jiang et al., 2020; Mohamad Aini et al., 2020).
Lignin can enhance the mechanical properties of rubber, such as tensile strength and heat resistance, and acts as anantioxidant.Blendinglignin with syntheticpolymersimproves mechanical and thermal properties and biodegradability. However, lignin’s polar functionalities can affect its compatibility with NR (Gregorová et al., 2006; Intapun et al., 2021; Makhalema et al., 2021; Mohamad Aini et al., 2020) Lignin is particularly promising for use with acrylonitrile butadiene rubber (NBR) due to its opposite polarity to NR. It can replace half the carbon black in NBR, enhancing strength, modulus, thermal stability, and oil resistance (Wang et al., 2018).
This study aims to optimize lignin recovery from black liquor and explore its use in NBR to replace carbon black, comparing it with commercially available lignin.
MATERIALS AND METHODS
Materials
Alkali lignin used to produce acid washed lignins was provided by Mondi SCP, Ružomberok Sulfuric acid (96 %) from Centralchem (Bratislava, Slovakia) and carbon dioxide from Messer Tatragas (Bratislava, Slovakia). The commercial softwood kraft lignin (UPM BioPiva™ 100) is provided by UPM Biochemicals (Helsinki, Finland).
Thematerials used to preparelignin-NBR compositesareas follows: NBR (SKN3345) (Sibur International, Russia), sulfur (Siarkopol Tarnobrzeg, Poland), zinc oxide (Slovzink a.s., Košeca, Slovakia), Stearic Acid III (Setuza, Ústí nad Labem, Czech Republic), Ncyclohexyl-2-benzothiazole sulfenamide CBS (SULFENAX CBS/MG) (Duslo a.s., Šaľa, Slovakia).
Methods
Designofexperiment(DoE)wasusedtostudytheinfluenceofprecipitationconditions on lignin properties. Specifically, a two-factor, five-level DoE was applied to prepare a total of 13 samples of acid-washed lignins. The specific conditions are listed in Tab. 2.
Lignin recovery involved resuspending 100 g of alkali lignin in water (8:1 ratio), heating, and acidifying with 50 % sulfuric acid to the desired pH and temperature. The slurry was aged for 30 minutes, filtered, washed with hot water, and air-dried. Optimization used the Equation (1) to find optimal conditions (80 °C, pH 2.0).
Pilot lignin production at Mondi SCP’s pulp mill involved processing black liquor, cooling, acidifying, aging, and filtering to produce alkali lignin cakes. These were further processed to obtain acid lignin, which was diluted, filtered, and air-dried.
DoE lignins and Pilot Lignin (PL) were analyzed using Near-Infrared (NIR) spectroscopy, Thermogravimetric analysis (TGA), and surface property measurements. NIR spectra were obtained using a Multi-Purpose Analyzer FT-NIR, and functional groups were
analyzed with a Partial least squares regression (PLS) calibration model by Sumerskii et al. (2024). Surface properties were determined using contact angles with water and αbromonaphthalene, calculated with See System software based on the Owens-Wendt model.
RESULTS AND DISCUSSION
NIR analysis provided a detailed evaluation of lignin characteristics, including concentrations of aliphatic and phenolic hydroxyl groups, methoxyl groups and syringyl and guaiacyl (S and G) units concentrations. This chemical characterization helps identify how pH and temperature variations during precipitation affect lignin. NIR analysis offers a comprehensive understanding of lignin properties, guiding the adjustment of precipitation conditions to tailor lignin for specific uses. The measured characteristics are shown in Tab. 3
3 NIR Structural Characterization of Lignins Prepared According to the DoE.
Sample
The structural characterization of PL, UPM BioPiva 100™, and DoE lignins reveals notable differences in their functional group concentrations and monolignol content. These variations primarily reflect the impact of preparation methods, such as temperature, pH, and other processing conditions like the freshness of black liquor and filtration temperature. The relationship between the structural characteristics of lignin and process parameters (temperature and pH) is illustrated in for phenolic hydroxyl groups (Ph-OH) and in for aliphatic hydroxyl groups (R-OH). For Ph-OH, the dependence exhibits a local minimum at approximately 3.46 ± 0.23 mmol/g and a maximum at around 4.13 ± 0.23 mmol/g. These values were calculated based on a thorough evaluation of the measured results. In contrast, R-OHdemonstratesadifferenttrendcomparedtoPh-OH.Theconcentrationdoesnotexhibit a distinct local minimum, as the curve does not change its directional pattern. However, the minimum and maximum concentrations can still be determined, with values of 1.32 ± 0.11 mmol/g and 1.55 ± 0.11 mmol/g, respectively.
Fig. 1 Dependence of phenolic hydroxyl groups concentration from process parameters calculated using DoE.
Fig. 2. Dependence of aliphatic hydroxyl groups concentration from process parameters calculated using DoE.
When comparing PL to DoE lignins, the most striking difference lies in the concentration of phenolic hydroxyl groups. PL has a significantly lower Ph-OH content of 0.45 mmol/g, while DoE lignins range from 3.39 to 3.96 mmol/g. This suggests that the conditions under which PL is prepared result in a much lower availability of phenolic hydroxyl groups, which could affect its reactivity and application potential. Similarly, the aliphatic hydroxyl group concentration in PL (0.71 mmol/g) is also lower than in DoE lignins, which range from 1.26 to 1.54 mmol/g. These differences indicate that the preparation of PL, particularly the combination of temperature and pH, leads to a reduced presence of hydroxyl groups, which are crucial for lignin's chemical interactions. In terms of methoxyl (OCH3) groups, PL also shows a lower concentration (4.65 mmol/g) compared to DoE lignins (5.17 to 6.05 mmol/g). The higher methoxyl content in DoE lignins is likely due to differences in the syringyl (S) and guaiacyl (G) unit ratios, which play a critical role in determining lignin’s reactivity and structural properties. Interestingly, while the syringyl content in PL (2.48 mmol/g) is comparable to that in DoE lignins (2.46 to 2.80 mmol/g), PL exhibits a slightly higher concentration of guaiacyl units (1.59 mmol/g) compared to DoE
lignins (1.10 to 1.28 mmol/g). This suggests that PL has a somewhat higher G-unit content, which could impact its overall chemical behavior and reactivity.
When comparing PL to UPM BioPiva 100™, further differences emerge (refer to Tab. 4). The Ph-OH concentration in UPM (2.9 mmol/g) is considerably higher than in PL, again highlighting the reduced reactivity of PL in this regard. UPM also shows a higher aliphatic hydroxyl group concentration (1.02 mmol/g) than PL (0.71 mmol/g), though the difference here is less pronounced than that between PL and DoE lignins. On the other hand, PL has a significantly higher methoxyl group concentration (4.65 mmol/g) compared to UPM (2.4 mmol/g), which can be attributed to the higher syringyl content in PL. This distinction in methoxyl content suggests different applications for each type of lignin, with PL potentially being more suitable for uses that require higher methoxyl group functionality.
In terms of monolignol content, PL contains more syringyl units (2.48 mmol/g) than UPM (1.31mmol/g),whileUPM has ahigherguaiacyl unit content(2.48mmol/g)compared to PL (1.59 mmol/g). This reversal in the S/G ratio between the two lignins could have significant implications for their reactivity and structural properties, with the guaiacyl-rich UPM likely being moresuitedto applications that benefit fromhigher G-unit concentrations, such as adhesives or resins.
Surface
CA = contact angle; BN = a-bromonaphtalene; SFE = surface free energy
UPM and PLligninsweretestedin NBR applications, revealingsignificant differences in mechanical properties (see Fig. 3). As the concentration of the lignin increases, PL consistently outperforms UPM. At 10 phr, UPM slightly improves elongation at break to 448 %, while PL significantly enhances it to 711 %. This trend continues, with PL reaching 946 % at 30 phr and over 1000 % at 40–50 phr, compared to UPM’s 670 % and 787 %, respectively. We hypothesize that intense mixing allows lignin molecules to exfoliate from the hydrogen-bonded network into smaller domains. The renewed surface provides additional sites for interaction with nitrile rubber, leading to an increase in the number of interactions. This greater number of interactions would ensure excellent toughness at large deformations (Tran et al., 2016), as evident from the results, where PL again outperforms UPM at every concentration. At 10 phr, UPM drops to 3.8 MPa, while PL increases to 7.0 MPa. This gap widens further at 20–50 phr, where PL reaches a tensile strength of 10.5 MPa, nearly double that of UPM in some cases. Even at 60 phr, PL remains superior in both characteristics, though both lignins experience a decline.
In conclusion, PL lignin enhances both the elongation and tensile strength of NBR more effectively than UPM, especially at higher concentrations, making it a superior choice for applications demanding better flexibility and mechanical strength.
Fig. 3 Mechanical properties of NBR produced using different kraft lignins.
CONCLUSION
In this study, the influence of precipitation conditions on lignin properties and their application in NBR was explored,focusing onthestructural differences betweenpilot lignin, UPM BioPiva 100™, and DoE lignins. The results showed that PL lignin consistently outperformed UPM in both elongation at break and tensile strength, especially at higher concentrations. PL's lower phenolic hydroxyl content and higher methoxyl concentration appear to enhance its performance in NBR, making it more suitable for applications requiring improved flexibility and mechanical strength. Overall, this research highlights the importance of lignin’s preparation conditions in determining its suitability for industrial applications, such as rubber reinforcement, and demonstrates PL's superior potential over UPM for such purposes.
REFERENCES
Biermann, J. C.,1996. Pulping Fundamentals. Handbook of Pulping and Papermaking (Second Edition) (pp. 55–100). Academic Press. https://doi.org/10.1016/B978-012097362-0/50007-8 Gregorová, A., Košíková, B., Moravčík, R., 2006. Stabilization effect of lignin in natural rubber. Polymer Degradation and Stability, 91(2), 229–233. https://doi.org/10.1016/J.POLYMDEGRADSTAB.2005.05.009
Hansen, G. A., 1962. Odor and Fallout Control in Kraft Pulp Mill. Journal of the Air Pollution Control Association, 12(9), 409–436. https://doi.org/10.1080/00022470.1962.10468107
Intapun, J., Rungruang, T., Suchat, S., Cherdchim, B., Hiziroglu, S., 2021. The Characteristics of Natural Rubber Composites with Klason Lignin as a Green Reinforcing Filler: Thermal Stability, Mechanical and Dynamical Properties. Polymers Vol. 13, Page 1109, 13(7), 1109. https://doi.org/10.3390/POLYM13071109
Jiang,C.,Bo,J.,Xiao,X.,Zhang,S.,Wang,Z.,Yan,G.,Wu,Y.,Wong,C.,He,H.,2020.Converting wasteligninintonano-biocharasarenewablesubstituteofcarbonblackforreinforcingstyrenebutadiene rubber. Waste Management, 102, 732–742. https://doi.org/10.1016/j.wasman.2019.11.019
Keyoumu, A., Sjödahl, R., Henriksson, G., Ek, M., Gellerstedt, G., Lindström, M. E., 2004. Continuous nano- and ultra-filtration of kraft pulping black liquor with ceramic filters: A method for lowering the load on the recovery boiler while generating valuable side-products. Industrial Crops and Products, 20(2), 143–150.
Makhalema, M., Hlangothi, P., Motloung, S. V., Koao, L. F., Motaung, T. E., 2021. Influence of kraft lignin on the properties of rubber composites Wood Research, 66(2), 285–296. https://doi.org/10.37763/wr.1336-4561/66.2.285296
Mohamad Aini, N. A., Othman, N., Hussin, M. H., Sahakaro, K., Hayeemasae, N., 2020. Lignin as Alternative Reinforcing Filler in the Rubber Industry: A Review. Frontiers in Materials, 6, 484930. https://doi.org/10.3389/FMATS.2019.00329/BIBTEX
Nadányi, R., Ház, A., Lisý, A., Jablonský, M., Šurina, I., Majová, V., Baco, A., 2022. Lignin Modifications, Applications, and Possible Market Prices. Energies, 15(18), 6520. https://www.mdpi.com/1996-1073/15/18/6520/htm
Öhman, F., Wallmo, H., Theliander, H., 2007. Precipitation and filtration of lignin from black liquor of different origin. Nordic Pulp and Paper Research Journal, 22(2), 188–193. https://doi.org/10.3183/npprj-2007-22-02-p188-193
Patt, R., Kordsachia, O., Süttinger, R., Ohtani, Y., Hoesch, J. F., Ehrler, P., Eichinger, R., Holik, H., Hamm, U., Rohmann, M. E.,Mummenhoff, P.,Petermann, E.,Miller, R. F.,Frank, D., Wilken, R., Baumgarten, H. L., Rentrop, G.-H., 2000. Paper and Pulp. In Ullmann’s Encyclopedia of Industrial Chemistry. Wiley-VCH Verlag GmbH & Co. KGaA. https://doi.org/10.1002/14356007.a18_545
Sixta,H.,Potthast,A.,Krotschek,A.W.,2008.ChemicalPulpingProcesses.HandbookofPulp(Vol. 1, pp. 109–509). John Wiley and Sons. https://doi.org/10.1002/9783527619887
Sjöström, E., 1993. Wood Pulping. Wood Chemistry (pp. 114–164). Elsevier. https://doi.org/10.1016/b978-0-08-092589-9.50011-5
Sumerskii, I., Böhmdorfer, S., Tsetsgee, O., Sulaeva, I., Khaliliyan, H., Musl, O., Dorninger, K., Tischer, A., Potthast, K., Rosenau, T., Brereton, R., Potthast, A., 2024. Tapping the Full Potential of Infrared Spectroscopy for the Analysis of Technical Lignins. ChemSusChem, e202301840. https://doi.org/10.1002/CSSC.202301840
Taylor, J. R., Hasegawa, A., Chambers, L. A., 1961. Control of air pollution by site selection and zoning. Monograph Series. World Health Organization, 46, 293–306.
Tomani, P., 2010. The lignoboost process. Cellulose chemistry and technology Cellulose Chem. Technol, 44(3), 53–58.
Tran, C. D., Chen, J., Keum, J. K., Naskar, A. K., 2016. A New Class of Renewable Thermoplastics with Extraordinary Performance from Nanostructured Lignin-Elastomers. Advanced Functional Materials, 26(16), 2677–2685. https://doi.org/10.1002/ADFM.201504990
Wang, H., Liu, W., Huang, J., Yang, D., Qiu, X., 2018. Bioinspired Engineering towards Tailoring Advanced Lignin/Rubber Elastomers. Polymers Vol. 10, Page 1033, 10(9), 1033. https://doi.org/10.3390/POLYM10091033
Worku, L. A., Bachheti, A., Bachheti, R. K., Rodrigues Reis, C. E., Chandel, A. K., 2023. Agricultural Residues as Raw Materials for Pulp and Paper Production: Overview and Applications on Membrane Fabrication. Membranes Vol. 13, Page 228, 13(2), 228. https://doi.org/10.3390/MEMBRANES13020228
Zhu, W., Theliander, H., 2015. Precipitation of lignin from softwood black liquor: An investigation of the equilibrium and molecular properties of lignin. BioResources, 9(4), 1696–1714. https://doi.org/10.15376/biores.9.4.6166-6192
Ziesig, R., Tomani, P., Theliander, H., 2014. Production of a pure lignin product part 2: separation of lignin from membrane filtration permeates of black liquor Cellulose Chemistry And Technology Cellulose Chem. Technol (Vol. 48, Issue 9).
ACKNOWLEDGEMENT
The FFG-Austrian Research Promotion Agency is acknowledged for their funding of the Projects KraftPell (FFG-Nr. 884529) co-financed by the Slovak Research and Development Agency under
the contracts APVV-22-0388, APVV-22-0034, APVV-22-0011, and VEGA 1/0743/24. Furthermore, this publication was supported by the project LigBioMat: Modifications of lignin for the preparation of new biomaterials (Grant STU Bratislava for young researchers).
AUTHORS’ ADDRESSES
Ing. Richard Nadányi, PhD.
Ing. Michaela Džuganová doc. Ing. Aleš Ház, PhD. Slovak University of Technology in Bratislava, Faculty of Chemical and Food Technology, Institute of Natural and Synthetic Polymers, Department of Wood, Pulp and Paper; Radlinského 9, 812 37 Bratislava. richard.nadanyi@stuba.sk michaela.dzuganova@stuba.sk ales.haz@stuba.sk
ACTA FACULTATIS XYLOLOGIAE ZVOLEN, 66(2): 61 74, 2024
Zvolen, Technická univerzita vo Zvolene
DOI: 10.17423/afx.2024.66.2.06
COMPARISON OF THE ROUGHNESS OF THE CNC MILLED SURFACE OF SELECTED WOOD SPECIES
Lukáš Adamčík – Richard Kminiak – Adrián Banski
ABSTRACT
This paper aims to quantify the surface roughness after the CNC milling of selected wood species. Optimization of the essential milling parameters, rotational speed, and feed speed is desirable for reducing surface roughness. Both technological parameters significantly contribute to the amount of feed per tooth, affecting surface roughness. In the experiment, three economically important wood species were compared – beech, oak, and spruce wood. In addition, the zones of sapwood, mature wood, and false heartwood were evaluated in beech wood. The surface roughness after milling was assessed using the Keyence VHX7000 digital microscope. The main result of the experiment is represented by the determination of the combination of the parameters mentioned above that produces the lowest roughness. In addition, roughness measurements were supplemented by microscopic analysis to explain roughness changes occurring on the surface.
Keywords: surface roughness; CNC milling; Keyence VHX microscope; hardwood; softwood
INTRODUCTION
CNC wood milling is currently a discussed issue in wood science (Atanasov et al., 2023; Lungu et al.,2023). Increasing the availability of this machining technology also results in an increase in the number of CNC machines in individual woodworking companies. An indisputable advantage of CNC machine tools is the ability to vary their technological parameters and tools. It makes it possible to use this machine to process wood and wood materials precisely. Therefore, their use raises several questions that need to be addressed in research. The high number of technological parameters and the possibility of changing them brings the need to deal with their optimization. Optimization can be carried out regarding energy consumption in CNC woodworking (Bal et al., 2022), but especially regarding the quality of the created, most often milled surface (Aras and Sofuoğlu 2024; Demir et al., 2022). According to research by (Hanincová et al., 2024), optimizing the right tool selection and an appropriate set of machining parameters reduces cutting forces. It helps to minimise tool wear, reduces energy consumption, and improves surface quality. Properties that can be optimized and have a significant impact on surface quality include feed speed (Bendikiene and Keturakis 2016; Smajic and Jovanovic 2021), cutting speed (Sedlecký et al., 2018), rotational speed (Çakiroğlu et al., 2019) and feed per tooth (Loc and Hung 2021). However, parameters that cannot be optimized but are crucial in woodworking processes also contribute to the creation of the final quality. These include, for example,
wear on the cutting edge (Djurković et al., 2019; Koleda et al., 2019) or the properties of wood,such as hardness (Bembenek et al., 2021; Laina et al., 2017)orwood moisturecontent (Benkreif et al., 2021; Fu et al., 2021; Rezaei et al., 2022).Accordingto (SingerandÖzşahin 2022), the feed speed and rotational speed have the most significant impact on the quality of the created surface (evaluated by the roughness and waviness). Research shows that with an increase in feed speed, there is also an increase in surface roughness (Gochev 2018; Yang et al., 2023).Increasingfeedspeeddirectlycorrelateswithanincreaseinfeedpertooth,leading to more severe conditions beneath the cutting edge and a higher likelihood of crack formation. This, in turn, significantly impacts the surface roughness parameters Ra and Rz (Pinkowski et al., 2018). The value of rotational speed, a crucial milling parameter, significantly influences surface quality. As rotational speed increases, feed per tooth decreases, resulting in smoother surfaces (Pelit et al.,2021). Therefore, it is essential to look for a way to determine the optimal value of important technological parameters (Cakmak et al.,2023; Jiang et al., 2022; Wei et al., 2021). Correct and quick determination of the most optimal parameters is crucial, especially for those woodworking companies that produce different wood species. Regarding solid wood processing, the most used materials are spruce, beech, and oak solid panels or boards, especially for beech wood. Differences in milled quality between false heartwood, mature wood, or sapwood as its internal parts are demonstrated. The priority of research in the field of quality management of CNC milling should, therefore, be the effort to determine the combinations of those technological parameters that produce satisfactory quality.
The term "quality of the created surface" is the accepted size of the actual surface deviations (irregularities) from the ideally smooth surface. However, from a kinematic point of view as well as from the point of view of the wood structure, the surface smoothness cannot be achieved. In the practice of machining, therefore, there is an effort to achieve such a degree of surface unevenness that is acceptable from the point of view of related technologies – gluing or application of paints. Surface irregularities, defined as the waviness and roughness on the actual surface, must be understood in a broader context. The roughness of the wood surface, in the form of microscopic hills (peaks) of the surface (wood fuzziness, unseparated protruding fibres) and the form of surface dales (torn fibres or cut deep anatomical pores) is one of the ideal properties that can be used to optimize the CNC milling process. The purpose of the optimal setting of the technological parameters of the CNC machining center is to reduce the presence of torn fibres, surface fuzziness or marks of the cutter's passage. These machining errors are time-consuming to eliminate in the subsequent sanding process. Significant damage to the surface can also put the workpiece out of further production (economic loss). Therefore, the priority of research on the roughness of wood after CNC milling is not to determine the microscopic height of irregularities but to try to achieve the most optimal surface condition for subsequent sanding.
The aim of this paper is to quantify the roughness of the milled surface of selected wood species under changing technological parameters – feed speed and rotational speed of a CNC 5-axis machining center. The contribution of the presented paper is the research of the two most important technological parameters for the development of surface roughness acting simultaneously. The combination of technological parameters that creates the lowest roughness in the milling process will be determined from the measured data.
MATERIALS AND METHODS
Sample preparation before CNC milling
A total of 40 samples from quality class I boards with semi-radial (T/R) surface and with dimensions of 20 mm × 70 mm × 400 mm (thickness × width × length) were prepared from spruce wood (Picea abies L.), oak wood (Quercus petraea (Matt.) Liebl.) and beech wood (Fagus sylvatica L.). The dimensions of the samples were determined as optimal dimensions regarding the design of the CNC 5-axis machining center and the design of the mechanical clamps. These wood species were chosen as primary representatives of coniferous, ringporous, and diffuse-porous wood species. Individual groups of wood species have their anatomical specifics (eg: coniferous wood species have tracheids, ring-porous wood species have earlywood vessels…) which significantly influence the surface morphology. Samples from beech wood were separately manipulated from a part of false heartwood, mature wood, and sapwood. The false heartwood was selected on the boards by visual assessment since the false heartwood has a significantly darker color (Dzurenda and Dudiak 2023). The sapwood part was manipulated 1 cm from the edge of the board. Part of the mature wood was visually assessed on the boards in a wet state when color differences were present between the mature wood and the sapwood. The moisture content of the samples ranged from 8 to 10 %, corresponding to the interior conditions. After sawing from the boards, all samples were processed on a planing and thicknessing milling machine to a nominal thickness.
CNC Sample Milling
A 5-axis CNC machining center SCM Tech Z5 (SCM Group S.p.A., Rimini, Italy) was then used to mill the samples. Two mechanical clamps were used to clamp each sample The samples were milled using a Klein T143 spiral milling cutter (Sistemi S.r.l., Pesaro, Italy) with a diameter of 20 mm, and 3 cutting edges were used to mill the samples. The tool was clamped in a GM 300 HSK 63F hydro clamp (Gühring KG, Albstadt, Germany) with a high concentricity. Each sample was milled with two tool passes, with one pass of the cutter removing a layer ae = 1 mm. The reason for the low material removal is to simulate the conditions of the finishing milling operation, which is defined by the higher quality of the created surface. Milling was carried out under the following conditions: feed speed of 10 m·min-1 and 14 m·min-1 and rotational speed of 12,000 rpm and 18,000 rpm. Higher rotational speed and feed speed values have been selected as the optimum set by the manufacturer. The lowest values were chosen as the technological minimum.
Surface Roughness Measurement
Surface roughness was assessed using a Keyence VHX-7000 digital microscope. The milled edge of the samples was scanned by five evenly distributed scans. The reason for scanning multiple locations on the milled edge is to quantify the surface roughness along the milling cutter's trajectory. All scans were taken at 100× zoom using the VH-Z100R lens. The measurement of surface roughness parameters was carried out in accordance with ISO 25178-2 standards (EN ISO 25178-2:2022). The following conditions were selected for filtration: S-filter = 25 μm, L-filter = 2.5 mm. The Keyence VHX-7000 digital microscope calculates 1 parameter value from 1 evaluated area. In the case of amplitude parameters, such as Sz, this means – the highest and lowest point on the evaluated area (similar principle as in the measurement of Rz). Thus, the parameter can be significantly distorted due to, for example, protruding (raised) fibres. To prevent distortion of parameter values, 5 squareshaped evaluation surfaces with a size of 2.5 × 2.5 mm were digitally put within one scan
(the length of the page is identical to the size of the L-filter according to the recommendations of the technical standard). The microscope then calculated 1 parameter value as the arithmetic mean of 5 data (from 5 square-shaped evaluation surfaces), similar to the line roughness parameters (Rz, Rp, Rv...) measurements. The methodology of adding a larger number of evaluated areas thus brings more reliable results than the methodology for evaluating the total surface based on only 1 evaluated area. The following parameters of wood roughness were used according to (EN ISO 25178-2: 2022): Sa (arithmetic mean height), Sz (maximum height), Sp (maximum peak height), Sv (maximum pit depth), Ssk (skewness). Sa is the mean of the absolute value, the difference in height (ordinate values) of each point compared to the arithmetical mean of the surface (S-L surface in this case) The advantage of this parameter is its relative stability. The disadvantage is that it does not define the heights of individual irregularities, but only the average deviation from the surface. The second disadvantage is that several different uneven surfaces can have the same Sa value. Sz is defined as the sum of the largest peak height value and the largest pit depth value within the defined area. In general, Sz is the sum of Sp and Sv. All these height (amplitude) parameters are sensitive to local elevations (peaks) or depressions (pits) of the profile. Their advantage is that they provide an idea of the heights of individual irregularities on the defined area. Ssk parameter of skewness can also be very essential. The value of the parameter Ssk defines whether the surface is dominated by hills or dales of the profile. The disadvantage is that this parameter is very sensitive during measurement.
RESULTS AND DISCUSSION
Influence of feed speed and rotational speed as independent factors on surface roughness parameters
The basic set of 400 measurements was statistically evaluated by the statistical software STATISTICA 14 (TIBCO Software Inc., Palo Alto, California). Before evaluation, the outliers were removed from the measured set, and the measurement was then repeated. Two-way ANOVA assessed the impact of various factors on surface roughness. To ensure the validity of the ANOVA results, several assumptions must be met:
1. Normality: The distribution of the random variable values (areal surface texture parameters) within each group should be approximately normal. The Shapiro-Wilk test confirmed that this assumption holds for all groups.
2. Equality of variance: The variances of the random variable within each group should be equal. Levene's test indicated that this assumption may not be strictly met, potentially due to the inherent variability of wood structure.
3. Independence of measurements: The observations within each group should be independent ofoneanother.This assumption was ensuredbytheexperimentaldesign and evaluated by a logical assessment.
The ANOVA method is a robust technique. This means that assumptions can be violated to some extent, but the method can still be applied. The results of the two-factor ANOVA show that both investigated factors (technological parameters) – feed speed and rotational speed have a statistically significant influence, separately and in mutual interaction (p = 0.000). The effect of another condition is the impact of one factor. A three-factor ANOVA was also used to optimise the milling process, where the investigated factors – feed speed, rotational
speed, and wood species- have a statistically significant influence (p = 0.000). However, the single-dimensional results for each dependent variable showed that statistically significant effects were not observed for some of the investigated roughness parameters (Tab. 1).
Tab. 1 Single-dimensional results of p-values for individual areal surface texture parameters according to selected factors. Factor
Wood Species*Feed Speed*Rotational speed
Note: Sa (arithmetic mean height); Sz (maximum height); Ssk (skewness); Sp (maximum peak height); Sv (maximum pit depth).
In Tab. 2,it is possibletoseetheaveragevaluesofroughness parametersforindividual wood species, as well as the influence of feed speed and rotational speed on their development. After determining the values in Tab. 2, the individual surfaces were then scanned with a digital microscope (Fig. 1).
Tab. 2 Average values of individual areal surface texture parameters (values in brackets represent standard deviations). Wood
Note: n, numberof samples; Sa (arithmetic mean height); Sz (maximum height); Ssk (skewness); Sp (maximum peak height); Sv (maximum pit depth).
Basedon Tab.2,itcan bestated thatsprucewoodachieves thehighest roughness value after milling (according to Sa). This is explained by the low density of spruce wood and the resulting protruding fibres formed on the surface after CNC milling. A larger group of protruding fibres that have not been completely separated in the milling process creates fuzziness on the surface (Carll and Wiedenhoeft 2023) This is also the cause of the increase ofspruce woodroughness. Agreatertendencyto form fuzziness onthesurfaceis, especially, with wood species with a lower density according to (Landry et al., 2013). With increasing density, there is a decrease in the fuzziness of the surface (Evans et al., 2017). The authors' claims are also confirmed by the microscopic analysis in Fig. 1. On the scan of the spruce wood surface, several protruding fibres can be observed, which protrude significantly above
the surface level. This, in turn, also caused an increase in surface roughness parameters in measurements. At the same time, from the topography of the spruce wood surface, it is possible to see sharp transitions between latewood, less milled wood, and more milled earlywood. At the same time, fuzziness tends to occur in the zone of earlywood, i.e., less dense, and softer wood (Fig. 2). This also proves the claims of the authors. From Tab. 2, it is also possibleto seethat in spruce woodcomparedto other woodspecies, Ssk and Sp values have risen sharply. Positive values of Ssk as a parameter indicate the prevalence of protrusions (hills and peaks) compared to surface dales (Gurau and Petru 2018). Sp also suggests thattheoverall surfaceroughness is madeupofprotrusions in theformof protruded fibres.
Fig. 2 Spruce wood surfaces with protruding fibres after CNC milling. Lens zoom 200×.
The second wood species with the greatest surface roughness is oak (according to Sa), based on Tab. 2 However, the opposite situation occurred as with spruce wood. The lowest, negative Ssk values and high Sv values mean that the surface is made up of significant dales. Also, research by (Gurau et al., 2019; Lungu et al., 2023) shows that the increase in the negative value of skewness (evaluated by the parameter Rsk) can be explained by anatomical cavities and the prevalence of surface depressions (pits and dales). From the surface microscopy in Fig. 1, it can be noted that roughness occurs mainly due to the presence of deep vessels of earlywood. This also confirms the claims found by other authors. In the case of beech wood, it is also possible to observe surface depressions due to the cell structure in Fig. 1. However, compared to oak wood, they do not cause such a significant increase in roughness. Beech wood therefore has the lowest measured roughness after CNC milling. At the same time, research on individual parts of beech wood showed that the lowest roughness after milling is in the zone of mature wood. On the other hand, the highest in the sapwood zone, which again may be due to a lower density compared to false heartwood and mature wood (Dzurenda et al., 2023). On the other hand, the denser zones of beech wood had a lower roughness after milling. The relationship between higher density and lower roughness after milling is also in line with the work of the authors (Kang et al., 2023)
Tab. 2 shows that the roughness of the wood surface increases as the feed speed increases. The same results are presented in the thesis of (Ibrišević et al., 2023; Smajic and Jovanovic 2020). This confirms the machining theory of the deterioration of conditions below the cutting edge. By (Wei et al., 2021) with a higher feed speed, the cutting edge cuts off a larger amount of material and increases the average milling depth. This will result in a higher load on the milling edge and a higher vibration amplitude on the edge. This also leads to a higher irregularity of the machined surface. When increasing the rotational speed, the roughness of the wood was supposed to be reduced according to the (Kúdela et al., 2018; Li et al., 2014). (Pelit et al., 2021) stated that rotational speed increases from 12 000 rpm to 18 000 rpm should reduce the roughness by 8 to 12 %. However, Tab. 2 shows an increase, which may probably be due to higher vibrations of the tool. This does not contradict the findings of other authors, that the reduction of feed per tooth and the associated reduced load on thecutting edgeshould reducevibrations. When investigatingthe feed speed as onefactor and thewoodspecies as theotherfactor,statistically significant changes occurred, especially for wood species with lower density. The sapwood zone of beech wood and spruce wood had a statistically significantly higher roughness expressed by the parameter Sz at a higher feed speed. This is evidenced by the significant growth of the Sv parameter, which is calculated from the dales of the surface. In the case of spruce wood, there was a sharp increase in the parameter Sp with increasing feed speed, which indicates the prevalence of surface protrusions. Together with the Ssk parameter, they prove that with increasing feed speed, the fuzziness of the surface and the proportion of protruding fibres increases. Of all the measured wood species, the lowest roughness was measured in the zone of mature wood in beech wood. The highest roughness, on the other hand, was measured in spruce and oak wood. As already mentioned, the cause of the roughness of spruce wood was the fuzziness of the surface. In the case of oak wood, the cause is deep vessels of earlywood, visible even to the naked eye. By (Lungu et al., 2023), the Rsk parameter (similarly the Ssk parameter) for oak wood reaches negative values mainly due to the deep pores of the earlywood vessels.
Accordingto Tab. 2 the effect ofwood species and rotational speed changes onsurface roughness parameters. As with the change in feed speed, there have been statistically significant differences in wood species with lower density. In the case of sapwood, the fibres were torn out of the surface and in the case of spruce, the fuzziness of the surface increased. Also, in the case of a false heartwood of the beech wood, it was found that the depressions of the surface increased. These findings contradict the theory of machining and the findings of other authors. As the rotational speed of the tool increases (if there is no change in the number of cutting edges), the feed per tooth is reduced. The lower the feed per tooth, the lower the roughness (Pinkowski et al., 2018). The explanation for this experiment may be theincreasein vibration whenthe rotational speed oftheCNC machineincrease (Hortobágyi et al., 2023). Also from the book of the authors (Csanády et al., 2015) it follows that as the increasing vibrations, the surface roughness increases.
Influence of the interaction of feed speed and rotational speed on surface roughness parameters for different wood species
Tab. 1 shows that the interaction of three factors (wood species, feed speed, and rotational speed) statistically affects the amplitude parameter Sz. This finding is consistent with the work of (Kúdela et al., 2018). This three-factor analysis of variances brings a demanding interpretation of the measured data. However, its results closely simulate the conditions of actual production practice, in which it is necessary to set the following for the CNC machine tool: feed speed, rotational speed, thickness of the removed layer, machining strategy, and
tool. Feed and rotational speeds are among the most essential technological parameters in roughness formation (Singer and Özşahin 2022). That is why the authors dealt with their mutual interactions (Pinkowski et al., 2018). They found that the worst quality when using a tilting spindle moulder occurs at high feed speeds and low rotational speeds. Rapidly deteriorating conditions occurred at feed speeds above 25 m×min-1 and rotational speeds below 10 000 rpm.
Fig. 3 Development of the areal surface texture parameter Sz depending on the selected rotational speed and feed speed for individual wood species.
Fig. 3 shows the results of the mutual interaction of feed speed and rotational speed on the parameter Sz For all selected wood species, it is about creating a prediction model based on which it is possible to determine the expected value of surface roughness (defined by the Sz parameter). In most cases, it was confirmed that the worst quality (the highest surface roughness) was produced at the highest rotational speed and highest feed speed and vice versa. This also confirms previous findings. The measured results show that the same trend was measured for most wood species. The opposite situation occurred with oak wood, where the highest roughness arose at the lowest rotational speed and lowest feed speed. This contradictory finding will be explored in more detail in future experiments.
Subsequently, the milled surfaces with the highest and lowest roughness (boundary variants) were subjected to microscopic analysis (Fig. 4). The variant with the highest roughness was for spruce and beech wood at a feed speed of 14 m·min-1 and rotational speed of 18 000 rpm. The variant with the lowest roughness was at feed speeds of 10 m·min-1 and rotational speed of 12 000 rpm. With oak wood, the situation was the opposite. For samples of spruce wood with the highest surface roughness, it is possible to observe a distinctive fuzziness, i.e., a group of fibres. From the image it can be identified that this fuzziness has formed mainly in earlywood, which has a lower density. After adjusting the technological parameters, a surface condition with lower roughness was achieved. For spruce wood, it was mainly about removing the characteristic fuzziness of the surface, i.e., better separation of protruding fibres. This is essential especially for subsequent sanding processes. In the most optimal variant, the roughness (evaluated through the Sz parameter) was reduced by more than half. It should be borne in mind that roughness in conditions of woodworking cannot be eliminated due to the anatomical structure of the wood (Luo et al., 2020; Magoss et al., 2022) and the kinematic movement of the tool (Kopecký et al., 2019). In Fig. 3 it can also
be observed that in the variant with the lowest roughness, the surface of spruce wood shows roughness due to differently milled parts of earlywood and latewood This creates the socalled anatomical earlywood-latewood waviness (Gurău et al., 2022). This is also the reason why the waviness (and the roughness) is greater in the case of spruce wood compared to other wood species. These results were also confirmed by (Kúdela et al., 2018) In the work of (Kúdela et al., 2016), it was investigated that the milling process cannot remove the waviness between earlywood and latewood In the case of oak wood, it was possible to microscopically observe the reduction of the characteristic waves (marks) after passing the cutter. Tool marks could also be observed with the naked eye in the variant of the highest roughness. On the other hand, in the variant of the lowest roughness, they could only be observed at the microscopic level. The removal of waves as marks of the passage of the tool is a desirable condition, especially for follow-up wood sanding processes. In the case of beech wood, the roughness of the wood has also been reduced. Fig. 3 shows that the lowest surface roughness is achieved at low feed speeds and low rotational speed. However, in the microscopic analysis, no significant differences were observed at 200× objective magnification (for this reason, beech wood was not shown in Fig. 4). A likely explanation is the overall more homogeneous structure of beech wood. In the future, therefore, the change in the roughness of sapwood, mature wood and false heartwood could be microscopically expressed using SEM analysis.

CONCLUSION
In the presented paper, the surface roughness of beech, oak, and spruce wood after CNC milling was quantified. From beech wood, the matrix of the experiment was expanded
to include its parts – sapwood, mature wood, and false heartwood. The following conclusions can be drawn from the results:
1. The highest roughness after CNC milling occurs in spruce wood due to protruding fibres (fuzziness). The second highest roughness was measured in oak wood, mainly due to the deep vessels of earlywood. On the other hand, the lowest roughness was measured forbeechwood,specifically forthezoneofmature wood.
2. Theroughnessincreasedwithincreasingfeedspeed.Atthesametime,itwasfound that the roughness increased with increasing rotational speed. A possible explanation was the increasing tool vibrations.
3. When the feed speed and rotational speed are investigated together, the lowest surface roughness is precisely at a feed speed of 10 m·min-1 and a rotational speed of 12 000 rpm (for spruce wood and individual parts of beech wood) and at a feed speed of 14 m·min-1 and a rotational speed of 18 000 rpm (for oak wood).
4. Optimization of technological parameters reduced waves as tool marks and the fuzziness of the surface, improving the quality of the finished CNC-milled surface.
5. The optimal way to optimize technological parameters regarding surface irregularities is to use the Sz areal surface texture parameter, which was also confirmed by microscopic analysis.
6. For each wood species, the models based on which it is possible to predict the development of roughness at selected parameters of feed speed and rotational speed were calculated.
REFERENCES
Aras, O., Sofuoğlu, S. D., 2024. Analyze the effects of CNC machining parameters on the surface roughness (Rz) of Anatolian chestnut. Ağaç ve Orman. Bursa Technical University. 5(1). 42–50. https://doi.org/10.59751/agacorman.1467058
Atanasov. V., Kovatchev. G., Todorov. T., 2023. Study of the Influence of Basic Process Parameters on the Roughness of Surfaces During Milling of Scots Pine Wood. Acta Facultatis Xylologiae Zvolen. 65(2). 89–98.
Bal, B. C., Mengeloğlu, F., Akçakaya, E., Gündeş. Z., 2022. Effects of Cutter Parameters on Surface Roughness of Fiberboard and Energy Consumption of CNC Machine. Kastamonu University Journal of Forestry Faculty. Kastamonu University. 22(3). 264–272. https://doi.org/10.17475/kastorman.1215347
Bembenek, M., Kowalski, Ł., Pawlik, J., 2021. Analysis of the influence of surface roughness of various types of wood on the results of their hardness measured by the Leeb method. IOP Conference Series: Materials Science and Engineering. 1199(1). 012071. https://doi.org/ 10.1088/1757-899X/1199/1/012071
Bendikiene, R., Keturakis, G., 2016. The effect of tool wear and planning parameters on birch wood surface roughness. Wood research. 61. 791–798.
Benkreif, R., Brahmia, F. Z., Csiha, C., 2021. Influence of moisture content on the contact angle and surface tension measured on birch wood surfaces. European Journal of Wood and Wood Products. 79. https://doi.org/10.1007/s00107-021-01666-6
Çakiroğlu, E. O., Demi̇R, A., Aydin, İ., 2019. Determination of the Optimum Feed Rate and Spindle Speed Depending on the Surface Roughness of Some Wood Species Processed with CNC Machine. Journal of Anatolian Environmental and Animal Sciences. 4(4). 598–601. https://doi.org/ 10.35229/jaes.635310
Cakmak, A., Malkocoglu, A., Ozsahin, S., 2023. Optimization of wood machining parameters using artificial neuralnetworkinCNCrouter.Materials Scienceand Technology. SAGEPublications. 39(14) 1728–1744. https://doi.org/10.1080/02670836.2023.2180901
Carll, C., Wiedenhoeft, A., 2023. Moisture-Related Properties of Wood and the Effects of Moisture on Wood and Wood Products.
Csanády,E.,Magoss,E.,Tolvaj.L.,2015.SurfaceRoughnessofWood.QualityofMachinedWood Surfaces. E. Csanády. E. Magoss. and L. Tolvaj. eds., Springer International Publishing. Cham. 183-236. https://doi.org/10.1007/978-3-319-22419-0_4
Demir, A., Cakiroglu, E. O., Aydin. I., 2022. Effects of CNC Processing Parameters on Surface Quality of Wood-Based Panels Used in Furniture Industry. Wood Industry. 73(4). 363–371. https://doi.org/10.5552/drvind.2022.2109
Djurković, M., Milosavljević, M. M., Mihailović, V., Danon. G., 2019. Tool Wear Impacts on Cutting Power and Surface Quality. International Journal.
Dzurenda, L., Dudiak, M., 2023. Colourfulness of European beech wood with a round false heartwood in the color space CIE L*a*b*. Annals of WULS. Forestry and Wood Technology. 122. 82–88. https://doi.org/10.5604/01.3001.0053.8671
Dzurenda, L., Dudiak, M., Kučerová, V., 2023. Differences in Some Physical and Chemical PropertiesofBeechwood withFalse Heartwood Mature Wood and Sapwood. Forests.14 1123. https://doi.org/10.3390/f14061123
ENISO25178-2: 2022. ENISO25178-2. Geometricalproduct specifications (GPS) Surfacetexture: Areal Part 2: Terms definitions and surface texture parameters. Brussels.
Evans, P. D., Cullis, I., Kim, J. D.W., Leung, L.H., Hazneza, S., Heady R. D., 2017. Microstructure and Mechanism of Grain Raising in Wood. Coatings. Multidisciplinary Digital Publishing Institute. 7(9) 135. https://doi.org/10.3390/coatings7090135
Fu, W.-L., Guan, H., Chen, B., 2021. Investigation on the Influence of Moisture Content and Wood Section on the Frictional Properties of Beech Wood Surface. Tribology Transactions. 64 1–13. https://doi.org/10.1080/10402004.2021.1926029
Gochev, Z., 2018. Examination the Process of Longitudinal Solid Wood Profile milling. Part II: Influence of the RevolutionFrequency and Feed Rate on the Roughness of the Treated Surfaces. 1 48–54.
Gurău, L. Coșereanu, C. Timar, M. C., Lungu, A., Condoroţeanu, C. D., 2022. Comparative Surface Quality of Maple (Acer pseudoplatanus) Cut through by CNC Routing and by CO2 Laser at Different Angles as Related to the Wood Grain. Coatings. Multidisciplinary Digital Publishing Institute. 12(12). 1982. https://doi.org/10.3390/coatings12121982
Gurau, L., Irle, M., Buchner J., 2019. Surface roughness of heat treated and untreated beech (Fagus sylvatica L.) wood after sanding. BioResources. 14(2) 4512–4531.
Gurau, L., Petru, A., 2018. The influence of CO2 laser beam power output and scanning speed on surface quality of Norway maple (Acer platanoides). BioResources. 13(4) 8168–8183. https://doi.org/10.15376/biores.13.4.8168-81833
Hanincová, L., Procházka, J., Novák V., 2024. Comparative Analysis of Cutting Forces in CNC Milling of MDF: The Role of Tool Coatings Cutting Speed and Feed Per Tooth. Coatings. Multidisciplinary Digital Publishing Institute. 14(9) 1085. https://doi.org/10.3390/coatings14091085
Hortobágyi, Á., Koleda, P., Koleda, P., Kminiak, R., 2023. Effect of Milling Parameters on Amplitude Spectrum of Vibrations during Milling Materials Based onWood. Applied Sciences. Multidisciplinary Digital Publishing Institute. 13(8). 5061. https://doi.org/10.3390/app13085061
Ibrišević, A., Obučina, M.,Hajdarević, S., Mihulja, G., Kuzman. M. K., Busuladžić, I., 2023.Effects of Cutting Parameters and Grain Direction on Surface Quality of Three Wood Species Obtained by CNC Milling. Bulletin of the Transylvania University of Brasov. Series II: Forestry. Wood Industry. Agricultural Food Engineering. 127–140. https://doi.org/10.31926/but.fwiafe.2023.16.65.3.9
Jiang, S., Buck, D., Tang, Q., Guan, J., Wu, Z., Guo, X., Zhu. Z., Wang, X., 2022. Cutting Force and Surface Roughness during Straight-Tooth Milling of Walnut Wood. Forests. Multidisciplinary Digital Publishing Institute. 13(12). 2126. https://doi.org/10.3390/f13122126
Kang, C.-W., Hashitsume, K., Jang, E., Kolya, H., 2023. Relationship Between Wood Anatomical Features and Surface Roughness Characteristics. Wood Research. 68. 455–464. https://doi.org/ 10.37763/wr.1336-4561/68.3.455464
Koleda, P., Barcík, Š., Svoreň, J., Naščák, Ľ., Dobrík, A., 2019. Influence of Cutting Wedge Treatment on Cutting Power. Machined Surface Quality. and Cutting Edge Wear When Plane Milling Oak Wood. BioResources. 14(4). 9271–9286.
Kopecký, Z., Hlasková, L., Solař, A., Nesázal, P., 2019. Cutting Forces in Quasi-orthogonal CNC Milling. Wood Research. 64(5). 879–890.
Kúdela, J., Javorek, Ľ., Mrenica, L. 2016. Influence of milling and sanding on beech wood surface properties. Part I. Surface morphology. Annals of Warsaw University of Life Sciences - SGGW Forestry and Wood Technology. (95). 148–153.
Kúdela, J., Mrenica, L., and Javorek, Ľ., 2018. The Influence of Milling and Sanding on Wood Surface Morphology.0 Acta Facultatis Xylologiae Zvolen. 60(1). https://doi.org/10.17423/afx.2018.60.1.08
Laina, R., Sanz-Lobera, A., Villasante, A., Espí, P., Martínez Rojas, J., Alpuente, J., Montero, R., Peña, S., 2017. Effect of the anatomical structure woodproperties and machining conditions on surface roughness of wood. Maderas. Ciencia y tecnología. 19. https://doi.org/10.4067/S0718-221X2017005000018
Landry, V., Blanchet, P., Cormier, L. M., 2013. Water-based and solvent-based stains: Impact on the grain raising in Yellow Birch BioResources. 8(2) 1997–2009. https://doi.org/10.15376/biores.8.2.1997-2009
Li, Y. W., Sun, Y. S., Zhou, X. G., 2014. Theoretical Analysis and Experimental Verification that Influence Factors of Climb and Conventional Milling on Surface Roughness. Applied Mechanics and Materials. Trans Tech Publications Ltd. 459 407–412. https://doi.org/ 10.4028/www.scientific.net/AMM.459.407
Lo, N. H., Hung, T. Q., 2021. Optimization of cutting parameters on surface roughness and productivity when milling wood materials. Journal of Machine Engineering. Vol. 21 No. 4. https://doi.org/ 10.36897/jme/144426
Lungu, A., Gurău, L., Coșereanu, C., 2023.Evaluationof CNCrouted surface qualityofmaple (Acer pseudoplatanus) and oak (Quercusrobur L.) with different milling angles as function of grain orientation. BioResources. 18(3) 5334–5350. https://doi.org/10.15376/biores.18.3.5334-5350
Luo, B., Zhang, J., Bao, X., Liu, H., Li, L., 2020. The effect of granularity on surface roughness and contact angle in wood sanding process. Measurement. 165 108133. https://doi.org/10.1016/j.measurement.2020.108133
Magoss, E., Rozs, R., Tatai, S., 2022. Evaluation of Wood Surface Roughness by Confocal Microscopy. Wood Research. 67 919–928. https://doi.org/10.37763/wr.13364561/67.6.919928
Pelit, H., Korkmaz, M., Budakçi M., 2021. Surface roughness of thermally treated wood cut with different parameters in CNC router machine. BioResources. 16(3) 5133–5147. https://doi.org/ 10.15376/biores.16.3.5133-5147
Pinkowski, G., Szymański, W., Krauss, A., Stefanowski, S., 2018. The effect of the feed speed and rotation speed of plane milling on the surface roughness of beech wood. Annals of Warsaw University of Life Sciences - SGGW. 103. 5–12.
Rezaei, F., Wimmer, R., Gaff, M., Gusenbauer, C., Frybort, S., Sethy, A., Corleto, R., Ditommaso, G., Niemz, P., 2022. Anatomical and morphological characteristics of beech wood after CO2laser cutting. Wood Material Science and Engineering. https://doi.org/10.1080/17480272.2022.2134820
Sedlecký, M., Kvietková, M., Kminiak, R., Kaplan, L., 2018. Medium-density fiberboard and edgeglued panel after edge milling - surface waviness after machining with different parameters measured by contact and contactless method. Wood Research. 63. 683–698. Singer,H.,Özşahin,Ş.,2022.Prioritizationoffactorsaffectingsurfaceroughnessofwoodandwoodbased materials in CNC machining: a fuzzy analytic hierarchy process model. Wood Material Science & Engineering. Taylor & Francis. 17(2). 63–71. https://doi.org/10.1080/17480272.2020.1778079
Smajić, S., Jovanović, J., 2020. Study of the influence factors affecting surface roughness of oak and beech samples during machining with peripheral milling. https://doi.org/10.13140/RG.2.2.22050.66249
Smajić, S., Jovanović, J., 2021. Influence of Different Machining on the Roughness of Oak Wood. Bulletin of the Transylvania University of Brasov. 14(63) No. 1-2021. 101–108. https://doi.org/10.31926/but.fwiafe.2021.14.63.1.9
Wei, W., Cong, R., Xue, T., Abraham, A. D., Yang, C., 2021. Surface roughness and chip morphology of wood-plastic composites manufactured via high-speed milling. BioResources. 16(3). 5733–5745. https://doi.org/10.15376/biores.16.3.5733-5745
Yang, C., Ma, Y., Liu, T., Ding, Y., Qu, W., 2023. Experimental Study of Surface Roughness of Pine Wood by High-Speed Milling. Forests. 14. 1275. https://doi.org/10.3390/f14061275
ACKNOWLEDGMENT
This experimental research was prepared within the grant project: APVV-21-0051Researchoffalse heartwoodandsapwoodofFagussylvaticaL.woodinordertoeliminatecolordifferencesbythe process of thermal treatment with saturated water steam as the result of work of author and the considerable assistance of the APVV agency and funded by the EU NextGenerationEU through the Recovery and Resilience Plan for Slovakia under the project No. 09I03-03-V05-00016.
AUTHORS' ADDRESSES
Ing. Lukáš Adamčík doc. Ing. Richard Kminiak, PhD. Ing. Adrian Banski, PhD. Technical University in Zvolen Faculty of Wood Sciences and Technology, Department of Woodworking T. G. Masaryka 24, 960 01 Zvolen, Slovakia xadamcikl@tuzvo.sk richard.kminiak@tuzvo.sk banski@tuzvo.sk
ACTA FACULTATIS XYLOLOGIAE ZVOLEN, 66(2): 75 87, 2024
Zvolen, Technická univerzita vo Zvolene
DOI: 10.17423/afx.2024.66.2.07
THE EFFECT OF THE FOCAL LENGTH POSITION OF THE FOCUSING LENS ON THE DISCOLORATION ROUGHNESS OF PLYWOOD UNDER DIFFERENT CO2 LASER ENGRAVING MODES
Zhivko Gochev – Pavlin Vitchev
ABSTRACT
The results of a surface roughness study obtained by CO2 laser engraving of birch plywood specimens are presented in the paper. A ZnSe lens with focal length F = 50.8 mm; focal position ∆F = -4, -6, and -8 mm above the material surface; laser beam power P = 4.0, 5.6, and7.2W;laserbeamscanningspeedvf=250,260,and270mm/swasusedfortheresearch. The roughness of the treated surfaces was measured with an electronic profilometer, model Surftest SJ-210 (Mitutoyo – Japan).
The experimental results were evaluated via the parameters Ra, Rq, and Rz and analyzed using specialized software Q-StatLab, ANOVA analysis, and interaction diagrams of all parameters, and relevant conclusions and recommendations were made. The analyses indicate that the surfaces of birch plywood treated with a CO2 laser exhibit higher roughness than untreated ones, with a deviation of 2 to 4 times greater for the Ra parameter and 2.2 to 3.9 times greater for the Rz parameter. The primary reason for the difference in surface roughness of CO2 laser-treated materials at different focusing positions on the surface is the varying laser beam power density. A higher beam power density leads to more significant absorbed heat, resulting in increased surface roughen
Keywords: CO2 laser engraving; birch wood; plywood; roughness of surfaces.
INTRODUCTION
Laser technologies based on different types of laser sources are widely used in the modern wood and furniture industry. One main use of CO2 lasers is cutting and engraving solid wood and wood-based materials (WBM).
Modern software products, part of laser technologies, open vast possibilities for building complex graphic images, a type of photography, on solid wood and WBM samples. This opens up new challenges for the furniture industry, not least for the souvenir industry. Along with thedevelopment oflasertechnology, researchersareparticularlyinterested in the study of the mechanism of the laser beam's interaction with different types of wood and WBM. The main guidelines being worked on are the most appropriate modes to be applied, depending on the objective set and the specific type of material.
The most commonly investigated factors of CO2 lasers are the power and feed (scan) speed of the laser beam, the focal length of the focusing optics and, the position of the focus relative to the surface of the material to be processed, the mode structure of the beam. The object of study is the formation of the slot and its parameters, the modifications that occur
in the processed material, the changes in the color of the engraved surfaces as a result of carbonization of the wood material, etc. (Orech and Jůza, 1987; Gotchev et al., 1994; Gochev, 1996; Gochev and Dinkov, 1996; Dinkov et al., 1996; Batov et al., 1997; Pagano et al., 2009; Kubovský et al., 2012; Hernández-Castañeda et al., 2011; Eltawahni et al., 2013; Petutschnigg et al., 2013; Gochev, 2016; Gurau et al., 2017; Martinez-Conde et al., 2017; Vidholdová et al., 2017; Sikora et al., 2018; Jurek and Wagnerová, 2021; Gochev and Vichev, 2022; Kúdela et al., 2022; Gochev, 2023 and others.).
Information can be found in the literature from different authors about the changes that occur in the color of various types of solid wood and WBM when engraving or decorating with a CO2 laser beam (Petutschnigg et al., 2013; Gurau et al., 2017; Vidholdová et al., 2017; Sikora et al., 2018; Jurek and Wagnerová, 2021; Gochev and Vichev, 2022; Kúdela et al., 2022; Jurek and Wagnerová, 2021 and others). When building complex graphic images, the different color shades stand out best when engraving with a laser beam on homogeneous solid wood and WBM. Several authors have also investigated the influence that the roughness of the carbonized material has on the quality of graphic images (Gurau et al., 2017; Kúdela et al., 2022; Li et al., 2022; Kúdela et al., 2023; and others).
The aim of the present work is to investigate the surface roughness obtained during CO2 laser engraving of birch plywood samples and the influence of the different positions of the focusing lens over the material surface at various powers and scanning speeds of the CO2 laser beam, as well as to formulate relevant conclusions and recommendations.
MATERIALS AND METHODS
The experimental studies were conducted using a FormaTec laser engraving and cutting machine, model K40 with 40 W power (Fig. 1).
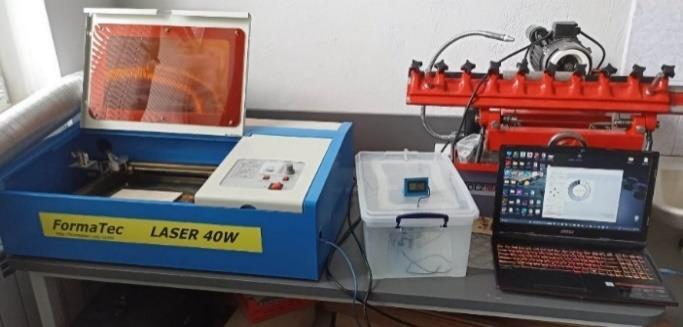
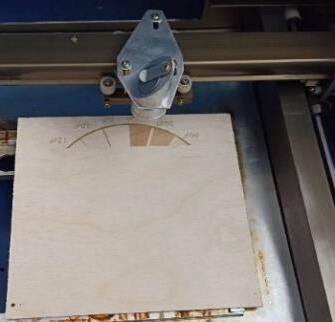
For the experiment, plywood samples were used – common birch (Betula pendula Roth.) with dimensions 200 × 200 × 3 mm, density ρ = 400 kg/m3 and humidity W = 6%. Birch plywood is manufactured from developed birch veneer and is characterized by high strength and dimensional stability. Birch is a hard broad-leaved tree species with a light, smooth, even surface and a homogeneous, fine structure, making it suitable for CO2 laser engraving.
A test was performed on plywood samples to examine the color change in the surface layer when varying the laser beam power (P, W); scan speed (vf, mm/s) and focal length of a ZnSe lens, F = 50.8 mm. For each matrix series of the planned experiment, the focal position was above the material surface: ΔF = - 4 mm; ΔF = - 6 mm and ΔF = - 8 mm (Fig. 2).
The values of the variable factors – laser beam power (P, W) and laser beam scan (feed) speed (vf, mm/s) in open and coded form are given in Table 1.
A high-precision roughness profilometer, model Surftest SJ-210 (Mitutoyo - Japan), was used to measure the roughness changes in the surface layer color of the birch plywood samples (Fig. 3). When the position of the focus (ΔF) is above the surface of the material, it is taken as "minus", when it is on the surface as "0" and when it is below the surface of the material as "plus".
The matrix of the planned two-factor experiment is shown in Table 2.
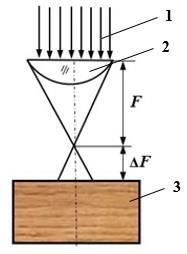
Fig. 2 Position of the focal plane of the focusing lens above the surface of the material: 1 – laser beam; 2 – focusing lens; 3 – processed material.
Tab. 1 Variable factor values. Variable
Tab. 2 Matrix of the planned two-factor experiment.
of the experiment
Experiments in the middle of the factor space
RESULTS AND DISCUSSION
The results of the test conducted on the color change of the surface layer of the plywood samples, according to the matrix of the planned two-factor experiment, are shown in Figure 4, for different focus positions ∆F above the material surface. The arrangement of
the samples was made vertically, in four rows, according to the experiment matrix of Table 2.
On the surface of the samples shown in Fig. 4 is an engraved system of isolated areas with different color from dark brown to light, approaching the natural color of birch plywood. Specialized software was used to conduct this test „Inkscape“ (https://wikibgbg.top/wiki/Inkscape; https://paradacreativa.es/bg/que-es-inkscape-y-comofunciona/). For each experience of the planned experiment matrix (Table 2), the laser beam power was varied from 100% to 5% with a step of 5%.
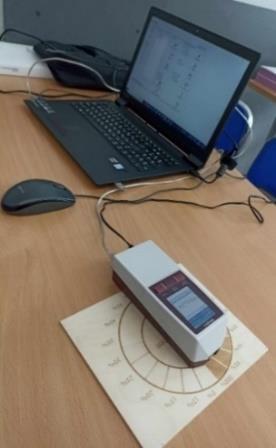
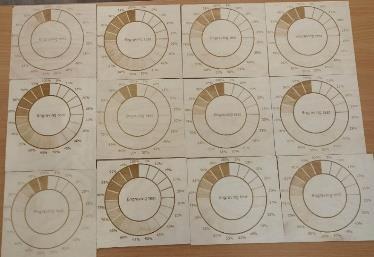
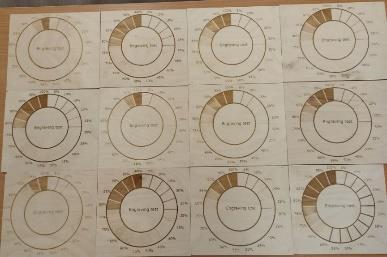
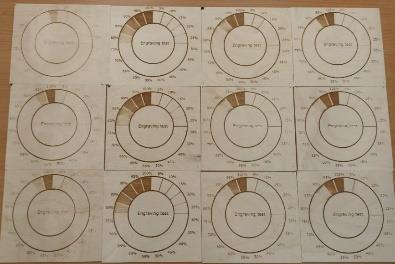
Since the volume of roughness measurements, for each effect zone, is very large, as can be seen in Figures 3 and 4, only the results of the areas affected with the laser beam at 100% power are presented here, according to the experiment matrix in Table 2.
The values of Ra (the absolute mean difference between the peak and valley of the irregularities, within the reference length l), Rq (the root mean square deviation of the evaluated profile from the mean line within the reference length l) and Rz (the absolute arithmetic mean sum of the five largest peaks and the five largest valleys, within the reference length l) were used to evaluate the roughness of the surface irradiated by the laser beam (BDS EN ISO 4287:2006). Each measurement was carried out in the area of influence, repeating the measurements three times in different directions to obtain averaged values (Table 3, 4 and 5).
Tab. 3 Surface roughness parameters at ∆F = -4 mm.
№ of the experiment Variable factors
Experiments in the middle of the factor space
Tab. 4 Surface roughness parameters at ∆F = -6 mm.
№ of the experiment Variable factors
Experiments in the middle of the factor space
Tab. 5 Surface roughness parameters at ∆F = -8 mm. № of the
factors
Experiments in the middle of the factor space
In North America the most commonly used surface roughness parameter is Ra, while in Europe, the more common roughness parameter is Rz. The Ra parameter is statistically stable and repeatable, but it does not distinguish between peaks and valleys of the profile.
The Rz parameter averages only the five highest peaks and the five deepest valleystherefore the extreme values have a much greater influence on the final result.
The Rq parameter is more sensitive to peaks and valleys than Ra and is commonlyused in in research and statistical control of very smooth surfaces (Kalimanova et al , 2012).
Which parameter to use to evaluate the surface roughness Rz or Ra depends on the manufacturer and the customer. It is recommended as a safe conversion to use a ratio range for Rz to Ra = 4:1 to 7:1 (https://www.productionmachining.com/articles/the-differencebetween-ra-and-rz, Kovács et al , 2012), but this is still an example of not good engineering practice.
Because using Ra alone may cause some points, such as single convexities, to be neglected, it is better to use Ra and Rz together. In this study, results are also given for the parameter Rq to obtain a more complete picture.
Figure 5 shows a roughness profile from the surface of a birch plywood sample not treated with a CO2 laser beam, and Figures 6, 7 and 8 after laser beam treatment at the position of the focus above the material surface (∆F = -4 mm, ∆F = -6 mm and ∆F = -8 mm).
The roughness profiles in Figs. 6, 7, and 8 were obtained for variable factor parameters corresponding to No. 10 in Table 2.
To compare the individual profiles in Figures 5, 6, 7 and 8, they are overlaid in a single Figure 9.
It can be seen from all the above figures that:
- theCO2laser-treatedsurfacesofthebirchplywoodsampleshaveagreaterroughness than the untreated ones, and for the parameter Ra, the variation is from 2 to 4 times, and for Rz from 2.2 to 3.9 times;
- the largest roughness of the CO2 laser treated surfaces is obtained at the focal position ∆F = -4 mm above the material surface and the smallest at ∆F = -8 mm, an intermediate position for the surface roughness is obtained at ∆F = -6 mm;
- the ratio of ∆F = -4 mm to ∆F = -6 mm and to ∆F = -8 mm for Ra is 2.0:1.7:1.2 and for Rz is 1.8:1.5:1.2;
- the main reason for the different roughness of the CO2 laser treated surfaces at different focus positions over the material surface is the different power density of the laser beam (Fig. 2);
- at all three focus positions, an unfocused laser beam falls on the plywood samples, but at ∆F = -4 mm the spot diameter is the smallest and the power density is the largest, while at ∆F = -8 mm the spot diameter is the largest and the power density is the smallest;
- greater beam power density leads to a greater amount of absorbed heat and increased surface roughness.
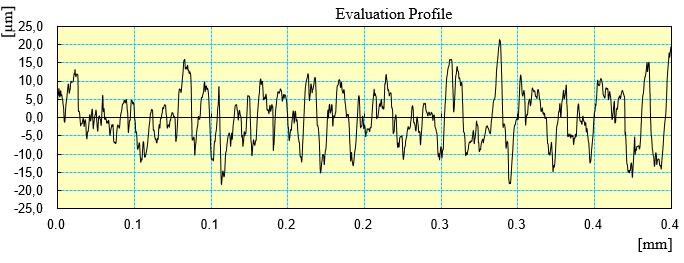
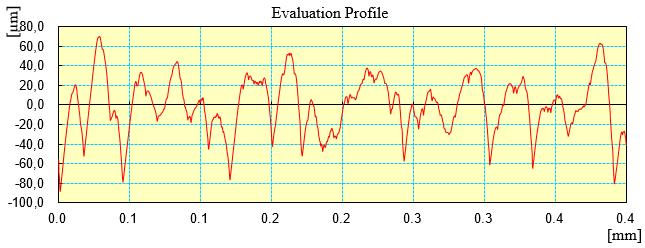
Fig. 6 Surface roughness profile of a birch plywood sample exposed to a CO2 laser beam at ∆F = -4 mm (Ra = 23.18 μm, Rq = 28.72 μm, Rz = 125.29 μm).
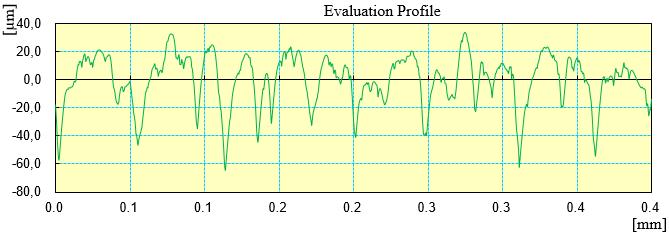
Fig. 7 Surface roughness profile of a birch plywood sample exposed to a CO2 laser beam at ∆F = -6 mm (Ra = 13.96 μm, Rq = 17.75 μm, Rz = 82.88 μm).
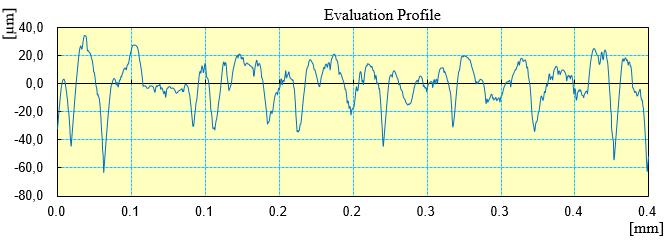
8 Surface roughness profile of a birch plywood sample exposed to a CO2 laser beam at ∆F = -8 mm (Ra = 11.73 μm, Rq = 15.14 μm, Rz = 70.78 μm).
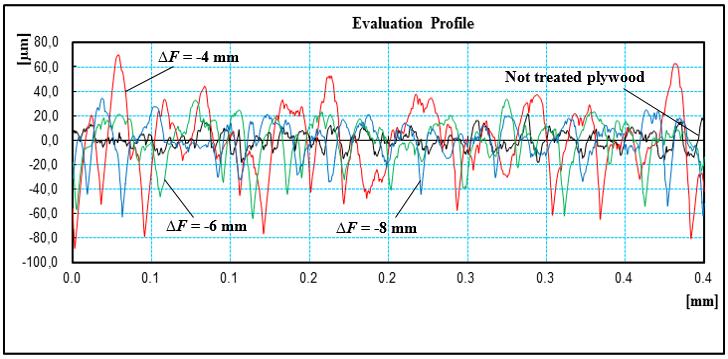
Fig. 9 Various machined surface roughness profiles.
The results of the experimental studies were processed mathematically with specialized Q-StatLab software and regression equations were derived for the roughness parameters Ra and Rz at different focal positions on the material surface:
- Regression equation for Ra at ΔF = -4 mm
- Regression equation for Ra at ΔF = -6 mm
- Regression equation for Ra at ΔF = -8 mm Y1 = 14.75 + 4.29X1 - 1.51X2 + 2.21X
- Regression equation for Rz at ΔF = -4 mm
- Regression equation for Rz at ΔF = -6 mm
- Regression equation for Rz at ΔF = -8 mm Y2 = 85.164 + 20.306X1 - 7.598X2 +
The equations show that it is the coefficient in front of X1 corresponding to the cutting power (P) that will have the greatest influence, and to a greater extent than feed rate (vf), on the roughness of the surfaces.
The sign in front of the coefficient is “plus”, i.e., as P increases, Ra and Rz will increase. The coefficient in front of X2 has a negative sign, i.e., with increasing feed rate (scanning) Ra and Rz will decrease. The sign in front of the coefficient of double interactions X12 is negative, indicating the divergent influence of laser beam power (P) and feed rate (vf) on the surface roughness.
Figures 10 – 15 present the graphical relationships showing the variation of the roughness parameters Ra and Rz with laser beam power (P) at different feed rates (vf) and at focal distance ∆F = -4 mm; ∆F = -6 mm and ∆F = -8 mm.
Fig. 10 Variation of the roughness parameter Ra with laser beam power (P) at different feed rates (vf) and focal length ΔF = -4 mm.
Fig. 11 Variation of the roughness parameter Ra with laser beam power (P) at different feed rates (vf) and focal length ΔF = -6 mm.
Fig. 12 Variation of the roughness parameter Ra with laser beam power (P) at different feed rates (vf) and focal length ΔF = -8 mm.
13 Variation of the roughness parameter Rz with laser beam power (P) at different feed rates (vf) and focal length ΔF = -4 mm.
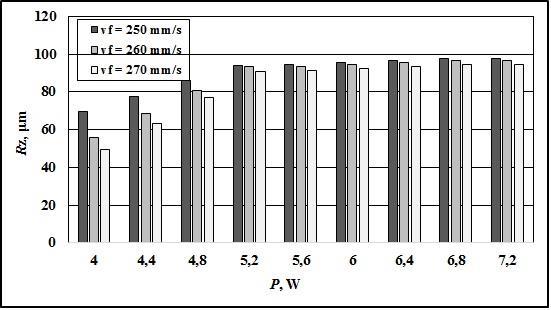
14 Variation of the roughness parameter Rz with laser beam power (P) at different feed rates (vf) and focal length ΔF = -6 mm.
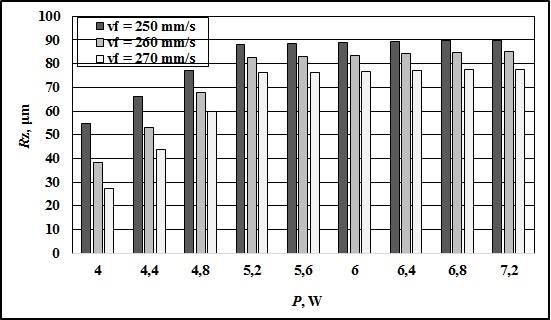
15 Variation of the roughness parameter Rz with laser beam power (P) at different feed rates (vf) and focal length ΔF = -8 mm
CONCLUSION
Based on the conducted research, the following conclusions can be drawn:
- The surfaces of birch plywood samples treated with a CO2 laser exhibit higher roughness than untreated ones, with 2 to 4 times more significant deviations for the Ra parameter and 2.2 to 3.9 times more significant for the Rz parameter.
- The highest values of surface roughness parameters for CO2 laser-treated surfaces are obtained at the focal position ∆F = -4 mm above the material surface, (laser beam power P = 7.2 W and feed rate vf = 250 mm/s) and the smallest at ∆F = -8 mm laser beam power P = 4 W and feed rate vf = 270 mm/s), an intermediate position for the surface roughness is obtained at ∆F = -6 mm.
- At the focusing position above the material surface ∆F = -4 mm, the material loss is greater than at the ∆F = -6 mm and ∆F = -8 mm positions. In the first case, the diameter of the unfocused laser beam is smaller, the power density is higher, and the amount of evaporated material is greater than at ∆F = -6 mm and ∆F = -8 mm, which is reflected in higher values of Ra, Rz, and Rq (Figures 5-15).
- Asthelaserbeampowerincreases(P –from4to 7.2W), thevaluesofRaandRzincrease, and the surface roughness of the processed areas also increases (Figures 10-15).
- Increasing the feed rate (scanning – vf from 250 to 270 mm/s) of the laser beam, the values of the roughness parameters Ra and Rz decrease, as the time of the laser beam impact on the material decreases, leading to a decrease in the degree of carbonization of the surface layer, and hence to a decrease in its roughness.
- The ratio of ∆F = -4 mm to ∆F = -6 mm and ∆F = -8 mm for Ra is 2.0:1.7:1.2, and for Rz, it is 1.8:1.5:1.2 (Table 3-5 and Figure 9).
- Depending on the effect achieved when creating complex graphic patterns using the laser beam, modes can be developed in which a specific shade between the darkening of the material's surface layer and its roughness is achieved. This will be the subject of further research.
REFERENCES
Batov,I.,Gotchev,Zh.,Dinkov,B.,Janic,Z.,1997,Studyontheheadfieldandthestructuralchanges during the interactions between CO2 laser beam and wood material, The 3rd International Conference on the Development of Forestry and Wood Science/Technology, Volume II, Belgrade, pp. 560-568, ISBN 86-7299-048-x.
BDSENISO4287:2006.Geometricalproductspecifications(GPS) -Surfacetexture:Profilemethod - Terms, definitions and surface texture parameters (ISO 4287:1997)
Dinkov, B., Gochev, Zh., Barnekov, V., 1996. Optimization of the Influence of the Main Notch Formation Factors in Laser Beam Interaction with Wood and Wood Materials, Proceedings of the International Scientific Conference „Mechanical Technology of Wood”, 21-23 November 1996, Sofia, University of Forestry Publishing House, pp. 305-311 (in Bulgarian).
Eltawahni, H., Rossini, N., Dassisti, M., Alrashed, K., Aldaham ,T., Benyounis, K., Olabi, A., 2013. Evaluation and optimization of laser cutting parameters for plywood materials. Opt. Lasers Eng., 51(9):1029-1043, ISSN: 0143-8166 https://doi.org/10.1016/j.optlaseng.2013.02.019
Gotchev, J., Barnekov, V., Dinkov, B., 1994. Modeling the Laser Cutting of Particleboard, 2nd International Conference on Automated Lumber Processing Systems and Laser Machining of Wood and Composites, Michigan State University, East Lansing, Michigan, USA, pp. 71-81. Gochev, Zh., 1996. Investigation of the process of laser cutting of furniture parts made of particle board, PhD Thesis, University of Forestry, Sofia, p. 200 (in Bulgarian).
Gochev, Zh., Dinkov B., 1996. Specific Cutting Energy at Laser Beam Interaction with Wood and Wood Materials, Proceedings of International Scientific Conference, University of Forestry, Section: Mechanical Technology of Wood, Sofia, pp. 298-304 (in Bulgarian).
Gochev, Zh., 2016. Laser wood cutting and modification in its structure, IInd International Furniture Congress: proceedings of papers, 13-15 October, Muğla Sitki Koçman University Faculty of Technology Department of Wood Product Industrial Engineering, Turkey, pp. 210-215.
Gochev, Zh., Vichev P., 2022. Color modifications in plywood by different mode of CO2 laser engraving, Scientific journal Acta Facultatis Xylologiae, Zvolen, 64(2), pp. 77-86, ISSN 13363824. https://doi.org/10.17423/afx.2022.64.2.08
Gochev, Zh., 2023. Real Parameters of a Focused CO2 Laser Beam and its Determination when Using Lenses with Different Focal Lengths, 32nd International Conference on Wood Science and Technology – ICWST 2023, Unleashing the Potential of Wood-Based Materials, proceeding of papers, 7-8 December, Zagreb, pp. 67-74, ISBN 978-953-292-083-3.
Gurau, L., A. Petru, A. Varodi, M. Timar, 2017. The Influence of CO2 Laser Beam Power Output and Scanning Speed on Surface Roughness and Colour Changes of Beech BioResources 12(4):7395-7412, ISSN: 1930-2126 https://doi.org/10.15376/biores.12.4.7395-7412
Hernández-Castañeda, J., H. Kursad, L. Li, 2011. Theeffect of moisture content in fibre laser cutting of pine wood. Opt. Lasers Eng., 49(9-10):1139–1152, ISSN: 0143-8166, https://doi.org/10.1016/j.optlaseng.2011.05.008
Jurek, M., R. Wagnerová, 2021 Laser beam calibrationfor wood surfacecolourtreatment, European Journal of Wood and Wood Products, 79(5):1097–1107, ISSN: 1436736X https://doi.org/10.1007/s00107-021-01704-3
Kalimanova, I., D. Teodosiev, D. Diakov, H. Nikolova, 2012. Study of the influence of the glasscarbon coating on the micro-topografy of the articulating surfaces of ceramic implants, Proceedings of the XXII National Scientific Symposium with „Metrology and Metrological Assurance 2012“, September 10-14, 2012, Sozopol, Bulgaria, pp. 147-153, ISSN: 1313-9126 (in Bulgarian).
Kovács,B.,Sipos,S.,Czifra,Á.,2012.Interpretationof„Rz=4×Ra“andotherroughnessparameters in the evaluation of machined surfaces, ICT-2012, In Proceedings of the 13th International Conference onTools 27-28March 2012,Miskolc, Hungary,pp. 237-242, ISBN: 978-963-998835-4
Kubovský, I., Babiak, M., Cipka, Š., 2012. A determination of specific wood mass remowal energy in machining by CO2 laser, Acta Facultatis Xylologiae Zvolen, 54(2): 31−37, 2012, Zvolen, Technická univerzita vo Zvolene, ISSN: 13363824.
Kúdela, J., Kubovský, I., Andrejko, M., 2022. Influence of Irradiation Parameters on Structure and Properties of Oak Wood Surface Engraved with a CO2 Laser, Materials, Vol. 15, Iss. 23, p. 21, ISSN: 1996-1944, https://doi.org/10.3390/ma15238384
Kúdela, J., Andrejko, M., Kubovský, I., 2023. The Effect of CO2 Laser Engraving on the Surface Structure and Properties of Spruce Wood, Coatings, Vol. 13, Iss. 12, p. 17, ISSN: 2079-6412 https://doi.org/10.3390/coatings13122006
Li, R. C. He, W. Xu, X. Wang, 2022. Prediction of Surface Roughness of CO2 Laser Modified PoplarWood Via Response Surface Methodology. Maderas. Ciencia y Tecnología 2022, Vol. 24, pp. 1-12, on-line ISSN: 0718-221X, https://doi.org/10.4067/s0718-221x2022000100442. Martinez-Conde, A., T. Krenke, S. Frybort, U. Müller, 2017. Review: Comparative analysis of CO2 laser and conventional sawing for cutting of lumber and wood-based materials. Wood Sci. Technol., 51: 943–966, ISSN: 1432-5225. https://doi.org/10. 1007/s00226-017-0914-9
Orech, J., Jůza, F., 1987. Měrná energie úběru a její určení při interakci laserového záření se dřevem [Specific removal energy and its determination during the interaction of laser radiation with wood]. Drevársky výskum, Vol. 114, pp. 29-40, ISSN: 0012-6136. Pagano, N., Genna, S., Leone, C., Lopresto, V., 2009. Wood Laser machining using CO2 30W laser in CW and pulse regime, In book: Innovative production machines and systems. LAPT, Napoli, pp. 145-150, ISBN-10:1849950067.
Petutschnigg, A., M. Stöckler, F. Steinwendner, J. Schnepps, H. Gütler, J. Blinzer, H. Holzer, Th. Schnabel1, 2013. Laser Treatment ofWood Surfacesfor Ski Cores: An Experimental Parameter
Study, Advances in Materials Science and Engineering, Volume 2013(11), Article ID 123085, pp 1-7, ISSN: 1687-8434 (Print), ISSN: 1687-8442 (Online), https://doi.org/10.1155/2013/123085
Sikora, A., F. Kačík, M. Gaff, V. Vondrová, T. Bubeníková, I. Kubovský, 2018. Impact of thermal modification on color and chemical changes of spruceand oak wood, Journal of Wood Science, Volume 64, pp. 406-416. https://doi.org/10.1007/s10086-018-1721-0
Vuchkov, I., Stoyanov, S., 1986. Mathematical modeling and optimization of technological objects, SPH Tehnika, Sofia, p. 341 (in Bulgarian).
Vidholdová, Z., Reinprecht, L., Igaz, R., 2017. The Impact of Laser Surface Modification of Beech Wood on its Color and Occurrence of Molds, 12(2):7395-7412, ISSN: 1930-2126 http://doi.org/10.15376/biores.12.2.4177-4186
https://wikibgbg.top/wiki/Inkscape; https://paradacreativa.es/bg/que-es-inkscape-y-como-funciona/. https://www.productionmachining.com/articles/the-difference-between-ra-and-rz
ACKNOWLEDGMENT
WewouldliketothanktheResearchSectoroftheUniversityofForestry,Sofia,Bulgaria,withwhose support, through Contract No. NIS-B-1284/19.10.2023, this research was carried out.
AUTHORS’ ADDRESSES
Prof. Eng. Zhivko Gochev, Ph.D.
Assoc. Prof. Eng. Pavlin Vitchev, Ph.D. University of Forestry, Faculty of Forest University Department of Woodworking Machines 10 Kliment Ohridski Blvd. 1797 Sofia, Bulgaria zhivkog@ltu.bg p_vitchev@ltu.bg
ACTA FACULTATIS XYLOLOGIAE ZVOLEN, 66(2): 89 101, 2024
Zvolen, Technická univerzita vo Zvolene
DOI: 10.17423/afx.2024.66.2.08
SELECTING COLOR OF MOSAIC PATTERN ELEMENTS FOR LASER ENGRAVING ON WOOD
Mikhail Chernykh – Alina Korepanova – Ekaterina Maksimova – Vadim Sevryugin – Maxim Gilfanov – Vladimir Stollmann
ABSTRACT
The research results of color change during laser engraving on the wood of six species: aspen, pine, larch, birch, beech, and spruce, are presented in the paper. The values of color coordinates are measured in the Lab system on test strips with the template grey color gradient changing from white to black. Depending on the template resolution, three distinctive regions are observed. The natural wood color is preserved with the resolution increase in the first region; the wood surface gradually gets darker, reaching the tone limit in the second one, and lighter due to the light reflection in the third. The method for selecting the color of mosaic pattern elements, providing the matching of the color of the original elements and the image engraved on wood, is proposed based on the research results.
Keywords: wood; laser engraving; color; computer template; mosaic pattern.
INTRODUCTION
In the process of laser thermal modification of wood surface, the radiation energy is converted into heat energy, causing chemical and structural transformations in wood, thus leading to changes in significant properties of the surface layer, such as color, roughness, water repellency, biological resistance, etc. (Babiak et al., 2004; Kubovsky and Kačik, 2013; Vidholdova et al., 2017; Gurau et al., 2017; Li et al., 2018; Kudela et al., 2019; Zykova et al , 2021). The extent of changes in wood property depends on its species and absorbed energy density Wp (Chernykh et al., 2022):
Wp = Pc *t/s*(1-Ko), J/cm2 (1)
which is defined by the average pulse radiation power Pc, time t for radiating the region with the area s and coefficient of reflection (Ко) of laser pulse by wood. In turn, the average pulse radiation power Рс:
depends on the pulse power Рi, pulse duration and pulse repetition frequency f. The values of factors indicated in the formulas (1) and (2) are specified by the processing mode
– pulse power Pi (set up in percent from the maximum laser power P max), laser head movement speed V, focal distance l and raster density (Kudela et al , 2019). The raster density is defined by the laser machine resolution R (Petutschnigg et al., 2013, Zykova et al , 2021) and template resolution N (Yakimovich et al., 2016).
The change in the template resolution with constant values of other processing mode factors (Pi, V, l and R) results in the changed pulse repetition frequency f (envisaged by software for laser machines); consequently, – in the changed average pulse radiation power Pc and properties of the surface processed by the laser, including the coloristic ones (Chernykh and Yapparova, 2012; Yakimovich et al , 2016; Zykova et al., 2021, Evdokimova et al., 2023).
The practical use of the results of investigating the color of wood modified by laser is discussed in a number of papers. Thus, Petutschnigg et al , 2013 substantiated the selected color and design of ski cores of beech wood. In order to preserve the cultural heritage in the conditions of hi-tech processing method application, Lungu et al , 2022 defined the color correlation on maple furniture parts engraved by laser similar to the correlation of colors of the national Rumanian ornament traditionally embroidered on elements of clothes. Jurek and Vagnerova et al , 2021, Gochev and Vitchev 2022, Chernykh et al , 2022, Evdokimova et al., 2023 applied the results of the color research for making photographs and landscapes on plywood, boards and veneer of beech and birch wood. Based on the research results, Chernykh et al., 2018 designed and produced wall panels with marine landscapes made of the veneer of five wood species: beech, pine, chestnut, mahogany and sapele. Thus, the tendency in a growing number of works with the practical use of the research results aimed at studying the color of wood modified by laser is evident. The design of products based on the color research results requires the involvement of designers.
On the one hand, for successful work a designer needs information about the color range obtained from one or another wood species processed on a certain laser machine. On the other hand, a laser machine operator needs to know the processing modes providing the colors set up by the designer on the wood. The paper discusses an option for solving this problem. It was suggested to engrave the test strip with a gradient of tone on the samples, also to determine the integrated coordinates in the CIE Lab system at the test strip length, highlight visually different parts and use them in the process of developing design for a layout.
MATERIALS AND METHODS
Two types of images are reproduced by laser on wood and wooden materials – halftone ones conveying the original three-dimensionality (usually photographs) due to the tone gradient (Jurek et al., 2021, Gochev and Vitchev 2022), and mosaic ones, in which the image is split into regions with the same tone within a certain region (Chernykh and Yapparova 2012; Lungu et al , 2022). Although the color of the image engraved on wood differs from the original color, the correlations of tones are preserved between the image elements. Therefore, the original contrast and pseudo-volume are reproduced on the product.
To correct the half-tone template, the designer needs only the information on lightness L or optic density D of the wood species to be engraved, better of the workpiece to be engraved (to eliminate the influence of unstable properties, such as moisture content, age, hardness), and its tone limit. Having this information, the designer sets up the highest and the lowest template brightness (Evdokimova et al , 2023). Moreover, the information
should correspond to those engraving mode values, which will be further used for manufacturing the product. The laser machine operator sets up such values either based on the work experience or takes them from well-known sources, for example, the range of rational values of Pi and V for beech wood, providing the reproduction of the whole range of the possible tone of the surface engraved (from light to dark), is given in Yakimovich et al , 2016.
In contrast to half-tone images, two template design options are possible when engraving mosaic images – based on the known original, for example, embroidery on fabric (Lungu et al., 2022) and the template made by a designer in computer programs. In both cases, the designer needs to know the whole color visual range of the surface to be engraved – from the wood natural color to the tone limit corresponding to it – when the further increase in the absorbed power Wp results not in the surface darkening but in its lightening (Kudela et al., 2019). Since the color is defined by the absorbed power, which depends on the processing mode - Pi, V, l, R, and N factors - for the designer’s convenient work, it is necessary to minimize the number of variable factors using the rational values of most of them. We believe it is practicable to decrease the number of variable factors to one, selecting the template resolution N as such. It can theoretically vary from 0 up to 255 dpi or from 0 up to 100% of the black color of the monochromatic scale. In fact, the N range is even narrower since the minimum N value is defined by the natural color of the wood species and the maximum one – by its tone limit. At the same time, a definite color of the engraved surface corresponds to each N value at constant values of other factors.
Samples of six wood species were used to check the proposed approach based on using the color visual range: aspen (Populus tremula), pine (Pinus sylvestris), larch (Larix decidua), spruce (Picea abies), beech (Fagus sylvatica) and birch (Betula populifolia).
The samples were shaped as blocks with the dimensions 2020300 mm, tangential section, and longitudinal direction of fibers. The surface was planed on a planer before engraving.
The samples moisture content: 12%.
Test strips were engraved on the samples using the grey computer template with resolution N uniformly increasing from 0 up to 255 dpi or from 0 up to 100% of black color (Figure 1). The samples with the engraved test strips are demonstrated in Figure 2.
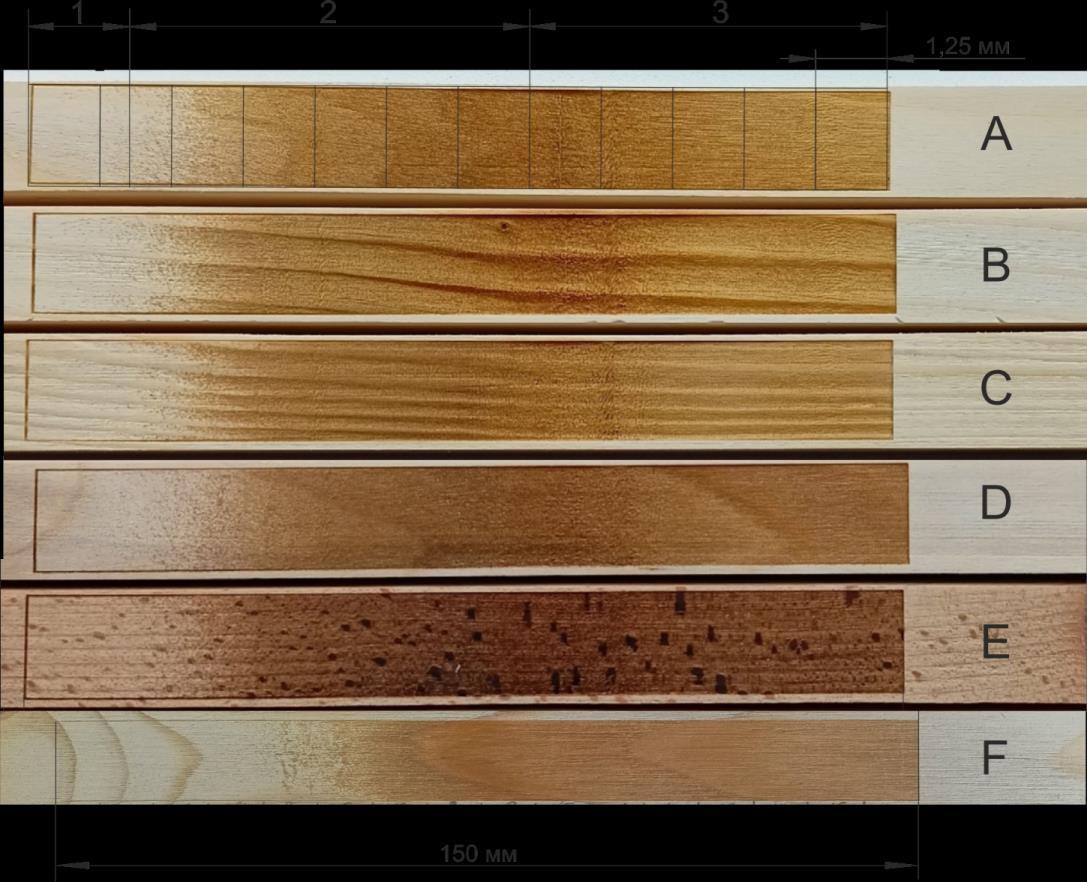
Fig. 2 The samples with the engraved test strips of the template: A) aspen; B) pine; C) larch; D) birch; E) beech; F) spruce; the distinctive regions are marked on the samples: 1 – the first region with the natural color preserved during the engraving; 2 – the second region with the active tone intensification; 3 – the third region with the tone lightening.
Equipment:
Laser CO2 marker with CNC GCC Synrad (USA), 30W.
The engraving power Pi was 4.5W, the speed V – 1000 mm/sec, the resolution R of the laser machine – 600 dpi, the focal distance l – 300 mm, the focal plane position coincided with the surface engraved.
The color of the modified wood is usually measured in Lab color coordinates (Dzurenda 2014, Kudela et al., 2019), in some works CMYK color models were successfully applied (Yakimovich et al., 2011, Zyrova et al., 2021) and RGB (Safin et al , 2015). It is believed that Lab color system is mostly appropriate to a human’s visual perception, therefore, we used Lab system in this work.
The color coordinates L, a, b and optic density D of the samples were measured in twelve points along the test strips with the step 1.25 mm, five measurements in each point. The measurements were made by spectrophotometer GretagMacbeth “Eye-One Pro” (Switzerland) (Figure 3) and processed in computer programs.
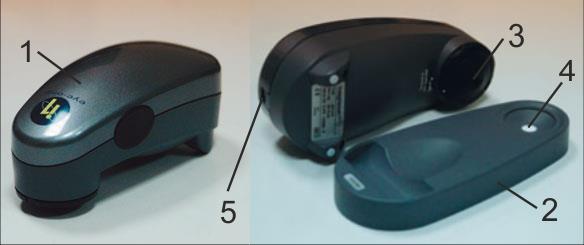
Fig. 3 Spectrophotometer GretagMacbeth “Eye-One Pro”: 1 – measuring device; 2 – platform; 3 – light source; 4 – white plate; 5 – Mini Display port for PC connection.
RESULTS AND DISCUSSION
The research results are given in the graphs (Figures 4, 5 and 6) and in Tab. 1, 2 and 3. The color coordinates L, a, b and optic density D change similarly in all wood species, some difference is observed in the beech sample.
Tab. 1 The results of measuring coordinates L, a, b, and template resolution N on the samples of different wood species
1 Aspen
2 Pine
3 Larch
4 Birch
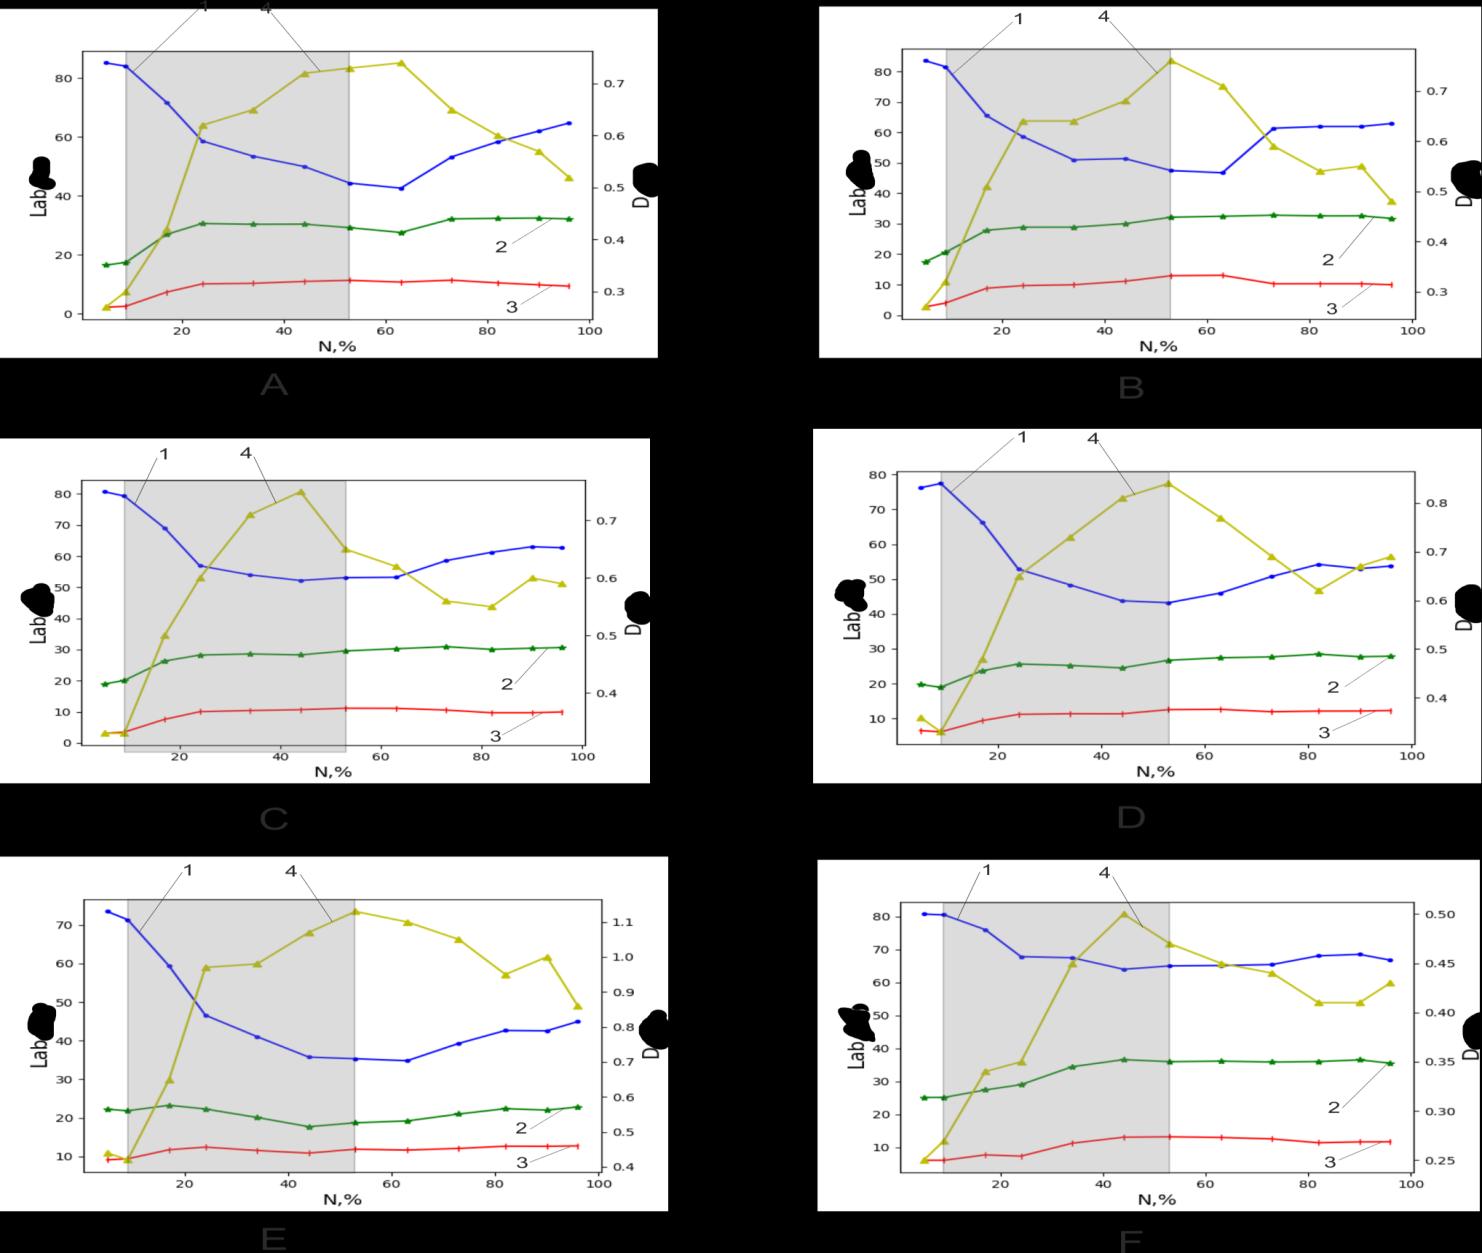
Fig. 4 Dependences of color coordinates L, a, b and optic density D on resolution N for the samples of different wood species: A) aspen; B) pine; C) larch; D) birch; Е) beech; F) spruce; 1 –dependence of L; 2 – dependence of b; 3 – dependence of a; 4 – dependence of D; the regions marked with color correspond to the second region of the samples in Figure 2.
Three distinctive regions can be pointed out in the graphs (Figure 4), which comply with the appearance of the engraved test strips (see Figure 2). The natural wood color is preserved in the first region; the wood is heated to the pyrolysis temperature. The gradual wood darkening up to the maximum value of optic density D is observed in the second region, and lightness L decreases to the minimum. The abovementioned indicates the increase in the absorbed power Wp and surface temperature, engraved with the template resolution N growth and, consequently, the pulse frequency f and average power Pc according to the expressions (1) and (2). Some tone lightening is observed in the third region due to the light reflection by the wood carbonized surface (Kudela et al., 2019). The result obtained coincides with the results of works described in Yakimovich et al., 2016; Jurek and Vagnerova 2021; Evdokimova et al., 2023.
The second graph regions marked with the tone in Figure 4 are of practical importance for image engraving, as it is possible to control the color and adequately
reproduce the original light-and-dark gradations and pseudo-volume on wood within them (Evdokimova et al., 2023).
Out of the investigated wood species, the maximum color change is observed in light species, which coincides with the opinions of Kudela et al., 2019, and the authors of some other papers.
Tab. 2 The maximum changes in color coordinates L, a, b in the second region.
Out of the color coordinates L, a, b the lightness L mostly contributes to the color change E during the engraving of wood species investigated (Tab. 2).
Where: L – lightness change relative to the initial one, a – change in the coordinate a, b – change in the coordinate b.
The coordinates a and b change to a lesser extent than the lightness. Nevertheless, they characterize the color gradation (Petutschnigg et al., 2013, Vidholdova et al , 2017, Jurek and Vagnerova 2021). In our case, the values of the color coordinates a and b increase with the increased template resolution N and, consequently, the absorbed power Wp (Figure 5) that indicates the color shift of most wood species investigated in this paper and poplar wood (Li et al , 2018), to the red-and-yellow region. On the beech sample, the value of the color coordinate slightly increases and coordinate b – decreases, the color shifts to the black region. For the beech, the result in the character of the change in the values of a and b and the range of values in general coincides with the results in Petutschnigg et al., 2013; Vidholdova et al , 2017; Kudela et al , 2019; Jurek and Vagnerova 2021. Some deviations in numerical values can be explained based on Petutschnigg et al., 2013. Its authors demonstrated that with the simultaneous change in two factors of the processing mode, namely, the pulse power Pi and resolution R of the laser machine, for beech the coordinate a can either decrease or increase and the coordinate b decreases differently
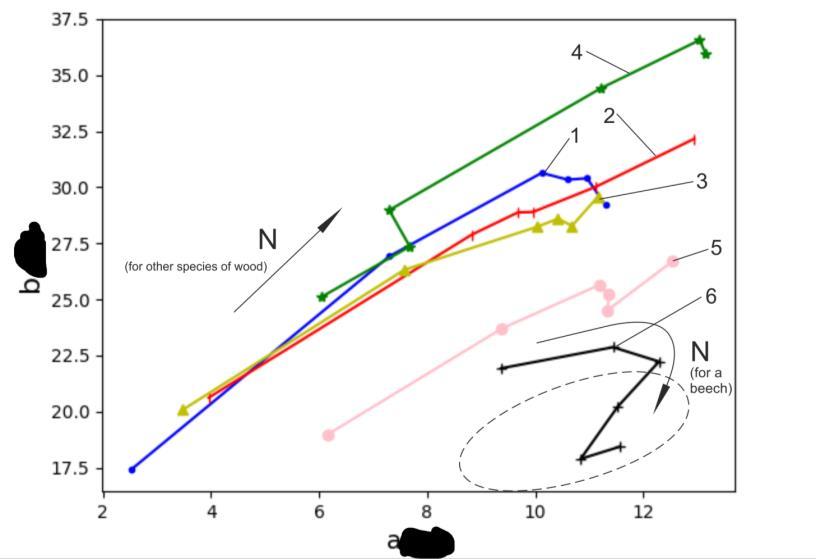
Fig. 5 The change in the values of the color coordinates a and b in the region 2 with the template resolution N increase for the samples of different wood species: 1) aspen (- • -); 2) pine (-|-); 3) larch ( -); 4) spruce (-*-); 5) birch (- -); 6) beech (-+-). The region of the values of coordinates a and b for the beech wood processed by the laser is rounded with the dotted line based on the research results in Petutschnigg et al. 2013.
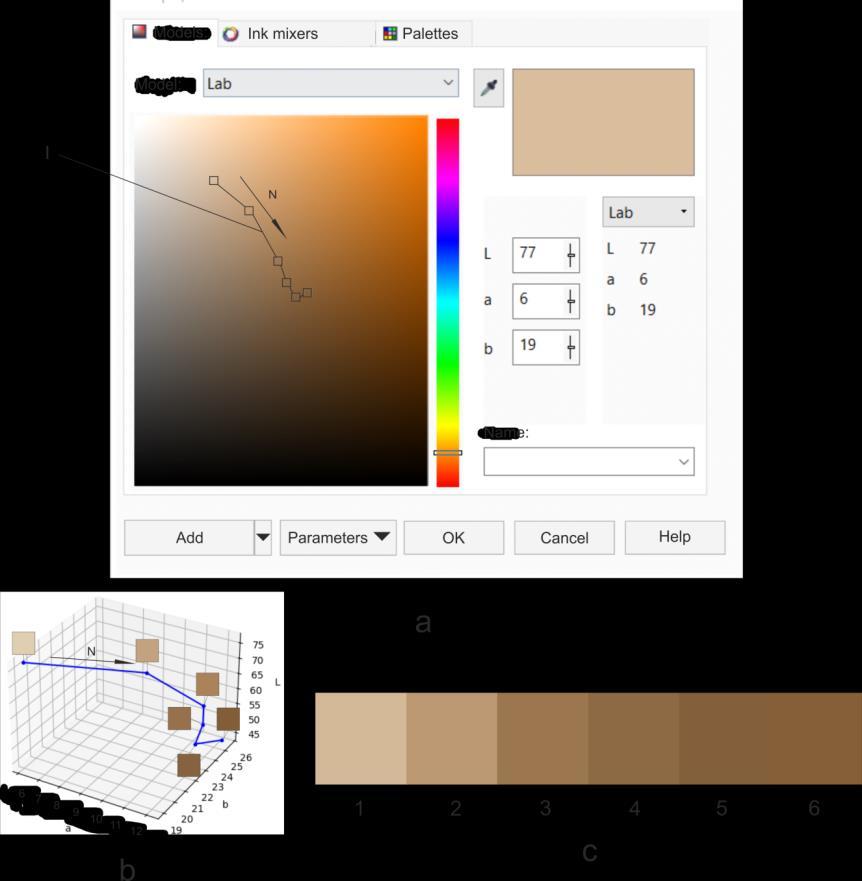
Fig. 6 The change in the integrated colorimetric color index E and color visualization depending on the template resolution N for the birch wood sample: a – the birch wood color change in Lab color range; b – the graphic depiction of the change in the integrated colorimetric index E; c – color discretization; 1-6 – the color number; I – the curve of wood colors in the red-and-yellow spectrum of Lab system.
Using CorelDRAW, it is possible to visualize the whole wood color range by the color coordinates L, a, b – from its natural color, corresponding to the upper left square of
the line 1 in Figure 6, a, – to the tone limit, corresponding to the lower right square of the same line. For convenient color selection, it is advisable for a designer to discretize the color gradient, making the gaps between the gradient regions. The discretization step can be found based on the value of Е , using the proposal formulated by Allegretti et al , 2009 stating that the visually perceived beech wood color change occurs at 12 Е . It can be assumed that this is also true for other wood species. The points are marked in the graph of Е dependence on resolution N (Figure 6, b) and the color discrete sequence corresponding to these points is given in Figure 6, с.
The discrete sequence obtained was used to prepare the mosaic pattern (Figure 7).
An image of a traditional Chinese dragon was selected as the template sketch. Chinese dragons play an important role in Chinese culture and mythology. They symbolize power, wisdom, and fortune. In contrast to Western dragons, Chinese dragons are usually depicted as kind and well-minded creatures able to control water, rain, and rivers.
A Chinese dragon is often associated with the Emperor’s power and is believed to be the people’s defender. According to legends, they can bring fertility and prosperity and act as ancient knowledge keepers.
Eberhard, 1952, pointed out that according to Chinese tradition, dragons can have different forms, but they are more frequently depicted with long bodies, horns, and bird’ feet. They are one of the main symbols of the Chinese New Year festivities and are also used in different art forms, such as painting, sculpture, and calligraphy.
Using the pattern mosaic elements allows for marking the dragon’s scales and imitating its movement due to the different gradations of the element color.
The pattern is made in two variants – with the key line of each element (Figure 7, а) to enhance the contrast and without the key line to soften the contrast (Figure 7, b). The digits on individual elements (Figure 7, с) correspond to the gradations of the birch wood color discrete sequence (see Figure 6, с). The colors from 1 to 5 are used in Figures 7, а and 7, b since the fifth and the sixth colors visually merge. The black-and-white image template is given in Figure 7, d. The maximum and the minimum values of the template element brightness are set up according to the boundary values of the birch wood lightness L in the region 2 (see Figure 4, а and Tab 1).
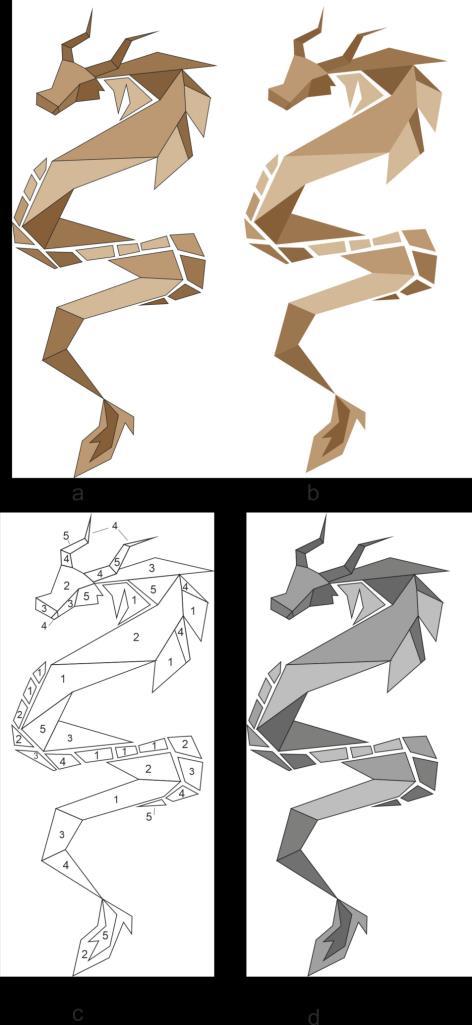
Fig. 7 Images: a – the colored pattern with tone regions with the key line; b – the colored pattern with tone regions without the key line; с – the color number of the elements in Figures 7, а and 7, b; d – the black-and-white template of the image in Figure 7, а.
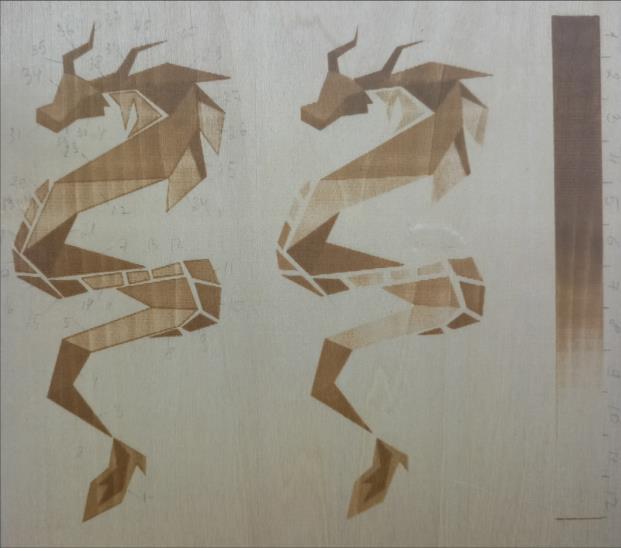
The comparison of the color coordinate values of the corresponding regions of the engraved image and original is given in Tab. 3.
The images were engraved on birch wood (Figure 8). The expert assessment of the aesthetic value of the images produced following the technique described in Chernykh et al., 2022, demonstrated their equivalence. The contrast, image integrity, and visibility of small elements were taken into account during the expert assessment.
A slight difference in the integrated color coordinate ΔE between the corresponding elements of the original patterns and engraved images (Tab. 3) gives the ground to state that the colors of the mosaic original and engraved image match, and the method worked out is practicable.
To achieve the positive result, it was necessary to combine the knowledge of a designer, a research engineer and a laser machine operator. The practice of combining their competences in one specialist within the bachelor and master study programs “Technology of material artistic processing” is known (Chernykh, M. 2019).
Tab. 3 Values of the color coordinates in the regions of patterns and engraved images
Object Color coordinates
Engraved image with the key line, Figure 8, а
Engraved image without the key line, Figure 8, b
Note: Е0 – the integrated color coordinate of figures in each region number; Еi – the integrated color coordinate of each engraved image region number respectively.
CONCLUSION
In recent years, the tendency to increase the number of works with the practical application of the results of color investigation during wood laser engraving has been observed. Applying the research results in practice dictates the need to combine the efforts of a designer and laser machine operators' efforts. On the one hand, for successful work, a designer needs information about the color range obtained from one or another wood species during laser engraving. On the other hand, a laser machine operator needs to know the processing modes, providing the colors set up by the designer on the wood.
The method of designing mosaic images for further laser engraving on wood is proposed, considering the wood coloristic capabilities and the engraving mode.
The method is based on revealing the color range of the wood to be engraved based on the results of the preliminary engraving of the test template with smoothly increasing resolution from the minimum to the maximum one, i.e., from 0 up to 255 dpi or from 0 up to 100% of the black color of the monochromatic scale. The species color range is fixed using a computer program, for example, CorelDRAW, following which a designer selects the colors of each region of the mosaic pattern and forms the computer template. The matching of the original and engraved image colors is achieved.
REFERENCES
Allegretti, O., Travan, L., Cividini, R., 2009: Drying techniques to obtain white Beech. Wood EDG Conference, 23rd April 2009, Bled, Slovenia. http://timberdry.net /downloads/ EDGSeminarBled/Presentation/EDG.
Babiak, V, Kubovsky, I., Mamonova, M. 2004; Farebny priestor vybranych domacicn drevin [Colour space of the selected domastic species]. In Interaction of wood with various from of energy. (Eds.: Kurjatko, S.): Zvolen: Technical University in Zvolen, p.113-117.
Chernykh, M., Kargashina, E., Stollmann, V. 2018. The use of wood veneer for laser engraving production. Acta Fac. Xylologiae Zvolen, 2018, 60 (1), 121-127. https://doi.org/10.17423/afx. 2018.60.1.13
Chernykh, M., Research work of students., 2019. Design. Materials. Technology. 4 (56) 2019б 70-72.
Chernykh, M., Yapparova, E., 2012. Metods of designing raster patten model in the process of wood laser engraving. Design. Materials. Technology. 2012. 2(22). 78-81.
Chernykh, M., Zykova, M., Stollmann, V., Gilfanov, M., 2022. Iufluence effect of wood laser engraving mode on aesthetic perception of images. Acta Fac. Xylologiae Zvolen, 2022, 64 (2), 87-96.
Dzurenda, L., 2014. Colouring of beech wood during treatment using saturated water steam. In Acta Fac. Xylologiae Zvolen 56 (1): 13-22.
Evdokimova, A., Chernykh. M., Gilfanov, M., Stollmann, V., 2023. Automation of tenplate correction algorithm for quality improvement of pseudo-3d engraved images. Acta Fac. Xylologiae Zvolen, (2); 63-76, 2023. https://doi.org/10.17423/afx. 2023.65.2.06
Gochev Z., Vitchev P., 2022.Colour modifications in plywood by different modes of CO2 laser engraving. Acta Fac. Xylologiae Zvolen, 2022, 64 (2), 77-86.
Gurau, L; Petru, A., Varodi, A., Timar, M.C., 2017. The Influence of CO2 Laser Beam Power Output and Scanning Speed on Surface Roughness and Colour Changes o of beech (Fagussylvatica), BioResources 2017, 12, 7395-7412.
Jurek, M., Vagnerova, R., 2021. Laser beam calibration for wood surface colour treatment. European Journal of Wood and Wood Products 79(5): 1097-1107. https://doi.org/10.1007/s00107-021-01704-3
Kubovsky, I., Kacik, F., 2013 Changes of the wood surface colour induced by CO2 laser and its durability after the xenon lamp exposure. In Wood Res-Slovakia 58 (4)581-590.
Kudela, J., Reinprecht, L., Vidholdova, Z., Andrejko, M., 2019. Surface propertiec of beech wood modified by CO2 laser. Acta Fac. Xilologiae Zvolen 61(1): 5-18, 2019. https://doi.org/10.17423/afx.2019.61.1.01
Li, R., Xu, W., Wang, X.A., Wang, C., 2018. Modeling and predicting of the color changes of wood surface during Co2 laser modification, In J. Clean. 183: 818-823.
Lungu A., Timar M., Beldan E., Georgescu S., 2022, Adding Value to Maple (Acer pseudop ltanus) Wood Furniture Surfaces by Different Metods of Transposing Motifs from Textile Heritage. Coatings.2022, 12.1393
Petutschnigg A., Stockler, M., Steinwenden, F., Schnepps, J., Gutler, H., Blinzer, j., Holzer, H., Schnabel, Th., 2013. Laser Treatment of Wood Surfaces for Ski Cores: An ExperimentalStudy. In Advances in Materials Sciecse and Engineering, Volume 2013 (11), Article ID 123085, pp 1-7, ISSN: 1687-8434 (Print), ISSN: 1687-8442 (Online), https://doi.org/10.1155/3013/123085
Safin, R., Akhmetova, A., Safina, A., Stepanova, T., 2015. Thermomodification of wood materials. Bulletin of the Technical University 2015. T 18. No.22. pp.112-117.
Vidholdova, Z., Reinprecht, L., Igaz, R., 2017. The impact of laser surface modification of beech wood on its color and occurrence of molds. BioResources, 12 (2), 4177-4186.
Wolfram Eberhard, A history of China / Wolfram Eberhard. - Welwyn Garden City, Herts.: The Alcuin Press, 1952. - P. 374
Yakimovich, V., Chernykh, M., Stepanova, A., Siklienka, M., 2016. Influence are selected laser parameters on quality of images engraved on the wood. Acta Fac. Xylologiae Zvolen, 5892): 45-50. https://doi.org/10.17423/afx.2016.58.2.05
Zykova, M., Kasimova, V., Chernykh, M., Stollmann, V., Evstafieva, G., 2021. Metod of computer template adjusment for wood laser ebgraving. Acta Fac. Xilologiae Zvolen 63(2), 2021. 85-92. https://doi.org/10.17423/afx.2021.63.2.07
ACKNOWLEDGMENT
This publication was created with the financial support of the project: Comprehensive research of mitigation and adaptation measures to diminish the negative impacts of climate changes on forest ecosystems in Sovakia (FORRES), ITMS: 313011T678 (100%) supported by the Operational Programme Integrated Infrastructure (OPII) funded by the ERDF.
AUTHORS’ ADDRESSES
Mikhail Chernykh, Prof. DSc. Kalashnikov Izhevsk State Technical University, Department of Industrial and Artistic Processing of Materials, Izhevsk, 426069, Studencheskaya, 7, rid@istu.ru
Alina Korepanova, student, Kalashnikov Izhevsk State Technical University, Department of Industrial and Artistic Processing of Materials, Izhevsk, 426069, Studencheskaya, 7, korepanovvalina@gmail.com
Ekaterina Maksimova, student, Kalashnikov Izhevsk State Technical University, Department of Industrial and Artistic Processing of Materials, Izhevsk, 426069, Studencheskaya, 7, flin.neison@gmail.com
Vadim Sevryugin, Prof. DSc. Kalashnikov Izhevsk State Technical University, Department of Industrial and Artistic Processing of Materials, Izhevsk, 426069, Studencheskaya, 7, sevryuginvadim@yandex.ru
Vladimir Stollmann, Assoc. Prof. Technical University in Zvolen, Faculty of Forestry, Department of Forest Harvesting, Logistics and Amelioration T. G. Masaryka 24, 960 53 Zvolen, Slovak Republic, stollmannv@tuzvo.sk
Maxim Gilfanov, Director of LLC “Synergy”, Izhevsk, 426063, Karlutskaya embankment, gravirovkarf@ya.ru
ACTA FACULTATIS XYLOLOGIAE ZVOLEN, 66(2): 103 113, 2024
Zvolen, Technická univerzita vo Zvolene
DOI: 10.17423/afx.2024.66.2.09
ALTERNATIVE DESIGN CREATION
Marián Ihring – Simona Hanes
ABSTRACT
The paper is focused on using design processes in furniture creation as a mediator to support women'sphysicalandmentalhealththroughreligioussymbols,specificallytheVirginMary. In the context of the ongoing development of alternative design and its societal impact, this research aims to significantly contribute to understanding social issues through new design approaches. The results will provide designers with visually comprehensible, graphically refined drawing studies, physical models with material tests, and fully functional creations as reference models for practical solutions. Additionally, the article reviews the issues that the authors rely on in their creative and artistic research and presents an artistic-scientific hypothesis. Through specific examples, the authors aim to clarify and interpret the results of their study, grounded in authentic creation.
Keywords: artdesign; subculture; antropomorphy; social probe; women.
INTRODUCTION
In its contemporary iteration, design transcends its origins as a functional discipline and emerges as a dynamic force at the intersection of art, science, and culture. As a hybrid practice, design operates not only as an aesthetic pursuit but as a conduit for socio-political commentary, cultural expression, and technological innovation. This transformation aligns design with a broader epistemological framework that integrates creativity, research, and critical analysis, challenging the traditional boundaries that once confined it to either form or function. As such, design is increasingly recognized as a powerful tool for reflecting on and engaging with the complexities of modern society.
The evolution of design reflects an ongoing shift towards interdisciplinarity, with practitioners drawing upon diverse fields to inform their creative processes. This shift aligns with broader theoretical frameworks such as posthumanism and transdisciplinarity, which emphasize the dissolution of rigid disciplinary boundaries in favor of a more integrated, relational approach to knowledge production. In this context, design is not merely a reflection of cultural norms but a space for active experimentation and reimagining social realities. Posthumanist theories, forinstance,critiquethetraditionalhuman-centricparadigm by integrating effect, materiality, and non-human elements into the discourse, thereby expanding the design’s scope to include ecological and technological concerns (Burnard, 2021).
1 a

interpretation of the subject, 1 b
legs.
Source: https://en.wikipedia.org/wiki/Piet%C3%A0_%28Michelangelo%29
Historically, religious motifs, particularly within Western art and architecture, have served as potent symbols of cultural values and collective identities. The Pietà, a depiction of the Virgin Mary mourning over the dead body of Christ, is a particularly salient example of how such motifs have been used to convey themes of suffering, piety, and maternal grief. Originating in the late Middle Ages and popularized in Gothic art, the Pietà underwent significant transformation, most notably in Michelangelo’s rendition, which infused the motif with a heightened emotional resonance and formal innovation. Michelangelo’s version, drawing on both Gothic and Renaissance styles, is renowned for its delicate balance of agony and serenity, symbolizing a moment of profound emotional and spiritual reflection. The Pietà’s endurance as a cultural symbol attests to its ability to resonate across historical and cultural contexts (Burnard, 2021)
In contemporary design, such motifs offer fertile ground for re-interpretation, especially when examined through the lens of modern socio-political discourse. The motif of the Virgin Mary, often associated with humility, purity, and suffering, has been reexamined through feminist theological critiques that challenge traditional interpretations of her role in Christian iconography. These critiques emphasize the Virgin’s dual representation as both an icon of purity and a symbol of patriarchal oppression, sparking debates about gender, power, and religious orthodoxy in contemporary culture (Zhang, 2024). This interrogation of historical narratives aligns with a broader trend in design that seeks to disrupt and reconfigure traditional power structures, thereby positioning design as a medium for cultural critique.
This study situates design within this evolving discourse, exploring its capacity to recontextualizetraditionalreligiousandculturalsymbolsinwaysthatspeaktocontemporary social issues, such as gender inequality, social justice, and environmental sustainability. By examining design's role as both a reflection of and a challenge to dominant cultural narratives, this research underscores the potential of design as a transformative practice, capable of influencing not only aesthetics but also the cultural and political landscapes in which it operates.
The convergence of historical motifs and contemporary social critique in design highlights its ongoing relevance as a means of exploring and negotiating complex cultural identities and societal challenges. This interdisciplinary approach offers valuable insights into how design can shape and be shaped by the forces of social, political, and technological change, making it a crucial area of study for both practitioners and scholars alike. The
replacement of Jesus's body with that of a woman in the design metaphorically represents nurturing and vulnerability, themes that resonate with users' perceptions of maternal roles. This symbolic layer enhances the furniture's role beyond functionality, aligning with Burnard et al. (2021)'s exploration of posthumanist theories in design.
MATERIAL AND METHODS
In the context of continuous alternative design development and its societal impact, this work aims to significantly contribute to understanding social issues through innovative approaches in (art)design.Theorganic form ofthe element drawsinspirationfrom theVirgin Mary’s figure, specifically her portrayal in the Pieta sculpture, symbolizing devotion and compassion. In this design, the body of Jesus is replaced by that of a woman, who becomes the user of the product. The womb is stylized as a central motif, symbolizing refuge, nurturing, and vulnerability.
The design process incorporates advanced 3D printing technology, highlighting its role as an innovative medium in art and design. The initial trial version of the product was crafted using clear filament in a 3D printer, producing an ethereal, transparent object. The use of clear filament conveys symbolism, as the womb appears both present and invisible, echoing the themes of spirituality and the intangible. This transparency allows the inner light integrated into the structure to shine through, transforming the object into both functional furniture and ambient interior lighting.
Fig. 1 b
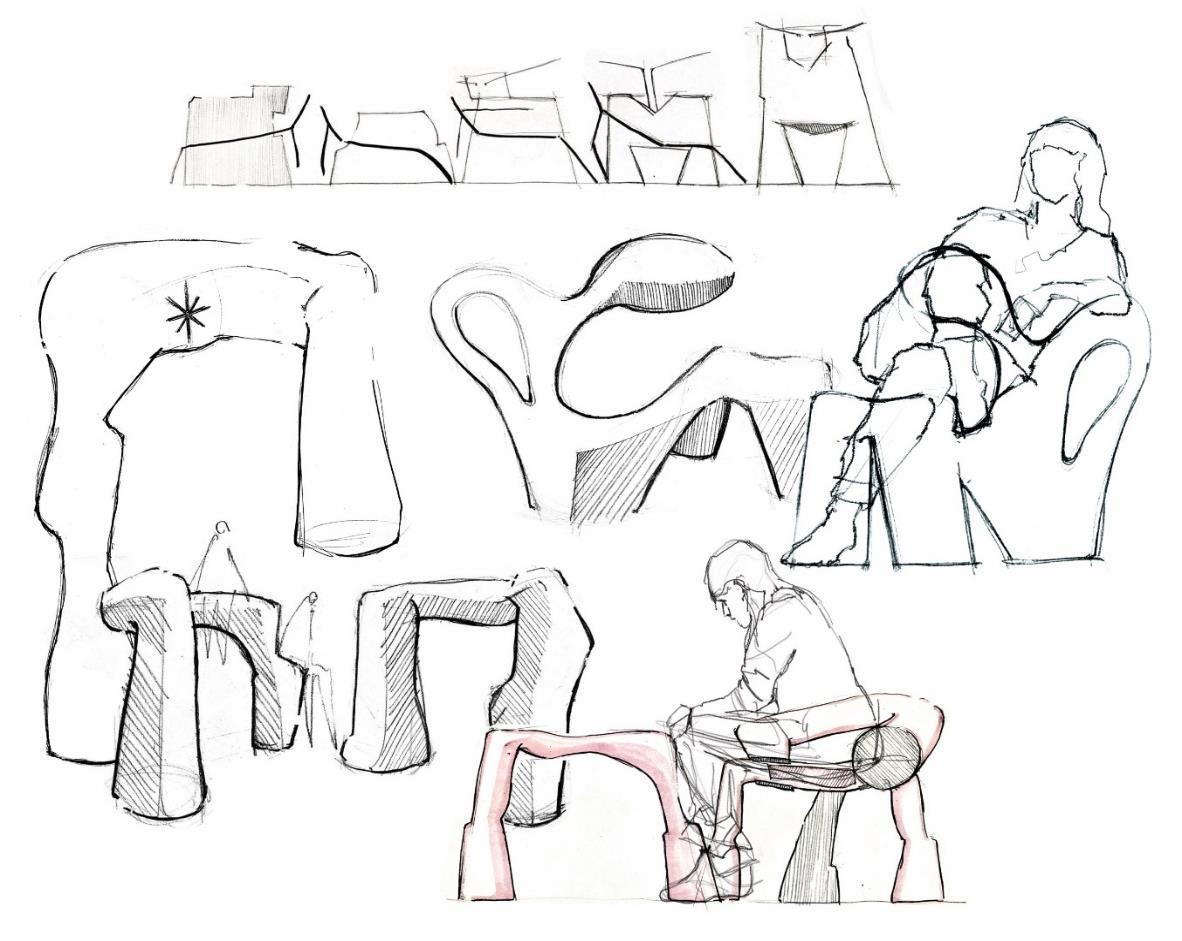
Fig. 2 b
2 d
Fig. 2 c
Fig. 2 a, b, c, d: 2 a - Initial ideas with the same positioning of the user as in Pietà, 2 b - a stylized and shaped female womb for the typology of the chair, 2 c - additional segments of backrests and armrests, 2 d - anthropomorphic shaping of the Virgin Mary for the seating design.
3D printing as a material process is central to this work, allowing for the creation of complex organic forms that would be difficult to achieve with traditional manufacturing methods. In this case, the use of filament material allows for precision and customization, making it possible to experiment with different forms, textures, and symbolic elements. The clear filament represents the spirit or soul, suggesting that while the object exists physically in the space, it also carries a deeper, invisible presence. (Fig. 3 b) In art and design, 3D printing has revolutionized how designers can integrate symbolic meanings into objects, as thelayer-by-layeradditiveprocess provides endless possibilitiesforcustomization,allowing for intricate textures, shapes, and visual effects that align with the designer’s conceptual vision.
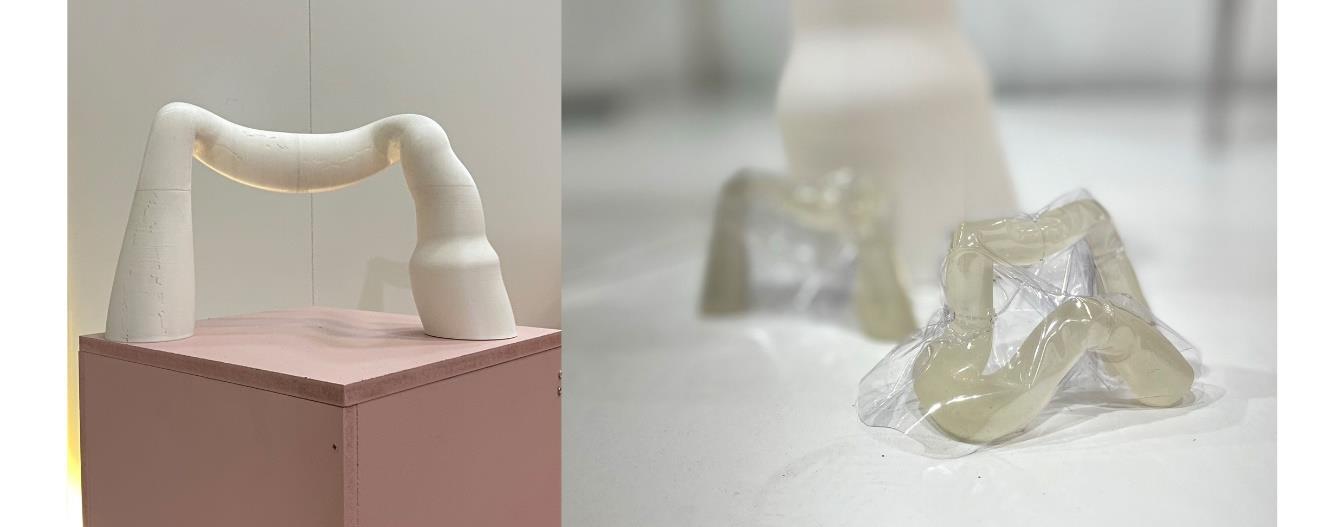
3 a
Fig. 3 a, b: Shape-material experimental test scale models.
Fig. 3 b
The second experimental model utilized white filament, which unintentionally developed surface cracks during the printing process (Fig. 3 a). These cracks, which resemble disrupted skin tissue or stretch marks (striae), introduce an additional layer of meaning, linking the object to the physical experiences of women, such as pregnancy, puberty, and body transformation. The imperfections caused by the 3D printing process symbolize the realities of the human body, emphasizing the physicality and vulnerability of the womb Following these experiments, a scale model was developed using steel wire and insulation foam to simulate the production method. Upholstery filling material and fabric were selected for their aesthetic and structural properties. However, this version faced challenges with balance and stability, leading to the addition of legs for reinforcement.
3D printing played a crucial role in bringing the concept to life, offering both technical flexibilityanda deepwellofsymbolicmeaning.Bylayeringmaterialinanadditive process, the design gains a tactile, almost organic quality that resonates with the idea of the womb and the maternal. This innovative technology allows designers to push the boundaries of form and function, using digital precision to create objects that resonate with human experience, emotion, and societal issues. The clear and white filaments, with their symbolic transparency and imperfections, enable the furniture to act as a vessel of both physical utility and conceptual depth.
In the accompanying exhibition, the product is not merely presented as furniture but asaworkofartthat engageswiththeaudienceon multiplesensorylevels. Acarefulselection of venue, light projection, and evocative audio tracks enhance the immersive experience, creating a dialogue around themes of mental and physical health, vulnerability, and the role
of women in society. The exhibition space, chosen for its symbolic resonance, amplifies the visual impact of the furniture, with light projections and abstract audio creating an environment that is both contemplative and thought-provoking. The integration of 3Dprinted elements into the exhibition reflects the potential of this technology not only as a tool for creating objects but as a medium that embodies complex ideas, emotions, and social critiques.
MATERIALS AND METHODS
The methodologies drawn from existing literature reveal that alternative design research often utilizes approaches like Participatory Design (Schuler and Namioka, 1993) and User-Centered Design (Norman, 2013), which emphasize active user involvement throughout the design process. Feminist Design approaches (Marcus and Gould, 2000), prioritizing gender-sensitive perspectives, also align with this study's objectives. However, while Feminist Design informs only one part of our perspective, it does not constitute the primary aim of our research, as our focus is on the mediating role of furniture. Rather than prioritizing a particular viewpoint, such as feminist or Catholic perspectives on women’s social status and the perception of the female body in art, our work seeks a balanced, exploratory approach.
Building upon these established methodologies, our research incorporates Symbolic Interactionismtoexaminethenuancedinteractionsbetweenusersandthedesignedfurniture. Unlike traditional design methods that focus solely on functionality, our approach emphasizes the symbolic significance of religious motifs particularly the Virgin Mary as a mother figure to foster emotional and psychological well-being.
Additionally, insights from Haptics and Vision in Architecture and the Haptic Labs principles underscore the importance of sensory engagement in design. These frameworks have guided our approach, especially in creating tactile and visual elements that foster a multi-sensory experience. Furthermore, Designing through Making: Exploring the Simple Haptic Design Space emphasizes the role of hands-on, iterative design as a pathway to understanding user interactions through haptic feedback. Inspired by this approach, our research adopts a tactile, exploratory process in which user feedback and iterative prototyping play a crucial role in refining the furniture’s design. This aligns with our objective of creating furniture that engages users both physically and psychologically, connecting them more deeply to the piece.
Employing a mixed-methods approach integrating both qualitative and quantitative techniques this study aims to explore how the design process in furniture creation can mediate and support women’s physical and mental health. By drawing on tactile principles, symbolic themes, and sensory-centered design, this research seeks to position the furniture as a conduit for fostering inclusivity, challenging societal norms, and addressing issues related to gender and identity through thoughtful design.
The research methodology is structured into two integral parts, each designed to provide a comprehensive understanding of the researched element and its potential impact. The first part involves a virtual gallery, offering various formats for presenting the product. This digital platform serves as a dynamic space where the (future) user can engage with the furniture, explore different versions, delve into the philosophy behind the work, and grasp the overall mission of the design. Through this virtual gallery, users are afforded a multifaceted introduction to the product, transcending traditional exhibition formats. Complementing the virtual gallery is the physical exhibition, an immersive audio-visual
experience carefully crafted to offer users a tangible encounter with the artwork. Within this space, users not only observe the product but actively participate in its exploration. The interactive nature of the exhibition allows (future) users to test the furniture, gaining firsthand experience of how the element functions beyond the confines of a private interior. This approach aims to bridge the gap between the digital representation and the tangible reality of the product, providing a more holistic understanding.
To further enrich the research, additional efforts are focused on capturing user responsesto theseatingexperience.This involvesanuancedexplorationofhowthefurniture affects users from both a haptic and ergonomic standpoint. Understanding the sensory and physical interactions users have with the seating is crucial for refining and optimizing the design. Moreover, the research delves into the emotional aspects, probing whether sitting on thefurnitureelicits asenseof security and comfort. These user responses contributevaluable insights, shaping the ongoing development of the project and informing decisions related to material selection, form, and functionality. By combining the virtual and physical dimensions of the exhibition, as well as actively soliciting user feedback, the research methodology seeks to create a robust foundation for understanding the product's reception and its potential implications for users. This multifaceted approach aligns with the project's overarching goal of not only showcasing the design but also fostering a meaningful and interactive dialogue between the creation and its audience.
RESULTS AND DISCUSSION
To better understand the importance of social norms, body language semantics and gender dynamics in design, these principles can be effectively integrated into the creative process. A recent case study was chosen as a key inspiration for previous research demonstrating how design can challenge societal conventions, empower users and reflect deeper socio-cultural issues through innovation of form, space and material.
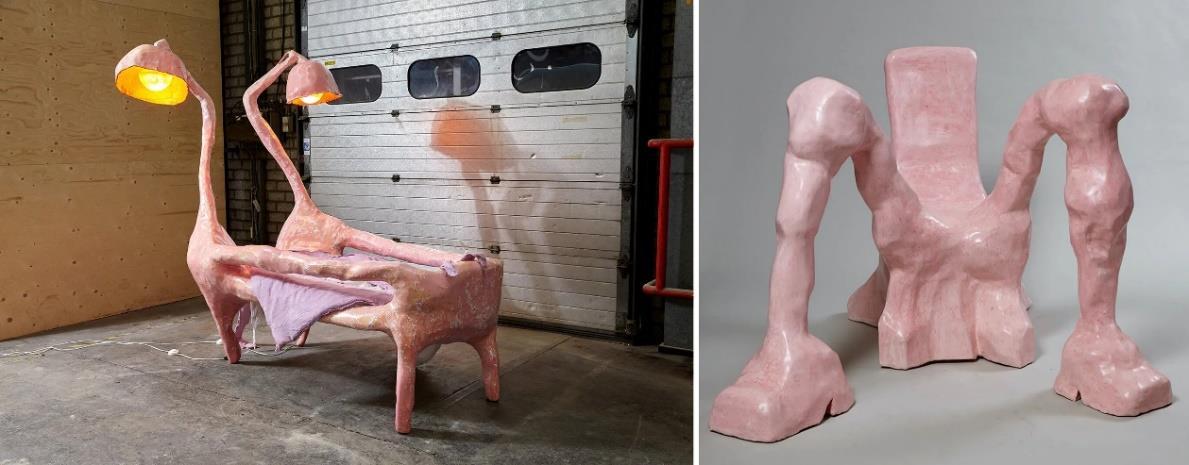
source: https://thedesignedit.com/deep-dive/reclaiming-the-female-body/
Anna Aagaard Jensen’s work exemplifies how socio-cultural issues can be interrogated through unconventional design installations that merge art and activism. Her series of art-design chairs, "Basic Instinct," (Fig. 4 a) challenges societal norms by encouraging women to reclaim physical space.Developedwithinthecontextofresearchinto female identity and kinesics (body language), these chairs highlight distinct postural differences between men and women in public spaces, with emphasis on how mainstream
culture perceives their body language. The design is intended to encourage women to adopt expansive postures, thereby rejecting the societal restrictions that often dictate their physical comportment. (Franck, K.A., Paxson, L., 1989)
The chairs feature anthropomorphic and biomorphic forms inspired by the female anatomy, particularly emphasizing feminine curves and softness. Jensen reinforces these symbolisms by employing a color palette derived from the natural blush tones of women’s cheeks and implementing uneven surface textures. These textures intentionally mimic the irregularities of human skin, such as stretch marks, celebrating imperfections and subtly challenging homogenized beauty ideals.
Jensen's work posits that through intricate details and makeup-inspired elements, these pieces manifest as "complex beings that are feminine, intelligent, and sexual at the same time." This multi-layered conceptual approach reflects the complexity of womanhood, surpassing conventional stereotypes. As such, these chairs serve not only as functional seating but also as artistic provocations that prompt discourse on body language, spatial dynamics, and the gendered expectations imposed by society.
Her creative process was deeply informed by her observations of gendered behaviors, particularly in televised media, where women’s body language is typically moderated based on external perceptions. Men, on the other hand, often exhibit instinctive, expansive postures, which Jensen seeks to address in her designs. "Basic Instinct" thus becomes a critical analysis of how social expectations influence women’s physical autonomy in public settings.
Further reinforcing her activist stance, Jensen expanded the collection with the "Dear Mother" (Fig. 4 b) bed, which symbolically portrays the act of childbirth and motherhood. This piece mimics the embrace of a mother and the female reproductive system, using caricature-like visual forms to evoke discussion about maternal themes. While the bed’s visual exaggerations may seem playful, they serve as an entry point for deeper reflections onthehistoricallyobscuredaspectsoffemininity,reproduction,andthetaboonatureofthese topics in contemporary art, society, and media. Both the bed and chairs, while designed as functional furniture, transcend their practical roles, embodying conceptual strength that challenges typical notions of domestic objects.
Jensen’sdesignmethodologyintegratestraditionalmaterialslikeresinandacrylicwith modern production technologies. However, her use of advanced fabrication techniques, such as digital modeling and CNC machining, pushes the boundaries of what functional furniture can convey. By employing these modern technologies, she underscores the timeliness and socio-political relevance of her work. The 3D printing of prototypes and models enhances precision, allowing Jensen to experiment with complex forms and surface textures that would otherwise be difficult to achieve through conventional methods. In particular, 3D printing offers the ability to produce organic forms layer by layer, which enhances the symbolic quality of the furniture pieces.
Her approach highlights how emerging manufacturing technologies, paired with conceptual rigor, can create design artifacts that are both visually and socially disruptive. The sculptural chairs and bed not only serve as practical objects but as symbols that invite critical reflections on gender dynamics, body politics, and societal constructs, thus positioning Jensen’s work at the intersection of design, activism, and artistic expression. UnlikeAnnaAagaardJensen’swork,whichprimarilyfocusesonreclaimingphysical space through expansive postures, our designs integrate symbolic elements that foster emotional connections. This dual focus on physical ergonomics and symbolic representation offers a more holistic approach to design for mental and physical health.
A comprehensive study was conducted to gather user feedback on the designed furniture, focusing on haptic and ergonomic features. Responses were collected from a sample of 100 participants, representing a diverse female demographic, through surveys and in-depth interviews. Key areas of feedback included comfort, aesthetic appeal, and emotional resonance with the design.
Quantitative analysis showed that 87% of respondents rated the ergonomic features as highly comfortable, emphasizing the effectiveness of the design in meeting physical comfort requirements. Additionally, 75% of participants reported an emotional connection to the aesthetic elements, highlighting the design’s ability to resonate on a symbolic and sensory level.
In an effort to create a fresh aesthetic and tactile experience, unconventional materials were chosen for upholstery, each selected for its unique, skin-like qualities. These materials, typically not used for upholstery, were specifically chosen to introduce a new look and feel that it challenges traditional perceptions of furniture design. By incorporating surfaces that evokesensationsofsmoothness,warmth,orevenrubberytextures,thedesignaimstoengage users through touch and redefine their sensory connection to the furniture.
Tab. 1 Material research analysis.
Skin-like material Percentage
Silk 43%
Latex 37%
Neoprene 15%
PVC Rubber 5%
As shown in Table 1, silk was the most preferred material, with 43% of respondents favoring its smooth and luxurious feel. Latex followed with 37%, providing a slightly rubbery texture that adds a unique tactile dimension. Neoprene was chosen by 15% of participants, offering a balance of flexibility and firmness, while PVC rubber was selected by 5%, appreciated by a smaller segment for its distinctive, cooler sensation.
For further study and research direction, the designed furniture piece a chair will be placed in its intended context, specifically within Catholic churches. This placement aims to capture additional responses and feedback from potential users in an authentic setting, allowing for a deeper understanding of how the design functions within its intended space and purpose.
CONCLUSION
Innovations inspired by human perception in the field of society and art are unique in many aspects. Their visuals are closest to us; we recognize them not only through the physical senses but also find beauty in their (im)perfection. Gender equality, as a method applied in design and art research, will be the most important task in design in the coming decades. Our research and creation focus on women as "living matter" and material. The female body symbolizes various concepts and ideas in the world of art and design, be it fertility, vulnerability, purity, or sensuality. We perceive the individual's position in society and the functioning of a person in their complexity as a source of inspiration on several levels. The research began with a first phase involving a methodology based on the creation of a database of anthropomorphic seat shapes and upholstery materials not commonly used in upholstery to ensure sufficient haptic comfort. The most interesting perspective of
inspiration is the fact that the structure of the material can be considered as materially programmed information about the human skin. The long-term goal of the project is the development of models and prototypes of furniture and materials that achieve the required functional, ergonomic, and visual-aesthetic properties of the "new sensibility" in shaping and execution based on the transfer of the feminine aspect. The objects thus become not only furniture but also artistic expressions and tools for discussing the language of women's bodies and social norms. The proposed project aims to question traditional gender stereotypes and confront the audience with social problems related to gender equality. Our vision is to simulate the human visually, artificially simulate his new unique parameters (including flaws), and transform them into an artistic form that enables the development of a new generation of products inspired by current social issues. Innovations inspired by the shapely female body are one of several paradigms that seek solutions to an ongoing social crisis. We assume that each such proposal will have its unique utility value, material composition, size, and artistic, and aesthetic character.
Design and art need alternative sources of inspiration primarily because they push the boundaries of creativity and bring new ways to reflect on the world around us. Influences such as cultural and social movements, philosophical ideas, spiritual currents, or abstract ideas allow creators to perceive the world differently. These alternative approaches allow designers and artists to disrupt established norms and explore new relationships between form, function, and meaning.
So what constitutes alternative inspiration? It can be drawing from marginalized subcultures, philosophical currents that challenge materialism, or conventional understanding of space and time. Inspiration can come from social phenomena, such as global movements for justice, inclusion, and equality, which designers transform into abstract forms or experimental projects
The result is a creation that goes beyond purely visual and functional values and that appeals to deeper emotional and intellectual levels. Such design is able to create space for reflection and polemic, thus opening new discussions about how we perceive the world and how we react to it. Thus, alternative inspiration is not only a departure from the usual but a meansforquestioningourexperiencesandbeliefsinaspace-timethatisconstantlyinmotion and transformation. This approach gives design and art the ability to reach and transform our thinking outsidetheusual frames of reality as creators,but also as viewersandusersthinking outside the usual frames of reality as creators, but also as viewers and users.
REFERENCES
Abadianb, K., Hamdiehd, M., Keshavarza, Z., Shamshiri Milanic, H., Nasiri, M., 2022. Sexologies, Spirituality and cultural factors impact on sexuality: A qualitative study, Elsevier Masson SAS, Vol. 31(4), pp. 302-310.
Adams R. G., Ernstes A. E.,Lucey, K. M., 2015. SociologyofSubculture: International Encyclopedia of the Social & Behavioral Sciences, Elsevier, 2015, pp. 637-642. ISBN: 9780080970875
Beňová, K., 2010. Žena v tradičnej kultúre Slovenska: menštruácia, panenstvo, materstvo (so zameraním na nečistotu a tabu), [Woman in traditional Slovak culture: menstruation, virginity, motherhood (with a focus on impurity and taboos)]. 3/2010 ANTROPOWEBZIN. ISBN 18018807 Available: http://www.antropoweb.cz/cs/zena-v-tradicnej-kulture-slovenskamenstruacia-panenstvomaterstvo-so-zameranim-na-necistotu-a-tabu
Bolin, A., Whelehan, P., 2009. Human sexuality: Biological, Psychological, and Cultural Perspectives. New York: ROUTLEDGE. ISBN 0-203-88923-1 Available: https://books.google.sk/books?id=qrPHYok19v8C&pg=PA32&redir_esc=y#v=onepa
Brown, C. S., Jewell, J. A., Tam, M. J. 2023. Gender: In R. Biswas-Diener & E. Diener, Noba textbook series: Psychology, DEF publishers, Pages 930-940 chromeextension://efaidnbmnnnibpcajpcglclefindmkaj/https://eastpsych.files.wordpress.com/2 011/08/textbook-noba.pdf
Burnard, P., Colucci-Gray, L., Sinha, P., 2021. Transdisciplinarity: Letting arts and science teach together. Curric Perspect 41, 113–118. https://doi.org/10.1007/s41297-020-00128-y
De Campos D, Buso L., 2021. The faces hidden in the anatomy of Michelangelo Buonarroti's Pietà in the Vatican. Acta Biomed. 2021 May 12;92(2): e2021044. https://doi.org/10.23750/abm.v92i2.9152
Delap, L., 2022. Feminismy – globálne dejiny [Feminisms – global history], Brno: Host, 2022. 376 p., ISBN 978-80-275-1079-5
Devon et al. 2004. Design Ethics: The Social Ethics Paradigm. International Journal of Engineering Education 2013).
Diamandis, H. P., Kotler, S., 2020. The Future Is Faster Than You Think, Publisher Simon & Schuster, 365 p., ISBN: 978-19-821-0966-0
Dimitrakaki, A., 2018. Feminism, Art, Contradictions. In e-flux Journal, 2018, n. 92. Available: https://www.e-flux.com/journal/92/205536/feminism-art-contradictions/ Elephant Art. 2019. Woman or object? Furniture and the Female Body, Elephant, Available: https://elephant.art/woman-object-furniture-female-body/ Franck, K.A., Paxson, L., 1989. Women and Urban Public Space. In: Altman, I., Zube, E.H. (eds) Public Places and Spaces. Human Behavior and Environment, vol 10. Springer, Boston, MA. https://doi.org/10.1007/978-1-4684-5601-1_6
Haptic Labs. (n.d.). Principles. Haptic Labs. Retrieved November 11, 2024, from Available: https://www.hapticlabs.io/principles
Herssens, J., Heylighen, A., 2008. Haptics and vision in architecture. Presented at the Sensory Urbanism Conference, Glasgow. Retrieved from ResearchGate: https://www.researchgate.net/publication/259464841_Haptics_and_Vision_in_Architecture
Korda, J. B., Goldstein, S. W., Sommer F. 2010. The Journal of Sexual Medicine,Volume 7, Issue 5, May 2010, pp. 1965–1975, https://doi.org/10.1111/j.1743-6109.2010.01720.x
Kulka, J., 2008. Psychologie uméní [Psychology of art]. Praha. Grada. ISBN 978-80-247-2329-7
Lloyd, P., 2009. Ethical imagination and design. Design Studies. 30(2), ISSN 0142694X. https://doi.org/10.1016/j.destud.2008.12.004
Marcus, A., Gould, E., 2000. Crossing the chasm: A review of participatory design theory. Design Issues, 16(3), 18–32. https://doi.org/10.1162/074793600750157709
Massey, A. 2022. World of art – Women in Design, New York: Thames & Hudson, 2022, 200 p., ISBN 978-80-0-500-20482-5
Mistrík, E., Haapanen, S., Heikkinen, H., Jazudek, R., Ondrušková, N. Räsänen, R., 1999. Culture and Multicultural Education. Bratislava. Iris. ISBN 80-88778-81-6
Monteiro, M. 2017. A Designer’s Code of Ethics. Mule. Available: https://muledesign.com/2017/07/a-designers-code-of-ethics
Owens, C., 1992. Beyond recognition: representation, power, and culture. Berkeley: University of California Press, p. 182. Available: https://books.google.at/books?id=Tn6PheSubWcC&lpg=PP1&hl=de&pg=PA180#v=onepage &q&f=false
Schaberg, J. 2006. The Illefitimacy of Jesus: A Feminist Theological Inerpretation of the Infancy Narratives, Expanded Twentieth Anniversary Edition. Sheffield Phoenix Press, 20. issue, 332 p., ISBN 978-1905048847
Smith, J., Doe, A., Roe, P., 2018. Ergonomic standards in furniture design. International Journal of Ergonomics, 45(2), 123–135. https://doi.org/10.1080/00140139.2018.1448275
Steen, M., 2015. Upon Opening the Black Box and Finding It Full. Science, Technology & Human Values. ISSN 0162–2439. https://doi.org/10.1177/0162243914547645
Zhang, L., Tao S., 2024. Integrating Sustainability into Contemporary Art and Design: An Interdisciplinary Approach. Sustainability 16, no. 15: 6539. https://doi.org/10.3390/su16156539
Wallace, W. E., 2000. Michelangelo, Tiberio Calcagni, and the Florentine “Pietà.” Artibus et Historiae, 21(42), 81–99. https://doi.org/10.2307/1483625
Wood, W., Eagly, A. H., 2002. A cross-cultural analysis of the behavior of women and men: Implications for the origins of sex differences, Psychological Bulletin, pp. 699–727 Available: https://psycnet.apa.org/record/2002-15487-002
ACKNOWLEDGMENT
This work was supported by the Slovak Research and Development Agency under the Contract no. APVV-21-0015
AUTHORS’ ADDRESSES
Doc. Mgr. art. Marián Ihring, ArtD.
Technical University in Zvolen
Faculty of Wood Sciences and Technology Department of Furniture and Interior Design
T. G. Masaryka 24, 960 01 Zvolen, Slovakia marian.ihring@tuzvo.sk
Mgr. art. Simona Hanes
Technical University in Zvolen Faculty of Wood Sciences and Technology Department of Furniture and Interior Design
T. G. Masaryka 24, 960 01 Zvolen, Slovakia simoonahanes@gmail.com
ACTA FACULTATIS XYLOLOGIAE ZVOLEN, 66(2): 115 123, 2024
Zvolen, Technická univerzita vo Zvolene
DOI: 10.17423/afx.2024.66.2.10
THE IMPACT OF DOOR LEAF PARAMETERS ON THE EFFICIENCY OF THE AUTOMATED TECHNOLOGICAL LINE
Dorota Michalak – Zdzisław Kwidziński – Marta Pędzik – Joanna Bednarz –Łukasz Sankiewicz – Bartłomiej Knitowski – Marcin Drewczyński – Tomasz Rogoziński
ABSTRACT
The automated intelligent technological line for the mass production of door leaves enables mass customization using unique QR codes. The IT control system dynamically adjusts the processingparameters to thecurrentlyprocesseddoorleaf,allowingthelinemodules tofinetune the settings. Door leaves categorized by colour, width and the presence of a rebate were tested in terms of efficiency. The time elapsed between the cycle completion on the line of two consecutive leaves in a series and the time changes depending on the product parameters are measured in the experiment. The results showed a significant impact of item classification on line efficiency. Colour sorting halves the takt time while sorting by width and the presence of rebates results in an efficiency increase of more than six times with the same technology and high quality.
Keywords: wooden door manufacturing; product classification; takt time; colour finish; door leaf width; door leaf rebate.
INTRODUCTION
The modern market for construction joinery is becoming increasingly demanding daily, emphasizing efficiency, sustainable development, and process optimization. Along with changing customer requirements, the range of products with non-standard features increases significantly. The consequence is the necessity to produce products in small batches orevensingleitems (PatelandShah,2014).Inthecaseofmanufacturingcompanies, customization is an effective solution in commercial competition and strengthening the existing competitive advantage (Zhao et al., 2018). It allows producers to increase customer satisfaction, retention, and, finally, loyalty (Kwidziński et al., 2022). To respond quickly to changing trends and consumer preferences, a company with a diverse product offering must implement optimal organization, planning and scheduling, and control of automated production lines (Patel and Shah, 2014; Taifa and Vhora, 2019).
Optimal resource utilization enhances the enterprise's competitiveness, reduces costs, and minimizes environmental impact. Decreasing energy consumption is becoming increasingly important, and efficient use of machinery and production lines is crucial to achieving this goal. Maintaining a short time in manufacturing operations is one of the crucial factors influencing production efficiency.
Maintaining a short time in manufacturing operations is one of the crucial factors influencing production efficiency.
Improvement of efficiency in the manufacturing industry should focus on shortening cycle times centered on the balance of man, machine, materials, methods, management, and environment, also called 4M 1E (Ebrahim et al., 2015). Even claim that the duration of the production cycle is one of the most important "economic and technical indicators" in assessing the production process's performance (Klarin et al., 2016). It is worth noting that (Taifa and Vhora, 2019) provide a systematic review of the various methods deployed for cycle time reduction, pointing out advantages to be achieved. Moreover, it outlines the relationship of critical time loss elements to existing production performance measures such as agility, fitness, flexibility, leanness, responsiveness, and sustainability (Ebrahim et al., 2015).
Ensuring the shortest possible production cycle requires conducting research and systematic production control. By analyzing the impact of various factors on production line efficiency, we can refine processes, minimize time and material losses, and increase overall productivity. Previous research showsthatvariable factorssuch as finish colour significantly affect processing time in door leaf production (Kwidziński et al., 2024). However, to gain a comprehensive understanding and further improve processing processes, it is necessary to expand the scope of analysis and consider additional factors influencing efficiency. In this context, our research focuses on increasing the analysis of the impact of various features on the efficiency of the TechnoPORTA production line. The study aimed to test the hypothesis that theorderofprocessed doorleaves differingin colour,width, andthepresenceof arebate affects line performance. In addition, identifying which of these variable factors is most significant in classifying parts during the production of door leaves on an automated customization line. The results obtained can be used to develop a strategy to optimize the production process by reorganizing it.
MATERIALS AND METHODS
The operational principle of the TechnoPORTA technological line
The TechnoPORTA line is designed for processing narrow surfaces of door leaves. It consists of segments, including the base edge milling module, pre-and post-processing edge milling module, edge band application module, press-down sections, corners, edge processing module, and rebate milling module. Each door leaf is marked with a QR code containing information such as cycle number, dimensions, finishing colour, family, model, hardware type, and other necessary specifications for processing adjustment flawless transportation. Before each piece is fed into the line, the posted QR code label is scanned, and with the information sent to the machines, the line settings are automatically adjusted. To finish, each door leaf must undergo at least three cycles on a TechnoPORTA line. The narrow top surface of the door leaf is processed in the first pass, and in the subsequent two passes, the narrow side surfaces are processed (Kwidziński et al., 2022). Each adjustment of processing parameters presents a challenge due to machine tool changeover. Changing the finishing colour of narrow surfaces, such as edge colour, between successive pieces requires additional timeforthetechnological lineto heat uporcool downthelamps to theappropriate temperature. The cooling process is not additionally assisted. Successively arranged door leaves with different widths necessitate a change in the positioning of bases on the machine, while transitioning from processing items without rebates to those with sealing grooves involves activating another unit of the TechnoPORTA line.
Tested material
Thestudy was conducted ondoorleaves with a panel structure, which is part ofregular production. The narrow surfaces were finished with a 1 mm thick ABS edge band. Four subgroups were examined. The first comprised elements with identical processing parameters, while the consequent three consisted of groups with elements having diverse line-setting requirements. For the tests, machining times were measured for 72 door leaves, each of which underwent all three machining cycles, resulting in 216 controlled cycles. Mixed sets were chosen so that the products differed only in one parameter affecting line settings at a time – colour, width, or alternating rebated, shown in Table 1, and their visualizations arepresentedin Fig. 1. Doorleafsamples from different groups were arranged alternately on pallets. Sorted sets had identical processing characteristics.


Research methodology
The time measurements used in the article were conducted at a constant line feed rate of 20 m/min. A stopwatch with an accuracy of 0.01 s was employed for precise time monitoring. The measurement procedure involved timing between the completion of processing subsequent products. The time measurement started when the first door leaf left
the line and ended when the subsequent door leaf left the line. As a result, for a series containing n elements, n-1 interval time measurements were obtained for the subsequently processed element from the TechnoPORTA line.
The measured times were categorized into four sets based on the characteristics of the door leaves: sorted – with identical processing parameters, with colour change, width change, and alternating with or without rebate. The measurements were used for calculations. Measurements during line downtime were excluded. Utilizing the formula for the arithmetic mean (1):
For each trial, the standard deviation was also calculated using the formula (2):
Where:
s – the standard deviation, n – the total number of elements in the set, ���� – the individual argument, �� – the mean.
The numbers for “sorted series in batches of 20 pieces” used in Figure 5 were calculated using the following formula (3):
Where:
D – the number of processed doors in h hours, h – the number of working hours,
���� – average time for sorted series,
��
���� – average time for unsorted series e – elements per pallet.
RESULTS AND DISCUSSION
The average takt time for the subsequent product to come off the technological line, depending on the door leaf variant tested is shown in Figures 2-4. In the series of sorted door leaves, the average time between the completion of processing of two subsequent items was 10.06 seconds. For products arranged alternately in terms of finish colours Milano 1 and Natural Oak, the average takt time was 17.58 seconds. The batch of door leaves with alternating rebates achieved an average takt time of 59.58 seconds. In the group of doors with variable widths, the average time between the exit of products from the line was 64.21 seconds. These values are depicted in the corresponding graphs, Fig. 2-4, illustrating the variability of takt time for the subsequent product depending on the difference in parameters of the previous door leaves.
Variant
Fig. 2. The takt time for the subsequent door leaf for the sorted series and colour changes series.
Variant
Fig. 3. The takt time for the subsequent door leaf for the sorted series and width change series.
Fig. 4. The takt time for the subsequent door leaf for the sorted series and alternating rebated series.
Fig.2presentsthetimerequiredtoexitthesubsequentelement fromthetechnological line in a series of aspects with colour change and a series of sorted products. These values differ approximately twice, confirming observations from previous studies (Kwidziński et al., 2024). Subsequent graphs, Fig. 3 and Fig. 4, illustrate the differences in selecting door leaves and arranging them alternately in terms of width and present rebated. The time differences between these two comparisons are similar. The processing time of a door leaf with a width different from the previous one results in a sixfold longer takt time. This is a very significant value, especially in mass production. Considering that each door leaf must undergo 3 processing cycles on the TechnoPORTA line, we can simulate production forecasts for an 8-hour shift for each of the four possibilities of arranging the order of door leaves. Dividing the interval time by the threefold average time obtained in the previous calculations (Fig. 2-4) gives an increase in the number of fully processed doors in successive working hours. These results allow us to estimate not only the daily efficiency of the line but also the potential losses resulting from less optimal processing sequences. The calculation omitted the processing time of the first element from entering to exiting the line. This would be a value equal for all four series without a tangible impact on the results, hence the simplification of the calculations. The results of the simulations are illustrated in Fig. 5, showing the key differences in efficiency depending on the batch preparation strategy.
Sorted series
Change of width series
Sorted series in batches of 20 pieces
Change of colour series
Alternating rebated series
In a continuous, eight-hour processing of elements with identical characteristics, the line can produce 954 doors. Maintaining only the same width and the consistent presence of the rebate reduces the line's efficiency to 546 doors. In the case of producing a series of door leaves with the same finishing color but varying rebate presence or change of width, the line can produce 161 and 150 door leaves, respectively, during one shift. The data shows this is six times less than the ideal situation where we can process leaves with fixed characteristics affecting the machine settings. Any additional parameter variation results in a significant decrease in efficiency, up to 84% for width changes compared to the ideal scenario. In particular, a change in leaf width affects efficiency more negatively than a change in a finish color, suggesting the need to minimize variation in this area during production planning. A drawback of the above simulation is assuming an unchanging, continuous situation over 8 hours. In practice, continuously producing one assortment for customized production is impossible. To actualize these forecasts, the situation of sorting door leaves by pallets, with
e= 20 pieces each, was assumed. On each pallet, the elements would be identical to each other. Between successive pallets, the technological line settings would be adjusted. To simulate the worst-case scenario, it was assumed that between successive pallets, the line settings must be adjusted to changes in the width of the door leaves. Therefore, the time between the exit of the last element from the pallet and the exit of the first element from the subsequent pallet was assumed to be the highest average takt time from Fig. 2-4, which is ������= 64.21 seconds. The interval time for the subsequent products for door leaves from one pallet is the takt time for a sorted series which is ���� = 10.06 seconds. The calculations were performed using the formula (3). Additionally, Figure 5 demonstrates that classification of doorleaves, eveninsmallersequencesof20pieces,hasasignificantimpactontheefficiency of the technological line. During an 8-hour workday, production planned in this manner is capable of processing 863 door pieces, resulting in 2589 completed machining cycles. This provides undeniable evidence of how crucial the sequence of processing products is. It also becomes apparent which of the examined features are most significant for line efficiency and which parameters should be prioritized first. The results can be used to determine the optimal processing sequence to reduce the number of necessary changes to the technological line setup.
Results from this study align with the conclusions found in the literature. The lower the variability in production, the shorter the cycle time, whereas any diversity significantly extends it or reduces efficiency (Barański et al., 2017; Ehteshami et al., 1992). Reducing cycle time is critical in production development (Zhang and Tag, 2006), particularly in highly advanced technical industries (Sherman et al., 2000). It is an indicator closely related to resource utilization (Aurand and Miller, n.d.), making it a key challenge across many sectors (Kalir, 2023), as it directly affects production costs and enterprise revenues (Weber and Fayed, 2010). In addition, the differences in the number of manufactured door leaves indicate that implementing a strategy to group them according to the lowest possible variability of their parameters may be key to improving efficiency (Pędzik et al., 2020).
CONCLUSION
Three characteristics of door leaves and their impact on the efficiency of the TechnoPORTA line are characterised in the study. The study revealed that the efficiency of the production line is significantly affected by the deliberate selection of the processing sequence for door leaves. All three discussed parameters should be considered to minimize takt time as much as possible. Width and the presence of a rebate or non-rebate were the most significant factors examined. With each change in these properties, the takt time increases sixfold compared to a series with no changes. Efficiency is reduced by half by adjusting the finish colour. When selecting the processing sequence, paying attention to these characteristics can increase efficiency several times, depending on the batch size with the same parameters. Without changes in the technological process, investments in new machinery,orcompromisingquality,efficiencycanbesignificantlyincreasedsolelythrough the reorganization of one production stage. In the future, tests should be extended with parameters such as the height of the door leaf or the type of material used in production to determine each feature's relevance level.
REFERENCES
Aurand, S.S., Miller, P.J., n.d. The operating curve: a method to measure and benchmark manufacturing line productivity, 1997 IEEE/SEMI Advanced Semiconductor Manufacturing Conference and Workshop ASMC 97 Proceedings. IEEE, pp. 391–397. https://doi.org/10.1109/ASMC.1997.630768
Barański, J., Klement, I., Vilkovská, T., Konopka, A., 2017. High Temperature Drying Process of Beech Wood (Fagussylvatica L.) with Different Zones of Sapwood and Red False Heartwood. Bioresources 12. https://doi.org/10.15376/biores.12.1.1861-1870
Ebrahim,Z.,Abdul Rasib,A.H., Muhamad,M.R.,2015. Understanding Time Loss inManufacturing Operations. Applied Mechanics and Materials 761, 619–623. https://doi.org/10.4028/www.scientific.net/AMM.761.619
Ehteshami, B., Petrakian, R.G., Shabe, P.M., 1992. Trade-offs in cycle time management: hot lots. IEEE Transactions on Semiconductor Manufacturing 5, 101–106. https://doi.org/10.1109/66.136270
Kalir, A.A., 2023. Optimizing Factory Performance for Unit Cost in Semiconductor Manufacturing. Open Journal of Optimization 12, 61–71. https://doi.org/10.4236/ojop.2023.122005
Klarin, M., Spasojević-Brkić, V.K., Golubović Sedmak, T., Stanisavljev, S., Brkić, A., Sajfert, Z., 2016. Production cycle time reduction in low and medium-low-tech companies: a case study for Serbia. Tehnicki vjesnik - Technical Gazette 23. https://doi.org/10.17559/TV-20140715130015
Kwidziński, Z., Chodnicki, M., Sankiewicz, Ł., Knitowski, B., Rogoziński, T., 2024. Influence of Finishing Colour on the Efficiency of Automated Production Line for Wooden Doors, in: Flexible Automation and Intelligent Manufacturing: Establishing Bridges for More Sustainable Manufacturing Systems. Proceedings of FAIM 2023, pp. 216–224. https://doi.org/10.1007/9783-031-38165-2_26
Kwidziński, Z., Hanincová, L., Tyma, E., Bednarz, J., Sankiewicz, Ł., Knitowski, B., Pędzik, M., Procházka, J., Rogoziński, T., 2022. The Efficiency of Edge Banding Module in a Mass Customized Line for Wooden Doors Production. Applied Sciences 12, 12510. https://doi.org/10.3390/app122412510
Patel, H., Shah, S.C., 2014. Review on Cycle Time Reduction in Manufacturing Industries. J Emerg Technol Innov Res 1.
Pędzik, M., Bednarz, J., Kwidziński, Z., Rogoziński, T., Smardzewski, J., 2020. The idea of mass customization in the door industry using the example of the company porta KMI Poland. Sustainability (Switzerland) 12. https://doi.org/10.3390/su12093788
Sherman,J.D.,Souder,W.E.,Jenssen,S.A., 2000. Differential EffectsofthePrimary Forms of Cross Functional Integration on Product Development Cycle Time. Journal of Product Innovation Management 17, 257–267. https://doi.org/10.1111/1540-5885.1740257
Taifa, I.W.R., Vhora, T.N., 2019. Cycle time reduction for productivity improvement in the manufacturingindustry.JournalofIndustrial Engineering andManagement Studies 6, 147–164. Weber, C.M., Fayed, A., 2010. Scale, Scope, and Speed Managing the Challenges of Multiproduct Manufacturing. IEEE Transactions on Semiconductor Manufacturing 23, 30–38. https://doi.org/10.1109/TSM.2009.2039249
Zhang, M.T., Tag, P.H., 2006. Cycle Time Reduction Through Preventive Maintenance Declustering, 2006 IEEE International Symposium on Semiconductor Manufacturing. IEEE, pp. 70–73. https://doi.org/10.1109/ISSM.2006.4493025
Zhao, Y., Xu, X., Li, H., Liu, Y., 2018. Stochastic customer order scheduling with setup times to minimize expected cycle time. Int J Prod Res 56, 2684–2706. https://doi.org/10.1080/00207543.2017.1381348
ACKNOWLEDGMENT
This research was supported by the projects entitled “TechnoPORTA. Smart customized production line for the automated manufacture of technical doors”, and “PortaFRAME Smart technology of automated production of customisedindustrial frames”.
AUTHORS’ ADDRESSES
BEng. Dorota Michalak
prof. Tomasz Rogoziński
Poznań University of Life Sciences, Faculty of Wood Technology
Wojska Polskiego 38/42, 60-627 Poznań, Poland dororota.mich@o2.pl tomasz.rogozinski@up.poznan.pl
Msc Zdzisław Kwidziński
Msc Łukasz Sankiewicz
MSc Bartłomiej Knitowski
Porta KMI Poland, Szkolna 54, 84-239 Bolszewo, Poland Zdzislaw_Kwidzinski@porta.com.pl lukasz_sankiewicz@porta.com.pl bartlomiej_knitowski@porta.com.pl
MSc Marta Pedzik
Łukasiewicz Research Network – Poznań Institute of Technology Center of Sustainable Economy, Ewarysta Estkowskiego 6, 61-755 Poznań, Poland marta.pedzik@pit lukasiewicz.gov.pl
Dr. hab. Joanna Bednarz, prof. UG
University of Gdańsk, Faculty of Economics
Armii Krajowej 119/121, 81-824 Sopot, Poland joanna.bednarz@ug.edu.pl
Dr. inż. Marcin Drewczyński
General Engeenering Solutions, Al. Zwyciestwa 96/98, Gdynia 81-451, Poland m.drewczynski@ges.com.pl
ACTA FACULTATIS XYLOLOGIAE ZVOLEN, 66(2): 125 135, 2024
Zvolen, Technická univerzita vo Zvolene
DOI: 10.17423/afx.2024.66.2.11
UTILISATION AND QUANTIFICATION OF WOOD BY-PRODUCTS FROM PRIMARY WOOD PROCESSING
Ján Parobek – Hubert Paluš – Martin Moravčík –Miroslav Kovalčík – Michal Dzian
ABSTRACT
Successful implementation of wood utilisation in various industry sectors is a driving force for building a sustainable society. Knowing the volume of by-products is essential for assessingtheindustry'scontributiontothecirculareconomybasedonthelevelofapplication of wood cascading principles. The study deals with the analysis of actual wood use patterns in Slovakia with a focus on wood by-product management. The obtained data are the basis for calculating a cascading coefficient to evaluate the use of wood in the whole chain of its processing and utilisation. Results confirm that the most important producer of wood byproducts is the sawmilling industry, consuming approximately 40% of the total volume of industrial wood. The value of the cascading coefficient in the Slovak Republic calculated with the inclusion of sources and products for energy use based on 2020 data determined on the basis of a questionnaire survey was 1.33.
Keywords: cascade coefficient; harvested wood products; by-products; sawnwood.
INTRODUCTION
Renewable resources, considered an inevitable part of the issue of the circular economy, are increasingly recognized as a key factor in environmental protection, sustainable development, and economic prosperity – the circular economy emphasizes reusing sources and waste streams to create value-added products. The forest-based sector and all linked businesses played a significant in the circular economy. These sectors focus on producing and using sustainable wood and wood products. Improved utilisation of available wood waste into added-value goods produces profits for all supply chain participants (Parobek and Paluš 2024). The industry's strength, competitiveness, effectiveness, attractiveness to investors, and many other factors influence the economic growth of each country. New problems have increased in recent decades, such as transformation and adaptation to new demands from the forest-based sector, which has been characterised by globalisation, an increasingly competitive economic environment, and new technologies and innovations. Thus, wood consumption must be assumed and coordinated with the need for conventional and modern products. Many studies (Buongiorno et al., 2011; Mantau et al., 2010; Raunikar et al., 2010) predicted an increase in wood demand in the European Union (EU), owing primarily to the rise in renewable energy use.
On the source side, forestry companies supply different wood assortments, namely sawlogs, veneer logs, pulpwood, and other industrial wood to the forest-based industries. Simultaneously, the industry generates significant volumes of wood residue (30-50% of the volume of processed wood), which can be used for industrial applications as additional resources. Furthermore, the industry is the leading consumer of these residues and other solid-wood products (Ministerial Conference on the Protection of Forests in EuropeFOREST EUROPE, 2020). From this perspective, it is critical to prioritise outputs with higher added value, which create jobs and contribute to a better carbon balance (resource efficiency). Wood products and derived residues have the potential to mitigate climate change in terms of their ability to store carbon and substitute for fossil-based materials (Howard et al., 2021). The efficient cascade use of wood enables the recycling and reuse of wood waste from the production process several times. In addition to the production of primary semi-finished products such as sawn wood, veneer, wood panels, paper, and paperboard, the forest-based industries also produce a significant proportion of by-products, in particular trimmings, edgings, sawdust, shavings, bark, but also black liquor resulting from pulp production.
Current statistical data do not include the volumes of by-products generated in the primary processing. In the conditions of the Slovak Republic, the most important producers of wood-based by-products are the sawmill industry (with about 40 % share in the total volume of processed wood) and the pulp and paper industry (energy-rich by-product - black liquor) (Moravčík et al., 2023). The quantification of these resources in volume terms is a requirement for knowing the actual wood flows, as these are significant volumes of wood that, after primary processing, are returned as a resource for industrial processing or energy production. Knowing the volumes of these by-products is also essential for assessing the contribution of the sector to the circular economy through the value of the cascading principle. According to Haberl and Geissler (2000), wood cascading increases the efficient use of biomass, which can be achieved by integrated optimization of biomass utilisation in the industry. The novel cascading concept can help optimize wood use along the processing chain and utilisation (Parobek and Paluš, 2016). Cascading can be characterised as a recycling chain in which woodis reused,and theproduct at the endofits lifecycleis suitable for energy generation (Brunet-Navarro et al., 2018). Wood cascading is a systematic effort to obtain biomass for higher-value products (Keegan et al., 2013). Mair and Stern (2017) specified that actively integrating cascading principles into the circular economy can strengthen both concepts in multiple ways. This concept, for example, could be used to communicate with members of a general audience and with specific reference to wood and other bio-based resources, cascading can be considered to represent a concept that forms a connection between circular economy and the bio-economy, fostering an inclusive, circular bio-economic vision in the future (Mair and Stern, 2017). As described by Sirkin and ten Houten (1994), cascading of renewable resources is an approach to improve the efficiency of source utilisation by a sequential re-utilisation of the same unit of a resource for multiple high-grade material applications followed by a final use for energy purposes (Höglmeier et al., 2017). In that way, primary inputs have increasing positive effects due to substituting limited materials with renewable resources (Gustavsson and Sathre, 2011). Wood cascading occurs when biomass is processed into a final product, which is reused at least once as a material or product in the production process or used for energy production. Keegan et al., (2013) distinguish between single and multi-stage use of resources. Moreover, Fraanje (1997) highlighted that appropriate secondary sources of the best possible quality should be applied to maximize the effects of cascading.
The cascade coefficient expresses how efficiently wood is used for different purposes before it reaches the end of its life cycle (Mantau et al., 2010; Parobek et al., 2014). Increasingthevalueofthecascadecoefficientcanbeachievedbypreferentialreuseofwoodbased by-products to produce products with higher added value. The least appropriate use of wood is for energy production, directly linked to releasing carbon dioxide into the atmosphere. According to the principles of wood cascading, the burning of wood should be the last stage of the wood life cycle. The above approach also allows for the creation of higher added value in the wood products and promotes employment growth. The system and rate of utilisation of wood by-products vary considerably between European Union (EU) countries (Mantau, 2012).
The study aims to calculate the cascade coefficient and evaluate the use of wood resourcesintheSlovakforest-basedindustrybasedonaquestionnairesurvey resultsaimed atquantifyingtheproductionofessentialsemi-finishedproducts,by-products,andprocessed energy wood. Subsequently, the findings were approximated for the conditions at the national level, and the values of the cascade coefficient were calculated. The conclusions are intended to serve as background material for adopting measures related to optimizing the current use of wood and wood by-products following principles of bioeconomy and cascade wood utilisation.
MATERIALS AND METHODS
The wood balance and resource balance were constructed to define wood material flows. While wood balance is mainly oriented to estimate domestic consumption regardless ofthe further use of wood, woodresource balanceis usedto determine andquantifythemain resources and uses of raw wood material and wood residues. Domestic roundwood production and imports represent the major resource categories, while domestic roundwood consumption and exports represent the primary uses. The resource side is supplemented by recycled material and stock decreases, while the use side is enhanced by stock increases. The availability of the data is a critical factor in the construction of the wood balance. Data were obtained from the FAOSTAT database (FAOSTAT, 2024) and forestry reports in Slovakia (MARD SK, 2023). To create a state of wood balance, the resources must match the uses. The wood resource balance provides an in-depth examination of wood and wood product flows while focusing on the various uses within the sector.
Empirical research based on accessible data is applied to obtain absent data. Under current conditions, wood resource balance statistics can be constructed using a combination of official information and empirically collected data. Official statistics provide data for highly concentrated industries such as pulp and paper. On the other hand, data on wood products, by-wood products and waste flows in the sawmill industry are not available. As the records on the volume of produced wood residues and their consequent use either as a material or energy source are not generally available. That is why, the analysis was accompanied by the determination and quantification of wood residues patterns using a questionnaire survey among the companies operating in the sawmilling and wood-based panel industry in Slovakia. Evaluation of the use of raw wood resources in the wood processingindustryis aimedat quantifyingtheproduction of(i)basicsemi-finishedproducts (sawnwood, veneers, plywood, panels), (ii) by-products (sawdust, bark, chips, peeling residues, etc.) and (iii) processed energy wood (pellets, briquettes, split firewood).
A questionnaire survey in 2023-2024 was conducted for two main product groups: sawntimberproducts(sawntimber,by-products)andwood-basedpanels(veneers,plywood,
agglomerated materials, and by-products) to determine the state of production of semifinished timber products and by-products of mechanical wood processing in 2020. The mentionedanalysed periodis to minimizeturbulences dueto market changes and results represent the latest possible data obtained by a combined primary and secondary research method. The number of contacted companies was 177. The number of respondents was 57, i.e., a 32.2% return rate. Of these, the number of respondents producing wood-based panels was five, representing almost 100% coverage of their production in the Slovak Republic. Consequently, expert analysis of the collected data and quantification of the volumes of inputs to production and production (including by-products according to their type) were carried out. On the other side of wood resource balance, the use of the production, namely own consumption, sale, industrial processing and use for energy were analysed. Finally, the calculation of the cascade coefficient in harvested wood products (HWPs) was estimated. Most of the main production inputs (logs) and products (sawn timber, bulk materials) were reported in m3 in the questionnaires. Other production inputs and by-products were reported by respondents in different units of measurement (spatial meter, tonnes, atrotons). All data were converted into m3 as part of the data evaluation using various methods (as available and feasible), in particular, forest product conversion factors (FAO, 2020), available domestic tables, conversion factors, and estimation according to the predominant wood species of the material, its assumed moisture content and wood volume tables. Conversion factorswereusedto determinetheneed foraroundwoodequivalent. Theprimaryconversion factors for deciding the roundwood equivalent for each HWP are given in Table 1. The first column shows the volume of roundwood needed to produce 1 m3 of different HWPs. The production from chemical processing is converted from tons to log equivalent.
Tab. 1 Coefficients for determining roundwood requirments for the production of individual HWPs.
Harvested wood products (HWP)
Source: UNECE/FAO (2020)
The wood resources balance in Slovakia was calculated for the whole sector of the primary use of roundwood. The relevance of the real wood resource results depended directly on the quality and availability of data on wood production and use in the individual sectors. Official statistics are available for highly concentrated sectors such as the pulp and paper industry. However, some manufacturing industries, such as the sawmill industry, are poorly concentrated, and access to input data is quite limited.
The interlink between available data through a questionnaire survey and information from official databases is a sufficient information base for assessing cascading in the Slovak Republic. The cascade analysis describes wood flows to identify and quantify the use of wood material and waste. Cascading can be defined as the efficient use of residues and recycled materials to expand the overall biomass availability in a given system.
To evaluate the cascade use of wood in the forest-based industry in Slovakia, it was necessary to determine cascade coefficients according to their type of use. The cascade
coefficient is a figure that tells us how often the wastes or by-products in the balance of wood resources get from the use side to the resource side and are reused either as input material for energy generation or for further industrial production. The higher the cascade coefficient, the higher the rate of use and recycling, and the contribution to the green economy increases (Bais-Moleman et al., 2018). To calculate the cascade coefficients, the following formula was used:
C = RW + IR (1)
Where:
C – cascade, RW – recovered post-consumer materials (wood, paper, furniture, waste, etc...), IR – industrial residues.
Where:
CF = 1 + (2)

CF – cascading factor, WRforests – wood resources from forest (industrial roundwood).
Wood is a versatile material and can be used in various manufacturing processes, so it was necessary to identify on both sides of the balance whether these were finished products or products that enter the input side of the balance for reuse. This analysis allowed the calculation of a cascade coefficient, which takes into account the reuse of wood entering from the use side and returning to the source side and vice versa. The cascade coefficient is defined as the total wood use, including wood waste, recycled wood, and wood from forests, divided by wood used from forests. However, such a cascade technique did not overvalue or undervalue the final balance; it only expanded the range of items or product groups included in the study. Thus,the final balance accounted for by-product flows, as well as indirect wood flows.
RESULTS AND DISCUSSION
Wood balance presents a global view of the resources and primary uses of roundwood in Slovakia(Tab. 2).Thevolumeofdomesticconsumption (9 59mil.m3)was deductedfrom the roundwood production and foreign trade. Export amounted to 2.29 mil. m3 and import 1.99 mil. m3 million. Based on a simple calculation, domestic consumption was set at 7.3 mil. m3 .
Tab. 2 Wood Balance in the Slovak Republic.
999 850
588 963
Detailed identification of wood by-products used in Slovakia was done by designing the wood resource balance. Based on the answers of 57 respondents from the operations in
the sawmilling and panel industry, the survey results represented 50% of the total sawnwood production in terms of volumes reported.
The primary input for sawmills is dominated by coniferous logs (Fig. 1), and naturally, the main product is sawnwood (Fig. 2). Coniferous (79.4%) and non-coniferous (14.0%) logs are the main production inputs. Other inputs (almost 6%) consisted of sawnwood and veneer for the associated production activities of sawmills; offcuts, logging residues, sawdust, and wood chips are used mainly for the energy for internal use or the production of pellets and wood briquettes. Over 52% of final sawmill production was sawnwood. Other products represented by pallets, crates, floors, roofs, fences, furniture parts, handles, facing, etc. accounted for 5.8%. The rest of the production (42.1%) consisted of by-products, part of which was used to produce energy pellets, briquettes and split firewood.
According to the survey data, the production volume was converted to the whole country production of sawnowood using a coefficient of 2.031. The coefficient results from the share of the sawnwood output in the SR recorded in the JFSQ (Joint Forest Sector Questionnaire) 2020 (e.g. 1.5 mil. m3) and the share of production according to the survey (0.75 mil. m3).
The share of coniferous roundwood as input raw material in the wood-based panel production plants was 35.8% and that of broadleaved 5.4%. Recycled wood had a significantly high share of 29.0%, sawdust and shavings 14.4%, and wood chips 10.7%. The lowest share was 4.8% for cuttings. According to the survey, up to 98.4% of the final products were produced in wood-based materials from the volume of production inputs, namely, veneers, plywood, and agglomerated materials. By-products (peeling residues, peeling core, bark, wood chips, and wood dust) accounted for only 1.6 % of the total volume of production inputs. The production volumes of wood-based materials in the plants participating in the survey were converted to production in the whole country by a factor of 0.725. The value of the coefficient was derived from the share of wood-based materials production according to the UNECE (1.05 mil. m3) and the share of production according to the survey (1.45 mil. m3).
The total volume of by-products in 2020 was 1.25mil. m3. Out of this, 61.2% was used for energy production and 38.8% was used for further industrial utilisation (Fig. 3). Among the most produced were chips (477,000 m3) and sawdust (255,000 m3).
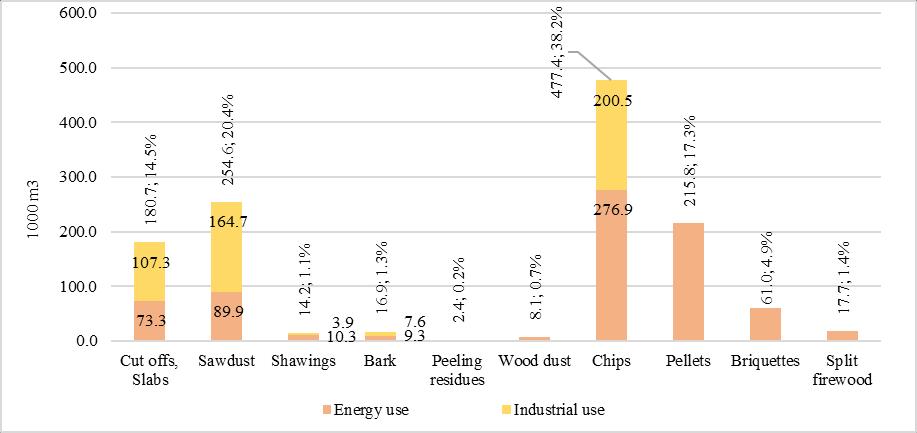
Fig. 3 Structure of by-products use by sectors.
Fig. 4 shows the production of by-products broken down according to their use for energy (37.7%), in industrial use (38.8%) and for energy purposes through processed energy wood such as pellets, briquettes, and split firewood (23.5%).
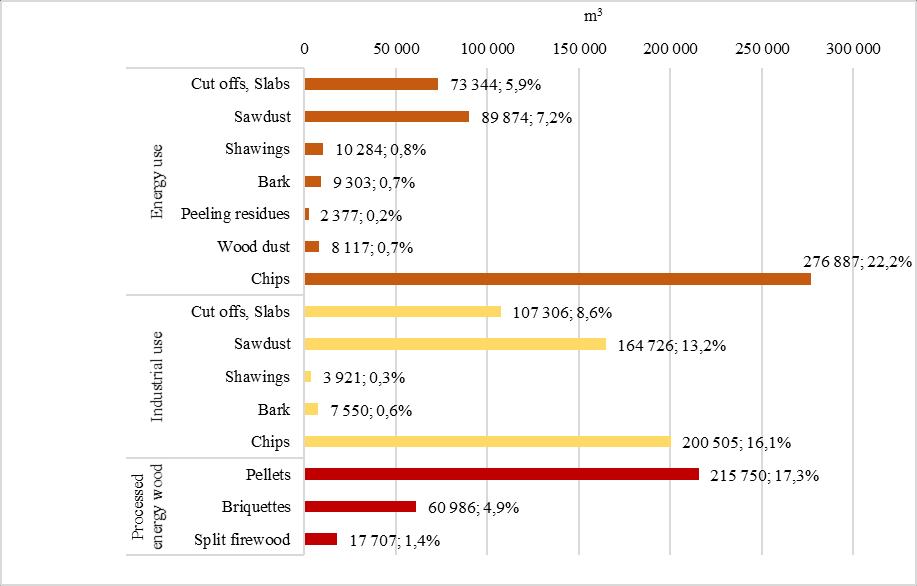
Fig. 4 Structure of by-products use by products.
A cascade coefficient can express the indirect wood flows. It describes the reuse of wood generated on the use side and returned to the resource side. The coefficient is calculated as the ratio of total wood supplies e.g 9.536 mil. m3 in 2020 (woody biomass from forest, recycled material, by-products and processed energy wood) and the volume of domestic consumption of roundwood e.g. 7.158 mil. m3 in 2020. The value of the calculated cascade coefficient was 1.332 (Table 3). A better alternative to calculating the cascade coefficientistoremove processedenergywoodfromthesourcesideandproducedfuelwood from the use side. This approach captures the desired increase in the use of by-products for further industrial processing, namely for producing wood-based panels, pulp and paper. This
also extends the carbon fixation time of wood products and delays the end of the life cycle of wood through its combustion with carbon emissions to the atmosphere. In this case, the share of total resources in 2020 (woody biomass from forests, recycled material and byproducts used for further industrial processing) would be 7.254 mil. m3 and the domestic consumption of raw wood in 2020, excluding fuel wood, will be 6.629 mil. m3. The value of the cascade coefficient calculated this way is 1.094.
Tab. 3 Calculation of the value of the cascade coefficient including resources and by-products for the industry and energy sector.
Recycled material
wood and paper
slabs, edge boards
wood cores
Explanatory notes:
1. Consumption of raw timber in the SR in 2020, excluding post-harvest residues, was 7.158 million m3 (Green Report 2020).
2. The volume of recycled wood and paper that entered as a source of production was 0.141 million m3 (processed from sources for 2020 published in the Pulp and Paper Industry Report of the SR in 2021)
3. Volume of by-products (0.954 million m3) returning back into industrial production or energy production as a resource after primary processing (NFC, questionnaire survey 2022)
4. Black Liguer (processed from 2020 sources published in the Pulp and Paper Industry Report 2021).
5. The volume of processed energy wood (pellets, briquettes and chipped wood) in 2020 was 0.294 million m3 (NFC, questionnaire survey 2022).
In recent years, using wood for energy production has become increasingly important. Wood is increasingly used as a fuel in both internal and external energy production facilities, and it also serves as an important source of heat in households. These same wood species and wood residues can also be used to produce a variety of wood products, thus acting as substitutes.AsstatedbyMantau(2015),industrial by-products,includingthosederivedfrom sawmilling and panel production and black liqueur from pulp milling, collectively constitute 38.6% of the total wood flows in Europe.
Market conditions for roundwood producers are strongly influenced by the availability of wood resources, legislative frameworks, voluntary international agreements and global initiatives for sustainable forest management. On the other hand, by-products receive less
attention in political strategies, and a clear target for their use needs to be present. The EU's Circular Economy Strategy is the first to identify the purpose of explicitly by-product uses. To some extent, by-products play a role as a renewable source in the EU's Bioeconomy Strategy (European Commission, 2018).
These factors directly influence the supply of renewable wood resources. At the same time, policies that prefer the use of renewable raw materials stimulate the demand for energy wood. Wood, traditionally used for wood production, is now also increasingly in energy demand, leading to price increases.
As previously stated, the primary distinction between the wood balance and the wood resource balance is the integration of wood waste into the calculations, which increases the total resources to 12 million m³. The results of this analysis can be compared with those of Mantau (2010), who estimated the total wood resource potential in the Slovak Republic, including imports, at 14.8 million m³. The discrepancies between these estimates can be attributed primarily to the disparate values of wood waste reported in the questionnaires and different developments in wood production in particular periods. In our investigation, for instance, the production of black liquor was found to be 0.8 million m³ lower, and the output of sawn timber and pulpwood was approximately 1 million m³ lower than the figures reported by Mantau (2010).
Dueto theconstraints posedby market structure,theutilisationpatternsofby-products could play at least as significant a role in climate change mitigation as wood construction.
CONCLUSION
The study confirmed that the wood resource balance approach used to identify and quantify wood material flows represents a significant tool for the evaluation of wood products' contribution to climate change mitigation. For determining domestic wood consumptionand thus thewoodcascadecoefficient valuecalculation, thevolumesofforeign wood trade are significant variables as exports account for almost 31% of domestic production, and imports account for more than 27% of domestic consumption.
Due to the availability of statistical data on by-product production and utilisation, a sampling-basedmarketsurveywasusedto collect suchdataanddefinethemainusepatterns. Findings show that almost 50% of all products from the sawmills enter by-product streams and are further available for utilisation either as a material or energy source. Over 60% of by-products, dominated by chips, are used for energy production. Finally, the wood cascade coefficient indicating the repeated use of wood was 1.33.
The value of the cascade coefficient without considering fuel wood volumes was 1.09. Such calculation allows a better expression of the desirability of increasing the use of byproducts forfurther industrial processing,especiallyfor products with a longerlifetime. This would thereby extend the carbon fixation time in the HWP and delay the end of the life cycle of wood through its combustion, which is associated with carbon emissions to the atmosphere.
The results focused on the approximation of by-product production for the conditions of the whole Slovak Republic and the calculation of cascade coefficient values. Available timber resources, legislation, voluntary international agreements, and global sustainable forestry initiatives and policies heavily regulate current market conditions for the forestbased sector. For this reason, wood flows and the value of the cascade coefficient can alternate every year. However, the study can serve as background material and measures for
optimising the current use of wood and wood by-products by principles of the circular bioeconomy and cascade wood utilisation.
REFERENCES
Bais-Moleman, A. L., Sikkema, R., Vis, M., Reumerman, P., Theurl, M. C., Erb, K. H., 2018. Assessing wood use efficiency and greenhouse gas emissions of wood product cascading in the European Union. Journal of Cleaner Production, 172, 3942–3954. https://doi.org/10.1016/j.jclepro.2017.04.153
Brunet-Navarro, P., Jochheim, H., Kroiher, F., Muys, B., 2018. Effect of cascade use on the carbon balance of the German and European wood sectors. Journal of Cleaner Production, 170, 137–146. https://doi.org/10.1016/J.JCLEPRO.2017.09.135
Buongiorno, J., Raunikar, R., Zhu, S., 2011. Consequences of increasing bioenergy demand on wood and forests: An application of the Global Forest Products Model. Journal of Forest Economics, 17(2), 214–229. https://doi.org/10.1016/j.jfe.2011.02.008
European Commission. 2018. Communication from the commission to the european parliament, the council, the european economic and social committee and the committee of the regions Brussels.
Fao, Itto, United Nations, 2020. Forest product conversion factors. Food and agriculture organization of the united nations. https://doi.org/https://doi.org/10.4060/ca7952en
Faostat., 2024. Food and Agriculture Organization of the United Nations, Statistics Division. Forestry Production and Trade. Retrieved April 4, 2020, from http://www.fao.org/faostat/en/#data/FO
Fraanje, P. J., 1997. Cascading of pine wood. Resources, Conservation and Recycling, 19(1), 21–28. https://doi.org/10.1016/S0921-3449(96)01159-7
Gustavsson, L., Sathre, R., 2011. Energy and CO2 analysis of wood substitution in construction. Climatic Change, 105 (1), 129–153. https://doi.org/10.1007/s10584-010-9876-8
Haberl, H., Geissler, S., 2000. Cascade utilization of biomass: Strategies for a more efficient use of a scarce resource. Ecological Engineering, 16 (SUPPL. 1), 111–121. https://doi.org/10.1016/s0925-8574(00)00059-8
Höglmeier, K., Weber-Blaschke, G., Richter, K., 2017.Potentials for cascading of recovered wood frombuildingdeconstruction Acasestudyforsouth-eastGermany.Resources,Conservation and Recycling, 117, 304–314. https://doi.org/10.1016/J.RESCONREC.2015.10.030
Howard, C., Dymond, C. C., Griess, V. C., Tolkien-Spurr, D., van Kooten, G. C., 2021. Wood product carbon substitution benefits: a critical review of assumptions. Carbon Balance and Management, 16(1), 1–11. https://doi.org/10.1186/s13021-021-00171-w
Keegan, D., Kretschmer, B., Elbersen, B., Panoutsou, C., 2013. Cascading use: A systematic approach to biomass beyond the energy sector. Biofuels, Bioproducts and Biorefining, 7(2), 193–206. https://doi.org/10.1002/bbb.1351
Mair, C., Stern, T., 2017. Cascading Utilization of Wood: a Matter of Circular Economy? Current Forestry Reports, 3(4), 281–295. https://doi.org/10.1007/s40725-017-0067-y
Mantau, U., 2012. Wood flows in Europe (EU 27). Project Report, Commissioned by CEPI (Confederation of European Paper Industries) and CEI-Bois (European Confederation of Woodworking Industries).
Mantau, U., 2015. Wood flow analysis: Quantification of resource potentials, cascades and carbon effects. Biomass and Bioenergy, 79, 28–38. Elsevier Ltd. Retrieved from http://dx.doi.org/10.1016/j.biombioe.2014.08.013
Mantau, U., Saal, U., Prins, K., Steierer, F., Lindner, M., Verkerk, H., Eggers, J., Leek, N., Oldenburger, J., Asikainen, A., Anttila, P., 2010. Methodology report Real potential for changes in growth and use of EU forests EUwood. https://doi.org/10.13140/2.1.3372.0642 Ministry of Agriculture andRural Development of theSlovak Republic., 2023. Report onthe forest sector of the Slovak Republic 2022. https://www.mpsr.sk/zelena-sprava-2022/123 18463/
Ministerial Conference on the Protection of Forests in Europe - FOREST EUROPE. 2020. State of Europe´s Forests. In State of Europe’s Forests. https://foresteurope.org/wpcontent/uploads/2016/08/SoEF_2020.pdf
Moravčík,M.,Parobek,J.,Paluš,H.,Kovalčík,M.,2023.VyužitiezdrojovdrevavSR–kaskádový prístup. Aktuálne otázky ekonomiky a politiky lesného hospodárstva Slovenskej republiky, 180[UtilizationofwoodresourcesintheSlovakRepublic–acascadeapproach.Currentissues of economics and forestry policy of the Slovak Republic, 180]. https://web.nlcsk.org/wpcontent/uploads/2023/12/Zbornik2024.pdf
Parobek, J., Paluš, H., 2016. The concept of cascaded use of wood in Slovkia. 9 Th International Scientific Conference WoodEMA 2016 The Path Forward for Wood Products: A Global Perspective, 101–106.
Parobek, J., Paluš, H., 2024. Wood-Based Waste Management Important Resources for Construction of the Built Environment. Creating a Roadmap Towards Circularity in the Built Environment, 213–1225. https://doi.org/10.1007/978-3-031-45980-1
Parobek, J., Paluš, H., Kaputa, V., Šupín, M., 2014. Analysis of wood flows in Slovakia. BioResources, 9(4), 6453–6462. https://doi.org/dx.doi.org/10.15376/biores.9.4.6453-6462
Raunikar, R., Buongiorno, J., Turner, J. A., Zhu, S., 2010. Global outlook for wood and forests with the bioenergy demand implied by scenarios of the Intergovernmental Panel on Climate Change. Forest Policy and Economics, 12(1), 48–56. https://doi.org/10.1016/j.forpol.2009.09.013
Sirkin, T., ten Houten, M., 1994. The cascade chain: A theory and tool for achieving resource sustainability with applications for product design. Resources, Conservation and Recycling, 10(3), 213–276. https://doi.org/10.1016/0921-3449(94)90016-7
UNECE., 2020. Joint Forest Sector Questionnaire. [WWW Document]. URL https://unece.org/sites/default/files/2021-04/jq2020def-e.pdf
ACKNOWLEDGMENT
This study was supported by the Slovak Research and Development Agency under the Contract no. APVV-23-0022 The integration of eco-innovation into the innovation process and APVV-20-0294 Assessment of Economic, Social and Environmental Impacts of Forest Management in Protected Areas in SR on Forestry and Related Industries and the Scientific Grant Agency of the The Ministry of Education, Research, Development and Youth of the Slovak Republic Grant No. 1/0494/22 Comparative Advantages of the Wood Based Sector under the Growing Influence of the Green Economy Principles and Grant No. 1/0495/22 Sustainability of Value Supply Chains and its Impact on the Competitiveness of Companies in the Forest and Forest-Based Sectors.
AUTHORS’ ADDRESSES
doc. Ing. Ján Parobek, PhD. doc. Ing. Hubert Paluš, PhD. Ing. Michal Dzian, PhD. Technical University in Zvolen, Faculty of Wood Science and Technology, T. G. Masaryka 24, 960 01 Zvolen, Slovakia parobek@tuzvo.sk palus@tuzvo.sk michal.dzian@tuzvo.sk
Ing. Martin Moravčík, CSc. Ing. Miroslav Kovalčík, PhD. National Forestry Center, T. G. Masaryka 22, 96001 Zvolen, Slovakia. moravcik@nlcsk.org kovalcik@nlcsk.org
ACTA FACULTATIS XYLOLOGIAE ZVOLEN, 66(2): 137 153, 2024
Zvolen, Technická univerzita vo Zvolene
DOI: 10.17423/afx.2024.66.2.12
TRENDS AND CHALLENGES IN MANAGING THE FORESTRY AND WOOD-PROCESSING INDUSTRY
Silvia Lorincová
ABSTRACT
The business environment is influenced by various constantly evolving trends impacting crucial corporate management aspects. The aim of the research was to identify trends and challenges in managing the forestry and wood-processing industry. The focus was on analyzing corporate culture. The study utilized the globally recognized methodology of Cameron and Quinn to measure corporate culture. A gap in existing research is addressed, as more attention should be given to corporate culture within the forestry and woodprocessing industry, especially in Slovakia. The results revealed that various cultural types were prevalent, with hierarchy and clan corporate cultures being the most dominant. It indicates that forestry and wood-processing companies tend to operate in a formalized and structured work environment, where procedures and regulations are prioritized, while also focusing on the internal environment and employee care. A key challenge for management is implementing the clan corporate culture preferred in the future, focusing on the long-term developmentofemployees. Itiscrucial,ashumancapitalplaysanessentialroleinincreasing the productivity, output of an organization, and competitive advantage.
Keywords: management; trends and challenges; forestry; wood-processing industry
INTRODUCTION
Dynamism, the speed of change, globalization, digital transformation, optimization, quality improvement, demographic shifts, skills shortages, the platform economy, circular economy, and artificial intelligence are just a few of the current trends that shape the corporate environment (Potkány et al., 2024; Piwowar-Sulej et al., 2024; Machova et al., 2023; Stacho et al., 2021; Teplická and Hurná, 2021). These factors are rapidly evolving and touch on key aspects of business management, including corporate culture (Herget, 2023). Successfully navigating these environments presents new challenges, with corporate culture undeniably playing a crucial role in overcoming these challenges (Herget, 2023). Corporate cultureisconsideredoneofthecriticalfeaturesofanyorganizationrelatedtoitsperformance (Mikusová et al., 2023). Creating an influential corporate culture is challenging as it requires senior managers to embed shared values (Abernethy et al., 2024).
Corporate culture has been attracting increasing attention in recent decades due to its potential to improve an organization's prospects from the managerial perspective (Calderón et al., 2022; Bendak et al., 2020; Stacho et al., 2016). Corporate culture involves the organization's value system, traditions, customs, and how things are carried out (Li et al., 2024; Todorova, 2024). It originates from business practices and influences employee
behavior (Sun et al., 2024). Corporate culture has evolved into a strategic concern due to its substantial impact on business development (Calderón et al., 2022). Creating a corporate culture that aligns with the enterprise's characteristics and is embraced by most employees remains a critical focus in developing corporate culture (Sun et al., 2024).
Corporate culture has been the subject of research across various contexts. Studies by Asif et al. (2024), Tian et al. (2022), and Guiso et al. (2015) have explored the relationship between corporate culture and performance. Nazipova et al. (2017) studied the stages of the elements of the corporate culture and methods for their evaluation, which allows for tracking theinfluenceofcorporate cultureontheeffectiveness indicatorsoftheorganizationandtheir change. Corporate culture from the perspective of sustainable business success was investigatedin theresearchofSamli (2024)andBegum (2022).Additionally, Li et al. (2021) affirmed the significance of examining corporate culture, highlighting its correlation with various business outcomes, including operational efficiency, risk-taking, earnings management, executive compensation design, firm value, and deal-making. The research of Li et al. (2021)adds thatthelinkagebetweencorporatecultureandperformanceis especially pronounced during challenging times. Qin et al. (2015) revealed that human relations and social nexus in a harmonious organizational context are the major cultural traits "gluing" management and employees together in efforts aimed at accomplishing strategic goals.
Various methods and techniques are used when investigating corporate culture, with the Organizational Culture Assessment Instrument serving as a commonly utilized tool for measuring corporate culture (Assens-Serra et al., 2022; Gebretsadik, 2022). Through this approach, corporate cultures have been studied in different countries, including Indonesia (Samsie et al., 2020), Colombia (Sindakis et al., 2024), the Czech Republic (Balková and Jambal, 2024), Germany (Lühr et al., 2022), Spain (Assens-Serra et al., 2022), Sweden (Karlsson et al., 2022), Romania (Dobrin et al., 2021), and others. Additionally, studies have covered various sectors such as the construction industry (Pancholi and Devkar, 2023; Lühr et al., 2022), tourism businesses (Simovic et al., 2020), higher education (Anishchenko et al., 2023), universities (Gorzelany et al., 2021), and health services (Angelini et al., 2021; Zervea et al., 2021).
Using the Organizational Culture Assessment Instrument, four culture types can be identified, and different values are typical for each type of corporate culture (Cameron and Quinn, 1999). Clan Culture represents a friendly working environment where employees share common values and feel like part of a big family. Leaders are perceived as mentors or even parental figures. Loyalty and tradition hold the organization together, fostering strong engagement. Long-term human resource development is a priority. Success is measured by meeting client needs and caring for employees. The organization promotes teamwork, participation, and consensus (Teräväinen et al., 2018; Jaeger et al., 2017; Demski et al., 2016; Jones et al., 2014; Übius and Alas, 2009). Adhocracy Culture represents a dynamic and creative work environment where employees are encouraged to take risks. Leaders are viewed as innovators and risk-takers, fostering experimentation and innovation as a means of connection. Emphasis is placed on prominence, with a long-term focus on growth and resource creation. The introduction of new products or services is considered a success. The organization promotes individual initiative and freedom (Liao, 2019; Cameron and Quinn, 1999). Market Culture thrives in a results-driven workplace that prioritizes targets, deadlines, and task completion. Individuals are competitive and goal-oriented, with leaders being hard drivers, producers, rivals, and competitors known for setting high expectations. A drive for winning keeps the organization together, with reputation and success ranking highest. Long-term attention is on competitive activities and goal achievement, with market dominance, goal attainment, and vital metrics defining success. Competitive pricing and
market leadership remain key. The organizational style is based on competition (AssensSerraet al., 2022; Cameron and Quinn, 1999). Hierarchy Culture embodies a formalized and structured work environment where procedures dictate actions. Leaders value efficiencydriven coordination and organization, ensuring the smooth functioning of the organization. Formal rules and policies uphold organizational unity, with long-term goals focused on stability, efficient task execution, and results. Success is defined by reliable delivery, consistent planning, and cost-effectiveness. Personnel management ensures work predictability and continuity (Gebretsadik, 2022; Heritage et al., 2014).
Our research fills a gap in the current knowledge of corporate culture, as there is limited focus on the forestry and wood-processing industry, particularly in Slovakia. The operational efficiency of forest enterprises has been a topical issue in the research of Neykov et al. (2021). Studies by Fiedler et al. (2020) centered mainly on mechanization in forestry implantation, and research by Gameiro et al. (2024) dealt with the issue of robots for forest maintenance. Aparna et al. (2024) and Sagar et al. (2024) focused on the operational efficiency of forests. Our research aims to identify trends and challenges in managing the forestry and wood-processing industry in Slovakia concerning corporate culture because, according to Landekic et al. (2015), for the forestry sector, organizational or corporate culture can be a key link in restructuring processes and business improvements of forest companies.
MATERIALS AND METHODS
Trends and challenges in managing were investigated in the research on corporate culture conducted in Slovakia. Questionnaires were used. They were distributed electronically between 2020 and 2023. A total of 1,573 employees in the forestry and woodprocessing industry participated in the research. The sample predominantly comprised male participants (69.36%). In terms of job positions, the sample included 60.39% blue-collar workers and 39.61% white-collar workers.
The research utilized the methodology developed by Cameron and Quinn (1999), enabling the identification of existing and preferred corporate culture by allocating points among four alternatives (alternative A, alternative B, alternative C, alternative D) across six partial areas, as follows:
1 area = Dominant Characteristics
• alternative A – The organization is a very personal place. It is like an extended family. People seem to share a lot of personal information and features.
• alternative B – The organization is a very dynamic entrepreneurial place. People are willing to stick out their necks and take risks.
• alternative C – The organization is very results-oriented. A major concern is getting the job done. People are very competitive and achievement-oriented.
• alternative D – The organization is very controlled and structured place. Formal procedures generally govern what people do.
2 area = Organizational Leadership
• alternative A – The leadership in the organization is generally considered to exemplify mentoring, facilitating, or nurturing.
• alternative B – The leadership in the organization is generally considered to exemplify entrepreneurship, innovation, or risk taking.
• alternativeC–Theleadershipintheorganizationisgenerallyconsideredtoexemplify a no-nonsense, aggressive, results-oriented focus.
• alternative D – The leadership in the organization is generally considered to exemplify coordinating, organizing, or smooth-running efficiency.
3 area = Management of Employees
• alternative A – The management style in the organization is characterized by teamwork, consensus, and participation.
• alternativeB–Themanagementstyleintheorganizationischaracterizedbyindividual risk taking, innovation, freedom, and uniqueness.
• alternative C – The management style in the organization is characterized by harddriving competitiveness, high demands, and achievement.
• alternative D – The management style in the organization is characterized by security of employment, conformity, predictability, and stability in relationships.
4 area = Organization Glue
• alternative A – The glue that holds the organization together is loyalty and mutual trust. Commitment to this organization runs high.
• alternative B – The glue that holds the organization together is commitment to innovation and development. There is an emphasis on being on the cutting edge.
• alternative C – The glue that holds the organization together is an emphasis on achievement and goal accomplishment.
• alternative D – The glue that holds the organization together is formal rules and policies. Maintaining a smooth-running organization is important.
5 area = Strategic Emphases
• alternative A – The organization emphasizes human development. High trust, openness, and participation persist.
• alternativeB –Theorganization emphasizes acquiring newresources and creatingnew challenges. Trying new things and prospecting for opportunities are valued.
• alternative C – The organization emphasizes competitive actions and achievement. Hitting stretch targets and winning in the marketplace are dominant.
• alternative D – The organization emphasizes permanence and stability. Efficiency, control and smooth operations are important.
6 area = Criteria of Success
• alternative A– Theorganizationdefines success on thebasis ofdevelopment ofhuman resources, teamwork, employee commitment, and concern for people.
• alternativeB –Theorganizationdefines success on thebasis ofhaving themost unique or newest products. It is a product leader and innovator.
• alternative C – The organization defines success on the basis of winning in the marketplace and outpacing the competition. Competitive market leadership is key.
• alternative D– Theorganizationdefines success on thebasis ofefficiency. Dependable delivery, smooth scheduling and low-cost production are critical.
Based on the Cameron and Quinn methodology (1999) these six areas were completed by respondents twice. Firstly, they allocated 100 points across the individual alternatives in each area, based on whichoptiontheybelievedmost accuratelyrepresentedthecurrent stateof-the-art. Based on this, it was possible to identify trends in managing existing culture. Then, respondents returned to the beginning. This time, by allocating 100 points, they indicated how they envisioned the company evolving over the next five years to achieve
exceptional success. Based on this, it was possible to identify the challenges related to corporate culture in management.
Subsequently, statistical software STATISTICA 12 was used to elaborate and analyze data. The results reached are presented in tables, using average values and confidence intervals (-95%; +95%). By averaging individual average values in all six partial areas, corporate culture type was calculated, firstly, in existing culture and subsequently in preferred culture. The significance of the differences was tested by inductive statistics using the Tukey HSD test, which allows multiple comparisons. Tukey HSD test was used because it focuses on the most significant value of the difference between two group means (Zaiontz, 2021). Differences were interpreted as statistically significant if p-level<0.05. The aim of the research was to identify trends and challenges concerning corporate culture in managing the forestry and wood-processing industry in Slovakia. The following hypotheses were verified:
WH1: Trends in managing the forestry and wood-processing industry in Slovakia, concerning individual areas of existing corporate culture, vary over time.
WH2:Trendsinmanagingtheforestryandwood-processingindustryinSlovakiaconcerning existing corporate culture vary over time.
WH3: Challenges in managing the forestry and wood-processing industry in Slovakia concerning individual areas of preferred corporate culture vary over time.
WH4: Challenges in managing the forestry and wood-processing industry in Slovakia concerning preferred corporate culture vary over time.
RESULTS AND DISCUSSION
Initially, the research focused on analyzing the existing corporate cultures in different areas to identify trends in managing Slovakia's forestry and wood-processing industry. The average values and confidence intervals were used. Based on the results presented in Table 1, it can be concluded that, with 95% confidence, when rating Alternative A in the area of Dominant Characteristics in 2020, respondents would give this alternative an average rating from 24.595 to 28.257 in similar research. The data from Table 1 further confirms that all alternatives were observed within the forestry and wood-processing industry under the area of Dominant Characteristics. However, respondents assigned the highest average rating to alternativeD for theyears 2020and2022.Accordingtoalternative D,respondents perceived enterprises as controlled and structured environments where formal processes were utilized for managing personnel. The findings also indicate a change in Dominant Characteristics in 2021 and 2023. During the period monitored, alternative A dominated. Respondents perceived the organization as a highly personal place akin to a multi-member family, fostering frequent employee interaction and shared experience.
Changes in the development of perception were also observed in the second area of investigation, focusing on Organizational Leadership. In 2020, respondents gave the highest average rating (from 26.238 to 30.002) to alternative B, indicating that leadership was characterized by entrepreneurship,innovation, and risk-taking,accordingto therespondents. In 2021, alternative A received the highest average rating (from 28.884 to 31.960) as respondents perceived leadership centered around mentoring, facilitation, and support. A change occurred in 2022, with alternative D achieving the highest average rating (from 28.912 to 34.777). Here, management was perceived to emphasize cooperation, order, and efficient functioning. In 2023, respondents reverted to the 2021 perception, emphasizing leadership focused on mentoring, facilitation, and support, with alternative A dominating.
Within the third area of investigation, which pertains to the Management of Employees, respondents consistently rated alternative A the highest in all years under examination (2020-2023) except for 2022. In their opinion, management styles in the forestry and wood-processing enterprises were characterized by teamwork, consensusbuilding, and fostering a sense of belonging. The change was noted in 2022 when alternative D reached the highest rating (from 30.277 to 35.797), reflecting a management style emphasizing job security, harmony, structured procedures, and stable relationships.
Additionally, the research explored the area of Organizational Glue. Findings indicate that, except for 2021, alternative D was predominantly observed over the monitored period. Respondents highlighted formal rules as a unifying element keeping forestry and woodprocessing businesses together. While operational efficiency was crucial, loyalty and mutual trust emerged as essential elements binding businesses together in 2021, where alternative A dominated.
Analysis of the fifth area investigated (Strategic Emphases) showed relatively stable development between 2020 and 2022. Respondents consistently rated alternative D the highest throughout this period, focusing on permanence, stability, efficiency, control, and smooth operation within the forestry and wood-processing enterprises. However, perceptions changed in 2023 towards strategies emphasizing employee development, trust, openness, and ongoing inclusivity, leading to alternative A predominating that year.
A similar trend in development was observed in the final area examined, which focused on the Criteria of Success. Respondents indicated that in the years 2020 to 2022, businesses in the forestry and wood-processing industry defined success primarily through efficiency. Key factors included reliable deliveries, well-managed logistics, and costeffective production, with alternative D being the prevailing choice. However, a change in perspective occurred in 2023, as alternative A achieved the highest average rating (from 25.118 to 30.568). Respondents perceived that companies defined success based on the growth of human resources, teamwork, employee commitment, and employee interest. The results reached are detailed in Table 1.
2
3
4
5
6
* 1 area = Dominant Characteristics; 2 area = Organizational Leadership; 3 area = Management of Employees; 4 area = Organization Glue; 5 area = Strategic Emphases; 6 area = Criteria of Success
Subsequently, the initial findings underwent statistical testing to verify the assumption that trends in managing the forestry and wood-processing industry in Slovakia, particularly in individual areas of existing corporate culture, varied over time (WH1). Table 2 presents the results where statistically significant differences are highlighted. Based on the findings, the hypothesis WH1 was confirmed. Thus, it can be concluded that trends in managing the forestry and wood-processing industry in Slovakia differ over time across individual areas of existing corporate culture.
Tab. 2 Statistical testing of trends in managing the forestry and wood-processing industry concerning individual areas of existing corporate culture.
1
2
3
4
* 1 area = Dominant Characteristics; 2 area = Organizational Leadership; 3 area = Management of Employees; 4 area = Organization Glue; 5 area = Strategic Emphases; 6 area = Criteria of Success; Statistically significant differences are highlighted in color if p-level<0.05.
Furthermore, the research examined the development of existing corporate culture between 2020 and 2023. As shown in Table 3, respondents perceived that all corporate culture types were applied during the observation period, with hierarchy corporate culture receiving the highest rating in 2020 and 2022. Based on the results presented in Table 3, it can be concluded that, with 95% confidence, when rating the corporate culture hierarchy in 2020, respondents would give this culture an average rating of 27.093 to 29.465 in similar research. The company's core values revolved around regulations, order, internal sustainability, stability, and control. Management practices emphasized organized coordination, monitoring, smooth operation, predictability, efficiency, and procedure accuracy. Top-down communication prevailed, with formal rules acting as a binding
element. Successful leaders were viewed as effective coordinators and organizers who prioritized maintaining operational smoothness, stability, and efficiency. Employee management is primarily focused on ensuring job security.
The results presented in Table 3 further indicate that a clan corporate culture was prevalent in 2021 and 2023. Respondents noted that during these years, management emphasized fostering a sense of family within the company. Individuals' goals were aligned with corporate goals based on their trust in the business. Loyalty and traditions were seen as foundational to the company, and a high level of dedication was exhibited. Emphasis was placed on the long-term development of each individual, and significance was attributed to cohesion, morale, and the work environment. Success was understood in connection with the internal environment and care for personnel.
Tab. 3 Trends in managing the forestry and wood-processing industry concerning existing corporate culture.
The results pertaining to overall corporate culture underwent statistical analysis. The analysis confirmed hypothesis WH2, indicating significant interannual differences in the perception of corporate culture types. Statistically significant differences are highlighted in Table 4.
Tab. 4 Statistical testing of trends in managing the forestry and wood-processing industry concerning existing corporate culture.
* Statistically significant differences are highlighted in color if p-level<0.05.
Subsequently, the research investigated the development of the preferred corporate culture, which should dominate in the future in the forestry and wood-processing industry in Slovakia, posing a managerial challenge. The investigation initially focused on six partial areasofcorporateculturebeforemovingonto assessingtheoveralltypeofcorporateculture. Based on the findings presented in Table 5, it can be stated that in the initial area of investigation, Dominant Characteristics, respondents preferred implementing tools associated with alternative A within a 5 to 10-year timeframe in the forestry and woodprocessing industry. This alternative received the highest average rating throughout the period analyzed. Further, it can be concluded that, with a 95% confidence, when rating alternative A in 2020, respondents would give this alternative an average rating from 31.574 to 35.626 in similar research. As per alternative A, companies are envisioned to function like a close-knit family, fostering frequent employee interactions.
In the subsequent area, Organizational Leadership, respondents indicated a preference for leadership grounded in principles of coordinating, organizing, or smooth-running efficiency, with alternative D emerging as the dominant choice. A change was observed in the year 2021, where respondents favored the adoption of alternative A, emphasizing the importance of management focusing on mentoring, facilitation, or nurturing in the future.
Respondents agreed and demanded a management approach centered on teamwork, consensus, and participation. In the third area of examination, Management of Employees, respondents showed a preference for using alternative A.
Consensus was reached in the area of Organization Glue, with a call to implement tools associated with alternative A over a 5 to 10-year period. Loyalty and mutual trust were critical elements for fostering unity within the company. An exception was noted in 2022, when respondents highlighted the attainment of objectives as the key element in maintaining organizational cohesion, leading to a preference for alternative C.
According to the respondents, the strategies of enterprises in the forestry and woodprocessing industry should focus on employee development, trust, openness, and continuous engagement. Throughout the entire period observed, alternative A was the preferred choice, except for 2022 when alternative D received the highest average rating (from 25.188 to 29.812). This suggests that strategies should prioritize permanence and stability. Emphasizing efficiency, control, and smooth operations should be crucial.
Similar findings were observed in the area of Criteria of Success. Results presented in Table 5 indicate that alternative A was preferred in 2020, 2021, and 2023 in the forestry and wood-processing industry. Success for these enterprises should be defined by the development of human resources, teamwork, employee commitment, and interest. In 2022, alternative D received the highest average rating (29.622 to 34.719), reflecting a demand for success linked to efficiency, reliable delivery, optimized logistics, and cost-effective production.
Tab. 5 Challenges in managing the forestry and wood-processing industry concerning individual areas of preferred corporate culture.
Areas of corporate culture Year
1 area
* 1 area = Dominant Characteristics; 2 area = Organizational Leadership; 3
=
Subsequently, the results underwent statistical testing. The outcomes presented in Table 6 support hypothesis WH3, indicating changes in the perception of partial areas of corporate culture over time whereas the interannual statistically significant differences were confirmed.
Tab. 6 Statistical testing of challenges in managing the forestry and wood-processing industry concerning individual areas of preferred corporate culture. Indicator
1
2
3
4
5
6
* 1 area = Dominant Characteristics; 2 area = Organizational Leadership; 3 area = Management of Employees; 4 area = Organization Glue; 5 area = Strategic Emphases; 6 area = Criteria of Success; Statistically significant differences are highlighted in color if p-level<0.05.
In the next stage, to identify the challenges in managing the forestry and woodprocessing industry, the investigation focused on assessing the overall preferred type of corporate culture desired by employees for the company's future development The results presented in Table 7 indicate a strong preference for a clan corporate culture in the 5 to 10year horizon. This culture consistently received the highest average rating in individual years. According to employees in the forestry and wood-processing industry, characteristics typical of a clan corporate culture should dominate in these enterprises in the future. The management's challenge lies in fostering a shared vision among employees. Employees should view themselves as integral members of a cohesive and engaged "family". The workplace environment should mirror an extended family, promoting equal opportunities for all employees. Leadership should embody mentorship, with leaders serving as guides, advisors, or parental figures. Core values should revolve around teamwork, participation, communication, and consensus.
Tab. 7 Challenges in managing the forestry and wood-processing industry concerning preferred corporate culture.
Despite clan corporate culture consistently receiving the highest average rating, statistical analysis confirmed differences. Differences were also confirmed in the perception of other corporate culture types (adhocracy, market, hierarchy). The results in Table 8 confirm hypothesis WH4.
Tab. 8 Statistical testing of challenges in managing the forestry and wood-processing industry concerning preferred corporate culture.
* Statistically significant differences are highlighted in color if p-level<0.05.
Trends and challenges in managing the forestry and wood-processing industry were examined through the research focused on corporate culture conducted in Slovakia from 2020 to 2023. The Organizational Culture Assessment Instrument was used, a tool for measuring corporate culture that is commonly employed in English-speaking countries This methodology has also been applied in studies by Balková and Jambal (2024), Sindakis et al. (2024), Igret et al. (2023), Pancholi and Devkar (2023), Assens-Serra et al. (2022), and others. Only high organizational effectiveness can ensure the competitiveness and commercial success of the company, which in turn depends on the corporate culture having developed in the organization (Vrabcova and Urbancova, 2023; Nazipova et al., 2017). In this context, the management must identify the corporate culture as it can improve corporate performance by providing meaning and purpose to daily work efforts. Corporate culture significantly influences the activities of employees, motivating them to achieve optimal results (Nazipova et al., 2017; Landekic et al., 2015; Teplická et al., 2015).
The research findings pointed out that a hierarchy and clan corporate culture predominated in the forestry and wood-processing industry in Slovakia. These businesses typically exhibited a formalized and structured work environment that emphasized procedures and regulations, with formal rules serving as a cohesive element. Effective leaders were characterized as skilled coordinators and organizers who prioritized the smooth operation, stability, and efficiency of the organization. Success was defined by the reliability of deliveries, adherence to schedules, and cost-effectiveness. Employee management is primarily focused on ensuring job security. Similar findings were confirmed by Calderón et al. (2022), Gebretsadik (2022), and Caliskan and Zhu (2019), who noted the prevalence of hierarchy corporate culture.
Alongside the hierarchy corporate culture, clan corporate culture named for its resemblance to family-type enterprises was most commonly found in the forestry and wood-processing industry in Slovakia. The working environment was perceived as friendly, with employees sharing similar values. Leaders often took on the roles of teachers or counselors, and sometimes even acted as parental figures. The companies were strengthened by loyalty and tradition,andemployees demonstratedastrongdevotiontotheirorganization. Emphasis was placed on the long-term development of each employee, with significant importance given to cohesion, morale, and the overall working environment. Success was viewed in relation to the internal environment and the care provided to employees. Teamwork, participation, and consensus were considered paramount. Clan corporate culture was also prevalent among a wide range of Czech businesses and trade unions across the country (Balková and Jambal, 2024), in public universities in Malaysia (Al Issa, 2019), and in junior high schools in Israel (Faddul et al., 2019). The research by Vlaicu et al. (2019)
using a similar methodology in Romania reached similar conclusions, highlighting the prevalence of a hierarchy culture followed closely by a clan corporate culture.
Employeesintheforestryandwood-processingindustryinSlovakiaexpressedadesire for clan corporate culture to be maintained in the future. According to the Cameron and Quinn methodology (1999), the challenge for company management is to foster a friendly working environment that resembles an extended family, where employees share common values. The fundamental values should revolve around teamwork, collaboration, communication, and consensus. Employees should view themselves as integral members of a dynamic and committed family. Emphasizing each employee's long-term development should be essential. The cohesion, morale, and work environment of the businesses should be fortified by loyalty and traditions, fostering a solid commitment to the company. Leadership should adopt a mentoring approach, with leaders acting as mentors, advisors, or parental figures. Success should be gauged based on the internal environment and the care devoted to each employee, as human capital plays a crucial role in increasing the productivity, output of an organization, and competitive advantage. It is confirmed by the research of Hitka et al. (2023), Kucharcíková et al. (2015) and Übius and Alas (2009), according to which human capital is involved in the creation of the market value of the company and also represents the most valuable source of company. Similar challenges are highlighted in the research conducted by Balková and Jambal (2024), Dobrin et al. (2021), which suggests that clan corporate culture should prevail in companies moving forward. According to the research by Bing-You et al. (2019), Dostiyrova (2016), and Goula et al. (2014), a clan corporate culture should be applied in the future. This culture emphasizes shared values, loyalty, and traditions that foster a friendly work environment. Similarly, Andrianu (2020) found that clan corporate culture is preferred due to its strong focus on employees. These findings align with research by Belias et al. (2015), which indicates that most employees prefer working in a friendly environment characterized by mutual trust, informal relationships, consideration of personal ambitions, and recognition of teamwork. Cucek and Kac(2020)addthatemployees favora clanculture,increasing satisfaction.These conclusions are supported by the research of Qin et al. (2015), emphasizing that human relationships and social connections within an organization contribute to a harmonious work environment, uniting management and employees in achieving strategic objectives.
CONCLUSION
The current business environment is characterized by trends such as globalization, the industrial revolution, digitization, artificial intelligence, sustainability, and others, impacting business operations across all industries. The primary trend in managing the forestry and wood-processing industry in Slovakia concerning corporate culture was a combination of elements of hierarchy and clan corporate culture. The challenge and, at the same time, the recommendation for the management of the forestry and wood-processing industry in Slovakia is to implement a clan corporate culture further. It is suggested that managers cultivate a work environment that mirrors an extended family, offering equal opportunities to all employees. A friendly working environment, where employees share common values, should be supported. Leaders should act as teachers or advisors and sometimes even as parental figures. Management should take steps to ensure that loyalty and tradition are the foundational elements thatunitethe business. Highlevels of devotionto the companyshould be encouraged, and the long-term development of each employee should be prioritized. Great importance should be placed on cohesion, morale, and the working environment.
Success should be understood in relation to the internal environment and the care provided to employees.
Research findings provide a picture of trends and challenges in managing concerning corporate culture, filling the gap in understanding existing and preferred corporate culture in the forestry and wood-processing industry in Slovakia. The research result can benefit managers when creating a suitable corporate culture. The focus was placed on the forestry and wood-processing industries, which can be considered a research limitation. Therefore, the future research direction could focus on examining corporate culture in different industries in Slovakia, as well as from the perspective of socio-demographic factors, due to the importance of respecting the individual characteristics of employees when developing, enhancing, and aligning with corporate culture, as it can influence employee performance and subsequently, the company's overall outcomes.
REFERENCES
Abernethy,M.A.,Hung,C.Y.,Jiang,L.K.,2024.Managers'careerpreferencesand corporateculture. Contemporary Accounting Research, 41(3), 1543–1576. https://doi.org/10.1111/19113846.12948
Al Issa, H.E., 2019. Organisational culture in public universities: Empirical evidence. Asian Journal of Business and Accounting, 12(1), 41–70. https://doi.org/10.22452/ajba.vol12no1.2
Andrianu, A.B., 2020. Resilient organizational culture: Cluj-Napoca case study. Eastern Journal of European Studies, 11(1), 335–357.
Angelini, E., Wolf, A., Wijk, H., Brisby, H., Baranto, A., 2021. The impact of implementing a person-centred pain management intervention on resistance to change and organizational culture. BMC Health Services Research, 21,1323. https://doi.org/10.1186/s12913-021-06819-0
Anishchenko, V., Vdovenko, I., Tretyak, O., Chebonenko, S., Prytulyk, N., 2023. Full-scale military invasion of the Russian Federation of Ukraine as a factor of social transformations in higher education. Amazonia Investiga, 12(61), 287–296. https://doi.org/10.34069/AI/2023.61.01.29
Aparna, K.G., Swarnalatha, R., Changmai, M., 2024. Optimizing wastewater treatment plant operational efficiency through integrating machine learning predictive models and advanced control strategies. Process Safety and Environmental Protection, 188, 995–1008. https://doi.org/10.1016/j.psep.2024.05.148
Asif, M., Yang, L., Hashim, M., 2024. The role of digital transformation, corporate culture, and leadership in enhancing corporate sustainable performance in the manufacturing sector of China. Sustainability, 16(7), 2651. https://doi.org/10.3390/su16072651
Assens-Serra, J., Boada-Cuerva, M., Serrano-Fernández, M.J., Villajos, E., Boada-Grau, J., 2022. Spanish Adaptation of the Organizational Culture Assessment Instrument: Reflection on the Difficulty in Transferring the ad hoc Factor. Frontiers in Psychology, 12, 817232. https://doi.org/10.3389/fpsyg.2021.817232
Balková, M., Jambal, T., 2024. Evaluation of organizational culture in enterprises in the Czech Republic using OCAI. Frontiers in Psychology, 14, 1297041. https://doi.org/10.3389/fpsyg.2023.1297041
Begum, A., 2022. Rebuilding public trust through the lens of corporate culture: an inevitable necessity to sustain business success in Australia. Journal of Money Laundering Control, 25(2), 280–296. https://doi.org/10.1108/JMLC-07-2021-0067
Belias, D., Koustelios, A., Vairaktarakis, G., Sdrolias, L., 2015. Organizational culture and job satisfactionof Greekbanking institutions.Procedia –Social and Behavioral Sciences, 175,314–323. https://doi.org/10.1016/j.sbspro.2015.01.1206
Bendak, S., Shikhli, A.M., Abdel-Razek, R.H., 2020. How changing organizational culture can enhance innovation: Development of the innovative culture enhancement framework. Cogent Business & Management, 7(1), 1712125. https://doi.org/10.1080/23311975.2020.1712125
Bing-You, R., Ramani, S., Ramesh, S., Hayes, V., Varaklis, K., Ward, D., Blanco, M., 2019. The interplay between residency program culture and feedback culture: A cross-sectional study exploring perceptions of residents at three institutions. Medical Education Online, 24(1), 1611296. https://doi.org/10.1080/10872981.2019.1611296
Calderón, G., Vivares, J.A., Jiménez, J.M., 2022. Towards an understanding of Colombian organizational culture. A Competing Values Approach. Revista Universidad Empresa, 24(43), 1–29.
Caliskan, A., Zhu, C., 2019. Organizational culture type in Turkish universities using OCAI: Perceptions of students. Journal of Education Culture and Society, 10(2), 270–292. https://doi.org/10.15503/jecs20192.270.292
Cameron, K.S., Quinn, R.E., 1999. Diagnosing and Changing Organizational Culture: Based on the Competing Values Framework, Addison-Wesley Publishing.
Cucek, M., Kac, S.M., 2020. Organizational culture in logistics sector and its relation to employee satisfaction. Management: Journal of Contemporary Management Issues, 25(2), 165–180. https://doi.org/10.30924/mjcmi.25.2.9
Demski, D., Van Ackeren, I., Clausen, M., 2016. The interrelation of school culture and evidencebased practice - Findings of a survey using the Organizational Culture Assessment Instrument. Journal for Educational Research Online-Jero, 8(3), 39–58.
Dobrin, C., Dinulescu, R., Dima, C., 2021. Evaluating the organizational culture from Romanian private companies using the Organizational Culture Assessment Instrument (OCAI). Studies in Business and Economics, 16(3), 60–71. https://doi.org/10.2478/sbe-2021-0045
Dostiyrova, A., 2016. Students' perception of organizational culture at KIMEP university based on OCAI instrument. Bulletin of the National Academy of Sciences of the Republic of Kazakhstan, 3(361), 89–94.
Faddul, N.K., Bibu, N.A., Danaiata, D., 2019. The organizational culture in junior High Schools in the Druze Sector. Quality-Access to Success, 20, 571–576.
Fiedler, N.C., de Campos, A.A., Caldeira, M.V.W., Lima, J.S.D., Ramalho, A.H.C., Lopes, E.D., 2020. Economic and operational analysis of mechanized forest implementation. Revista Árvore, 44, E4422. https://doi.org/10.1590/1806-908820200000022
Gameiro, T., Pereira, T., Viegas, C., Di Giorgio, F., Ferreira, N.M.F., 2024. Robots for forest maintenance. Forests, 15(2), 381. https://doi.org/10.3390/f15020381
Gebretsadik, D.M., 2022. Impact of organizational culture on the effectiveness of public higher educational institutions in Ethiopia. International Journal of Leadership in Education, 25(5), 823–842. https://doi.org/10.1080/13603124.2020.1722248
Gorzelany, J., Gorzelany-Dziadkowiec, M., Luty, L., Firlej, K., Gaisch, M., Dudziak, O., Scott, C., 2021.Findinglinksbetweenorganization’scultureandinnovation.Theimpactoforganisational culture on university innovativeness. Plos One, 16(10), e0257962. https://doi.org/10.1371/journal.pone.0257962
Goula, A., Kefis, B., Stamouli, M.A., Pierrakos, G., Sarris, M., 2014. Investigation of the organizational culture of general public hospitals. Archives of Hellenic Medicine, 31(4), 452–460.
Guiso, L., Sapienza, P., Zingales, L., 2015. The value of corporate culture. Journal of Financial Economics, 117, 60–76. https://doi.org/10.1016/j.jfineco.2014.05.010
Herget, J. 2023. Challenges to corporate culture: Today and tomorrow. Shaping Corporate Culture, 149–157. https://doi.org/10.1007/978-3-662-65327-2_14
Heritage, B., Pollock, C., Roberts, L., 2014. Validation of the Organizational Culture Assessment Instrument. Plos One, 9(3), e92879. https://doi.org/10.1371/journal.pone.0092879
Hitka, M., Lizbetinová, L., Lejsková, P., Nedeliaková,E., Sydor, M., 2023. Differences in employee motivation in wood-processing enterprises in selected countries of central Europe. Acta Facultatis Xylologiae Zvolen, 65(2), 135–147. https://doi.org/10.17423/afx.2023.65.2.12
Igret, R.S., Busu, M., Goia, S. I., Marinas, C.V., Radu, C., 2023. The mediating role of entrepreneurialleadershipbetweenperceived organisationalcultureandengagement. Economic Computation and Economic Cybernetics Studies and Research, 57(3), 173–186. https://doi.org/10.24818/18423264/57.3.23.10
Jaeger, M., Yu, G., Adair, D., 2017. Organisational culture of Chinese construction organisations in Kuwait. Engineering Construction and Architectural Management, 24(6), 1051–1066. https://doi.org/10.1108/ECAM-07-2016-0157
Jones, D.A., Willness, C.R., Madey, S., 2014. Why are job seekers attracted by corporate social performance? Experimental and field tests of three signal-based mechanisms. The Academy of Management Journal, 57(2), 383–404. https://doi.org/10.5465/amj.2011.0848
Karlsson, M., Karlsson, F.,Åström, J., Denk, T., 2022.Theeffect of perceived organizational culture on employees' information security compliance. Information and Computer Security, 30(3), 382–401. https://doi.org/10.1108/ICS-06-2021-0073
Kucharcíková, A., Tokarcíková, E., Durisová, M., 2015. Human capital efficiency in trading company, in: Proceedings of the 9th International Days of Statistics and Economics. Prague, pp. 892–901.
Landekic, M., Sporcic, M., Martinic, I., Bakaric, M., 2015. Influence of organizational culture on firm efficiency: Competing values framework in Croatian forestry. Scandinavian Journal of Forest Research, 30(7), 624–636. https://doi.org/10.1080/02827581.2015.1046480
Li, C., Wang, C., Xue, C., 2024. Clan culture and corporate innovation. Pacific-Basin Finance Journal, 83, 102229. https://doi.org/10.1016/j.pacfin.2023.102229
Li, K., Mai, F., Shen, R., Yan, X., 2021. Measuring corporate culture using machine learning. The Review of Financial Studies, 34(7), 3265–3315. https://doi.org/10.1093/rfs/hhaa079
Liao, Z.J., 2019. Corporate culture, environmental innovation and financial performance. Business Strategy and the Environment, 27(8), 1368–1375. https://doi.org/10.1002/bse.2186
Lühr, G.J., Bosch-Rekveldt, M.G.C., Radujkovic, M., 2022. Key stakeholders' perspectives on the ideal partnering culture in construction projects. Frontiers of Engineering Management, 9(2), 312–325. https://doi.org/10.1007/s42524-020-0135-z
Machova, R., Korcsmaros, E., Csereova, A., Varga, J., 2023. Innovation activity of Slovak ICT SMEs. Journal of Business Sectors, 1(1), 32–41. https://doi.org/10.62222/HTPI2054
Mikusová, M., Rydvalová, P., Klabusayová, N., Konecny, F., 2023. Has COVID-19 affected the organisational culture of non-governmental organisations? E & M Ekonomie a Management, 26(3), 70–91. https://doi.org/10.15240/tul/001/2023-3-005
Nazipova, A., Koshkina, I.A., Faizova, G., 2017. Scheme of influence of elements of corporate culture on indicators of economic effectiveness of the organization. Journal of Fundamental and Applied Sciences, 9, 1589–1601.
Neykov, N., Kristáková, S., Hajdúchová, I., Sedliaciková, M., Antov, P., Gierliová, B., 2021. Economic efficiency of forest enterprises Empirical study based on data envelopment analysis. Forests, 12(4), 462. https://doi.org/10.3390/f12040462
Pancholi, J., Devkar, G., 2023. Analysing the influence of organizational culture in projects using Last Planner System. Construction Economics and Building, 23(3–4), 143–169. https://doi.org/10.5130/AJCEB.v23i3/4.8804
Piwowar-Sulej, K., Blstáková, J., Lizbetinová, L., Zagorsek, B., 2024. The impact of digitalization on employees' future competencies: Has human resource development a conditional role here? Journal of Organizational Change Management, 37(8), 36–52. https://doi.org/10.1108/JOCM10-2023-0426
Potkány, M., Neykov, N., Streimikis, J., Lesníková, P., 2024. Circular economy efficiency in the context of wastemanagement intheselected Centraland Eastern European countries – evidence from DEA and fractional regression analysis. Journal of Scientific Papers ECONOMICS & SOCIOLOGY, 17(3), 175–195. https://doi.org/10.14254/2071- 789X.2024/17-3/10
Qin, Y., Li, B., Yu, L., 2015. Corporate culture and company performance: A case study of home inns in China. Asia Pacific Journal of Tourism Research, 20(9), 1021–1040. https://doi.org/10.1080/10941665.2014.949280
Sagar, A., Kärhä, K., Einola, K., Koivusalo, A., 2024. Assessing the potential of onboard LiDARbased application to detect the quality of tree stems in Cut-to-Length (CTL) harvesting operations. Forests, 15(5), 818. https://doi.org/10.3390/f15050818
Samli, E., 2024. Shaping corporate culture for sustainable business success. Journal of Organizational Change Management, 37(2), 463–464. https://doi.org/10.1108/JOCM-03-2024514
Samsie, I., Rahman, T.K.B.A., Suarga., 2020. The mapping of organizational culture to find determinant factors for behavioral intention to use in IT utilization among credit unions in Indonesia, in: Proceedings of Icoris 2020: 2020 The 2nd International Conference on Cybernetics and Intelligent System (ICORIS), pp. 340–343. https://doi.org/10.1109/ICORIS50180.2020.9320814
Simovic, O., Perovic, D., Raicevic, M., 2020. How organizational culture influences satisfaction of employees shown on the example of tourism businesses in Montenegro. Interdisciplinary Description of Complex Systems, 18(2-B), 223–240. https://doi.org/10.7906/indecs.18.2.11
Sindakis, S., Kitsios, F., Kamariotou, M., Aggarwal, S., Cuervo, W.J.M., 2024. The effect of organizational culture and leadership on performance: A case of a subsidiary in Colombia. Journal of General Management, 49(2), 115–132. https://doi.org/10.1177/03063070221100048
Stacho, Z., Potkány, M., Stachová, K., Marcineková, K., 2016. The organizational culture as a support of innovation processes' management: A case study. International Journal for Quality Research, 10(4), 769–783. https://doi.org/10.18421/IJQR10.04-08
Stacho, Z., Stachová, K., Varecková, L., Matúsová, J.G., 2021. Direction of businesses operating in Slovakia to develop key managerial competencies. Production Engineering Archives, 27(4), 291–295. https://doi.org/10.30657/pea.2021.27.39
Sun, P.X., Cui, T., Qi, S., 2024. An integrated decision-making method for corporate culture influence evaluation with intuitionistic fuzzy multiple attribute group decision-making. Journal of Intelligent & Fuzzy Systems, 46(1), 297–307. https://doi.org/10.3233/JIFS-232044
Teplická, K., Čulková, K., Železník, O., 2015. Application of bayess principle optimumOptimization model for managerial decision and continual improvement. Polish Journal of Management Studies, 12(2), 170–179.
Teplická, K., Hurná, S., 2021. New approach of costs of quality according their trend of during long period in industrial enterprises in SMEs. Management Systems in Production Engineering, 29(1), 20–26. https://doi.org/10.2478/mspe-2021-0003
Teräväinen, V.J., Junnonen, J.-M., Ali-Löytty, S., 2018. Organizational culture: Case of the Finnish construction industry. Construction Economics and Building, 18(1), 48–69. https://doi.org/10.5130/AJCEB.v18i1.5770
Tian, V.-I., Tang, F., Tse, A.C.B., 2022. Understanding corporate culture and business performance from a Confucian perspective. Asia Pacific Journal of Marketing and Logistics, 34(4), 759–777. https://doi.org/10.1108/APJML-08-2020-0555
Todorova, T., 2024. Corporate culture and corporate strategy: Some economic aspects of the modern organisation. International Journal of Business Performance Management, 25(1), 147–158. https://doi.org/10.1504/IJBPM.2024.135136
Übius, Ü., Alas, R., 2009. Organizational culture types as predictors of corporate social responsibility. Engineering Economics, 61(1), 90–99.
Vlaicu, F.L.,Neagoe, A.,Tîru, L.G.,Otovescu,A., 2019. Theorganizationalculture ofamajor social work institution in Romania: A sociological analysis. Sustainability, 11(13), 3587. https://doi.org/10.3390/su11133587
Vrabcova, P., Urbancova, H., 2023. Sustainable innovation in agriculture: Building a strategic management system to ensure competitiveness and business sustainability. Agricultural Economics, 69(1), 1–12. https://doi.org/10.17221/321/2022-AGRICECON
Zaiontz, CH., 2021. TukeyHSD(Honestly SignificantDifference). [online]. 2021.[cit. 2024-11-05]. Available at: https://www.real-statistics.com/one-way-analysis-of-variance-anova/unplannedcomparisons/tukey-hsd/
Zervea, E., Apostolakis, I., Malliarou, M., Sarafis, P., 2021. Organizational culture and resistance to change in the Chania General Hospital. Upgrade of service quality. Archives of Hellenic Medicine, 38(5), 624–634.
ACKNOWLEDGMENT
The research was supported by projects VEGA 1/0093/23 “Research of the potential of the circular economy in the Slovak business environment in the production of innovative products based on recycled materials wood -rubber –plastic”, VEGA 1/0161/21 “Dependence of the type of corporate culture on the industries of Slovak enterprises and selected socio-demographic factors”, KEGA 012UCM-4/2022 “Human Resources Management in a Digital World ‒ A Bilingual (SlovakEnglish) Course Book with E-learning Modules based on Multimedia Content”, and APVV-20-0004 “The effect of an increase in the anthropometric measurements of the Slovak population on the functional properties of furniture and the business processes” for support to carry out this research.
AUTHORS’ ADDRESSES
doc. Ing. Silvia Lorincová, PhD. Technical University in Zvolen
T. G. Masaryka 24 960 01 Zvolen silvia.lorincova@tuzvo.sk
ACTA FACULTATIS XYLOLOGIAE ZVOLEN, 66(2): 155 171, 2024
Zvolen, Technická univerzita vo Zvolene
DOI: 10.17423/afx.2024.66.2.13
AGILITY ASSESSMENT IN THE WOODWORKING COMPANY
Katarína Marcineková – Andrea Janáková Sujová – Martin Halász
ABSTRACT
Agility has become a strategic priority for organizations striving to succeed in dynamic and unpredictable environments. This study is aimed at evaluating the agility of a Slovak woodworking company based on the application of a proposed assessment framework by authors to find out the agility level, the main gaps in its agility practices, and how these gaps can be addressed to improve agility. The custom-designed agility maturity model, structured interviews, questionnaires, and diagnostic tests are used in the research to examine 35 key agility elements and seven dimensions, including organization, processes, change culture, human resources, customer engagement, and innovation. The findings reveal significant gaps in process management, technology integration, and customer orientation, where agile practices are partially recognized but still need to be fully implemented. Actionable recommendations are proposed to enhance operational flexibility, foster innovation, and improve customer-centricity. This study demonstrates the critical role of agility in maintaining competitiveness and provides a roadmap for its systematic enhancement in small and medium-sized enterprises.
Keywords: agile maturity model; agility evaluation; woodworking company; enterprise agility; change management.
INTRODUCTION
Agility and agile principles were first introduced in the Agile Manifesto, focusing on uncovering better software development (Beck et al., 2001). Business agility is defined as an organization's ability to swiftly and effectively adapt its business and processes to unpredictable internal and external changes, enhancing flexibility and responsiveness (Oosterhout et al., 2006). It enables businesses not only to manage but also capitalize on opportunities arising from dynamic environments. Couto (2015) emphasized the importance of quick responsiveness in agile businesses, highlighting both reactivity and proactivity and stated that agility is among the top 10 organizational concerns. Nowadays, it is crucial for businesses to adapt to changing circumstances and shape them, as they face increasing levels of uncertainty (Girod, et al., 2023). Agility is the ability of a system to respond to change, and it is essential to adopt a holistic perspective, as a firm comprises processes that vary in complexity. Less complex processes are more accessible to modify and, therefore, more agile (Arteta and Giachetti, 2004).
The principles of agility revolve around fostering adaptability, speed, and responsiveness across all levels of an organization. According to Tseng and Lin (2011), agility is rooted in four key drivers: responsiveness, competency, flexibility (adaptability),
and quickness (speed). Responsiveness entails identifying and reacting swiftly to external changes, while competency ensures that organizations possess the necessary skills, resources, and processes to deliver effective solutions. Flexibility allows businesses to restructure processes and resources to align with evolving demands, and quickness focuses on minimizing the time required to implement changes (Tamtam and Tourabi, 2019). Christopher (2000) highlights the importance of focusing on customer needs in agile practices. Additionally, agility emphasizes continuous improvement and iterative approaches, enabling firms to test, learn, and adapt without significant delays (Beck et al., 2001). These principles underscore the need for in-depth analysis to evaluate the level of business agility.
Agility is widely applied in business, economy, management, and business finance. Agility played a significant role in enhancing flexibility and responsiveness in supply chain management (Rathod et al., 2019), lean processes (Narasimhan et al., 2006), and business process management (BPM) (Fertalj and Matejas, 2015). Agile principles have been applied inmanufacturingandsupplychainmanagementtoimproveadaptabilityandcompetitiveness by promoting flexibility and rapid response to market changes (Berthot, 2023). Agile supply chain practices enhance responsiveness to disruptions, optimizing inventory and delivery times (Shpak et al.,2023; Alzoubi et al., 2022). Agile BPM emphasizes continuous improvement, flexibility, and rapid iteration, allowing businesses to adapt processes swiftly to new information or environmental changes. This synergy between BPM and agility ensures that organizations remain resilient, competitive, and capable of sustaining long-term growth in dynamic environments (Badakhshan et al , 2019).
Agile methodologies are more flexible and responsive to change than traditional methodologies. Key components include Adaptive Planning (Wang et al., 2010), Iterative Processes (Larson, 2019), Collaboration and Communication (Papadopoulos, 2015), Flexibility and Responsiveness (Imgrund and Janiesch, 2019), and a focus on Value and Innovation (Diego et al., 2020). In business management, finding the golden mean between traditional and agile methodologies (Perides et al., 2021; Milenković et al., 2019). This integration allows organizations to benefit from structured planning and risk management while leveraging the flexibility and iterative nature of agile methodologies. Agility is vital for enterprises as it enhances their ability to respond to market fluctuations, seizeemergingopportunities, andmitigateuncertainrisks. Agility enablesfirms to senseand respond quickly to market changes and positively affects profitability, speed to market, and customer satisfaction (DeGroote and Marx, 2013). It fosters innovation by creating an environment where processes and strategies can be adjusted to meet evolving demands. Firms with strong agility capabilities are better at leveraging innovation for competitive advantage (Ashrafi et al., 2019). Furthermore, agility drives operational efficiency by streamlining workflows, reducing redundancies, and enabling quicker decision-making (Kock and Gemünden, 2016).
Agility in resource integration allows companies to be more responsive to customer needs, therebyimproving customersatisfactionand loyalty (Findsrud,2020).Agilepractices prioritize customer collaboration, ensuring that development aligns with user needs, which helps deliver market-driven products (Chakravarty and Singh, 2024).
Nowadays, business agility is considered a key success factor in the dynamic business sphere. Agility assessment is the starting point in the journey toward gaining a competitive advantage and ensuring a company's success. Following this initial step, overall agility can be analyzed, leading to developing an action plan and implementing necessary changes
(Mahapatra and Shenoy, 2021). Assessing agility can reveal inefficient processes, leading to reduced time to market (Kumar and Dhas, 2023), faster decision-making (Leroux and Wright, 2010), and increased overall operational efficiency. Identifying key agile categories, such as agility factors and dimensions, provides a coherent view of an organization's current state (Walter, 2020).
Various assessment methods have been developed to better understand and measure agility within organizations (Looks et al., 2021; Gren et al., 2015; Ganguly et al., 2009). Looks et al. (2021) developed a questionnaire measuring team agility, encompassing six dimensions: communication, openness to change, iterativity, self-organization, focus on products, and continuous improvement. Their approach involved professional reviews and a case study for validation. Rdiouat et al. (2021) proposed a three-level structure for each perspective, consisting of a mission, critical success factors, and criteria for agility assessment. Chacko and Suresh (2021) employed a multi-grade fuzzy approach, classifying attributes using Importance Performance Analysis (IPA). Their model assists startups in assessing their agility index, focusing on identifying weaknesses and implementing improvements. Shafiabady et al. (2023) developed an AI model that facilitates proactive adjustments to enhance agility and identifies both obstacles and benefits associated with improving agility to predict the future level of organizational agility. Yu and Heng (2006) developed an index system for measuring agility, identifying three levels of agility: low, medium, and high. When combined with methods like the Analytical Hierarchy Process (AHP) and Bayesian Belief Networks (BBN), managers can make informed decisions supported by comprehensive data analysis.
One notable example is the method developed by Gergin et al. (2022), which utilizes a comprehensive questionnaire composed of 51 questions. These questions are grouped into eight categoriesthat defineagility: Technology & Innovation; Collaboration& Involvement; Responsiveness & Reactivity; Connectivity & Integration; Adaptability & Quick Changeover; Efficiency; Continuous Improvement & Versatility; and Time. This structured approach allows for a detailed evaluation of an organization's agility across multiple dimensions, providing valuable insights for balancing traditional and agile methodologies. Agility Maturity Models (AMMs) are designed to evaluate an organization's current agility level, identifyareas forimprovement,andprovide astructuredpathwayfor enhancing agility across various dimensions, making them a critical tool in agility assessment (Wendler, R., 2014). Schmitt et al. (2019) analyzed 14 Agile Maturity Models (AMMs), defined criteria for their comparison, and highlighted the pros and cons of each model. In conclusion, they recommended the AMM model by Patel and Ramachandran as it meets most of the defined criteria and is based on the Capability Maturity Model Integration (CMMI). In the study by Carvalho et al. (2019), a model based on CMMI was developed to create a unique approach for determining organizational agility through specific maturity levels. In this model, the traditional first level is subdivided into individual levels to provide a more precise characterization of the initial phases of agility implementation. A scoring method was employed, with the Zeroth level corresponding to 0%, the first level ranging from 1% to 20%, the second level from 21% to 40%, the third level from 41% to 60%, the fourth level from 61% to 80%, and the fifth level from 81% to 100%.
After agility assessments, key areas for resource optimization can be identified, leading to better allocation and utilization (Vasanthan and Suresh, 2021).
After the resource analysis, it could be stated that many approaches to agility evaluation are excessively complex and theoretical, and it is difficult to apply them to the market environment. Manypublications focus onorganizational agilityassessment,but most tend to concentrate on theoretical model creation, which can be challenging to apply in
practical conditions. While having a comprehensive theoretical background is essential, there remains a gap in the future development of agility assessment.
Even though agility enhancement is essential for every market competitor, there is a lack of comprehensive studies focusing on the Slovak woodworking industry. This gap in theliterature presents asignificant opportunity to explorehow companies in this sectoradapt to changes and manage agility. The woodworking industry, characterized by its reliance on traditional practices and modern technological advancements, faces unique challenges requiring agile responses. Therefore, exploring how companies in this sector adapt to changes and manage agility is essential. In comparing recent research publications and the focus of our study, we identified a gap in the understanding of agile methods by large corporations versus small enterprises. Most papers concentrate on large corporations or technological giants (Edison et al., 2022; Moe and Mikalsen, 2020; Alqudah and Razali, 2016), but the real competition primarily consists of many small and medium-sized enterprises (SMEs). More than 99.7% of companies in the Slovak woodworking industry are classified as SMEs.
To address the gaps mentioned above, our study focuses on a set of key research questions aimed at deepening our understanding of agility within a specific Slovak woodworking enterprise:
• How does the selected woodworking enterprise perceive its current level of agility, and what challenges does it face in enhancing its agility?
• Which specific agility factors and dimensions are most critical to the selected enterprise?
• How effective are the current change management practices within the selected enterprise in addressing market challenges?
These questions will guide the research methodology, focusing on structured interviews and questionnaires to gather in-depth insights into the agility practices of the Slovak woodworking enterprise. This approach helps identify the company’s strengths in agility and areas for potential improvement, allowing us to recommend adjustments that balance traditional and agile methodologies. The study aims to comprehensively assess the overall agility and provide actionable recommendations for enhancing agility and achieving a competitive edge in the analyzed company.
MATERIALS AND METHODS
This study evaluated the approach to agility in a woodworking company by employing amulti-faceteddata collection process, including structuredinterviews, ananalysis ofagility practices via a questionnaire, and a diagnostic test of agility evaluated in the study. These methods were chosen to comprehensively assess the company's agility across multiple dimensions, ensuring a holistic understanding of its practices and challenges. The methodology aligns with the proposed assessment framework, which combines established theoretical models of agility with practical evaluation tools. This approach addresses the research questions, focusing on identifying the company's agility level, key factors influencing it, and strategies for improvement. The chosen company, a small-sized enterprise with up to 50 employees, has been producing construction and carpentry products for 25 years. Its size and long-term operations make it a suitable case study to validate the proposed methodology, as it provides a clear context for examining the interplay between traditional practices and agility requirements. Data sources included direct insights from the
owners and information from the company's annual reports, ensuring the relevance and accuracy of the analysis.
Assessment framework
The Agility Maturity Model (AMM) used in this study was developed by integrating insights from established frameworks and models discussed in the literature. Heng (2006) provided foundational ideas with an index system for measuring agility. This approach inspired the inclusion of structured levels in our model to evaluate agility comprehensively. Building on Heng's concept, Schmitt et al. (2019) reviewed 14 Agile Maturity Models (AMMs) and emphasized the value of frameworks that balance theoretical rigor with practical applicability. Their recommendation of the AMM model by Patel and Ramachandran, based on Capability Maturity Model Integration (CMMI), reinforced the importance of incorporating detailed maturity levels to capture nuanced agility stages. We adopted this principle by structuring our model into five levels, ensuring precision and flexibility in assessing organizational adaptability. Carvalho et al. (2019) contributed additional inspiration with a modified CMMI-based model, introducing finer subdivisions within early maturity levels to provide a granular understanding of initial agility adoption. This directly influenced our decision to break down the "Agility Awakening" stage into lower and middle ranges, enabling a more detailed evaluation of early-stage agility.
By synthesizing these inspirations, our custom-designed Agility Maturity Model bridges theoretical foundations with practical needs, ensuring its relevance for small enterprises like the woodworking company examined in this study. The dimensions assessed include:
1. Organization: focuses on the company's ability to create flexible structures, leadership and decision-making that support agility
2. Strategy: evaluates how strategic planning, goals and strategy encourages agile practices.
3. Processes and systems: analyses the efficiency and adaptability of core operational processes.
4. Customer engagement and responsiveness: Measures the company’s ability to respond to changing customer needs and preferences.
5. Products and services: assesses the company’s commitment to innovation and ongoing improvement in products and services.
6. Culture of change: evaluates how the company is ready and open to changes, its ability and willingness to take risks.
7. Employee Development and Collaboration: focuses on the ability of employees to collaborate and develop skills that contribute to organizational agility.
Each dimension is broken down into five maturity levels, ranging from Zeroth to Fourth Level, providing a detailed framework for assessing the company’s agility
0 Agility Ignorance (0%):Noagileprinciplesareapplied,andprocessesareunsystematic.
1. Agility Awakening – low agility (1% to 25%): Awareness of agile principles begins, but decision-making is slow, and structures are rigid.
2 Agility Understanding – middle agility (26% to 50%): Basic agile practices are implemented with some adaptability, but not fully integrated across the company.
3 Agility Integration – high agility (51% to 84%): Agile principles are integrated throughout the organization, enabling fast decision-making and effective adaptation to change.
4. Agility Excellence (85% to 100%): The company continuously optimizes agile practices using data and proactively anticipates market trends.
Methods of data collection
Structured interviews are a systematic method for collecting consistent and detailed data, often used to explore organizational dynamics (Kallio et al., 2016). In this study, interviews with the company’s owners focused on their agility challenges and strategies. Inspired by Srivastava et al. (2023), who explored digital agility in higher education, this method was adapted to the business context, aligning questions with the research objectives to gather insights into key agility dimensions. The aim was to understand how the company handled challenges arising from the COVID-19 crisis and subsequent economic disruptions. The interview comprised 14 questions organized into three main areas:
- Obstacles and Challenges: identify key barriers faced during the crisis.
- Realized Solutions: explore measures implemented to overcome these challenges.
- Reached results: the impact of the solutions on core business processes and financial results
Agility assessment questionnaire was designed to evaluate the company’s attitude, perception, and application of agility across its operations. It was completed by the company’s two owners and all five managers, totaling seven respondents, ensuring comprehensive input from key decision-makers and operational leaders. The questionnaire consisted of two sections: General Company Information (questions A - E) and the Agile Practices Survey (questions 1 - 15), which focused on assessing the adoption of agile methodologies, identifying practices implemented in various departments, and evaluating the company’s overall commitment to agility. This method draws inspiration from Looks et al. (2021),whodevelopedastandardized questionnaireformeasuringteam-level agility,and Bottani (2009), who used case studies in two manufacturing companies to reveal the perception of agility drivers, attributes, enablers, and their corresponding degree of implementation. These sources guided the structure and content of the questionnaire, ensuring a detailed and relevant evaluation aligned with theoretical frameworks.
Diagnostic test aimed to evaluate specific elements of agility within the company by examining 35 items across seven dimensions. Each question offered two possible responses, reflecting either agile or non-agile characteristics. The choices were designed so that both options appeared equally valid. This approach was inspired by Salama and Said (2023), who developed a detailed questionnaire to assess agility in modular and offsite construction firms. Their tool covered 48 attributes across four categories, allowing participants to identify agile and non-agile practices. Drawing on this methodology, the diagnostic test was designed to provide a comprehensive analysis of the company's agility level, ensuring alignment with established theoretical frameworks.
Data analysis and evaluation
Structured interview: analysis of the responses to assess how the company adapted to the COVID-19 crisis and subsequent economic challenges and proved the ability to be agile. The methods of content analysis and Term Frequency-Inverse Document Frequency (TFIDF) analysis were applied. The analysis aimed to identify the most significant terms and themes within the text, with a focus on key areas such as the impact of the crisis, the company's response measures, and the challenges faced. In our analysis, the selection by excluding common words (pronouns, adverbs, and so on) was refined. The remaining keywords were grouped and analyzed, reflecting the company's strategies and actions in
response to the challenges posed by the pandemic. By eliminating common stopwords and non-informative terms, the analysis was able to highlight the most relevant words that reflect the core issues addressed by the company during this period.
Agility Assessment Questionnaire was used analyze responses to determine how the company views its agility through their classification into "agile" and "non-agile" categories by comparing responses to predefined agile practices. The scale-based answers to questions enable assessing the agility level in each dimension using the scoring method and summarizing the company's perspective on agility. These insights complement the company's self-perception of agility.
Diagnostic test: a scoring method based on relative frequencies of agile versus nonagileanswers.Calculatingthecompany'soverall agilitylevel, categorizingit intooneoffour levels: low, medium, high, or excellence within the agility maturity model.
Cross-analysis and verification were used to compare the qualitative insights from the structured interview with the results from the agility assessment questionnaire to identify any discrepancies betweenthecompany's perceptionof agilityandits actual practices during the crisis. Cross-checking the findings from the perception analysis and qualitative interviews with the objective results from the diagnostic test was made to ensure consistency and accuracy in the company's agility assessment.
Final evaluation and agility level determination were performed by combining the results from all three questionnaires to determine the company's final agility level and identifyareas wherethe companyexcels and where improvements are needed,based onboth qualitative and quantitative data.
RESULTS AND DISCUSSION
Analysis of the structured interview
The Term Frequency-Inverse Document Frequency (TF-IDF) analysis was conducted on the responses provided by the company regarding their experiences during the coronavirus crisis. The analysis aimed to identify the most significant terms and themes within the text. The analysis revealed that the terms "coronavirus," "crisis," "company," "measures," and "business" were among the most significant, indicating a strong focus on the company's operational challenges and strategic responses during the pandemic. The inclusion of "3D printing" as a unified term underscores the importance of innovation and adaptability in the company's strategy. The frequent mention of "employees," "safety," and "health" reflects the prioritization of workforce well-being during the crisis. Overall, the results suggest that the company successfully navigated the challenges of the pandemic by implementing significant operational measures, emphasizing employee safety, and leveraging new technologies to maintain business continuity.
A content analysis of responses to questions 1 through 14 was conducted The results were grouped into three main areas:
• Obstacles and Challenges: during the COVID-19 pandemic and the period of high inflation, the company faced significant challenges, including supply chain disruptions that affected operations, rising operating costs due to inflation, and pressure to raise prices while maintaining competitiveness. The need to protect employee health and business continuity added complexity, as the company worked to ensure both safety and operational flow. Additionally, inflationary pressures further strained financial stability, with sharp increases in input material, energy, and service costs.
• Realized Solutions: the company implemented operational adjustments by reorganizing work processes with a two-shift system and enhanced sanitation to protect employees while ensuring production continuity. Through budget optimization, the company improved efficiency, renegotiated supplier contracts, and adjusted pricing to balance competitiveness with rising costs. To ensure financial resilience, the company bolstered reserves, revised investment plans, and maintained clear communication with employees. Lastly, digital transformation efforts enhanced digital channels and adopted new technologies to engage customers and partners amid restricted in-person interactions.
• Reached Results: achieved Revenue Growth, increasing from €1.57 million in 2019 to €1.98 million in 2022. Profitability also improved, with profits rising from €29,500 to €32,800,drivenbystrategiccostmanagementandpricing.Thecompany'sGrossMargin saw a boost, with ROS reaching 38.5%, reflecting enhanced efficiency. While Debt Management led to a slight dip in ROE, the debt ratio was reduced to 51.5%, ensuring financial stability. Non-financial positive outcomes include enhanced flexibility, improved team collaboration, optimized processes, and a stronger focus on sustainability Overall, the company's adaptability contributed to the company’s resilience and competitive position in the market.
Analysis of the Agility Assessment Questionnaire
Attitude and self-perception of agility
The enterprise under study perceives agility as important to keep up with competitors and retain customers. It perceives several barriers to being agile, such as complex bureaucracy that slows down decision-making, lack of quality staff and competition. The level of agility achieved is rated as high by the enterprise, which means that it is usually able to adapt in a timely manner.
Self-assessment of the agility level
Organization - agility level 1: the company primarily uses traditional management structures and decision-making, showing low to medium organizational agility, where agile practices are recognized but not fully implemented.
Strategy - agility level 2: the firm shows medium agility, adapting to market changes while maintaining a structured, gradual approach. Agile strategies are present but not fully integrated across all processes.
Change Culture - agility level 3: the company shows high agility with a positive attitude towards change, supporting continuous improvement and experimentation, though full agility across all dimensions hasn't been achieved yet.
Processes and Technology - agility level 0: the company exhibits the lowest agility, with limited flexibility and slow adoption of technologies like automation and data-driven decision-making, as traditional processes remain dominant.
Products and Services - agility level 2: the company shows a balance between traditionalproductdevelopmentcyclesandresponsivenesstomarketneeds,suggestingsome agility in how it handles innovations and customer requirements. Medium agility, as there is recognition of agile principles, but they are not fully integrated across all product development phases.
Customer Orientation - agility level 2: the firm places significant emphasis on customerfeedback andadapts its processesbasedoncustomerneeds, whichaligns withagile methodologies. Medium to high agility, depending on how systematically customer insights are incorporated into decision-making.
Human Resources and Teamwork - agility level 4: there is a strong focus on teamwork, autonomy, and continuous learning, which are key agile principles. The company promotes a collaborative environment with decision-making autonomy at team levels. Agility Excellence, indicating a well-integrated agile approach to human resource management.
Overall Agility Assessment: Considering the varying levels across dimensions, the company's overall agility can be classified as medium (Level 2 – Agile Understanding). The company has adopted several agile practices and principles but is still in the process of fully integrating them across all departments and processes. The next steps towards higher agility would involve more systemic adoption of agile methodologies in their organizational structure, decision-making, and processes.
Analysis of the Diagnostic Test
Each question in the diagnostic test has either an agile or a non-agile (traditional) answer.Weassignedascoreof1foragileanswersand0fornon-agileones.Aftercalculating the total score for each area, we computed the relative frequency (RF) by dividing the number of agile answers by the total number of questions for each dimension. This RF gives us a percentage of agile practices implemented in each dimension and the agility level can be detected. The results are shown in Table 1.
Tab. 1 Agility assessment by diagnostic test.
The results in Table 1 show that the biggest space to building agility is in the dimensions of process/technology, strategy and customer orientation, especially in meeting the changed requirements for the company's products and services.
Cross – analysis
Organization: the previous self-assessment indicated low agility, reflecting the company's view of itself as still developing. However, the diagnostic test results reveal agility integration, highlighting a gap between self-perception and actual practices. This suggests a modest initial self-assessment.
Strategy: a low agility score in the diagnostic test contrasts with the self-assessed medium level, indicating that the company's strategic agility may be more traditional than initially perceived.
Culture Change: a high agility score is consistent in both evaluations regarding embracing change and innovation.
Processes / Technologies: both assessments confirmed a zero score, which indicates no agility in processes and technology adoption.
Products + Services: a medium agility score aligns with both evaluations of balancing traditional and agile practices.
Customers: a low agility score in diagnostic tests contrasts with a medium-to-high self-assessment, revealing that agility in customer-facing processes may be more limited than previously thought.
Human Resources: thecompany'shighly agilehuman resourcepractices are confirmed by an excellent agility score consistent in both assessments.
As for overall agility, the company perceives it at a high level, which was confirmed in diagnostic test. However, a self-assessment through questionnaire showed a lower, medium level as the integration of agile principles across all dimensions is not completed. The comparison of the agility level self-assessed and tested is depicted in Fig. 1.
Identification of agility weak areas and recommendations
One area where an agile approach is absent in the surveyed enterprise is in processes and technology, which includes elements such as process management, automation, flexibility, thetimerequiredforchanges and optimization,andtheintegrationofinformation systems. Additionally, significant gaps were found in the strategy dimension, encompassing managing continuity and change simultaneously, building relationships with external stakeholders, resource mobility, engagement, responsiveness to environmental changes through goals and strategies, and the scope of planning. Weaknesses also appeared in the customer focus dimension, including elements such as monitoring feedback, tracking customer needs and requirements, measuring customer satisfaction, and prioritizing customer value orientation.
To enhance agility and achieve a competitive edge, the enterprise should consider the following actionable recommendations:
Continuous process improvement: Adopt lean and six sigma practices to eliminate waste and inefficiencies. Implement Kaizen to encourage small, incremental improvements involving all employees. Specific Impact:
• Shortened production cycles and lower operational costs through streamlined workflows.
• Improved employee productivity and morale, as workers actively contribute to continuous improvement.
• Faster adaptability to process disruptions or inefficiencies, reducing downtime by 20-30%.
Continuous improvement processes (CIP) significantly enhance efficiency and reduce operational costs. Schuh et al. (2019) demonstrated that CIP shortens production cycles and
reduces operational costs by using predictive models to optimize workflows, while empowering employees to innovate increases productivity. Wongsomboon et al. (2023) showed a 14% reduction in production cycle times and cost savings through waste elimination and production line balancing. Furthermore, Beraldin et al. (2020) emphasized that involving employees in continuous improvement initiatives improves product quality, cost efficiency, and responsiveness, while enhancing morale and organizational outcomes.
Technology Integration: Invest in digital tools like cloud computing, big data analytics, and AI-drivendecision-making.Utilizeagileproject managementtoolsforadaptiveandefficient execution. Specific Impact:
• Real-time data processing leads to faster (up to 50%) decision-making.
• Increased production accuracy and reduced errors due to AI-driven insights and automation.
• Scalable operations allow the company to handle a 15-20% increase in customer demand without additional overhead costs.
The integration of advanced technologies enhances real-time responses to market dynamics and operational efficiency. Schuh et al. (2019) highlighted how predictive analytics optimizes workflows, providing actionable insights for decision-making and streamlining processes. Azizi (2015) demonstrated that technological upgrades, such as SPC, enhance productivity by reducing errors and machine downtime. Digital tools like agile project management software ensure adaptive planning and execution, while automation improves scalability and responsiveness to customer needs.
Strategic Agility: Develop flexible strategic plans to respond to future scenarios and diversify supply chains to minimize dependency on single sources. Specific Impact:
• Enhanced resilience to supply chain disruptions, potentially reducing material shortages by 40-50%.
• Greater strategic alignment with market trends, leading to sustained market presence during volatile periods.
• Improved profitability through better resource allocation and minimized operational risks.
Strategic agility enhances resilience by enabling businesses to adapt to changes rapidly and effectively. Wongsomboon et al. (2023) illustrated the benefits of strategic flexibility in reducing inefficiencies and minimizing disruptions in production cycles. Schuh et al. (2019) emphasized how prescriptive analytics can align strategic plans with dynamic market demands, ensuring agile and informed decision-making. Diversifying supply chains and reducing reliance on single sources further mitigate risks and enhance continuity during crises.
Customer-Centric Innovation: Engage customers in the innovation process via feedback loops, beta testing, and pilot programs. Use agile methodologies to rapidly develop and test products. Specific Impact:
• A 25-30% improvement in customer satisfaction due to more tailored products/services.
• Faster time-to-market for new offerings (by up to 40%), ensuring a competitive advantage.
• Increased revenue streams from co-created products, with higher customer retention rates.
A focus on customer-centric innovation strengthens product-market alignment and customer satisfaction. Beraldin et al. (2020) highlighted that engaging customer in continuous improvement processes enhances quality and responsiveness, directly benefiting organizational outcomes. Schuh et al. (2019) reinforced the value of feedback-driven
innovation, which ensures products and services remain relevant to evolving customer needs. Agile methodologies, such as rapid prototyping, allow for quick testing and refinement, reducing time-to-market and improving competitiveness.
Agility Metrics and Assessment: Regularly assess agility to identify gaps and track progress. Use key performance indicators (KPIs) such as time-to-market, customer satisfaction, and innovation rates. Specific Impact:
• Improved alignment of processes with strategic objectives, increasing overall efficiency by 15-20%.
• Measurable improvements in agility-related outcomes, enabling data-driven decision-making.
• Enhanced competitiveness by maintaining a consistent focus on operational and strategic agility.
Regular evaluation of agility provides actionable insights for organizational improvement. Schuh et al. (2019) demonstrated how prescriptive analytics can track key performance indicators (KPIs),suchas time-to-market andcustomersatisfaction,ensuring alignmentwith strategic goals. Beraldin et al. (2020) emphasized that monitoring progress fosters a culture of continuous improvement, enhancing both organizational responsiveness and employee morale. Metrics-driven assessments also support resource optimization and long-term growth by identifying and addressing agility gaps.
Discussion
The methods and tools we employed to assess agility, such as the structured questionnaire divided into general company information and agile practices, align closely with approaches documented in prior studies. For example, Looks et al. (2021) developed a standardized questionnaire to measure team-level agility, focusing on dimensions like communication, iteration, and adaptability. Our approach also incorporates similarly structured questionnaires, emphasizing agileandnon-agiletraits, ensuringconsistency with established tools in the field. Additionally, the diagnostic framework we applied shares similarities with Wendler's (2014) Organizational Agility Maturity Model, which systematically evaluates agility across multiple dimensions to identify improvement areas. Our findings highlight a strong link between agile practices applied to Human Resources and the firm’s ability to adapt to unexpected changes, such as COVID-19, corroborating the outcomes of similar research. Agile HR strategies focusing on remote work, employee wellbeing, and flexible management practices played a crucial role in enabling organizations to navigate the unpredictable challenges of the pandemic (Plater et al., 2022). Tseng and Lin (2011), for instance, identified key drivers of agility: responsiveness, competency, flexibility, and quickness and demonstrated their importance in enhancing organizational adaptability
The alignment of our approach with these studies underscores its validity and applicability. By comparing our methods and findings, it becomes evident that our studynot only confirms existing knowledge but also offers unique insights into agility assessment in the woodworking industry. This comparison highlights the robustness and transferability of our methodology.
CONCLUSION
The study confirmed that using an agile approach helped the surveyed company achieve financial stability and survival during the pandemic crisis. By implementing flexible
work models, workforce agility has increased, ensuring continuity during the pandemic and future adaptability. Leadership and culture play key roles, with swift decision-making, transparent communication, and high morale. At the same time, stable financial performance and operational continuity suggest agility metrics and assessment, indicating mechanisms to evaluate agility.
Our aim was to evaluate the agility level achieved in the chosen woodworking company. The diagnostic test offered an objective perspective of the company's agility compared to the self-assessment methods, which included the structured interview and agility assessment questionnaire. While the Organization has progressed to agility integration,theStrategyhasrevealedaloweragilityscorethanpreviouslyperceived.Culture Change retains high agility, but Processes/Technologies confirm minimal agility. Products and Services align with medium agility, though Customers score lower than expected. Human Resources remains consistently excellent in agility. Overall, the results point to both progress and areas for improvement.
The company's financial results (2019–2022) showed revenue growth of €0.41 million and a €3,300 profit increase, driven by agility improvements in organizational structure and human resources. A 38.5% ROS and improved gross margin reflect strong performance. However, lower agility in Strategy and customer focus suggests room for further growth to stay competitive and financially stable. The detected non-agile dimension of processes and technology requires the most attention and implementation of agile principles. Adaptive, continually improved processes, digitization, and intelligent technologies are the path to increased agility.
Overall, the company has successfully addressed many areas of agility enhancement, contributing to its resilience and ability to navigate the challenges posed by the COVID-19 pandemic and subsequent economic disruptions. By implementing the suggested recommendations, the woodworking enterprise can enhance its agility, better navigate market complexities, and gain a competitive advantage in its respective industries.
REFERENCES
Alqudah,M., Razali, R., 2016. AReviewof Scaling AgileMethods in Large Software Development. International Journal on Advanced Science, Engineering and Information Technology 6, 828837. https://doi.org/10.18517/IJASEIT.6.6.1374
Alzoubi, H., Elrehail, H., Hanaysha, J., Al-Gasaymeh, A., Al-Adaileh, R., 2022. The Role of Supply Chain Integration and Agile Practices in Improving Lead Time During the COVID-19 Crisis. Int. J. Serv. Sci. Manag. Eng. Technol., 13, 1-11. https://doi.org/10.4018/IJSSMET.290348
Arteta, B., & Giachetti, R., 2004. A measure of agility as the complexity of the enterprise system. Robotics and Computer-integrated Manufacturing, 20, 495503. https://doi.org/10.1016/J.RCIM.2004.05.008
Ashrafi, A., Ravasan, A., Trkman, P., Afshari, S., 2019. The role of business analytics capabilities in bolstering firms' agility and performance. Int. J. Inf. Manag., 47, 115. https://doi.org/10.1016/J.IJINFOMGT.2018.12.005
Azizi, A., 2015. Evaluation Improvement of Production Productivity Performance using Statistical Process Control, Overall Equipment Efficiency, and Autonomous Maintenance. Procedia Manufacturing, 2, 186-190. https://doi.org/10.1016/J.PROMFG.2015.07.032
Badakhshan, P., Conboy, K., Grisold, T., Brocke, J., 2019. Agile business process management: A systematic literature review and an integrated framework. Bus. Process. Manag. J., 26, 15051523. https://doi.org/10.1108/bpmj-12-2018-0347
Beck, K., Beedle, M., van Bennekum, A., Cockburn, A., Cunningham, W., Fowler, M., Grenning, J., Highsmith, J., Hunt, A., Jeffries, R., Kern, J., Marick, B., Martin, R., C., Mellor, S.,
Schwaber, K., Sutherland, J., Thomas, D., 2001. The Agile Manifesto. Agile Alliance. http://agilemanifesto.org/
Beraldin,A., Danese, P., Romano,P., 2020. Employeeinvolvementfor continuousimprovementand production repetitiveness: a contingency perspective for achieving organisational outcomes. Production Planning & Control, 33, 323339. https://doi.org/10.1080/09537287.2020.1823024
Berthot,B.,2023.AgileSupplyChainManagementTheories,EmpiricalData,andFutureDirections. InSITE, 15 p. https://doi.org/10.28945/5153
Bottani, E., 2009. On the assessment of enterprise agility: issues from two case studies. International Journal of Logistics Research and Applications, 12, 213 - 230. https://doi.org/10.1080/13675560802395160
Carvalho, A., Sampaio, P., Rebentisch, E., 2019. On Agile Metrics for Operations Management: Measuring and Aligning Agility with Operational Excellence. 2019 IEEE International Conference on Industrial Engineering and Engineering Management (IEEM), 1601-1605. https://doi.org/10.1109/IEEM44572.2019.8978806
Chacko, E., Suresh, M., 2021. Assessment of Start-Up Agility Using Multi-grade Fuzzy and Importance Performance Analysis. In: Kumaresan, G., Shanmugam, N.S., Dhinakaran, V. (eds) Advances in Materials Research. ICAMR 2019. Springer Proceedings in Materials, vol 5. Springer, Singapore, 685-694. https://doi.org/10.1007/978-981-15-8319-3_68
Chakravarty, K., Singh, J. A., 2024. dissection of agile software development in changing scenario and the sustainable path ahead. Int J Syst Assur Eng Manag 15, 2606–2622. https://doi.org/10.1007/s13198-024-02283-1
Christopher, M., 2000. The agile supply chain: Competing in volatile markets. Industrial Marketing Management, 29(1), 37-44. https://doi.org/10.1016/S0019-8501(99)00110-8
Couto, E., Lopes, M., Sousa, R., 2015. Can IS/IT Governance Contribute for Business Agility?. , 1099-1106. https://doi.org/10.1016/J.PROCS.2015.08.565
DeGroote, S., Marx, T., 2013. The impact of IT on supply chain agility and firm performance: An empirical investigation. Int. J. Inf. Manag., 33, 909-916. https://doi.org/10.1016/j.ijinfomgt.2013.09.001
Diego, S.S.,Ghezzi, A., Barbosa de Aguiar, R., Marcelo, N. C., Schwengber, C., 2020. Lean startup, agile methodologies and customer development for business model innovation: A systematic review and research agenda. [Business Model Innovation] International Journal of Entrepreneurial Behaviour & Research 26(4), 595-628. https://doi.org/10.1108/IJEBR-07-2019-0425
Edison, H., Wang, X., Conboy, K., 2022. Comparing Methods for Large-Scale Agile Software Development:ASystematicLiteratureReview.IEEETransactionsonSoftwareEngineering48, 2709-2731. https://doi.org/10.1109/TSE.2021.3069039
Fertalj, K., Matejas, M., 2015. Using Agility in Building Business Process Management Solutions. International Journal of Industrial and Systems Engineering 9, 3826-3832. Ganguly, A., Nilchiani, R., Farr, J., 2009. Evaluating agility in corporate enterprises. International Journal of Production Economics 118, 410-423. https://doi.org/10.1016/J.IJPE.2008.12.009
Gergin, Z., Çolak, E., Kayalar, M., Yavaşoğlu, C., 2022. A New Organizational Agility Assessment Approach Applied in the Logistics Industry. Journal of Business Research – Turk 14(2), 11291147. https://doi.org/10.20491/isarder.2022.1431
Girod, S. J. G., Birkinshaw, J., Prange, C., 2023. Business agility: Key themes and future directions. CaliforniaManagementReview,65(5), 5-21. https://doi.org/10.1177/00081256231186641
Gren, L., Torkar, R., Feldt, R., 2015. The prospects of a quantitative measurement of agility: A validation study on an agile maturity model. Journal of Systems and Software 107, 38-49. https://doi.org/10.1016/j.jss.2015.05.008
Imgrund,F.,Janiesch,C.,2019.UnderstandingtheNeedforNewPerspectivesonBPMintheDigital Age: An Empirical Analysis. Di Francescomarino, C., Dijkman, R., Zdun, U. (eds) Business Process Management Workshops. BPM 2019. Lecture Notes in Business Information Processing, vol 362. Springer, Cham. https://doi.org/10.1007/978-3-030-37453-2_24
Kallio, H., Pietilä, A., Johnson, M., Kangasniemi, M., 2016. Systematic methodological review: developing a framework for a qualitative semi-structured interview guide. Journal of advanced nursing, 72 12, 2954-2965. https://doi.org/10.1111/jan.13031
Kock, A., Gemünden, H., 2016. Antecedents to decision-making quality and agility in innovation portfolio management. Journal of Product Innovation Management, 33, 670-686. https://doi.org/10.1111/JPIM.12336
Kumar, A. K. R., Dhas, J. E. R., 2023. Improving supplier performance and strategic sourcing decisions by integrating jobshop scheduling, inventory management and agile new product development. Journal of Global Operations and Strategic Sourcing 16(2), 456-491. https://doi.org/10.1108/JGOSS-06-2022-0047
Larson, D., 2019. A Review and Future Direction of Business Analytics Project Delivery. In: Anandarajan, M., Harrison, T. (eds) Aligning Business Strategies and Analytics. Advances in Analytics and Data Science, vol 1. Springer, Cham. https://doi.org/10.1007/978-3-319-93299-6_7
Leroux,K., Wright, N.,2010. Does Performance Measurement Improve Strategic Decision Making? Findings From a National Survey of Nonprofit Social Service Agencies. Nonprofit and Voluntary Sector Quarterly - NONPROFIT VOLUNT SECT Q. 39. 571-587. 10.1177/0899764009359942
Looks, H., Fangmann, J., Thomaschewski, J., Cuaresma, M., Schön, E., 2021. Towards a Standardized Questionnaire for Measuring Agility at Team Level. , 71-85 https://doi.org/10.1007/978-3-030-78098-2_5
Looks, H., Fangmann, J., Thomaschewski, J., Cuaresma, M., Schön, E., 2021. Towards a Standardized Questionnaire for Measuring Agility at Team Level. In: Gregory, P., Lassenius, C., Wang, X., Kruchten, P. (eds) Agile Processes in Software Engineering and Extreme Programming. XP 2021. Lecture Notes in Business Information Processing, vol 419. Springer, Cham., 71-85. https://doi.org/10.1007/978-3-030-78098-2_5
Mahapatra,M. S., Shenoy,D., 2021. Leanmaintenanceindex:Ameasureofleannessinmaintenance organizations. Journal of Quality in Maintenance Engineering 28(4), 791-809. https://doi.org/10.1108/jqme-08-2020-0083
Milenković, M., Lalic, B., Pavlovic, K., Beric, I., Šobajić, V., 2019. Comparison of traditional and agile approach to manage product development projects. In: Proceedings of the 5th IPMA SENET Project Management Conference. https://doi.org/10.2991/senet-19.2019.8
Moe, N., Mikalsen, M., 2020. Large-Scale Agile Transformation: A Case Study of Transforming Business, Development and Operations. Agile Processes in Software Engineering and Extreme Programming 383, 115 - 131. https://doi.org/10.1007/978-3-030-49392-9_8
Narasimhan, R., Swink, M., Kim, S., 2006. Disentangling leanness and agility: An empirical investigation. Journal of Operations Management 24, 440-457. https://doi.org/10.1016/J.JOM.2005.11.011
Oosterhout, M., Waarts,E.,Hillegersberg,J., 2006. Change factorsrequiring agilityandimplications for IT. European Journal of Information Systems, 15, 132-145. https://doi.org/10.1057/palgrave.ejis.3000601
Papadopoulos, G., 2015. Moving from traditional to agile software development methodologies also on large, distributed projects. Procedia - Social and Behavioral Sciences 175, 455-463. https://doi.org/10.1016/J.SBSPRO.2015.01.1223
Perides, M. P. N., Barrote, E. B., Sbragia, R., 2021. The competencies of project managers working with agile and traditional approaches: a comparative study. Revista De Gestão E Projetos 12(1), 11–38. https://doi.org/10.5585/gep.v12i1.17534
Plater,Q.,Frazier,M.,Talbert,P.,Davis,V.,Talbert,P.,2022.HumanResourcesStrategies&Lessons Learned During the COVID-19 Pandemic: ALiterature Review. Management Dynamics in the Knowledge Economy, 10, 330 - 342. https://doi.org/10.2478/mdke-2022-0021
Rathod, G., Puranik, V., Hiremath, V., 2019. Developing agility system in supply chains. International Journal of Business and Systems Research 13(2), 15. https://doi.org/10.1504/IJBSR.2019.10018715
Rdiouat, Y., Bahsani, S., Lakhdissi, M., Semma, A., 2021. Measuring and improving information systems agility through the balanced scorecard approach. International Journal of Computer Science Issues (IJCSI) 12(5), 58. https://doi.org/10.48550/arXiv.2109.07281
Schmitt, A., Theobald, S., Diebold, P., 2019. Comparison of Agile Maturity Models. In: Franch, X., Männistö, T., Martínez-Fernández, S. (eds) Product-Focused Software Process Improvement. PROFES 2019. Lecture Notes in Computer Science, vol 11915. Springer, Cham., 661-671. https://doi.org/10.1007/978-3-030-35333-9_52
Schuh, G., Prote, J., Busam, T., Lorenz, R., Netland, T., 2019. Using Prescriptive Analytics to Support the Continuous Improvement Process. In: IFIP International Conference on Advances in Production Management Systems, book series, 46-53. https://doi.org/10.1007/978-3-030-30000-5_6
Shafiabady, N., Hadjinicolaou, N., Din, F., Bhandari, B., Wu, R., Vakilian, J., 2023. Using Artificial Intelligence (AI) to predict organizational agility. PLOS ONE 18(5), e0283066. https://doi.org/10.1371/journal.pone.0283066
Shpak, Y., Ilnytskyi, V., Andrukhiv, I., 2023. Comparative characteristics of lean- and agilemethodology of supply chain management under uncertainty. Scientific opinion: Economics and Management 3(83), 64-71. https://doi.org/10.32782/2521-666x/2023-83-9
Srivastava, A., Yadav, M., Yadav, R., Singh, B., Dewasiri, N., 2023. Exploring Digital Agility and Digital Transformation Leadership. Journal of Global Information Management. https://doi.org/10.4018/jgim.332861
Tamtam, F., Tourabi, A., 2019. Agile capabilities in Moroccan companies: Criteria and practices. 2019 4th World Conference on Complex Systems (WCCS), 1-6 https://doi.org/10.1109/ICoCS.2019.8930721
Tseng, Y., Lin, C., 2011. Enhancing enterprise agility by deploying agile drivers, capabilities and providers Inf. Sci., 181, 3693-3708. https://doi.org/10.1016/j.ins.2011.04.034
Vasanthan, P., Suresh, M., 2021. Assessment of organizational agility in response to disruptive innovation: a case of an engineering services firm. International Journal of Organizational Analysis 30(6), 1465-1475. https://doi.org/10.1108/IJOA-09-2020-2431
Walter,A.,2020.Organizationalagility:ill-definedandsomewhatconfusing?Asystematicliterature review and conceptualization. Management Review Quarterly 71, 343-391. https://doi.org/10.1007/s11301-020-00186-6
Wang, L., Keshavarzmanesh, S., Feng, H. Y., 2010. A function block based approach for increasing adaptability of assembly planning and control. International Journal of Production Research 49(16), 4903–4924. https://doi.org/10.1080/00207543.2010.501827
Wendler, R., 2014. Development of the organizational agility maturity model. 2014 Federated Conference on Computer Science and Information Systems, 1197-1206 https://doi.org/10.15439/2014F79
Wongsomboon, C., Maneerat, N., Thudthong, J., Sukasem, S., Luangpol, A., 2023. Cycle Time Reduction for Productivity Improvement in an Engine Assembly Industry. 2023 9th International Conference on Engineering, Applied Sciences, and Technology (ICEAST), 8992. https://doi.org/10.1109/ICEAST58324.2023.10157291
Yu, L., Heng, Z., 2006. Measuring Agility of Enterprise Using Analytic Hierarchy Process and Bayesian Belief Networks. 2006 International Conference on Management Science and Engineering, 551-556. https://doi.org/10.1109/ICMSE.2006.313954
ACKNOWLEDGMENT
The authors are grateful for the support of the Slovak VEGA Agency, the paper is a partial result of the grant scientific project VEGA 1/0333/22 and IPA ESG no. 4/2024.
AUTHORS’ ADDRESSES
Ing. Katarína Marcineková, PhD. et Ph.D.
doc. Ing. Andrea Janáková Sujová, PhD.
Ing. Martin Halász
Technical University in Zvolen, Faculty of Wood Sciences and Technology
T. G. Masaryka 24, 960 01 Zvolen, Slovakia xmarcinekovak@is.tuzvo.sk andrea.sujova@tuzvo.sk xhalasz@tuzvo.sk
